Article

Terrain-Based High-Resolution Microclimate Modeling for Cold-Air-Pool-Induced Frost Risk Assessment in Karst Depressions

Department of Geography and Geoinformatics, University of Miskolc, 3515 Miskolc, Hungary
*
Author to whom correspondence should be addressed.
Climate 2025, 13(10), 205; https://doi.org/10.3390/cli13100205
Submission received: 17 August 2025 / Revised: 22 September 2025 / Accepted: 25 September 2025 / Published: 30 September 2025
(This article belongs to the Section Climate and Environment)

Abstract

Cold-air pooling (CAP) and frost risk represent significant climate-related hazards in karstic and agricultural environments, where local topography and surface cover strongly modulate microclimatic conditions. This study focuses on the Mohos sinkhole, Hungary’s cold pole, situated on the Bükk Plateau, to investigate the formation, structure, and persistence of CAPs in a Central European karst depression. High-resolution terrain-based modeling was conducted using UAV-derived digital surface models combined with multiple GIS tools (Sky-View Factor, Wind Exposition Index, Cold Air Flow, and Diurnal Anisotropic Heat). These models were validated and enriched by multi-level temperature measurements and thermal imaging under various synoptic conditions. Results reveal that temperature inversions frequently form during clear, calm nights, leading to extreme near-surface cold accumulation within the sinkhole. Inversions may persist into the day due to topographic shading and density stratification. Vegetation and basin geometry influence radiative and turbulent fluxes, shaping the spatial extent and intensity of cold-air layers. The CAP is interpreted as part of a broader interconnected multi-sinkhole system. This integrated approach offers a transferable, cost-effective framework for terrain-driven frost hazard assessment, with direct relevance to precision agriculture, mesoscale model refinement, and site-specific climate adaptation in mountainous or frost-sensitive regions.

1. Introduction

As climate change increases the frequency of temperature extremes, terrain-controlled microclimatic processes have become crucial for understanding local vulnerability and developing precision climate adaptation strategies.
Low temperature anomalies are often associated with sinkholes in several countries (Italy, Slovenia [1], Austria [2], Hungary [3,4,5], and also in the US states [6], etc.). The phenomenon is well-known, but the details of their development often stay on a cognitive level, lacking a precise description of the contributing factors. The microclimate of sinkholes is shaped by radiation patterns and geomorphological characteristics. Radiation, including longwave emission from surfaces and shortwave solar irradiation, is influenced by terrain attributes that affect surface properties, such as momentary albedo (dependent on snow cover) and vegetation [7]. On the other hand, geomorphological factors, like airflow patterns and cold-air accumulation, create conditions favorable for temperature inversions and the formation of cold-air pools (CAP) [7].
Conditions that favor cold-air persistence include a clear sky, low humidity, local wind lulls, along with specific physical and geomorphological characteristics of the terrain. Sinkholes lack runoff; thus, gravity traps denser near-surface air at lower elevations in the closed depressions. As a result, substantial amounts of cold air accumulate in sinkholes’ bottoms due to micro-topographic flow patterns [7,8]. Air within these formations can be significantly colder than surrounding areas even at typical meteorological measurement heights (2 m above ground). The minimum temperature recorded inside a sinkhole is influenced by net radiation loss during potential radiation periods.
Previous studies documented that basin cold pools may generate downslope outflows of dense air, influencing the microclimate beyond the basin itself. During periods of strong nocturnal radiative cooling, airflow can disrupt or entirely erode CAPs. Pospichal et al. [9] extensively studied this phenomenon. Other studies have focused on similar dynamics in the Grünloch sinkhole [9,10,11,12]. Wind disturbances can inhibit temperature inversion development by homogenizing pre-existing stratified layers or blowing out accumulated cold-air masses temporally or permanently by laminar or turbulent erosion [9,13].
In stable temperature inversions, denser cold air accumulates at the bottom of a sinkhole, creating a secondary surface on which warmer air layers slide away. This layering helps maintain the inversion when wind protection is sufficient and depends on both depth and local exposure conditions [9].
Any potential engineering application requires a quantitative model to be used. There were several studies on this topic [7,8,9,10,11,12,14,15,16], but geoinformatics tools were rarely used to interpret the results. The major added value of this paper is the integration of the state-of-the-art, GIS and remote sensing toolset and general physical geographic knowledge to provide a much higher resolution of the major contributing factors quantified using high-resolution GIS models. By integrating GIS-based modeling with high-resolution field data, this study not only advances cold-air-pool research in karst terrains, but also contributes to the validation of mesoscale atmospheric models and the design of climate-resilient landscapes. The increasing number of available quantitative parameters and their joint analysis can provide a new dimension in the interpretation of the development of cold-air pools. A good example is the detection of daily transformation dynamics (diurnal position during the day) of the inversed air layer by using thermal cameras and multi-dimensional systems. Understanding the contributing factors and the quantitative explanation of these very dynamic meteorological changes may provide the missing toolset to mitigate the negative impacts of climate change by appropriate environment planning. This knowledge may support urban planning as well as the detection of frost risk in agriculture. One of the major advantages of this study is the capacity to simultaneously analyze several contributing factors such as the sky-view factor, wind exposition, insolation and radiation tendencies, cold air flow and the diurnal anisotropic heat of the investigated area.
The sky-view factor is one of the most significant contributors to the microclimate of sinkholes. It quantifies a sinkhole’s exposure to sky radiation and is critical for understanding net energy loss due to radiation.
The prediction of basins with high potential for inversion buildup is crucial due to significant discrepancies between predicted and measured air temperatures in CAP areas, especially in high-resolution atmospheric models [17]. The primary methodology involves detecting closed depressions using Digital Elevation Models (DEM 25 m spatial resolution) or Digital Surface Models (DSM 2.7 cm spatial resolution). This approach has been successfully applied to lower resolution DEM databases to assess topographical potential for cold-air pools [18]. This study classifies CAP potential through a SAGA-GIS multi-model [19,20] analysis of high-resolution, unfiltered DSM data, corroborated by measured observations.
The aim of this study is to spatially determine the relationship between topographical and meteorological factors affecting cold-air-pool (CAP) development, and to assess the extent of the modeled phenomena influencing both the quantitative and qualitative aspects of inversion buildup. Despite numerous studies on CAP phenomena, the interactions between multi-sinkhole topography, local airflow, and the resulting spatial and temporal variability of temperature inversions remain insufficiently quantified. This research seeks to fill this gap by systematically characterizing the boundaries and intensity of microclimatic anomalies within the Mohos sinkhole system. By examining how multiple interacting topographic and environmental factors define CAP dynamics, the study provides new insights into the physical drivers of temperature inversions and their spatial heterogeneity based on applicable results of long-term measurements (2022–2025).

2. Materials and Methods

2.1. Topographical Database Methodology

The orographic data required for generating the Digital Surface Models (DSM) were collected in the field using DJI Mavic 2 and DJI Mavic 3 drones (DJI, Shenzhen, China). The flight zone covered the area of the predicted flow system of the Mohos sinkhole’s microclimate system. The model required immense computational capacity. To optimize the database, the modeled area was extended to the flow-out point of the Mohos sinkhole.
Prior to data acquisition, the exact coordinates of the study site were sent to the relevant aerial and environmental authorities for approval. The survey was conducted using and DJI Mavic 3 drone, which took aerial photographs in the RGB + Infra range, tagged with coordinates. The records were processed in the PIX4D™ Cloud (version 4.8.3.) [21], yielding point clouds, DSMs and orthomosaic imagery. Instead of using filtered DEMs, the raw DSM including vegetation was used to preserve microclimatic features. Figure 1 shows the DJI Mavic 3 drone’s flight path and the derived point cloud on the interface of the PIX4D™ Discovery (version 4.8.3.).
No filtration of the vegetation was performed on the surface models, as vegetation is a component of the sinkhole’s microclimate system. The image classification in RGB bands was calculated using MultiSpecW64™ software.

2.2. DSM-Based Model Methodology

To evaluate the microclimatic drivers of cold-air-pool formation, several terrain-based indices were applied within the SAGA GIS™ environment. These models are grounded in physical principles of radiative balance, airflow dynamics, and energy exchange, and they have been widely applied and validated in topo-climatological studies [19,20,23,24]. Each index captures a distinct aspect of the CAP dynamic: radiative cooling (Sky-View Factor), wind sheltering (Wind Exposition), gravitational cold-air drainage (Cold Air Flow), and terrain-based insolation (Diurnal Anisotropic Heat) providing a complementary set of parameters that, when combined, allow for an integrated assessment of cold-air accumulation potential in complex topography.
Sky-View Factor: The sky-view parameter is a dimensionless factor ranging between 0 and 1. It represents the angle of slope of the surfaces with the sky, which is one of the main quantified characteristics that influences the low temperature anomaly, associated with a sinkhole’s microclimate [16]. The Sky-View Factor is physically grounded in radiative transfer principles, as it quantifies the portion of the hemispheric sky visible from a point and thus the longwave radiation exchange with the atmosphere [19,20]. A lower sky-view value indicates greater obstruction by terrain, which limits radiative cooling and mitigates extreme minimum temperatures, whereas high values (>0.7) promote efficient radiative heat loss and stronger nocturnal cooling. This parameter has been widely validated in microclimatology to explain the intensity of CAP development [16].
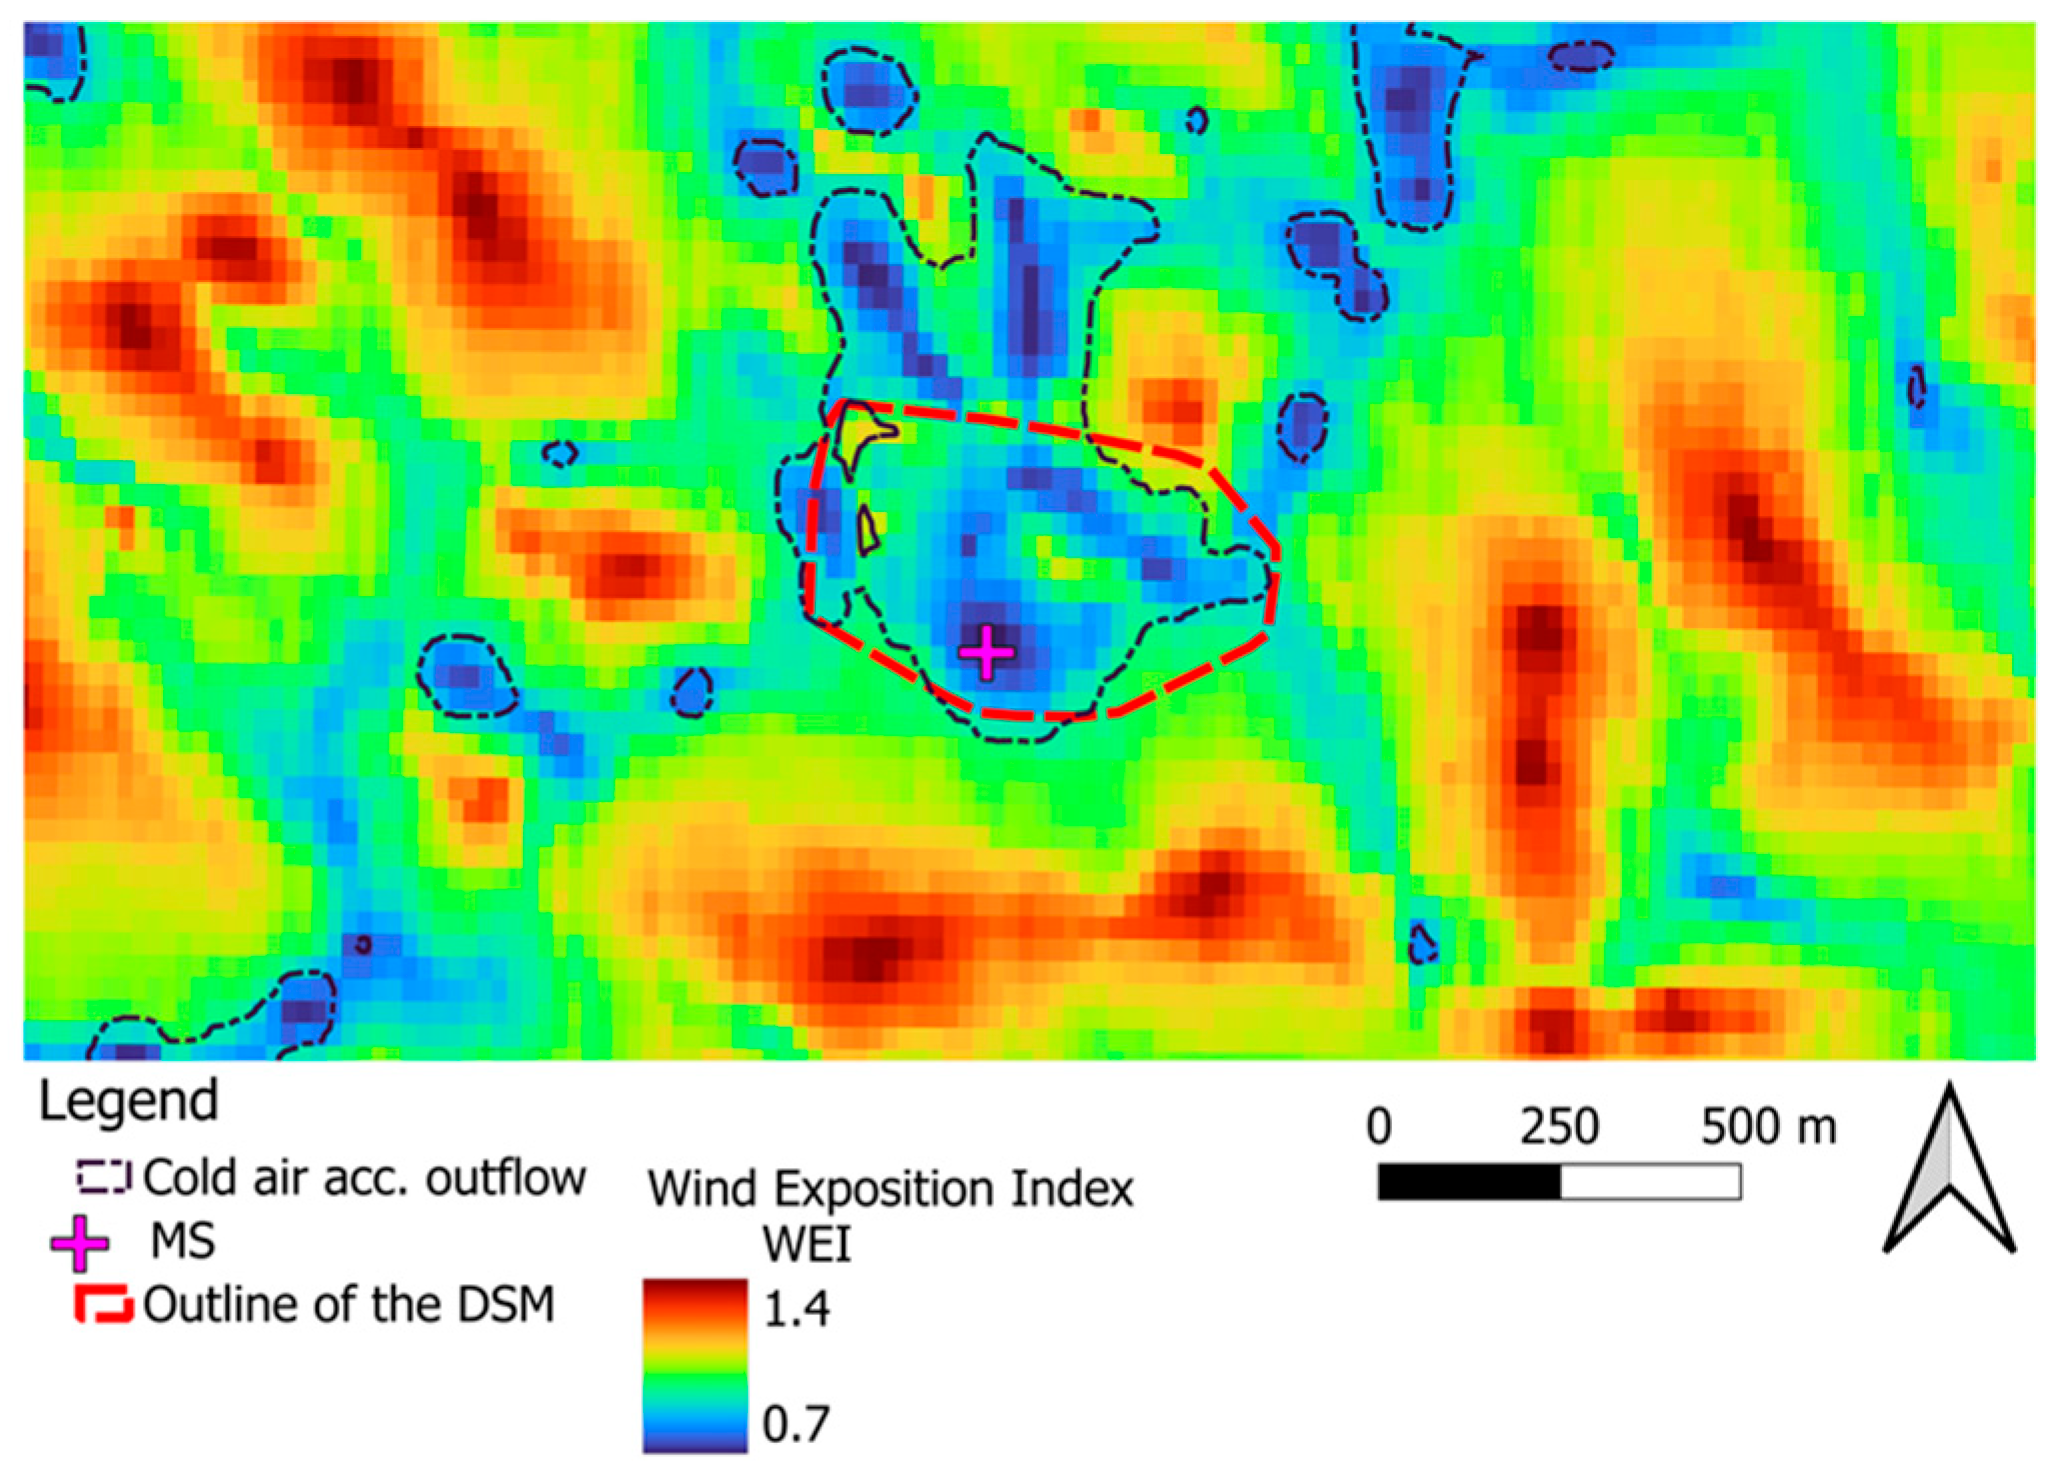
Wind Exposition Index: The exposure to wind of the study area was modeled with the ‘Wind Exposition Index’ module of the SAGA GIS 9.7.1 software based on the topography. The Wind Exposition Index is derived from terrain–wind interactions, estimating relative sheltering and exposure by analyzing differences between the slope for each direction using an angular stepping method (15°). Values under 1 represent territories sheltered from the wind, while values above 1 are exposed to wind [19,20]. The local wind anomalies (in the sinkholes) calculated for the tertiary microclimate were mapped onto the surface model. It is important to note that the high-resolution model’s running area (DSM) does not include the mountain ridge surrounding the Mohos sinkhole, which provides significant protection against external wind effects in case of E, S and W wind direction. Figure A1 in Appendix A illustrates the wind protection of the broader environment of the Mohos sinkhole’s indicators. Physically, it reflects the momentum flux of air masses across rough terrain, where concave forms reduce wind penetration and convex forms enhance it.
In addition, the critical threshold for CAP breakup in context of the wind can be expressed by the Froude number, defined as
F = U N H ,
where U is the wind speed above the valley, N marks the Brunt–Väisälä frequency, and H marks the depth of the valley [25,26,27,28].
Although not a full energy-budget model, this index has been tested in topo-climatological studies and shown to correlate well with observed wind erosion and CAP persistence patterns [20].
Cold Air Flow: The model was created by SAGA GIS software’s Cold Air Flow [19] modules. This investigated factor explains the diversity of cold-air accumulation. The cold-air accumulation potential correlates with the extension of the closed basin’s flow system and the microtopography attributes of the sinkhole on a dimensionless scale. The concept of Cold Air Flow model algorithm is summarized in the work of Andreas Schwab [24] where he explains the analogy between cold-air drainage and downslope water flow, using flow accumulation algorithms to approximate the pathways and pooling zones of dense air masses. The model calculates the accumulation area and the height of cold-air mass, based on different terrain analysis methods. The DEM/DSM based model is similar to several commonly used hydrological models (e.g., flow accumulation, flow direction, etc.). It is quite suitable for isolated, closed depressions (e.g., closed basins like sinkholes) to determine the extent and volume of cold-air pools. It incorporates the gravitational settling of cold air under stable stratification, which is the fundamental physical driver of CAP development. Previous studies [19,20] confirm that this terrain-based approximation reliably predicts CAP-prone areas, even though it simplifies the full thermodynamic energy budget.
Diurnal Anisotropic Heat: The ‘Diurnal Anisotropic Heat’ model was executed using the Diurnal Anisotropic Heat module in SAGA GIS to calculate the anisotropic daily heat disturbance (Ha) based on the aspect of the slopes [23] and gradient. The model’s formula is
Ha = cos(amax − a) ∗ arctan(b)
where ‘amax’ represents the side with maximum excess heat, ‘a’ is the slope aspect, and ‘b’ is the slope steepness gradient [19]. The output is scaled from −1 to +1, indicating that surface heat decreases towards −1 and increases towards +1, effectively illustrating the daily temperature cycle within the sinkhole’s microclimate across varying surface exposures. This index is grounded in surface energy balance theory, since slope orientation and inclination directly control incoming shortwave radiation and consequent heating [23]. The cosine–arctangent formulation provides a simplified representation of anisotropic insolation, capturing how terrain modifies diurnal thermal contrasts. Validation in topo-climatological studies [19,20] has demonstrated that this index explains spatial variations in maximum and minimum temperature regimes in complex terrain.
Used model parameters are listed in Appendix A, Table A2.

2.3. Meteorological Data Collection Methodology

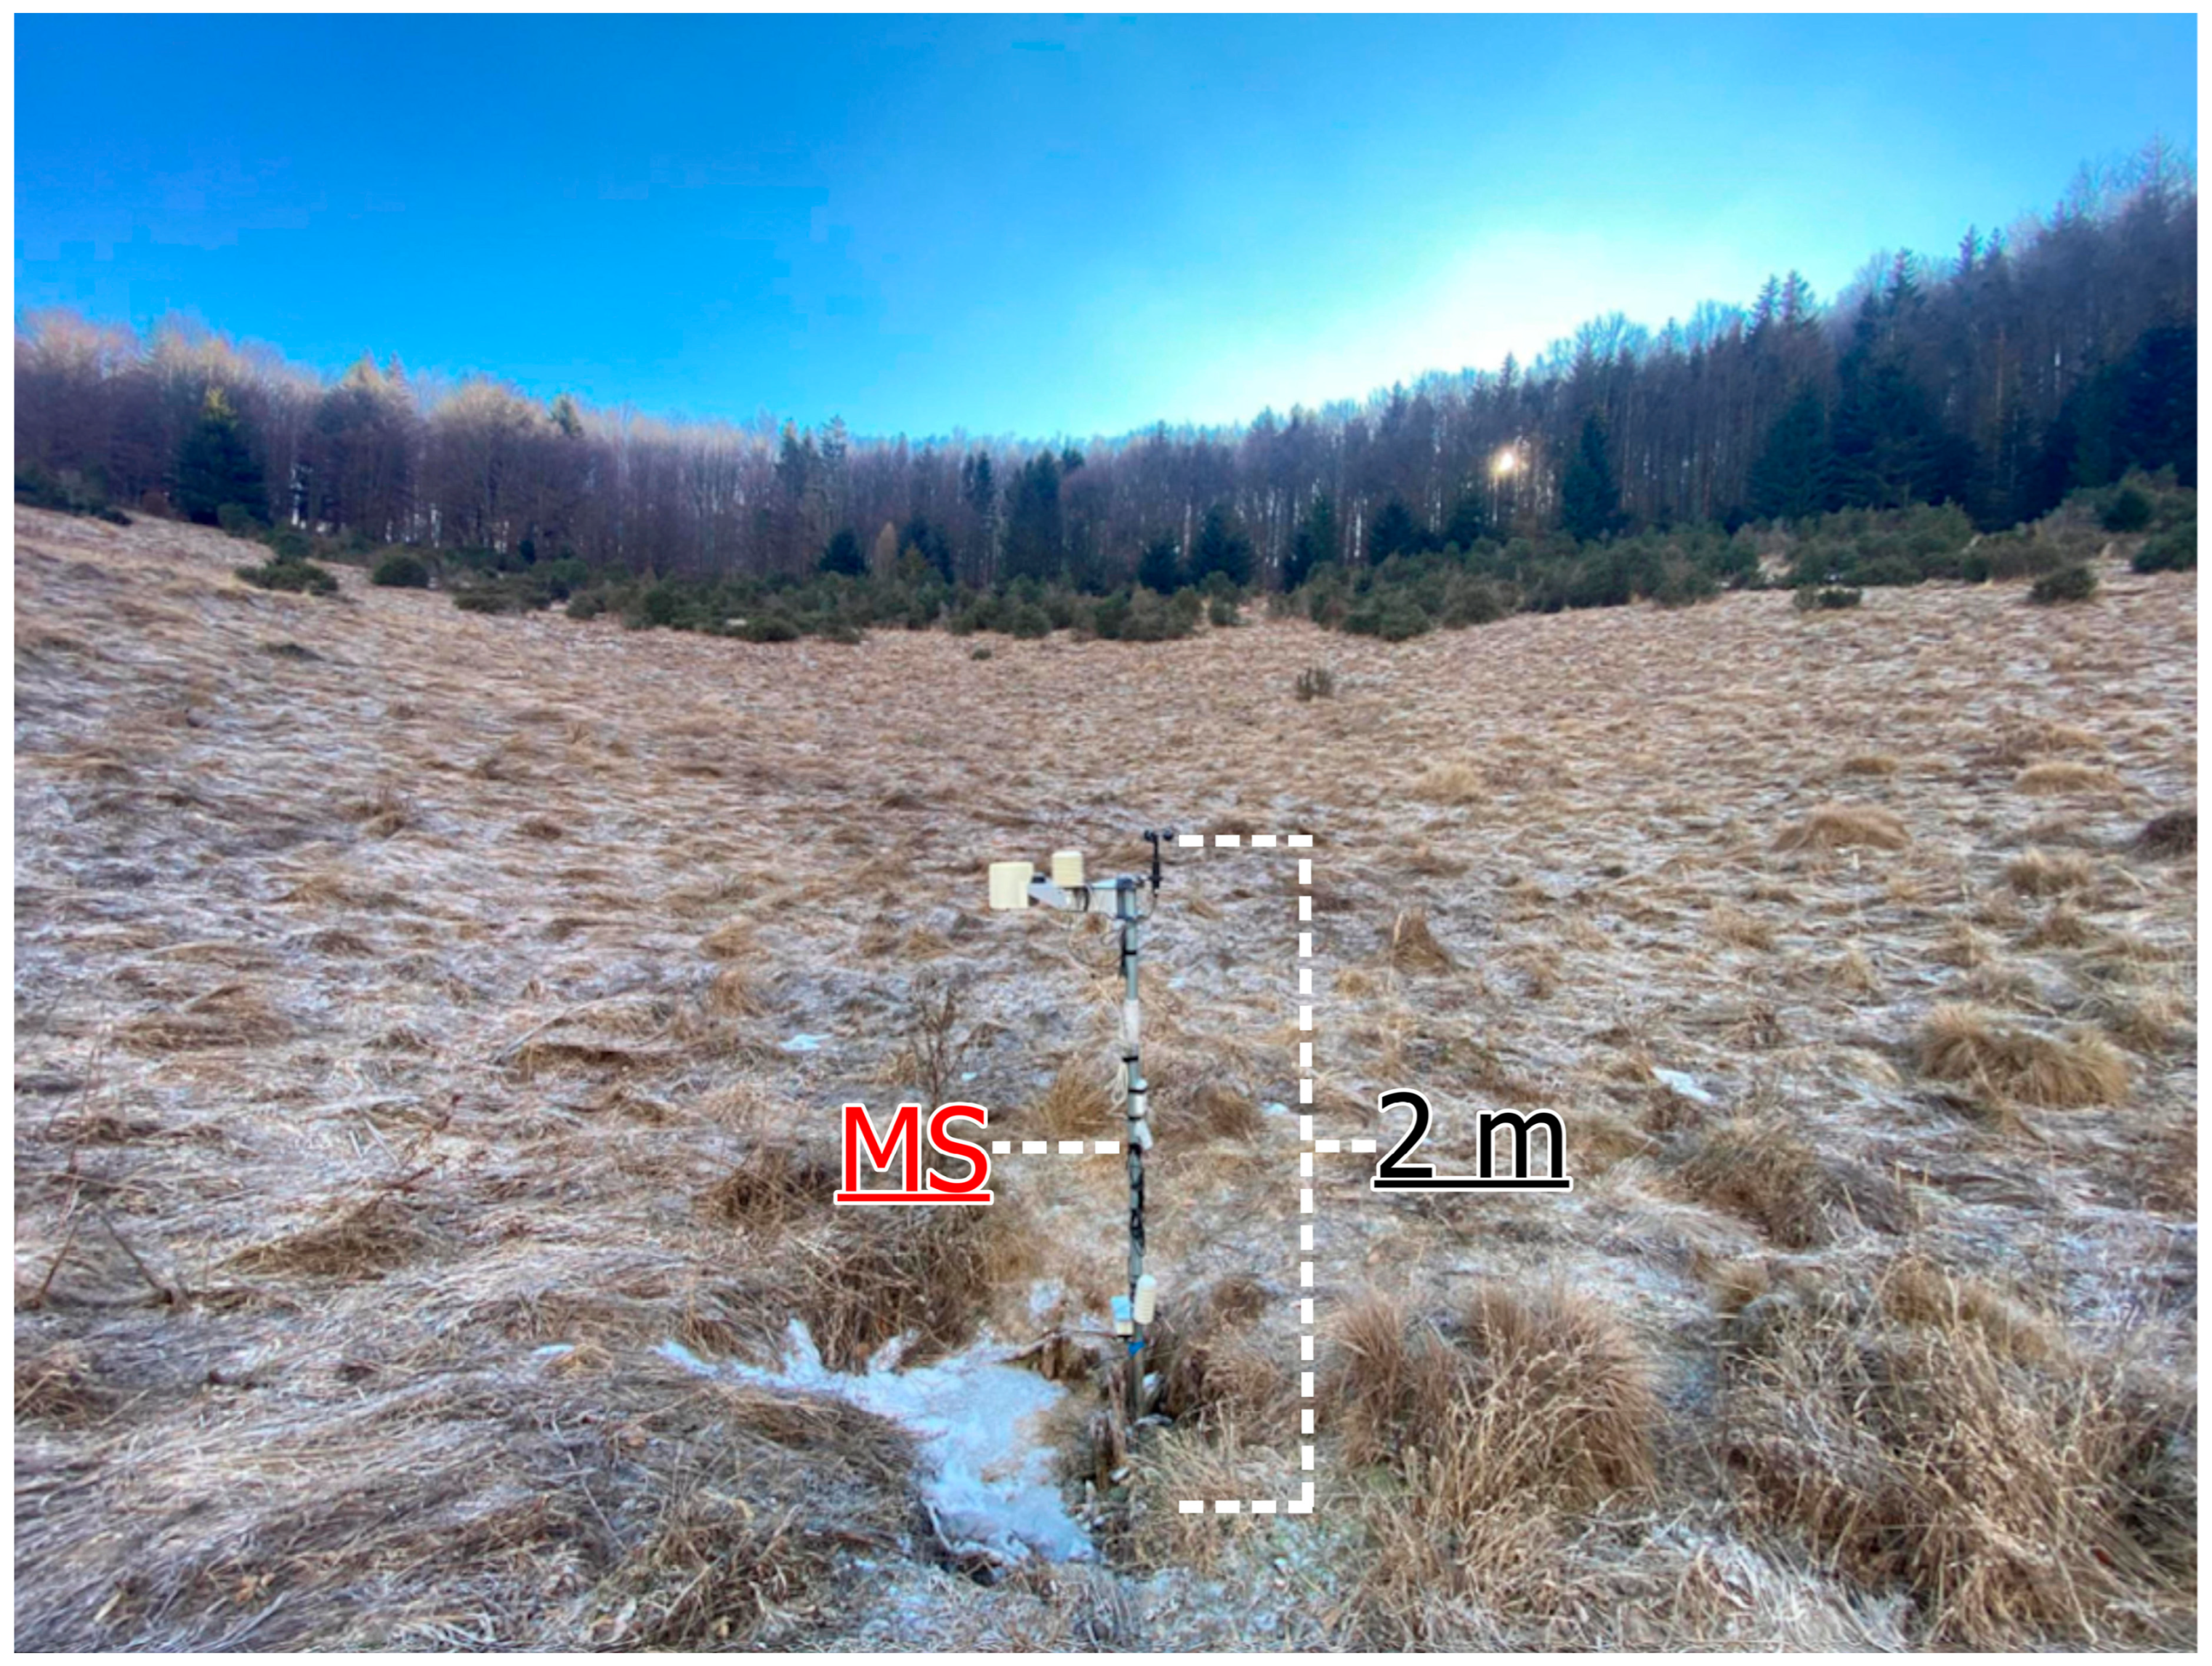
An iMETOS 3.3 [29] automatic meteorological station provides meteorological data from the bottom of the Mohos sinkhole (Figure A2). The station takes measurements at 2 m (based on meteorological standards) above ground level and measures the soil temperature (T(s)) at −5 cm. Measurements are recorded every 5 min; however, the instrument is measuring constantly, so it can also provide the minimum and maximum values of 5 min intervals. The measured and derived parameters are the following: Air Temperature (°C, ±0.8 °C), Dew Point (°C, ±0.3 °C), Solar Radiation (J/m2, calibration against Kipp & Zonen CMP3 under daylight, abs. error max. 5%, typically 3%), Vapor Pressure Deficit (VPD) kPa), Relative Humidity (%; 0–80%: ± 2%; 80–100%: ± 3%), Precipitation (mm; 0.2 mm), Wind Speed (km/h, threshold: 1.1 m/s), Daily Evapotranspiration ((ETO) mm, calculated) and Soil Temperature (°C, ±0.1 °C). The station transmits the collected data via a mobile network to the FieldClimate [30] website.
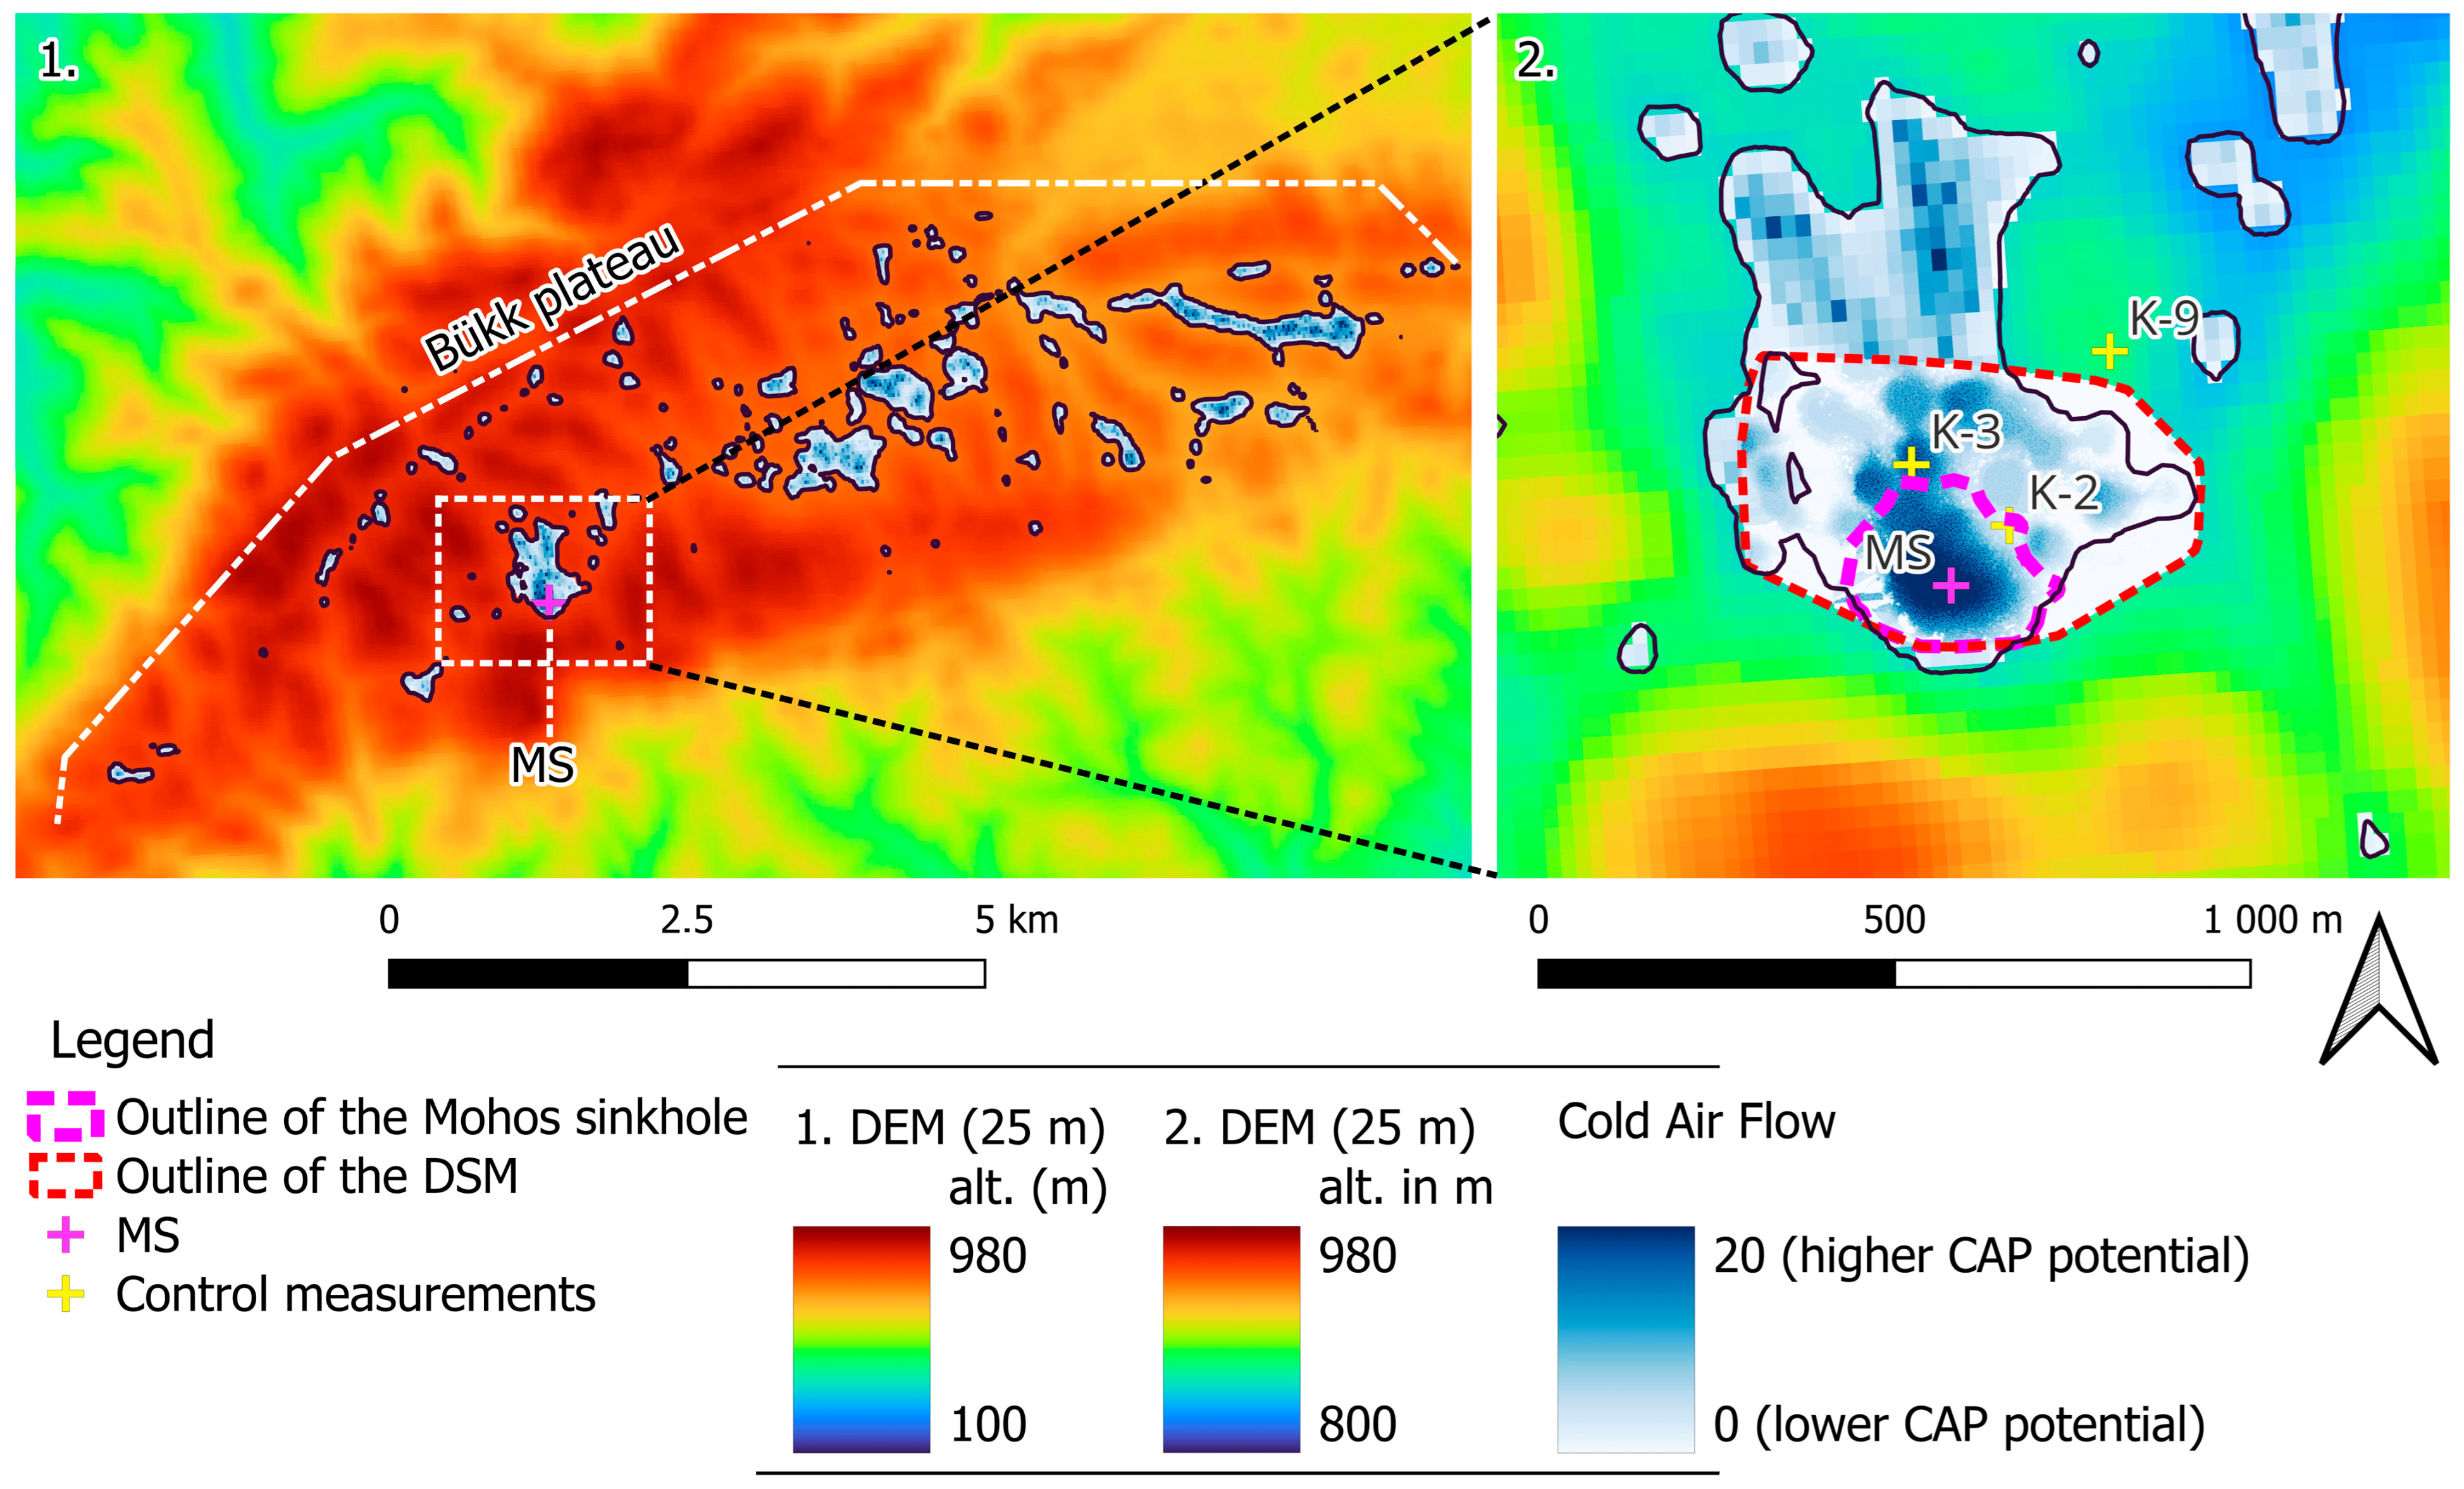
To better understand the characteristics of the air layers closer to the surface, since that is where the main processes of the flow system in the sinkhole microclimate take place, further measurements are needed. Therefore, Termio-1 [31] radiation shaded temperature data-collecting devices were installed at 40 cm above the surface and for control points. This datalogger can measure in the resolution of 0.01 °C with the accuracy of ±0.07 °C (−10 °C to 100 °C). Three control measurement points were selected with the aim to determine the proportion of the air temperature anomaly caused by thermal inversion. Control point K-2 (alt.: 855 m) is located in the eastern edge of the Mohos sinkhole and has a moderate CAP potential. Control point K-3 (alt.: 835 m) is installed below the first outflow point of the Mohos sinkhole with significant CAP potential and control point K-9 (alt.: 880 m) is located on peak position (400 m vertical NE direction from the MS), without significant CAP potential (see in Figure 2 and Figure 3). The point MS (bottom of the Mohos sinkhole) is the central area of the cold-air accumulation.

2.4. Thermal Camera Recording Methodology

A radiometric camera from Seek Thermal™ (Seek Thermal Inc., Santa Barbara, CA, USA) was used for the field measurements at 14:50 on 12 March 2023. For processing the first recordings, the Simple Viewer from Seek was used. The °C heat matrix, derived from a K-based matrix, was obtained via the Seek SDK developer interface. By communicating with the sensor through the program, we were able to extract the isometric Kelvin matrix, making it possible to continue taking the measurements with the thermal camera, as well as to quantitatively process the recordings at a higher level.

2.5. Delimitation of the Research Area

The Mohos sinkhole is located in the Bükk Mountains, which are part of the Central Mountains of northern Hungary and are the southernmost member of the Northwestern Carpathians. It is located in the southwestern part of the ‘Nagy-fennsík’ (karst plateau), under the ranges, often exceeding 900 m, that emerge from the southern edge of the Northern Bükk (Figure 2, left). The Mohos sinkhole is the largest sinkhole of the plateau (51,097 m2) and was formed at the line connecting ‘Büszkés-hegy’ (952 m a.s.l.) and the ‘Tar-kő’ group (949 m a.s.l.), between the ‘Zsidó’ meadow and the 952 m-high ‘Büszkés-hegy’ group in the southwestern corner of the Bükk plateau (Figure 2, right). The huge cirque in the hillside has unique topographic conditions. Its eastern, western, and southern sides continue partially into the hillside, protecting the sinkhole from both wind and solar radiation from those directions (Figure 2 and Figure A1).
The study site with the flow system of its microclimatic scope is in the southern third of the ‘Zsidó’ meadow. The entire ‘Zsidó’ meadow can also be characterized as a closed depression area, which gradually slopes towards the bottom of the Mohos sinkhole. Thus, the Zsidó meadow itself also has CAP development potential with its surrounding area being the deepest point (MS., alt. = 825.5 m) in the meadow. Inside the outflow line, with an altitude of 860 m, the Zsidó meadow is a multi-bottom sinkhole system within the extended microclimate system of 304,033 m2 (Figure 2 and Figure 3). Figure 2, Figure 3 and Figure 4 also present the location of the temporal control points over the Digital Elevation (DEM).

3. Results

Although these subsections are presented in Results, they also serve as a detailed case study area description, closely linked to the applied methods.

3.1. Land-Cover-Based Analysis of the Orthomosaic Images of the Study Area

To understand the models, it is worth analyzing the orthophoto made in the range of visible light (Figure 3b), whose territory overlaps the derived surface model and three-dimensional database. As seen on the orthophoto, vegetation visibly defines the outline of the sinkhole and the vegetation inversion that is specific to the sinkholes of the plateau can also be observed [32].
At the bottom of the sinkhole, lithotypes (alpine lawn communities) are found, which cover 45.07%, 126,110.7 m2 of the area of the study area represented by the orthomosaic. With increasing height and normalization of the temperature’s characteristics, they change to juniper (40.89%, 114,436.4 m2), pine (1.99%, 5576.6 m2), and beech communities (11.89%, 33,276.5 m2).
On 12 March, when the images were taken, some remaining snow patches were found at the very bottom of the sinkhole and in the juniper zone on the north-facing side (0.16%, 436.9 m2) (Figure 3c and Table A1), which can be explained by two observations. In the juniper zone, the snow laid down by the turbulent air currents had accumulated in greater quantities due to the snowdrift; moreover, it shielded the area from solar radiation, which usually penetrates from the west.

3.2. Micro-Topographic Analysis of the Research Territory

The digital surface model (DSM; 30,320,622 points, unfiltered for vegetation) (Figure 3a, bottom) contains raw surface data, retaining vegetation cover. This approach was chosen because vegetation influences radiation and airflow and thus represents a relevant micro-topographic impact factor. Subsequent model runs and thermal camera recordings confirmed the validity of this approach in the context of the microclimate, as filtering vegetation would have produced unrealistic results. The DSM highlights the Mohos sinkhole (MS) with its twin base and steep depth in the southern quadrant (Figure 3). Smaller depressions are visible to the north, aligned NW–NE. These northern depressions form a row that deepens progressively towards the Mohos sinkhole, the deepest point of the Zsidó meadow.
The bottom of the Mohos sinkhole (MS) acts as the main accumulation point of the surrounding topography, both locally and at the system level. The chain of karst depressions leading into the Mohos sinkhole (Figure 3 and Figure 4) likely enhances the microclimate system of the Zsidó meadow by expanding the effective radiation surface as a favorable sky-view area.
The DSM does not fully include the forested ridges around the Zsidó meadow, although they are present in the DEM (Figure 2). These ridges are important factors as they extend the shaded periods and strengthen the CAP’s resistance to external air flow influences from the E–S–W directions.
The slope map of the southern part of the ‘Zsidó’ meadow represents the slope conditions of the area on a scale of 0–90 degrees [23,33,34,35] (Figure 4, right). Outlier slope values are caused by vegetation, while the steepest surfaces occur on the south-facing sides of the Mohos sinkhole bottom. The sinkhole’s morphology explains the persistence of the CAP: the steepest drops occur near the bottom, where radiation energy loss is minimal. However, the topographically opened areas of the Zsidó meadow’s microclimate system hold favorable radiation conditions, generating cold air that drains into the more sheltered, protected Mohos sinkhole bottom (MS; Figure 3).
Thus, the micro-relief directly influences the cold-air-flow system, concentrating cold air in accumulation point zones. Open topographic surfaces promote radiative heat loss, producing cold air that settles in the protected, steep-walled bottom, which then flattens at the lowest elevation. The valley depth model indicates a relative depth of 33 m for the deepest part of the dolina as MS (Figure 4, left). These orographic conditions result in a relatively high sky-view factor area working as a ‘cold air factory’ zone, while still providing shelter for CAP development. Overall, the topographical properties of the microclimate system promote a combination of strong radiative heat loss potential protection for CAP, thus support the development of extremely low temperatures compared to its surroundings.

3.3. The Results of the Specific Models Derived from the GIS Database

3.3.1. Sky-View Analysis for the Mohos Sinkhole

According to the current state of science, the sky-view factor (fv) is a key microclimatic indicator of inversion development in sinkholes with comparable settings (similar geographical position) [16]. It was analyzed for the Mohos sinkhole and its microclimate system using the SAGA GIS Sky-View module [19,36,37] (Figure 5).
The interpretation of the sky-view factor (fv) of the Mohos sinkhole is partly based on the analysis of the slope gradient, which confirmed that the Mohos sinkhole’s geometry is both open and sheltered, favoring the formation and persistence of the cold-air-pool. The fv value range for the area (including all elements of the surface) is between 0.4 and 0.96 (on a scale from 0 to 1), displayed from fv ≥ 0.5 (Figure 5). According to the fv histogram, the study area can be characterized by a high sky-view factor. The average fv for the entire area is around 0.9 (Arithmetic Mean = 0.86). The tree cover is sparse, except for juniper and pine communities on the edge of the slopes (Figure 5). Snow cover further enhances favorable fv conditions by creating more uniform radiating surfaces. A deep (~30+ cm) snow layer reduces vegetation-induced roughness while leaving the orographic structure unchanged. This reduces near-surface air-flow turbulence and decreases the net shortwave radiation flux absorbed by the surface due to its high albedo. Overall, enhanced surface reflectivity contributes to lower temperatures.
Because the study relied on a raw surface model that accounts for multiple radiation and airflow factors, no single representative fv value was defined. The combined presence of sufficient openness, depth, and protection is necessary for the optimal development of the characteristic microclimate of the sinkholes. In comparison, in the research of Whiteman [16], the summarized values of the sinkholes studied by them were fv = 0.91 and fv = 0.88.

3.3.2. Analysis of Wind Exposition Index for the Mohos Sinkhole

The Wind Exposition Index [38] (Figure 6) is not a direction-specific mode; it estimates the potential overall wind exposure of the terrain. While real airflow patterns are strongly direction-dependent and turbulent, WEI offers a useful approximation of the area’s wind protection. Vegetation, particularly juniper, stands along the ridges separating the sinkholes and represents the most wind-exposed element but also provides additional shelter, especially for shallower depressions. The sinkholes connected to Mohos from the north illustrate how surrounding depressions can support the flow system of MS and contribute to CAP formation (Figure 6). The Mohos sinkhole appears as the most prominent anomaly, forming a large, homogeneous wind-sheltered zone where exposure decreases toward the bottom as a peak of the wind-protected line of depressions. The steepest relief presented in the slope gradient map is also the most protected part of the investigated area. This ~100 m wide area with 0.88–0.9 WEI values should be interpreted in the broader context of the DSM, which characterizes the wider area as generally wind-sheltered (Figure A1). The low average wind speed, measured in point MS (avg. wind speed < 1 km/h) confirms the model results (Figure 6).

3.3.3. Analysis of Cold Air Flow Index for the Mohos Sinkhole

When near-surface flows dominate, cold, dense air accumulates in closed depressions, unless disrupted by external homogenizing winds. This process results in inversion buildup. These separated flow systems can be modeled in order to calculate local air flow characteristics and reveal the area’s cold-air traps.
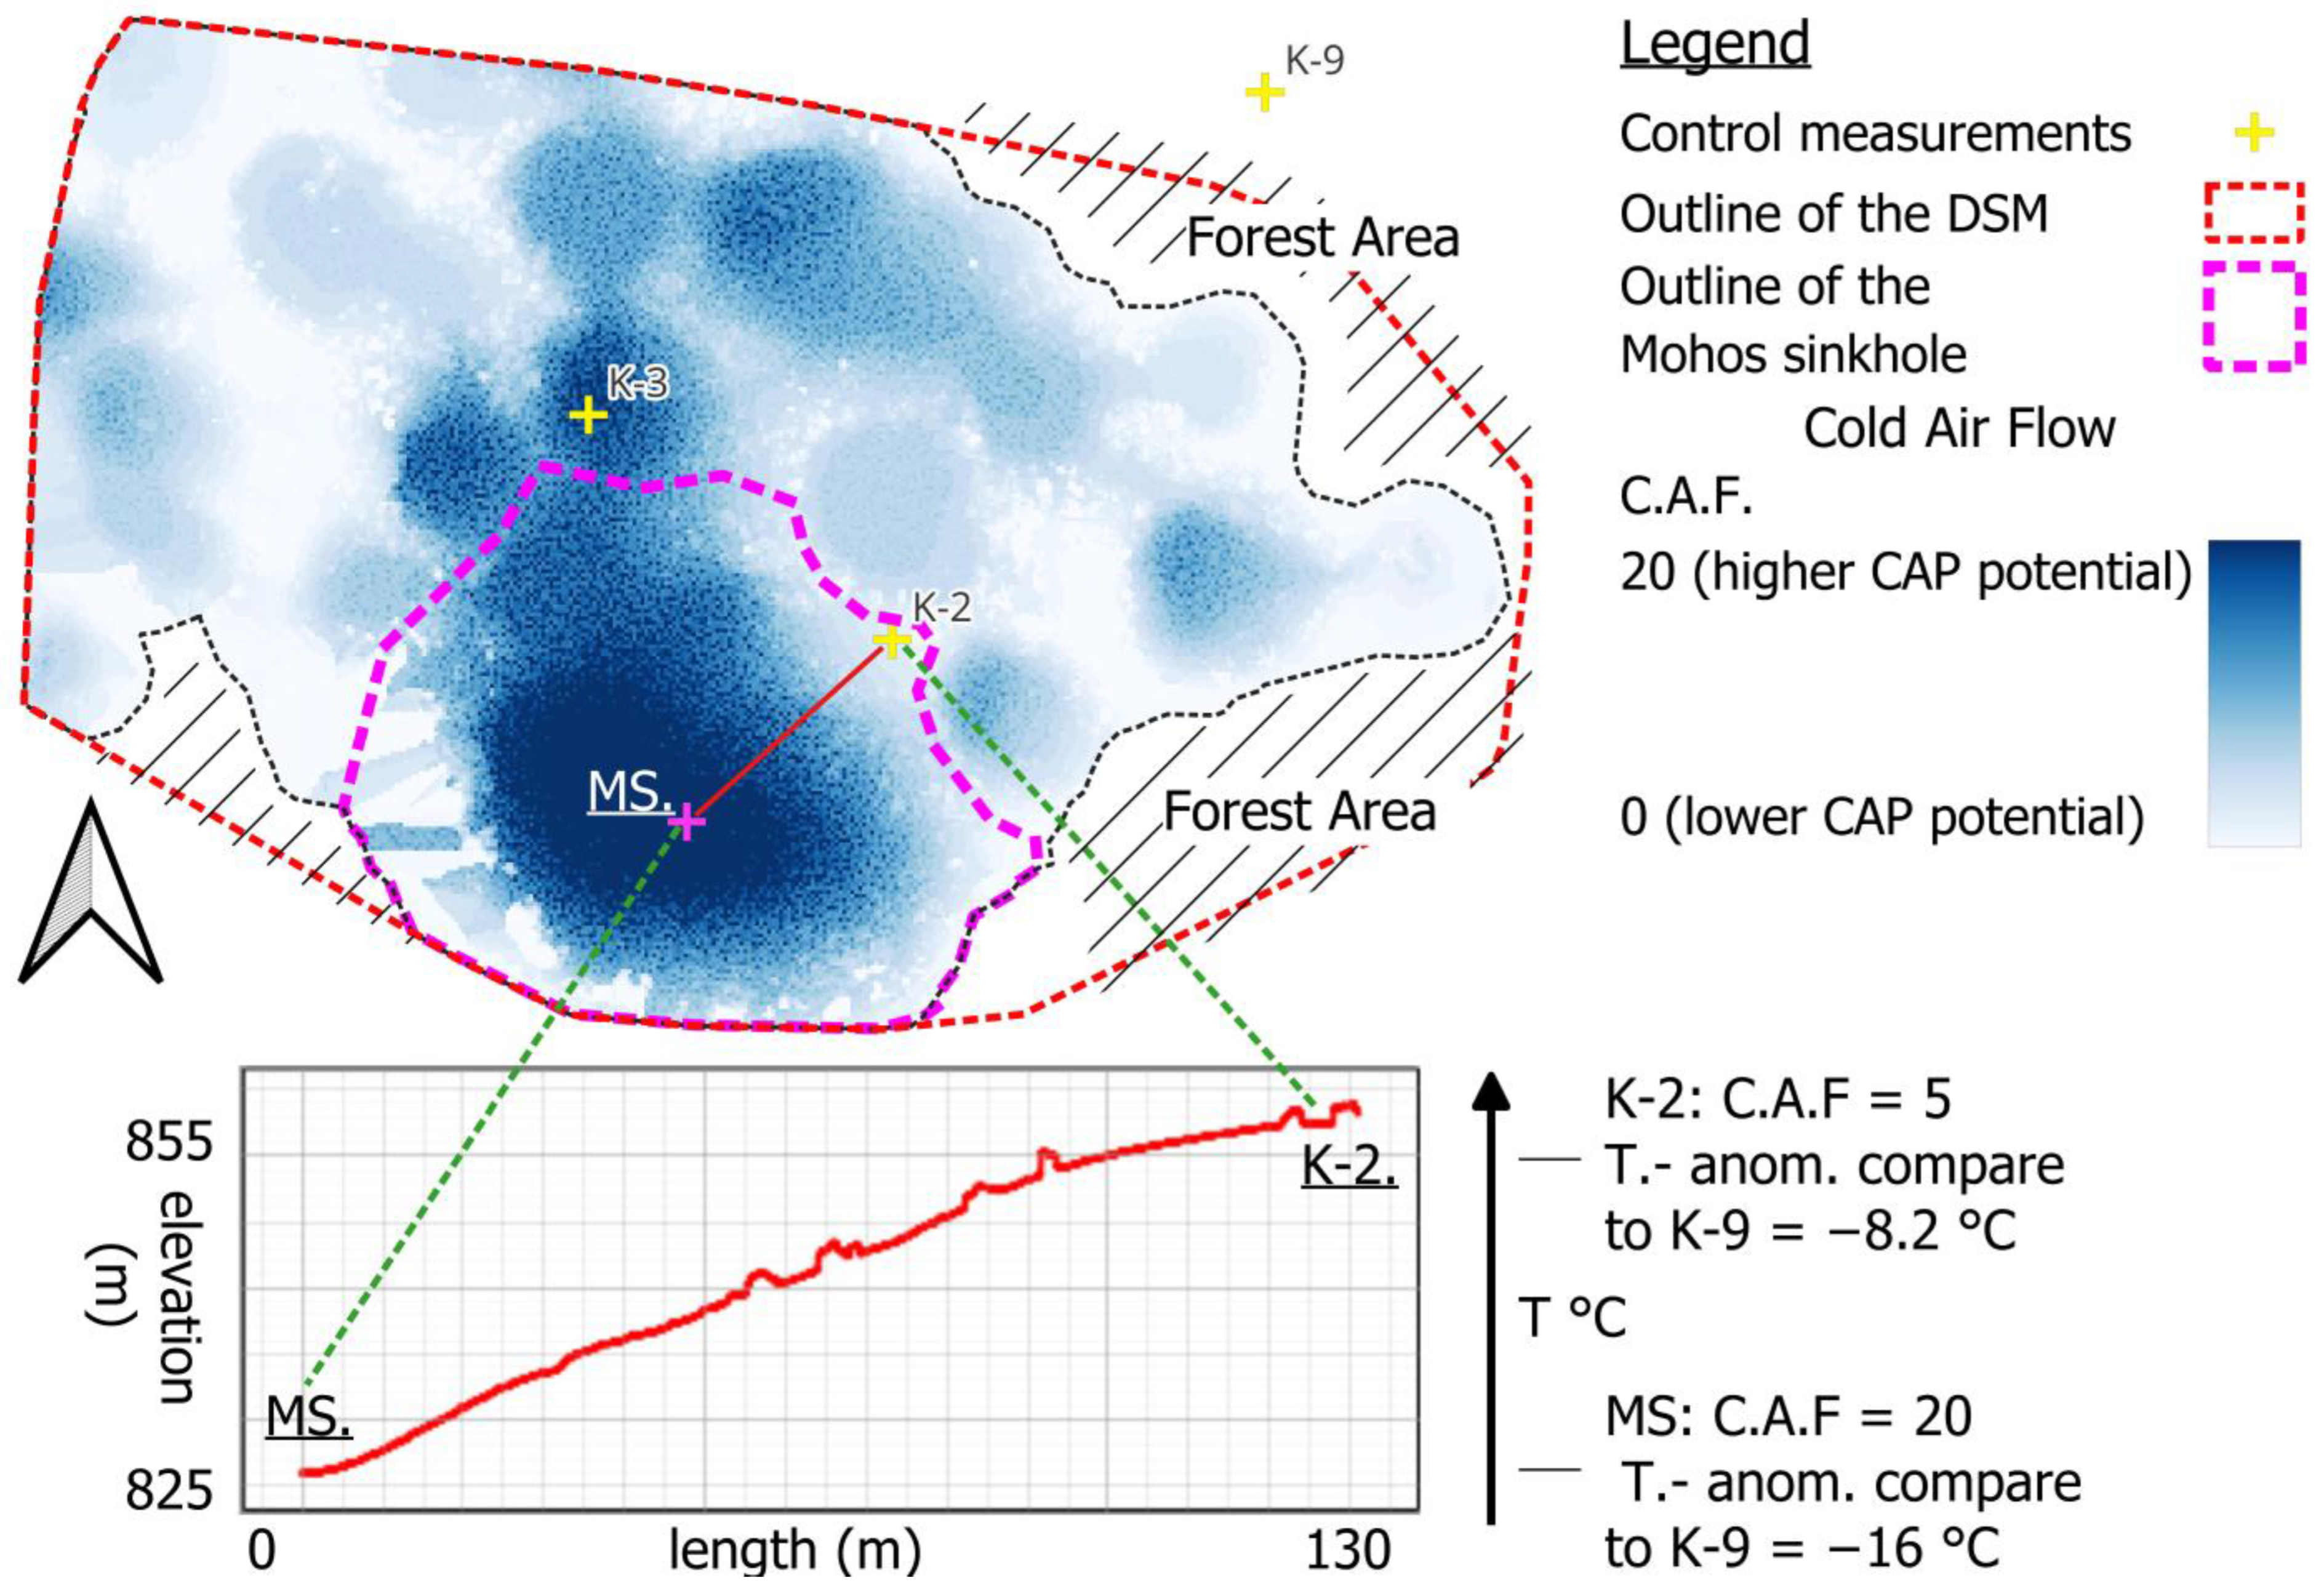
The Cold Air Flow model (Figure 7) is suitable for determining potential CAP areas and for providing quantitative estimation of CAP in closed basins [24]. It calculates with a hypothetical 0 °C air temperature in the point MS and a 16 °C surrounding air temperature. This 16 °C difference approximates the average daily minimum temperature contrast between MS and K-9 (see in Section Control Measurements) This difference can exceed 20≤ °C under favorable conditions. Figure 7 illustrates the model results for the delineated research area. The model indicates that at point MS, gravity-driven flows accelerate as they reach the slope base, generating near-surface CAP disturbances. These do not inhibit the inversion development but contribute to local turbulence in the subsurface zone.
The models mark the confluence zone of the Mohos sinkhole and the connected sinkhole system’s bottoms part as a separate unit (Figure 7). The main cold-air accumulation zone follows a 480 m NW–SE line at relatively low elevations of the study area. The model highlights the role of the connected sinkhole lines as an additional cold-air factory system more clearly than earlier approaches. The area directly linked to point MS, strongly affected by CAP, is about 55,000 m2 within the 304,033 m2-wide microclimate system of Zsidó meadow.
Control Measurements
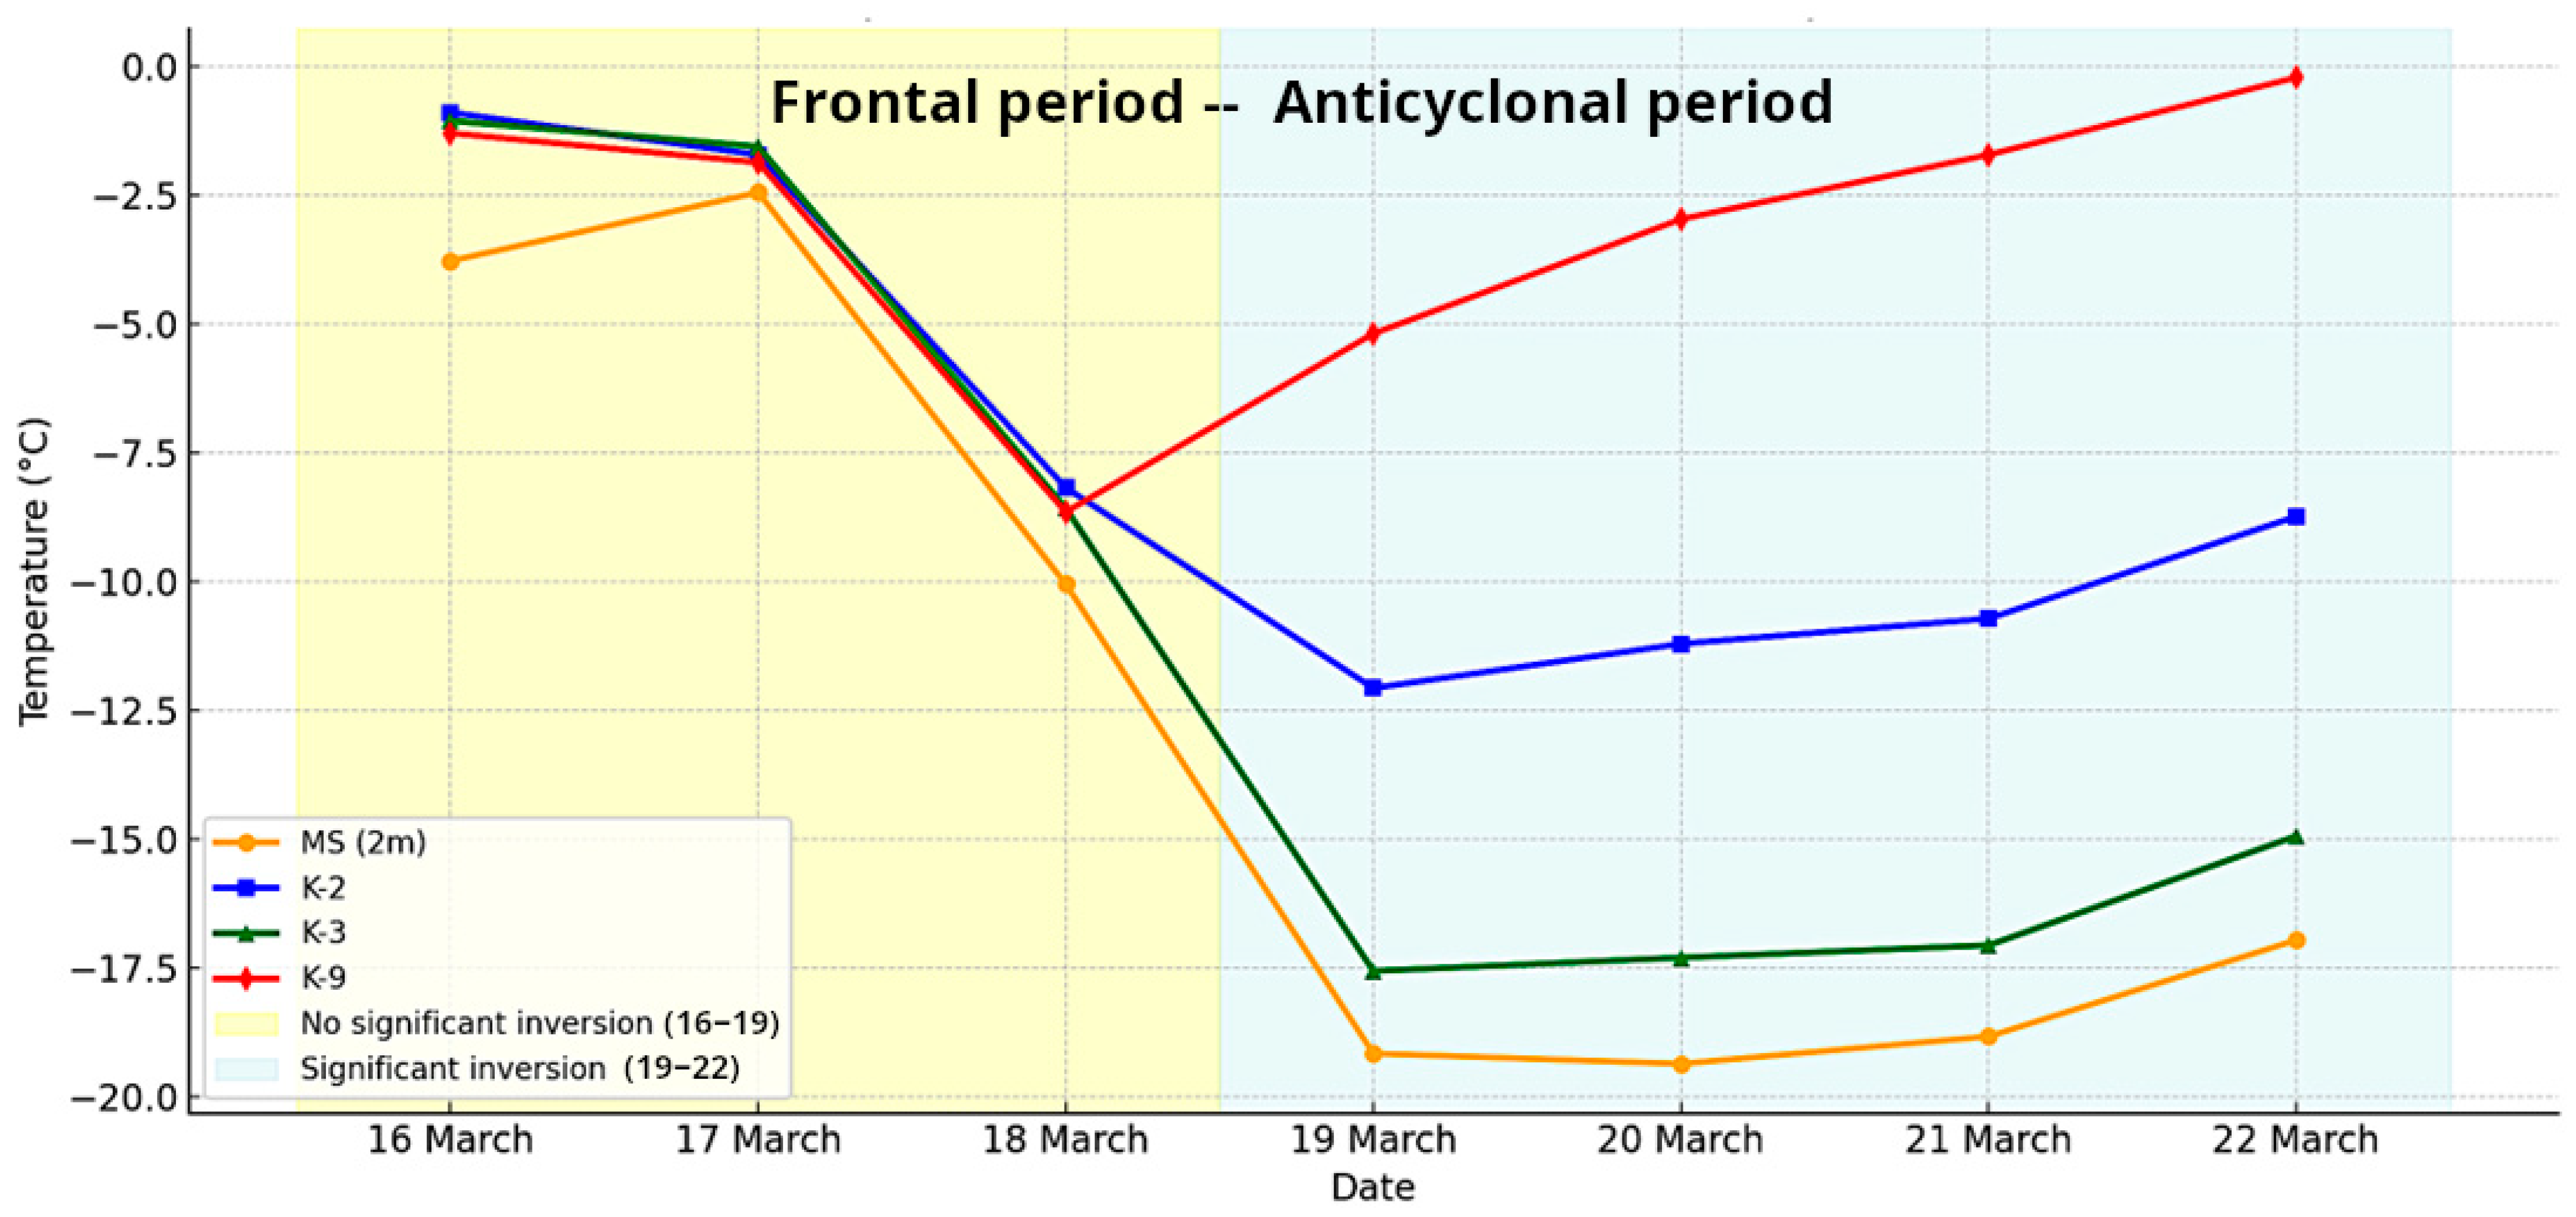
To compare the atmospheric processes at the point MS with its surrounding areas and to validate the results of the Cold-Air-Flow model (Figure 7) and confirm the CAP phenomenon in the study area (Figure 8), control measurements were established (K-2; K-3; K-9) based on the representative points of calculated cold-air anomaly rates.
From the control point measurements of the spring of 2025, seven cases were selected for analysis. Selection targeted a sequence with both high-dynamic frontal weather and a subsequent stable anticyclonic period, to demonstrate inversion presence in a continuous investigated period (16–22 of March). From 16th to 18th of March, thermal inversion was not present, while between 19th and 22nd of March it was present within the study area.
During the frontal period, the average daily minimum temperature differences between the point MS and the control points were −1.7 °C in case of K-3; −1.8 °C in case of K-2, and −1.5 °C in case of K-9 (peak). During the anticyclonic period (these results form the basis of the calculated anomalies), the average daily T-min. differences between the point MS and the control points were −1.8 °C in case of K-3; −7.9 °C in case of K-2, and −16 °C in case of K-9 (peak); furthermore, −8.2 between K-9 and K-2 (Figure 8).
The recorded reference values confirm the negative temperature anomaly of the Mohos sinkhole below the Zsidó meadow (Figure 8). They also indicate a reduced but still present negative temperature anomaly in the Zsidó meadow microclimate system (K-2 and K-3), compared to areas without significant temperature inversion (K-9) tendencies but at similar elevations. In addition, since the beginning of the control measurements (summer of 2024) the amount of the inversion reached the value of −20 °C.
The control measurements confirmed the anomaly levels predicted by the Cold-Air-Flow model for the ‘Zsidó’ meadow microclimate system, with MS as the main cold-air accumulation point.

3.3.4. Analysis Based on Diurnal Anisotropic Heat Model in the Mohos Sinkhole

The Diurnal Anisotropic Heat (Figure 9) model is useful to define the CAP position during daytime and the differences in energy budget. Observations indicate that winter inversions in the Mohos sinkhole can persist even during peak daytime radiation, because sunlight does not directly reach the shaded bottom air layers. The stable CAP can resist mixing with warmer turbulent currents under weak airflow conditions [14,15].
Temperature fluctuations within the sinkhole reflect its inhomogeneous microclimate, with notable variations in surface and near-surface temperatures depending on slope exposure as they warm at different rates. The sun-exposed southern side heats up more rapidly than the shaded northern side, because of the different energy budget of the sides. South-facing slopes reach higher temperatures, while the north-facing side stays cooler, often warmed only by reflected heat radiation from the S exposed side or by mixing with catabatic winds. This indicates that CAP on protected, topographically favorable slopes can persist through the irradiation period under stable regional weather conditions [14,15] and these differences are critical for CAP to survive during the insolation period on the self-shaded basin side [39].
In case of windless and clear-sky conditions, the erosion of the inversion starts as direct irradiation warms the surface. The eastern exposed slopes warm up first, followed by the southern, causing CAP to erode most rapidly in these areas. Strong currents form above the warming surface, and both laminar and turbulent air flows develop around the sinkhole. The turbulent air currents generated above the south-facing side move gradually to the CAP zone, with delayed reaction to the N-S shift in the boundary of the irradiation zone to the shaded side. The convection zone’s line pushes forward the inversion in the bottom-zone of the sinkhole, until either (a) the entire area of the sinkhole is in the direct irradiation zone, or (b) the shielded side of the sinkhole prevents the growth of the irradiation zone, and the CAP is pushed up to the north-facing side. The inversion persists on the north-facing side until insolation decreases, after which cold air settles back into the basin bottom (Figure 9).
Thermal Camera Analysis of the Location of the Cold-Air-Pool During the Irradiation Period
To detect the diurnal positioning of CAP in the Mohos sinkhole, thermal camera surveys were elaborated on 12 March 2023, and 10 November 2024. Both measurements were carried out during transitional seasons (spring and autumn), when self-shading divides the sinkhole bottom and allows the inversion layer to be observed during direct irradiation in the insolated side (first date selection guideline). The aim was to validate the temperature distribution predicted by the Diurnal Anisotropic Heat model using thermal imagery and point measurements (Figure 9).
The 12 March case demonstrated that the inversion was displaced from the basin bottom to the shaded side. Measurements started at 14:50, and earlier data are not available; therefore, the onset of cooling may have occurred earlier. At 40 cm, the measurements initially showed normal stratification, followed by a rapid temperature drop (5.5 °C within 10 min), indicating the downslope relocation of cold air into the bottom. This was not a measurement error but rather a direct capture of the sudden reestablishment of the inversion. Although the inversion collapsed at 2 m, it persisted in the shaded part of the sinkhole during the irradiation period, consistent with relatively higher local atmospheric dynamics that affected the investigated day.
In contrast, on 10 November, under extremely stable anticyclonic conditions, the inversion remained intact throughout the day. Here, the 2 m air layer was gradually cooled from below by the persistent CAP, and no complete collapse was observed (Figure 9).
Together, these complementary cases confirm that the CAP can survive daytime irradiation under certain meteorological situations. The March event represents a more dynamic, transitional state, whereas the November case shows a stable all-day inversion. These observations provide targeted validation of the Diurnal Anisotropic Heat model and underline the need for further measurements to generalize the phenomenon across varying conditions.

3.4. Recorded CAP Cases

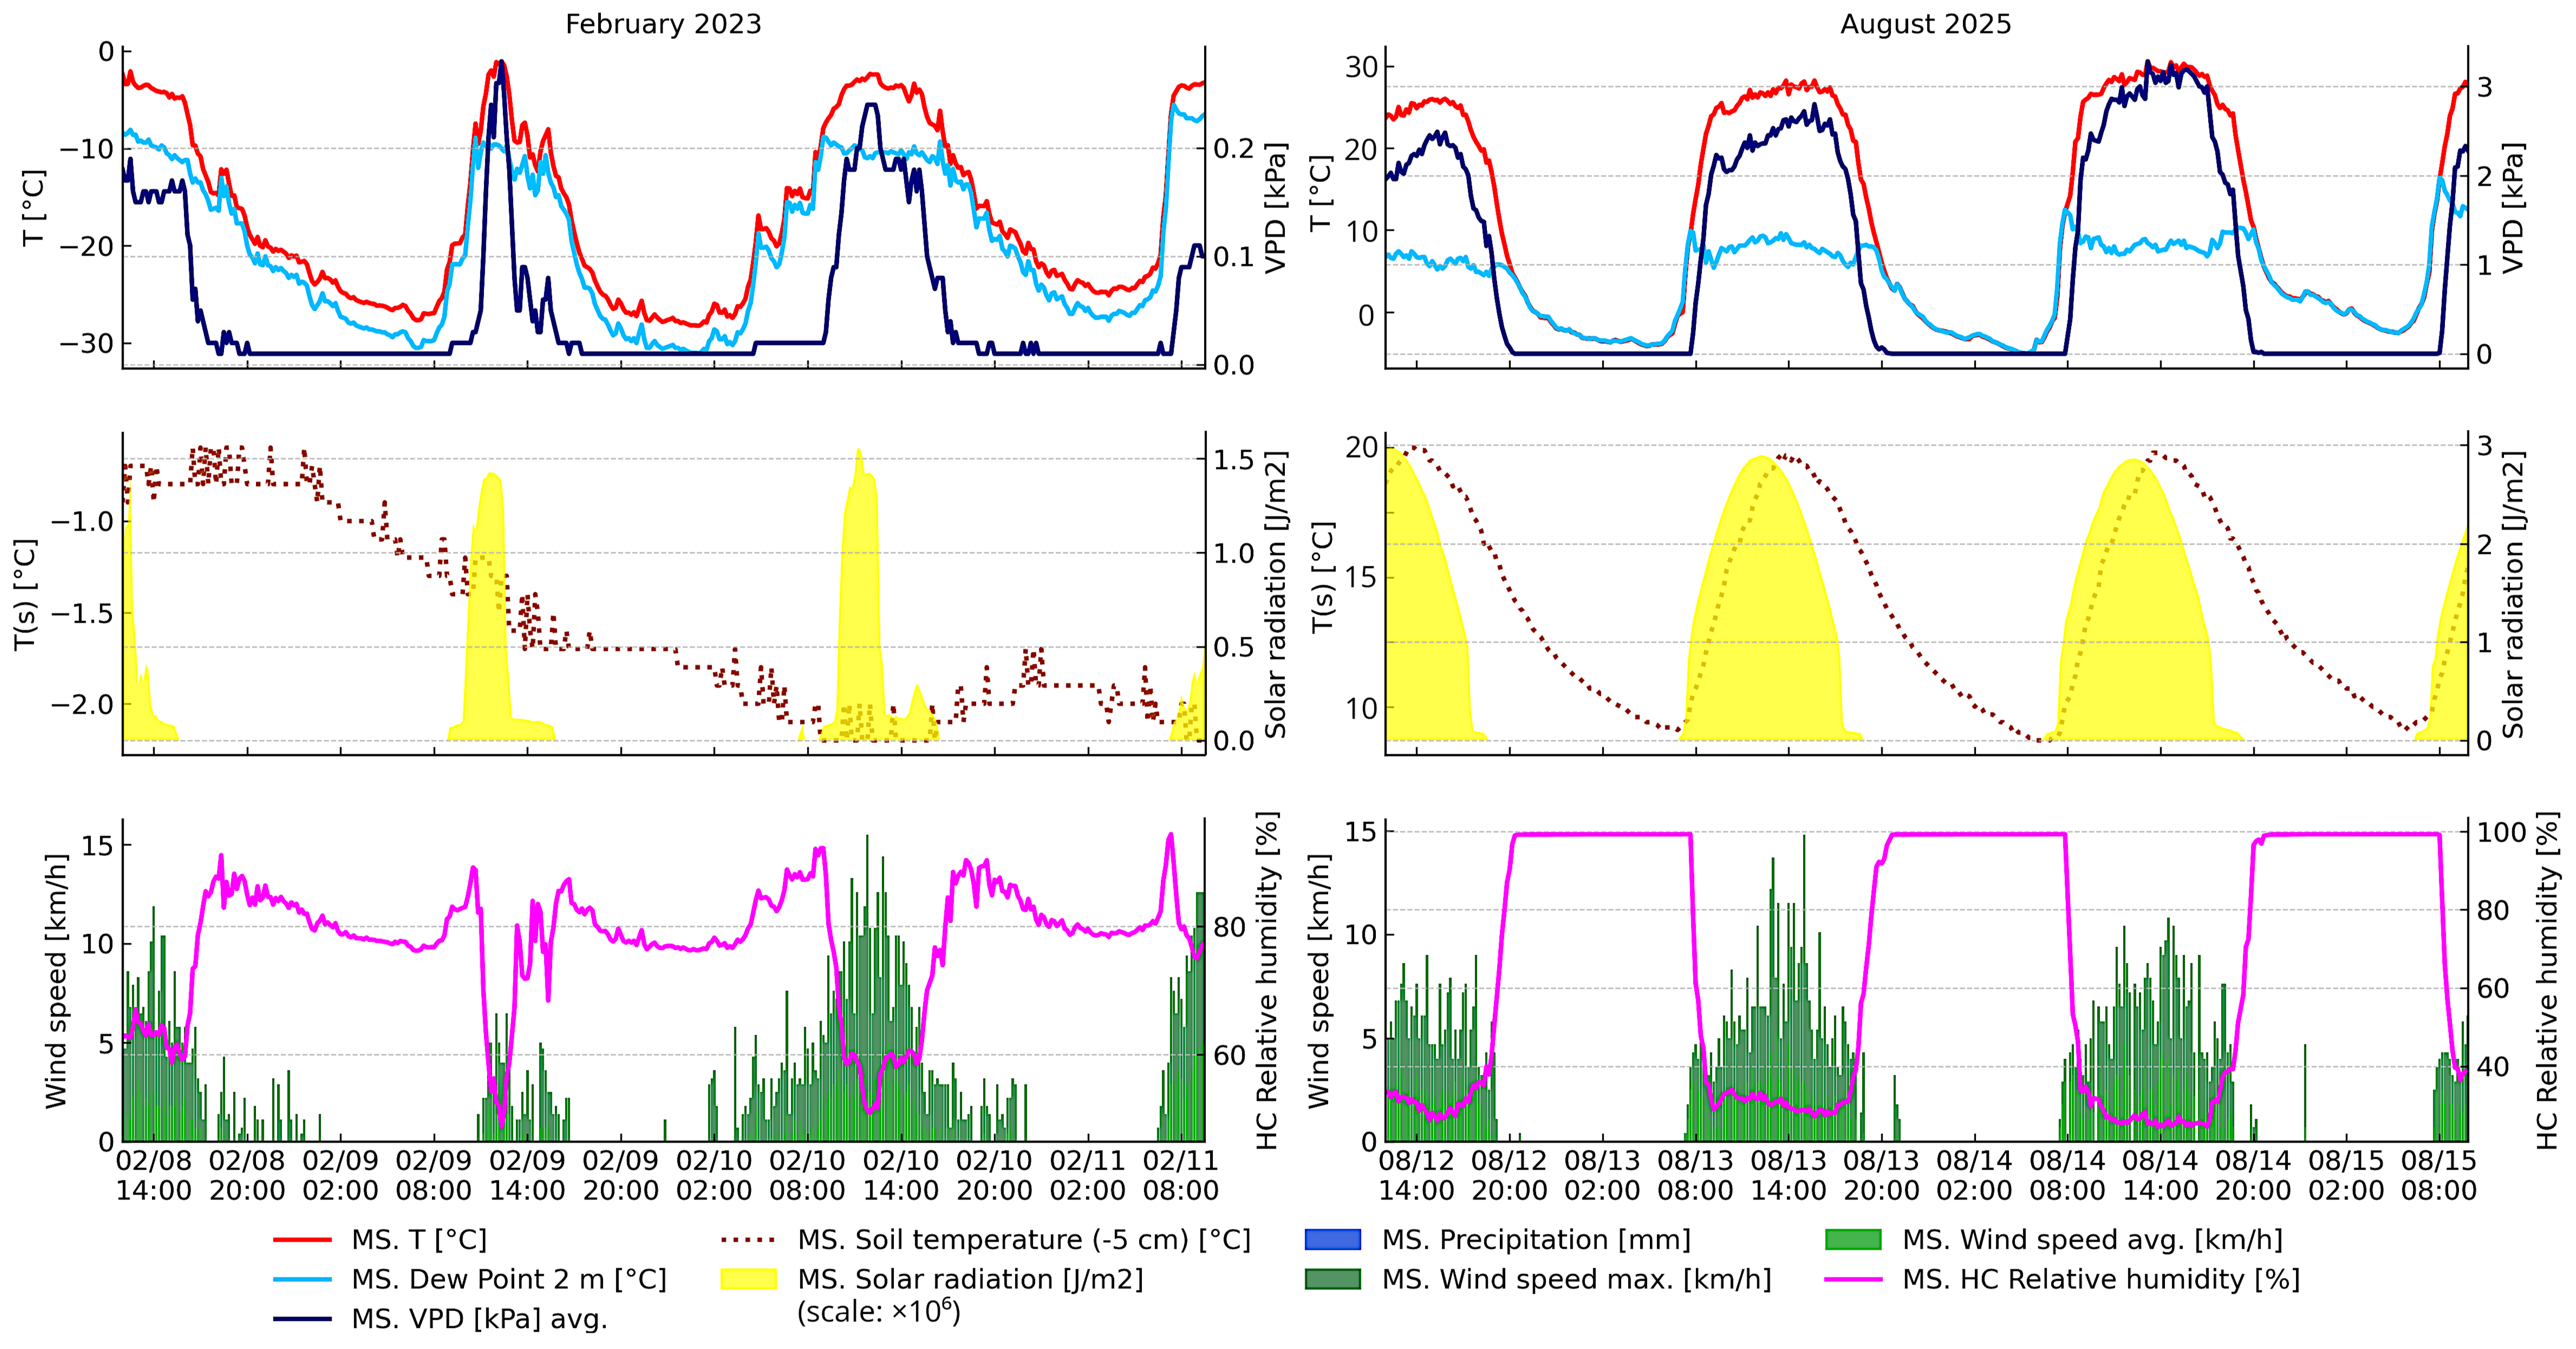
This section presents the effects of the sinkhole microclimate system, determined by topography, based on temperature measurements taken at 2 m above the ground during two representative periods: a dynamic winter period and an undisturbed summer anticyclone period at point MS (Figure 10). Since the beginning of the long-term measurements (from 2022) in MS all types of temperature inversion developments were recorded, including a CAP window; late buildup (with a minimum temperature recorded as late as at 10 A.M.); early breakup; layered (turbulent) erosions; and both slightly disturbed and undisturbed buildups [7,15,40,41].
Temperature data from the three coldest days of February 2023, highlighting the influence of external weather factors on the development of CAP, are presented by Figure 10.
On 8–9 and 10–11 February, wind lulls occurred during the second half of the night, allowing CAP formation until solar radiation began, which influenced CAP persistence. During the night of 9–10 February, favorable radiation conditions prevailed in the first part of the radiation period due to clear skies and calm winds. Following a minimum temperature of −28.2 °C at 1 A.M., wind gradually strengthened due to incoming warm elevated convection [42], leading to the typical case of layered (turbulent) CAP erosion [7]. The turbulent erosion process was also evident in the early rise in the VPD curve. This phenomenon, characterized by progressively increasing wind speed, led to the gradual breakup of the temperature inversion [14,15]. Throughout the periods of 8–9 and 10–11 February, significant CAP build-up occurred during wind lulls. This accumulation increased CAP resistance against external conditions, due to higher specific air density. Consequently, the sinkhole’s flow system may have influenced the surrounding external flow systems, altering their direction and velocity (Figure 10) [7,18,39].
At dawn of 10 February 2023, the temperatures in several sinkholes of the Bükk plateau fell below −25 °C (Vörösmeteor-töbör (sinkhole): −27 °C, MeteoPont.hu). At point MS the T-min. was −28.23 °C, which is the coldest temperature recorded in the winter of 2022/2023 in Hungary (official national T-min. of the winter of 2022/23 was −15.3 °C at Gagybátor [42]).
Soil temperature (T(s), −5 cm) values reflected the heat-insulating effect of the thick snow cover. T(s) did not react directly to the daily air temperature fluctuations, but to the generally lower average temperature of the near surface air temperature. The correlation between T and T(s) decreased with increasing in snow depth [43,44,45,46,47]. Based on the measurements in MS, the average correlation of T(s) and T was low under 35 cm of snow (R2 = 0.29), medium with 2–4 cm of snow (R2 = 0.57), and high without snow coverage (R2 = 0.81) within undisturbed conditions [48].
Another notable phenomenon resulting from sinkhole microclimate is summer frosts (Figure 10), uncommon at this altitude in Central Europe. No official frost records exist for July or August in the national monitoring database of the Hungarian Weather Service [49]. However, due to the CAP effects, summer frosts are not an extreme phenomenon in the Mohos sinkhole and generally in the Bükk plateau. Since the installation of the meteorological station in the MS, between 17 July 2022 and 31 August 2025, a total of 87 summer frost cases have been recorded at 2 m above the surface.
A representative example occurred between 12 and 15 of August 2025, during a strong anticyclone period, when temperatures reached −4.2 °C (13 August), −5.1 °C (14 August), and −2.5 °C (15 August) (Figure 10). The undisturbed inversions allowed detailed analysis of temperature curve behavior. The diurnal temperature range (DTR = T-max − T-min) reached 32.9 °C (13 August), 35.7 °C (14 August) and 34.1 °C (15 August) with corresponding maximum instantaneous cooling rates (ICR max) of 8.7 °C/h (18:30), 9.8 °C/h (18:20), and 11.2 °C/h (18:40) [16]. The average DTR was 34.2 °C, while the ICR max. was 9.9 °C/h during the most intensive cooling phase. The DTR = 35.7 °C recorded on 14 August exceeded the official Hungarian record by 4.3 °C [49], marking the highest unofficial DTR measured to date (17 August 2025).
In addition, the coldest summer temperature recorded in MS (2 m) was −10.1 °C in August 2025 which is the lowest unofficial summer temperature of Hungary. During summer 2025, minimum temperatures were ≤0 °C on 41 occasions, ≤−5 °C on 8 occasions, ≤−7 °C on 4 occasions, and ≤−10 °C once. These results clearly illustrate the magnitude of the extended microclimate system.

4. Discussion

This study reinforces and extends previous findings on cold-air-pool development in topographically closed basins. Earlier studies (Steinecker et al. [8], Dorninger et al. [7], Whiteman et al. [16]) demonstrated that sparsely vegetated basins are prone to temperature inversions under calm and clear conditions. Our measurements and high-resolution DSM-based models confirm these patterns at the Mohos sinkhole, with minimum temperatures consistently lower than surrounding areas. Control measurements revealed an average temperature difference of 7.4 °C between the sinkhole bottom (MS) and its outline (K2), and 13.8 °C between MS and K1 (no CAP potential), highlighting the magnitude of local anomalies.
The study highlights the importance of integrating multiple factors in CAP modeling. The Sky-View Factor, wind exposure, cold-air accumulation potential and diurnal anisotropic heating collectively define microclimatic exposure patterns (Figure 9). Retaining vegetation in the DSM enhanced the realism of cold-air simulations, as vegetative cover provides wind shelter and modifies local airflow. External wind effects were critical: laminar flows glide over accumulated cold air, whereas turbulent flows gradually erode inversions [7,9,14,15]. Inversions showed increased resistance as they matured, but extreme wind events caused temporary resets, consistent with the prior literature [7,14,15,18,41].
The Mohos sinkhole represents a tertiary microclimate system [39], whose dynamics are shaped by topography, basin morphology, and vegetation. Multi-sinkhole connectivity further emphasizes that CAPs are not isolated phenomena. Cold-air masses flow from adjacent depressions into deeper basins, influencing both the timing and intensity of inversions. Optimal inversion buildup requires a combination of high sky-view factor (fv > 0.7–0.9) and protection from external airflows, with local vegetation enhancing wind sheltering and extended area with low vegetation coverage (e.g., grass areas). These results extend observations by Whiteman et al. [16] and others, showing that the persistence of inversions depends on both local morphology and broader airflow context.
Spatial overlaps of modeled parameters revealed coherent microclimatic patterns: cold air accumulation aligns with sheltered zones, while diurnal heating and the Sky-View Factor shape the broader microclimate system. During later stages of inversion buildup, these areas converge to form extensive air temperature anomalies across the multi-bottom depression of the Zsidó meadow, peaking at point MS. Winter heterogeneity in diurnal anisotropic heating allowed daytime persistence of inversions and reduced daily maxima [39]. Thermal camera and near-surface measurements confirmed periodic shifts in the CAP between the basin bottom and self-shaded areas, demonstrating resilience to daily irradiation maxima and weak laminar airflows [14,15].
While this study focused on detailed case analyses and topographical-resulted microclimate factors, future work will expand the dataset to assess the frequency and seasonal distribution of CAP events, enabling more systematic comparison of observed and simulated data. This will strengthen the representativeness of our findings and their practical relevance. The persistence of CAPs also has implications under climate change, particularly for frost-sensitive agriculture and ecosystems. Our multi-sinkhole, multi-model approach provides a transferable framework for site-specific risk assessment and adaptation in other karst landscapes.

5. Conclusions

This study shows that a multi-sinkhole perspective enables hierarchical analysis of karst depressions, providing new insights into the system-level dynamics of cold-air pools, which represent one of the most pronounced microclimate systems in Central Europe. The Bükk Plateau and the Mohos sinkhole exhibit some of the coldest temperatures below 1000 m, highlighting that significant temperature inhomogeneity can occur over very small spatial scales under favorable topographic and atmospheric conditions. These findings demonstrate the critical role of terrain, vegetation, and airflow in shaping the formation and persistence of CAPs.
A key novelty of this research lies in the multi-sinkhole perspective, which enables hierarchical system-level analysis and confirms that the applied multi-model framework can precisely delineate the elements of a microclimate system. This fine-resolution classification of microclimatic structures provides a new methodological pathway for studying the spatial processes of CAP buildup and persistence in karst landscapes.
Beyond the scientific contribution, the integrated DSM-based modeling combined with field measurements provides a reproducible, cost-effective framework for frost-risk assessment and microclimate mapping. The methodology supports precision agriculture, site-specific climate adaptation, urban planning, and environmental management by allowing decision-makers to evaluate exposure patterns across multiple spatial scales. Partial validation has already been achieved through Cold Air Flow–based control measurements and Diurnal Anisotropic Heat model thermal imaging, which provide preliminary results supporting the applied modeling framework. A monitoring network of sensors deployed in the study area will further refine the understanding of CAP dynamics and inform operational decision-support systems.
Overall, this study underscores the value of complex microclimate modeling for identifying spatial heterogeneity in frost exposure and for developing targeted adaptation strategies in climate-sensitive landscapes. The next stage of this research involves the inclusion of a high-mountain control site, the high-resolution validation of the model framework, and further testing of its applicability and refinement. These steps are already underway and are expected to provide answers to the remaining open questions.
The study area offers significant long-term potential for advancing the understanding of the relationship between climate change and microclimate systems, with behavioral patterns being continuously monitored and analyzed [4]. This study provides the complex, reproducible GIS-based analysis of cold-air-pool dynamics in topographical basins. Its novelty lies in the integrative, multi-sinkhole approach and the use of unfiltered surface data, which together reveal the combined role of topography and microclimatic drivers beyond single-process interpretations.

Author Contributions

Conceptualization, A.D.; methodology, A.D.; software, A.D.; validation, A.D.; formal analysis, A.D.; investigation, A.D.; resources, A.D. and E.D.; data curation, A.D. and R.F.; writing—original draft preparation, A.D.; writing—review and editing, A.D., R.F. and E.D.; visualization, A.D. and R.F.; project administration, A.D.; funding acquisition, A.D. and E.D. This study was initiated and developed independently by A.D. with support from the affiliated research environment. The contributions of R.F. and E.D. reflect close and consistent professional support throughout the project, primarily in the form of field assistance, language editing, ongoing scientific feedback and logistical background. Their roles did not shape the core concept, but substantially supported the implementation and scientific communication of the work. All authors have read and agreed to the published version of the manuscript.

Funding

This research received no external funding.

Data Availability Statement

Most of the data presented in this study were derived from in situ measurements using meteorological instruments operated by the University of Miskolc. These data are available from the corresponding author upon reasonable request. National meteorological data were obtained from the Hungarian Meteorological Service and are accessible through their database.

Acknowledgments

The author wishes to thank the Board of Directors of the Bükk National Park Directorate for authorizing access to the protected research area. Appreciation is also extended to 360world Europe Ltd. for providing thermal imaging hardware and software support. The author gratefully acknowledges Róbert Kerékgyártó for generously sharing the measured data from point Vörösmeteor sinkhole, and Attila Szamosi for his help with the UAV data collection. Furthermore, thank you to András Hegedűs and Attila Hevesi for the valuable advice in relation with the ongoing research project.

Conflicts of Interest

The authors declare no conflicts of interest.

Abbreviations

The following abbreviations are used in this manuscript:
MSMohos sinkhole
K-2control measurement point (ridge of the basin)
K-3control measurement point (1st outflow of the MS)
K-9Control measurement point (peak)
DEMDigital Elevation Model
DSMDigital Surface Model
DTRDiurnal Temperature Range
TTemperature
T(s)Soil Temperature
T-max.Maximum Temperature
T-min.Minimum temperature
CAPCold-Air-Pool
GISGeographic Information System
fvSky-view Factor
Alt.Altitude above sea-level
NNorth
EEast
SSouth
WWest
Avg.average
RGBRed–Green–Blue composite picture
R2Level of co-variance
ICR max.Maximum hourly cooling rate

Appendix A

Figure A1. Wind Exposition Index (regional context) calculated from the 25 m DEM, illustrating ridge-scale sheltering around the study area.
Climate 13 00205 g0a1
Figure A2. Automatic meteorological station (iMETOS 3.3) at point MS during late autumn; note the persistent ice cap at the basin bottom associated with CAP. The white line shows the elevation of the measurement above the surface.
Climate 13 00205 g0a2
Table A1. Class distribution of the investigated area, calculated from the RGB orthophoto presented by Figure 3c.
Class Distribution of the Investigated Area
Thematic Image ClassNumber of SamplesPercent (%)Area (m2)
Pines9,919,9131.99%5,576,619 m2
Snow777,2600.16%436,948 m2
Junipers203,564,12540.89%114,436,443 m2
Lithotypes224,331,05245.07%126,110,864 m2
Beech communities59,193,51011.89%33,276,466 m2
Total497,785,860100.00%279,837,340 m2
Table A2. The parameters of Tool Sky-View Factor; Wind Exposition Index; Cold Air Flow and Diurnal Anisotropic Heat from the SAGA-GIS Tool Library Documentation (v7.8.0) [50,51,52,53].
ModelParameters
Sky-View Factor NameTypeIdentifierDescription (and Constraints)
InputElevationgrid, inputDEM
-
(DSM)
OutputVisible Skygrid, outputVISIBLEThe unobstructed hemisphere given as percentage.
Sky-View Factorgrid, outputSVF
-
(YES)
Sky-View Factor (Simplified) grid, output, optionalSIMPLE
-
(YES)
Terrain View Factor grid, output, optionalTERRAIN
-
(YES)
Average View Distance grid, output, optionalDISTANCEAverage distance to horizon.
OptionsGrid Systemgrid systemPARAMETERS_GRID_SYSTEM
-
(DSM)
Maximum Search Radiusfloating point numberRADIUSThe maximum search radius [map units]. This value is ignored if set to zero. (10,000)
Number of Sectorsinteger numberNDIRS
-
(8)
MethodchoiceMETHOD
-
(cell size)
Multi Scale Factorfloating point numberDLEVEL-
Wind
Exposition Index
InputElevationGrid (input)DEM
-
(DEM; DSM)
OutputWind ExpositionGrid (output)EXPOSITION
-
(DEM; DSM)
OptionsSearch Distance [km]Floating pointMAXDIST
-
(30)
Angular Step Size (Degree)Floating pointSTEP
-
(15°)
Old VersionBooleanOLDVERuse old version for constant wind direction (no acceleration and averaging option)
AccelerationFloating pointACCEL
-
(1.5)
Elevation AveragingBooleanPYRAMIDSuse more averaged elevations when looking at increasing distances
Cold Air FlowInputElevationGrid, inputDEM
-
(DEM; DSM)
Production Grid, input, optionalPRODUCTIONRate of cold air production [m/h].
Surface Friction Coefficient Grid, input, optionalFRICTIONSurface friction coefficient. (1)
OutputCold Air HeightGrid, outputAIR
-
(YES)
Velocity Grid, output, optionalVELOCITY
-
(YES)
OptionsGrid SystemGrid systemPARAMETERS_GRID_SYSTEM
-
(DSM)
DefaultFloating pointPRODUCTION_DEFAULTdefault value if no grid has been selected
DefaultFloating pointFRICTION_DEFAULTdefault value if no grid has been selected
ResetBooleanRESET
-
(YES)
Simulation Time [h]Floating pointTIME_STOPSimulation time in hours. (6 h)
Map Update Frequency [min]Floating pointTIME_UPDATE
-
(10 min)
EdgeChoiceEDGE
-
(OPEN)
Time Step AdjustmentFloating pointDELAYChoosing a lower value will result in better numerical precision but also in a longer calculation time. (0.5)
Surrounding Air TemperatureFloating pointT_AIRSurrounding air temperature [degree Celsius]. (15 °C)
Cold Air TemperatureFloating pointT_AIR_COLDCold air temperature [degree Celsius]. (0 °C)
Diurnal Anisotrpic HeatInputElevationGrid (input)DEM
-
(DSM)
OutputDiurnal Anisotropic HeatingGrid (output)DAH
-
(YES)
OptionsGrid SystemGrid systemPARAMETERS_GRID_SYSTEM
-
(DSM)
Alpha Max
(Degree)
Floating pointALPHA_MAX
-
(202.5)

References

  1. Ogrin, M. The minimum temperatures in the winter 2006/07 in Slovenian frost hollows. Dela 2007, 28, 221–237. [Google Scholar] [CrossRef]
  2. Zängl, G. Formation of Extreme Cold-Air Pools in Elevated Sinkholes: A Numerical Study. Mon. Weather Rev. 2005, 133, 925–941. [Google Scholar] [CrossRef]
  3. Dobos, A.; Kerékgyártó, R.; Dobos, E. A 2022–2023-as téli szezon összefoglaló elemzése a Bükk-fennsíki Mohos-töbör és Vörösmeteor-töbör mérései alapján. LÉGKÖR 2024, 69, 33–40. [Google Scholar] [CrossRef]
  4. Dobos, A.; Dobos, E. A termális inverzió viselkedése a Mohos-töbör mikroklímarendszerén belül 2023 őszén. Földrajzi Közlemények 2025, 148, 289–304. [Google Scholar] [CrossRef]
  5. Meteopont.hu. Available online: http://bukk.meteopont.hu/ (accessed on 10 February 2023).
  6. Clements, C.B.; Whiteman, C.D.; Horel, J.D. Cold-Air-Pool Structure and Evolution in a Mountain Basin: Peter Sinks, Utah. J. Appl. Meteorol. 2003, 42, 752–768. [Google Scholar] [CrossRef]
  7. Dorninger, M.; Whiteman, C.D.; Bica, B.; Eisenbach, S.; Pospichal, B.; Steinacker, R. Meteorological events affecting cold-air pools in a small basin. J. Appl. Meteorol. Climatol. 2011, 50, 2223–2234. [Google Scholar] [CrossRef]
  8. Steinacker, R.; Whiteman, C.D.; Dorninger, M.B.; Pospichal, S.; Eisenbach, A.M.; Holzer, P.; Weihs, E.; Mursch-Radlgruber, A.; Baumann, K. A sinkhole field experiment in the Eastern Alps. Bull. Am. Meteorol. Soc. 2007, 88, 701–716. [Google Scholar] [CrossRef]
  9. Pospichal, B.; Eisenbach, S.; Whiteman, C.D.; Steinacker, R.; Dorninger, M. Observations of the Cold Air Outflow from a Basin Cold Pool Through a Low Pass. International Conference on Alpine Meteorology. 2003. Available online: https://www.researchgate.net/publication/238094066 (accessed on 20 May 2023).
  10. Aigner, S. Die Temperaturminima im Gstettnerboden bei Lunz am See, Niederösterreich (The minimum temperatures in the Gstettner basin near Lunz, Lower Austria). Wetter Leben 1952, 1, 34–37. [Google Scholar]
  11. Eisenbach, S.; Pospichal, B.; Whiteman, C.D.; Steinacker, R.; Dorninger, M. Classification of cold air pool events in the Gstettneralm, a sinkhole in the Eastern Alps. In International Conference on Alpine Meteorology; MeteoSwiss Publ.: Brig, Switzerland, 2003; Volume 66, pp. 157–160. [Google Scholar]
  12. Sauberer, F.; Dirmhirn, I. Über die Entstehung der extremen Temperaturminima in der Doline Gstettner-Alm. Arch. Meteorol. Geophys. Bioklimatol. Ser. B 1954, 5, 307–326. [Google Scholar] [CrossRef]
  13. Salavec, P. Inverzió és légszennyezés falusi környezetben. Tolmácsi Kisbíró 2012, 11, 2–3. Available online: https://www.tolmacs.hu/salavec12.pdf (accessed on 20 May 2023).
  14. Petkovšek, Z. Turbulent dissipation of cold air lake in a basin. Meteorol. Atmos. Phys. 1992, 47, 237–245. [Google Scholar] [CrossRef]
  15. Rakovec, J.; Merše, J.; Jernej, S.; Paradiž, B. Turbulent dissipation of the cold-air pool in a basin: Observed and simulated. Meteorol. Atmos. Phys. 2002, 79, 195–213. [Google Scholar] [CrossRef]
  16. Whiteman, C.D.; Haiden, T.; Pospichal, B.; Eisenbach, S.; Steinacker, R. Minimum temperatures, diurnal temperature ranges, and temperature inversions in limestone sinkholes of different sizes and shapes. J. Appl. Meteorol. 2004, 43, 1224–1236. [Google Scholar] [CrossRef]
  17. Hart, K.A.; Steenburgh, W.J.; Onton, D.J.; Siffert, A.J. An evaluation of mesoscale-model-based MOS during the 2002 Olympic Winter Games. Weather Forecast. 2004, 19, 200–218. [Google Scholar] [CrossRef]
  18. Lundquist, J.D.; Pepin, N.; Rochford, C. Automated mapping of cold-air pooling regions. J. Geophys. Res. Atmos. 2008, 113, D22107. [Google Scholar] [CrossRef]
  19. Boehner, J.; Antonic, O. Land-surface parameters specific to topo-climatology. In Geomorphometry—Concepts, Software, Applications; Hengl, T., Reuter, H., Eds.; Developments in Soil Science; Elsevier: Amsterdam, The Netherlands, 2009; Volume 33, pp. 195–226. [Google Scholar]
  20. Boehner, J.; Antonic, O. Earth system dynamics. Earth Syst. Dyn. 2015, 6, 1–21. [Google Scholar] [CrossRef]
  21. PIX4Dcloud. Available online: https://cloud.pix4d.com/drive (accessed on 20 May 2023).
  22. Dobos, A. A Légköri Események és a Domborzati Viszonyok Hatása az Inverziós Légrétegződés Kialakulására a Bükk-Fennsíki Mohos-Töbörben. Master’s Thesis, University of Miskolc, Miskolc, Hungary, 2023. Available online: http://midra.uni-miskolc.hu:80/?docId=43397 (accessed on 1 September 2023).
  23. Evans, I.S. An Integrated System of Terrain Analysis and Slope Mapping; Final report on grant DA-ERO-591-73-G0040; University of Durham: Durham, UK, 1979. [Google Scholar]
  24. Schwab, A. Reliefanalytische Verfahren zur Abschätzung nächtlicher Kaltluftbewegungen. In Freiburger Geographische Hefte, 61; Institut für Physische Geographie, Universität Freiburg: Freiburg, Germany, 2000; 212p, Available online: https://www.geographie.uni-freiburg.de/de/publikationen-und-wissenschaftliche-arbeiten/fgh-zusammenfassungen/fgh61 (accessed on 21 September 2025).
  25. Bell, R.C.; Thompson, R.O. Valley ventilation by cross winds. J. Fluid Mech. 1980, 96, 757–767. [Google Scholar] [CrossRef]
  26. Lareau, N.P.; Horel, J.D. Turbulent Erosion of Persistent Cold-Air Pools: Numerical Simulations. J. Atmos. Sci. 2015, 72, 1409–1427. [Google Scholar] [CrossRef]
  27. Soontiens, N.; Stastna, M.; Waite, M.L. Numerical simulations of waves over crater topography. J. Atmos. Sci. 2013, 70, 1216–1232. [Google Scholar] [CrossRef]
  28. Tampieri, F.; Hunt, J.C.R. Two-dimensional stratified flow over valleys. Bound.-Layer Meteorol. 1985, 32, 257–279. [Google Scholar] [CrossRef]
  29. Data from iMETOS 3.3 Meteorologic Station. Available online: https://metos.at/wp-content/uploads/2023/01/iMETOS-33-extended-manual.pdf (accessed on 20 May 2023).
  30. FieldClimate.com (Online Software). Available online: https://www.fieldclimate.com/ (accessed on 20 May 2023).
  31. Data from Termio-1 Temperature Sensor. Available online: https://termoprodukt.co.uk/index.php?route=product/product/download&download_id=9 (accessed on 12 September 2023).
  32. Bátori, Z.; Csiky, J.; Farkas, T.; Vojtkó, A.E.; Erdős, L.; Kovács, D.; Wright, T.; Körmöczi, L.; Vojtkó, A. The conservation value of karst dolines for vascular plants in woodland habitats of Hungary: Refugia and climate change. Int. J. Speleol. 2014, 43, 15–26. [Google Scholar] [CrossRef]
  33. Tarboton, D.G. A new method for flow directions in DEMs. Water Resour. Res. 1997, 33, 309–319. [Google Scholar] [CrossRef]
  34. Travis, M.R.; Elsner, G.H.; Iverson, W.D.; Johnson, C.G. VIEWIT: Computation of Seen Areas, Slope, and Aspect for Land-Use Planning; Gen. Tech. Rep. PSW-11; USDA Forest Service: Washington, DC, USA, 1975; Available online: https://play.google.com/books/reader?id=QIhxNyfyeg0C (accessed on 1 September 2023).
  35. Zevenbergen, L.W.; Thorne, C.R. Quantitative analysis of land surface topography. Earth Surf. Process. Landf. 1987, 12, 47–56. [Google Scholar] [CrossRef]
  36. Hantzschel, J.; Goldberg, V.; Bernhofer, C. GIS-based regionalisation of radiation, temperature and coupling measures in complex terrain. Meteorol. Appl. 2005, 12, 33–42. [Google Scholar] [CrossRef]
  37. Oke, T.R. Boundary Layer Climates; Taylor & Francis: New York, NY, USA, 2000. [Google Scholar] [CrossRef]
  38. SAGA GIS Tool: Wind Exposition Index. Available online: https://saga-gis.sourceforge.io/saga_tool_doc/7.1.1/ta_morphometry_27.html (accessed on 20 May 2023).
  39. Keveiné Bárány, I. Néhány adat a bükki töbrök mikroklímájához. Miskolci Egy. Közleményei, Bányászat 2011, 82, 171–176. Available online: https://matarka.hu/koz/ISSN_1417-5398/82k_2011/ISSN_1417-5398_82k_2011_171-176.pdf (accessed on 20 May 2023).
  40. De Wekker, S.F.J.; Whiteman, C.D. On the time scale of nocturnal boundary layer cooling in valleys and basins and over plains. J. Appl. Meteorol. 2006, 45, 813–820. [Google Scholar] [CrossRef]
  41. Dobos, A.; Dobos, E. Légköri események hatása az inverziós légrétegződésre a Bükk-fennsíki Mohos-töbör eseti példáin keresztül. In Proceedings of the Bányászati, Kohászati és Földtani Konferencia, Reșița/Resicabánya, Romania, April 2023; pp. 70–75. Available online: https://ojs.emt.ro/bkf/article/view/1158/1143 (accessed on 20 May 2023).
  42. OMSZ. Daily Weather Report. Available online: https://www.met.hu/idojaras/aktualis_idojaras/napijelentes/ (accessed on 20 May 2023).
  43. Beltrami, H. On the relationship between ground temperature histories and meteorological records: A report on the Pomquet station. Glob. Planet. Change 2001, 29, 327–348. [Google Scholar] [CrossRef]
  44. Decker, K.L.M.; Wang, D.; Waite, C.; Scherbatskoy, T. Snow removal and ambient air temperature effects on forest soil temperatures in northern Vermont. Soil Sci. Soc. Am. J. 2003, 67, 1234–1242. [Google Scholar] [CrossRef]
  45. Goodrich, L.E. The influence of snow cover on the ground thermal regime. Can. Geotech. J. 1982, 19, 421–432. [Google Scholar] [CrossRef]
  46. Sokratov, S.A.; Barry, R.G. Thermoinsulation effect of snow on soil temperatures. J. Geophys. Res. Atmos. 2002, 107, AAC 1-1–ACL 9-14. [Google Scholar] [CrossRef]
  47. Thorn, C.E.; Schlyter, J.P.L.; Darmody, R.G.; Dixon, J.C. Statistical relationships between air and ground temperatures in Lapland. Permafrost Periglac. Process. 1999, 10, 317–330. [Google Scholar] [CrossRef]
  48. Dobos, A. A lég- és talajhőmérsékleti viszonyok együttváltozásának vizsgálata a hóborítottság és talajfagy mértékének alapján a Bükk-fennsíki Mohos-töbörben. In Proceedings of the Bányászati, Kohászati és Földtani Konferencia, Targu Mures/Marosvásárhely, Romania, April 2024; pp. 57–63. Available online: https://ojs.emt.ro/bkf/article/view/1530 (accessed on 21 September 2025).
  49. OMSZ. Temperature Extremes of Hungary. Available online: https://www.met.hu/eghajlat/magyarorszag_eghajlata/homersekleti_szelsoertekek/Magyarorszag/ (accessed on 27 October 2024).
  50. SAGA GIS Tool: Cold Air Flow Model. Available online: https://saga-gis.sourceforge.io/saga_tool_doc/7.8.0/sim_air_flow_0.html (accessed on 20 May 2023).
  51. SAGA GIS Tool: Diurnal Anisotropic Heat Model. Available online: https://saga-gis.sourceforge.io/saga_tool_doc/7.6.1/ta_morphometry_12.html (accessed on 20 May 2023).
  52. SAGA GIS Tool: Sky-View Factor. Available online: https://saga-gis.sourceforge.io/saga_tool_doc/2.1.4/ta_lighting_3.html (accessed on 20 May 2023).
  53. SAGA GIS Tool: Valley Depth Model. Available online: https://saga-gis.sourceforge.io/saga_tool_doc/7.2.0/ta_channels_7.html (accessed on 26 October 2023).
Figure 1. The DJI Mavic 3 drone’s flight path (left) and the derived point cloud (right) display by PIX4D Discovery [22] used as the base-data of the Digital Surface Model (DSM).
Climate 13 00205 g001
Figure 2. The location of the Mohos sinkhole (MS) and the control points in the Bükk plateau. The topographic surroundings of the Mohos sinkhole and the Zsidó meadow, according to the DEM with a 25 m resolution and the high-resolution surface model’s outline (inside the red dashed line) and the Mohos sinkhole’s topographic outline. The potential cold-air accumulation zones are in the closed depressions of the Bükk plateau, drawn with black outlines. The 860 m outflow line bounds the Zsidó-meadow multi-bottom system (304,033 m2).
Climate 13 00205 g002
Figure 3. (a) High resolution (2.4 cm) orthomosaic (RGB) of the Mohos sinkhole and its environment. (b) Bottom: high resolution (2.4 cm) digital surface model of the Mohos sinkhole and its environment. (c) Classified land cover image of the Mohos sinkhole and its environment. This complex figure shows that the heterogeneity of the study area within the major properties generates a CAP phenomenon.
Climate 13 00205 g003
Figure 4. (Top) The elevation profile of the Mohos sinkhole; (Right) slope map (in degrees) of the Mohos sinkhole and its environment [22]; (Left) valley depth (in meters) of the Mohos sinkhole and its environment. This complex figure shows the favorable slope and surface properties which can support the CAP phenomenon.
Climate 13 00205 g004
Figure 5. Map of the Sky-View Factor of the Mohos sinkhole and its environment, calculated based on the DSM [22]. Values range from 0 to 1 (displayed ≥0.5); higher SVF denotes greater sky openness and enhanced nocturnal radiative cooling. Model settings follow the SAGA GIS Sky-View module; parameter list in Table A2. Thus, the Sky-View Factor is one of the most important index values to define a potential area for CAP development.
Climate 13 00205 g005
Figure 6. Wind Exposition Index (WEI) for the MS and its surroundings from the DSM [22]. WEI < 1 indicates wind-sheltered, WEI > 1 wind-exposed terrain. Computation used 15° angular steps and 30 km search distance (SAGA GIS); see Table A2. Note: the high-resolution DSM domain does not include the encircling ridge that provides additional shelter; regional context is shown in Appendix A Figure A1.
Climate 13 00205 g006
Figure 7. Cold-Air-Flow (CAF) model results for the MS microclimate system, calculated from the DSM. The model defines the near-surface drainage and cold-air-pool zones (under favorable weather conditions). For illustration, the surrounding air temperature was set to ~15–16 °C and cold-air mass to 0 °C; simulation time was 6 h (SAGA GIS) [24]. The major accumulation zone (dashed outline) spans ~55,000 m2 within the 304,033 m2 Zsidó-meadow microclimate system; forested beech stands (e.g., K-9) show limited (~zero) CAP potential.
Climate 13 00205 g007
Figure 8. Daily minimum air temperature during the temporal control measurements (16–22 March 2025) at MS (very high CAP potential) and control points K-2, K-3 (significant CAP potential) K-9 (not significant CAP potential). Sensor types and measurement heights follow Section 2.3; anomalies quantify CAP intensity across the multi-sinkhole system.
Climate 13 00205 g008
Figure 9. Diurnal Anisotropic Heat (DAH) model (from DSM) and thermal imagery documenting daytime CAP positioning. Thermal frame on 12 March 2023 (1.-up); first quantitative frame at 14:50 local time (earlier data unavailable), capturing the sudden re-establishment of the inversion on the shaded side. Thermal frame on 10 November 2024 (2.-down) under very stable anticyclonic conditions, showing all-day CAP persistence. The measured temperature data at point MS in 200 and 40 cm above the surface. The thermal record is adapted from the author’s MSc thesis [22] (2023) and updated with 2024/2025 observations; all panels were reprocessed consistently for the present study.
Climate 13 00205 g009
Figure 10. Meteorological time series at MS (2 m, by station iMETOS 3.3) for a moderately dynamic (but suitable for CAP development) winter period (8–11 February 2023) and an undisturbed summer anticyclone (12–15 August 2025). Winter series show nocturnal CAP formation and layered (turbulent) erosion; summer series illustrate exceptional DTR and frequent frosts at this elevation. Local time: CET; variables and sensor specs in Section 2.3.
Climate 13 00205 g010
Disclaimer/Publisher’s Note: The statements, opinions and data contained in all publications are solely those of the individual author(s) and contributor(s) and not of MDPI and/or the editor(s). MDPI and/or the editor(s) disclaim responsibility for any injury to people or property resulting from any ideas, methods, instructions or products referred to in the content.