Abstract
In this paper, we analyse drought variability in Spain (1950–2024) using the Standardised Precipitation–Evapotranspiration Index (SPEI) at 6-, 12-, and 24-month scales. Using 43 long-record meteorological observatories (AEMET), we compute SPEI from quality-controlled (QC), homogenised series, and derive coherent drought regions via clustering and assess trends in the frequency, duration, and intensity of dry episodes (SPEI ≤ −1.5), including seasonality and statistical significance (p < 0.05). Short-term behaviour (SPEI-6) has become more complex in recent decades, with the emergence of a “Catalonia” type and stronger June–October deficits across the northern interior; Mediterranean coasts show smaller or non-significant changes. Long-term behaviour (SPEI-24) is more structural, with increasing persistence and duration over the north-eastern interior and Andalusia–La Mancha, consistent with multi-year drought. Overall, short and long scales converge on rising drought severity and persistence across interior Spain, supporting multi-scale monitoring and region-specific adaptation in agriculture, water resources, and forest management. Key figures are as follows: at 6 months—frequency 0.09/0.08 per decade (Centre–León/Catalonia), duration 0.59/0.50 months per decade, intensity −0.12 to −0.10 SPEI per decade; at 24 months—frequency 0.5 per decade (Cantabrian/NE interior), duration 0.8/0.7/0.4 months per decade (Andalusia–La Mancha/NE interior/Cabo de Gata–Almería), intensity −0.06 SPEI per decade; Mediterranean changes are smaller or non-significant.
1. Introduction
Drought is the climate risk that has the greatest territorial impact in the world [1]. Very high economic losses are recorded each year in agriculture due to droughts affecting different regions [2]. Furthermore, famines suffered in affected by long-term droughts cause fatalities in areas with food shortages and weak political structures. Very few regions in the world are unaffected by the impacts of drought sequences. Even areas with abundant annual precipitation (ocean climates) are experiencing the consequences of the reduced regularity in rainfall [3]. These consequences are occurring with increasing frequency and intensity in the current context of climate change [4,5,6].
Undoubtedly, drought is the most complex natural risk of all natural hazards on the earth’s surface [7]. This is because its regional or local manifestations differ from one climate region to another and even within a same climate region, depending on the degree and type of human occupation in the affected territory. In addition to the atmospheric mechanisms that give rise to drought sequences, human actions on water resources generated by rainfall (rivers, lakes, aquifers) influence a territory’s risk of drought episodes, as the social component (vulnerability) plays a considerable role in determining the level of drought [8].
Moreover, drought is not a climate risk with identical cause and effect features across a wide geographical space. In mid-latitudes, the causal aspects of a dry sequence can be varied, brought about either due to a greater incidence of subtropical subsidence at higher latitudes or different effects of frontal depressions in a territory, depending on its geographical characteristics (layout of reliefs, upwind, and downwind slopes with respect to the dominant atmospheric flows) [9]. In the current context of climate change, the analysis of the atmospheric circulation belts is more complex due to warming process effects on the position of these areas of atmospheric dynamics. Different studies indicate the polar displacement of the focal point of subtropical subsidence, whereby the mean position of the anticyclones (e.g., Azores) would have gained latitude towards the north [10]. The effect of this is a lower entry of depressions from the west at mid-latitudes, particularly in the southern position of this atmospheric circulation belt [11].
Another relevant aspect is related to the incidence of atmospheric oscillation mechanisms, such as the NAO in the synoptic space of Western Europe and the incidence of the climate warming process in this atmospheric mechanism [12]. Similarly, the ENSO process and the alterations in the atmospheric dynamics on a large scale give rise to positive and negative phases [13].
There are various approaches to the study of droughts. The most widespread are related to the use of drought indicators based on basic climate data (precipitation, temperature, evaporation, etc.). The Standardised Precipitation Index (SPI) is the indicator that has gained the most importance in drought studies and in monitoring the status of SPI drought sequences—hydrological planning—in different countries and world regions [14,15,16].
Other studies have analysed the atmospheric causes of droughts in different regional areas, especially in areas frequently affected by them, to characterise the typical situations that cause episodes of reduced precipitation compared to normal conditions [17,18,19,20].
There is no shortage of approaches that emphasise the different perception of the phenomenon and the territorial, environmental, and economic effects of drought sequences [21,22,23,24,25].
In Spain, many approaches are used to address drought from different perspectives. Some highlight the atmospheric causes and effects on the principal climate elements, particularly rainfall and its recent evolution [26]; others address the human consequences in relation to the difficulties that arise when guaranteeing agricultural and urban demands [27,28,29].
Drought classification studies have also been carried out, based on the analysis of rainfall and its effect on different territories [30,31,32,33]. Olcina conducted an initial typology of drought in Spain after analysing the effects of the dry sequence, with different regional characteristics, occurring in the country between 1989 and 1995 [34]. Thus, three types of droughts were identified in Spain, with different effects on the availability of water resources and the socio-economic impact: Iberian droughts, Cantabrian droughts, and south-eastern droughts, to which the drought sequences occurring in the Canary archipelago were added, which are chronologically similar to the south-eastern droughts [34].
Studies have also been conducted to characterise dry sequences in regional spaces, enabling different types of dry sequences to be obtained [35,36,37]. Other research has analysed the change in the seasonal precipitation patterns in Spain [38,39,40,41,42], highlighting the “Mediterraneanisation” process of the maximum precipitations towards the west of the peninsula (Cordillera Iberica sector) with a main peak in autumn [43]. González-Hidalgo et al. (2023 and 2024) have shown the recent trend in rainfall in the Iberian Peninsula with an increase in autumn and a reduction in spring [44,45,46]. This is particularly important for the planning and management of water resources, given that the volumes of water that can accumulate in spring are fundamental for guaranteeing the demands of the summer season, which increase considerably due to the increase in agricultural and tourist uses and the increase in the real evaporation due to the higher temperature. This trend in the reduction in spring rains is significant in the southern sector of the Cordillera Iberica, where the sources of two important rivers are found (Júcar and Tajo), which serve demand systems (agriculture and urban tourism) that are highly valuable to the Spanish economy [47,48].
Drought has become an important field of study for water planning in Spain [33]. There is uncertainty as to the duration of droughts that have been occurring since the beginning of the current century. Contrary to the long sequences that occurred in the second half of the twentieth century that generated droughts in the Iberian Peninsula (Iberian droughts), with a duration of between three and five years (calendar years), the droughts occurring in the twenty-first century are more intense, but with a shorter duration (one or two calendar years) [30,31,48]. Similarly, the drought sequences display diverse regional manifestations (drought in the north-east of the peninsula, south-eastern droughts, Cantabrian droughts) [34,49], with their own calendars of development and repercussion on the percentage reduction in precipitation recorded with respect to the annual averages.
The occurrence of shorter and more intense droughts would correspond to the changes in the overall atmospheric circulation in mid-latitudes, with an expansion of the Hadley cell towards the pole [10,50]. This generates a greater probability of anticyclonic days each year, with energy readjustment days involving the intrusion of cold air masses into the middle and upper layers of the troposphere, giving rise to unstable configurations (cold drops) and the possibility of occasional intense rain events, which, in general, cannot be used to satisfy agricultural demand [51].
In addition to climate-based studies, there are many others who analyse the hydrological and socio-economic effects of drought situations. Traditionally, the principal instruments used to resolve a drought situation have been reactive and extraordinary emergency measures. That is, infrastructures that increase the supply of water resources and economic compensations for the damage and losses incurred [52]. According to Wilhite, these initiatives form part of the so-called “approach to crisis management” which has proved to be insufficient to mitigate the losses for different reasons: (1) it limits the solutions based on technical aspects, whose design does not incorporate the assessment of alternatives or the participation of groups of interest; (2) it diverts the attention away from fundamental causes. As a decrease in rainfall generates situations of scarcity, the causality of the drought is attributed to the natural phenomenon with no questioning of the way in which the resource is managed and exploited; and (3) it generates a process of depoliticisation, which facilitates the prioritising of technological solutions [53]. In recent years, and within the context of climate change, the “risk management approach” has been defined as an alternative. As indicated by Del Moral et al. (2017), it is necessary to manage droughts more proactively, regarding them as one more component of climate, particularly within the reality of climate change [54]. In relation to this latter aspect, it is predicted that the intensity and periods of drought will increase in the future [55]. In the Mediterranean basin, forecasts indicate not only a rise in average temperatures but also a decrease in precipitation and that there will be changes in rainfall regimes, which adds pressure on the availability of water [56]. The planning and management of water in Spain is being affected by the recorded effects of the current climate change process. The traditional paradigm based on a policy of continuous supply of water no longer applies to the forecasts of reduced flows indicated by the climate and hydrological modelling. The guarantee of water safety, the guiding principle of planning, as indicated by the Climate Change Law of 2021, requires the incorporation of water resources that reduce water management’s dependency on precipitations [51].
This study conducts a climate study of the droughts occurring in the Spanish territory. The principal objective is to define the different types of territorial drought (short-, medium-, and long-term) and their evolution over the most recent periods of reference (1951–1980, 1971–2000, and 1991–2020). Furthermore, a spatiotemporal analysis of the evolution of the SPEI in the area of study and of the extreme drought events that have occurred is proposed, together with the characterisation of the different types of drought and the delimitation of the affected area and how it has changed over the last few decades in relation to the synoptical causes of the different dry sequences in Spain. The study seeks to be of use in hydrological planning as it delimits the areas affected and the registered rainfall effects that call into question the water supply systems in each territory.
2. Materials and Methods
2.1. Monthly Meteorological Series, Quality Control (QC) and Homogenisation Process
We used 43 meteorological observatories from the primary network of AEMET (Spain’s State Meteorological Agency), obtained from the European Climate Assessment and Dataset (ECA&D) database [57] (Figure 1). Stations were selected to span the full analysis period 1950–2024 with ≥80% original (non-missing) observations, enabling rigorous quality control (QC) and subsequent homogenization procedures. The observatories are approximately distributed uniformly across the Iberian Peninsula to represent drought behaviour in Spain’s principal geographic regions. No Balearic Islands stations were included because no series meeting the 1950–2024 requirement are available (Table 1).
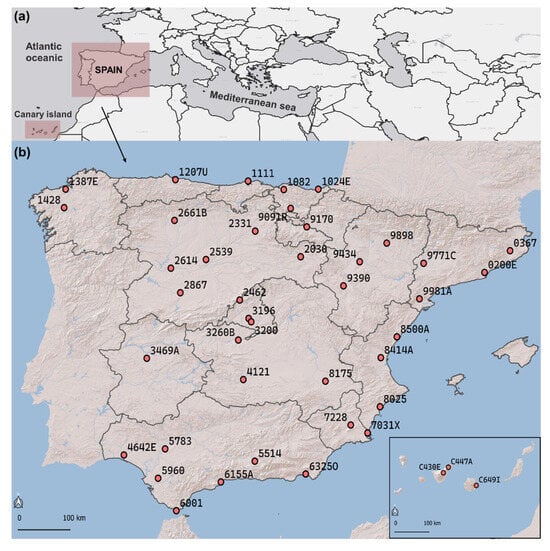
Figure 1.
Meteorological observatories used in the area of study: (a) geographical context of the Iberian Peninsula and Canary Islands (Spain) and (b) codes of the observatories with information in Table 1.

Table 1.
Meteorological observatories analysed.
All 43 meteorological stations underwent an exhaustive, automated quality control (QC) workflow. First, we performed an advanced diagnostic screening with ClimPACT2 (R/GUI), which computes the ET-SCI extreme climate indices endorsed by the WMO and summarises their frequency, duration, and magnitude [58]. In addition to providing diagnostics of extremes, ClimPACT2 applies preliminary QC to each series, flagging duplicates, missing values (NA), outliers, and abrupt shifts/jumps, which we reviewed and corrected where appropriate.
To homogenise and, where necessary, reconstruct series affected by breaks or inhomogeneities, we used the climatol package (v3.1.1) in R [59]. This procedure implements network-based QC, homogeneity adjustment, and gap filling for groups of stations of any climate variable. Breakpoint detection and adjustment follow the Standard Normal Homogeneity Test (SNHT) in the Alexandersson–Moberg formulation [60], after which series are adjusted, and missing data are infilled using reference information from neighbouring stations. The resulting dataset provides quality-controlled and homogenised monthly series for subsequent SPEI calculations and trend analyses. The quality control diagnostics are shown in the Supplementary Materials (Figure S1, Table S1).
2.2. Calculation of the SPEI
The Standardised Precipitation–Evapotranspiration Index (SPEI) measures drought severity by combining intensity and duration and by locating the onset and termination of dry episodes. SPEI extends the SPI framework by incorporating the climatic water balance (Equation (1)), enabling consistent spatiotemporal comparisons across a wide range of climates, as required by recommended properties for drought indices (statistical robustness, transparency, and ease of calculation)
where Pt is monthly precipitation accumulated and PETt is the potential evapotranspiration. The SPEI calculation was performed using the SPEI package for R Studio 1.8.1 [61]. Potential evapotranspiration was estimated using the Hargreaves method, which relies on readily available temperature data and extraterrestrial radiation, making it well suited to long, quality-controlled series with fewer discontinuities than other variables. This choice provides reliable PET estimates across diverse climatic zones while minimising data-availability biases (Equation (2)). This approach is particularly well-suited for our long-term climate series as it relies on readily available and high-quality temperature data, which are less prone to discontinuities than other variables. The Hargreaves method has been shown to provide reliable PET estimates across diverse climatic zones. To standardise the climate water balance (precipitation minus PET) and derive the SPEI, we applied a three-parameter Log-logistic distribution. This distribution was selected because it is widely recognised for its superior performance in fitting a range of water balance series, outperforming other common distributions like the Gamma function, and is particularly effective for multi-scalar drought indices. For each accumulation scale, k (6, 12, 24 months) is obtained by aggregating Dt over rolling k-month windows. To remove seasonality and permit comparability, we fit a three-parameter log-logistic distribution. The cumulative probability F(x) is then mapped to the standard normal space to yield the index (Equation (1)).
where Φ − 1 is the inverse standard normal distribution function. The log-logistic family is widely reported to outperform alternatives for multi-scalar water-balance series and has become standard in SPEI applications.
(Dt = Pt − PETt)
SPEI = Φ − 1(F(x))
A crucial advantage of the SPEI over other widely used drought indices that consider the effect of the PET on drought severity is its multi-scale characteristics, which enable the identification of different types of drought and their impacts in the context of global warming.
The calculation of the SPEI is based on the original procedure of the SPI calculation (using monthly or weekly precipitation as the input data). The SPEI uses the monthly (or weekly) difference between precipitation and the PET. This represents a simple climate water balance that is calculated on different time scales to obtain the SPEI. This study uses different time scales (SPEI-6 and SPEI-24) to analyse the short-, medium-, and long-term droughts. By using these three distinct time scales, we can effectively capture the different stages of drought evolution, from the initial meteorological deficit to the sustained, long-term impact on the regional climate. This multi-scale approach provides a robust and holistic understanding of drought dynamics. The drought severity classes applied in this study follow the categorisation shown in Table 2.
Table 2.
Categorisation of the SPEI.
2.3. Regionalisation and Time Trends
The regionalisation or clusterisation process has been carried out through hierarchical clustering, following the Euclidean distance method, recommendable for this study as it uses homogeneous variables in similar units. Meanwhile, the selection of the number of clusters has been conducted with silhouette analysis in the group using K-means-based clustering. The silhouette method calculates the coefficients of the silhouette of each point that measure how similar a point is to its own group compared to other groups.
The time trends of the SPEI-6, 12, and 24, and their associated characteristics of the number of events, duration, and intensity, have been calculated through non-parametric testing, as the data of the analysis do not follow a normal distribution. The Theil–Sen estimator (T–S) [63,64] has been applied to confirm the existence of trends in the climate series, together with the Mann–Kendall test [65,66], to determine the slope of the regression line or the magnitude of the trend. The latter method enables the detection of the increasing or decreasing trend in the data series and also the estimation of the slope based on the calculation of the mean slope of each pair of values of the whole set of data separately. In the calculations of trend significance, a significance level of 0.05% was used. The R-4.3.2 statistical software was used and the “Rtrend Trend Estimating Tools” library of R Studio [67].
3. Results
3.1. Types of Drought
3.1.1. SPEI-6 or Short-Term Droughts
The 6-month accumulation (SPEI-6) resolves short-term droughts in greater detail. Across the three reference periods (1951–1980, 1971–2000, 1991–2020), the optimal number of clusters changes from seven (1951–1980 and 1971–2000) to eight (1991–2020), reflecting increased spatial complexity at short accumulation as rapid-onset, meteorologically diverse droughts become more frequent. Despite this added complexity, the typology remains geographically coherent and well defined, encompassing the Canary Islands, Cantabrian, Mediterranean–south-east, Atlantic–north-east, Andalusia–La Mancha, Centre–León, and the north-eastern interior, with new category that strengthens the robustness of the regional framework.
Membership is largely stable, with a few notable changes. Albacete and Almería fall within the Mediterranean type in 1971–2000, whereas Albacete links to the north-eastern interior in 1951–1980, and both stations group with Andalusia–La Mancha in 1991–2020. In the last period (1991–2020), Huelva associates with the north-eastern interior cluster (Figure 2).

Figure 2.
Types of meteorological drought in Spain according to reference periods (SPEI-6): (a) 1951–1980, (b) 1971–2000, (c) 1991–2020.
3.1.2. SPEI-24 or Long-Term Droughts
The 24-month accumulation (SPEI-24) emphasises long-term drought persistence and, as expected, yields more spatially homogenised patterns in the earlier periods. In 1951–1980 and 1971–2000, the optimal partition collapses to two principal regions: an eastern half linked to the Mediterranean regime and a western half under Atlantic influence—reflecting the dominance of slow, basin-scale hydroclimatic controls at long accumulation windows.
The Canary Islands alternate affiliations in the first two periods (western archipelago with the Atlantic-western mainland; eastern archipelago with the Mediterranean type). By 1991–2020, the partition becomes more articulated, with six distinct regions. In this latter period, Almería groups with the Canary Islands (which re-emerge as their own type), and a broad western-linked region consolidates, encompassing Galicia, the Northern Plateau, Huesca, central Iberia, Cáceres, and Huelva (Figure 3).
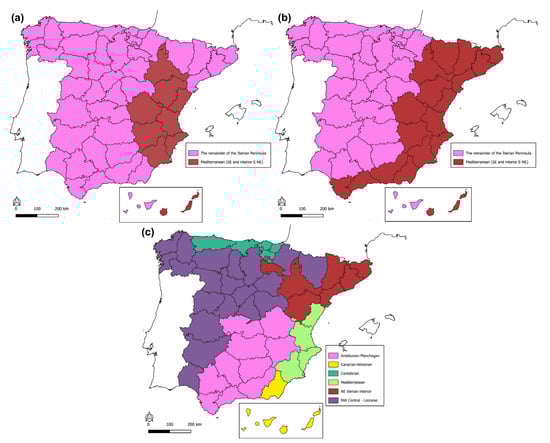
Figure 3.
Types of meteorological drought in Spain according to reference periods (SPEI-24): (a) 1951–1980, (b) 1971–2000, (c) 1991–2020.
3.2. Spatial and Time Variations in the Different Types of Drought (1950–2024)
This section analyses the space–time variation, or changes in the SPEI-6 and SPEI-24, to determine the differences between short- and long-term droughts. In the first case, the results are analysed on a monthly scale due to their greater heterogeneity, while for the SPEI-24, a seasonal scale is used due to a greater homogeneity in the monthly results, in which very few differences are observed.
3.2.1. SPEI-6 (Short-Term Droughts)
The results of space–time changes in the SPEI-6 index show appreciable monthly and seasonal differences in the area of study as a whole. The time trends of the intensity of the index are analysed, together with the evolution of the number of months per year when the drought intensity is equal to or lower than −1.5 (extreme drought), with the objective of quantifying the variation in the number of months experiencing the most severe droughts.
Table 3 shows the time trend of the number of extreme drought events (<−1.5) and their duration and intensity for the different types of droughts. The statistically significant increase stands out for the whole of the area of study, with particular incidence in the Centre–León type (0.09 events/decade) and the Catalonia type (0.08 events/decade), although, in general, the greatest increases are located in the northern half of the peninsula. Meanwhile, the Mediterranean type displays the lowest increases (0.03 events/decade). With respect to the duration of the event, an increase in the number of months in all of the regions analysed is observed, particularly in the Catalonia type (0.59 months/decade) and the Centre–León type (0.50 months/decade). Again, the Mediterranean and Andalusia–La Mancha regions exhibit the lowest increases (0.23 and 0.21 months/decade, respectively).
Table 3.
Summary of the time trend of the number of extreme drought events (<−1.5) and their duration and intensity according to the different drought type regions. The figures in bold are statistically significant with a confidence interval of 0.05.
Finally, the intensity of the events has increased, with a decrease in the SPEI-6 to increasingly negative values, particularly the Centre-León type (−0.12/decade), followed by the NE inland part of the peninsula and the Catalonia type with −0.10/decade. The Mediterranean region stands out as being the geographical area where the intensity of extreme droughts has increased the least (−0.03/decade).
By month, June and October stand out with the greatest spatial distribution of trends at around −0.2/decade, particularly in the north of the peninsula. In the northern regions, the decrease in the SPEI-6 is around −0.2/decade between the months of June and September and until December in the Catalonia drought type region. Meanwhile, in the Cantabria region, the greatest decreases can be found between September and October (autumn) with −0.2/decade, in the Canary Islands, particularly in winter (December and January with −0.2/decade), and in the Andalusian–Manchegan region between June and August (−0.2/decade). The Mediterranean region records the largest decreases (−0.1/decade) between October and December (Figure 4). Detailed monthly values are provided in the Supplementary Materials (Tables S2–S3).

Figure 4.
Monthly time trend of the intensity of SPEI-6 (1950–2024): (a) January, (b) February, (c) March, (d) April, (e) May, (f) June, (g) July, (h) August, (i) September, (j) October, (k) November, (l) December.
With regard to the monthly scale, the greatest increases are recorded between June and September, particularly September, with increases of up to 0.06 months/decade in observatories in the west of the peninsula such as Salamanca (Ae.) or Huelva, in August with the same time trend in the observatories of Tortosa or Cáceres, or finally, in June in Barcelona (Obs. Fabra) or Seville (Figure 5).
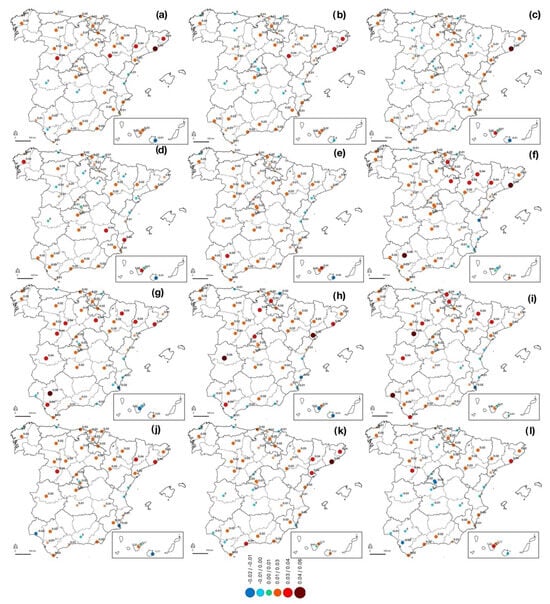
Figure 5.
Monthly time trend of the number of months per year with an intensity equal to or lower than −1.5 (extreme drought) in accordance with the SPEI-6 (1950–2024): (a) January, (b) February, (c) March, (d) April, (e) May, (f) June, (g) July, (h) August, (i) September, (j) October, (k) November, (l) December.
The time evolution of short-term droughts during the period of analysis (1950–2024) reflects a global trend shifting towards increasingly intense droughts, although subject to cycles with a dynamic shifting towards a more negative SPEI-6. Figure 6 and Figure 7 show the evolution of the SPEI for the different types of droughts, first through monthly diagrams and second, through the annual evolution with a smoothed low-pass filter. Although the trend towards an intensification of short-term droughts is more difficult to see in Figure 8, it clearly reflects the greater predominance of severe and extreme droughts over the last few decades and a higher representation of wet periods during the first decades of the study. This is observed more clearly in those regions where droughts have intensified the most: (e) Andalusia–La Mancha, (f) Centre–León, (g) NE inland part of the peninsula, and (h) Catalonia.

Figure 6.
Annual diagram with drought type/wet period according to the SPEI-6 for the different regions analysed (1951–2024): (a) Cantabria, (b) Canary Islands, (c) Galicia, (d) Mediterranean, (e) Andalusia–La Mancha, (f) Centre–León, (g) NE inland part of the peninsula, and (h) Catalonia.

Figure 7.
Time evolution of the intensity of the SPEI-6 in the different drought types (1952–2024), with a smoothed low pass filter (moving average of 12 months): (a) Cantabria, (b) Canary Islands, (c) Galicia, (d) Mediterranean, (e) Andalusia–La Mancha, (f) Centre–León, (g) inland NE part of the peninsula, and (h) Catalonia.

Figure 8.
Time evolution of the number of months per year with extreme drought (<−1.5) according to the SPEI-6 in the different drought types (1952–2024), with a smoothed low pass filter (moving average of 12 months): (a) Cantabria, (b) Canary Islands, (c) Galicia, (d) Mediterranean, (e) Andalusia–La Mancha, (f) Centre–León, (g) NE inland part of the peninsula, and (h) Catalonia.
Meanwhile, Figure 8 shows clear downward trends in the majority of the regions analysed, particularly: (e) Andalusia–La Mancha, (f) Centre–León, (g) NE inland part of the peninsula, and h) Catalonia. In this regard, particularly noteworthy is the extraordinary decrease in the Andalusia–La Mancha type in recent years, where the lowest average SPEI-6 of all the regions analysed was recorded. This is followed closely by the Catalonia drought type, also with a strong decrease in recent years, and the Centre–León region. Together with the inland NE part of the peninsula, these are the geographical areas with the most intense droughts in recent years. We should also highlight the Galician type, where after a considerable decrease over the last two decades, a slight increase has taken place in recent years. The only two regions that have not recorded large changes in recent decades and years are Cantabria (even with an upturn) and the Mediterranean, which, although subject to cycles, has not experienced any appreciable change.
Finally, the annual time analysis in Figure 8 shows the evolution of the number of months with extreme drought for the different types of droughts. The most noteworthy case refers to the Catalonia type, with a very significant increase in recent years. A similar situation has occurred in the Mediterranean, Andalusia–La Mancha, and Centre–León with large increases in recent years. However, the Cantabria and Canary regions do not show significant trends, while Galicia exhibits a large increase during the 2000s and 2010s, but in recent years has stabilised or even decreased.
3.2.2. SPEI-24 (Long-Term Droughts)
The results of the analysis of the SPEI-24 or long-term droughts are highly interesting, particularly on a seasonal scale, as on a monthly scale the time trends are very similar to the year-long trends.
Table 4 shows the variations in the long-term extreme drought events and their duration and intensity over the last few decades. It reveals a greater homogeneity in the results between the different types of droughts analysed, particularly the increase in Cantabria and the NE of the peninsula (0.5 events/decade). All of the results show statistically significant trends, except for the Mediterranean region (0.2 events/decade). The differences with respect to the previous analysis of the SPEI-6 are important, with the Cantabrian type of drought being one of the most affected, while in the SPEI-6 it was one of the lowest in of the regions analysed.
Table 4.
Summary of the time trend of the number of extreme drought events (<−1.5) and their duration and intensity according to the different drought type regions. The figures in bold are statistically significant with a confidence interval of 0.05.
With respect to duration, some results are truly remarkable. The increase in the number of months of extreme drought in the Andalusia–La Mancha region stands out (0.8 months/decade) as does that of the NE of the peninsula (0.7 months/decade), while the Mediterranean type and Canary Islands–Almería type record increases but more moderately (0.3 and 0.4 months/decade). Finally, the intensity also increases significantly towards increasingly more extreme events, particularly Cantabria and the NE of the peninsula with decreases in −0−.06/decade. The rest of the regions record statistically significant decreases (−0.05/decade) except for the Mediterranean peninsula region with −0.03/decade.
From a monthly and seasonal point of view, the greatest deceases of the SPEI-24 and, therefore, the most intense droughts, are distributed homogeneously throughout the whole year. Depending on the type of droughts, the seasons acquire a greater or lesser relevance. Therefore, observing the largest annual and seasonal decreases, the NE of the peninsula type particularly stands out (−0.3/decade, followed by the Canary Islands–Almería, Andalusia–La Mancha, and North-Central–Leónese (−0.2/decade) (Figure 9). Meanwhile, Cantabria and the Mediterranean do not exhibit statistically significant trends, and the latter shows no trend at all in the last few decades (0.0/decade). Detailed monthly and seasonal results are available in the Supplementary Materials (Tables S4–S5).

Figure 9.
Time–seasonal trend in the intensity of the SPEI-24 (1950–2024): (a) winter, (b) spring, (c) summer, and (d) autumn.
Figure 10 reveals some interesting details. Practically all of the 43 meteorological observatories analysed display statistically significant decreases of between −0.2 and −0.3/decade, with Huesca, Daroca, Salamanca, and Valladolid being the most relevant as they are the only places recording a slight decrease of −0.3/decade. Therefore, a greater intensification of droughts has been recorded in these points over the last few decades. However, there are also isolated cases with very different dynamics, such as the observatories in the Gulf of Valencia (Castellón and Valencia), which show trends between 0.0 and 0.1/decade, or certain Cantabrian observatories such as San Sebastián (Igueldo) or Gijón, also with trends between 0.0 and 0.1/decade.

Figure 10.
Monthly time trend of the number of months per year with an intensity equal to or lower than −1.5 (extreme drought) in accordance with the SPEI-24 (1950–2024): (a) winter, (b) spring, (c) summer, and (d) autumn.
The evolution over the last few decades of the months with the most extreme SPEI-24 indices reflects a substantial increase, particularly in the observatories located in the northern half of the peninsula. Although it is true that there are no substantial monthly and seasonal differences, the NE of the peninsula is noteworthy, where several of its observatories (such as Girona or Lleida) record an increase in more than 0.14 months (decade) (Figure 10). Meanwhile, the most modest increases are found in Cantabria, Canary Islands, and the Mediterranean regions. Some observatories, such as that of San Sebastián (Igueldo), even record slight decreases in the number of months. Other observatories, such as the Mediterranean coasts (Castellón, Valencia or San Javier), also record slight decreases that are not statistically significant (−0.06 to −0.02 months/decade). Station-level monthly values are provided in the Supplementary Materials (Tables S6–S7).
Figure 11 and Figure 12 show the annual time evolution of the SPEI-24 in the different regions studied, highlighting the notable increase in their intensity in some types analysed. Furthermore, Figure 11 shows the diagrams with the monthly evolution in the period 1951–2024, with the Centre–north León and NE of the peninsula particularly standing out, where in recent years, a persistent extreme drought has prevailed. Moreover, in the majority of the regions analysed, there is a clear predominance of wet periods in the first half of the period and vice versa. The major drought period recorded in the Andalusia–La Mancha drought-type region between the years 1994 and 2002 is also noteworthy.

Figure 11.
Annual diagram with drought type/wet period according to the SPEI-24 for the different regions analysed (1951–2024): (a) cantabrian, (b) canarian, (c) mediterranean, (d) Andalusian–manchegean, € centre-north-leon (e) NW Central–Leónese, and (f) NE Iberian interior.

Figure 12.
Time evolution of the SPEI-24 in the different drought types (1952–2024), with a smoothed low pass filter (moving average of 12 months): (a) Cantabria, (b) Andalusia–La Mancha, (c) Canary Islands, (d) Centre–north León, (e) Mediterranean, (f) NE of the peninsula.
Meanwhile, Figure 12 shows the annual evolution of the SPEI-24 in the different regions analysed. The drought type of the NE of the peninsula is noteworthy as it accumulates a greater and more constant progression towards increasingly negative indices from the end of the 1970s, with an average value of around −0.8 in recent years. The decrease is most prominent during the last few decades. The Centre–north León region has also been recording highly significant decreases in recent decades. Specifically, from the end of the 1970s to the present day and, except for a small upturn in the mid-2000s, the decrease in the SPEI-24 has been constant and considerable, with values of around −0.8 in recent years. Another example of the intensification of long-term droughts is found in the Andalusia–La Mancha type, although the decrease experienced in recent years is noteworthy, with a drop in average values of between −0.4 and −1.0. After a period from the beginning of the 1990s to the end of the 2010s, with a gradual decrease but not very significant, the intensification over the last few years has been very acute.
However, the other three regions have experienced a very different evolution. First, Cantabria is characterised by a strong decrease in the SPEI-24 from the mid-1970s to the 2000s, although over the last few years there has been a gradual increase that has grown from averages of −0.7 in the 2000s to 0.0 in the present day.
The Canary Island drought type has experienced an overall decrease in recent decades, with positive values until the beginning of the 1980s and from then until the present day with a decrease in the SPEI-24, except for an upturn in the 2010s. Currently, a notable decrease is being recorded once again, with values of −0.6. Finally, the Mediterranean type exhibits the last variations in recent decades, although an alternation of wet–dry cycles can be appreciated, subject to a slight overall decrease in the SPEI-24. Figure 12e shows a principal wet cycle in the 1970s and 1980s and the most important drought of the 2000s. In recent years, there have been no statistically significant variations, although a slight decreasing trend can be observed with average values of −0.2 in recent years.
Figure 13 is perhaps one of the most interesting in this study, as it reflects the space–time evolution of the average annual intensity of the SPEI-24 in the 43 meteorological observatories analysed from 1952 to 2024. Annual extreme droughts are represented in brown, while severe droughts are in red. In this way, we can rapidly identify where the most important droughts are concentrated in each year. The first noteworthy aspect is the predominance of dark and intermediate blue tones in the majority of the observatories in three principal periods, 1960–1963, 1969–1973, and 1977–1980. Meanwhile, a clear change in trend may be observed from the beginning of the 1980s, specifically from 1981, when negative average SPEI-24 values began to predominate in the majority of the Iberian Peninsula, particularly in certain periods: 1991–1996, 2000–2002, 2005–2007, 2012–2014, and finally the last years of the analysis (2016–2024), with a clear major role of droughts in the majority of the peninsula territory. The years 2023 and 2024 are noteworthy, with a higher concentration of observatories with extreme drought, particularly in the northern inland strip, the NE of the peninsula, and the south and south-east of the peninsula.

Figure 13.
Space–time evolution of the annual average intensity of the SPEI-24 in the observatories analysed.
Figure 14 shows the annual evolution of the number of months per year with extreme drought (<−1.5) in each of the regions analysed according to the SPEI-24 index. The case of the NE of the peninsula stands out with a highly significant and sudden increase from the beginning of the 1990s to the present day. In recent years, the rise has been so drastic that averages of 3.0 months per year of extreme drought have been recorded. Although to a lesser extent, the graphs of the Andalusia–La Mancha and Centre–north León drought type regions have recorded overall upward trends in recent years, the latter exhibits a more homogeneous regressive line from the 1980s to the present day. Meanwhile, the Andalusia–La Mancha region records a first peak in the 2000s and a second in recent years, with an average of 2.0 months per year of extreme drought being reached.

Figure 14.
Time evolution of the number of months per year with extreme drought (<−1.5) according to the SPEI-24 in the different drought types (1952–2024), with a smoothed low pass filter (moving average of 12 months): (a) Cantabria; (b) Andalusia–La Mancha, (c) Canary Islands, (d) Centre–north León, (e) Mediterranean, (f) NE of the peninsula.
Figure 15 shows the evolution of the SPEI-24 for six examples of the different types of droughts analysed. This time, we can appreciate in greater detail the evolution of the index of the last few years on a monthly scale.

Figure 15.
Composition of the evolution of the SPEI-24 for some examples of the different types of droughts: (a) Cantabria, (b) Andalusia–La Mancha, (c) Canary Islands, (d) Centre–north León, (e) Mediterranean, (f) NE of the peninsula. A 48-month moving trend line is the bold black line. Linear trend is the dashed black line.
The Cantabria, Canary Island, and Mediterranean types record a more complex and less defined evolution than those previously analysed. Cantabria has remained stable in recent years, recording a maximum peak in the 1990s. The Canary Island type exhibits an insignificant linear trend, with maximums in the 1980s and 1990s and current averages of around 1.5 months of extreme drought per year. Finally, the Mediterranean region registered a more noteworthy peak during the 2000s with an average of almost 2.5 months of extreme drought per year, while it decreased substantially in the 2010s. Currently, although it is rising, it is not excessively pronounced, standing at around 1.0 months per year.
As a synthesis of drought analysis in Spain, it is clear that one cannot speak of a single type of drought, and the effects of these atmospheric events differ significantly across the affected territories (Figure 16). The accompanying figure summarises the different drought typologies that occur in Spain, considering their typical atmospheric causes and affected regions. It is important to note that this figure indicates broad regional groupings, within which finer sub-regional distinctions can be made. This is the case for Cantabrian droughts, which have different impacts in the western and eastern parts of the northern Iberian façade. Similarly, within the Mediterranean region, the behaviour of droughts developing in the north-east (Catalonia), the central area (Jucar basin and Balearic Islands), and the south-east peninsula (Segura basin) differs. The latter shares characteristics with Iberian droughts, with its effects exacerbated by its geographical location, which incorporates leeward effects from the general westerly circulation. All of these factors contribute to an arid condition that limits conventional water resources.

Figure 16.
Drought typologies in Spain and typical atmospheric situations that generates them. Authors’ own graphics.
The comparative assessment of trend extremes derived from the SPEI-6 and SPEI-24 indices reveals distinct temporal and regional patterns. In the short term (SPEI-6), significant positive trends are observed in drought duration, particularly over the Central–Leónese (0.50 m/dec) and Andalusian–Manchegan (0.21 m/dec) domains, while intensity exhibits weak negative tendencies in the Central–Leónese (−0.12 SPEI/dec). Extremes and intensity months also display localised increases, with notable signals in Catalonia (0.3 and −0.2 SPEI/dec, respectively). In contrast, long-term conditions (SPEI-24) highlight the Andalusian–Manchegan (0.82 m/dec) and Mediterranean (0.31 m/dec) regions as hotspots of increasing drought duration, accompanied by positive extremes in the Cantabrian (0.05) and north-eastern Iberian interior (0.5). Intensity trends remain modest, with slight declines in the Cantabrian (−0.06 SPEI/dec) and Mediterranean (−0.03 SPEI/dec) (Table 5). Seasonal analyses further indicate widespread declines across the northern half of the peninsula in the short term, shifting towards more homogeneous reductions in the long term, particularly over the north-eastern interior (−0.3/dec). Together, these results emphasise the contrasting behaviour of short- and long-term drought processes, with regional heterogeneity evident across both timescales (Table 5).
Table 5.
Comparative summary of trend extremes for the SPEI-6 and SPEI-24 indices.
4. Discussion
Drought is a pervasive and complex natural hazard with profound consequences for water management, particularly in regions with limited rainfall. Drought has become a climate risk with significant human repercussions on the earth’s surface, to the extent that it has become an element of territorial dispute with respect to the availability of water resources on regional and local levels [25] (Figure 17).

Figure 17.
Main approaches to the study of droughts: the importance of regional typologies. Own elaboration.
Projections indicate increases in drought frequency and intensity under climate change, underscoring the need for efficient monitoring and planning [68]. Recent evidence points to a broadening global drought footprint—~74% expansion in the last five years relative to 1981–2017—largely linked to rising atmospheric evaporative demand (AED), even where mean annual precipitation has changed little [4]. From a risk perspective, Spain consistently ranks high at the global scale [69], with particularly elevated agricultural drought risk over central–eastern Iberia [70]. The European Risk Atlas likewise anticipates substantial increases in short-accumulation drought (e.g., SPEI-3) across southern Europe, with Spain among the most affected under +2 to +3 °C warming, implying two- to three-fold relative losses in the Mediterranean region at +3 °C [71]. Complementary metrics (e.g., DSS) also highlight intense, short events over southern Iberia [72].
For the Iberian Peninsula, multiple studies converge on enhanced drought severity and persistence in interior regions. The Ebro Basin stands out for longer and more intense events, coincident with ~10% precipitation declines, while Mediterranean areas show increases in severity/frequency but with greater spatial heterogeneity [73]. At the European scale, drought intensification has contributed to agricultural impacts in Spain, degraded water quality and wetlands, increased fire risk, and heightened water-management conflicts, consistent with strengthened long-term deficits over much of the Peninsula [74]. Drought indices remain essential tools to quantify severity and change [75]. Composite approaches (e.g., CDI using precipitation, soil moisture, NDVI) underscore the need to represent soil moisture explicitly [62,76] and basin-scale comparisons suggest index choice should reflect system size and management properties [77]. Spatially, the probability of extreme drought is higher over south and central Spain, with recent significant increases in NE Spain [78]. Operationally, more than half of Spanish basins have reached severe stress in recent years, and scenario analyses project precipitation −14%, PET +10% and comparable declines in runoff and aquifer recharge under RCP 8.5 (2040–2070), highlighting substantial adaptation challenges [79].
Our results fit—and refine—this picture. Using SPEI-6/12/24, we find increasing severity and persistence across interior Spain, particularly the north-eastern interior, while Mediterranean coastal changes are smaller or non-significant. The short-term (SPEI-6) signal accentuates June–October deficits and reveals a new “Catalonia” type in 1991–2020, whereas SPEI-24 captures structural, multi-year persistence over the NE interior and Andalusia–La Mancha. These spatial contrasts are consistent with enhanced AED and with large-scale circulation patterns (AO/NAO, SSWI2, WeMO), known to modulate Iberian hydroclimate [31], and—with appropriate caution—also with greater meridionality and blocking over Western Europe, which can sustain persistent deficits [35].
Implications are clear, listed as the following: (i) adopt multi-scale monitoring (6–24 months) to separate seasonal dryness from structural persistence; (ii) prioritise interior basins (e.g., Ebro and adjacent NE interior; Andalusia–La Mancha) for drought-ready allocation rules, groundwater safeguards, and fire-risk integration; (iii) maintain coastal Mediterranean vigilance where changes are emerging but less robust. Limitations include the station-based nature of the dataset (43 observatories), PET estimation (Hargreaves), and parametric standardisation (log-logistic); future work should integrate soil-moisture and ET observations, land-surface–atmosphere coupling, and teleconnection-aware attribution at higher spatial resolution.
5. Conclusions
Using SPEI-6/24 to represent short-, medium-, and long-term droughts, we identify an increase in the typological complexity of drought across Spain in the recent reference period (1991–2020). Regionalization evolves from fewer, broader types to more articulated partitions: SPEI-12 rises to an optimum ≈8 regions (vs. ~3–4 in earlier periods) and SPEI-24 to 6 regions, with the emergence of a new Catalonia-type in the short-term structure.
At 6 months (SPEI-6), changes are strongest over the northern interior. The frequency of extreme dry months (SPEI ≤ −1.5) increases by +0.09 events/decade in Centre–León and +0.08 in Catalonia; duration rises by +0.59 and +0.50 months/decade (Catalonia, Centre–León), and intensity becomes more negative (−0.12 in Centre–León; −0.10 in the NE interior and Catalonia). Seasonally, deficits intensify from June to October (−0.2/decade) across the northern half. The number of extreme-drought months per year increases most in Catalonia (+0.3 months/decade), followed by Andalusia–La Mancha, Centre–León, and the NE interior (+0.2).
At 24 months (SPEI-24), the signal is structural and persistent. Event frequency grows by +0.5 events/decade in the Cantabrian and NE interior regions, while the Mediterranean shows a smaller, non-significant trend (+0.2). Duration increases by +0.8 (Andalusia–La Mancha) and +0.7 months/decade (NE interior). Intensity weakens by about −0.06 SPEI/decade in the Cantabrian and NE interior. Station-level declines are largest at Huesca, Daroca, Salamanca, and Valladolid (−0.2 to −0.3/decade). Overall, SPEI-24 indicates a marked strengthening of long-term drought across the northern half of the Peninsula, with more modest increases in the Canary Islands and parts of the Mediterranean. Since the early 1990s, the NE interior has experienced a sharp rise in extremes, reaching ~3 extreme-drought months per year in recent years, and stands as the most affected region. At 6 months, recent decades show finer regionalization (including the emergence of a “Catalonia” type) and increases in the frequency and duration of dry episodes across much of the northern interior, whereas the Mediterranean littoral exhibits weaker or non-significant changes. At 24 months, the signal is more structural: persistence and duration intensify notably in the north-eastern interior and Andalusia–La Mancha, with broadly negative intensities and a more homogeneous seasonal imprint, consistent with multi-year drought processes. Taken together, both scales converge in a picture of increasing drought severity and persistence over large interior regions, with comparatively smaller changes along the Mediterranean coast. This synthesis supports a multi-scale monitoring approach and targeted adaptation planning (agriculture, water resources, and forest management) that reflects the distinct risk profiles at 6- and 24-month horizons.
Supplementary Materials
The following supporting information can be downloaded at: https://www.mdpi.com/article/10.3390/cli13100202/s1, Figure S1: Example of a rupture or inhomogeneity in the Huelva series; Table S1: Number of ruptures or inhomogeneities and outliers; Tables S2–S7: Monthly and seasonal trends of SPEI-6 and SPEI-24 for drought type regions and observatories.
Author Contributions
Conceptualization, D.E.S. and J.O.C.; methodology, D.E.S.; software, D.E.S.; validation, D.E.S.; formal analysis, J.O.C.; investigation, J.O.C.; data curation, D.E.S.; writing—original draft preparation, D.E.S.; writing—review and editing, J.O.C.; visualization, D.E.S. All authors have read and agreed to the published version of the manuscript.
Funding
This research received no external funding.
Data Availability Statement
The data presented in this study are available on request from the corresponding author.
Conflicts of Interest
The authors declare no conflict of interest.
Abbreviations
The following abbreviations are used in this manuscript:
| SPEI | Standardized Precipitation Evapotranspiration Index |
| ECA | European Climate Assessment |
| ET | Evapotranspiration |
| LDPET | Potential Evapotranspiration |
References
- UNCCD. Global Drought Snapshot; United Nations: New York, NY, USA, 2023; Available online: https://www.unccd.int/sites/default/files/2023-12/Global%20drought%20snapshot%202023.pdf (accessed on 8 September 2025).
- Freedman, H.; AghaKouchak, A.; Rigden, A.J. Disparities in the impact of drought on agriculture across countries. Sci. Rep. 2025, 15, 13465. [Google Scholar] [CrossRef]
- Li, Q.; Ye, A.; Wada, Y.; Zhang, Y.; Zhou, J. Climate change leads to an expansion of global drought-sensitive area. J. Hydrol. 2024, 632, 130874. [Google Scholar] [CrossRef]
- Gebrechorkos, S.H.; Sheffield, J.; Vicente-Serrano, S.M. Warming accelerates global drought severity. Nature 2025, 642, 628–635. [Google Scholar] [CrossRef] [PubMed]
- Vicente-Serrano, S.M.; Peña-Angulo, D.; Beguería, S.; Domínguez-Castro, F.; Tomás-Burguera, M.; Noguera, I.; Gimeno-Sotelo, L.; El Kenawy, A. Global drought trends future projections. Phil. Trans. R. Soc. Math. Phys. Eng. Sci. 2022, 380, 20210285. [Google Scholar] [CrossRef] [PubMed]
- Chiang, F.; Mazdiyasni, O.; AghaKouchak, A. Evidence of anthropogenic impacts on global drought frequency, duration, and intensity. Nat. Commun. 2021, 12, 2754. [Google Scholar] [CrossRef]
- Alkhalidi, A.; Assaf, M.N.; Alkaylani, H.; Halaweh, G.; Salcedo, F.P. Integrated innovative technique to assess priorities risks associated with drought: Impacts measures/strategies actions global study. Int. J. Disaster Risk Reduct. 2023, 94, 103800. [Google Scholar] [CrossRef]
- Wens, M.; Johnson, J.M.; Zagaria, C.; Veldkamp, T.I.E. Integrating human behavior dynamics into drought risk assessment: A sociohydrologic, agent-based approach. Water 2019, 6, e1345. [Google Scholar] [CrossRef]
- Kchouk, S.; Melsen, L.A.; Walker, D.W.; van Oel, P.R. A geography of drought indices: Mismatch between indicators of drought and its impacts on water and food securities. Nat. Hazards Earth Syst. Sci. 2022, 22, 323–344. [Google Scholar] [CrossRef]
- Cresswell, C.; Ummenhofer, C.C.; Thatcher, D.L.; Wanamaker, A.D.; Denniston, R.F.; Asmerom, Y.; Polyak, V.J. Twenthieth Century Azores High expansion unprecedented in the last 1200 years. Nat. Geosci. 2022, 15, 548–553. [Google Scholar] [CrossRef]
- Garrido-Perez, J.M.; Vicente-Serrano, S.M.; Barriopedro, D.; García-Herrera, R.; Trigo, R.; Beguería, S. Examining the outstanding Euro-Mediterranean drought of 2021–2022 and its historical context. J. Hydrol. 2024, 630, 130653. [Google Scholar] [CrossRef]
- Outten, S.; Davy, R. Changes in the North Atlantic Oscillation over the 20th century. Weather. Clim. Dyn. 2024, 5, 753–762. [Google Scholar] [CrossRef]
- Singh, J.; Ashfaq, M.; Skinner, C.B. Enhanced risk of concurrent regional droughts with increased ENSO variability and warming. Nat. Clim. Chang. 2022, 12, e1345. [Google Scholar] [CrossRef]
- Sabzevari, Y.; Eslamian, S.; Pamula, A.S.P.; Bazrkar, M.H. Drought Trend Analysis Using Standardized Precipitation Evapotranspiration Index in Cold-Climate Regions. Atmosphere 2025, 16, 482. [Google Scholar] [CrossRef]
- Tomas-Burguera, M.; Vicente-Serrano, S.M.; Peña-Angulo, D.; Domínguez-Castro, F.; Noguera, I.; El Kenawy, A. Global characterization of the varying responses of the Standardized Precipitation Evapotranspiration Index to atmospheric evaporative demand. J. Geophys. Res. Atmos. 2020, 125, e2020JD033017. [Google Scholar] [CrossRef]
- Beguería, S.; Vicente-Serrano, S.M.; Reig, F.; Latorre, B. Standardized Precipitation Evapotranspiration Index (SPEI) revisited: Parameter fitting, evapotranspiration models, tools, datasets and drought monitoring. Int. J. Climatol. 2014, 34, 3001–3023. [Google Scholar] [CrossRef]
- Holgate, C.M.; Falster, G.M.; Gillett, Z.E.; Goswami, P.; Grant, M.O.; Hobeichi, S.; Hoffmann, D.; Jiang, X.; Jin, C.; Lu, X.; et al. Physical mechanisms of meteorological drought development, intensification and termination: An Australian review. Commun. Earth Environ. 2025, 6, 220. [Google Scholar] [CrossRef]
- Di Paola, A.; Di Giuseppe, E.; Magno, R.; Quaresima, S.; Rocchi, L.; Rapisardi, E.; Pavan, V.; Tornatore, F.; Leoni, P.; Pasqui, M. Building a framework for a synoptic overview of drought. Sci. Total Environ. 2025, 958, 177949. [Google Scholar] [CrossRef]
- Kirk, J.; Sheridan, S.; Schmidlin, T. Synoptic climatology of the early 21st century drought in the Colorado River Basin and relationships to reservoir water levels. Int. J. Climatol. 2016, 37, 2424–2437. [Google Scholar] [CrossRef]
- Parry, S.; Hannaford, J.; Lloyd-Hughes, B.; Christel Prudhomme, C. Multi-year droughts in Europe: Analysis of development and causes. Hydrol. Res. 2012, 43, 689–706. [Google Scholar] [CrossRef]
- OECD. Global Drought Outlook: Trends, Impacts and Policies to Adapt to a Drier World; OECD Publishing: Paris, France, 2025. [Google Scholar] [CrossRef]
- Motta, C.; Naumann, G.; Gomez, D.; Formetta, G.; Feyen, L. Assessing the eco-nomic impact of droughts in Europe in a changing climate: A multi-sectoral analysis at regional scale. J. Hydrol. Reg. Stud. 2025, 59, 102296. [Google Scholar] [CrossRef]
- Buras, A.; Rammig, A.; Zang, C.S. Quantifying impacts of the 2018 drought on European ecosystems in comparison to 2003. Biogeosciences 2020, 17, 1655–1672. [Google Scholar] [CrossRef]
- Edwards, B.; Gray, M.; Hunter, D. The social and economic impact of drought. CSRM Work. Pap. 2018, 5, 18. [Google Scholar] [CrossRef]
- Suleymanov, F. A review of the multifaceted relationship between drought dynamics and conflicts. Hydrol. Process. 2024, 38, e15262. [Google Scholar] [CrossRef]
- Páscoa, P.; Russo, A.; Gouveia, C.M.; Soares, P.M.; Cardoso, R.M.; Careto, J.A.; Ribeiro, A.F. A high-resolution view of the recent drought trends over the Iberian Peninsula. Weather Clim. Extrem. 2021, 32, 100320. [Google Scholar] [CrossRef]
- Villegas, P.; Carente, M.A.; Beltran, D. Economic impact of the drought in Spain: Measurement for the adoption of measures. Water Econ. Policy 2024, 10, 2450007. [Google Scholar] [CrossRef]
- Peña-Gallardo, M.; Vicente-Serrano, S.M.; Domínguez-Castro, F.; Beguería, S. The impact of drought on the productivity of two rainfed crops in Spain. Nat. Hazards Earth Syst. Sci. 2019, 19, 1215–1234. [Google Scholar] [CrossRef]
- Sánchez, E.; Hidalgo, S.; Bruna, J. La sequía en España: Análisis del fenómeno a través del estudio de las noticias de prensa recogidas por Hispagua durante el año 2005. In Scire: Representación y Organización del Conocimiento; Universidad de Zaragoza: Zaragoza, Spain, 2006; pp. 137–150. [Google Scholar] [CrossRef]
- Trullenque-Blanco, V.; Beguería, S.; Vicente-Serrano, S.M. Catalogue of drought events in peninsular Spanish along 1916–2020 period. Sci. Data 2024, 11, 703. [Google Scholar] [CrossRef]
- Torelló-Sentelles, H.; Franzke, C.L. Drought impact links to meteorological drought indicators and predictability in Spain. Hydrol. Earth Syst. Sci. 2022, 26, 1821–1844. [Google Scholar] [CrossRef]
- Lorenzo, M.N.; Alvarez, I.; Taboada, J.J. Drought evolution in the NW Iberian Peninsula over a 60 year period (1960–2020). J. Hydrol. 2022, 610, 127923. [Google Scholar] [CrossRef]
- Vicente-Serrano, S.M. La evolución de los estudios sobre sequías climáticas en España en las últimas décadas. Geographicalia 2021, 73, 7–34. [Google Scholar]
- Olcina Cantos, J. Tipología de sequías en España. Ería 2001, 56, 201–227. [Google Scholar]
- Miró, J.J.; Estrela, M.J.; Corell, D.; Gómez, I.; Luna, M.Y. Precipitation and drought trends (1952–2021) in a key hydrological recharge area of the eastern Iberian Peninsula. Atmos. Res. 2023, 286, 106695. [Google Scholar] [CrossRef]
- Moreno, M.; Bertolín, C.; Ortiz, P.; Ortiz, R. Satellite product to map drought and extreme precipitation trend in Andalusia, Spain: A novel method to assess heritage landscapes at risk. Int. J. Appl. Earth Obs. Geoinf. 2022, 110, 102810. [Google Scholar] [CrossRef]
- Ruiz Álvarez, V.; Portela, M.M.; Espinosa, L.Á.; García Marín, R.; Belmonte Serrato, F.; Ruiz Álvarez, M. Regionalization of droughts from the SPI in the Segura hydrographic basin and Commonwealth of Taibilla Channels (Southeast of Spain). Boletín Asoc. Geógrafos Españoles (BAGE) 2021, 88. [Google Scholar] [CrossRef]
- Ruiz-Sinoga, J.; García-Marín, R.; Martínez Murillo, J.; Gabarrón-Galeote, M. Precipitation dynamics in southern Spain: Trends and cycles. Int. J. Climatol. 2011, 31, 2281–2289. [Google Scholar] [CrossRef]
- Acero, F.J.; Gallego, M.C.; García, J.A. Multi-day rainfall trends over the Iberian Peninsula. Theor. Appl. Clim. 2012, 108, 411–423. [Google Scholar] [CrossRef]
- Serrano Notivoli, R. Reconstrucción climática instrumental de la precipitación diaria en España: Ensayo metodológico y aplicaciones. Ph.D. Thesis, Universidad de Zaragoza, Zaragoza, Spain, 2017. [Google Scholar]
- CEDEX. Impacto del Cambio Climático en las Precipitaciones Máximas en España, Madrid; Centro de Estudios Hidrográficos: Madrid, Spain, 2021; 404p. [Google Scholar]
- Senent-Aparicio, J.; López-Ballesteros, A.; Jimeno-Sáez, P.; Pérez-Sánchez, J. Recent precipitation trends in Peninsular Spain and implications for water infrastructure design. J. Hydrol. Reg. Stud. 2023, 45, 101308. [Google Scholar] [CrossRef]
- González-Hidalgo, J.C.; Brunetti, M.; De Luis, M. Precipitation trends in Spanish hydrological divisions, 1946–2005. Clim. Res. 2010, 43, 215–228. [Google Scholar] [CrossRef]
- Gonzalez-Hidalgo, J.C.; Beguería, S.; Peña-Angulo, D.; Trullenque-Blanco, V. MOPREDAS_century database and precipitation trends in mainland Spain, 1916–2020. Int. J. Climatol. 2023, 43, 3828–3840. [Google Scholar] [CrossRef]
- Gonzalez-Hidalgo, J.C.; Trullenque Blanco, V.; Beguería, S.; Peña-Angulo, D. Seasonal precipitation changes in the western Mediterranean Basin: The case of the Spanish mainland, 1916–2015. Int. J. Climatol. 2024, 44, 1800–1815. [Google Scholar] [CrossRef]
- Paredes, D.; Trigo, R.M.; Garcia-Herrera, R.; Trigo, I.F. Understanding precipitation changes in iberia in early spring: Weather typing and storm-tracking approaches. J. Hydrometeorol. 2006, 7, 101–113. [Google Scholar] [CrossRef]
- Miró, J.J.; Estrela, M.J.; Olcina-Cantos, J.; Martin-Vide, J. Future Projection of Precipitation Changes in the Júcar and Segura River Basins (Iberian Peninsula) by CMIP5 GCMs Local Downscaling. Atmosphere 2021, 12, 879. [Google Scholar] [CrossRef]
- González, A.; Santos, M.; Hernández, J.C.; Acosta, B.; Montalvo, J. Aumenta la frecuencia e intensidad de las sequías por el cambio climático en España. Fundación Matrix. Proyecto Climvac. 2020. Available online: https://fundacionmatrix.es/aumenta-la-frecuencia-e-intensidad-de-la-sequia-por-el-cambio-climatico-en-espana/ (accessed on 7 September 2025).
- Lana, X.; Casas-Castillo, M.C.; Rodríguez-Solà, R.; Serra, C.; Martínez, M.D.; Kirchner, R. Rainfall regime trends at annual and monthly scales in Catalonia (NE Spain) and indications of CO2 emissions effects. Theor. Appl. Clim. 2021, 146, 981–996. [Google Scholar] [CrossRef]
- Xian, T.; Xia, J.; Wei, W.; Zhang, Z.; Wang, R.; Wang, L.P.; Ma, Y.F. Is Hadley cell expanding? Atmosphere 2021, 12, 1699. [Google Scholar] [CrossRef]
- Olcina Cantos, J. Water Planning and Management in Spain in a Climate Change Context: Facts and Proposals. Cuad. Investig. Geográfica 2024, 50, 3–28. [Google Scholar] [CrossRef]
- Paneque, P. Estrategias de gestión de sequías en España: De la gestión de crisis a la gestión de riesgos. In Agua, Estado y Sociedad en América Latina y España; Contreras, J., Navarro, J.R., Rosas, S., Eds.; Consejo Superior de Investigaciones Científicas: Madrid, Spain; Escuela de Estudios Hispanoa-mericanos: Sevilla, Spain; Asociación Cultural la otra Andalucía: Andalucía, Spain, 2015; pp. 15–35. [Google Scholar]
- Wilhite, D. Drought: A Global Assessment; Routledge: New York, NY, USA, 2000; Volumes 1 and 2. [Google Scholar]
- Del Moral, L.; Hernández-Mora, N.; De Stefano, L.; Paneque, P.; Vargas, J.; Brufao, P.; Olcina, J.; Martínez-Fernández, J. Acerca del Real Decreto Ley 10/2017, de 9 de Junio, por el que se Adoptan Medidas Urgentes para Paliar los Efectos Producidos por la Sequía en Determinadas Cuencas Hidrográficas y se Modifica el texto Refundido de la Ley de Aguas, Aprobado por el Real Decreto Legislativo 1/2001, de 20 de Julio. Notas Para el Debate; Fundación Nueva Cultura del Agua: Zaragoza, Spain, 2017. [Google Scholar]
- Olcina, J.; Vera, J.F. Adaptación del sector turístico al cambio climático en España. La importancia de las acciones a escala local y en empresas turísticas. An. Geogr. 2016, 36, 321–352. [Google Scholar]
- Bates, B.C.; Kundzewicz, Z.W.; Palutikof, J.P. Climate change and water. In Technical Paper of the Intergovernmental Panel on Climate Change; IPCC Secretariat: Geneva, Switzerland, 2008. [Google Scholar]
- Klein Tank, A.M.; Wijngaard, J.B.; Können, G.P.; Böhm, R.; Demarée, G.; Gocheva, A.; Mileta, M.; Pashiardis, S.; Hejkrlik, L.; Kern-Hansen, C.; et al. Daily dataset of 20th-century surface air temperature and precipitation series for the European. Clim. Assess. Int. J. Climatol. 2002, 22, 1441–1453. [Google Scholar] [CrossRef]
- Alexander, L.; Herold, N. ClimPACT2: Indices and Software. 2016. Available online: https://epic.awi.de/id/eprint/49274/1/ClimPACTv2_manual.pdf (accessed on 10 September 2025).
- Guijarro, J.A. User’s Guide to Climatol. An R Contributed Package for Homogenization of Climatological Series; Report; State Meteorological Agency, Balearic Islands Office: Palma de Mallorca, Spain, 2011; Available online: https://www.climatol.eu/climatol4.2-0-en.pdf (accessed on 5 September 2025).
- Alexandersson, H.; Moberg, A. Homogenization of Swedish temperature data. Part I: Homogeneity test for linear trends. Int. J. Climatol. 1997, 17, 25–34. [Google Scholar] [CrossRef]
- Beguería, S.; Vicente-Serrano, S.M. SPEI: Calculation of the Standardized Precipitation-Evapotranspiration Index. 2023. Available online: https://github.com/sbegueria/SPEI (accessed on 5 September 2025).
- Vicente-Serrano, S.M.; Tomas-Burguera, M.; Beguería, S.; Reig, F.; Latorre, B.; Peña-Gallardo, M.; Luna, M.Y.; Morata, A.; González-Hidalgo, J.C. A high resolution dataset of drought indices for Spain. Data 2017, 2, 22. [Google Scholar] [CrossRef]
- Sepulcre-Canto, G.; Horion, S.M.A.F.; Singleton, A.; Carrao, H.; Vogt, J. Development of a Combined Drought Indicator to detect agricultural drought in Europe. Nat. Hazards Earth Syst. Sci. 2012, 12, 3519–3531. [Google Scholar] [CrossRef]
- Theil, H. A rank-invariant method of linear and polynomial regression analysis. Indag. Math. 1950, 12, 173. [Google Scholar]
- Sen, P.K. Estimates of the regression coefficient based on Kendall’s tau. J. Am. Stat. Assoc. 1968, 63, 1379–1389. [Google Scholar] [CrossRef]
- Mann, H.B. Non-parametric tests against trend. Econometrica 1945, 13. [Google Scholar] [CrossRef]
- Kendall, M.G. Rank Correlation Methods; Charles Griffin: London, UK, 1975. [Google Scholar]
- Hamed, K.H.; Rao, A.R. A modified Mann-Kendall trend test for autocorrelated data. J. Hydrol. 1998, 204, 182–196. [Google Scholar] [CrossRef]
- Urquijo-Reguera, J.; Gómez-Villarino, M.T.; Pereira, D.; De Stefano, L. An assessment framework to analyze drought management plans: The case of Spain. Agronomy 2022, 12, 970. [Google Scholar] [CrossRef]
- Meza, I.; Siebert, S.; Döll, P.; Kusche, J.; Herbert, C.; Eyshi Rezaei, E.; Nouri, H.; Gerdener, H.; Popat, E.; Frischen, J.; et al. Global-scale drought risk assessment for agricultural systems. Nat. Hazards Earth Syst. Sci. 2020, 20, 695–712. [Google Scholar] [CrossRef]
- Wu, J.; Geng, G.; Zhou, H.; Liu, J.; Wang, Q.; Yang, J. Global vulnerability to agricultural drought and its spatial characteristics. Sci. China Earth Sci. 2017, 60, 910–920. [Google Scholar] [CrossRef]
- Rossi, L.; Wens, M.; De Moel, H.; Cotti, D.; Sabino Siemons, A.; Toreti, A.; Maetens, W.; Masante, D.; Van Loon, A.; Hagenlocher, M.; et al. European Drought Risk Atlas; Publications Office of the European Union: Luxembourg, 2023. [Google Scholar] [CrossRef]
- Monjo, R.; Royé, D.; Martin-Vide, J. Meteorological drought lacunarity around the world and its classification. Earth Syst. Sci. Data 2020, 12, 741–752. [Google Scholar] [CrossRef]
- Gaitán, E.; Monjo, R.; Pórtoles, J.; Pino-Otín, M.R. Impact of climate change on drought in Aragon (NE Spain). Sci. Total Environ. 2020, 740, 140094. [Google Scholar] [CrossRef]
- Blauhut, V.; Stahl, K.; Stagge, J.H.; Tallaksen, L.M.; De Stefano, L.; Vogt, J. Estimating drought risk across Europe from reported drought impacts, drought indices, and vulnerability factors. Hydrol. Earth Syst. Sci. 2016, 20, 2779–2800. [Google Scholar] [CrossRef]
- Jiménez-Donaire, M.D.P.; Tarquis, A.; Giráldez, J.V. Evaluation of a combined drought indicator and its potential for agricultural drought prediction in southern Spain. Nat. Hazards Earth Syst. Sci. 2020, 20, 21–33. [Google Scholar] [CrossRef]
- Ortega-Gómez, T.; Pérez-Martín, M.A.; Estrela, T. Improvement of the drought indicators system in the Júcar River Basin, Spain. Sci. Total Environ. 2018, 610–611, 276–290. [Google Scholar] [CrossRef] [PubMed]
- Domínguez-Castro, F.; Vicente Serrano, S.M.; Tomás-Burguera, M.; Peña-Gallardo, M.; Beguería, S.; El Kenawy, A.M.; Luna, Y.; Morata, A. High spatial resolution climatology of drought events for Spain: 1961–2014. Int. J. Clim. 2019, 39, 5046–5062. [Google Scholar] [CrossRef]
- Vargas, J.; Paneque, P. Challenges for the integration of water resource and drought-risk management in Spain. Sustainability 2019, 11, 308. [Google Scholar] [CrossRef]


Disclaimer/Publisher’s Note: The statements, opinions and data contained in all publications are solely those of the individual author(s) and contributor(s) and not of MDPI and/or the editor(s). MDPI and/or the editor(s) disclaim responsibility for any injury to people or property resulting from any ideas, methods, instructions or products referred to in the content. |
© 2025 by the authors. Licensee MDPI, Basel, Switzerland. This article is an open access article distributed under the terms and conditions of the Creative Commons Attribution (CC BY) license (https://creativecommons.org/licenses/by/4.0/).