Article

Near-Surface Temperature Climate Change in the Caspian Region: A Study Using Meteorological Station Data, Reanalyses, and CMIP6 Models

1
A.O. Kovalevsky Institute of Biology of the Southern Seas of RAS, 299011 Sevastopol, Russia
2
Shirshov Institute of Oceanology of Russian Academy of Sciences, 117997 Moscow, Russia
3
H. Aliyev Institute of Geography, Ministry of Science and Education, AZ1070 Baku, Azerbaijan
4
Research Institute of Meteorological and Atmospheric Sciences (RIMAS), Mashhad 14977-16385, Iran
*
Author to whom correspondence should be addressed.
Climate 2025, 13(10), 201; https://doi.org/10.3390/cli13100201
Submission received: 31 August 2025 / Revised: 21 September 2025 / Accepted: 22 September 2025 / Published: 25 September 2025

Abstract

The climatic variability of near-surface air temperature (NSAT) over the Caspian region (35–60° N; 40–65° E) was analyzed in this study. The analysis was based on a comparison of data from various sources: weather stations, NOAA OISSTv2 satellite-based data, atmospheric reanalyses ECMWF ERA5, NASA MERRA-2, and NCEP/NCAR, and the outputs from 33 Earth system models (ESMs) participating in the Coupled Model Intercomparison Project Phase 6 (CMIP6). CMIP6 models results from the historical and Shared Socioeconomic Pathways (SSPs) experiments were utilized. Over the period 1940–2023, NSAT exhibited variable changes across the Caspian region. Weather stations in the northwestern part of the region indicated NSAT increases of 0.9 ± 0.2 °C for 1985–2023. In the central-western part of the Caspian region, the increase in average NSAT between 1940–1969 and 1994–2023 was 1.4 °C with a spatial standard deviation of 0.3 °C. In the southern part of the Caspian region, the increase in average NSAT between 1986–2004 and 2005–2023 was 0.8 ± 0.1 °C. Importantly, all 33 CMIP6 models, as well as the ERA5 reanalysis, captured an average NSAT increase of approximately 1.3 ± 0.5 °C for the whole Caspian region between 1940–1969 and 1994–2023. From the ERA5 data, the increase in NSAT was more pronounced in the north (~1.6 °C) than in the central Caspian region, with the most significant warming observed in the mountainous regions of Iran (up to 3.0 °C). Under various CMIP6 SSPs scenarios (SSP1-2.6, SSP2-4.5, SSP3-7.0, and SSP5-8.5), projections indicate an increase in average NSAT across the study region. Comparing the periods 1994–2023 and 2070–2099, the projected NSAT increases are 1.7 ± 0.7 °C, 2.8 ± 0.8 °C, 4.0 ± 0.9 °C, and 5.2 ± 1.2 °C, respectively. For the earlier period of 2024–2053 relative to 1994–2023, the projected NSAT increases are 1.2 ± 0.4 °C, 1.3 ± 0.4 °C, 1.4 ± 0.4 °C, and 1.7 ± 0.5 °C. Notably, the projected increase in NSAT is slower over the Caspian Sea compared to the surrounding land areas.

1. Introduction

Over the last few decades, widespread instrumental measurements have documented climate warming across the Earth’s surface. The most widely accepted explanation for this global warming trend is the increase in greenhouse gas concentrations in the atmosphere [1,2]. Earth system models (ESMs) are used to validate this hypothesis; the best of these models contribute to the Coupled Model Intercomparison Project (CMIP). A core objective of CMIP is to generate a multi-model ensemble for both analyzing the past climate (the historical experiment) [3] and creating projections of future climate changes (SSP experiments) [4].
The effects of global warming are not uniform; they vary significantly from region to region [2]. The Caspian Sea region provides a clear example. The Caspian Sea is a closed basin located between Europe and Asia. The shallow, lagoon-like Kara-Bogaz-Gol Gulf is adjacent to the Middle Caspian on its eastern side. Notably, in March 1980, this gulf was artificially separated from the Caspian Sea by a sand dam. Consequently, it nearly completely dried up by mid-1984. However, following the dam’s destruction in June 1992, the gulf had refilled by mid-1996 [5]. These anthropogenic interventions have had an impact on the Caspian Sea’s level changes.
Research on near-surface air temperature (NSAT) and sea surface temperature (SST) trends in the Caspian region has drawn upon diverse data sources, including the following: weather station records [6], satellite observations (DAHITI—Database for Hydrological Time Series of Inland Waters, NASA Giovanni) [7,8], and reanalysis datasets [9,10,11]. Some studies have specifically examined long-term trends in NSAT and SST across different parts of the Caspian Sea watershed [7,11,12]. Alterations in NSAT are often correlated with Caspian Sea level changes [13,14], variations in ice cover [15,16], the discharge rate of the Volga River [7,12,14,17], humidity levels (both specific and relative), precipitation fluctuations, the North Atlantic Oscillation (NAO) [10], the Atlantic Multidecadal Oscillation (AMO) [9], the Interdecadal Pacific Oscillation (IPO) [9], and the broader context of global warming [1,2].
For southern regions with hot climates, such as the Caspian Sea area, rising temperatures translate to more frequent and severe heatwaves and droughts during the summer months. These events negatively impact both public health and agricultural productivity. Since the early 1990s, global warming has fueled greater evaporation from the sea and its watershed, coupled with reduced discharge from the Volga River. As a consequence, the rate of Caspian Sea level decline has accelerated since 1996, adversely affecting socioeconomic development along the coast [14,17]. Research using MERRA-2 reanalysis data revealed statistically significant warming trends in average annual SST across the North, Middle, and South Caspian Sea. Specifically, the 2001–2021 period experienced increases of 0.4 °C, 0.9 °C, and 0.7 °C, respectively, compared to the earlier 1980–2000 period [11]. Science-based projections of future climate developments are crucial for effective and timely adaptation to climate change. These projections are heavily influenced by plausible Shared Socioeconomic Pathways (SSPs) and the associated scenarios of anthropogenic greenhouse gas emissions [18].
The main goals of this research are to accurately evaluate the climatic changes in NSAT over the Caspian Sea region, utilizing a comparative analysis of data from various reliable instrumental sources; investigate the underlying causes of observed NSAT changes using CMIP6 ESMs’ historical experiment outputs, dividing the contributions of different scales and physical mechanisms within the climate system; estimate projections of future NSAT changes in the Caspian Sea region through the end of the 21st century, employing an ensemble of CMIP6 ESM SSP experimental outputs under various scenarios of global economic development and greenhouse gas emissions.

2. Materials and Methods

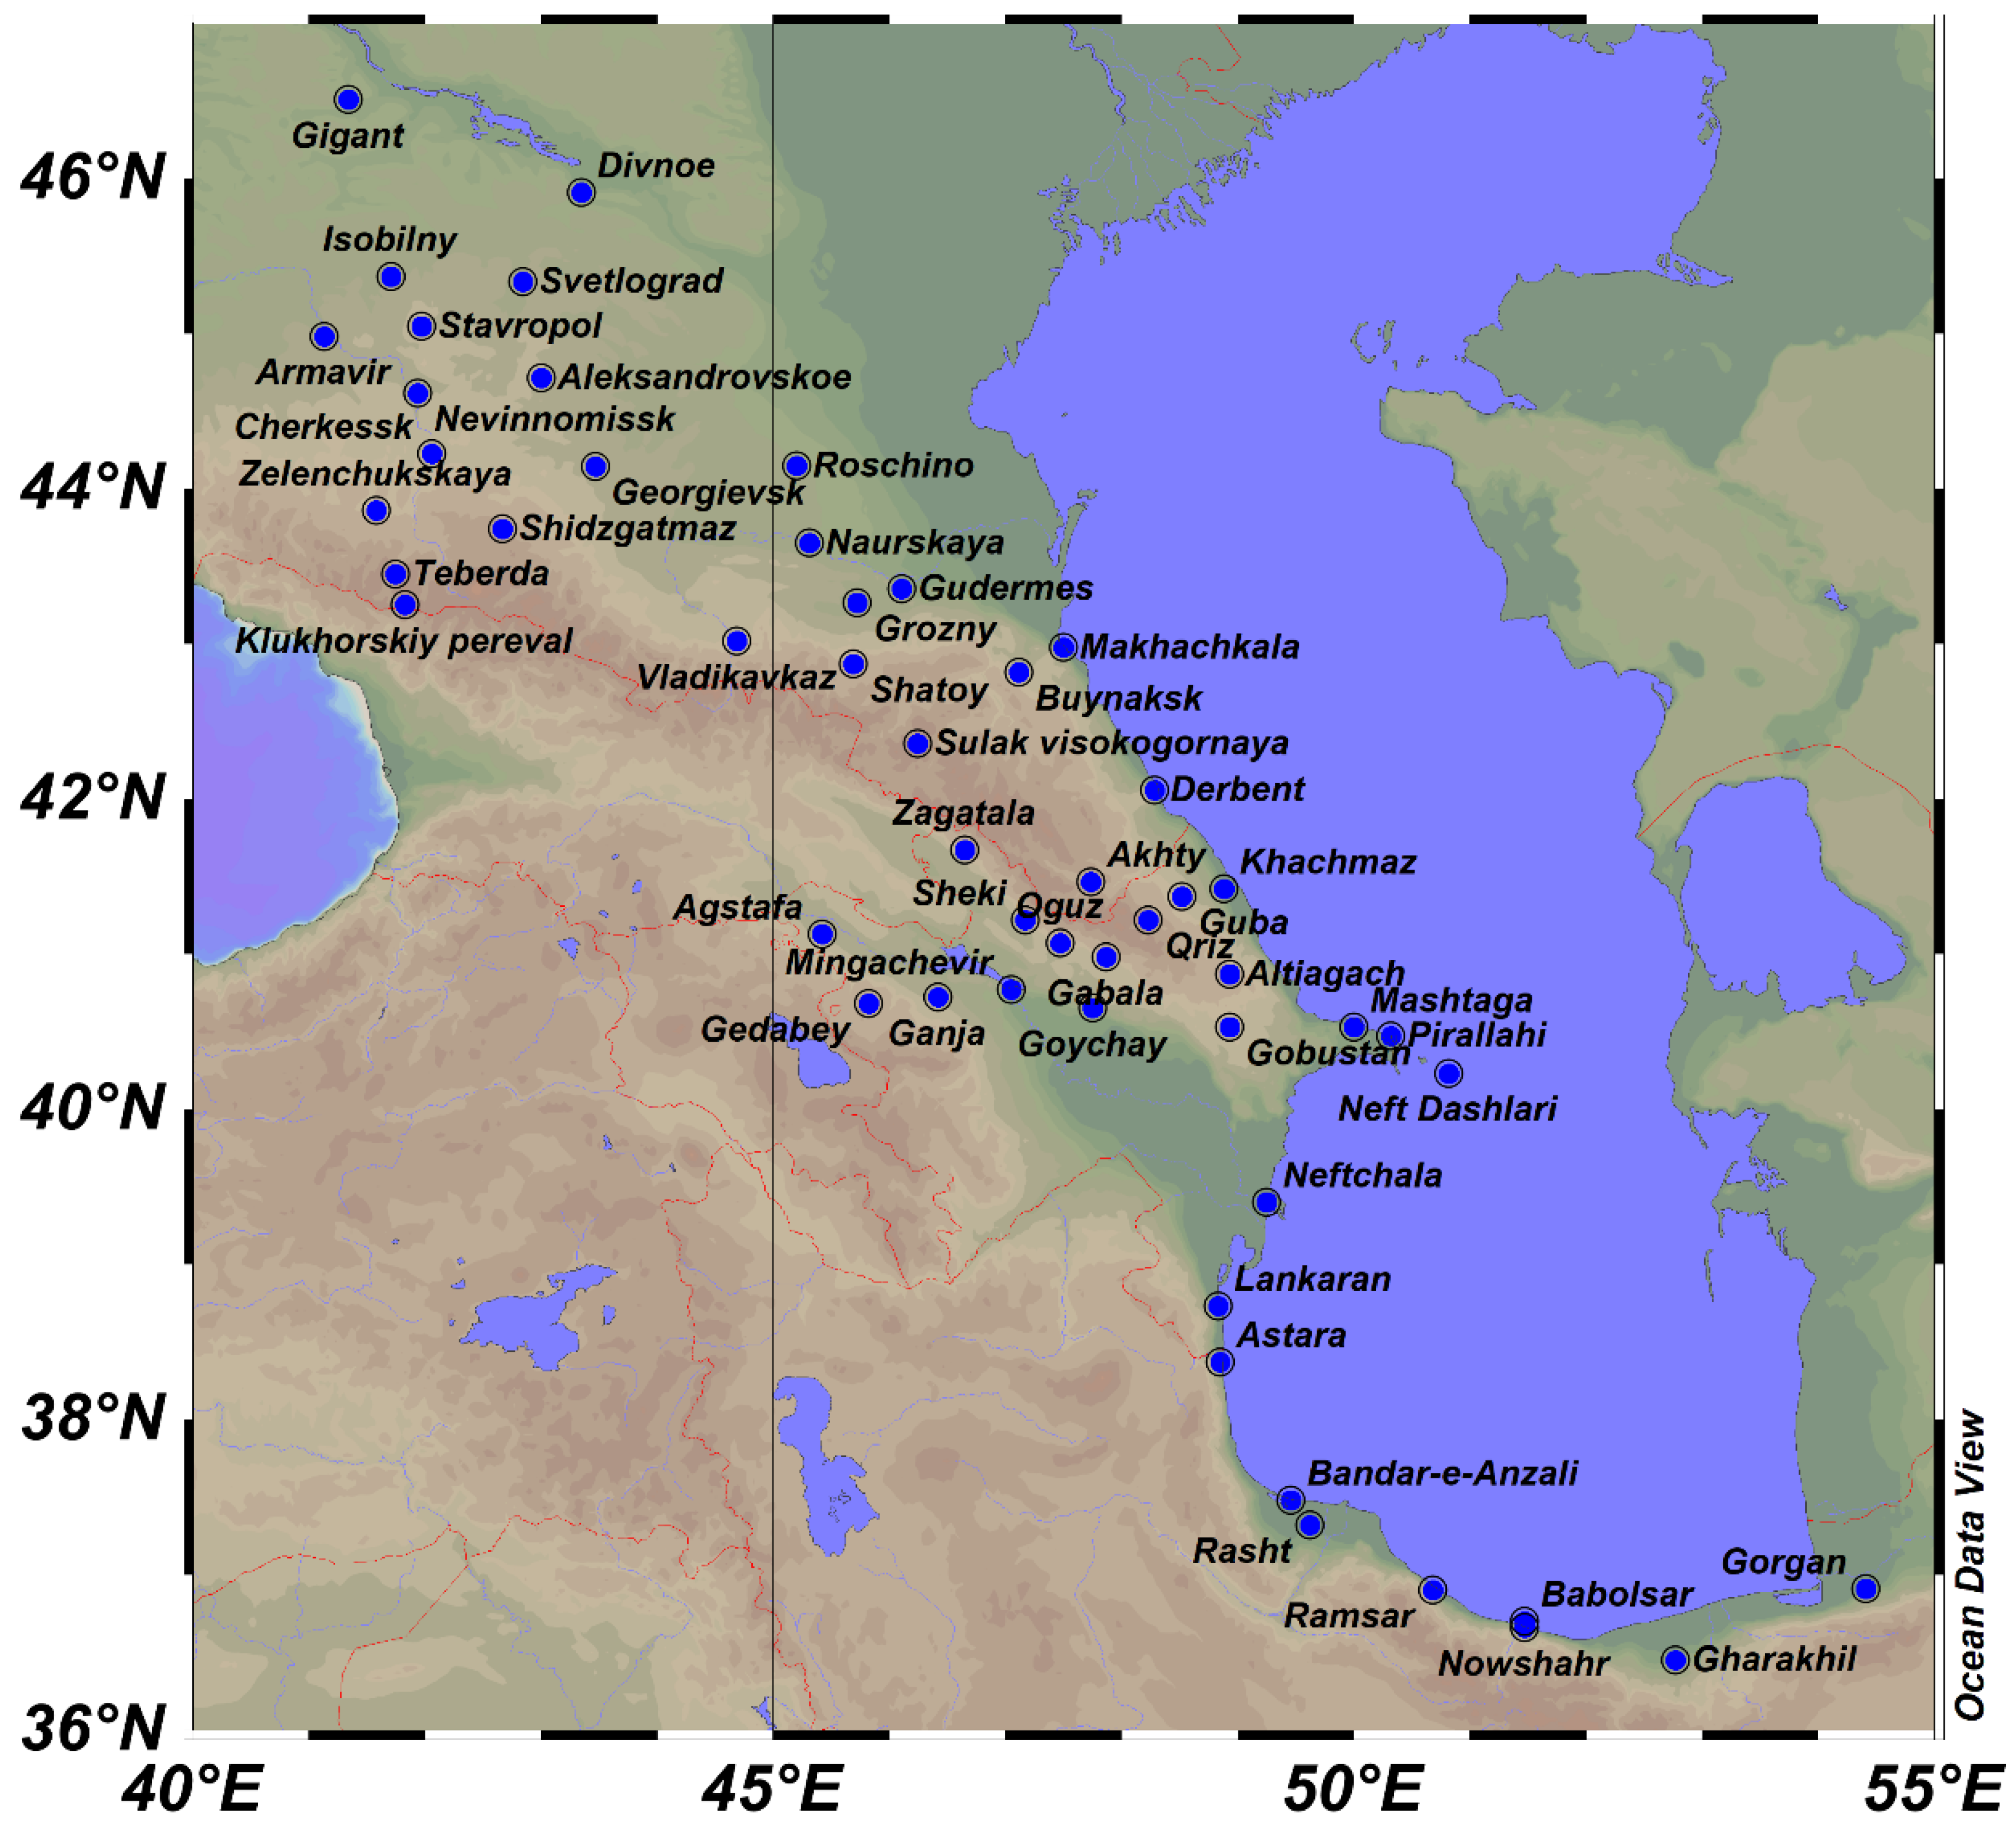
This study examined NSAT data from the broader Caspian Sea region (35–60° N, 40–65° E), encompassing its watershed basin. The analysis utilized NSAT data obtained from meteorological stations (Figure 1). For each station, we computed the mean NSAT, standard deviation, and minimum and maximum values for the entire period of 1960–2023. Furthermore, these calculations were performed for the sub-periods of 1985–2010, 2011–2023, 1940–1969, and 1994–2023. To calculate the average temperatures for the 1940–1969 period, additional data from archival reference sources [19,20] were incorporated.
This study primarily relied on monthly mean NSAT data from the European Centre for Medium-Range Weather Forecasts (ECMWF) ERA5 reanalysis, spanning 1940–2023 with a 0.25° × 0.25° spatial resolution [21]. To validate the ERA5 findings, supplemental NSAT data were obtained from the NASA MERRA-2 satellite reanalysis (0.5° latitude 0.625° longitude grid, 1980–2023) [22] and the NCEP/NCAR reanalysis (2.5° × 2.5° resolution, 1948–2023) [23]. In addition, satellite-derived NOAA Optimum Interpolation SST (OISSTv2) data (0.25° × 0.25° resolution, 1982–2023) were examined to assess changes in the Caspian Sea surface temperature [24].
To analyze past and potential future changes in NSAT in the study region, ESMs results from the CMIP6 experiments, organized by the World Climate Research Programme [3], were used. It is important to note that the term “Earth system model” (ESM) is now preferred for Earth’s climate modeling, as the term “coupled model” is outdated due to the inclusion of components beyond just the ocean and atmosphere. The addition of soil, ice, and biosphere components enables the creation of climate projections under various scenarios of future human development. Modeling of future climate change is coordinated through the Scenario Model Intercomparison Project (Scenario MIP) [4], which investigates climate change under different plausible scenarios of greenhouse gas emissions and land-use changes. To assess how well the ESMs simulate observed NSAT changes in the Caspian Sea region, results from the “historical” experiment were used, which incorporates forcing from historical changes in greenhouse gas concentrations, anthropogenic aerosols, solar activity, and volcanic eruptions.
Different SSPs for future greenhouse gas emissions result in varying levels of radiative forcing by the end of the 21st century, ranging from 1.9 to 8.5 W/m2. Higher values indicate a stronger global warming effect. For this analysis, the SSP1-2.6, SSP2-4.5, SSP3-7.0, and SSP5-8.5 scenarios were selected to encompass a wide range of uncertainties in future radiative forcing trajectories. These specific radiative forcing values (2.6, 4.5, 7.0, and 8.5 W/m2) were chosen because these SSP experiments have been run with the largest number of CMIP6 ESMs and to facilitate comparisons with the scenarios used in the previous phase of the Coupled Model Intercomparison Project (CMIP5) [25].
To ensure an equal contribution from each ESM, only one simulation (run) per ESM was used. To calculate average NSAT fields from the 33 CMIP6 ESMs, the results from each ESM were first linearly interpolated to a common 1 × 1° grid. The historical experiment results end in 2014, while the SSP experiment results begin in 2015. When an averaging period spanned this transition, the final average included historical experiment results up to 2014 and SSP experiment results from 2015 onward.
It is important to note that CMIP6 ESMs employ different methods to represent the same physical, chemical, and biological processes, including different approaches to defining boundary layer depth, varying spatial resolutions, and different parameterizations of sub-grid scale processes. These differences contribute significantly to the variability in the results from the 33 analyzed CMIP6 ESMs, with some models better reproducing observational data than others. However, the fact that one simulation (run) from a particular ESM better replicates past climate changes (historical experiment) does not necessarily imply that its projections of the future climate state (SSPs experiments), under significantly altered physical conditions, will be superior [2]. Given this, and assuming that the parameterization methods used in different CMIP6 ESMs are equally plausible, we believe that an ensemble approach is the most justifiable method for utilizing CMIP6 ESM results.
The study by Reichler and Kim [26] demonstrated that past climate changes are best reproduced not by any single ESM, even the most sophisticated ESM, but rather by averaging the results of an ensemble of ESMs that have undergone rigorous prior selection. This selection involves independent collective expert evaluations of modeling results by numerous scientific groups and adherence to ever-increasing standards (e.g., high spatial resolution, inclusion of new processes). Therefore, it is reasonable to assume that future climate changes are best represented by averaging the results of the entire ensemble of ESMs participating in the most recent, currently completed 6th phase of CMIP (CMIP6). This is because the huge and complex programming code of each ESM, even the most advanced, contains its own unique random errors that do not correlate with those of other ESMs. Averaging the results from a large number of ESMs suppresses these random errors, leading to a more robust and less random-dependent result. To ensure homogeneity across the ensemble, the basic CMIP6 experiments are standardized and mandatory for all participating ESMs [3]. Ensemble averaging also removes the influence of natural climate variability, as the periods and phases of these oscillations (climate modes) may not align across different ESMs and even in runs of a single model [27,28].
The ensemble of 33 CMIP6 ESMs allows us to estimate the standard deviation of climate projections for each SSP scenario. In the initial decades, natural climate variability contributes most to the uncertainty in climate projections. By the mid-21st century, intermodel spread is the largest source of uncertainty, while towards the end of the 21st century, differences among the SSP scenarios dominate the reasons for uncertainty [29]. Because the nominal NSAT values for the study region differ significantly across the 33 selected CMIP6 ESMs due to individual model characteristics, NSAT anomalies were used for the analysis. This approach helps to partially mitigate systematic errors (biases) present in the ESMs. The period 1982–2011, which represents the first 30 years covered by all datasets (satellite NOAA OISSTv2 data began from 1982), was chosen as the common climate normal for calculating anomalies. For each grid point, the average annual cycle of the analyzed data from 1982 to 2011 was computed and then subtracted from the original monthly mean data to obtain monthly anomalies. These monthly anomalies were then averaged to produce annual anomalies at each grid point of each data set under study.
To minimize the impact of interannual climate variability on trend analyses, and to align with the World Meteorological Organization’s (WMO) guidelines for using 30-year averages as climate normals, this study employed a comparative analysis of temperatures averaged over 30-year periods. This method allows for the detection of long-term climate shifts without relying on the potentially biased estimates provided by trend calculations. Recognizing the sensitivity of linear trend estimates to the initial and final data points, the analysis of long-term climate changes relies on comparing anomalies averaged over the 30-year periods of 1940–1969 and 1994–2023. This comparison was performed using both the ERA5 reanalysis data and data from meteorological stations, as well as through the combination of historical and SSP model results. Furthermore, projected future changes were assessed by examining the ESM results under the SSP scenarios for the periods 2024–2053 and 2070–2099. The above described data and methods have already been successfully applied by us to analyze temperature changes in the South African region [30].
Statistical analyses were conducted using XLStat2016 for MS Excel 16. To assess how accurately the weather stations data consistent with the ERA5 reanalysis and the ensemble of CMIP6 models in the entire Caspian Sea region (35–60° N, 40–65° E), Pearson correlation coefficients were calculated. The significance of Pearson’s correlation coefficients (r) was assessed using Student’s t-test. Correlation coefficients were considered statistically significant at the 5% confidence level when |r| > 0.5 for a sample size of 55 and 75.
Long-term trends in NSAT change in the Caspian region were studied at individual meteorological stations, assessing the significance of the reliability of the Mann–Kendall approximation.

3. Results

3.1. Weather Stations

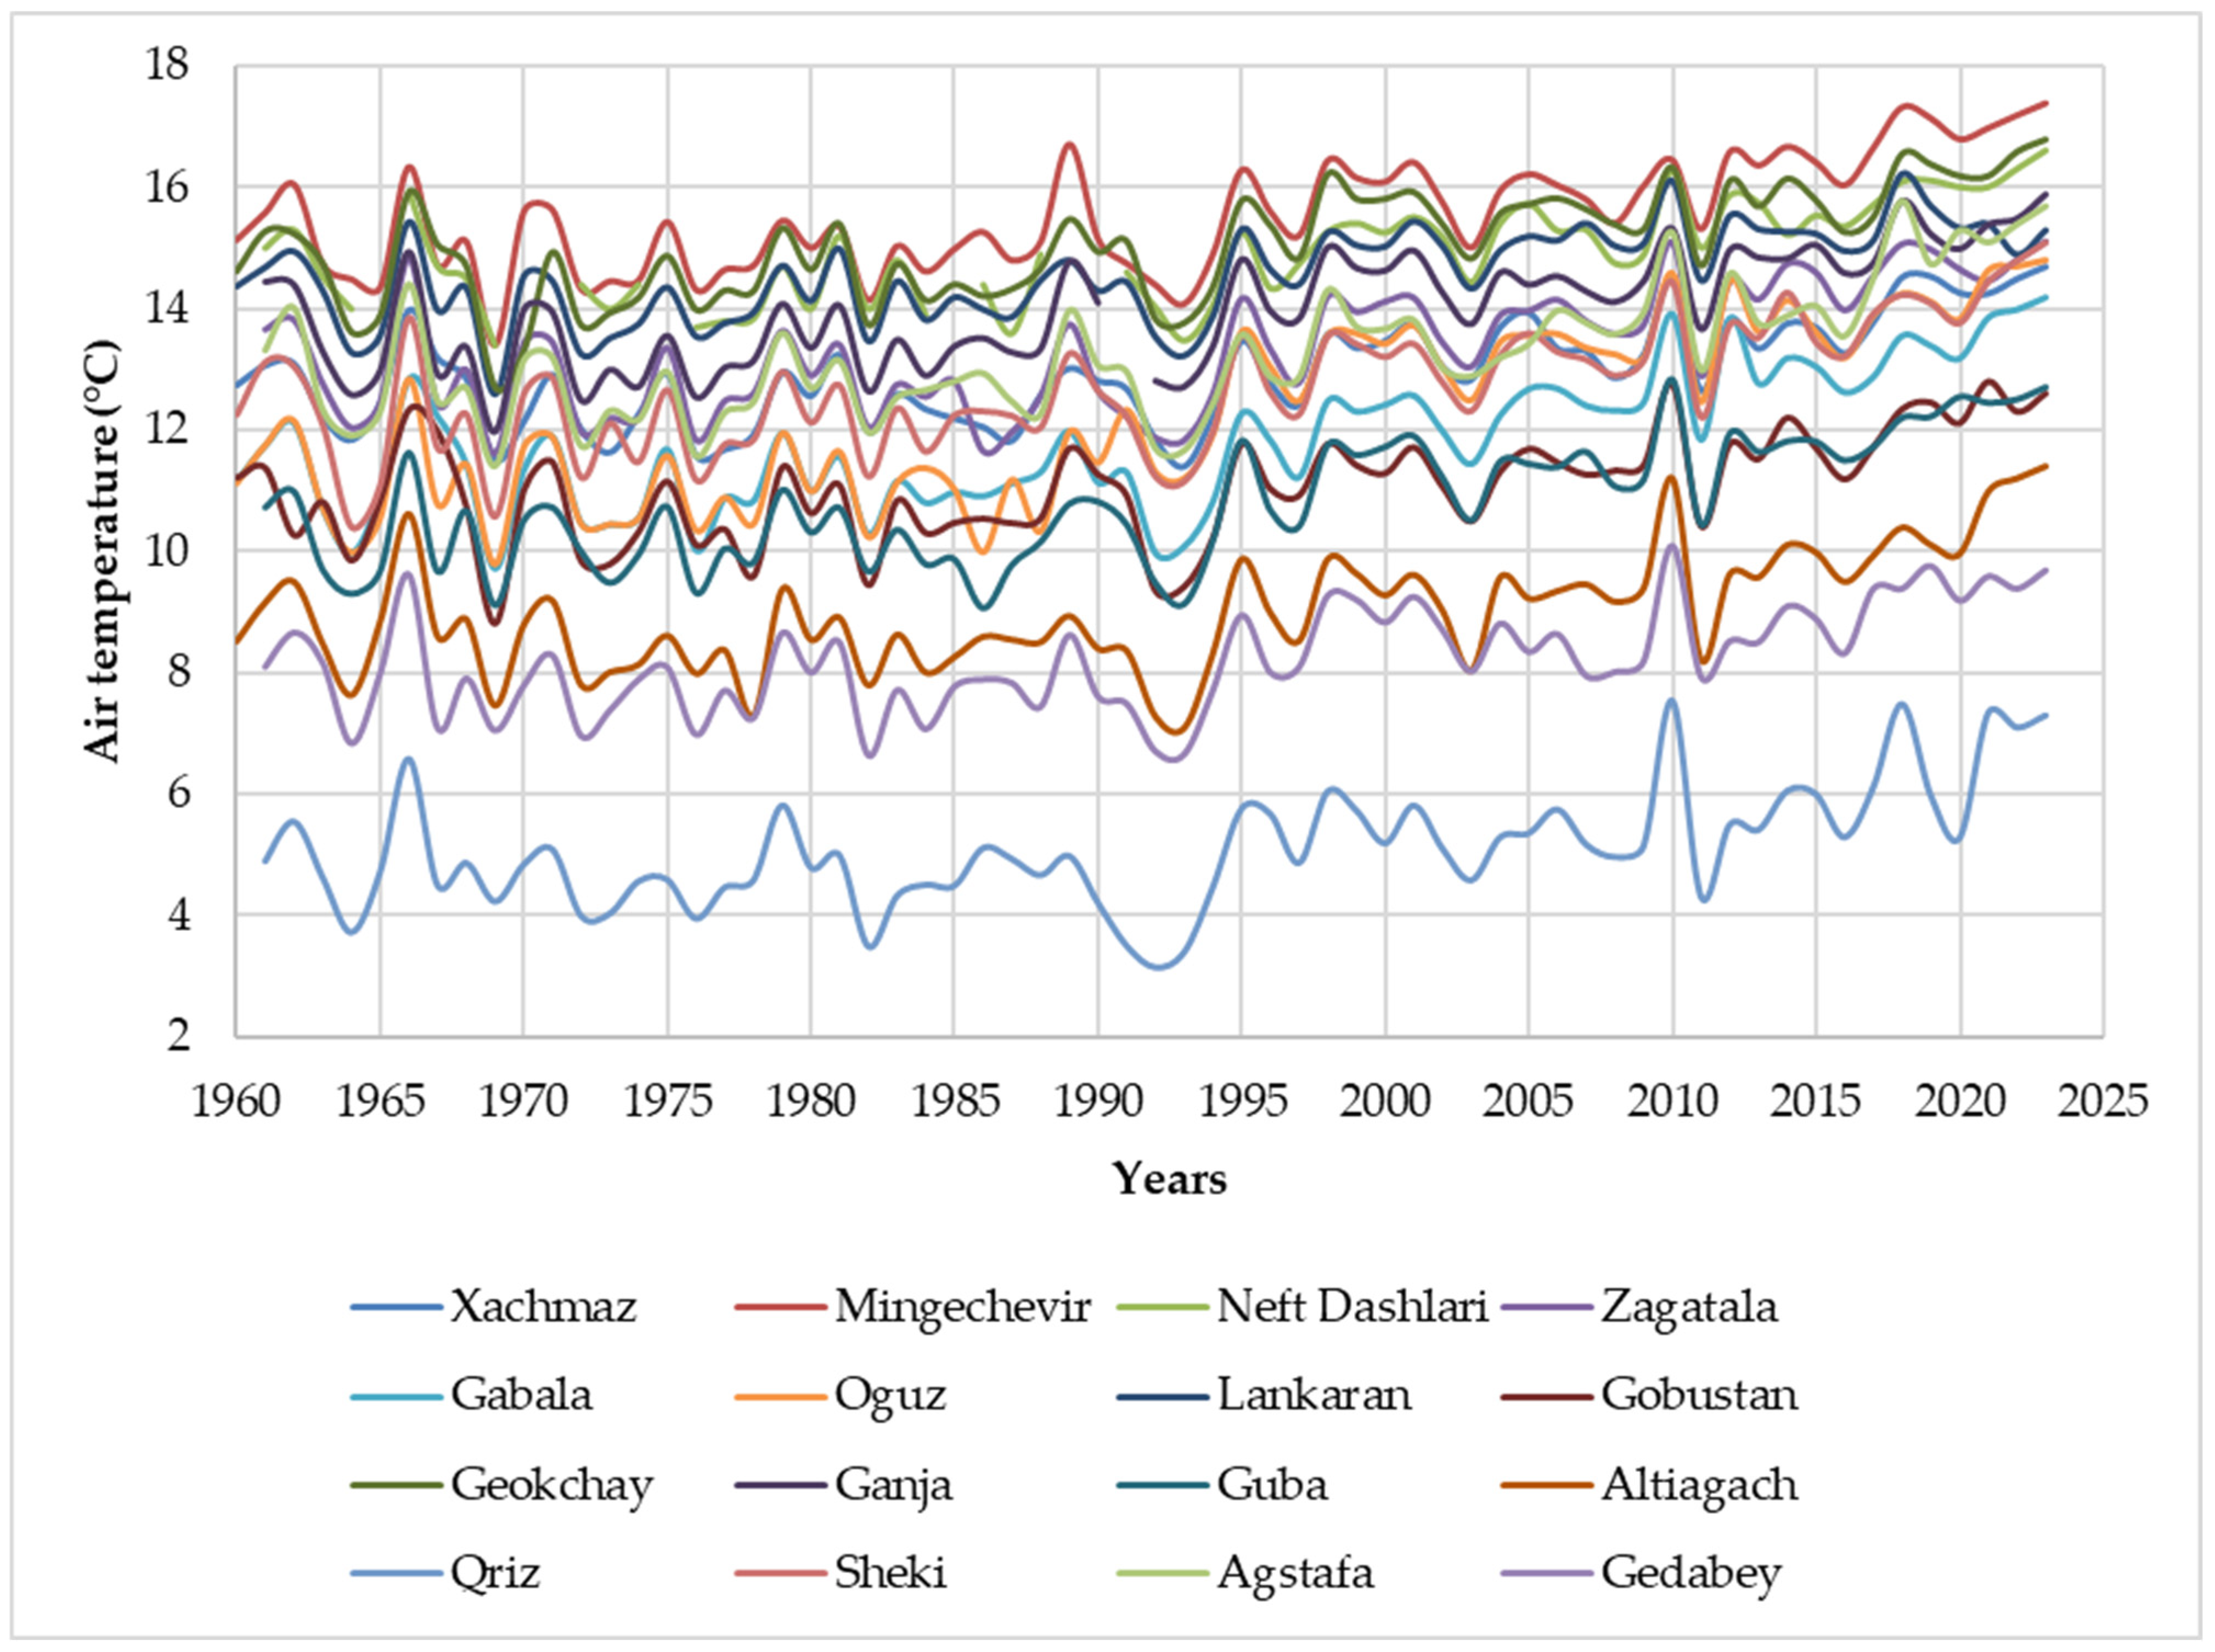
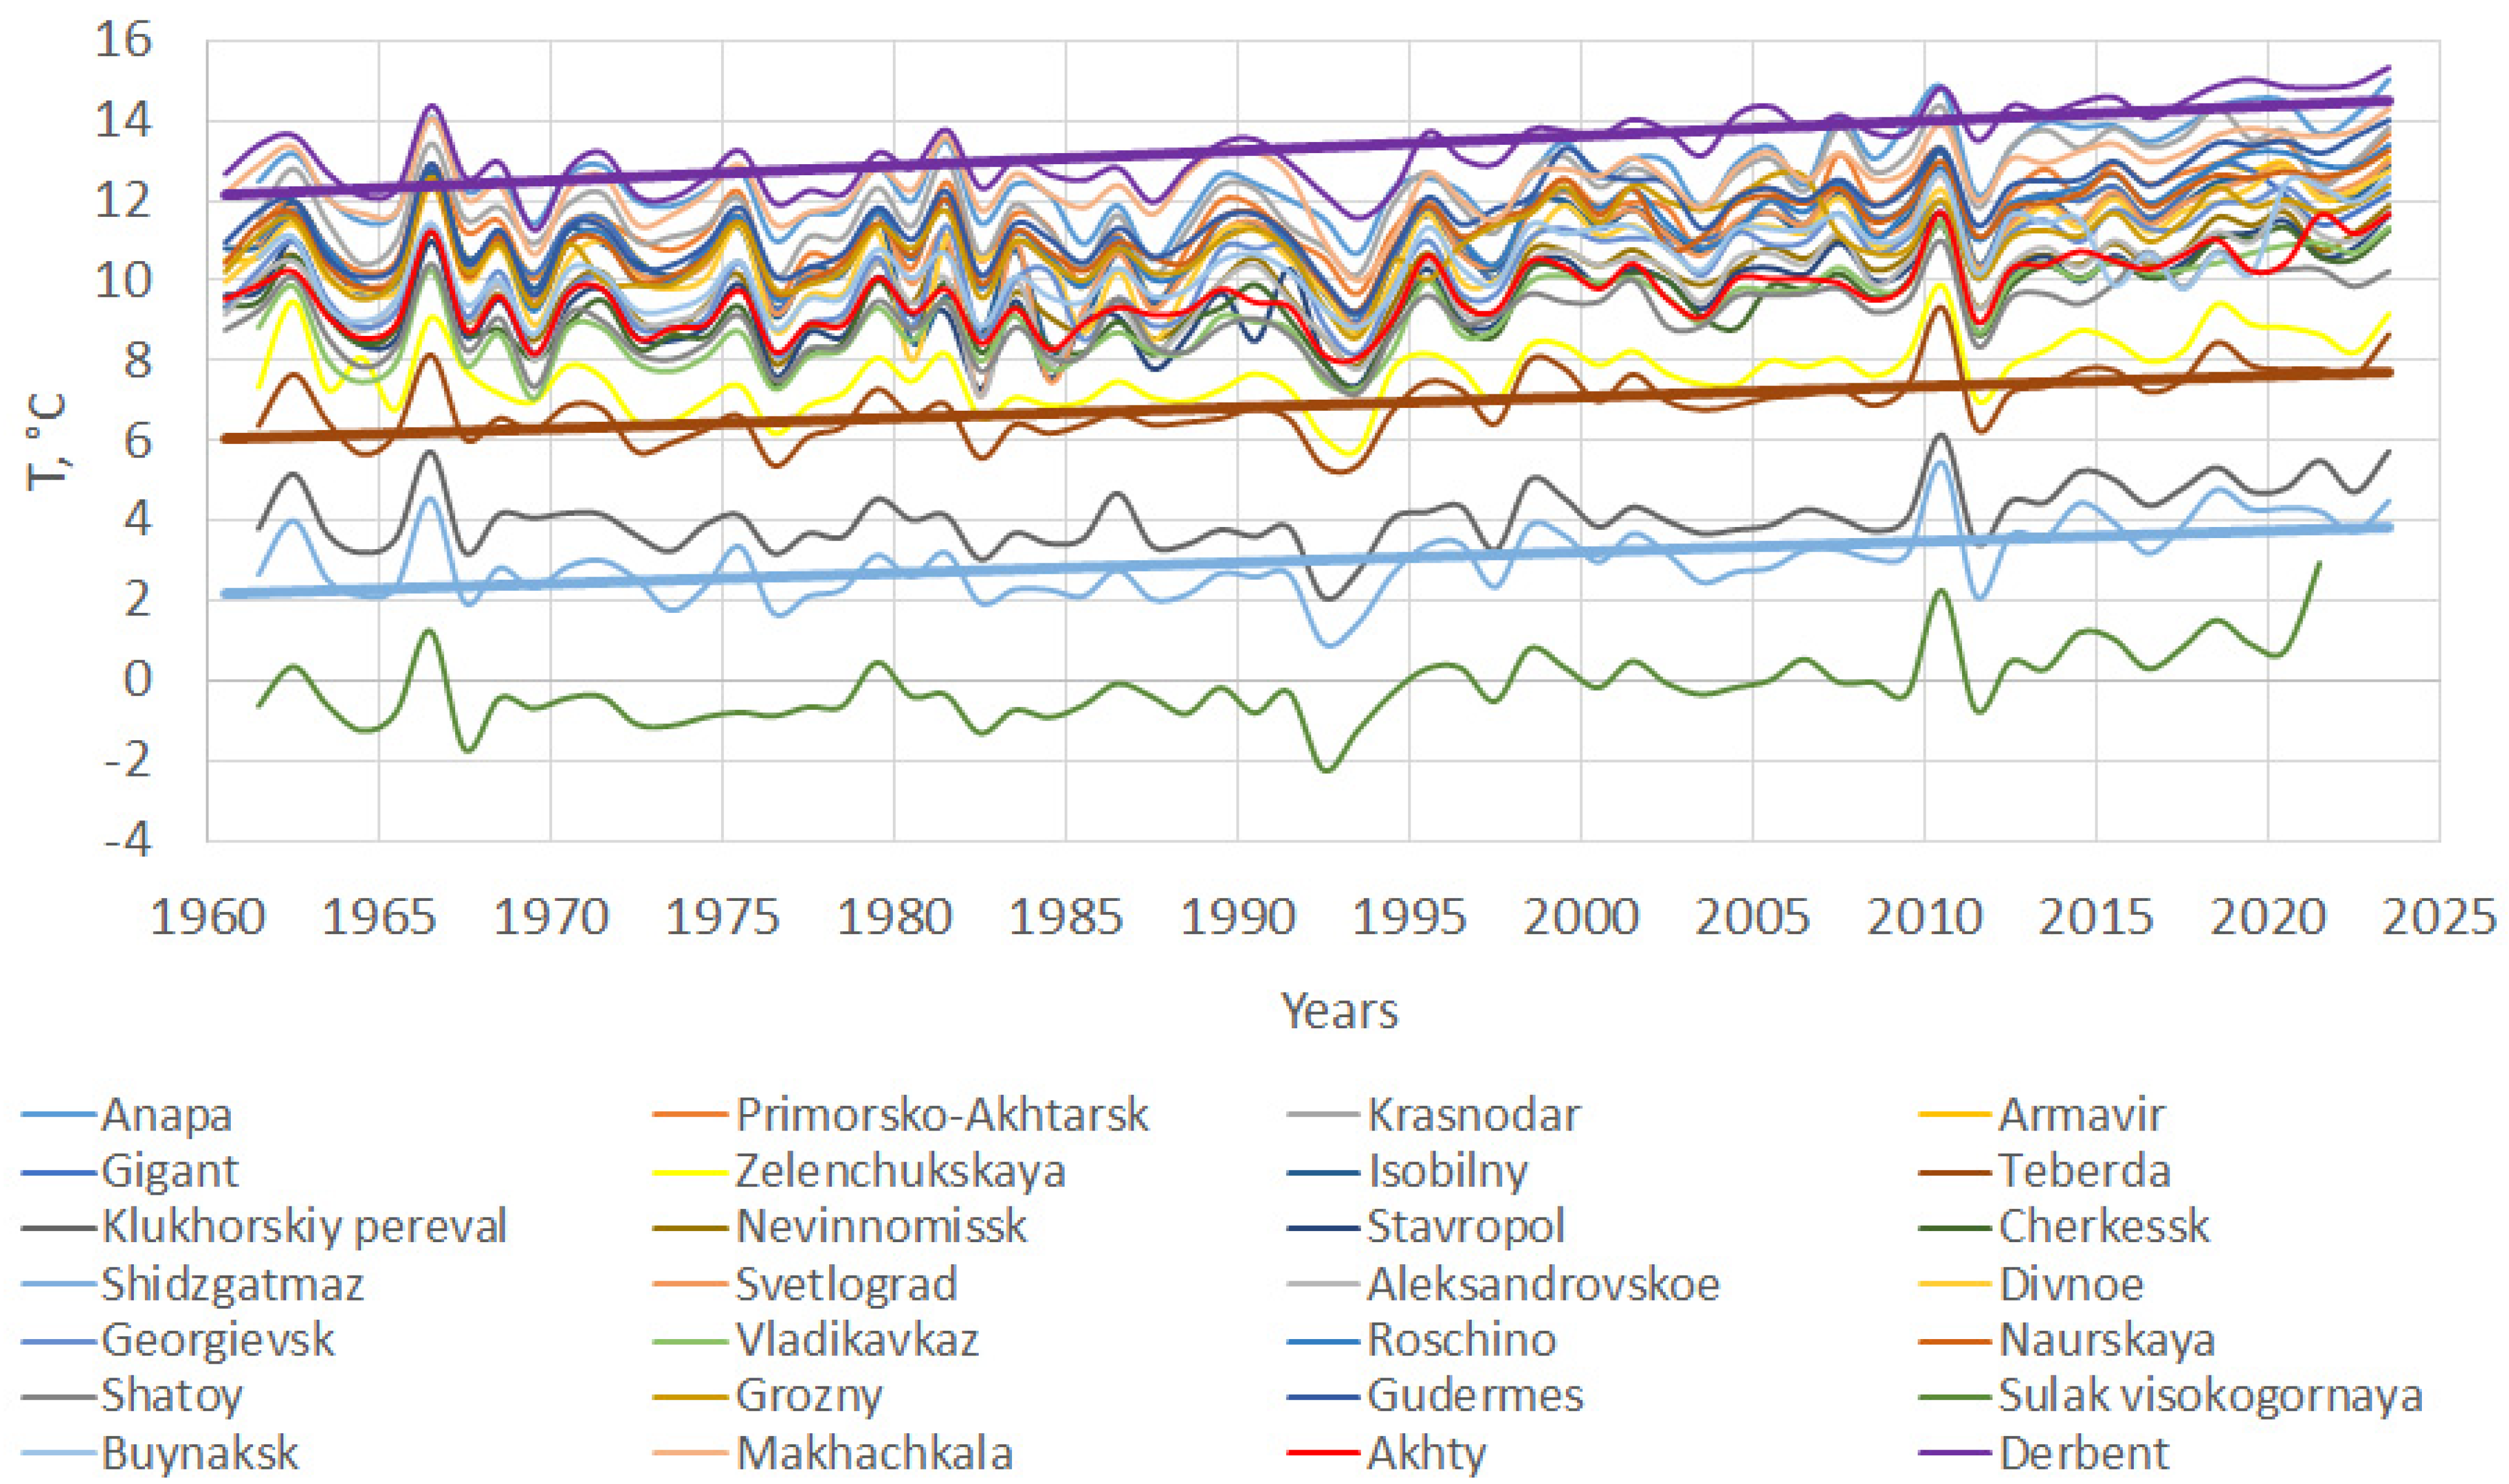
Results from the analysis of mean NSAT values and their standard deviations, recorded at meteorological stations in the northwestern (0.9 ± 0.2°C), central-western (1.0 ± 0.3°C), southern parts (0.7 ± 0.2°C) of Caspian region, demonstrate a significant increase in average NSAT during the period 2011–2023 compared to 1985–2010 (1986–2010 for the southern part) (Table 1, Table 2, Table 3, Table 4 and Table 5). Moreover, interannual NSAT fluctuations show a high degree of coherence across the various meteorological stations analyzed (Figure 2 and Figure 3). An increase in the average annual NSAT was noted for all the meteorological stations considered in the northwestern Caspian region (Russia) (Figure 2). For all stations, the increase in NSAT and linear trends were statistically significant at the 0.05 level. The course of change in the average annual NSAT is mainly synchronous for the meteorological stations considered (Figure 2). The values of Pearson’s correlation coefficients between the average annual NSAT at separate weather stations for the period 1960–2023 were significant (r > 0.9).
The Republic of Azerbaijan, in the central Caspian region, is characterized by complex terrain. Data from 19 hydrometeorological stations across the region show that, from 1991 to 2018 compared to the 1961–1990 climate normal, the average annual NSAT increased by 0.83 °C, ranging from 0.61 to 1.17 °C, with a spatial standard deviation of ±0.15 °C. The increase in NSAT was slightly lower (0.61–0.65 °C) for the offshore stations of Neft, Dashlari, and Chilov [31,32]. An increase in average annual NSAT was observed at all meteorological stations within Azerbaijan (Figure 3). For all stations, both the NSAT increase and the linear trends (Figure 2) were statistically significant at the 0.05 level. The annual NSAT changes generally exhibited a synchronous pattern across the analyzed meteorological stations (Figure 3).
Table 2 presents the geographic coordinates and primary temperature data for the Azerbaijani meteorological stations included in this study. From 1960 to 2023, average annual NSAT ranged from 3.1 to 17.4 °C across the various stations, with interannual standard deviations of 0.7–1.4 °C.
A comparison of the 1985–2010 and 2011–2023 periods indicates a marked rise in average annual NSAT in the most recent years. The average NSAT increase, as shown in Table 2, is 1.0 °C, with individual station increases varying between 0.8 and 1.5 °C. The spatial standard deviation of the temperature increase is 0.3 °C. This analysis aligns well with results from the stations situated within the northern part of the Caspian Sea basin (Table 1).
Validating the CMIP6 model experiments against weather station temperature data is of considerable importance. For this reason, average NSAT values were calculated for the periods 1940–1969 and 1994–2023, along with their differences, to facilitate comparison with the results of the CMIP6 historical experiment (Table 3).
Table 3 reveals an average temperature increase of 1.37 °C across all weather stations between 1940–1969 and 1994–2023, with a spatial standard deviation of 0.29 °C. As discussed in subsequent sections, these observations are consistent with the findings obtained from the 33 CMIP6 ESM ensemble.
As shown in Table 4 and Table 5, an increase in average NSAT is seen at all stations in the southern part of Caspian region (Iran) in the period 2005–2023 compared to the period 1986–2004 by 0.8 ± 0.1 °C on average. It should be pointed out that observation data for the southern part of the Caspian Sea is available for the period of 1986–2023; thus, Table 4 and Table 5 were prepared based on the available data.

3.2. Reanalysis and Satellite Data

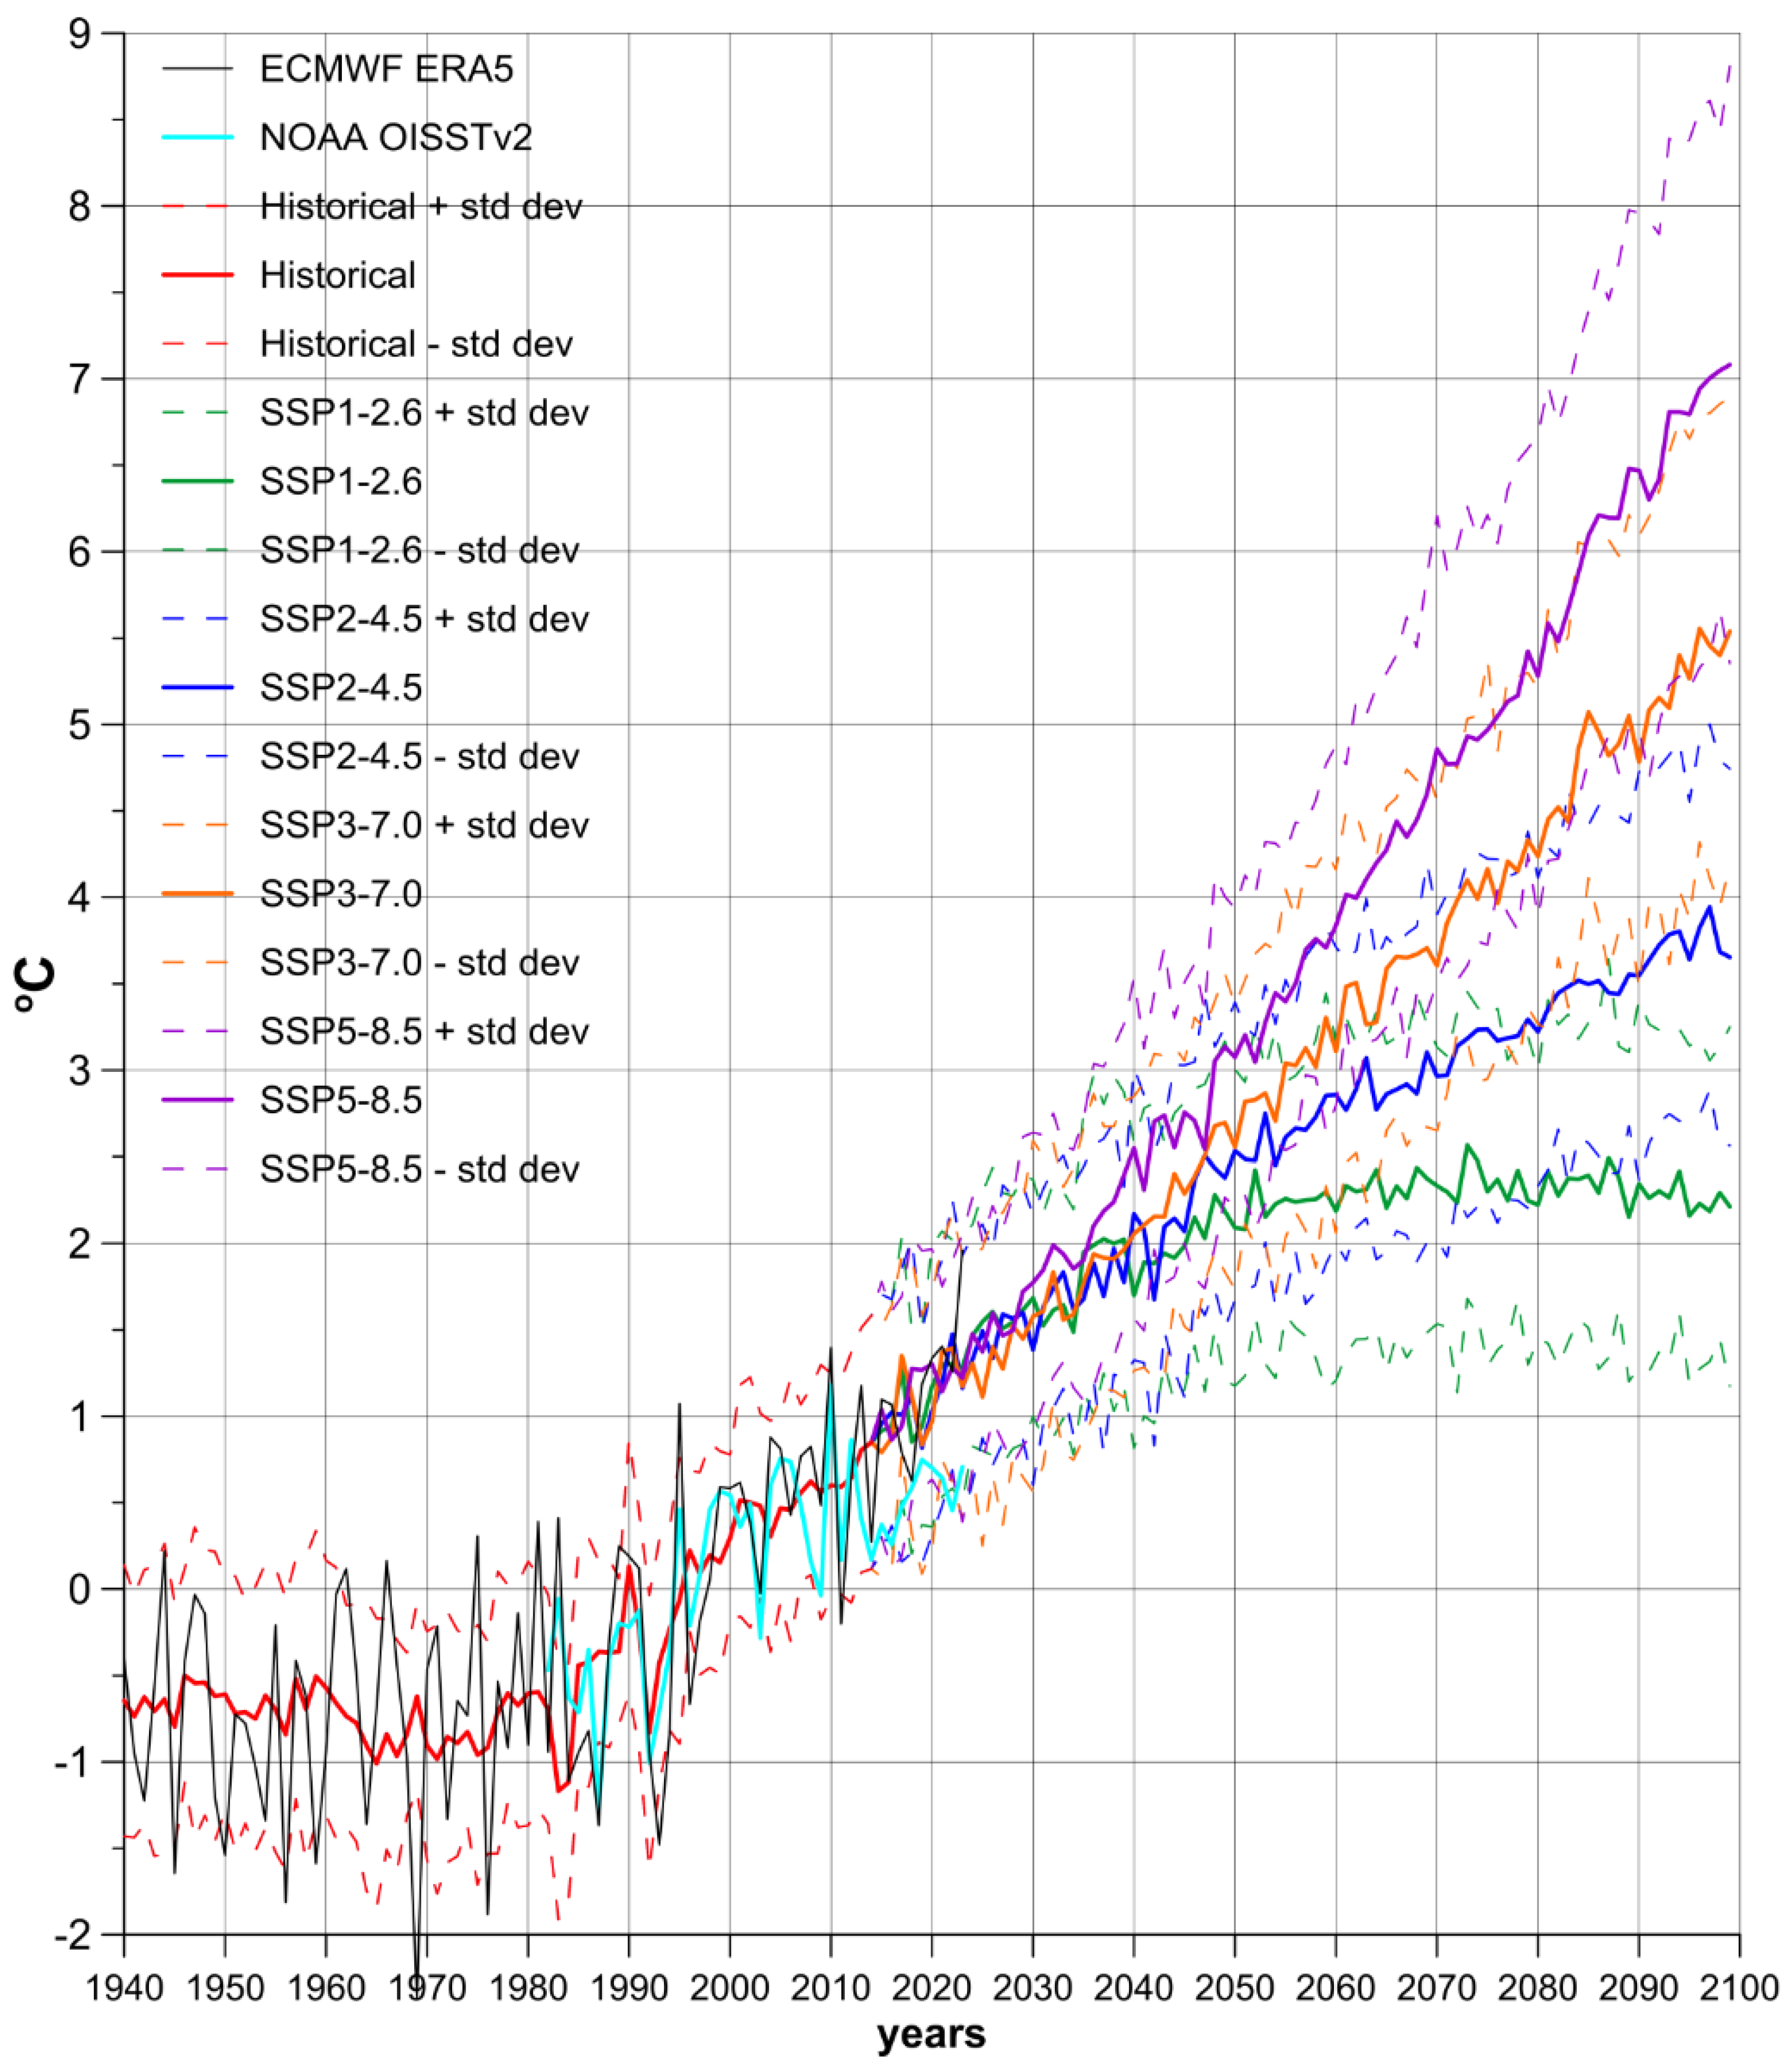
Annual mean NSAT anomalies from the ERA5 reanalysis varied considerably in the Caspian Sea region from 1940 to 2023 (Figure 4, black line). Long-term (interdecadal) NSAT changes in the study region were uneven, with a period of weak dynamics from the 1940s to the mid-1980s followed by rapid warming to the present. This warming trend since the mid-1980s is supported by weather station data (Table 1, Table 2, Table 3, Table 4 and Table 5, Figure 2 and Figure 3) and Caspian Sea SST changes from NOAA OISSTv2 satellite data (Figure 4, blue line). The NSAT changes from NASA MERRA-2 and NCEP/NCAR reanalyses were similar to those from ERA5 and OISSTv2.
Pearson correlation analysis (Table 6) was conducted for the mean NSAT values of the northwestern Caspian region (Russia) (Figure 2). High significant correlation (r = 0.8) was found between meteorological station data and ERA5 reanalysis. The ensemble of 33 CMIP6 models also showed a significant correlation with the station data (r = 0.6) for the common period of 1960–2014 (55 years). Over the entire historical period of 1940–2014 (75 years), the correlation between ERA5 reanalysis and the CMIP6 model ensemble was also significant (r = 0.6) (Figure 4).
Since the 2010s, the rate of NSAT increase in the Caspian Sea has slowed compared to the entire study region. From 1982 to 2023, NSAT increased at an average rate of 0.54 °C/decade across the entire study region, but at only 0.33 °C/decade for the SST of the Caspian Sea. This may be attributable to a stabilizing effect of the Caspian Sea on regional warming by absorbing excess heat in its upper water layer. The correspondence between NSAT and SST trends was stronger during the 1980–2010 period than after 2010. However, linear trends provide a rough estimate of the warming rate due to the non-linear nature of the changes and the sensitivity of the least squares method to extreme values, which are affected by strong interannual temperature variability.

3.3. CMIP6 Models

The average NSAT of the Caspian region from the historical experiment of the 33 CMIP6 ESM ensemble (Figure 4, red line) exhibits interdecadal variations similar to ERA5. The ESM ensemble captures the small NSAT changes from the 1940s to the mid-1980s and the substantial NSAT increase from the mid-1980s to the present. Individual ESMs do not always accurately reproduce the natural modes of climate variability, and averaging across the ensemble suppresses this natural climate variability. This is evident in the weak interannual fluctuations of the average NSAT for the multi-model ensemble (Figure 4, red line). Table 7 (Column 3) presents the changes in the average NSAT of the Caspian region between the 30-year periods of 1940–1969 and 1994–2023 for each of the 33 CMIP6 ESMs from the historical and SSP2-4.5 experiments, along with their minimum, maximum, average, and standard deviation values. Any SSP experiment could have been selected instead of SSP2-4.5, as their results are nearly identical for 2015–2023. From 1940–1969 to 1994–2023, the average NSAT increase in the study region was 1.31 °C according to the 33 CMIP6 ESM ensemble, with a standard deviation of 0.48 °C (Table 7), consistent with ERA5 data. Notably, the interannual variability of NSAT anomalies from the ERA5 reanalysis falls almost entirely within the intermodel spread of the 33 CMIP6 ESM ensemble (Figure 4, dashed lines). Furthermore, all 33 ESMs reproduce the increase in average NSAT in the study region between 1940–1969 and 1994–2023.
Some of the considerable interannual NSAT variability observed by ERA5 in the Caspian region (Figure 4, black line) may be linked to modes of natural climate variability like the El Niño–Southern Oscillation (ENSO) and the NAO [33]. This is supported by the fact that ensemble averaging suppresses this natural climate variability, although it is present in individual ESM results, evidenced by the significant standard deviation (averaging 0.5°C) of NSAT anomalies across the ESM ensemble. Weather station data, ERA5, OISSTv2, and the 33 CMIP6 ESM ensemble average of the historical experiment results all show significant cooling in 1992–1993 (Figure 2, Figure 3 and Figure 4). Since the multi-model NSAT averages suppress natural climate variability but retain the influence of external forcing, the local temperature minimum of 1992–1993 can be attributed to the 1991 eruption of Mount Pinatubo, which released large amounts of aerosols into the atmosphere, reducing incoming solar radiation. The multi-model NSAT averages (Figure 4, red line) and weather station data from the Caspian Sea region (Figure 2 and Figure 3) also exhibit NSAT decreases lasting several years in the 1960s and 1980s, likely caused by the eruptions of the Agung (1963) and El Chichón (1982) volcanoes. However, the ERA5 NSAT time series (Figure 4, black line) does not clearly show these minima, possibly due to the superposition of antiphase interannual variability, which is suppressed in the multi-model ensemble but present in weather station data and reanalyses.
The results show that interdecadal changes in average NSAT time series from ERA5 and the historical–SSP experiments of the 33 CMIP6 ESM ensemble for 1940–2023 generally agree well, lending confidence to ESMs-based NSAT projections through the end of the 21st century. This agreement is further supported by the similar NSAT increases from 1940–1969 to 1994–2023 based on weather station data and the historical–SSP experiments of the 33 CMIP6 ESM ensemble (Table 3 and Table 7). Figure 4 presents the average values (solid lines) and variability range (dashed lines) of annual NSAT anomalies in the study region for scenarios SSP1-2.6, SSP2-4.5, SSP3-7.0, and SSP5-8.5 from the 33 CMIP6 ESM ensemble for 2015–2099. Variability boundaries were defined as the ensemble average NSAT for a given scenario plus (upper boundary) and minus (lower boundary) one standard deviation of the annual NSAT anomalies from these 33 CMIP6 ESMs. All SSP scenarios examined project a warming trend in NSAT, both when averaged across the ensemble and in individual ESMs. As anticipated, the rate of warming accelerates with increasing CO2 emissions (Figure 4, Table 7). Nevertheless, the projected increase in average NSAT remains relatively consistent across all SSP scenarios until approximately 2040, with a projected increase ranging from 1.24 to 1.67 °C (standard deviations: 0.36–0.46 °C) between the periods 1994–2023 and 2024–2053 (Table 7). The SSP1-2.6 scenario envisions immediate and substantial reductions in anthropogenic CO2 emissions, leading to net-zero emissions by 2075, resulting in a stabilization of NSAT in the latter half of the 21st century, both globally [2] and within the Caspian Sea region (Figure 4). Under SSP2-4.5, emissions are projected to gradually decline throughout the 21st century. Conversely, SSP3-7.0 and SSP5-8.5 forecast increasing emissions, doubling and tripling their levels, respectively, by century’s end. Consequently, the projected increases in regional average NSAT are 1.70, 2.83, 4.06, and 5.26 °C, respectively, with intermodel standard deviations of 0.68–1.20 °C. Similar results are observed across the individual ESMs simulations (Table 7).
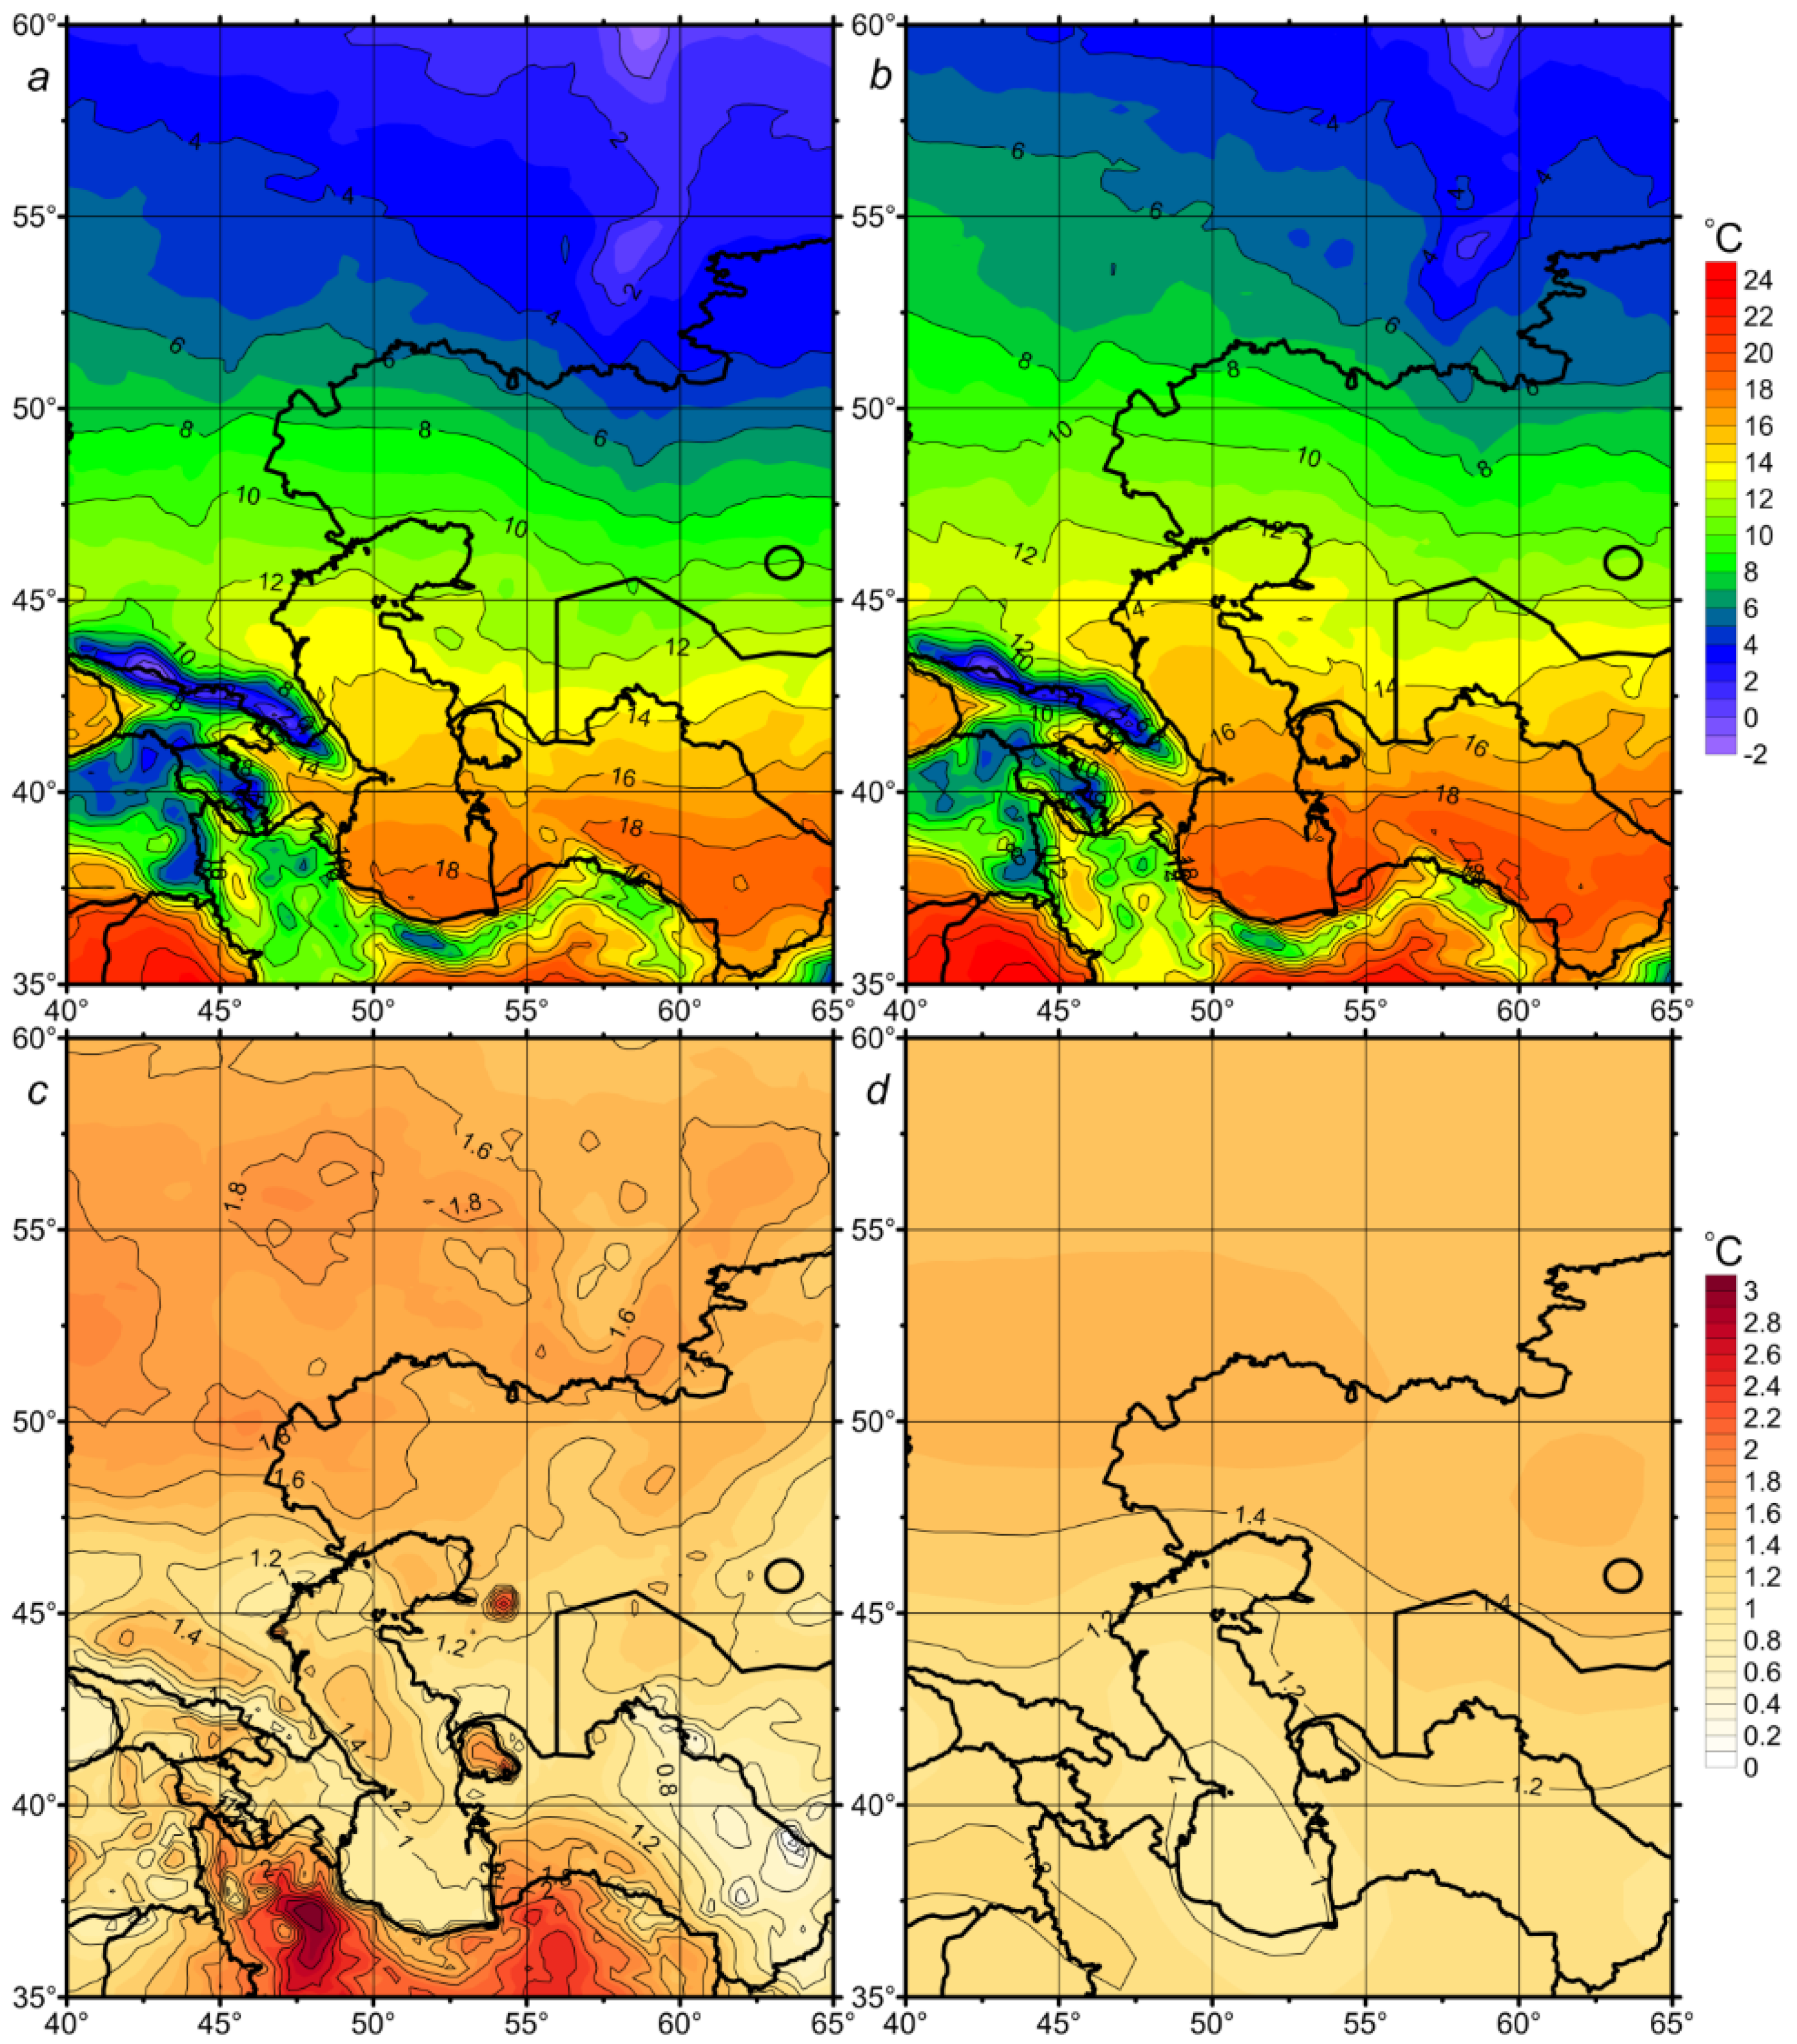
The analysis, which compared average NSAT values from weather stations and the ERA5 reanalysis over the 1994–2023 period (Table 1, Table 2, Table 3, Table 4 and Table 5, Figure 5), demonstrated a strong agreement in both the magnitude and temporal pattern of maximum and minimum NSAT values, particularly in the area west of the Caspian Sea. NSAT variations within the Caspian region exhibited significant spatial and temporal heterogeneity between 1940 and 2023 (Figure 5). Over the period under study, the increase in NSAT was more pronounced in the northern (by ~1.6 °C) than in the central part of the Caspian region (Figure 5a–c). The most substantial warming, based on ERA5 data, occurred in the mountainous regions of Iran, showing an increase of up to 3.0 °C between 1940–1969 and 1994–2023. The spatial distribution of NSAT changes simulated by the 33 CMIP6 ESM ensemble (Figure 5d), using the historical and SSP2-4.5 experiments, closely mirrored the patterns derived from ERA5 reanalysis (Figure 5c). However, the ESMs simulations did not capture some fine-scale spatial details, especially within the mountainous areas of the southern part of the study area, due to the models’ limited spatial resolution. Notably, the 33 CMIP6 ESM ensemble reproduced greater warming changes in the northern Caspian Sea region (more than 1.4 °C) compared to the central, including over the water (about 1.2 °C) (Figure 5d). This warming peculiarity was consistent with ERA5 reanalysis (Figure 5c). This confirms that the CMIP6 ESMs accurately represent the observed NSAT changes within the Caspian Sea region from 1940 to 2023. While the NSAT differences between the various SSP scenarios were negligible during the 2015–2023 period, they become more pronounced by the end of the 21st century (Figure 4).
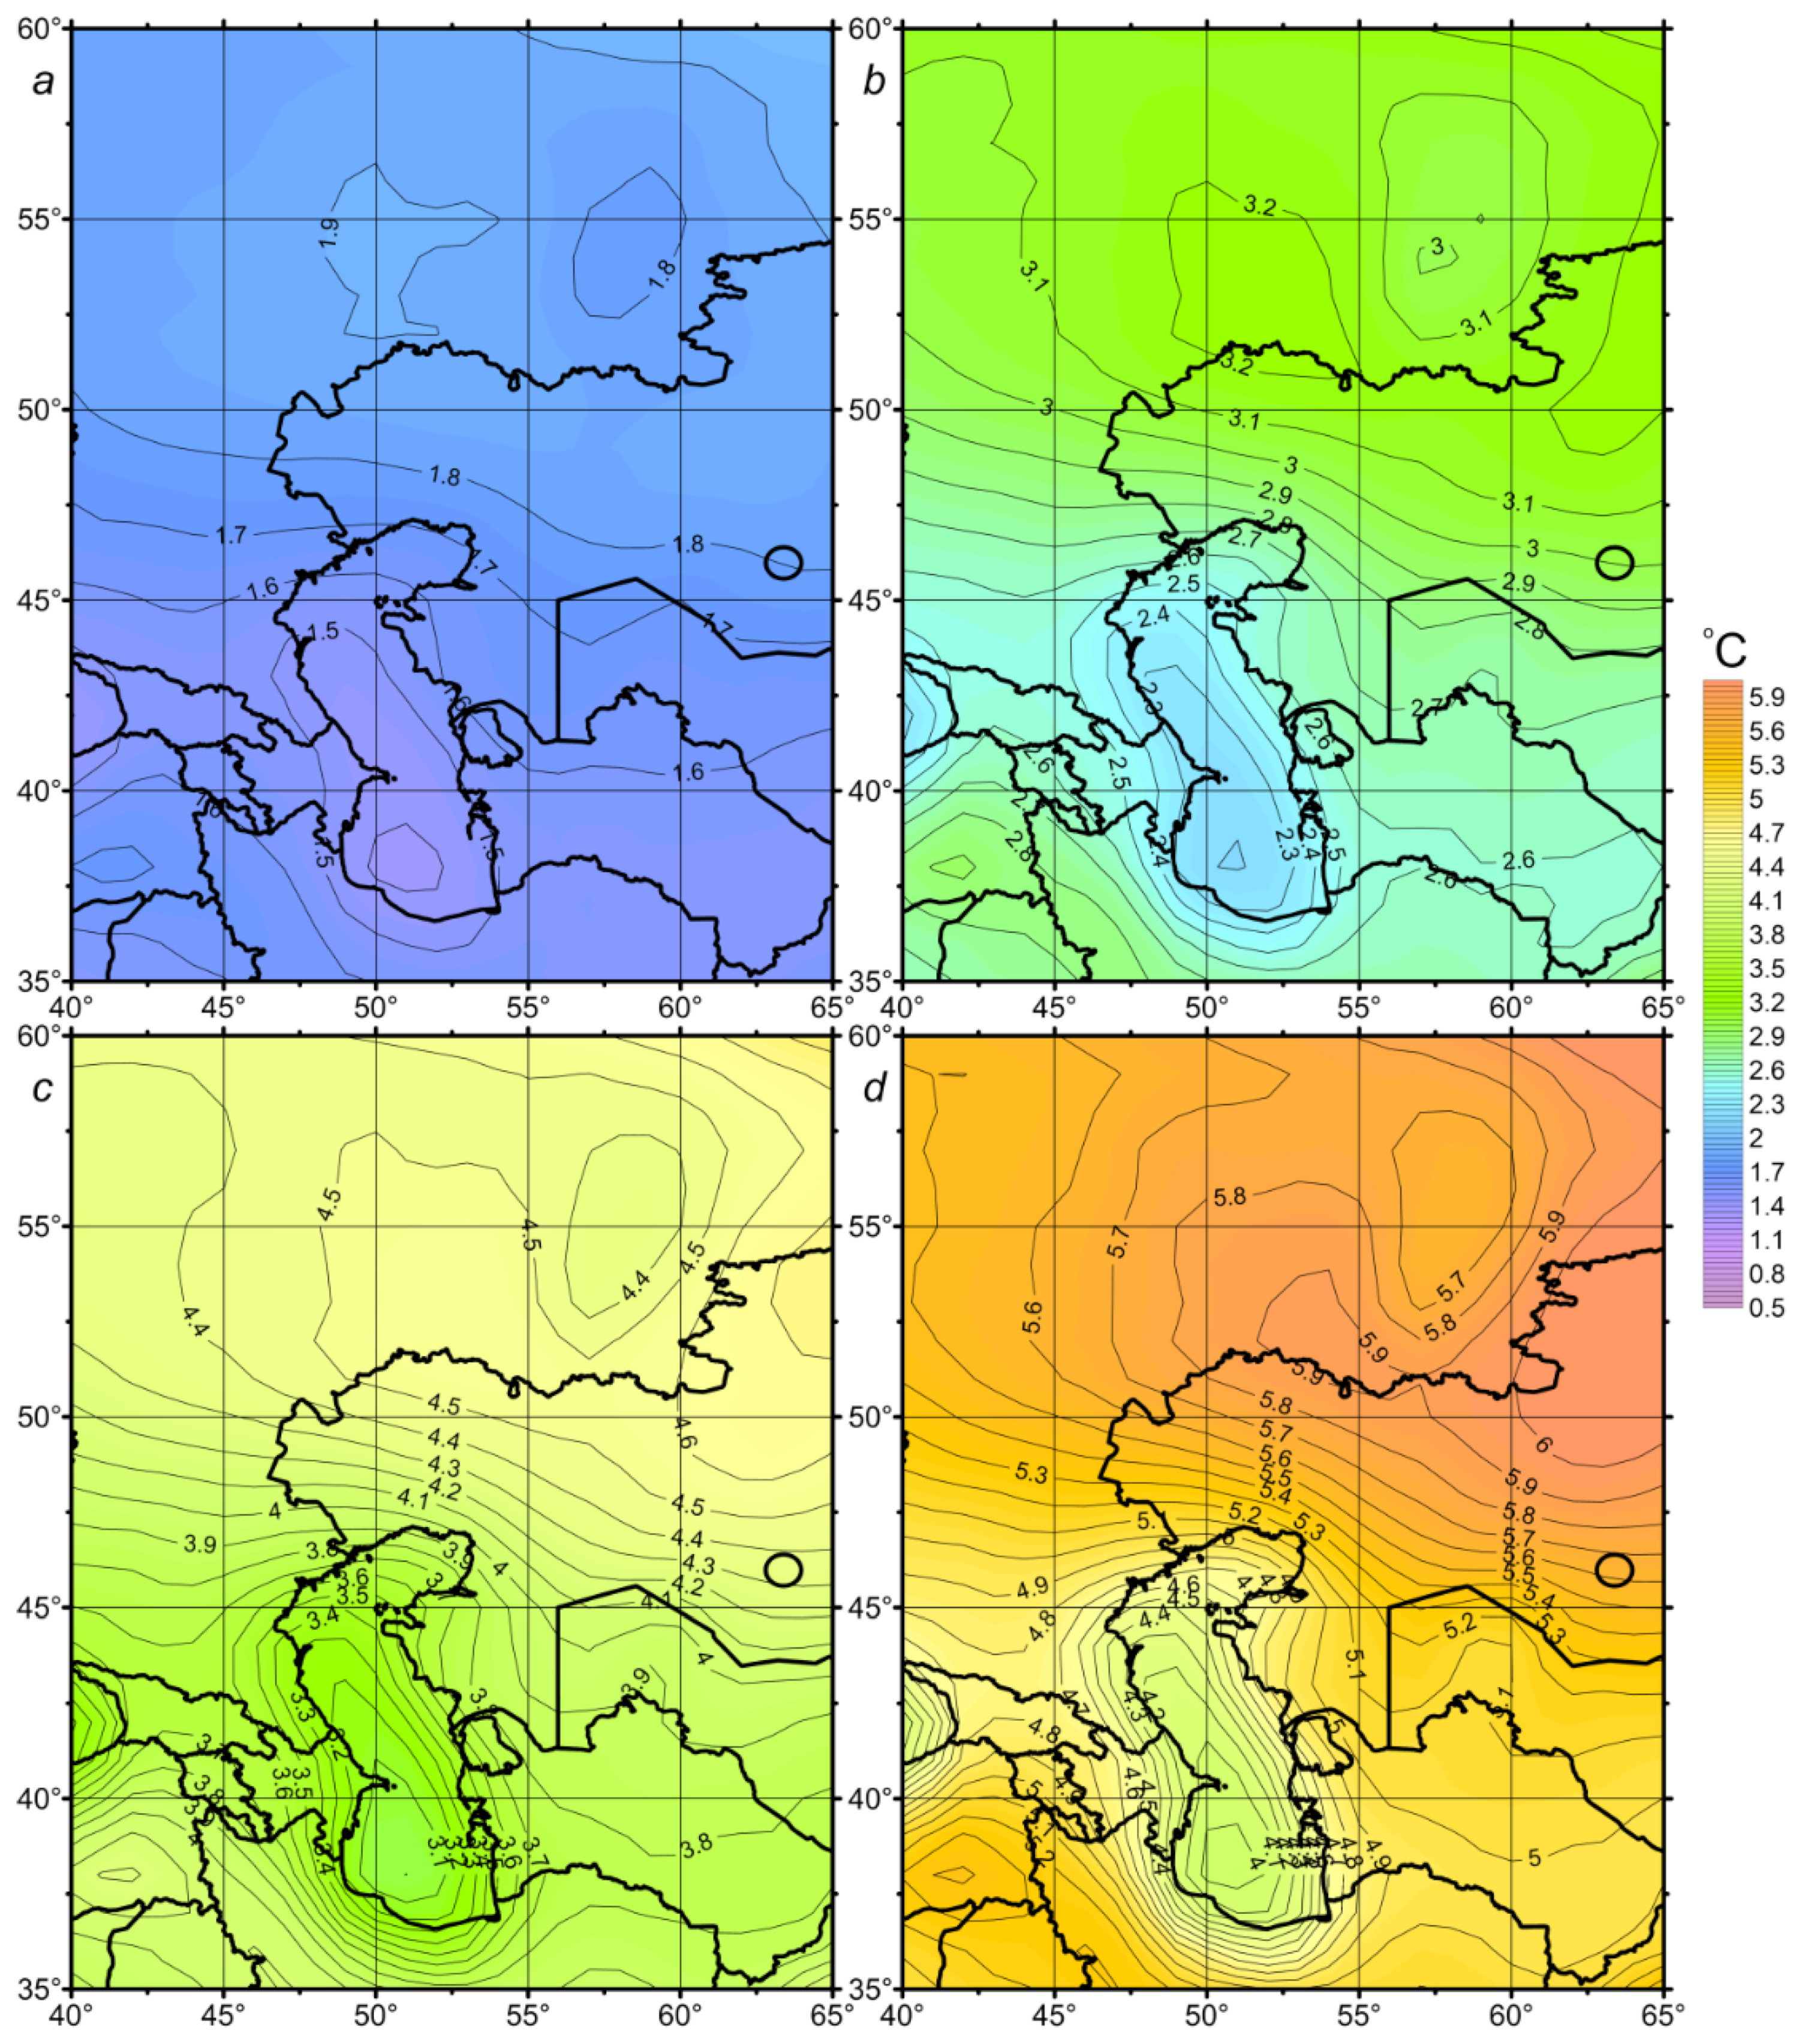
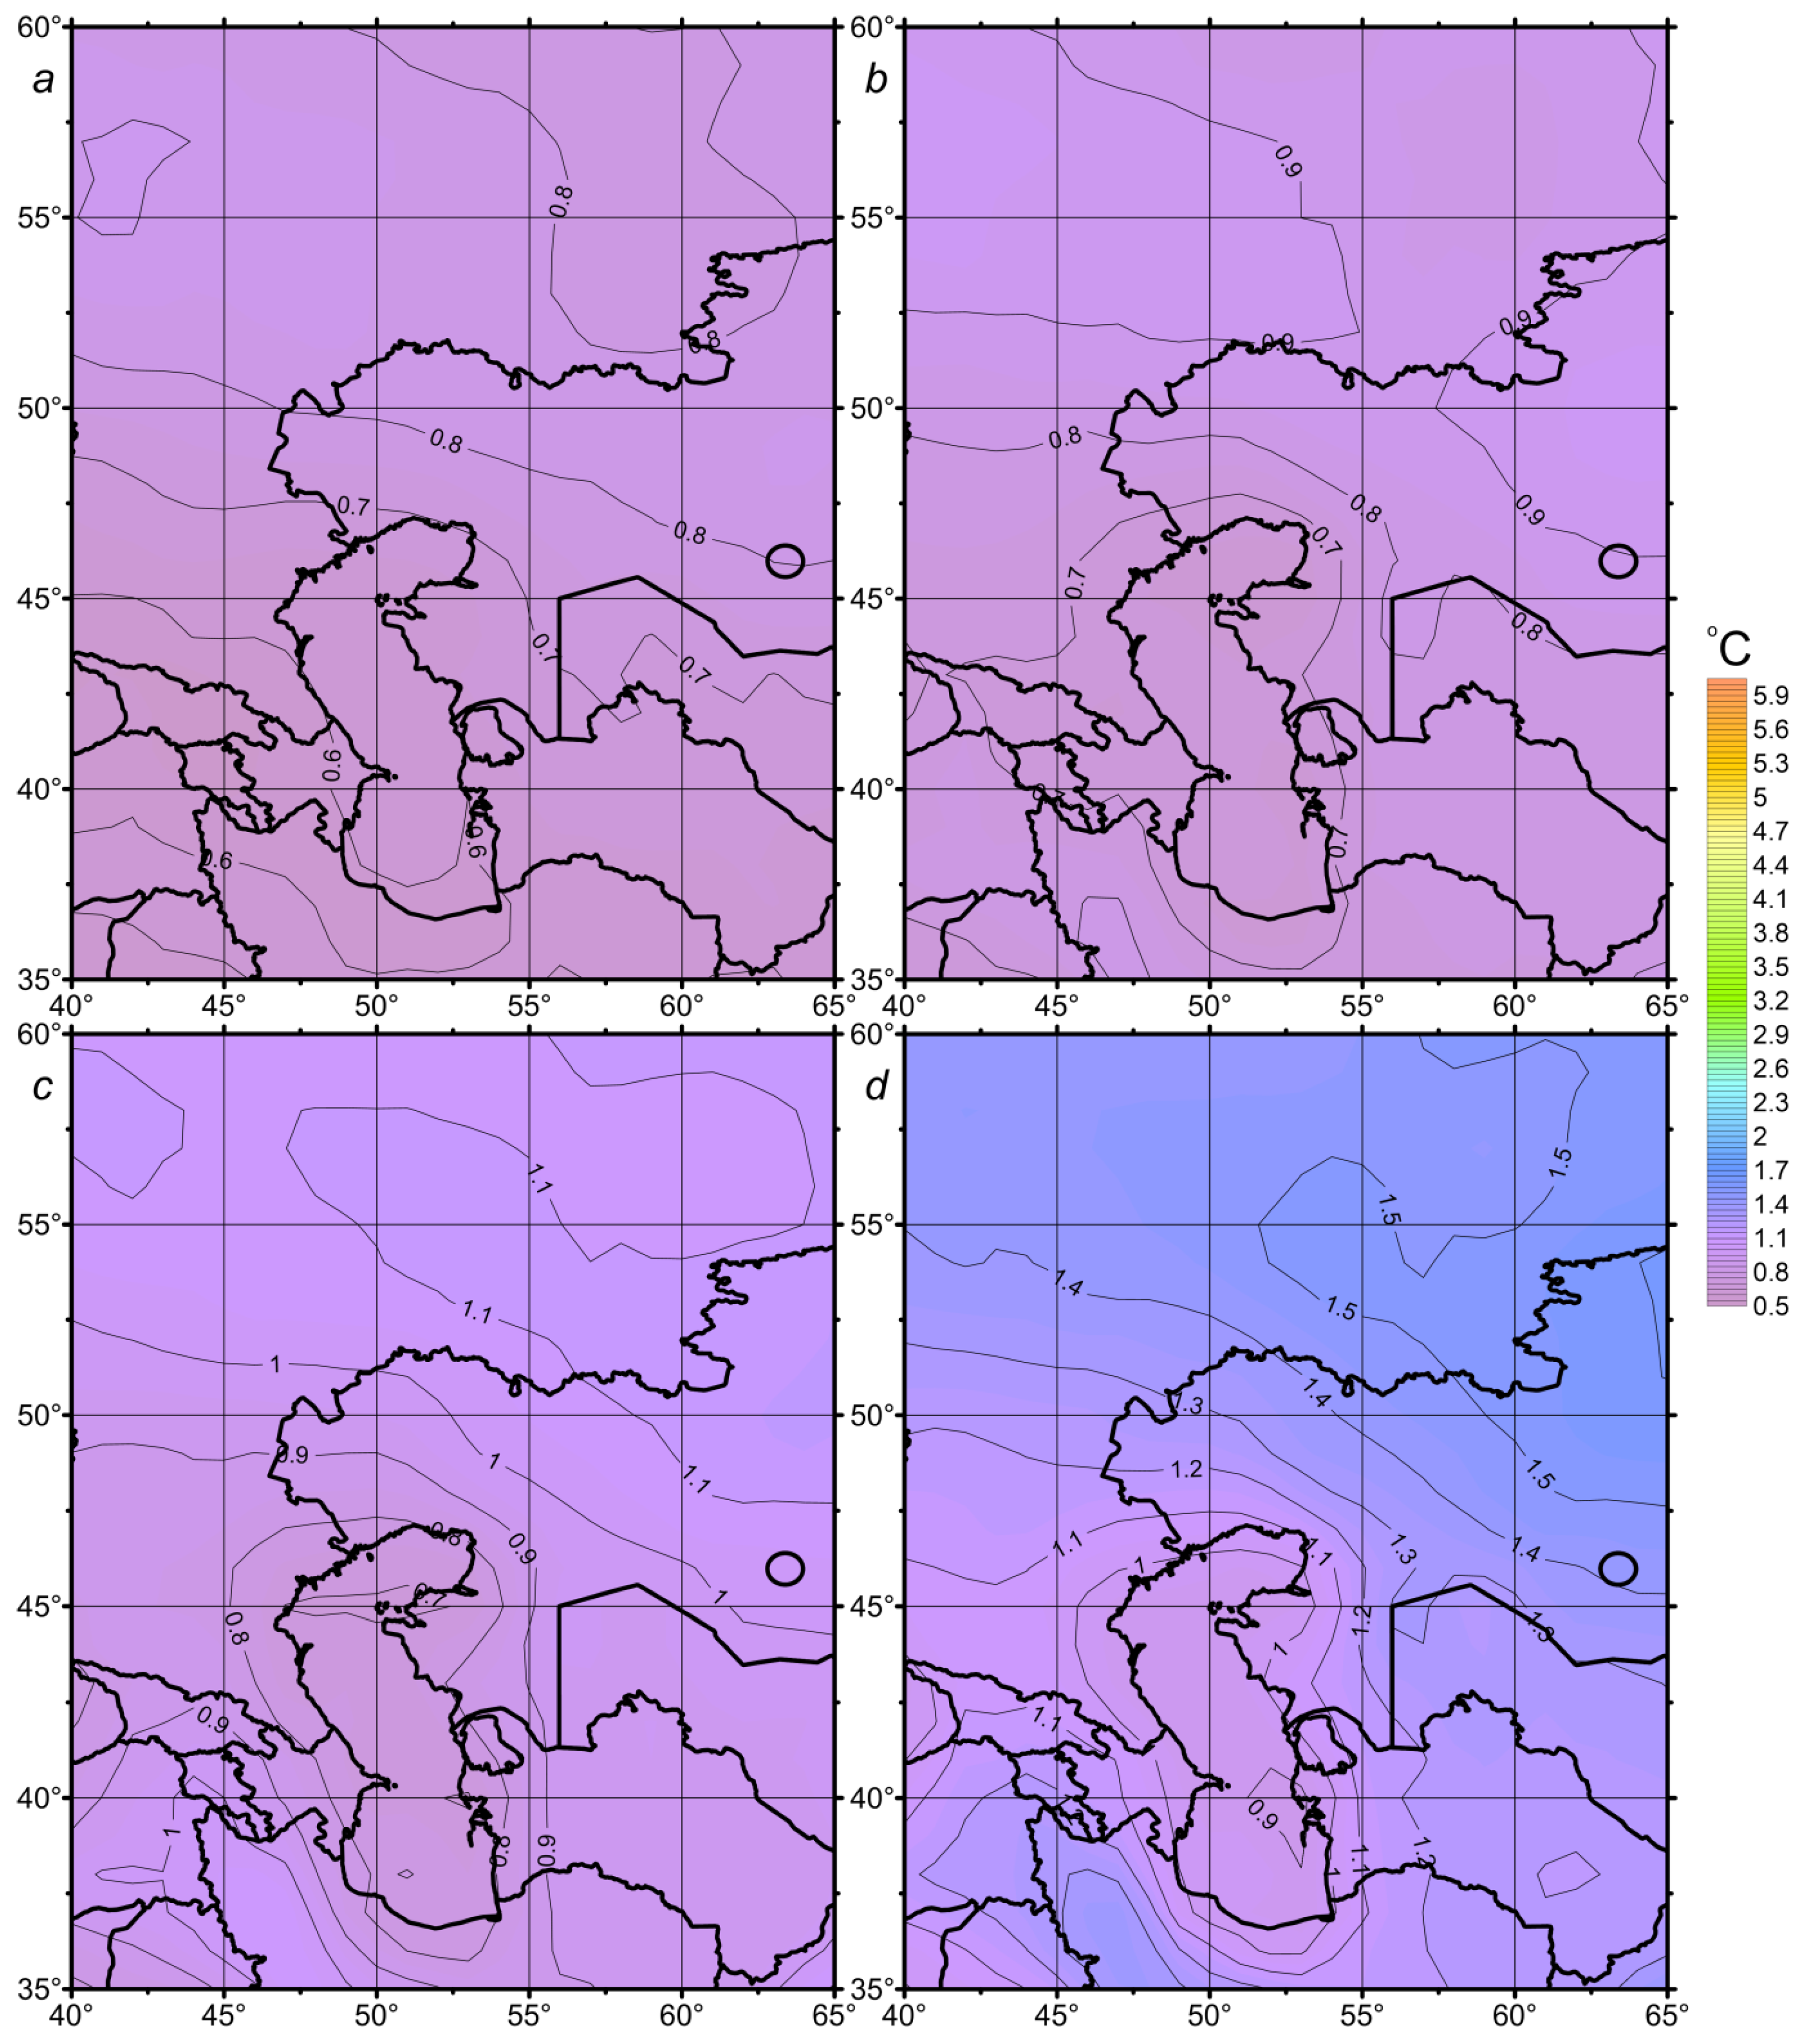
An analysis of the change in the average NSAT field simulated by 33 CMIP6 ESMs between the periods of 1994–2023 and 2070–2099 for the SSP1-2.6 scenario suggests that immediate and substantial global greenhouse gas emission reductions, as prescribed by the SSP1-2.6 scenario, would result in a Caspian Sea region NSAT increase of approximately 1.5–1.8 °C (with a standard deviation of 0.6–0.8 °C) by the end of the 21st century, relative to the start of the century (Figure 6a and Figure 7a). The increase in NSAT (Figure 6a), and the associated standard deviation amongst the ESMs (Figure 7a), is not spatially homogeneous. SSP1-2.6 projections indicate the most significant NSAT increase will be in the northern part of the studied region (approximately 1.8 °C), where the highest standard deviation values (~0.8 °C) were also observed. It is important to note that the NSAT change estimates provided here and elsewhere are approximate; more precise values are given in Table 6. Given the substantial intermodel variability, high accuracy is not expected from the CMIP6 ESM ensemble projections. Despite the SSP1-2.6 scenario projecting atmospheric carbon dioxide (CO2) concentrations at approximately the 2020 year level by the end of the 21st century, the average NSAT of the Caspian region is projected to continue increasing until around the mid-21st century (Figure 4), and then stabilize in the latter half of the century. This NSAT increase until approximately the 2050s can be attributed to the continued increase in global temperatures projected under SSP1-2.6 until that time [2]. We view SSP1-2.6 as the most optimistic but least likely scenario, as it requires global CO2 emissions to have begun declining in the 2020s, which is unfortunately not yet occurring.
Under the SSP2-4.5 scenario, which features a gradual reduction in global greenhouse gas emissions starting in the mid-21st century, the NSAT in the Caspian region will increase more substantially by the end of the century (Figure 6b) compared to SSP1-2.6 (Figure 6a). The projected increase in average NSAT for the study region is approximately 2.4–3.2 °C under SSP2-4.5, with values of about 3.2 °C in the north and around 2.4 °C over the Caspian Sea. The intermodel spread remains similar to SSP1-2.6—approximately 0.7–0.9 °C (Figure 7b). Despite the decline in global CO2 emissions under SSP2-4.5, the average NSAT in the Caspian region is projected to continue rising throughout the 21st century (Figure 4), though the rate of increase will slow in the second half of the century. We consider SSP2-4.5 to be more plausible than SSP1-2.6, given its alignment with current commitments regarding greenhouse gas emission reductions.
The SSP3-7.0 scenario assumes continued increases in global greenhouse gas emissions through the end of the 21st century, which would lead to significantly higher concentrations of greenhouse gases in the atmosphere compared to current levels. Under this high-emission scenario, the projected warming over the Caspian Sea would be approximately 3.3 °C, and nearly 5.8 °C in the northern part of the study region (Figure 6c). The intermodel spread of the temperature projections is slightly higher than under previous scenarios, ranging from 0.8 to 1.1 °C (Figure 7c). The changes in global CO2 emissions under SSP3-7.0 represent a direct linear extension of the trends observed in the latter half of the 20th century and the early part of the 21st. Without concerted global efforts to reduce greenhouse gas emissions, this negative, and unfortunately plausible, scenario is likely to materialize.
The SSP5-8.5 scenario assumes the most rapid increase in atmospheric greenhouse gas concentrations, with a correspondingly large impact on the average NSAT of the Caspian region by the end of the 21st century. This scenario projects the highest warming in the northeast of the study area (approximately 5.8 °C), with the NSAT increasing by approximately 4.5 °C over the Caspian Sea (Figure 6d). The intermodel spread, ranging from 1.0 to 1.5 °C, is also higher than in the SSP3-7.0 scenario (Figure 7d). Although the SSP5-8.5 scenario represents an extreme future climate, it becomes plausible if past increases in anthropogenic CO2 emissions are approximated and projected using an exponential, rather than linear, extrapolation.
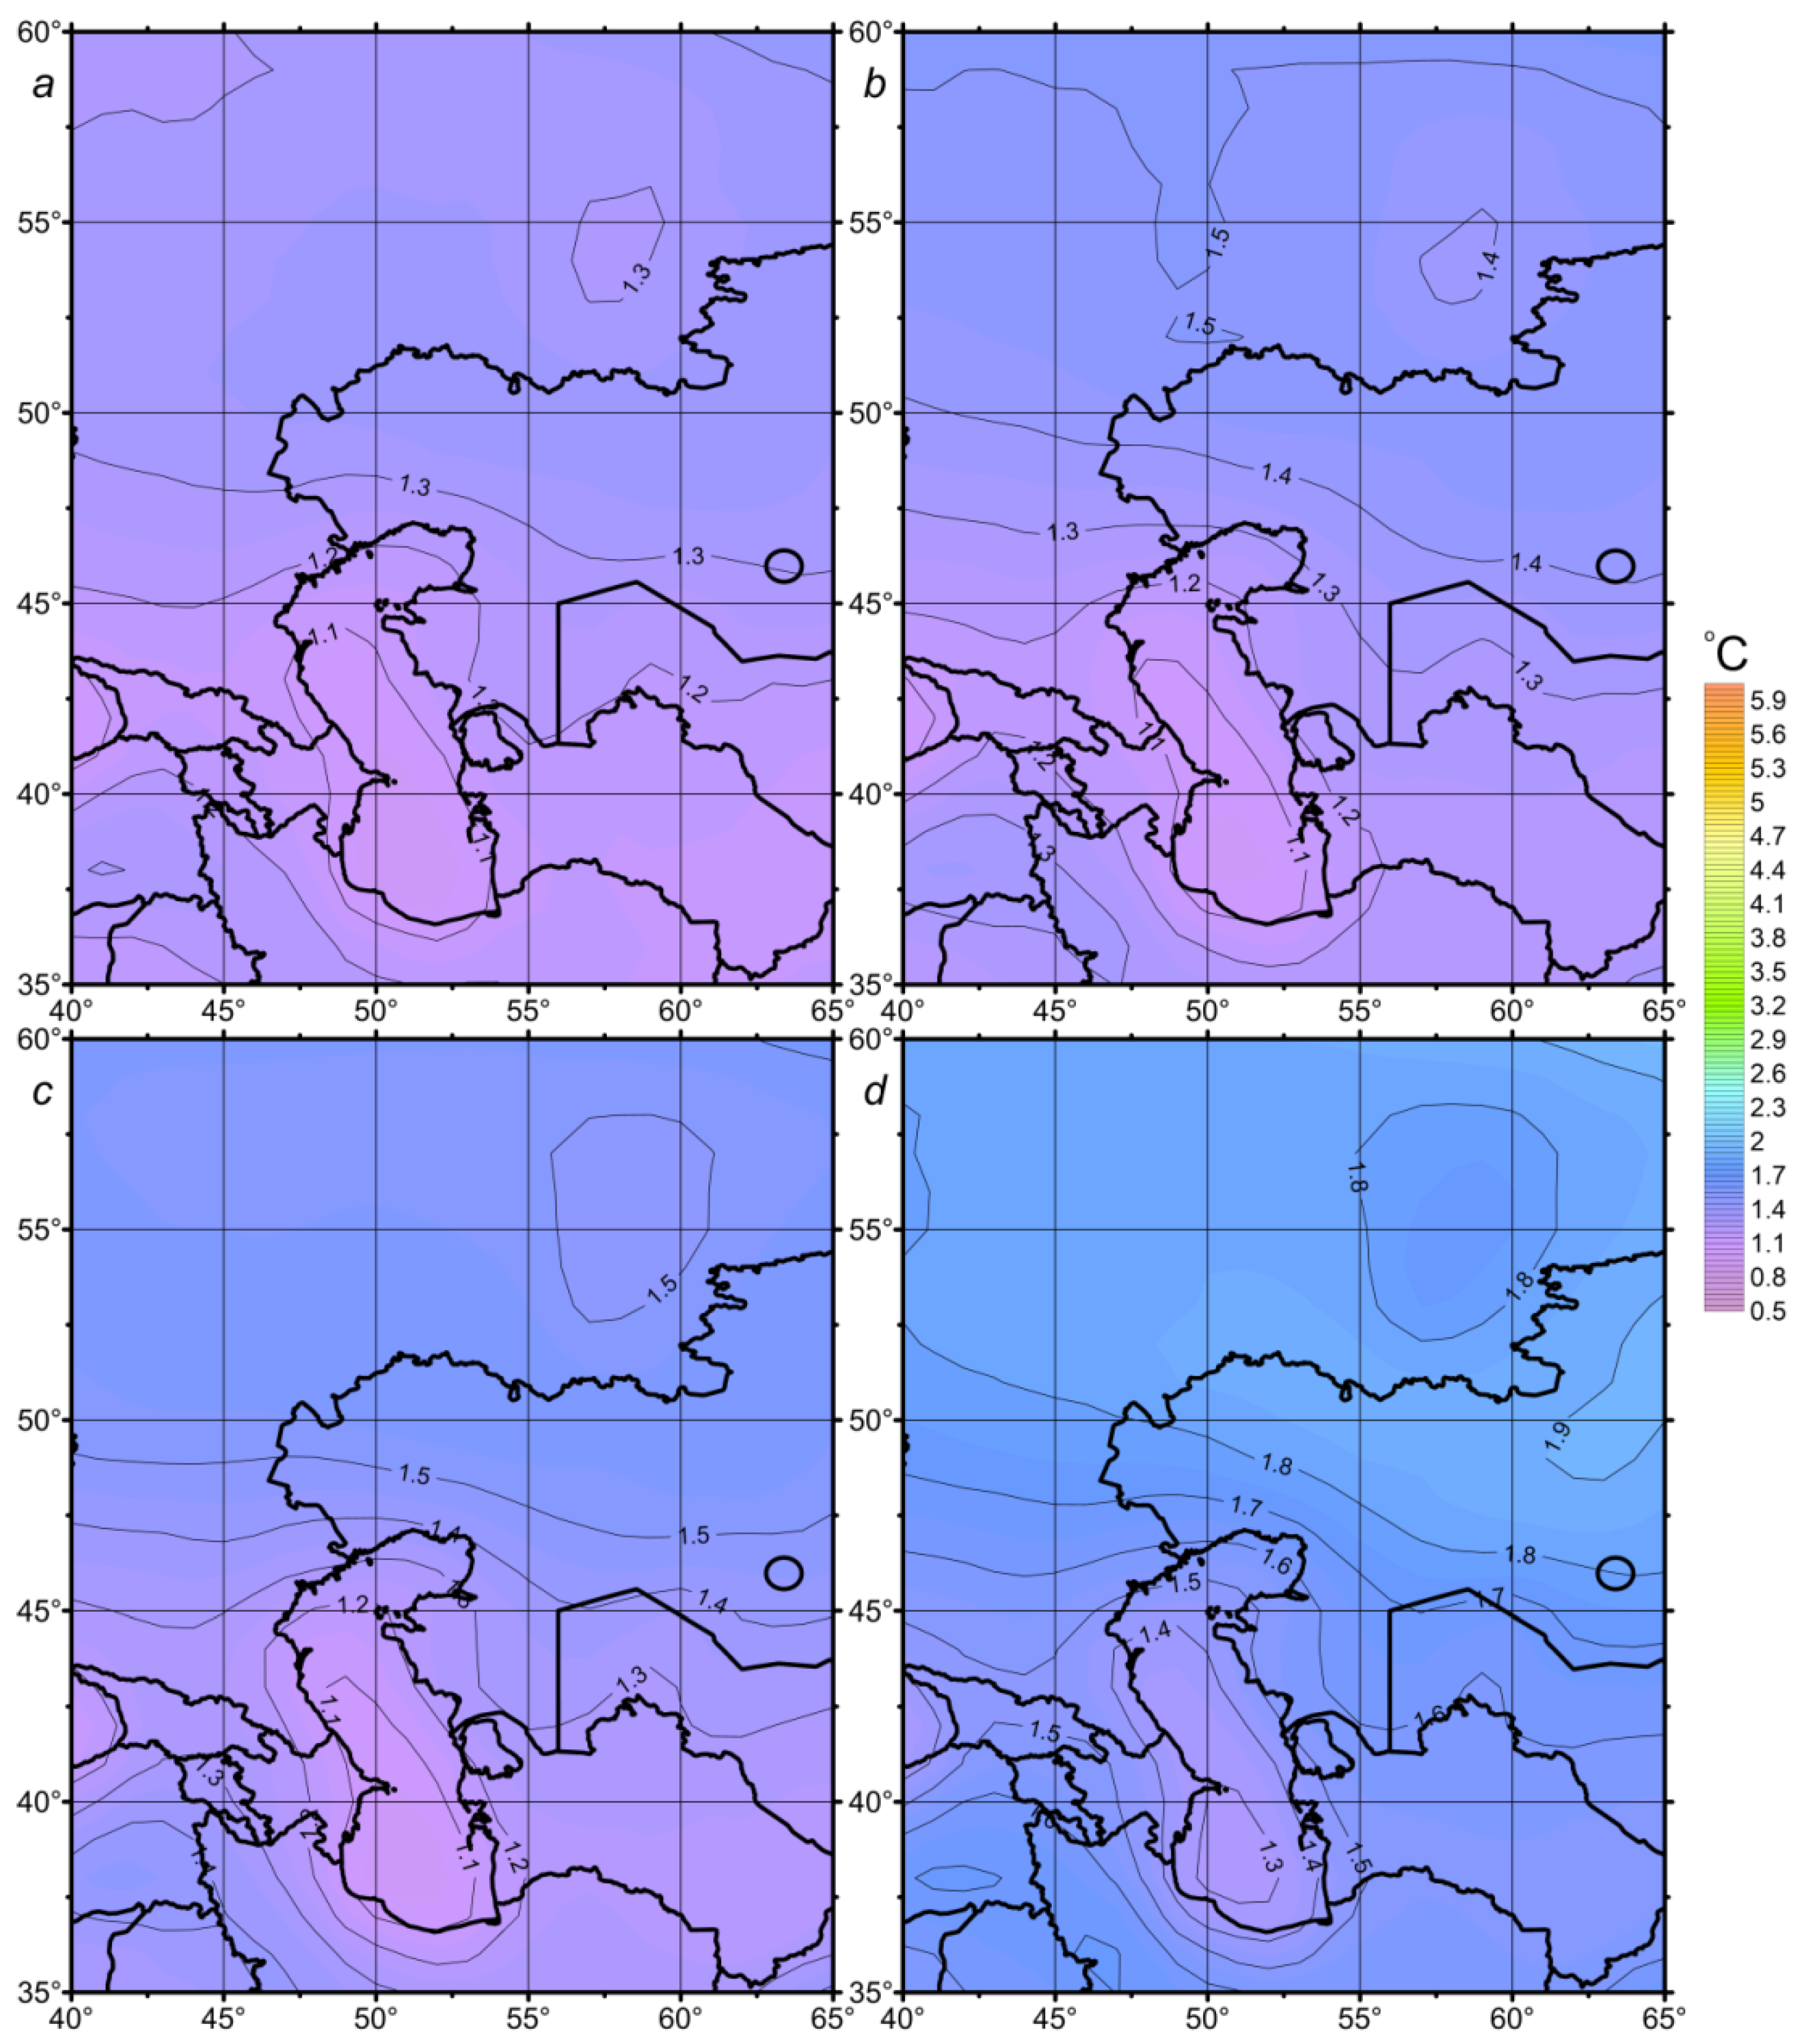
Recognizing the significant practical relevance of climate change in the coming decades, we conducted additional calculations focused on changes in the average NSAT in the Caspian region under each of the considered SSP scenarios. This involved comparing the 30-year periods of 1994–2023 and 2024–2053, based on simulations from the ensemble of 33 CMIP6 ESMs (Figure 8). These simulations indicate that the average NSAT across the Caspian region is likely to rise by approximately 1.1–1.8 °C over the next 30 years. The northern portion of the study area is projected to experience an NSAT increase exceeding 1.3 °C, while regions over the Caspian Sea are projected to warm by approximately 1.1–1.3 °C. Importantly, we found no significant differences in projected near-term NSAT changes across the different SSP scenarios.
4. Discussion

The long-term NSAT trends derived from weather station data in this study support the conclusion that the climate of the Caspian region is warming. Furthermore, the rate of NSAT increase has accelerated in recent decades, a finding corroborated by other research. The NSAT trend from 2003 to 2017 was +0.04 °C/year. The average SST trend from 2003 to 2017 was +0.059 °C/year (with trends of +0.050, +0.067, +0.087, and +0.106 °C/year in the Northern, Middle, and Southern Caspian, and the Kara-Bogaz-Gol Bay, respectively) [7]. The increase in NSAT from weather station data for 1990–2015 compared to the baseline period of 1980–1989 was 1.1 °C, and 1.4 °C for 2000–2015 [6]. A separate analysis of the cold season (November–March) showed an NSAT increase of 1.3 °C and 1.6 °C compared to the 1980–1989 baseline [6]. The average annual NSAT in the Caspian region (sea and adjacent areas) increased nearly monotonically over the 41-year period from 1980 to 2020 at a rate of 0.03 °C/year, resulting in an overall increase of 1.2 °C. SST warming was even greater, at approximately 1.4 °C [12]. Furthermore, the maximum summer and minimum winter average monthly values of both NSAT and SST were higher in the 2000s compared to the 1980s–1990s, and the frequency of mild winters increased [12]. Research suggests that by the end of the 21st century, winters will primarily be classified as mild or very mild, with a stable ice cover persisting only in the northeastern part of the sea [15].
Average annual SST trends from 1982 to 2020 reveal regional variability in the Caspian Sea. Warming rates were +0.026 °C/year in the Northern Caspian, +0.042 °C/year in the Middle Caspian, +0.034 °C/year in the Southern Caspian, and +0.035 °C/year for the entire sea. The strongest warming was observed in the western part of the Middle Caspian Sea, while the weakest was found in the northeastern part of the Northern Caspian and along the Turkmen shelf zone. The decreasing trends of both NSAT and SST from 1980/1982 to 2020, when compared with the earlier period spanning from 1980/1982 to approximately 2010, alongside a lack of increase in average annual SST values after 2010, suggest a slowing of Caspian Sea warming during the second decade of the 21st century. This recent slowdown in NSAT increase in the Caspian Sea may be linked to shifts in regional atmospheric circulation patterns [9,11,34].
The catastrophic summer drought that affected European Russia in 2010 [14] is also evident in the weather station data from the Caspian region presented in this study. Consequently, the Volga River’s discharge declined sharply over the subsequent two years [14]. Analysis of the NCEP/NCAR reanalysis data from 1948 to 2017 reveals three time intervals, each lasting 10–25 years, with varying trends in hydrometeorological parameters, including NSAT, indicative of interdecadal variability. Air warming/cooling phases correlate with weakening/strengthening of eastward wind transport [9,10].
A time lag of approximately 6–8 years exists between shifts in atmospheric dynamic and thermal (including humidity) regimes. This suggests that large-scale changes in atmospheric forcing have a dominant role in driving regional climate variability. Specific air humidity is positively correlated with air temperature, decreasing during cooling periods and increasing during warming. In contrast, relative humidity and fluctuations in precipitation intensity are negatively correlated with air temperature trends [10]. Intensification of eastward air transport, and the related cooling over the Caspian Sea, are linked to periods when NAO index decreases into negative values, while the East Atlantic–West Russia (EA-WR) pattern shows positive index values [10]. Fluctuations in the intensity of North Atlantic Ocean circulation patterns may also have an influence on the Caspian Sea level [35].
Projected climatic changes are anticipated to exert profound impacts on the socioeconomic and environmental systems of the Caspian Sea region. The identified warming trend, particularly under the SSP3-7.0 and SSP5-8.5 scenarios, threatens to fundamentally alter the ecology of the Caspian Sea, a unique and fragile endorheic basin. This vulnerability is compounded by ancillary stressors, including increasing urbanization, which can amplify negative climatic impacts through land-use change and localized pollution. The convergence of these pressures necessitates the development of robust adaptation strategies. Consequently, the international scientific and policy communities have increasingly prioritized the formulation of national adaptation plans and methodologies to enhance resilience to climate change and variability.

5. Conclusions

Using a range of data sources, including weather stations, NOAA OISSTv2 satellite measurements, ECMWF ERA5 reanalysis, and the 33-member CMIP6 climate model ensemble, this study demonstrates a consistent warming trend across the Caspian region during the period of reliable instrumental observations. A Mann–Kendall test (p < 0.05) confirms the statistical significance of the trend towards increasing NSAT. The analysis reveals that the average NSAT increased by 0.9 ± 0.2 °C during 1985–2023 at all weather stations examined in the northwestern portion of the Caspian region (Russia). In the central-western part of the Caspian region (Azerbaijan), the increase in average NSAT between 1940–1969 and 1994–2023 was 1.4 °C with a spatial standard deviation of 0.3 °C. NSAT in the southern part of the Caspian region (Iran) increased in all stations in the period 2005–2023 compared to the period 1986–2004 by 0.8 ± 0.1 °C on average.
Interdecadal changes in NSAT in the Caspian Sea region have been unevenly distributed over the study period. Weak, long-term NSAT variability was observed from the early 1940s to the mid-1980s, followed by a period of rapid warming that has continued, with brief interruptions, to the present. Since the 2010s, the rate of increase in Caspian Sea surface temperature (SST) has slowed, in contrast to the NSAT of the entire study region. From 1982 to 2023, the NSAT of the entire study region increased at an average rate of 0.54 °C per decade, while the SST of the Caspian Sea increased at a rate of 0.33 °C per decade. This is further supported by the finding that NSAT increases at weather stations located in the sea are somewhat lower (0.61–0.65 °C) than at stations located inland. This may be attributed to the stabilizing influence of the Caspian Sea on regional warming, due to the absorption of excess heat by the upper water layer.
The 33 CMIP6 ESM ensemble projects an NSAT increase of 1.3 ± 0.5 °C in the Caspian region between 1940–1969 and 1994–2023, which aligns with the ERA-5 reanalysis and meteorological station observations. Using Pearson’s correlation analysis, significant relationships (r > 0.6) were established between the mean NSAT series derived from weather station data, ERA5 reanalysis, and the 33 CMIP6 models for the common period of 1960–2014. The interannual variability of NSAT from weather station data and ERA5 reanalysis falls within the range of the 33 CMIP6 model ensemble, capturing the key features of weak changes during the period 1940–1980 and a rapid increase starting in the 1980s.
Analyzing the results from the 33-member CMIP6 ESM ensemble’s simulations under the SSP1-2.6, SSP2-4.5, SSP3-7.0, and SSP5-8.5 scenarios, the study projects an increase in the average NSAT of the Caspian region between the periods of 1994–2023 and 2070–2099. The projected increases are 1.7 °C, 2.8 °C, 4.0 °C, and 5.2 °C, respectively, depending on the specific SSP scenario. The intermodel standard deviations for these projections range from 0.7 to 1.2 °C. In the near term, between 1994–2023 and 2024–2053, the average NSAT is projected to increase by 1.2–1.7 °C, with a standard deviation of 0.4 °C. Notably, the warming over the Caspian Sea itself is projected to be less rapid than that over the surrounding land areas.

Author Contributions

Conceptualization, I.S., S.K., T.G. and R.G.; methodology, I.S. and S.K.; software, I.S.; validation, S.K., S.S., E.S., E.A.O. and Y.F.; formal analysis, I.S., S.K., S.S., E.S., E.A.O. and Y.F.; investigation, I.S., S.K., S.S., E.S., E.A.O., T.G., R.G. and Y.F.; resources, I.S., S.K., S.S., E.S., T.G., R.G., E.A.O. and Y.F.; data curation, I.S. and S.K.; writing—original draft preparation, I.S., S.K., S.S., E.S., T.G., R.G., E.A.O. and Y.F.; writing—review and editing, I.S., S.K. and T.G.; visualization, I.S.; supervision, R.G.; project administration, T.G. All authors have read and agreed to the published version of the manuscript.

Funding

This work was carried out within the framework of a large scientific project “Dynamics of the geoecological state of the mountain river basins of the North-Eastern Caucasus, Azerbaijan, and Iran under conditions of climate change and growing anthropogenic load” (Agreement of MSHE No. 075-15-2024-644).

Data Availability Statement

Dataset available on request from the authors.

Conflicts of Interest

The authors declare no conflicts of interest. The funders had no role in the design of the study; in the collection, analyses, or interpretation of data; in the writing of the manuscript; or in the decision to publish the results.

Abbreviations

The following abbreviations are used in this manuscript:
AMOAtlantic Multidecadal Oscillation
CMIPCoupled Model Intercomparison Project
CMIP6Coupled Model Intercomparison Project Phase 6
DAHITIDatabase for Hydrological Time Series of Inland Waters, NASA Giovanni
ENSOEl Niño–Southern Oscillation
ESMsEarth System Models
IPOInterdecadal Pacific Oscillation
NAONorth Atlantic Oscillation
NSATNear-Surface Air Temperature
SSPsShared Socioeconomic Pathways
SSTSea Surface Temperature
WMOWorld Meteorological Organization

References

  1. IPCC. Climate Change 2013: The Physical Science Basis. In Contribution of Working Group I to the Fifth Assessment Report of the Intergovernmental Panel on Climate Change; Stocker, T.F., Qin, D., Plattner, G.-K., Tignor, M., Allen, S.K., Boschung, J., Nauels, A., Xia, Y., Bex, V., Midgley, P.M., Eds.; Cambridge University Press: Cambridge, UK; New York, NY, USA, 2013; 1535p. [Google Scholar]
  2. Trisos, C.H.; Adelekan, I.O.; Totin, E.; Ayanlade, A.; Efitre, J.; Gemeda, A.; Kalaba, K.; Lennard, C.; Masao, C.; Mgaya, Y.; et al. Africa. In Climate Change 2022: Impacts, Adaptation, and Vulnerability. Contribution of Working Group II to the Sixth Assessment Report of the Intergovernmental Panel on Climate Change; Pörtner, H.-O., Roberts, D.C., Tignor, M., Poloczanska, E.S., Mintenbeck, K., Alegría, A., Craig, M., Langsdorf, S., Löschke, S., Möller, V., et al., Eds.; Cambridge University Press: Cambridge, UK, 2022. [Google Scholar]
  3. Eyring, V.; Bony, S.; Meehl, G.A.; Senior, C.A.; Stevens, B.; Stouffer, R.J.; Taylor, K.E. Overview of the Coupled Model Intercomparison Project Phase 6 (CMIP6) experimental design and organization. Geosci. Model Dev. 2016, 9, 1937–1958. [Google Scholar] [CrossRef]
  4. O’Neill, B.C.; Tebaldi, C.; Van Vuuren, D.P.; Eyring, V.; Friedlingstein, P.; Hurtt, G.; Knutti, R.; Kriegler, E.; Lamarque, J.F.; Lowe, J.; et al. The Scenario Model Intercomparison Project (ScenarioMIP) for CMIP6. Geosci. Model Dev. 2016, 9, 3461–3482. [Google Scholar] [CrossRef]
  5. Kosarev, A.N.; Kostianoy, A.G. Kara-Bogaz-Gol Bay. In The Caspian Sea Environment; Kostianoy, A., Kosarev, A., Eds.; The Handbook of Environmental Chemistry; Part P; Springer: Berlin/Heidelberg, Germany, 2005; Volume 5, pp. 211–221. [Google Scholar] [CrossRef]
  6. Ivkina, N.I.; Naurozbaeva, Z.; Klove, B. The impact of changing climate conditions on the ice regime of the Caspian Sea. Cent. Asian J. Water Res. 2017, 3, 12–23. [Google Scholar]
  7. Ginzburg, A.I.; Kostyanoy, A.G. Trends in changes in hydrometeorological parameters of the Caspian Sea in the modern period (1990s–2017). Mod. Probl. Remote Sens. Earth Space 2018, 15, 195–207. [Google Scholar] [CrossRef]
  8. Safarov, S.; Valizadeh Kamran, K.; Ismayilov, V.; Safarov, E. Detection of upwelling events in the Caspian Sea using thermal satellite image processing. Int. J. Eng. Geosci. 2024, 9, 247–255. [Google Scholar] [CrossRef]
  9. Serykh, I.V.; Kostyanoy, A.G. On the influence of the Atlantic and Pacific oceans on changes in climatic parameters of the Caspian Sea. Meteorol. Hydrol. 2020, 5, 96–107. [Google Scholar]
  10. Kazmin, A.S. Multidecadal variability of the hydrometeorological parameters in the Caspian Sea. Estuar. Coast. Shelf Sci. 2021, 250, 107150. [Google Scholar] [CrossRef]
  11. Safarov, S.H.; Ismayilov, V.G.; Safarov, E.S. Study of the surface temperature of the Caspian sea according to MERRA-2 reanalysis data for the period 1980–2021. ANAS Trans. Earth Sci. 2023, 2, 79–88. (In Russian) [Google Scholar] [CrossRef]
  12. Ginzburg, A.I.; Kostyanoy, A.G.; Serykh, I.V.; Lebedev, S.A. Climatic changes in hydrometeorological parameters of the Caspian Sea (1980–2020). Mod. Probl. Remote Sens. Earth Space 2021, 18, 277–291. [Google Scholar] [CrossRef]
  13. Chen, J.L.; Pekker, T.; Wilson, C.R.; Tapley, B.D.; Kostianoy, A.G.; Cretaux, J.-F.; Safarov, E.S. Longterm Caspian Sea level change. Geophys. Res. Lett. 2017, 44, 6993–7001. [Google Scholar] [CrossRef]
  14. Malinin, V.N. Does the Caspian Sea face the fate of the Aral Sea? Hydrometeorol. Ecol. 2022, 69, 746–760. [Google Scholar] [CrossRef]
  15. Lobanov, V.A.; Naurozbaeva, Z.K. On possible changes in sea ice thickness in the Caspian Sea in the current century. Hydrometeorol. Ecol. 2021, 62, 75–95. [Google Scholar] [CrossRef]
  16. Lavrova, O.Y.; Ginzburg, A.I.; Kostianoy, A.G.; Bocharova, T.Y. Interannual variability of ice cover in the Caspian Sea. J. Hydrol. 2022, 17, 100145. [Google Scholar] [CrossRef]
  17. Safarov, E.; Safarov, S.; Bayramov, E. Changes in the Hydrological Regime of the Volga River and Their Influence on Caspian Sea Level Fluctuations. Water 2024, 16, 1744. [Google Scholar] [CrossRef]
  18. Riahi, K.; Van Vuuren, D.P.; Kriegler, E.; Edmonds, J.; O’neill, B.C.; Fujimori, S.; Bauer, N.; Calvin, K.; Dellink, R.; Fricko, O.; et al. The Shared Socioeconomic Pathways and their energy, land use, and greenhouse gas emissions implications: An overview. Global Environ. Change 2017, 42, 153–168. [Google Scholar] [CrossRef]
  19. Pyhtunova, V.M.; et al. (Eds.) Scientific and Applied Reference Book on the Climate of the USSR; Issue 15. Dagestan ASSR, Azerbaijan SSR, Nakhichevan ASSR; Gidrometizdat: Leningrad, Russia, 1966; 269p. [Google Scholar]
  20. Gadzhiev, G.A.; Ragimov, V.A. Climatic Characteristics of the Administrative Regions of the Azerbaijan SSR; Elm Publishing House: Baku, Azerbaijan, 1977; 137p. (In Azerbaijani) [Google Scholar]
  21. Hersbach, H.; Bell, B.; Berrisford, P.; Hirahara, S.; Horányi, A.; Muñoz-Sabater, J.; Nicolas, J.; Peubey, C.; Radu, R.; Schepers, D.; et al. The ERA5 global reanalysis. Q. J. R. Meteorol. Soc. 2020, 146, 1999–2049. [Google Scholar] [CrossRef]
  22. Gelaro, R.; McCarty, W.; Suárez, M.J.; Todling, R.; Molod, A.; Takacs, L.; Randles, C.A.; Darmenov, A.; Bosilovich, M.G.; Reichle, R.; et al. The modern-era retrospective analysis for research and applications, Version 2 (MERRA-2). J. Clim. 2017, 30, 5419–5454. [Google Scholar] [CrossRef]
  23. Kalnay, E.; Kanamitsu, M.; Kistler, R.; Collins, W.; Deaven, D.; Gandin, L.; Iredell, M.; Saha, S.; White, G.; Woollen, J.; et al. The NCEP/NCAR 40-year reanalysis project. Bull. Am. Meteorol. Soc. 1996, 77, 437–471. [Google Scholar] [CrossRef]
  24. Huang, B.; Liu, C.; Banzon, V.; Freeman, E.; Graham, G.; Hankins, B.; Smith, T.; Zhang, H. Improvements of the Daily Optimum Interpolation Sea Surface Temperature (DOISST) Version 2.1. J. Clim. 2021, 34, 2923–2939. [Google Scholar] [CrossRef]
  25. Taylor, K.E.; Stouffer, R.J.; Meehl, G.A. An Overview of CMIP5 and the Experiment Design. Bull. Amer Meteor. Soc. 2012, 93, 485–498. [Google Scholar] [CrossRef]
  26. Reichler, T.; Kim, J. How Well Do Coupled Models Simulate Today’s Climate? Bull. Amer Meteor. Soc. 2008, 89, 303–312. [Google Scholar] [CrossRef]
  27. Serykh, I.V.; Sonechkin, D.M. Global El Niño–Southern Oscillation Teleconnections in CMIP6 Models. Atmosphere 2024, 15, 500. [Google Scholar] [CrossRef]
  28. Serykh, I.V. El Niño–Southern Oscillation Prediction Based on the Global Atmospheric Oscillation in CMIP6 Models. Climate 2025, 13, 25. [Google Scholar] [CrossRef]
  29. Lehner, F.; Deser, C.; Maher, N.; Marotzke, J.; Fischer, E.M.; Brunner, L.; Knutti, R.; Hawkins, E. Partitioning climate projection uncertainty with multiple large ensembles and CMIP5/6. Earth Syst. Dynam 2020, 11, 491–508. [Google Scholar] [CrossRef]
  30. Serykh, I.; Krasheninnikova, S.; Gorbunova, T.; Gorbunov, R.; Akpan, J.; Ajayi, O.; Reddy, M.; Musonge, P.; Mora-Camino, F.; Olanrewaju, O.A. Climate Change of Near-Surface Temperature in South Africa Based on Weather Station Data, ERA5 Reanalysis, and CMIP6 Models. Climate 2025, 13, 161. [Google Scholar] [CrossRef]
  31. Safarov, S.H.; Guseynov, J.S.; Ibrahimova, I.V. Characteristics of long-term temperature changes in the western regions of the Republic of Azerbaijan. Sci. Work. Natl. Aviat. Acad. Baku 2018, 1, 108–115. (In Azerbaijani) [Google Scholar]
  32. Safarov, S.H.; Guseynov, J.S.; Ibrahimova, I.V.; Safarov, E.S. The main features of temperature changes, occurring over the territory of Caspian Sea in Azerbaijan. In Understanding the Problems of Inland Waters: Case Study for the Caspian Basin (UPCB); Baku, Azerbaijan, 2018; pp. 85–89. [Google Scholar]
  33. Arpe, K.; Molavi-Arabshahi, M.; Leroy, S.A.G. Wind variability over the Caspian Sea, its impact on Caspian seawater level and link with ENSO. Int. J. Climatol. 2020, 40, 6039–6054. [Google Scholar] [CrossRef]
  34. Vyruchalkina, T.Y.; Dianskii, N.A.; Fomin, V.V. Effect of Long-Term Variations in Wind Regime over Caspian Sea Region on the Evolution of Its Level in 1948–2017. Water Resour. 2020, 47, 348–357. [Google Scholar] [CrossRef]
  35. Panin, G.N.; Vyruchalkina, T.Y.; Solomonova, I.V. Climate changes in the Arctic, North Atlantic, Caspian region and their relationship. Fundam. Appl. Climatol. 2015, 1, 183–210. [Google Scholar]
Figure 1. Location of the weather stations under study.
Climate 13 00201 g001
Figure 2. Interannual variability in annual mean NSAT (T, °C) at the weather stations (Table 1) located in the northwestern Caspian region (Russia) from 1960 to 2023.
Climate 13 00201 g002
Figure 3. Interannual variability in annual mean NSAT (T, °C) at the weather stations (Table 2) located in the central-western Caspian region (Azerbaijan) from 1960 to 2023.
Climate 13 00201 g003
Figure 4. Annual anomalies of average NSAT in the Caspian region (35–60° N, 40–65° E) from ERA5 (black, 1940–2023) and CMIP6 experiments: historical (red, 1940–2014), SSP1-2.6 (green, 2015–2099), SSP2-4.5 (blue, 2015–2099), SSP3-7.0 (orange, 2015–2099), and SSP5-8.5 (purple, 2015–2099). Dashed lines represent the variability range (standard deviation) of the 33 CMIP6 models. Annual anomalies of average Caspian Sea surface temperature from OISSTv2 (light blue, 1982–2023).
Climate 13 00201 g004
Figure 5. Spatial distributions of average NSAT: (a) ERA5 reanalysis for 1940–1969, (b) ERA5 reanalysis for 1994–2023, (c) difference in NSAT between 1994–2023 and 1940–1969 based on ERA5, (d) average difference in NSAT between 1994–2023 and 1940–1969 as simulated by the 33-member CMIP6 ESM ensemble (historical and SSP2-4.5 scenarios).
Climate 13 00201 g005
Figure 6. Spatial patterns of NSAT average change, as simulated by the 33-member CMIP6 ensemble between 1994–2023 and 2070–2099, under the following scenarios: historical and SSP1-2.6 (a), SSP2-4.5 (b), SSP3-7.0 (c), and SSP5-8.5 (d).
Climate 13 00201 g006
Figure 7. Spatial patterns of standard deviations corresponding to the average NSAT change fields presented in Figure 6: historical and SSP1-2.6 (a), SSP2-4.5 (b), SSP3-7.0 (c), and SSP5-8.5 (d).
Climate 13 00201 g007
Figure 8. Spatial patterns of NSAT average change, as simulated by the 33-member CMIP6 ensemble between 1994–2023 and 2024–2053, under the following scenarios: historical and SSP1-2.6 (a), SSP2-4.5 (b), SSP3-7.0 (c), and SSP5-8.5 (d).
Climate 13 00201 g008
Table 1. NSAT characteristics at weather stations in the northwestern Caspian region (Russia): average (Tavg ± σ, °C), minimum (TMin, °C), and maximum (TMax, °C) values and NSAT increase (ΔT, °C) in different periods.
NoWeather StationsTavg ± σ, °CTMin, °CTMax, °CTavg ± σ, °CTavg ± σ, °CΔT,°CTavg ± σ, °C
1960–20231985–20102011–2023(2011–2023)–
(1985–2010)
1994–2023
1Armavir11.2 ± 0.89.013.311.2 ± 0.712.2 ± 0.51.011.7 ± 0.7
2Gigant11.2 ± 0.89.013.311.2 ± 0.712.0 ± 0.40.811.6 ± 0.6
3Zelenchukskaya7.7 ± 0.75.89.97.7 ± 0.58.5 ± 0.50.88.1 ± 0.5
4Isobilny11.0 ± 0.98.313.211.1 ± 0.712.0 ± 0.50.911.6 ± 0.7
5Teberda6.9 ± 0.75.39.37.0 ± 0.57.6 ± 0.40.67.4 ± 0.5
6Klukhorskiy pereval4.1 ± 0.62.16.13.9 ± 0.54.8 ± 0.40.94.4 ± 0.6
7Nevinnomissk9.9 ± 0.87.911.810.0 ± 0.710.8 ± 0.50.810.5 ± 0.6
8Stavropol9.6 ± 0.97.311.79.6 ± 0.810.6 ± 0.51.010.2 ± 0.6
9Cherkessk9.5 ± 0.87.411.49.4 ± 0.710.5 ± 0.51.110.0 ± 0.7
10Shidzgatmaz3.0 ± 0.70.95.52.9 ± 0.63.9 ± 0.51.03.5 ± 0.6
11Svetlograd11.0 ± 0.97.113.011.1 ± 0.712.0 ± 0.50.911.6 ± 0.6
12Aleksandrovskoe9.9 ± 0.97.111.99.9 ± 0.810.9 ± 0.51.010.5 ± 0.6
13Divnoe10.8 ± 0.98.012.910.7 ± 0.811.8 ± 0.51.111.3 ± 0.7
14Georgievsk10.3 ± 1.08.212.610.5 ± 0.811.6 ± 0.51.111.1 ± 0.6
15Vladikavkaz9.2 ± 0.97.111.49.3 ± 0.810.4 ± 0.41.19.9 ± 0.6
16Roschino11.3 ± 0.99.113.411.3 ± 0.712.5 ± 0.51.211.9 ± 0.7
17Naurskaya11.3 ± 0.89.313.311.4 ± 0.712.4 ± 0.41.011.9 ± 0.6
18Shatoy9.1 ± 0.77.211.09.1 ± 0.69.9 ± 0.40.89.6 ± 0.5
19Grozny11.0 ± 0.88.612.611.2 ± 0.811.5 ± 0.50.311.5 ± 0.7
20Gudermes11.7 ± 0.99.214.011.7 ± 0.713.0 ± 0.61.312.4 ± 0.7
21Sulak visokogornaya–0.1 ± 0.7–2.23.0–0.1 ± 0.50.9 ± 0.51.00.4 ± 0.6
22Buynaksk10.5 ± 0.88.712.710.7 ± 0.711.2 ± 0.90.511.1 ± 0.7
23Makhachkala12.5 ± 0.710.014.312.4 ± 0.613.3 ± 0.40.912.8 ± 0.6
24Akhty9.7 ± 0.78.111.79.7 ± 0.610.6 ± 0.50.910.2 ± 0.6
25Derbent13.3 ± 0.811.215.313.3 ± 0.614.5 ± 0.41.214.0 ± 0.6
Tmean ± σ, °C for the specified periods across all regional weather stations9.4 ± 0.8–2.215.39.4 ± 0.710.4 ± 0.50.9 ± 0.210.0 ± 0.6
Table 2. NSAT characteristics for weather stations in the central-western Caspian region (Azerbaijan): average (Tavg ± σ, °C), minimum (TMin, °C), and maximum (TMax, °C) values and NSAT increase (ΔT, °C) in different periods.
NoWeather StationsTavg ± σ, °CTMin, °CTMax, °CTavg ± σ, °CTavg ± σ, °CΔT, °C
1960–20231985–20102011–2023(2011–2023)–(1985–2010)
1Mashtaga14.5 ± 0.812.516.014.6 ± 0.715.4 ± 0.40.8
2Neft Dashlari14.9 ± 0.813.416.614.8 ± 0.615.8 ± 0.41.0
3Pirallahi14.9 ± 0.912.816.414.9 ± 0.815.8 ± 0.40.9
4Gobustan11.0 ± 0.98.812.911.1 ± 0.711.9 ± 0.60.8
5Ganja14.0 ± 0.712.015.914.1 ± 0.715.0 ± 0.50.9
6Agstafa13.3 ± 1.0511.415.813.2 ± 0.814.6 ± 0.81.4
7Lankaran14.6 ± 0.912.616.214.7 ± 0.715.2 ± 0.40.5
8Sheki12.7 ± 1.010.415.112.6 ± 0.713.9 ± 0.71.3
9Zagatala13.4 ± 1.011.615.113.3 ± 0.914.5 ± 0.61.2
10Gedabey8.3 ± 0.96.710.18.3 ± 0.89.0 ± 0.50.7
11Goychay15.1 ± 0.912.716.815.2 ± 0.716.0 ± 0.70.8
12Guba10.6 ± 1.09.112.810.9 ± 0.912.0 ± 0.61.1
13Qriz5.1 ± 1.03.17.55.1 ± 0.86.1 ± 1.01.0
14Gabala11.8 ± 1.19.714.211.8 ± 0.913.3 ± 0.61.5
15Oguz12.3 ± 1.49.814.612.6 ± 1.214.0 ± 0.61.4
16Neftchala15.4 ± 0.813.817.015.5 ± 0.716.1 ± 0.40.6
17Khachmaz13.0 ± 0.811.414.712.9 ± 0.713.9 ± 0.61.0
18Mingachevir15.6 ± 0.913.417.415.6 ± 0.716.7 ± 0.61.1
19Altiagach9.1 ± 1.07.111.48.9 ± 0.810.1 ± 0.81.2
Tmean ± σ, °C for the specified periods across all regional weather stations12.6 ± 1.03.117.412.6 ± 0.813.6 ± 0.61.0 ± 0.3
Table 3. Average NSAT (Tavg, °C) and NSAT increase (ΔT, °C) for the period 1994–2023 relative to 1940–1969 in the central-western Caspian region (Azerbaijan).
NoWeather StationsTavg, °CΔT, °C
1940–19691994–2023
1Mashtaga13.715.11.4
2Neft Dashlari14.215.41.2
3Pirallahi14.215.41.2
4Gobustan10.611.61.0
5Ganja13.314.71.4
6Agstafa12.3141.7
7Lankaran1415.11.1
8Sheki1213.51.5
9Zagatala12.714.11.4
10Gedabey7,68.61.0
11Goychay14.315.71.4
12Guba9.811.61.8
13Qriz4.75.71.0
14Gabala10.812.71.9
15Oguz11.713.61.9
16Neftchala14.615.81.2
17Khachmaz12.413.61.2
18Mingachevir14.916.21.3
Average for all stations12.1013.471.37 ± 0.29
Table 4. Average NSAT (Tavg, °C) and NSAT increase (ΔT, °C) for the period 2005–2023 relative to 1986–2004 in the southern part of Caspian region (Iran).
NoWeather StationsTavg, °CΔT, °C
1986–20042005–2023
1Astara15.115.90.8
2Bandar-e-Anzali16.217.21.0
3Rasht15.816.60.8
4Ramsar16.117.11.0
5Nowshahr17.118.00.8
6Babolsar16.417.20.8
7Gharakhil16.217.00.8
8Gorgan17.217.70.5
Average for all stations16.317.10.8 ± 0.1
Table 5. NSAT characteristics for weather stations in the southern part of Caspian region (Iran): average (Tavg ± σ, °C), minimum (TMin, °C), and maximum (TMax, °C) values and increase in NSAT (ΔT,°C) in different periods.
NoWeather StationsTavg ± σ, °CTMin, °CTMax, °CTavg ± σ, °CTavg ± σ, °CΔT, °CTavg ± σ, °C
1986–20231986–20102011–2023(2011–2023)–(1986–2010)1994–2023
1Astara15.5 ± 0.712.219.515.3 ± 0.715.9 ± 0.40.715.7 ± 0.5
2Bandar-e-Anzali16.7 ± 0.814.619.716.4 ± 0.717.3 ± 0.40.917.0 ± 0.6
3Rasht16.2 ± 0.712.721.216.0 ± 0.616.8 ± 0.50.816.4 ± 0.5
4Ramsar16.6 ± 0.713.720.016.3 ± 0.717.2 ± 0.40.916.9 ± 0.5
5Nowshahr17.5 ± 0.613.320.217.3 ± 0.618.0 ± 0.40.717.8 ± 0.5
6Babolsar16.8 ± 0.714.421.616.5 ± 0.617.3 ± 0.40.817.0 ± 0.5
7Gharakhil16.6 ± 0.712.822.116.3 ± 0.617.1 ± 0.40.816.7 ± 0.5
8Gorgan17.5 ± 0.612.623.617.3 ± 0.717.7 ± 0.40.417.7 ± 0.5
Tmean ± σ, °C for the specified periods across all regional weather stations16.7 ± 0.913.32116.4 ± 0.917.2 ± 0.70.7 ± 0.216.9 ± 0.8
Table 6. A Pearson correlation matrix (n–) was computed for mean NSAT (°C) values derived from meteorological stations, ERA5 reanalysis, and the ensemble of 33 CMIP6 models within the northwestern Caspian region (Russia) for the common period 1960–2014. Statistically significant correlations (p < 0.05) are indicated in bold.
VariablesTWeatherStations, °CTERA5, °CTCMIP6, °C
TWeatherStations, °C10.80.6
TERA5, °C0.810.6
TCMIP6, °C0.60.61
Table 7. Average NSAT (°C) changes in the Caspian region (35–60° N, 40–65° E) under various CMIP6 scenarios and the 33 CMIP6 models.
OrganizationModelThe Difference Between 1994–2023 and 1940–1969 (°C)The Difference Between 2024–2053 and 1994–2023 (°C)The Difference Between 2070–2099 and 1994–2023 (°C)
Historical and SSP2-4.5SSP1-2.6SSP2-4.5SSP3-7.0SSP5-8.5SSP1-2.6SSP2-4.5SSP3-7.0SSP5-8.5
AS-RCECTaiESM10.762.321.811.222.232.784.204.816.30
AWIAWI-CM-1-1-MR1.500.981.371.291.481.512.423.854.76
BCCBCC-CSM2-MR0.980.951.191.541.421.532.524.244.55
CAMSCAMS-CSM1-00.491.100.971.141.291.161.932.993.55
CASCAS-ESM2-01.031.461.171.321.792.603.543.755.42
CASFGOALS-f3-L1.900.680.891.211.320.832.033.934.77
CASFGOALS-g31.330.460.901.260.820.742.002.963.57
CCCmaCanESM51.751.591.872.122.452.323.965.797.45
CCCmaCanESM5-CanOE1.781.782.172.532.522.303.956.217.35
CMCCCMCC-CM2-SR51.321.411.501.661.802.403.924.636.42
CMCCCMCC-ESM21.101.511.611.251.443.224.114.366.29
CNRM-CERFACSCNRM-CM6-11.661.261.051.131.361.642.604.385.64
CNRM-CERFACSCNRM-CM6-1-HR1.291.681.421.571.952.093.104.595.90
CNRM-CERFACSCNRM-ESM2-11.530.451.041.021.591.232.693.784.71
CSIRO-ARCCSSACCESS-CM21.021.991.651.872.092.713.654.976.15
CSIROACCESS-ESM1-51.661.351.450.921.851.862.843.945.07
EC-Earth-ConsortiumEC-Earth32.701.581.321.952.091.502.744.526.20
EC-Earth-ConsortiumEC-Earth3-Veg2.400.890.930.801.921.832.754.315.78
INMINM-CM4-80.830.651.211.041.211.132.393.404.00
INMINM-CM5-00.861.471.221.461.441.192.383.624.24
IPSLIPSL-CM6A-LR1.541.141.421.431.401.943.435.226.58
MIROCMIROC-ES2L1.071.301.331.221.471.432.483.504.51
MIROCMIROC60.891.081.571.341.361.512.773.294.97
MOHCUKESM1-0-LL1.171.862.142.402.652.994.496.277.92
MPI-MMPI-ESM1-2-LR0.980.921.011.271.020.902.203.504.29
MRIMRI-ESM2-00.911.001.111.121.380.851.912.903.56
NASA-GISSGISS-E2-1-G0.711.321.321.301.251.642.083.003.39
NCARCESM21.711.281.110.961.731.272.463.605.80
NCARCESM2-WACCM1.241.381.251.322.021.682.423.785.75
NCCNorESM2-LM1.460.750.690.801.230.972.033.044.57
NCCNorESM2-MM1.160.911.231.141.540.892.293.364.44
NIMS-KMAKACE-1-0-G1.691.491.932.202.622.152.844.395.89
NOAA-GFDLGFDL-ESM40.841.061.061.121.331.232.273.183.80
Minimum0.490.450.690.800.820.741.912.903.39
Maximum2.702.322.172.532.653.224.496.277.92
Standard deviation0.480.430.360.440.460.680.750.901.20
Average1.311.241.331.391.671.702.834.065.26
Disclaimer/Publisher’s Note: The statements, opinions and data contained in all publications are solely those of the individual author(s) and contributor(s) and not of MDPI and/or the editor(s). MDPI and/or the editor(s) disclaim responsibility for any injury to people or property resulting from any ideas, methods, instructions or products referred to in the content.