Abstract
Weather Report is an initiative from Weathernews Inc. to obtain sky images and current weather conditions from the users of its weather app. This approach can provide supplementary weather information to radar observations and can potentially improve the accuracy of forecasts However, since the time and location of the contributed images are limited, gathering data from different sources is also necessary. This study proposes a system that automatically submits weather reports using a dash cam with communication capabilities and image recognition technology. This system aims to provide detailed weather information by classifying rainfall intensities and cloud formations from images captured via dash cams. In models for fine-grained image classification tasks, there are very subtle differences between some classes and only a few samples per class. Therefore, they tend to include irrelevant details, such as the background, during training, leading to bias. One solution is to remove useless features from images by masking them using semantic segmentation, and then train each masked dataset using EfficientNet, evaluating the resulting accuracy. In the classification of rainfall intensity, the model utilizing the features of the entire image achieved up to 92.61% accuracy, which is 2.84% higher compared to the model trained specifically on road features. This outcome suggests the significance of considering information from the whole image to determine rainfall intensity. Furthermore, analysis using the Grad-CAM visualization technique revealed that classifiers trained on masked dash cam images particularly focused on car headlights when classifying the rainfall intensity. For cloud type classification, the model focusing solely on the sky region attained an accuracy of 68.61%, which is 3.16% higher than that of the model trained on the entire image. This indicates that concentrating on the features of clouds and the sky enables more accurate classification and that eliminating irrelevant areas reduces misclassifications.
1. Introduction
Weather forecasting requires a large amount of current weather data. Weathernews Inc. (WNI) has been working on “Weather Report”, in which users of Weathernews, a weather app, are asked to report a single sky image and multiple weather variables. Using Weather Report, WNI has achieved high-accuracy forecasting by detecting rain clouds, which are precursors to thunderstorms, and obtaining rainfall intensities. WNI conducted a verification by comparing the presence or absence of precipitation announced by WNI and the Japan Meteorological Agency (JMA) at 5:00 AM on the same day with the actual precipitation measured from 5:00 AM to 24:00 PM on that day [1]. Precipitation was defined as rainfall of 1 mm or more, and less than 1 mm was defined as no precipitation. The target area consisted of the 56 regions designated by the Japan Meteorological Agency [2]. The verification metric used was the precipitation capture rate, which calculates the ratio of cases where precipitation was observed to those where precipitation was predicted by the forecast. As a result, the original forecasting system combining observation radar and Weather Report has shown the potential to exceed the JMA benchmark in the national average capture rate of precipitation in 2022 [3].
Recently, dash cams have acquired the ability to record images and can upload them to the cloud via a network connection. Auto insurance companies use these cameras to provide services that use AI to analyze and report an accident when an impact is detected. Therefore, an approach is to propose a system that automatically submits data to Weather Report using a dash cam with communication capabilities and image recognition technology. The proposed system aims to provide detailed weather information by classifying rainfall intensities and cloud formations from images captured via dash cams.
One of the general challenges in image classification is the loss of accuracy due to learning unnecessary information like background information. Aniraj et al. [4] confirmed that removing the background information from an image and learning and evaluating only the classification target can improve the classification accuracy. A method for feature removal is suggested, which employs masking with semantic segmentation to enhance classification accuracy. Semantic segmentation is a method of classifying each pixel in an image into a category, and it is used to predict the sky and road areas in images. Here, masking is applied to all areas except the predicted sky area and the predicted road area to preprocess images for cloud type and rain intensity classification, respectively. The models are trained and evaluated using the preprocessed data as described above. Moreover, the effectiveness of the proposed method is verified based on the classification accuracy using dash cam images.
1.1. Weather Report
Weather Report was devised to obtain images from the application users containing sky and weather information and is shown in Figure 1. There are two sections in submitted reports. First, it is necessary to take pictures of the sky, as these are essential for forecasting. Second, the user chooses the current weather condition, the apparent temperature, and the five-sense forecast from a list of options. The current weather condition is selected based on the degree of shadows and the rainfall intensity.
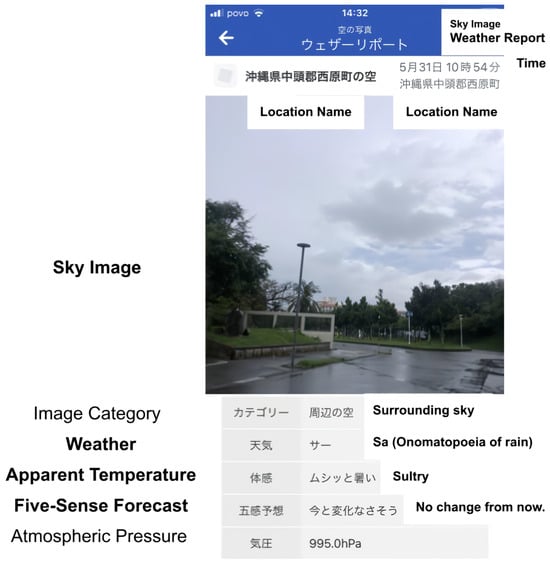
Figure 1.
Example of a weather report. The user selects the current weather conditions, the perceived temperature, and the five-sense forecast from a list of options.
The apparent temperature is selected based on the user’s perception of the temperature, for example, “hot” or “cold”, while five-sense forecasts are selected based on the user’s forecasting about the weather. For example, the user selects “I feel like it’s going to rain” or “I feel like it’s going to be sunny” based on the weather conditions. WNI operations personnel also use this information to determine which areas to focus on for observation.
In addition to the sky images, more detailed information can be provided by adding meteorological information. The weather report shown in Figure 1 was generated based on sky images and meteorological information and is then submitted to WNI. WNI can extract more detailed weather information than observational radar as they can forecast the evolution of clouds and the intensity of rainfall in different areas.
To capture localized short-term weather phenomena such as squalls, it is important to understand the current weather conditions using the Weather Report and minimize the discrepancy between observations. In addition, since the amount of data is the most essential factor for accurate forecasting, Weather Report is a critical observational infrastructure. However, since users are limited regarding the time at which and the place where they can report data, it is necessary to obtain data from other sources.
1.2. Related Work
1.2.1. Weather Monitoring by Image Recognition
Sun et al. [5] aimed to improve the temporal and spatial resolution by monitoring weather conditions from road surveillance camera images. A road weather dataset with sunny, cloudy, rainy, snowy, and foggy weather labels was constructed using recorded images from a road surveillance system in China. Their proposed model, the Deeply Supervised Convolution Network, achieved a high classification accuracy of 96.81% on the road weather dataset. In addition, they applied and verified the proposed model on an actual road monitoring system. Comparing the classification data with recorded data from weather stations, it was demonstrated that the proposed model could accurately capture the weather conditions at a set distance from stations and the spatial resolution was improved. Therefore, using image-based weather recognition in combination with numerical data from observation sensors improves the reliability of observation data.
A higher spatial and temporal resolution is important because it can provide high-quality weather forecasts. Since it has been proven that the temporal and spatial resolution can be improved using roadway surveillance cameras, the same effect can be expected using dash cams. Therefore, the purpose is to improve the temporal and spatial resolution by using dash cam images to recognize weather conditions.
1.2.2. Feature Areas in Weather Recognition Using Images
Li et al. [6] proposed a weather classification model based on a three-channel convolutional neural network (3C-CNN) based on ResNet50. This 3C-CNN learns global weather features extracted from a whole image and sky and ground features extracted from the top and bottom of the image. The 3C-CNN was trained and evaluated on the WeatherDataset-6 (clear, cloudy, rainy, snowy, foggy, sandy conditions) [6] and two-class weather images (clear, cloudy) [7]. They achieved a higher recognition accuracy than conventional CNN models such as VGG16 when training only with all image features.
Ye et al. [8] considered that clouds are an essential indicator for weather forecasting and conducted a classification of cloud images. The proposed model uses SVM to classify cloud texture features extracted by CNN after encoding them with Fisher Vector. The proposed approach is more effective in identifying the complex texture patterns of clouds and achieves higher accuracy. Jinglin et al. [9] constructed 11 cloud image datasets, Cirrus Cumulus Stratus Nimbus (CCSN), and classified cloud type using CNN models. They trained a model using the CCSN dataset and visualized feature maps of each layer. The results show that visual features such as the cloud shape and texture are important for classifying cloud types.
Lin et al. [10] focused on the fact that not only the sky but also the road have a close relationship with the weather, as ice and flooding have a significant impact on driving safety. Therefore, they proposed a method of semantic segmentation model switching according to weather conditions to predict road conditions. Their proposed method uses four semantic segmentation models, where weights are stored separately for each condition (sunny, cloudy, daytime rain, and night-time rain) to avoid cross-suppressing the weights in a single model. After accurately identifying the current weather conditions using a weather classification model, a weather-aware semantic segmentation model is used to predict the road conditions. Their results suggest that the relationship between the weather and the road conditions is critical for road condition predictions.
Based on these studies, it is clear that the visual features of the sky and road are related and relevant in image-based weather recognition. The accuracy of the classification model cannot be directly compared with that of the models presented in previous studies. However, in this study, the rainfall intensity is classified based on road features, while the cloud type is determined using sky features, with consideration of the interplay between the sky and road conditions.
2. Methods
2.1. Proposal Automatic Weather Reporting System
WNI is used by Weather Report to provide supplemental weather information to radar observations for forecasting purposes. Thus, this study propose an automatic weather report submission system that utilizes a communicative dash cam and a deep learning-based image recognizer. Figure 2 shows the flow of the automatic posting process. The proposed system consists of six processes.
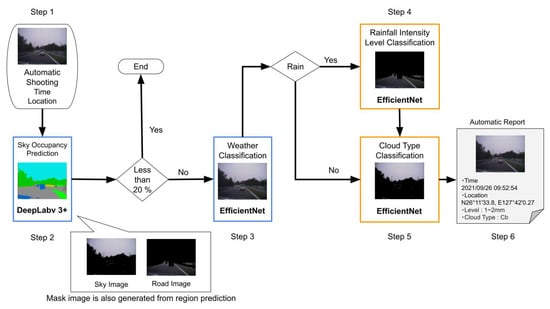
Figure 2.
Flow of automatic reporting. The proposed system consists of six steps.
2.1.1. Step 1 Automatic Image Acquisition
Dash cam can record video frames, date and time, location, speed, direction, and G-sensor data. Meteorological institutes forecast the weather on a grid mesh of several kilometers in length. The smaller the mesh, the more accurately cloud motion can be captured. In order to match the 250 m mesh [11] resolution of WNI, the proposed system will also automatically acquire and report data at 250 m intervals.
Japan has speed limits of 40 km/h and 60 km/h in urban and rural areas, respectively. Therefore, the average vehicle speed is approximately 50 km/h (11 m/s). In order to take pictures at intervals of 250 m, the system would have to take automatic pictures at intervals of about 20 s.
2.1.2. Step 2 Selection of Sky Images
Although the system automatically captures images, it cannot always capture images of the sky. It is difficult to determine the weather conditions in obstructed situations like in tunnels because it is impossible to capture the sky adequately. Therefore, in a previous study, semantic segmentation was proposed to predict the percentage of the sky occupied in the image (sky occupancy) and to select appropriate images for prediction [12]. The study uses the “BDD100K” dataset, which consists of dashcam images with weather labels such as sunny, partly cloudy, overcast, and rainy. However, some images are assigned the weather label “undefined”, such as images inside tunnels, where it is difficult to determine the weather conditions based on visual information alone. The images were classified into two groups: those for which weather conditions could be determined and those for which the weather conditions were unpredictable, or “undefined”. When comparing the sky occupancy in these two sets of images with that predicted by DeepLabv3+ [13], 90% of the images for which it was difficult to determine the weather had a sky occupancy of less than 20%. The results indicate that images with sky occupancy rates of 20% or higher are suitable images for weather determination. In addition, dash cam images taken in Okinawa Prefecture were clipped every 20 s to generate frame images. The results of the selection of sky images using threshold values for these frame images showed that changes in the sky and clouds due to weather changes could be captured. If the predicted sky occupancy rate is greater than or higher than 20%, the system proceeds to Step 5; if it is less than 20%, the process ends.
2.1.3. Step 3 Weather Recognition
The images selected in Step 2 are subjected to weather classification to predict whether it will be “rainy” or “not rainy”. The weather classification model is trained using EfficientNet by labeling sunny, partially cloudy, and overcast as “not rainy” and rainy as “rainy” in the BDD100K dataset. If the classification result is “rainy”, the system proceeds to Step 4; if it is “not rainy”, the system proceeds to Step 5.
2.1.4. Step 4 Rainfall Intensity Level Classification
In conventional weather reports, users intuitively select the rainfall intensity based on five onomatopoeic words shown in the first row of Table 1.WNI uses these five indicators to determine the current intensity of rainfall. The user uses visual as well as auditory information, i.e., rainfall sounds, to describe the rainfall intensity in detail. However, since the proposed system uses only visual information from dash cam images for classification, conventional detailed classification is difficult. In a previous study, Bartos et al. [14] determined that vehicle wiper speeds (low, medium, and high) are positively correlated with rainfall intensity, and they attempted to estimate the rainfall amount by combining a prediction system with weather radar.

Table 1.
Comparison of WNI rainfall intensity indicators and those of the proposed system. First column: the WNI indicators for rainfall intensity levels used in traditional weather reports. Second column: the indicators of rainfall intensity levels used in the proposed system. Third column: the amount of ten-minute rainfall corresponding to the WNI index. Fourth column: the criterion for the user to determine the need for an umbrella and the difficulty of going outside.
Therefore, in the proposed system, as shown in the second column of Table 1, the rainfall intensity is reduced from five to three levels based on the wiper rate, with WNI indices of “light” (Potsu and Para), “medium” (Saa), and “heavy” (Zaza and Goo). The system proceeds to Step 5 after classifying the rainfall intensity.
2.1.5. Step 5 Cloud Type Classification
Observation of cloud development is essential in weather forecasting. In order to predict the intensity, extent, and duration of rainfall, forecasters monitor the size, shape, and motion of clouds through radar and satellite data. In the user’s report, the user identifies the shadow conditions as “clear”, “faint”, or “none” and identifies the cloud conditions at the location where their image was taken. However, since determining the shadow conditions from dash cam images is difficult, there is concern about the accuracy of the classification. Moreover, the amount and duration of the rainfall vary depending on the cloud type. For example, cumulonimbus clouds lead to localized heavy rain and thunderstorms such as guerrilla downpours, while turbulence clouds are thick gray clouds that cover the entire sky and often cause long-lasting rainfall. Conventional weather reports can confirm the development of clouds with shadow conditions classified as “none” but cannot capture rainfall trends.
The purpose of this step is to classify cloud types from sky images and to understand cloud development in more detail. The proposed system classifies clouds into three types—cumulonimbus, stratus, and other clouds—and adds cloud-type information.
2.1.6. Step 6 Automatic Report
A weather report is created based on the image, time, and location obtained in Step 1 and the rainfall intensity and cloud type predicted in Steps 4 and 5. This weather report is automatically edited via network communication.
In this paper, both the rainfall intensity and cloud type classification models described in Steps 4 and 5 are trained and evaluated.
2.2. Feature Removal by Masking
Image classification via deep learning is the task of identifying the content of an image by its labels, where the accuracy is dependent on the extracted features. However, images contain background information that is not relevant to the classification task, which may reduce the importance of appropriate features and weaken the decision-making power of the classifier. Therefore, the accuracy can be improved by masking unnecessary regions and learning only appropriate ones.
In dash cam images, as shown in Figure 3, the color and brightness of the sky and road change depending on the weather conditions. Therefore, sky and road features are critical for weather classification, and utilizing these features is essential for accuracy [6]. However, the appearance of the sky during rainfall events with different intensities is less distinct than that of the sky in other weather conditions (clear, cloudy, and rainy). In addition, consideration was given to learning the features of the road separately, given the relationship between weather and road conditions [5,10]. Therefore, masking is applied to non-road areas to learn only road features.
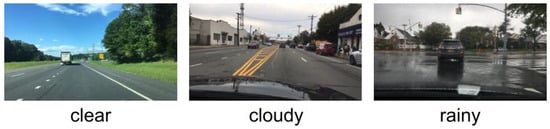
Figure 3.
Example of images for each weather label.
Experts have defined 10 types of clouds based on the cloud shape and top. Thus, except for those of the sky, the considered features were unnecessary for classifying cloud types. Therefore, masking is applied to non-sky areas to learn only sky features.
In this experiment, feature removal by masking using semantic segmentation is performed on each dataset to improve the classification accuracy. Figure 4 shows the procedure of creating a masked image. First, the required areas are predicted using semantic segmentation and color mapped to white for the original image. For the rainfall intensity dataset, the model predicts the road area, and for the cloud type dataset, it predicts the sky area. Unnecessary areas are color mapped to black. Finally, using OpenCV, which is an image processing library, the original and predicted images are combined to create a masked image.
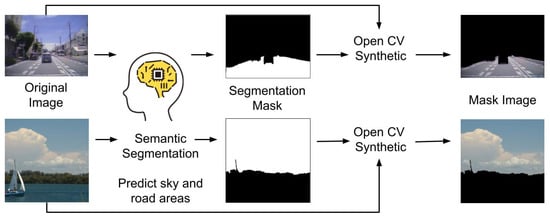
Figure 4.
Procedure for creating masked images (upper: rainfall intensity dataset, lower: cloud dataset).
The pre-trained model with the BDD100K dataset [15] was used for automated driving by Deeplabv3+ [13]. The intersection over union (IoU) serves as a crucial metric for assessing the precision of semantic segmentation models. It quantifies the model’s accuracy by dividing the overlap (intersection) between the predicted and ground truth areas by their combined area (union). The goal is to achieve an IoU value as close to 100% as possible, indicating a near-perfect segmentation accuracy. This model achieved an IoU of 94.41% for sky-only and 94.43% for road-only BDD100K datasets, indicating that the model can predict sky and road areas with sufficient accuracy.
Figure 5 shows the result of masking sky and road areas in each dataset. Figure 5a,c show the successfully masked images, with only road and sky in the image. However, some images were completely masked due to inaccurate predictions of road and sky areas, as depicted in Figure 5b,d. The number of images that were unable to be masked is 805/2700 for the rainfall intensity dataset and 63/786 for the cloud cover dataset. In this section, this study propose a method to improve the image classification accuracy by learning only the features of road and sky areas through masking. It was concluded that including the failed images in Figure 5b,d in the training dataset would not accurately validate the feature removal performance by masking. Therefore, images from each dataset that were unable to be masked were excluded, and only images where the road and sky are visible were used to train the model.
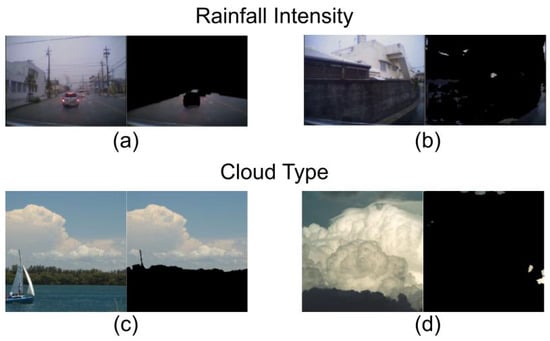
Figure 5.
Examples of masked images. (a) Rainfall intensity dataset: road mask, (b) rainfall intensity dataset: failed road mask, (c) cloud type dataset: sky mask, (d) cloud type dataset: failed sky mask.
3. Experiments
Experiments were performed to evaluate the effectiveness of feature removal for dash cam images using masking. A classification model was trained to predict the rainfall intensity and cloud type from the masked images. Its accuracy was evaluated through a comparison with the original images.
3.1. Rainfall Intensity Level Classification
3.1.1. Dataset
Although there is related research on rainfall estimation using images [16,17], there is no open-source dataset consisting of dash cam images annotated with rainfall amounts. A dataset was constructed using dash cam images and JMA observation records taken in Okinawa Prefecture in 2022. The evaluation methodologies rely on the location and time of images taken from dash cams, and the rainfall data published by JMA [18] were referenced to label the images with the indices shown in the first column of Table 2. The temporal resolution is every 10 min and the spatial resolution is 20 km to 30 km. Table 2 shows the details of the rainfall intensity dataset and Figure 6 shows examples of images with each rainfall intensity label. Additionally, out of the 2700 images collected, scenes where the sky and road were not visible, or images where the masking described in Section 2.2 failed, were excluded. The dataset consists of 604 images for light rain, 687 images for medium rain, and 604 images for heavy rain, totaling 1895 images.
Table 2.
Details of the rainfall intensity dataset.
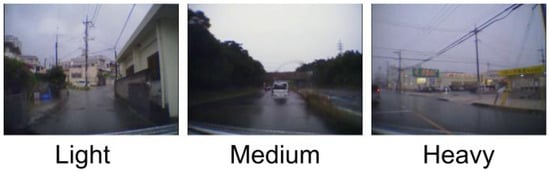
Figure 6.
Example images for each rainfall intensity label.
For data splitting, a ratio of 90% to 10% was used for the training and test sets. K-fold cross-validation with k = 9 was applied to train and test the classifier. The performance of the classifier was evaluated based on the average and maximum accuracies across the nine iterations.
3.1.2. Model
In this experiment, models were trained on the dataset using EfficientNet [19], VGG16 [20], ResNet50 [21], and Vision Transformer (ViT) [22], all of which are pre-trained models provided by PyTorch [23,24,25,26]. EfficientNet is a CNN architecture and scaling method that uniformly scales all depth, width, and resolution dimensions using composite coefficients. EfficientNet achieves a high accuracy by balancing the scaling of these factors, which reduces the computational complexity and the number of parameters. EfficientNet has achieved high accuracy on various datasets, such as ImageNet, and is a general-purpose method in image recognition. Therefore, high accuracy is also expected in this experiment. The Adam optimizer was used with a learning rate of , a batch size of 8, and an epoch number of 30. Training and testing were conducted on a computer equipped with the Ubuntu 20.04.2 LTS OS, an Intel(R) Core(TM) i9-11900K CPU, NVIDIA GeForce RTX 3060 Ti GPU, and 8GB of memory.
3.1.3. Results and Discussion
The results from Table 3 offer a comprehensive overview of the performance of various deep learning models on the classification of rainfall intensity. Average Acc is the average of the classification accuracies for the nine times of the test data with k-fold cross-validation, and the maximum Acc is the results of the model that achieved the highest classification accuracies for the test data. EfficientNet stands out as the top performer, with an average accuracy of 90.09% and a maximum accuracy of 92.61%. This underscores EfficientNet’s superior ability to balance model scaling and complexity, which in turn translates to higher precision in classifying rainfall intensity from the dataset provided. VGG16 and ResNet50, both of which are established models in image recognition, show commendable performance with average accuracies of 85.16% and 87.37%, and maximum accuracies of 90.34% and 90.91%, respectively. Their respectable performance highlights their robustness and the effectiveness of convolutional architectures for image-based classification tasks, despite being surpassed by EfficientNet in this instance. ViT, on the other hand, demonstrates a significantly lower accuracy with an average of 62.56% and a maximum of 67.05%. This deviation can be attributed to ViT’s reliance on global dependencies between image patches, which might not be as effective for the specific task of rainfall intensity classification as it is for other types of image classification tasks. The transformer model, being relatively novel in image processing compared to CNN-based architectures, might require further tuning or a different approach in preprocessing the data to better capture the relevant features for this specific task. Given these findings, it is evident that EfficientNet’s architecture provides a more suitable model for the rainfall intensity dataset, achieving the highest accuracy in this experiment. Therefore, experiments in the masking process were conducted using EfficientNet as the model.
Table 3.
Comparison of rainfall intensity classification accuracy between EfficientNet, VGG16, ResNet50, and ViT (average Acc, maximum Acc).
Table 4 shows the results of the whole-area and road-area models for the test data. The whole-area model learns the features of the entire image, while the road-area model learns only road features. With the whole-area model achieving a 2.84% higher accuracy, the average Acc values for the whole-area model and road-area model were 90.09% and 87.25%, respectively. This result indicates that the accuracy cannot be improved by only using the features of the road. The F1-scores indicate that both models are able to classify heavy rain with a high accuracy, but the accuracy tends to decrease for light and medium rain. A possible reason for the lower accuracy for light and medium rain is the complexity of the rainfall image near the boundary value. When the rainfall amount is around 2 mm, which is the boundary value between light and medium rain, the differences in the size and distribution of rain droplets are too small to be classified. These factors make it difficult to accurately classify images with rainfall amounts near 2 mm in the light and medium rain categories. Heavy rainfall has an upper limit of 4 mm or more and has a broader range of rainfall than the other two categories, which makes it easier to distinguish the difference in appearance. It is concluded that the model is less accurate for light and medium rain compared to heavy rain.
Table 4.
Comparison of accuracy between the whole-area model and the road-area model.
Additionally, Grad-CAM [27] was utilized to explore the focus areas of the model. Figure 7 shows the results of the visualization of the whole-area and road-area models. GradCAM highlights the areas that were used as the basis for classification with warm colors. The upper panel of Figure 7 shows that the tail lamps of a car are highlighted, while the masked image in the lower panel of Figure 7 shows that the reflection of the car lights on the road is highlighted. This result suggests that not only the road but also the lights of the car are the basis for rainfall intensity classification. Rain is due to the combination of moisture in clouds and the formation of large water droplets. The larger the water droplets, the thicker and lower the clouds become, which reduces the amount of sunlight transmitted through them. The image brightness decreases as the car lights become more visible and the rainfall intensity increases, which is a significant feature of this model. Kanazawa et al. [28] attempted to predict rainfall intensities using pixel values from surveillance camera images and a regression analysis. As a result, they found a positive correlation between the rainfall intensity and luminance values. It seems that as the rainfall intensity increases, the image gradually becomes hazier, and the luminance value also increases because the difference between the brightness and darkness of the image decreases. These results indicate a relationship between the rainfall intensity and luminance values. Additionally, the road-area model did not accurately identify car lights as a feature, resulting in a reduced accuracy; however, this model achieved an accuracy of around 90%, indicating that the road area is a still significant feature for classifying rainfall intensity.
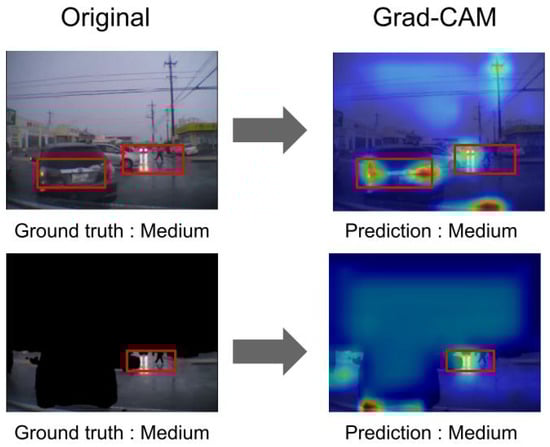
Figure 7.
Visualization of classification basis via Grad-CAM (upper: whole-area model, lower: road-area model). Red boxes: focus area.
3.2. Cloud Type Classification
3.2.1. Dataset
The CCSN database [9], a cloud image dataset constructed by Jinglin et al, was utilized in this study. This dataset consists of 10 types of cloud images defined by the World Meteorological Organization, in addition to airplane clouds, totaling 2543 images. Table 5 shows the details of the CCSN database. In the experiments, the dataset was reconstructed using cumulonimbus (Cb) images, nimbostratus (Ns) images, and other images (the remaining nine labels) from the CCSN database. Figure 8 shows example images for each label. The cloud type dataset consists of 229 images for Cb clouds, 252 images for Ns clouds, and 242 images for other clouds, totaling 723 images. As described in Section 2.2, data that were unable to be masked were removed from the dataset. Therefore, the number of Cd and Ns images was less than the initial quantity. A ratio of 80% of the data was used as the train data, with 20% allocated to the test data.
Table 5.
Details of the CCSN Database. The dataset used in the experiment was reconstructed using Cb, Ns, and other images.
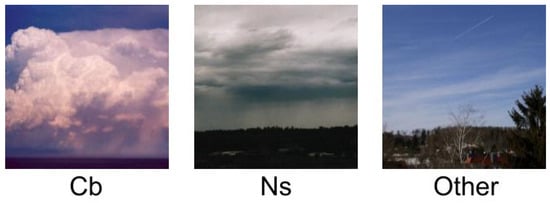
Figure 8.
Example images for each cloud label. Cb: cumulonimbus, Ns: nimbostratus, Other: Other nine clouds.
Similarly to rainfall intensity classification, the model was evaluated via k-fold cross-validation. The performance of the classifier was evaluated based on the average and maximum accuracies across the six iterations.
3.2.2. Model
As was the case for rainfall intensity classification, models were trained on the dataset using EfficientNet [19], VGG16 [20], ResNet50 [21], and Vision Transformer (ViT) [22], all of which are pre-trained models provided by PyTorch [23,24,25,26]. The optimization process, the learning rate, the batch size, and the number of epochs were all the same. Training and testing were conducted on the same computer described in Section 3.1.2.
3.2.3. Results and Discussion
The results from Table 6 offer a comprehensive overview of the performance of various deep learning models on the classification of cloud types. EfficientNet stands out as the top performer, with an average accuracy of 65.45% and a maximum accuracy of 70.8%. In contrast, VGG16 and ResNet50, though established models, exhibit lower accuracies of 49.15% and 63.75% (average), respectively. This disparity is primarily due to their lack of scalable architecture, unlike EfficientNet, which adeptly balances model dimensions to enhance classification precision. ViT’s performance, with an average accuracy of 55.35%, suggests that, similar to its application in rainfall intensity classification, alternative preprocessing or tuning may be essential for improving its effectiveness in cloud type classification. The findings indicate EfficientNet’s architecture as optimal for cloud type dataset, achieving the highest accuracy in this experiment. Therefore, experiments in the masking process were conducted using EfficientNet as the model.
Table 6.
Comparison of cloud type classification accuracy between EfficientNet, VGG16, ResNet50, and ViT (average Acc, maximum Acc).
Table 7 shows the test data results for the whole-area and sky-area models. The whole-area model learns the features of the entire image, while the sky-area model learns only sky’s features. The average Acc is the average classification accuracy for the six iterations of k-fold cross-validation on the test data, and the maximum Acc and F1-Score are the highest classification accuracies for the test data, indicating the best-performing model. The whole-area model achieved a 3.16% higher accuracy, with the average Acc of the whole-area and sky-area models at 65.45% and 68.61%. Ns clouds are formed by the development of Sc and St when contained in other clouds. They are similar in shape and color, as shown in Figure 9. It was found that Ns clouds are more difficult to classify than Cb clouds.
Table 7.
Comparison of accuracy between whole-area and sky-area models.
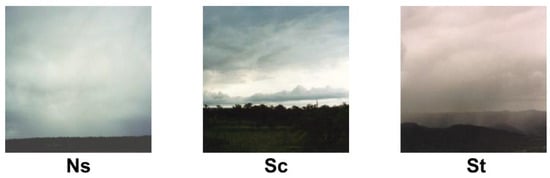
Figure 9.
Example images for Ns: nimbostratus clouds, Sc: stratocumulus clouds, and St: stratus clouds.
The F1-Score for Cb in the whole-area model was 84%, which dropped to 80% when masking was introduced. This decrease in score is due to its unique structural properties: Cb extends vertically and occupies a significant portion of the image; compared to Ns and others, it contains less unnecessary information, such as buildings and trees. Therefore, the need for masking is not pronounced, and the loss of classification accuracy can be attributed to the inadvertent removal of essential features. As shown in Figure 2, the selection of sky images is based on a minimum of 20%, but a selection threshold should be set for each cloud class.
Figure 10 shows the visualization results of Grad-CAM for the images predicted by the whole-area and sky-area models. As shown in the visualization in the left part of Figure 10, the whole-area model highlights the house in the right corner and misclassifies it. However, the visualization in the lower panel highlights clouds as the subject because the non-sky subject is masked. Thus, the sky-area model correctly classifies cloud types. The Grad-CAM visualization results for each model show that the highlighted point is the same for all models. For the whole-area model, about 40% (16/40) of the misclassified images highlighted non-clouds, while for the sky-area model, this value was about 29% (11/38). The sky models were trained with only sky and cloud features, eliminating unnecessary information via masking. Therefore, it is concluded that the sky-area model tends to use visual features, such as the shape and color of clouds, as cues for classification, in contrast to the whole-area model.
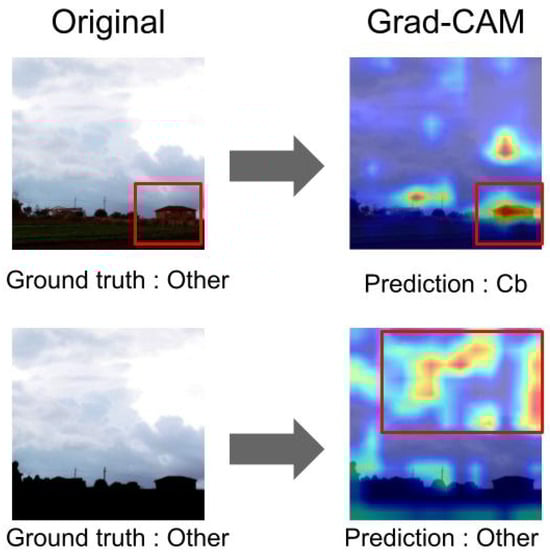
Figure 10.
Visualization of classification basis via Grad-CAM (upper: whole-area model; lower: sky-area model). Red boxes: focus area.
The pre-annotated, open-source CCSN database was used for this paper, as it was determined that cloud-type annotation can be challenging for non-experts. Since the CCSN database does not contain dash cam images, the accuracy of cloud classification from dash cam images has not been evaluated. The proposed system can achieve the same level of accuracy as the experimental results by masking the dash cam images to show only the sky.
In the proposed system, three images are taken per minute, which is due to the automatic image capture interval being set to 20 s. Since the cloud type classification accuracy is 72.26%, it is believed that the system can adequately predict the cloud development status if it can correctly classify and report two images per minute. Therefore, the accuracy of Ns cloud classification is low, but the accuracy of cloud type classification is efficient in the proposed system.
4. Conclusions
WNI has focused on improving the forecast accuracy of Weather Report using current sky images and weather information. This study proposed an automatic weather report submission system using communication-enabled dash cams and image recognition. The rainfall intensity and cloud type were classified using dash cam images, and EfficientNet was used to acquire weather information. Each model was trained with datasets from which certain features were removed through a masking process to enhance accuracy.
For rainfall intensity classification, the focus was on road textures, and the model was trained only on road features; the whole-area model achieved a 92.61% accuracy, which is 2.84% better than the road-area model. The F1-Score for heavy rain classification was 99%. Early detection and information on heavy rainfall can be used in disaster response for landslides and floods. Using the Grad-CAM visualization technique, it was observed that the classifier, trained with masked dash cam images, focused on areas containing car headlights during rainfall intensity classification. When classifying cloud types, the model that focused only on the sky region achieved an accuracy of 68.61%, which is 3.16% higher than the model that was trained on the entire image. This indicates that models focusing only on cloud and sky features produce better results than more generalized approaches, and that ignoring irrelevant areas such as buildings can significantly reduce misclassification events. However, it is necessary to verify the generality of the proposed system due to the small size of the dataset and the fact that the images were not from dash cams. In the future, an extended dataset will be created to include the angle of view of dash cams. This dataset would be used to evaluate classification accuracy in an environment that closely resembles the proposed system environment. To enhance the efficiency of the masking process, test with the high-quality instance segmentation model Segment Anything developed by Meta Research. This model archives high accuracy by incorporating bounding boxes, prompts, and images into its input. While the current focus remains on classifying rainfall intensity levels, accurate real-time prediction of rainfall necessitates a regression approach. To achieve this, a regression model will be developed, utilizing a time-series dataset and incorporating an attention mechanism to improve performance.
Author Contributions
Conceptualization, K.S.; methodology, K.S.; software, K.S.; validation, K.S.; formal analysis, K.S.; investigation, K.S., S.E. and S.S.; resources, K.S.; data curation, K.S.; writing—original draft preparation, K.S. and S.E.; writing—review and editing, K.S. and S.E.; visualization, K.S.; supervision, S.E.; project administration, S.E. and S.S.; funding acquisition, S.E. All authors have read and agreed to the published version of the manuscript.
Funding
This research was supported by JSPS KAKENHI Grant Number 23K11234.
Data Availability Statement
Information about obtaining our rainfall intensity datasets for classification can be requested by contacting k228573@ie.u-ryukyu.ac.jp. Information about obtaining our cloud type datasets for classification can be accessed at https://dataverse.harvard.edu/dataset.xhtml?persistentId=doi:10.7910/DVN/CADDPD (accessed on 21 April 2024).
Conflicts of Interest
Author Shunsuke Sato was employed by the company Weathernews Inc. The remaining authors declare that the research was conducted in the absence of any commercial or financial relationships that could be construed as a potential conflict of interest.
References
- Agency, J.M. Verification of Precipitation. Available online: https://www.data.jma.go.jp/fcd/yoho/kensho/explanation.html (accessed on 21 April 2024).
- Agency, J.M. Weather Warnings and Advisories and Weather Forecast Areas. Available online: https://www.jma.go.jp/jma/kishou/know/saibun/index.html (accessed on 21 April 2024).
- Weathernews, Inc. Accuracy Remains High through Winter 2022 Weather News Weather Forecast Accuracy. Available online: https://weathernews.jp/s/topics/202212/230215/ (accessed on 6 January 2023).
- Aniraj, A.; Dantas, C.F.; Ienco, D.; Marcos, D. Masking Strategies for Background Bias Removal in Computer Vision Models. In Proceedings of the IEEE/CVF International Conference on Computer Vision, Paris, France, 2–6 October 2023; pp. 4397–4405. [Google Scholar]
- Sun, Z.; Wang, P.; Jin, Y.; Wang, J.; Wang, L. A practical weather detection method built in the surveillance system currently used to monitor the large-scale freeway in China. IEEE Access 2020, 8, 112357–112367. [Google Scholar] [CrossRef]
- Tan, L.; Xuan, D.; Xia, J.; Wang, C. Weather recognition based on 3C-CNN. KSII Trans. Internet Inf. Syst. (TIIS) 2020, 14, 3567–3582. [Google Scholar]
- Lu, C.; Lin, D.; Jia, J.; Tang, C.K. Two-class weather classification. In Proceedings of the IEEE Conference on Computer Vision and Pattern Recognition, Columbus, OH, USA, 23–28 June 2014; pp. 3718–3725. [Google Scholar]
- Ye, L.; Cao, Z.; Xiao, Y. DeepCloud: Ground-based cloud image categorization using deep convolutional features. IEEE Trans. Geosci. Remote Sens. 2017, 55, 5729–5740. [Google Scholar] [CrossRef]
- Zhang, J.; Liu, P.; Zhang, F.; Song, Q. CloudNet: Ground-Based Cloud Classification With Deep Convolutional Neural Network. Geophys. Res. Lett. 2018, 45, 8665–8672. [Google Scholar] [CrossRef]
- Lin, P.W.; Hsu, C.M. Lightweight Convolutional Neural Networks with Model-Switching Architecture for Multi-Scenario Road Semantic Segmentation. Appl. Sci. 2021, 11, 7424. [Google Scholar] [CrossRef]
- Weathernews, Inc. Industry’s First! 250-Meter Mesh Raincloud Radar with 10-Minute Intervals for up to 15 Hours ahead New Rain Cloud Radar Available on Weather News App. Available online: https://jp.weathernews.com/news/32149/ (accessed on 31 December 2023).
- Suemitsu, K.; Endo, S.; Sato, S. Selection of Dash Cam Images for Weather Forecasting Based on The Sky Occupancy. In Proceedings of the 2022 Joint 12th International Conference on Soft Computing and Intelligent Systems and 23rd International Symposium on Advanced Intelligent Systems (SCIS&ISIS), Ise, Japan, 29 November–2 December 2022; IEEE: Piscataway, NJ, USA, 2022; pp. 1–8. [Google Scholar]
- Chen, L.C.; Zhu, Y.; Papandreou, G.; Schroff, F.; Adam, H. Encoder-decoder with atrous separable convolution for semantic image segmentation. In Proceedings of the European Conference on Computer Vision (ECCV), Munich, Germany, 8–14 September 2018; pp. 801–818. [Google Scholar]
- Bartos, M.; Park, H.; Zhou, T.; Kerkez, B.; Vasudevan, R. Windshield wipers on connected vehicles produce high-accuracy rainfall maps. Sci. Rep. 2019, 9, 170. [Google Scholar] [CrossRef] [PubMed]
- Yu, F.; Chen, H.; Wang, X.; Xian, W.; Chen, Y.; Liu, F.; Madhavan, V.; Darrell, T. Bdd100k: A diverse driving dataset for heterogeneous multitask learning. In Proceedings of the IEEE/CVF Conference on Computer Vision and Pattern Recognition, Seattle, WA, USA, 13–19 June 2020; pp. 2636–2645. [Google Scholar]
- Yin, H.; Zheng, F.; Duan, H.F.; Savic, D.; Kapelan, Z. Estimating rainfall intensity using an image-based deep learning model. Engineering 2023, 21, 162–174. [Google Scholar] [CrossRef]
- Zheng, F.; Yin, H.; Ma, Y.; Duan, H.F.; Gupta, H.; Savic, D.; Kapelan, Z. Toward Improved Real-Time Rainfall Intensity Estimation Using Video Surveillance Cameras. Water Resour. Res. 2023, 59, e2023WR034831. [Google Scholar] [CrossRef]
- Agency, J.M. Historical Weather Data Search. Available online: https://www.data.jma.go.jp/obd/stats/etrn/index.php (accessed on 1 September 2022).
- Tan, M.; Le, Q. Efficientnet: Rethinking model scaling for convolutional neural networks. In Proceedings of the International Conference on Machine Learning, PMLR, Long Beach, CA, USA, 9–15 June 2019; pp. 6105–6114. [Google Scholar]
- Simonyan, K.; Zisserman, A. Very deep convolutional networks for large-scale image recognition. arXiv 2014, arXiv:1409.1556. [Google Scholar]
- He, K.; Zhang, X.; Ren, S.; Sun, J. Deep residual learning for image recognition. In Proceedings of the IEEE Conference on Computer Vision and Pattern Recognition, Las Vegas, NV, USA, 27–36 June 2016; pp. 770–778. [Google Scholar]
- Dosovitskiy, A.; Beyer, L.; Kolesnikov, A.; Weissenborn, D.; Zhai, X.; Unterthiner, T.; Dehghani, M.; Minderer, M.; Heigold, G.; Gelly, S.; et al. An image is worth 16x16 words: Transformers for image recognition at scale. arXiv 2020, arXiv:2010.11929. [Google Scholar]
- PyTorch. Efficientnet_b0. Available online: https://pytorch.org/vision/stable/models/generated/torchvision.models.efficientnet_b0.html#torchvision.models.efficientnet_b0 (accessed on 1 April 2023).
- PyTorch. Vgg16. Available online: https://pytorch.org/vision/stable/models.html#torchvision.models.vgg16 (accessed on 1 April 2023).
- PyTorch. Resnet50. Available online: https://pytorch.org/vision/stable/models.html#torchvision.models.resnet50 (accessed on 1 April 2023).
- PyTorch. Vit_Base_Patch16_224. Available online: https://pytorch.org/vision/stable/models.html#torchvision.models.vit_base_patch16_224 (accessed on 1 April 2023).
- Selvaraju, R.R.; Cogswell, M.; Das, A.; Vedantam, R.; Parikh, D.; Batra, D. Grad-cam: Visual explanations from deep networks via gradient-based localization. In Proceedings of the IEEE International Conference on Computer Vision, Venice, Italy, 22–29 October 2017; pp. 618–626. [Google Scholar]
- Kanazawa, A.; Uchida, T.; Nakaya, H. Quantitative rainfall intensity estimation based on pixel values in surveillance camera images. Jpn. Soc. Eros. Control. Eng. 2021, 74, 37–48. [Google Scholar]
Disclaimer/Publisher’s Note: The statements, opinions and data contained in all publications are solely those of the individual author(s) and contributor(s) and not of MDPI and/or the editor(s). MDPI and/or the editor(s) disclaim responsibility for any injury to people or property resulting from any ideas, methods, instructions or products referred to in the content. |
© 2024 by the authors. Licensee MDPI, Basel, Switzerland. This article is an open access article distributed under the terms and conditions of the Creative Commons Attribution (CC BY) license (https://creativecommons.org/licenses/by/4.0/).