Article

Mapping and Assessing Riparian Vegetation Response to Drought along the Buffalo River Catchment in the Eastern Cape Province, South Africa

by
Zolisanani Mpanyaro
1,2,
Ahmed Mukalazi Kalumba
1,2,
Leocadia Zhou
3 and
Gbenga Abayomi Afuye
1,2,*
1
Department of Geography and Environmental Science, University of Fort Hare, Alice 5700, South Africa
2
Geospatial Application, Climate Change and Environmental Sustainability Lab—GACCES, University of Fort Hare, Alice 5700, South Africa
3
Risk and Vulnerability Science Centre, Faculty of Science and Agriculture, University of Fort Hare, P. Bag X1314, Alice 5700, South Africa
*
Author to whom correspondence should be addressed.
Climate 2024, 12(1), 7; https://doi.org/10.3390/cli12010007
Submission received: 10 November 2023 / Revised: 22 December 2023 / Accepted: 29 December 2023 / Published: 11 January 2024
(This article belongs to the Section Climate and Environment)

Abstract

:
The increasing drought frequency poses a significant threat to global and regional river systems and ecosystem functioning, especially in the complex topographical Buffalo River catchment area of the Eastern Cape Province, South Africa. This study explored the impact of drought on riparian vegetation dynamics using the Normalize Difference Vegetation Index (NDVI), Transformed Difference Vegetation Index (TDVI) and Modified Normalized Difference Water Index (MNDWI) from satellite-derived Landsat data from 1990 to 2020. The least-squares linear regression and Pearson’s correlation coefficient were used to evaluate the long-term drought in riparian vegetation cover and the role of precipitation and streamflow. The correlation results revealed a moderate positive correlation (r = 0.77) between precipitation and streamflow with a significant p-value of 0.04 suggesting consequences on riparian vegetation health. Concurrent with the precipitation, the vegetation trends showed that precipitation increased insignificantly with less of an influence while the reverse was the case with the streamflow in the long term. The results show that the NDVI and TDVI were significant indices for detecting water-stressed vegetation in river catchment dynamics. Much of these changes were reflected for MNDWI in dry areas with a higher accuracy (87.47%) and dense vegetation in the upper catchment areas. The standardized precipitation index (SPI) revealed the inter-annual and inter-seasonal variations in drought-stressed years between 1991–1996, 2000–2004, 2009–2010, 2015, and 2018–2019, while 2020 exhibited slight sensitivity to drought. The findings of this study underscore the need for heightened efforts on catchment-scale drought awareness for policy development, programs, and practices towards ecosystem-based adaptation.

1. Introduction

Climatic predictions have indicated an increase in drought frequency, duration, and severity [1]. Droughts can occur in most climatic zones including both high and low rainfall regions marked by a decrease in precipitation for an extended period such as a season or a year [2]. The World Meteorological Organization (WMO) accentuates the severity of these climatic shifts with far-reaching consequences for ecosystems and water resources [3]. The Centre for Research on the Epidemiology of Disasters (CRED) further emphasized the impact of drying trends on communities, revealing a growing number of reported drought-related disasters globally [4]. Riparian vegetation serves as an important natural resource that regulates a variety of key ecosystem roles and services [5]. Riparian vegetation is used as a river rehabilitation tool and biological engineering plays a large role in agricultural practices in riparian fencing [6]. In semi-arid ecosystems, riparian vegetation acts to control water flow, the effect of water, transportation, and the deposition of sediments thus, presenting a distinctive habitat for an extensive array of plants and animals on the landscape [7]. Evidence of anthropogenic impacts on global drought frequency, duration, and intensity signals threats to various environmental components including riparian vegetation and ecosystem functioning [8]. Riparian ecosystems characterise vegetation components along river networks and are functionally related to fluvial systems and surrounding areas [9]. According to [10], riparian vegetation serves two pollution control functions including the prevention of pollution from entering water bodies and the removal of pollution from water bodies that may affect them, thereby causing chemical transformations. The spatial and temporal dynamics of riparian vegetation in response to drought stress are increasingly becoming imperative for effective conservation and sustainable water resource management.
Satellite-derived Normalized Difference Vegetation Index (NDVI) [11], Transformed Difference Vegetation Index (TDVI) [12] and Modified Normalized Difference Water Index (MNDWI) [13] have been applied to broader drought and vegetation-climate related studies, and plant species for change detection [14,15]. Numerous studies have shown that the major climatic factors including precipitation, temperature, solar radiation, and wind speed affect vegetation response to drought stress, which may vary across different climatic regions [16,17]. Long-term ecological studies on riparian vegetation change and their responses to drought stress in the semi-arid environment are crucial to understanding how vegetated ecosystems respond to environmental change [18,19]. South Africa witnessed one of the worst droughts hit between 2015 and 2016, with rainfall and water levels extremely declining in most parts of the country [20]. Buffalo River catchment in the Eastern Cape Province has been experiencing increasing incidences of drought in recent years affecting riparian vegetation health and ecosystem functioning due to the region’s aridity and the hydrological complexity of the topographic environment [20,21]. Assessment of riparian vegetation response to water stress in a semi-arid environment especially along river networks is still lacking at the microscale level over a long-term period [22,23,24]. Only a few studies have explored the Buffalo River vegetation change placing limited emphasis on comprehensive riparian vegetation assessment to reveal the topographic complexities along the catchment dynamics because drought conditions are linked to multiple factors [25,26,27,28]. The complexities in interactions between drought and river hydrology necessitate a comprehensive approach that combines advanced remote sensing techniques to accurately assess riparian vegetation response to drought.
The advancement in space-based technologies in assessing ecological interactions has provided numerous options for change detection in riparian vegetation dynamics, making ground-based observations less efficient [15,29]. Therefore, this study integrates multimodal drought-related vegetation indices (NDVI, TDVI and MNDWI) from Landsat and hydro-meteorological variables (precipitation and streamflow) to provide a comprehensive assessment of the impacts of drought on riparian vegetation change along the Buffalo River in South Africa. As such, an integrated approach is crucial in identifying areas vulnerable to drought along the Buffalo River catchment, which may help in mitigating drought risks and potential ecosystem collapse. The change detection method least-squares linear regression and the pixel-wise Pearson’s correlation coefficient were used to evaluate long-term drought trends and the role of hydro-meteorological variables. The broadly used Standardized Precipitation Index (SPI) was employed to assess the frequency and severity of drought over the long term [30,31]. The shorter time scale of 3 months and 6 months SPI are more efficient in identifying short-term droughts, while the longer time scale of 12 months is better for identifying less frequent with longer-lasting drought episodes [32,33]. Hence, this study aimed to assess riparian vegetation response to drought along the Buffalo River catchment in the Eastern Cape Province, South Africa from 1990 to 2020. The specific objectives of the study are to (i) identify riparian vegetation areas vulnerable to drought stress along the Buffalo River catchment between the period 1990–2020 and (ii) assess the frequency and severity of drought impacts on the riparian vegetation change. The outcomes of this study can aid environmental protection managers in the adoption of strategies for preserving riparian vegetation variation from recurrent drought stress along the river-catchment dynamics.

2. Materials and Methods

2.1. Study Area

The Buffalo River Catchment is located between 33°39′ and 33°05′ S and longitude 27°05′ and 27°33′ E spanning 1237 km2 on the east coast of South Africa in the Eastern Cape Province (Figure 1), with an approximately total population of 642,000 inhabitants [27]. The Buffalo River estuary enters the Indian Ocean in the city of East London with the catchment drained by the Buffalo River and runs southeastward towards the Indian Ocean with an elevation of 1200 mean sea level (3900 ft) [25]. The geology of the area is mostly made of marine sediments of the Beaufort Series with the Buffalo River being naturally saline [34]. Rainfall varies from the mountainous landscape and natural forest to the plain in the Northwestern to Southeastern direction [26]. In general, the average minimum temperature is 13.5 °C and can be as low as −3 °C in winter at the hilltop [25]. The average maximum temperature is 22.3 °C across the area while maximum summer temperatures reach 38 °C on the plain, especially at Gwaba town of the Buffalo River catchment [25].
Buffalo River catchment has four dams which are located from north to south comprising the Maden Dam, Rooikrans Dam, Laing Dam and Bridle Drift Dam with a full supply volume of 101 million m3 [28]. Consequently, a large proportion of the Buffalo catchment has been transformed from its natural condition as reported that almost 17% of the total catchment area is degraded thicket and grassland with urban built-up and industrial areas covering almost 12% of the catchment [34]. Along the Buffalo River, four dams supply the main areas of King William’s Town, Zwelitsha, Mdantsane and East London.

2.2. Data Acquisition and Pre-Processing

Satellite imageries obtained from Landsat were used to assess the impact of drought on riparian vegetation changes along the Buffalo River catchment from 1990 to 2020. The first step involves the acquisition of Landsat imageries from the United States Geological Survey (USGS) database (https://earthexplorer.usgs.gov/, accessed on 5 July 2023). Landsat data provide the best spectral bands and ground resolution for efficiently tracking riparian vegetation in the long term and documenting changes in response to drought stress [29]. In this study, the Landsat imageries were processed, mosaicked, and geometrically corrected to the World Geodetic System (WGS84) coordinate system and clipped using the boundary of the Buffalo River catchment. Landsat data were acquired at a spatial resolution of 30 m with a cloud cover of less than 10% during the observed period. The data were grouped into five-year intervals to detect the long-term impacts of drought stress on riparian vegetation from 1990 to 2020. The selection of the drought assessment period was informed by the documented literature and information on the onset of drought [20,33]. Consequently, the polygon for South African dams and the dams on the Buffalo River catchment were extracted using the DIVA-GIS database (https://www.diva-gis.org/gdata/, accessed on 7 August 2023). A uniform riparian buffer of 50 m was placed on the Buffalo River and dam layers for this study. The Standardized Precipitation Index (SPI) values were calculated based on precipitation data obtained from eight meteorological weather stations from the Agricultural Research Council (ARC) database. The long-term precipitation data was fitted to the Gamma probability distribution to calculate the SPI values at different time scales [32,33,35] because it is suitable for this type of data. The streamflow data were obtained from the Department of Water Affairs database (https://www.dws.gov.za/Hydrology/Verified/hymain.aspx/, accessed on 9 August 2023). Consequently, the two hydro-meteorological datasets were used to assess the lucid relationship between the variables.

2.3. Image Processing

2.3.1. Normalize Difference Vegetation Index

Riparian vegetation along the Buffalo River often occurs in a narrow pattern. The Normalize Difference Vegetation Index (NDVI) was calculated using the Landsat imagery [36]. The NDVI proposed by [37] was calculated as a ratio between measured reflectivity in the red and near-infrared (NIR) side of the electromagnetic spectrum. The red and NIR spectral bands are mainly affected by the chlorophyll absorption of leaves in green vegetation and the thickness of the green vegetation on the surface. The NDVI values normally range from −0.2 to 0.1 for inland water bodies, snow, deserts, bare soils, and sparsely vegetated areas and between 0.1 to 1 for increasing amounts of vegetation. NDVI values increase with increasing green biomass, positive seasonal changes, and positive factors such as abundant precipitation [36]. Therefore, the NDVI was calculated using Equation (1):
N D V I = ρ n i r ρ r e d ρ n i r + ρ r e d
where, ρ nir is the near-infrared band reflectance and ρ red is the red band reflectance respectively. In this study, the NDVI was calculated using Landsat 5 and 7 (bands 4 and 3) and Landsat 8 (bands 4 and 5).

2.3.2. Transformed Difference Vegetation Index

The Transformed Difference Vegetation Index (TVDI) proposed by [38] was calculated to assess drought impact on riparian vegetation along the Buffalo River catchment [39]. As such, the TDVI was used to reduce the effect of soil brightness, environmental effects, the colour of soil, moisture and shadow and enhance the actual vegetation response to the effects of drought. The TDVI has been tested in previous studies where the index has performed better than other indices for assessing vegetation response to drought [39]. The TDVI has demonstrated high performance in differentiating vegetation cover, especially in arid and semi-arid lands [38,39]. Subsequently, the TVDI was evaluated using Equation (2):
T D V I = 1.5 [ N I R R N I R 2 + R + 0.5 ]
where, R and NIR depict the reflectance in the red and near-infrared spectral bands of Landsat satellite imageries respectively. The output of the TDVI difference imageries was overlaid with the riparian buffer polygon to determine where primary changes (i.e., an increased or decreased and/or remained the same) might have occurred during the period of the study.

2.3.3. Modified Normalized Difference Water Index

The Modified Normalized Difference Water Index (MNDWI) was extracted with the near-infrared RNIR as a reference wave band using the short infrared wave band (SWIR) [37]. The MNDWI was originally developed for use with Landsat TM bands 2 and 5, and applicable with other Landsat imagery such as Landsat 4/5 and 7 (bands 2 and 5) used for this study. The MNDWI was used to supervise the soil moisture state and the status of the water bodies. Furthermore, Landsat 8 (bands 3 and 6) were subsequently used respectively. Therefore, the MNDWI was calculated using Equation (3):
MN D W I = G r e e n S W I R G r e e n + S W I R
When compared with the NDWI water bodies, the MNDWI have greater positive values because water bodies mostly absorb more SWIR light than NIR light [40]. Soil, vegetation, and built-up classes have been evaluated to show smaller negative values because they reflect more SWIR light than green light [41]. The MNDWI values range between −1 (vegetation and land surface) and +1 (freshwater bodies). MNDWI delivers higher positive values of −1 to +1 (i.e., close to one) for water than the near-infrared (NIR) of the NDWI because of the absorption of light. The MNDWI indicator has a stronger ability to reduce disturbances generated by buildings, vegetation, and soils [42]. Numerous studies have used MNDWI for the extraction of information on water bodies including lakes, rivers, ponds, etc. [40,42].

2.4. Standardized Precipitation Index (SPI)

Monthly precipitation data from eight meteorological weather stations employed were obtained from the Agricultural Research Council (ARC) database within the Buffalo River catchment from 1990 and 2020. The selected weather stations for the analysis include the stations covering the catchment areas. Annual precipitation data was used to analyse and derive the Standardized Precipitation Index (SPI) using the RStudio v.4.1 software. The SPI was calculated and analysed into (three, six and twelve-month) intervals from the long-term mean. The SPI has been widely used for drought monitoring and assessment [30,43] due to its ability to produce reliable comparisons of various climatic conditions at different timescales [31]. Equation (4) was used for SPI calculation as follows:
SPI = ( P P * ) / σ p
where, P is the precipitation value for a given time. P * is the mean precipitation over the reference period. σ p is the standard deviation of the precipitation over the reference period. If a value less than zero is consistently observed and it reaches a value of 1 or less, a drought is said to have occurred [44]. When the SPI value becomes positive it indicates the end of a drought, thus the onset of a drought can be described as shown in Table 1. The standardized precipitation index threshold value of ±1 has been widely used to compute the frequency and severity of drought for wet and dry phases over a long term [42,44,45]. Monthly river flow data for the period of investigation was sourced from the Department of Water Affairs database (https://www.dws.gov.za/Hydrology/Verified/hymain.aspx, accessed on 9 August 2023), and subsequently, the mean annual values were evaluated.

2.5. Study Methods

The spatial and inter-annual characteristics of riparian vegetation response to drought were analysed using the NDVI, TDVI, and MNDWI. Annual precipitation and streamflow were evaluated to reveal the degree of correlation between the variables. Consequently, the entire period was characterised into four seasons, which included spring (September–November), summer (December–February), autumn (March–May), and winter (June–August) respectively. The geospatial technique adopted a hybrid methodological approach using ArcGIS v.10.8 and R statistical package (RStudio v.4.1 software) to compute the inter-annual variability of vegetation indices and changes in climatic patterns in response to drought. The change detection allows the identification of changes in the state of drought incidence quantified over a repeated time interval [47]. In this study, the widely adopted change detection method was employed in mapping and assessing riparian vegetation response in a time series interval of five years [48,49]. Post-classification assessments and image differencing techniques [50] were used to identify and approximate the extent of land cover changes in the study area between 1990, 1995, 2000, 2005, 2010, 2015, and 2020 respectively. The least-squares linear regression was used to evaluate the long-term vegetation trends [51] and the role of hydro-meteorological variables including annual precipitation and streamflow during the study period. To better understand the relationship between hydro-meteorological variables and vegetation series along the Buffalo River catchment, the pixel-wise Pearson’s correlation analysis was carried out between streamflow, NDVI, TDVI and MNDWI as dependent variables and precipitation being the independent variable from 1990 to 2020 [45]. The correlation coefficient analysis (rxy) is evaluated in Equation (5):
r x y = i ( x i x ) ( y i y ) i ( x i x ) 2 ( y i y ) 2
where, xi and yi are independent and dependent variables, and x and y are the sample mean values with a value ranging from −1 to 1 respectively.

Classification and Accuracy Assessment

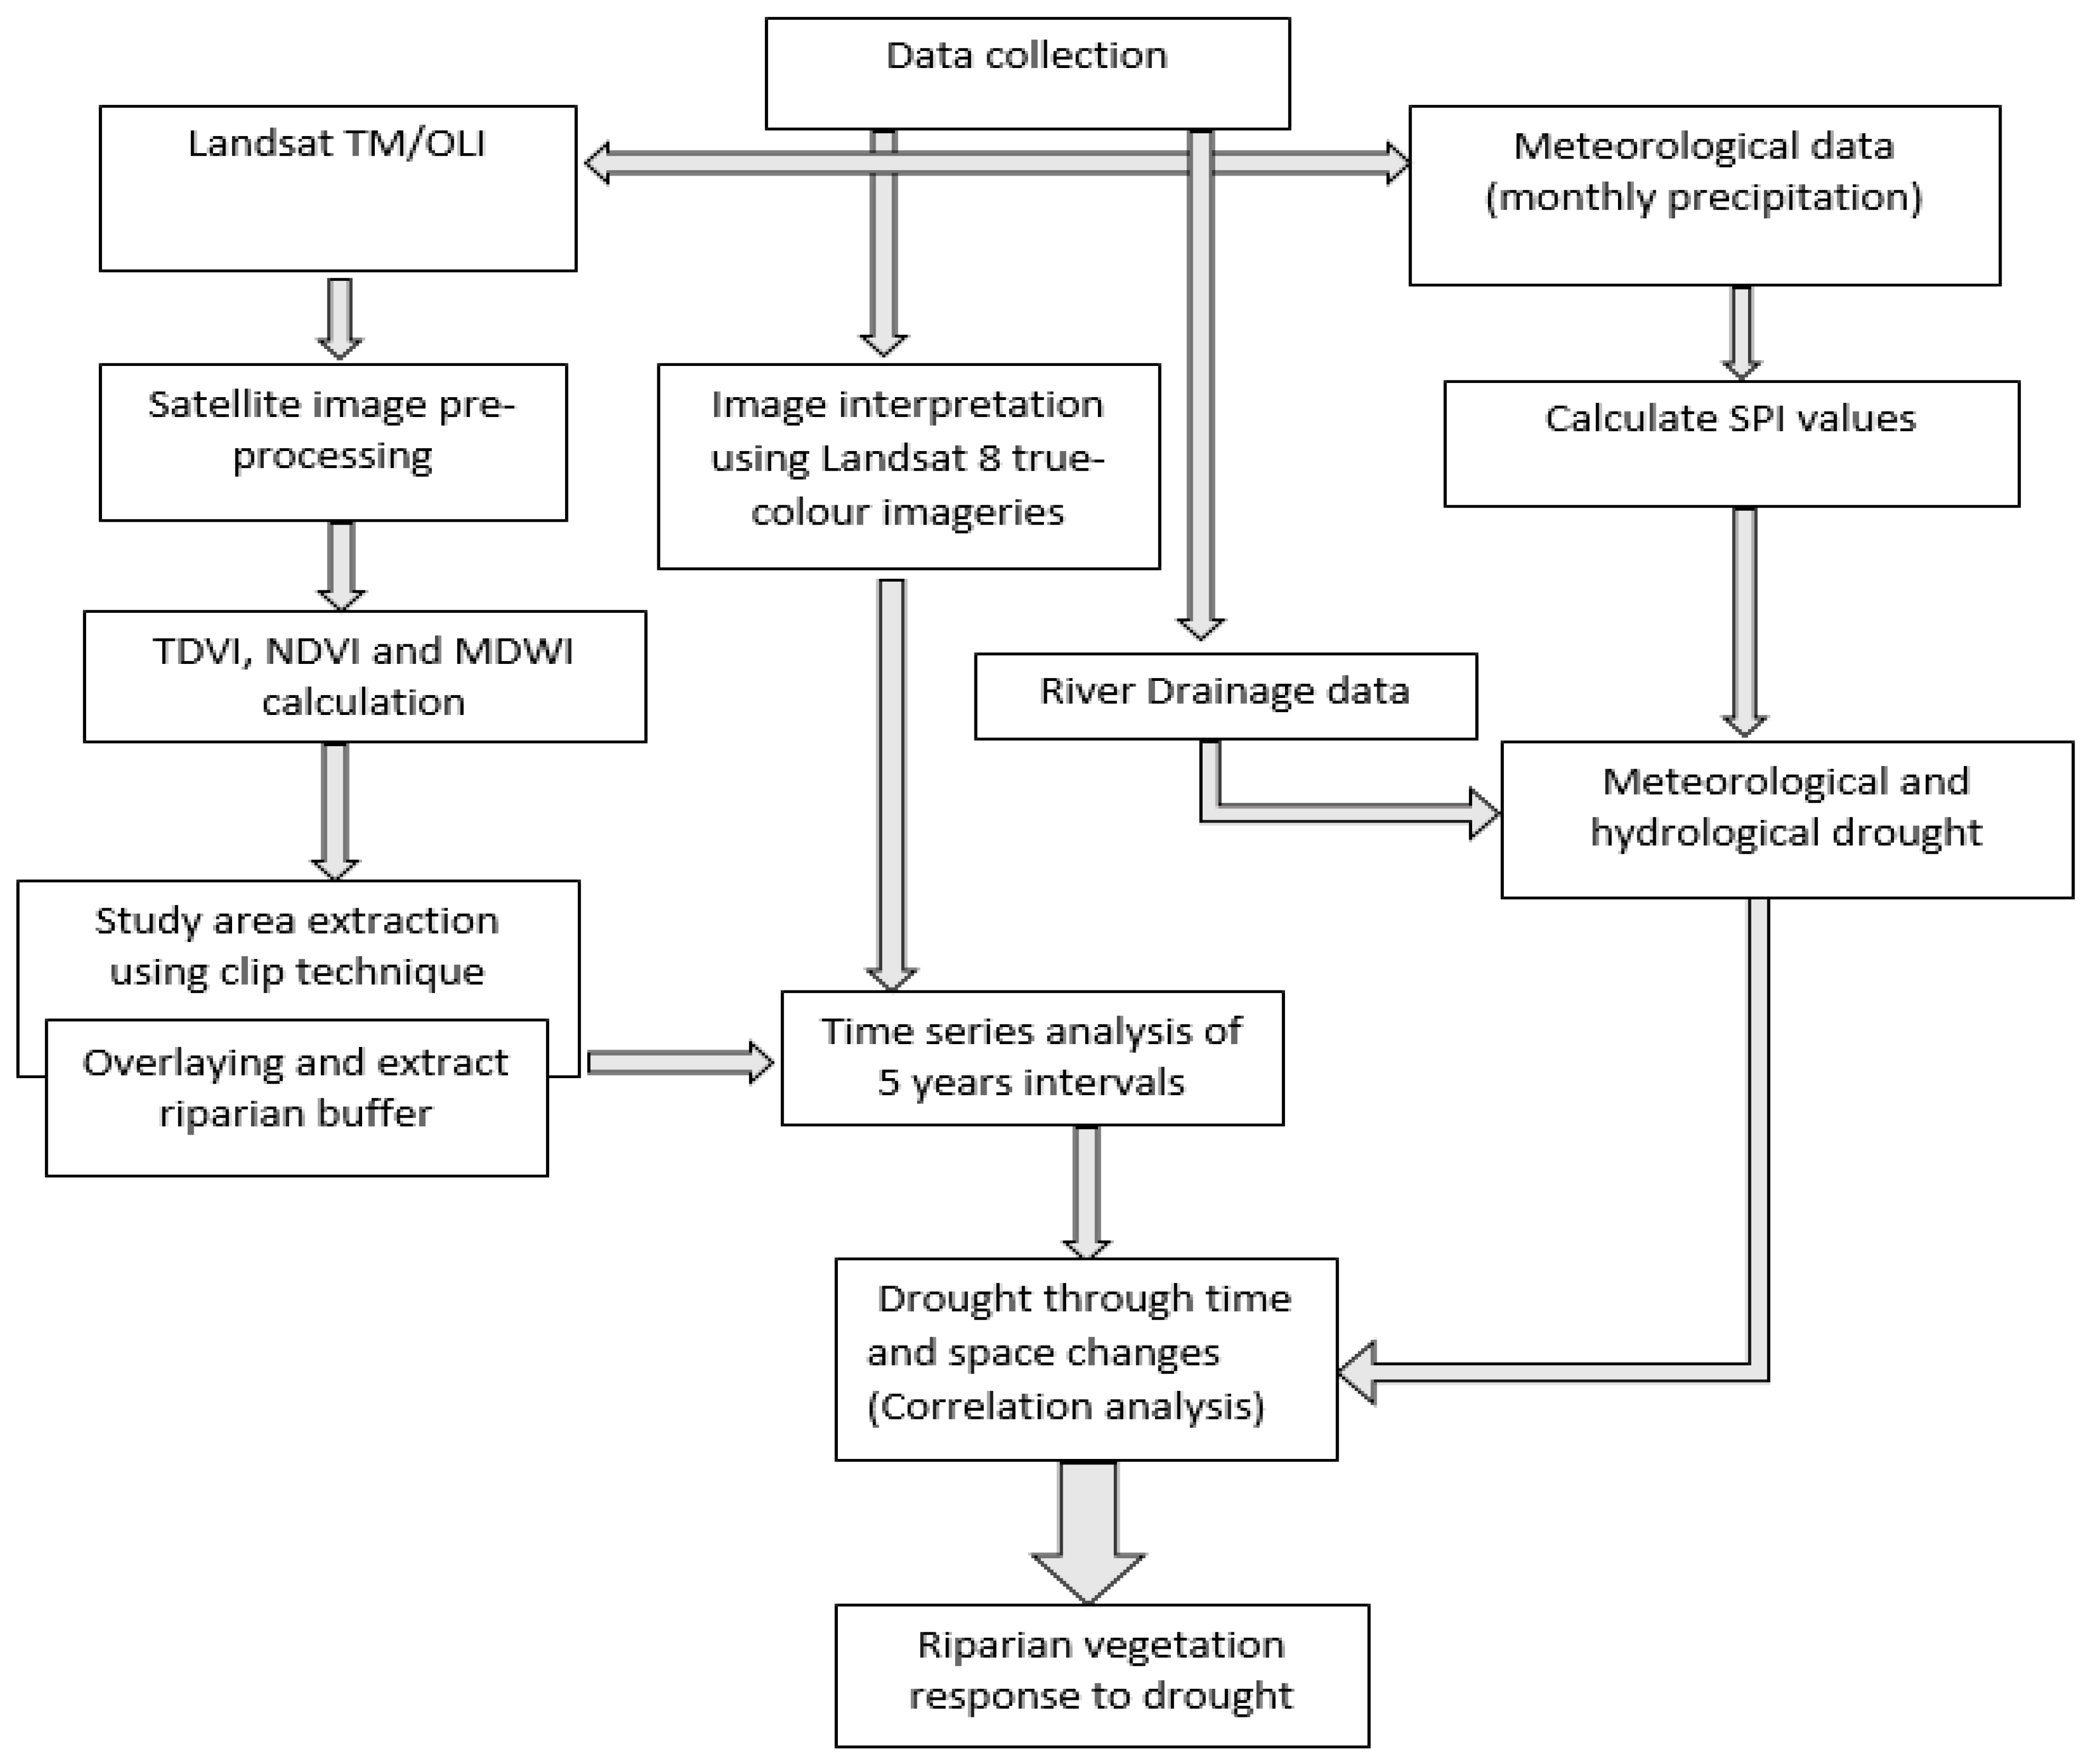
An unsupervised classification was performed on the vegetation index imageries to create user-defined classes and harmonise them into four classes [47]. The quantified classes include dense riparian vegetation, sparse, non-vegetated areas, and water bodies. The accuracy assessment for the derived indices including the TDVI, NDVI and MNDWI was computed through the user, producer, overall accuracy, and validation [12]. Based on the classified maps, change detection was applied to quantify the changes in natural riparian vegetation cover within the area. In addition, Figure 2 shows the flowchart of the methodology for pre-processing and data-processing techniques used for the study. Hence, the study methodology navigates the overall indices and hydro-meteorological variables used for the study period.

3. Results

3.1. Spatial Variation of Buffalo River Catchment Dynamics for TDVI

The inter-annual variation of TDVI from 1990 to 2020 is presented in Figure 3. The results show substantial inter-catchment changes in riparian vegetation over time. As such, these changes vary in the magnitude of TDVI thresholds along the Buffalo River. Overall, the TDVI results revealed the lowest (0.59) and highest (0.77) values between 1995 and 2015 respectively. The largest decrease in TDVI was observed in 2015 (0.59) and 2020 (0.68). The TDVI shows slight variations in the three sections of the Buffalo River Catchment including the upper, middle, and lower reaches. The accuracy assessment of the derived index shows that the accuracy values for TDVI varied from 0.89 to 0.95. In contrast, the highest overall accuracy was witnessed in 2000 at the level of 95.22 and 88.34 in the year 1990 as shown in Table 2.

3.2. Spatial Variation of Buffalo River Catchment Dynamics for NDVI

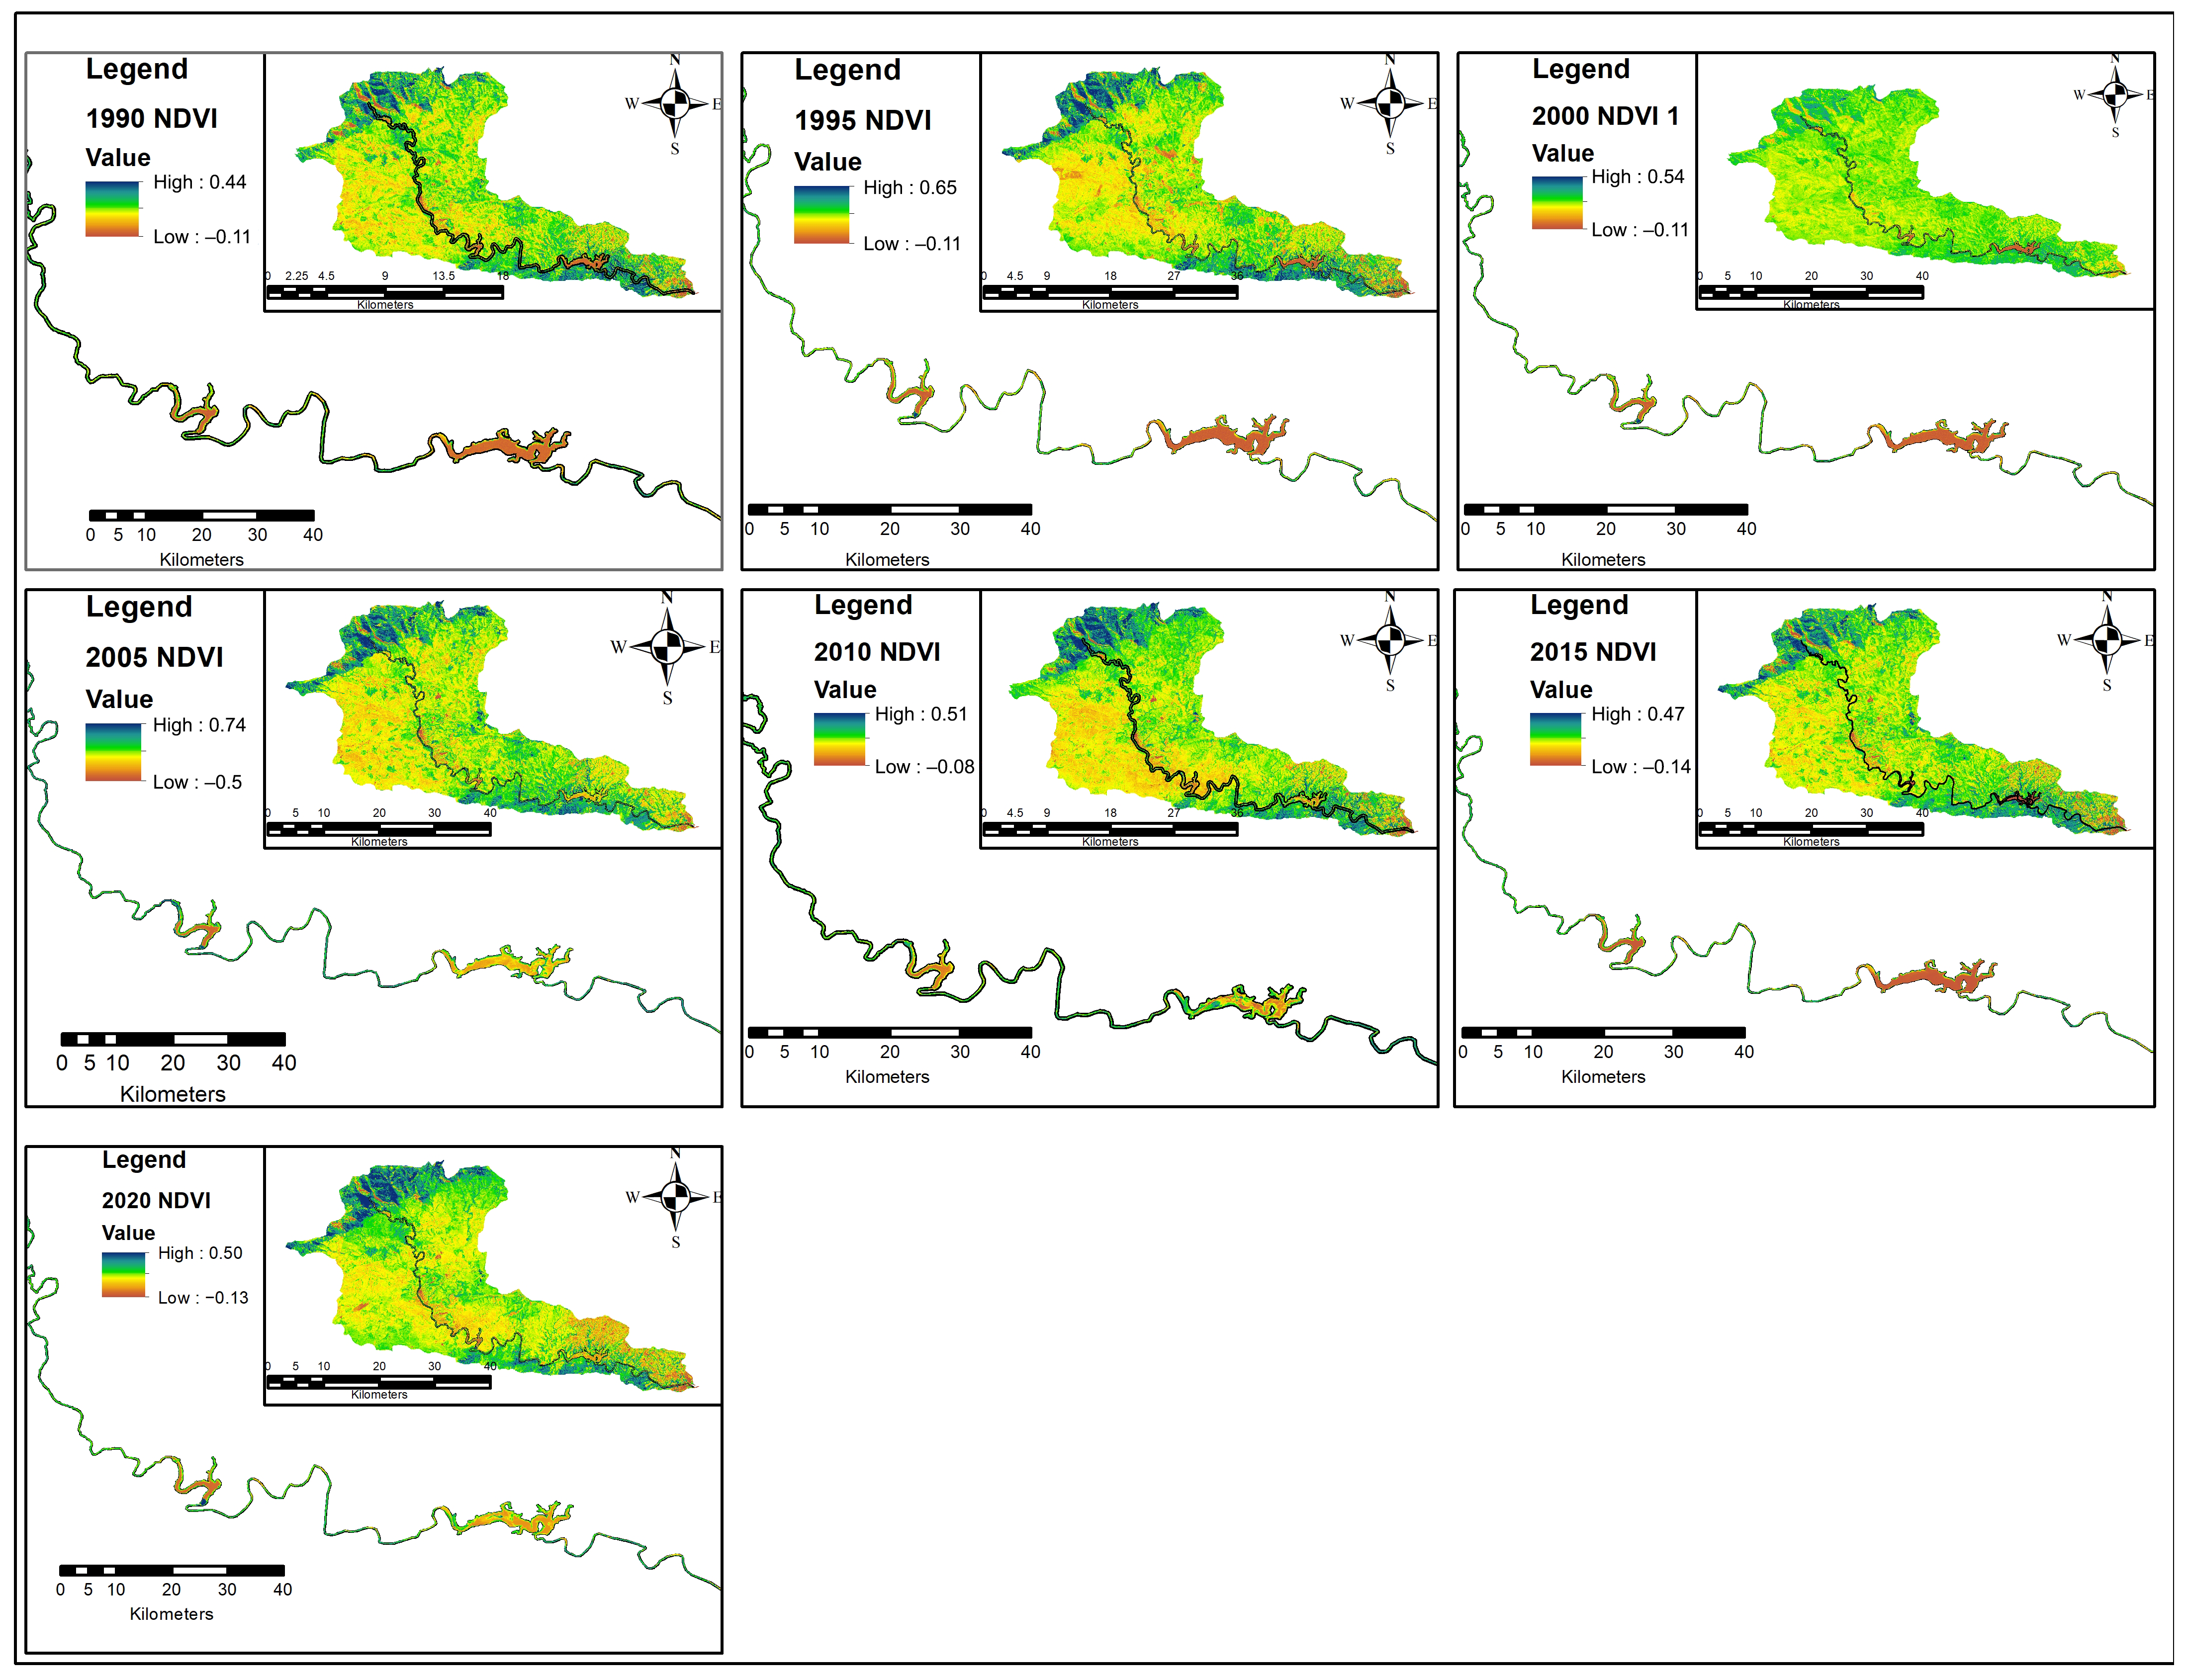
The NDVI algorithm was evaluated to identify the riparian vegetation status over the study area as shown in Figure 4. The inter-annual changes in NDVI revealed a substantial decrease in the riparian vegetative cover along the Buffalo River. The maximum NDVI values ranging from 1990 (0.44), 1995 (0.65), and 2000 (0.54) show some slight variations with maximum NDVI values while the year 2005 witnessed a slight increase of about 0.76. For the subsequent years, the NDVI gradually decreased in 2010 from 0.51 to 0.47 in 2015 followed by a slight increase of 0.50 in 2020. This connotes that there were more decreasing changes in NDVI trend over the last five years specifically between 2015 and 2020 when compared to the previous years. In general, the decrease of vegetation cover density in the study area was witnessed in the middle and lower reaches in combination with precipitation averages, and surface water bodies. Accuracy assessment was performed using random points for the NDVI and TDVI imageries and classification results were obtained. The estimated accuracy of the vegetation cover density and classification results for the study area is presented in Table 3. The accuracy assessment for NDVI results varies between 0.82 and 0.88. The highest overall accuracy was witnessed in 2020 at the level of 88.47% and 82.34% for the year 1990 as shown in Table 3.

3.3. Spatial Variation of Buffalo River Catchment for MNDWI

The inter-annual variation of MNDWI of the Buffalo River catchment is presented in Figure 5. The MNDWI imageries were derived by using the MNDWI algorithm for the 5-year time intervals across the region. By visual interpretation, vegetation was distinguished from water bodies using the MNDWI which enhances the water surface such that the water bodies are depicted clearly from other surface features. The index showed high accuracy (87.47%) even though there was misclassification, especially in the upper catchment areas with dense vegetation. The MNDWI results show that a large part of the Buffalo River catchment was affected by drought over three decades significantly affecting dams, lakes and streams becoming low because of the severe conditions that occurred over the study period. The overall accuracy for the MNDWI values varied between 0.82 and 0.89 as shown in Table 4. The highest overall accuracy was witnessed in 2015 at the level of 94.47 and the lowest was recorded as 85.40 for the year 2005.

3.4. Analysis of Annual Precipitation, Streamflow and Vegetation Series (1990–2020)

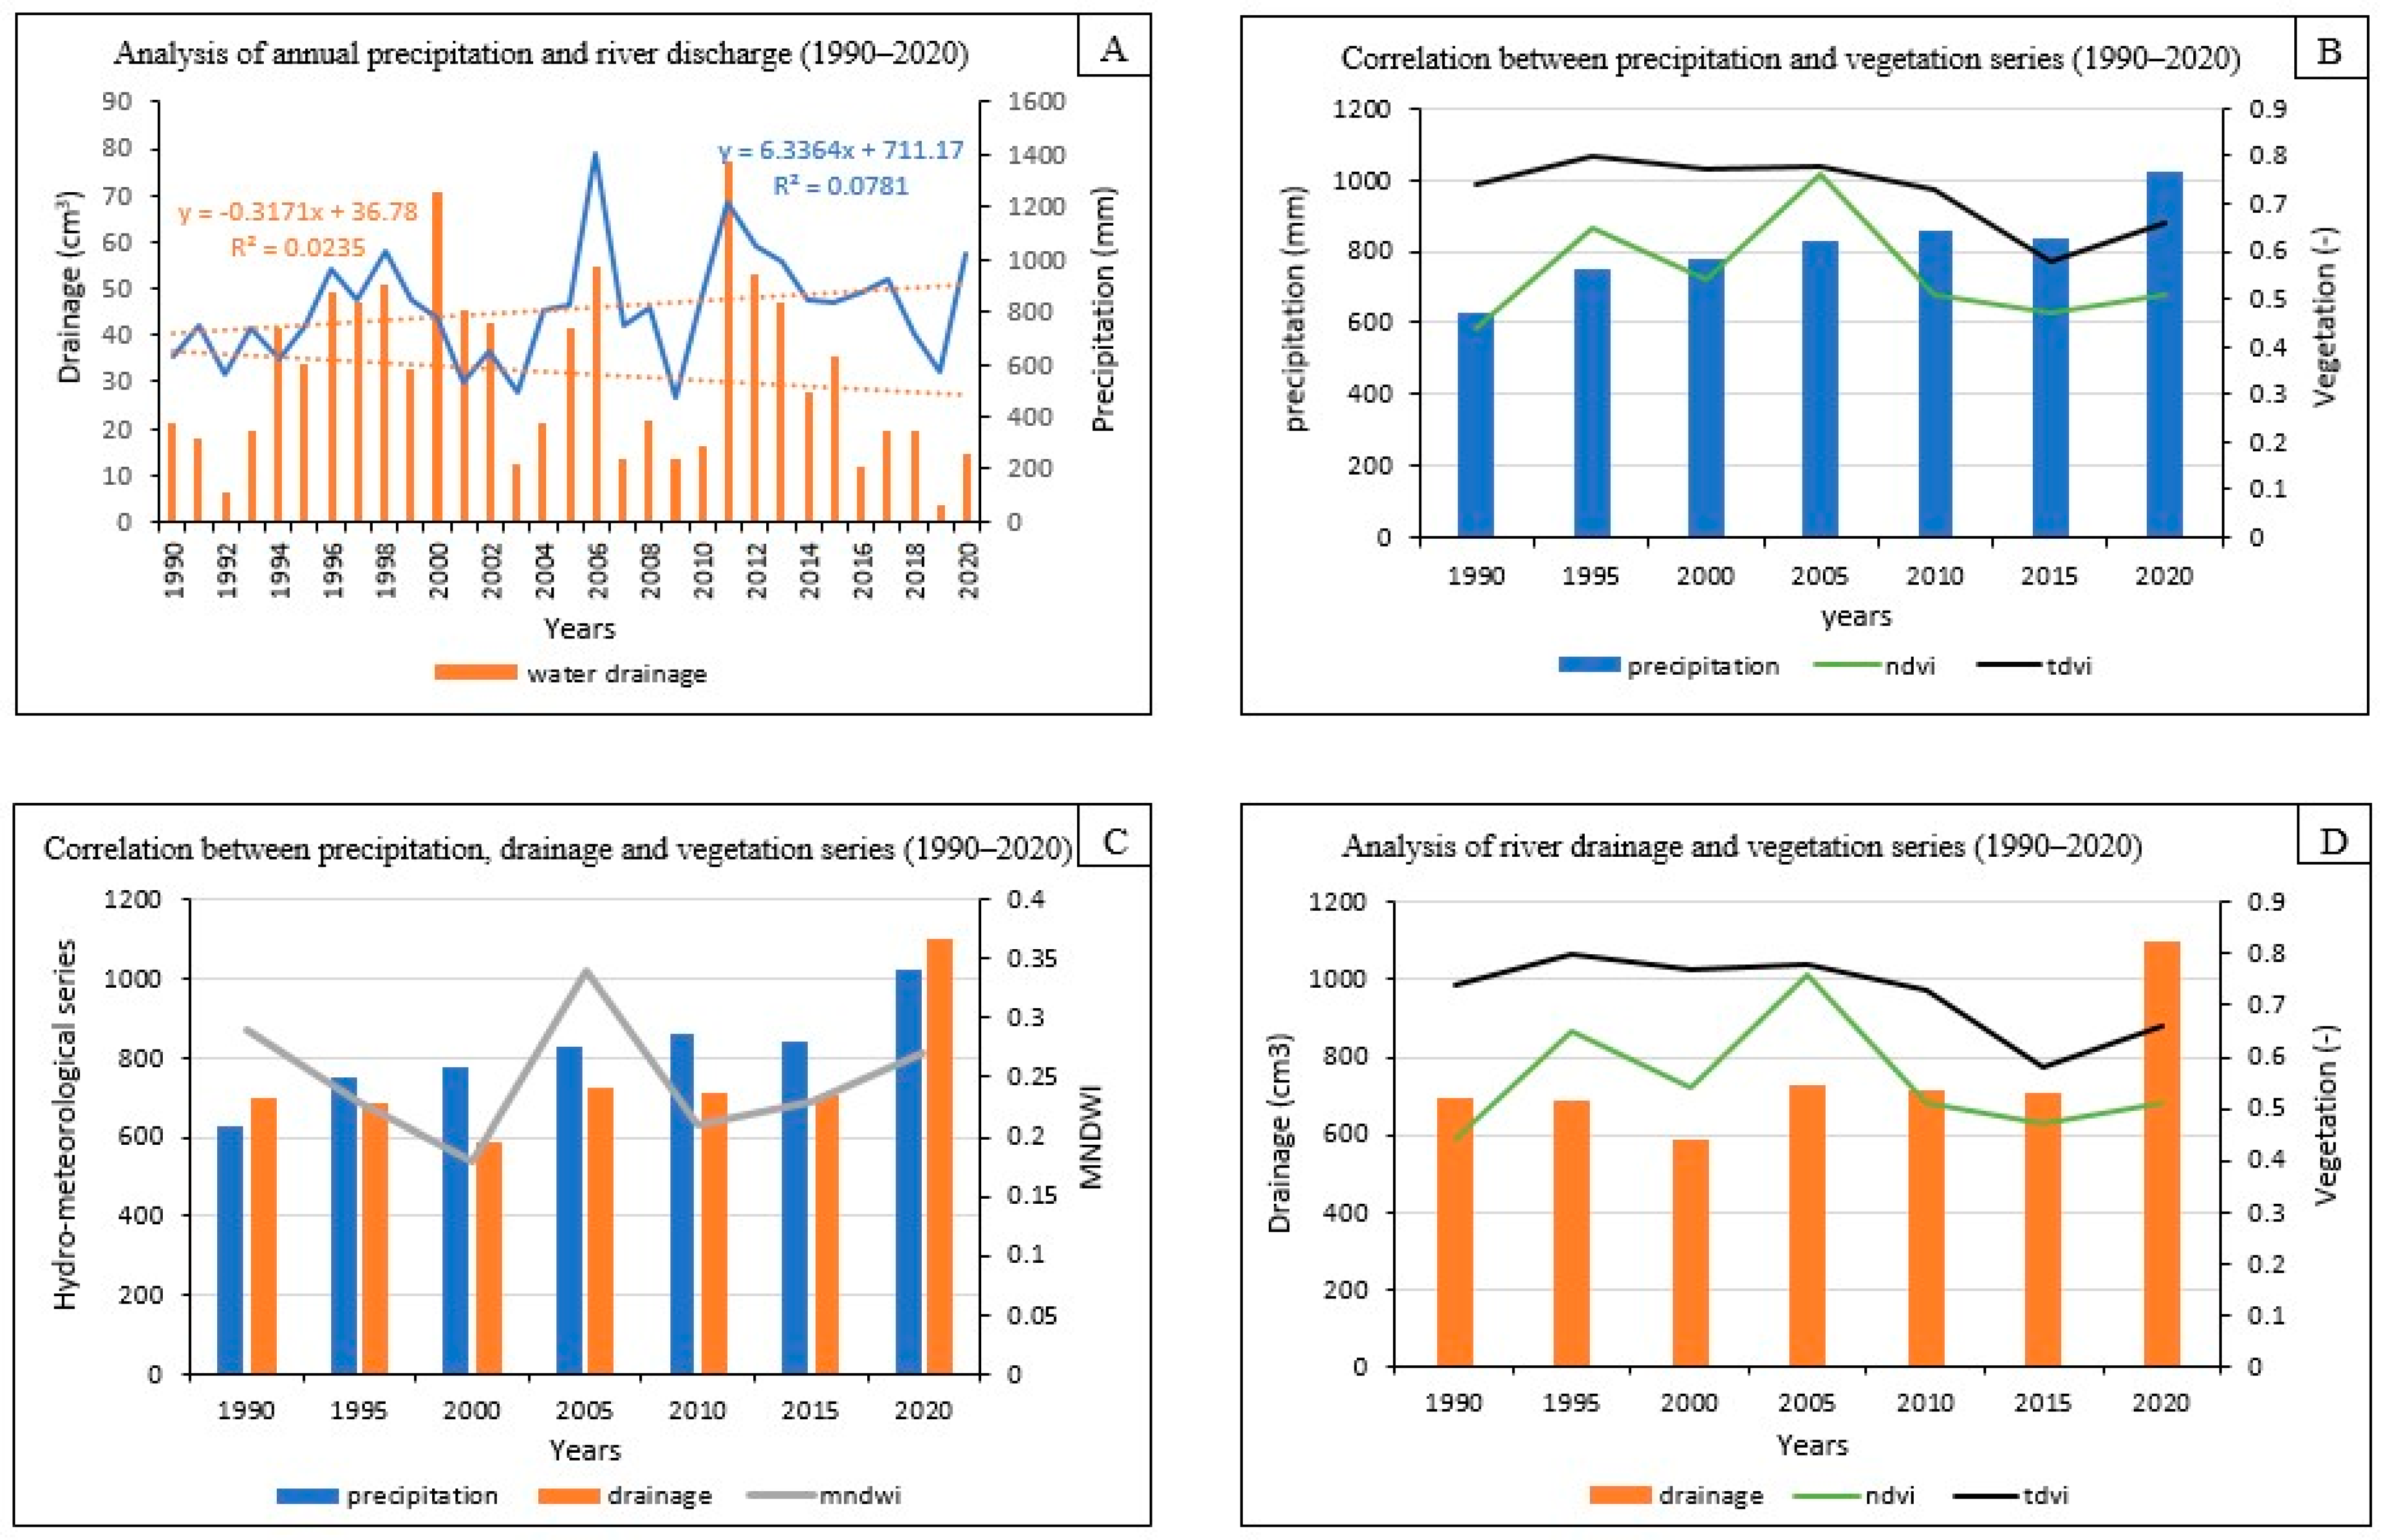
The correlation between annual precipitation and streamflow reveals the changes between drought and relative drought-free years based on the annual precipitation change, vegetation series and streamflow during the study period (Figure 6A). The lowest precipitation peaks were recorded in 1992, 2003, 2007, 2009, 2018 and 2019 respectively. However, the precipitation change depicts a wave-like sinusoidal effect that can be attributed to the significant variation in rainfall across the Buffalo River catchment. These years were associated with the period when drought was most likely linked to El Niño/Southern Oscillation (ENSO) perturbation [52]. The prevalent drought episodes ravaged some croplands and vegetated ecosystems with profound effects on the inhabitants in some parts of southern Africa including South Africa [53]. The streamflow reveals a declining trend in the time series associated with the increased frequency of prolonged drought periods and less precipitation amounts received across the catchment area (Figure 6A). The relationship between annual precipitation and streamflow was relatively low with insignificant positive trends across time scales. Streamflow decreases in some years while precipitation increases in other years which may be due to the complexities created by spatial heterogeneity of different natural and human-induced changes [54].
Figure 6B revealed a time series correlation analysis between precipitation and vegetation series from 1990 to 2020. The hydro-meteorological variables were used to reveal the spatial variation in response to vegetation series (i.e., TDVI and NDVI) along the Buffalo River Catchment dynamics (Figure 6B). Riparian vegetation cover and hydro-meteorological variables (i.e., precipitation and streamflow) exhibited drought variation trends during the study period. The correlation analysis revealed insignificant positive relationships between precipitation and vegetation series suggesting variations in vegetation cover due to the presence of water in the soil [55]. In essence, the NDVI and TDVI trends revealed a similar trend across the Buffalo River with NDVI indicating an insignificant positive correlation during the study period. The period of low vegetation series corresponds with the decrease in rainfall trend and streamflow in some years. For instance, in 1990 and 2005, vegetation cover showed a corresponding increase in above-average rainfall trend while 2010 and 2015 showed a decrease in TDVI, NDVI and rainfall trend (Figure 6B).
Figure 6C shows the correlation between MNDWI and hydro-meteorological time series. The results revealed year-to-year fluctuations in streamflow with less water coverage during the drought period suggesting less than average precipitation over the catchment. At the start of 1995, the inter-annual changes revealed a decline in MNDWI with minor vegetation recoveries from 1995 to 2005 (Figure 6C).
Figure 6D shows the analysis between streamflow and vegetation series. At the start of 2010, the vegetation along the catchment began to show consistency in decline while the reverse was the case for precipitation and the streamflow (Figure 6D). The development may be attributed to the semi-arid microclimate dynamics of the area, which might have impacted the dams and rivers becoming severely low [56]. During the year 2015, the catchment dynamics revealed a decline that coincided with the recurrent dry episodes that occurred from 2015 to 2016, contributing to the reduction in water dam levels [53]. Consequently, the next five years after 2016 exhibited minor vegetation recovery with a positive relationship between precipitation and the streamflow (Figure 6B,D). The development may be associated with the relative recovery gained during the impacted period of proximal catchment discharge and native vegetation cover in the area. Consequently, this might have changed to a certain extent and improved riparian vegetation recovery.

3.5. Standardized Precipitation Index Classification for 3, 6 and 12 Months

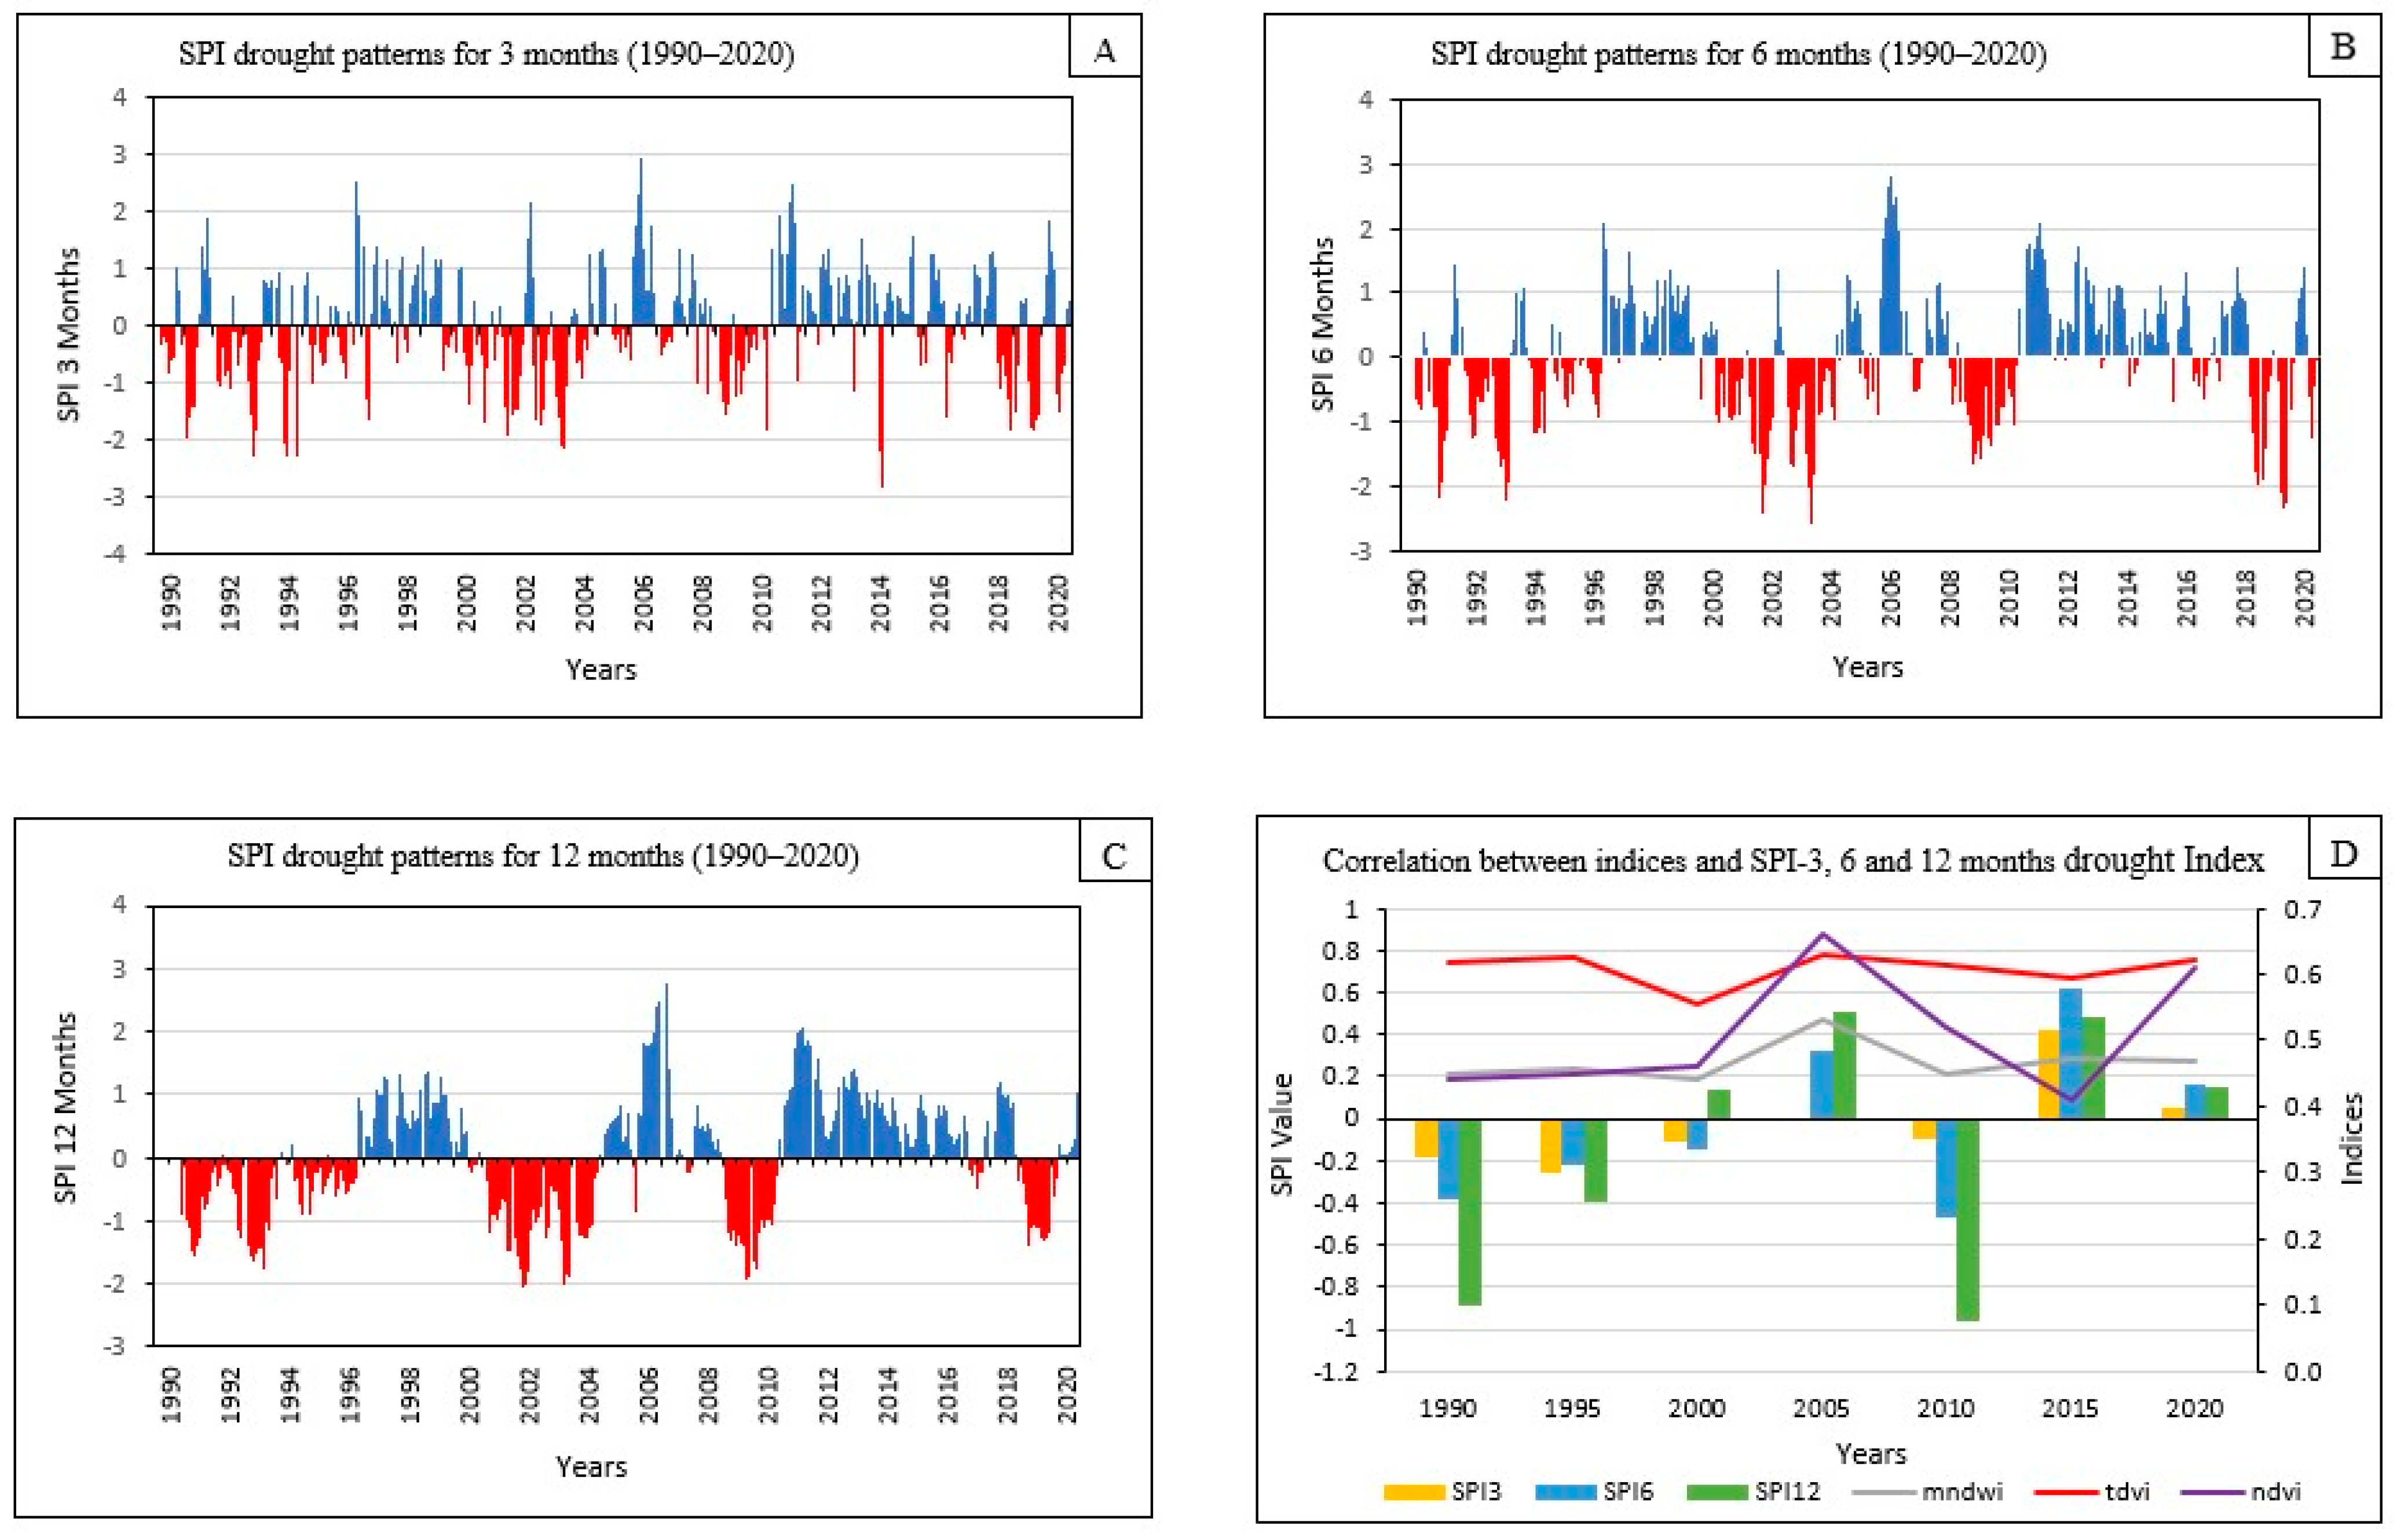
Standardized Precipitation Index (SPI) classification for drought (3, 6, and 12 months) timescales from 1990 and 2020 is shown in Figure 7A–C. The time series precipitation data was used based on the monthly average to calculate SPI for drought at 3-time scales (i.e., 3 months, 6 months, and 12 months) for the study area. Accordingly, the predominant wet years exhibited higher values (blue colour), while the frequent drought years showed lower values (red colour). The research area’s SPI for drought at three-time scales—three months, six months, and twelve months—was determined using the time series precipitation data based on the monthly average. To assess seasonal drought, the entire season was divided into four seasons: winter (June–August), spring (September–November), summer (December–February), and autumn (March–May). Subsequently, the long-time drought and trend were calculated for each season based on the annual and seasonal SPI series of the Buffalo River catchment dynamics.

3.5.1. 3-Months SPI Patterns (1990–2020)

The SPI results of the Buffalo River catchments show that the summer of 2009 was the driest season based on the average SPI values of −1.12 suggesting severe dry conditions (Figure 7A). The year 2005 shows high positive SPI values suggesting wetter-than-average conditions during the summer period. The SPI values for most years in summer seasons are negative indicating severe conditions. During the autumn season, the SPI values exhibit more variations when compared to the summer with both positive and negative values indicating the combination of wetter and drier conditions (Figure 7A). Although no strong consistent trend is apparent. In the winter season, the SPI values show a combination of positive and negative values indicating a fluctuating condition. Some years experienced wetter winters (e.g., 1997, 1.40; 2006, 1.94; 2011, 2.01), while others indicate drier winters (e.g., 1994, −2.29; and 2019, −1.09) as shown in Figure 7A. The 3-month SPI reveals short and medium-term moisture conditions with no clear trend over the long term, suggesting variability in winter precipitation. Similarly, the SPI values for the spring season show a combination of positive and negative values indicating varying precipitation patterns (e.g., 1994, −2.04). Some years have wetter springs (e.g., 2002, 2.14), and others experience drier spring seasons suggesting a fluctuating pattern of spring precipitation (e.g., 2010, −0.71) and the driest month (2018, −1.29; 2019, −1.64) respectively.

3.5.2. 6-Months SPI Patterns (1990–2020)

The 6-month SPI classification timescale for the Buffalo River catchment reveals the precipitation over distinct seasons (Figure 7B). The 6-month SPI values provided the emphasis on the months with the most negative SPI values as they indicate drier conditions when compared to the long-term average. By visual interpretation, we can infer that most negative SPI values for each month exhibit the driest values including January 1992: −1.48; February 1992: −2.11; March 1992: −2.40; April 1991: −2.20; May 1991: −1.95; June 1991: −1.28; July 1991: −1.14; August 2009: −1.59; September 2019: −2.10; October 2019: −2.34; November 2019: −2.25; and December 2019: −2.25 respectively. The 6-month SPI averaged values indicate that the Buffalo River catchment experienced mild inter-annual drought variability. Based on these values, we can infer that March 1992 and October, November, and December 2019 had the most negative SPI values indicating extremely dry conditions during those months as shown in Figure 7B.

3.5.3. 12-Month SPI Patterns (1990–2020)

The 12-month SPI scales reflect long-term precipitation patterns in riparian vegetation change at different time scales within the Buffalo River catchment area (Figure 7C). In the analysis of the 12-month SPI series, certain years exhibited a higher level of drought impact when compared to others in the study area. These periods can have significant impacts on riparian vegetation and river ecosystems. The averaged 12-month SPI values range between −0.23 to −1.19 for the dry episodes and 1.09 to 2.77 for the wet episodes. Specifically, the years 1991–1996, 2000–2004, 2009–2010, 2015, and 2018–2019 were identified as the most drought-affected years (Figure 7C). These periods of reduced precipitation affect the overall health of the river ecosystem which in turn decreases riparian vegetation. In some years, the results show the period of above-normal rainfall with positive SPI values in 1997–1999, 2005–2007, 2011–2016 and 2017 respectively.

3.5.4. Correlation between Indices and SPI Drought Patterns (1990–2020)

Figure 7D shows the SPI drought classification patterns and indices for SPI-3-, 6- and 12-months between 1990 and 2020. The SPI-6 and SPI-12 months for the year 2005 reveal wet years indicating wet years indicating wet years indicating wetter-than-average conditions while the 3-month SPI shows the period of short and medium-term precipitation variations. In 2015, the SPI-3 and 12 months showed a period of above-normal rainfall, particularly for the 6-month SPI drought index. In contrast, the 3- and 6-month SPI in 1990 reveals a dry year, especially for the 12 months where riparian vegetation and agricultural practices are impacted by the stress caused by drought during the study period. More so, the year 2010 shows a period of dry spells for 12 months SPI followed by 6 months and 3 months with the short period which may have impacted agricultural production with a potentially adverse impact on the economy. The years 1990 and 2010 appear to have lower values across multiple indices, indicating potential environmental stress or disturbance as shown in Figure 7D.
Information in Table 5 shows the correlation results between indices and SPI-3, 6 and 12 months drought Index. The negative values in the SPI3, SPI-6, and SPI-12 drought index for certain years reveal periods of drought. The results indicate a weak positive correlation between SPI-3 and NDVI (r = 0.16) and a moderate positive correlation between SPI-3 and TDVI (r = 0.40). This connotes that the NDVI and TDVI may slightly increase as SPI-3 months increase suggesting a potential positive relationship between vegetation indices and the 3-month precipitation. SPI-6 month shows a moderate negative correlation between SPI-6 and NDVI (r = −0.38) while a weak negative correlation was observed between SPI-6 and TDVI (r = −0.14). This suggests that NDVI and TDVI may decrease as SPI-6 months increase, indicating a potential negative relationship between vegetation indices and 6-month precipitation. Overall, there is a strong positive correlation between SPI-6 and SPI-12 (r = 0.86) indicating a strong relationship between SPI-6 and 12-month drought Index. In contrast, the negative correlations between the SPI-6, SPI-12, and the vegetation indices (NDVI, TDVI) suggest that the study area witnessed longer dry periods for (SPI-6 and SPI-12), which may have resulted in a decrease in vegetation health. Moreover, the MNDWI indicates variability in water content over the years with a weak positive correlation between MNDWI and SPI-3 (r = 0.14). This suggests a slight tendency for MNDWI to increase with SPI-3 as shown in Table 5.
Information in Table 6A shows the hydro-meteorological variables and vegetation series from 1990 to 2020. The correlation coefficient and band collection statistics were employed to calculate the correlation matrix. The correlation matrix assessed the spatiotemporal patterns between the inter-annual indices and climate data. The values range between −1 and +1, where 1 indicates a strong association between hydro-meteorological variables and vegetation series. While 0 indicates a neutral relationship, and −1 indicates a weak relationship. The correlation results show an insignificant relationship between vegetation indices (NDVI and TDVI), precipitation and streamflow which indicates the period of riparian vegetation activity in response to surface water level and land cover change (Table 6A). During the dry years, the hydro-meteorological variables indicate a high agreement of vegetation dependency on streamflow while a low vegetation dependency was observed for precipitation along the Buffalo River catchment. A study showed that the higher rainfall received throughout wet years does not necessarily equate to significantly higher vegetation series [57]. Extremely high precipitation is harmful to vegetation and terrestrial ecosystems and leads to erosion while moderate precipitation tends to support vegetation activity. Furthermore, the results of MNDWI revealed a weak correlation coefficient (R = 0.58) between streamflow and precipitation while a high correlation coefficient (R = 0.77) was observed between annual precipitation and streamflow.
Information in Table 6B shows Pearson’s correlation analysis between Precipitation, streamflow, NDVI, TDVI and MNDWI from 1990 to 2020. The correlation analysis evaluates the relationships between precipitation and the variables under review. A moderate positive correlation coefficient of (r = 0.77) was observed for precipitation and streamflow with a p-value of 0.04, which suggests that the correlation is statistically significant at conventional levels. Similarly, the correlation between precipitation and NDVI yielded a moderate positive coefficient of (r = 0.58) with a p-value of 0.17 which connotes an insignificant relationship. The correlation between precipitation and TDVI shows a weak positive relationship (r = 0.24) with an insignificant association with a p-value of 0.29. The analysis indicates a weak correlation (r = 0.24) between precipitation and MNDWI with an insignificant p-value of 0.60 (Table 6B). This connotes spatial heterogeneity in the distribution of rainfall and water bodies in the study area which may have contributed to the weak relationship.
Information in Table 6C shows Pearson’s correlation analysis between streamflow, NDVI, TDVI and MNDWI. The correlation analysis examines the relationships between streamflow and vegetation indices. A moderate positive correlation coefficient of (r = 0.55) between streamflow and NDVI was observed which suggests a potential connection. The associated p-value of 0.20 indicates that this correlation is not statistically significant at standard amounts. Likewise, the correlation between streamflow and TDVI yielded a moderate positive coefficient of (r = 0.47) with an insignificant p-value of 0.29. Furthermore, the analysis shows a weak positive correlation (r = 0.18) between streamflow and MNDWI, with a p-value of 0.70 suggesting an insignificant connection (Table 6C). This may be associated with natural variability in streamflow patterns due to factors such as soil type, topography or vegetation cover can introduce complexities and reduce the strength of the correlation.

4. Discussion

4.1. Hydro-Meteorological Influence on Climate-Related Vegetation Series

The study assessed riparian vegetation change in response to drought stress using multimodal drought-related vegetation indices between NDVI, TDVI, MNDWI and hydro-meteorological variables (precipitation and streamflow) along the Buffalo River Catchment from 1990 to 2020. The vegetation series revealed distinct spatial characteristics of drought across the region in response to hydro-meteorological variations suggesting shifts in riparian vegetation. The TDVI and NDVI reveal spatial patterns in riparian vegetation cover dynamics with the TDVI demonstrating better accuracy in detecting vigorous riparian vegetation change along the river catchment when compared to the NDVI (Figure 3 and Figure 4). The study shows that the changes in riparian vegetation were largely influenced by the declining streamflow, while some years experienced variations in precipitation associated with drought years over the area. Inter-annual and inter-seasonal climate variability predominantly influenced dry years in riparian vegetation change thus, revealing high variability in the inter-seasonal drought trends in the study area (Figure 7A–D). During the period of drought-induced stress, plants and vegetation provide their capacity to bounce back when climatic conditions become more favourable, demonstrating their adaptive capacity to withstand harsh environmental conditions [58]. The dynamic nature of riparian ecosystems and their ability to recover during improved climatic conditions enhance the riparian ecosystem’s resilience and adaptability [59]. For instance, the negative relationship between NDVI, TDVI, precipitation and streamflow exerts a significant influence on the inner catchment changes along the Buffalo River. This presents negative consequences for ecological interactions and water budgets which pose threats to ecosystem services and sustainable human well-being [12]. The recurrent drought experienced along the Buffalo River catchment has lasting impacts on agricultural resources which has led to food and water shortage and ecosystem functioning affecting the local community resilience in the area. Consequently, the resilience capacity of ecosystems in the area is inhibited by the frequency and severity of drought on riparian vegetation over the long term thereby making recovery and resilience multifaceted, particularly in a semi-arid environment.
The inter-annual changes reveal a declining trend in streamflow (R2 = 0.0235) across the catchment over decades indicating dry years with reduced vegetation vigour (Figure 6A). The declining trend of annual streamflow can be attributed to the shifting patterns in precipitation resulting in drought stress [60]. Moreover, precipitation shows an increasing trend (R2 = 0.0781) over time across the catchment. The year 2006 was observed with a high precipitation amount in the study area which indicates a healthy vegetation condition, while 2020 exhibited slight sensitivity to drought (Figure 6A,B). For instance, the drought year of 2015 shows a notable decline in riparian vegetation change as severe drought gripped a large part of the area with significant implications on the water cycle and ecosystem services (Figure 6D). In contexts of hydro-meteorological factors, precipitation and streamflow are two main drivers of riparian vegetation health, if one of these aspects deviates from optimal values, the riparian vegetation becomes stressed and plant productivity declines [15]. The trends in NDVI, TDVI and MNDWI vary along the Buffalo catchment vegetation, thus indicating that the climate characteristics in the microscale areas differ significantly compared to large areas within the river ecosystems [56].
The river catchment flows showed modest year-to-year changes in response to rainfall trend indicating a low streamflow level that can be attributed to the variations in rainfall. The MNDWI revealed changes in the water surface within the dams of the catchment suggesting a reduction in downstream flow during the drought years [22]. Similarly, the riparian vegetation showed a growth trend in years with high streamflow, while the reverse was the case in other years that experienced severe drought (Figure 6D). This suggested that the riparian vegetation in the upper reaches has more time to recover over the period due to the possible continuous streamflow compared to the lower reaches during the drought period. This can be attributed to the perennial condition of the Buffalo streamflow groundwater discharge from the aquifer system that sustains the river catchment flow [26,61], thus causing the riparian vegetation to remain relatively healthy. Consequently, the mid to lower reach of the river has a long past of river regulations and flow management which may considerably influence the rate of change in riparian vegetation growth and performance [62]. This connotes that the climate variability and predictability of streamflow due to drought stress can pose negative impacts on riparian ecology and management. Studies show that drought can result in the reduction of leaf longevity in vegetation, with the length and intensity of the drought playing a significant role [63]. The decrease in water availability limits vegetation health resulting in reduced reflection in the NIR region [64]. Drought impacts can reduce riparian vegetation and drying of soil, which in turn reduces the moisture and volume of soil resulting in significant changes in riverbank [65].
Consequently, the study shows a slight relationship between hydro-meteorological variables and vegetation change indicating spatial heterogeneity in riparian systems sustained by low levels of biodiversity and productivity of riparian vegetation due to various landforms [54]. Depending on land heterogeneity, the response of riparian vegetation has an impact on the regional circulation pattern, resulting in the various responses of hydro-meteorological variables. The seasonal climatology and inter-annual variability of the Buffalo catchment revealed a high spatial heterogeneity in riparian vegetation growth trends (Figure 6 and Figure 7). The findings show that overall, vegetation-covered areas in Buffalo catchment have been decreasing due to climate change and variability, therefore, the decrease of the spatial heterogeneity in riparian vegetation trends requires management and strategic planning. The results showed different patterns and variations between the NDVI, TDVI, MNDWI, precipitation and streamflow. As a result, the increased (decreased) NDVI was linked to a decreasing (increasing) insignificant positive trend in precipitation and subsequently increased (decreased) streamflow as the length of the period increased. A recent study further corroborates the findings of these results based on NDVI trends and precipitation variations in the semi-arid region of South Africa [66]. The results of the riparian vegetation dynamic and hydro-meteorological factors in this study varied seasonally and are largely consistent with the results of previous studies [67,68,69,70,71,72,73]. The deductions from this current study can enable informed decisions for the management and conservation of vital ecosystems in the face of recurrent drought episodes at the catchment scale. Drought-related challenges in the study area permit the adoption of effective strategies and innovative policies and planning for mitigating the adverse impacts of increasing drought risks. Overall, the summary of outputs differs in spatial characteristics at different time scales. Pearson’s correlation analysis revealed a weak positive correlation between precipitation, streamflow and MNDWI and largely insignificant along the Buffalo River catchment. The MNDWI may be attributed to the spectral characteristics and saturation effects of soil type, topography and vegetation cover associated with index sensitivity [74]. Vegetation indices such as NDVI and TDVI showed a moderate positive correlation and hydro-meteorological variables with implications for riparian vegetation change. This means that if one of the hydro-meteorological variables deviates from the standard mean, it will in turn threaten riparian vegetation performance and growth.

4.2. SPI Drought Classification Patterns between 1990 and 2020

The 3-month SPI average values range between −1.50 and −1.19 drought classification. The results show that the summer of 2009 suggested that severe dry conditions dominated most of the landscape while the year 2005 indicated high positive SPI values suggesting wetter-than-average conditions during the summer period (Figure 7 and Table 1). The 6-month SPI average values range between −2.40 and −1.59 drought category. The results indicate mild inter-annual drought variability indicating severe drying conditions during early autumn, summer, and mid-spring months between 1992 and 2019. This can be associated with frequent and recurrent drought episodes that pose significant implications on Buffalo River and dam levels affecting riparian vegetation along the catchment [75,76]. Furthermore, the averaged 12-month SPI values range between −0.23 to −1.19 for the dry episodes and 1.09 to 2.77 for the wet episodes, which suggested moderate to extreme drought conditions (Figure 7 and Table 1). The years 1991–1996, 2000–2004, 2009–2010, 2015, and 2018–2019 were identified as the most drought-affected years with declining precipitation affecting the overall riparian vegetation health within the river ecosystems. During the period of study, some years exhibited periods of above-normal rainfall indicating positive SPI values which corresponds to an increase in streamflow in other years, while the reverse was the case for dry years. As a result, the negative values indicated drier conditions less than the average rainfall while the positive SPI values revealed wet conditions greater than the average rainfall as shown in the classification (Table 1).
To better understand the role of drought on riparian vegetation (NDVI and TDVI), the correlation between different indices and SPI drought index for 3, 6 and 12 months were analysed. The results revealed a moderate positive relationship between NDVI and TDVI at different time scales. The TDVI showed a consistent increase across the study period while NDVI and MNDWI depict an increase in the second decade of the analysis, particularly for the year 2005. The vegetation indices revealed a notable peak in 2005 with a sharp significant decline in 2015 which coincided with riparian vegetation stress as compared to the variation in MNDVI during the study period (Figure 7D). The observed decline might have presented implications for farmers with a further significant effect on food resource processing and losses to different communities especially during drought years as noted in the study. The findings of this study revealed valuable insights into drought dynamics of 6 months and the 12 months SPI of a longer time scale for identifying less frequent droughts with longer-lasting episodes. Therefore, the increased variations in precipitation exert a significant influence on riparian vegetation, owing to their susceptibility to drought stress in the region. The denser riparian vegetation shows years of higher precipitation, whereas the drought years indicate sparse and/or less vegetation growth in the study area.
Additionally, the SPI evaluation revealed the extent and severity of drought impact on riparian vegetation with varying complexities. With the integration of vegetation indices and hydro-meteorological variables, the study offers a more holistic perspective on the complex interplay between hydro-meteorological factors and riparian vegetation health. The magnitude of drought stress in the microscale river catchment contributes to enhancing the accuracy of the assessment. Further research employing observational data instead of reanalysis data is also important to comprehend the impact of water-stressed vegetation change via simulated interactions between riparian vegetation and drought as well as feedback mechanisms within the Buffalo River catchment zone. The integration of different riparian vegetation indices used for this study was relatively coarse, thus revealing overall trends for the entire Buffalo River catchment. This might not have provided enough resolution to precisely distinguish ecological processes including urbanization, land use, warming and ecological restorations. Hence, further studies can use a higher spatial resolution dataset to better assess the sensitivity of riparian vegetation to drought stress and distinguish the effects of external factors such as soil characteristics and human activities on water-stressed vegetation cover. There is a need for further assessment of a larger dataset or sample size to determine a more robust relationship between hydro-meteorological factors and vegetation indices. The study suggests more studies on the integration of remote sensing-based models such as the Riparian Vegetation Response Assessment Index (VEGRAI) and Vegetation Drought Response Index (VegDRI) as drought monitoring tools. This will provide a robust assessment of the use of different datasets to quantify the rate of riparian vegetation status and monitor drought-induced stress on vegetation at both regional and local scales.

5. Conclusions

The least-squares linear regression and Pearson’s correlation coefficient were used to evaluate the long-term drought trends in riparian vegetation cover and the role of precipitation and streamflow during the period from 1990 to 2020. Post-classification assessments and image differencing techniques were used to identify and estimate the extent of land cover changes. Change detection technique was employed to assess riparian vegetation change in response to drought stress using different vegetation indices (NDVI, TDVI, MNDWI) and hydro-meteorological variables (precipitation and streamflow) along the Buffalo River Catchment, in the Eastern Cape Province, South Africa. The study establishes that while the area witnessed variations in precipitation in some years due to droughts, the changes in riparian vegetation were mostly caused by the diminishing streamflow. The major conclusions from this study are summarised below.
  • The change detection technique and Pearson’s correlation analysis show that the NDVI and TDVI were significant indices for detecting water-stressed vegetation in river catchment dynamics. Much of these changes were reflected for MNDWI in dry areas with a higher accuracy (87.47%) and dense vegetation in the upper catchment areas.
  • The correlation results revealed a moderate positive correlation (r = 0.77) between the precipitation and streamflow with a significant p-value of 0.04 suggesting consequences on riparian vegetation health. Concurrent with the precipitation, the vegetation trends showed that precipitation increased insignificantly with less of an influence while the reverse was the case with the streamflow in the long term.
  • The standardized precipitation index (SPI) revealed the inter-annual and inter-seasonal variations in drought-stressed years between 1991–1996, 2000–2004, 2009–2010, 2015, and 2018–2019, while 2020 exhibited slight sensitivity to drought. Within context, the last decade exhibited slight sensitivity to drought along the Buffalo River catchment, highlighting the dynamic nature of riparian ecosystems and their ability to recover during improved climatic conditions.
  • The findings of this study revealed valuable insights into drought dynamics of 6 months and the 12 months SPI of a longer time scale for identifying less frequent droughts with longer-lasting episodes. The result of this study can be used to establish a provincial drought monitoring system and risk assessment program, considering the frequency and severity of droughts in the region.
  • The assessment of drought disaster in this study provides guidelines for policymakers on disaster preparedness and response, emphasizing the importance of managing recurrent drought within the river ecosystems.

Author Contributions

Conceptualization, Z.M.; methodology, Z.M.; writing—original draft preparation, Z.M.; writing—review and editing, A.M.K., L.Z. and G.A.A. All authors have read and agreed to the published version of the manuscript.

Funding

This research was funded by The South Africa/Flanders Climate Adaptation Research and Training Partnership (SAF-ADAPT).

Data Availability Statement

Data used in this study is available on request.

Acknowledgments

All thanks to The South Africa/Flanders Climate Adaptation Research and Training Partnership (SAF-ADAPT), the Risk and Vulnerability Science Centre, and the University of Fort Hare, South Africa for creating an enabling environment for research, and to the anonymous reviewers for their wonderful insights that strengthened this paper.

Conflicts of Interest

The authors declare no conflict of interest.

References

  1. Haile, G.G.; Tang, Q.; Hosseini-Moghari, S.M.; Liu, X.; Gebremicael, T.G.; Leng, G.; Kebede, A.; Xu, X.; Yun, X. Projected impacts of climate change on drought patterns over East Africa. Earth’s Future 2020, 8, e2020EF001502. [Google Scholar] [CrossRef]
  2. Tramblay, Y.; Koutroulis, A.; Samaniego, L.; Vicente-Serrano, S.M.; Volaire, F.; Boone, A.; Le Page, M.; Llasat, M.C.; Albergel, C.; Burak, S.; et al. Challenges for drought assessment in the Mediterranean region under future climate scenarios. Earth-Sci. Rev. 2020, 210, 103348. [Google Scholar] [CrossRef]
  3. Svoboda, M.; Fuchs, B.A. Handbook of Drought Indicators and Indices; World Meteorological Organization (WMO) and Global Water Partnership (GWP), Integrated Drought Management Programme (IDMP), Integrated Drought Management Tools and Guidelines Series 2; Taylor and Francis Group: Geneva, Switzerland, 2016. [Google Scholar]
  4. CRED. Centre for Research on the Epidemiology of Disasters. CRED Disasters in Numbers 2021. 2021. Available online: https://cred.be/sites/default/files/2021_EMDAT_report.pdf (accessed on 1 July 2023).
  5. del Tánago, M.G.; Martínez-Fernández, V.; Aguiar, F.C.; Bertoldi, W.; Dufour, S.; de Jalón, D.G.; Garófano-Gómez, V.; Mandzukovski, D.; Rodríguez-González, P.M. Improving river hydromorphological assessment through better integration of riparian vegetation: Scientific evidence and guidelines. J. Environ. Manag. 2021, 292, 112730. [Google Scholar] [CrossRef]
  6. Walz, Y.; Min, A.; Dall, K.; Duguru, M.; de Leon, J.-C.V.; Graw, V.; Dubovyk, O.; Sebesvari, Z.; Jordaan, A.; Post, J. Monitoring the progress of the Sendai Framework using a geospatial model: The example of people affected by agricultural droughts in Eastern Cape, South Africa. Prog. Disaster Sci. 2020, 5, 100062. [Google Scholar] [CrossRef]
  7. Cornejo-Denman, L.; Romo-Leon, J.R.; Castellanos, A.E.; Diaz-Caravantes, R.E.; Moreno-Vázquez, J.L.; Mendez-Estrella, R. Assessing riparian vegetation condition and function in disturbed sites of the arid northwestern Mexico. Land 2018, 7, 13. [Google Scholar] [CrossRef]
  8. Chiang, F.; Mazdiyasni, O.; AghaKouchak, A. Evidence of anthropogenic impacts on global drought frequency, duration, and intensity. Nat. Commun. 2021, 12, 2754. [Google Scholar] [CrossRef]
  9. Dufour, S.; Rodríguez-González, P.M. Riparian Zone/Riparian Vegetation Definition: Principles and Recommendations. Report, Cost Action ca16208 Converges. 2019, p. 20. Available online: https://converges.eu/wp-content/uploads/2019/04/Report_definitions_Riparian_V1-2.pdf (accessed on 1 July 2023).
  10. Kusler, J. Protecting and Restoring Riparian Areas. Association of State Wetland Managers. Windham, ME. 2016. Available online: https://www.nawm.org/pdf_lib/protecting_and_restoring_riparian_areas_kusler_030916.pdf (accessed on 2 July 2023).
  11. Jiang, L.; ·Jiapaer, G.; Bao, A.; Guo, H.; Ndayisaba, F. Vegetation dynamics and responses to climate change and human activities in Central Asia. Sci. Total Environ. 2017, 599–600, 967–980. [Google Scholar] [CrossRef]
  12. Bhunia, G.S.; Chatterjee, U.; Kashyap, A.; Shit, P.K. (Eds.) Land Reclamation and Restoration Strategies for Sustainable Development: Geospatial Technology Based Approach; Elsevier: Amsterdam, The Netherlands, 2021. [Google Scholar]
  13. Hussain, S.; Qin, S.; Nasim, W.; Bukhari, M.A.; Mubeen, M.; Fahad, S.; Raza, A.; Abdo, H.G.; Tariq, A.; Mousa, B.G.; et al. Monitoring the Dynamic Changes in Vegetation Cover Using Spatio-Temporal Remote Sensing Data from 1984 to 2020. Atmosphere 2022, 13, 1609. [Google Scholar] [CrossRef]
  14. Afuye, G.A.; Kalumba, A.M.; Orimoloye, I.R. Characterisation of Vegetation Response to Climate Change: A Review. Sustainability 2021, 13, 7265. [Google Scholar] [CrossRef]
  15. Rusnák em Goga, T.; Michaleje, L.; Šulc Michalková, M.; Máčka, Z.; Bertalan, L.; Kidová, A. Remote sensing of riparian ecosystems. Remote Sens. 2022, 14, 2645. [Google Scholar] [CrossRef]
  16. Orimoloye, I.R.; Belle, J.A.; Ololade, O.O. Drought disaster monitoring using MODIS derived index for drought years: A space-based information for ecosystems and environmental conservation. J. Environ. Manag. 2021, 284, 112028. [Google Scholar] [CrossRef]
  17. Helali, J.; Asaadi, S.; Jafarie, T.; Habibi, M.; Salimi, S.; Momenpour, S.E.; Shahmoradi, S.; Hosseini, S.A.; Hessari, B.; Saeidi, V. Drought monitoring and its effects on vegetation and water extent changes using remote sensing data in Urmia Lake watershed, Iran. J. Water Clim. Chang. 2022, 13, 2107–2128. [Google Scholar] [CrossRef]
  18. Albano, C.M.; McGwire, K.C.; Hausner, M.B.; McEvoy, D.J.; Morton, C.G.; Huntington, J.L. Drought sensitivity and trends of riparian vegetation vigor in Nevada, USA (1985–2018). Remote Sens. 2020, 12, 1362. [Google Scholar] [CrossRef]
  19. Afuye, G.A.; Kalumba, A.M.; Busayo, E.T.; Orimoloye, I.R. A bibliometric review of vegetation response to climate change. Environ. Sci. Pollut. Res. 2021, 29, 18578–18590. [Google Scholar] [CrossRef]
  20. Mahlalela, P.T.; Blamey, R.C.; Hart, N.C.G.; Reason, C.J.C. Drought in the Eastern Cape region of South Africa and trends in rainfall characteristics. Clim. Dyn. 2020, 55, 2743–2759. [Google Scholar] [CrossRef]
  21. Gleser, G.C.; Green, B.L.; Winget, C. Prolonged Psychosocial Effects of Disaster: A Study of Buffalo Creek; Elsevier: Amsterdam, The Netherlands, 2013. [Google Scholar]
  22. Mokgoebo, J.M.; Kabanda, T.A.; Gumbo, J.R. Assessment of the riparian vegetation changes downstream of selected dams in Vhembe District, Limpopo Province based on historical aerial photography. In Environmental Risks; IntechOpen: London, UK, 2018; pp. 65–84. [Google Scholar]
  23. Petersen, C.; Jovanovic, N.; Grenfell, M. The effectiveness of riparian zones in mitigating water quality impacts in an agriculturally dominated river system in South Africa. Afr. J. Aquat. Sci. 2020, 45, 336–349. [Google Scholar] [CrossRef]
  24. Pace, G.; Gutiérrez-Cánovas, C.; Henriques, R.; Carvalho-Santos, C.; Cássio, F.; Pascoal, C. Remote sensing indicators to assess riparian vegetation and river ecosystem health. Ecol. Indic. 2022, 144, 109519. [Google Scholar] [CrossRef]
  25. Slaughter, A.R.; Mantel, S.K.; Hughes, D.A. Investigating Possible Climate Change and Development Effects on Water Quality within an Arid Catchment in South Africa: A Comparison of Two Models. International Congress on Environmental Modelling and Software. 13. 2014. Available online: https://scholarsarchive.byu.edu/iemssconference/2014/Stream-H/13 (accessed on 2 July 2023).
  26. Owolabi, S.T.; Madi, K.; Kalumba, A.M.; Alemaw, B.F. Assessment of recession flow variability and the surficial lithology impact: A case study of Buffalo River catchment, Eastern Cape, South Africa. Environ. Earth Sci. 2020, 79, 187. [Google Scholar] [CrossRef]
  27. Carter, A.; Hunter, A.; Mack, C.; Smith, C.; Mgweba, T. Buffalo River Estuary Situation Assessment Report. EOA Coastal and Environment Service. 2016. Available online: http://www.cesnet.co.za/pubdocs/Buffalo%20River%20Estuary%20Management%20Plan%20295_AH/Buffalo%20River%20Draft%20Situation%20Assessment%20Report%20Full.pdf (accessed on 25 April 2023).
  28. Olaniyan, L.W.B.; Okoh, A.I. Determination and ecological risk assessment of two endocrine disruptors from River Buffalo, South Africa. Environ. Monit. Assess. 2020, 192, 750. [Google Scholar] [CrossRef]
  29. Huylenbroeck, L.; Laslier, M.; Dufour, S.; Georges, B.; Lejeune, P.; Michez, A. Using remote sensing to characterize riparian vegetation: A review of available tools and perspectives for managers. J. Environ. Manag. 2020, 267, 110652. [Google Scholar] [CrossRef]
  30. Hernina, R.; Yandi, S. Drought Analysis by Using Standardized Precipitation Index (SPI) and Normalized Difference Vegetation Index (NDVI) at Bekasi Regency in 2018. In IOP Conference Series: Earth and Environmental Science; IOP Publishing: Bristol, UK, 2019; Volume 280, p. 012002. [Google Scholar]
  31. Mohammed, S.; Alsafadi, K.; Daher, H.; Gombos, B.; Mahmood, S.; Harsányi, E. Precipitation pattern changes and the response of vegetation to drought variability in eastern Hungary. Bull. Natl. Res. Cent. 2020, 44, 55. [Google Scholar] [CrossRef]
  32. Patil, R.; Polisgowdar, B.S.; Rathod, S.; Bandumula, N.; Mustac, I.; Reddy, G.V.S.; Wali, V.; Satishkumar, U.; Rao, S.; Kumar, A.; et al. Spatiotemporal characterization of drought magnitude, severity, and return period at various time scales in the Hyderabad Karnataka Region of India. Water 2023, 15, 2483. [Google Scholar] [CrossRef]
  33. Stefanidis, S.; Rossiou, D.; Proutsos, N. Drought severity and trends in a Mediterranean oak forest. Hydrology 2023, 10, 167. [Google Scholar] [CrossRef]
  34. Thomas, A. Modelling of spatially distributed surface runoff and infiltration in the Olifants River catchment/water management area using GIS. Int. J. Adv. Remote Sens. GIS 2015, 4, 828–862. [Google Scholar] [CrossRef]
  35. Botai, C.M.; Botai, J.O.; Adeola, A.M.; De Wit, J.P.; Ncongwane, K.P.; Zwane, N.N. Drought risk analysis in the Eastern Cape Province of South Africa: The copula lens. Water 2020, 12, 1938. [Google Scholar] [CrossRef]
  36. Gaznayee, H.A.A.; Al-Quraishi, A.M.F.; Mahdi, K.; Ritsema, C. A Geospatial Approach for Analysis of Drought Impacts on Vegetation Cover and Land Surface Temperature in the Kurdistan Region of Iraq. Water 2022, 14, 927. [Google Scholar] [CrossRef]
  37. Xie, Q.; Dash, J.; Huang, W.; Peng, D.; Qin, Q.; Mortimer, H.; Casa, R.; Pignatti, S.; Laneve, G.; Pascucci, S.; et al. Vegetation indices combining the red and red-edge spectral information for leaf area index retrieval. IEEE J. Sel. Top. Appl. Earth Obs. Remote Sens. 2018, 11, 1482–1493. [Google Scholar] [CrossRef]
  38. Hameid, N.A.; Bannari, A. The relationship between vegetation and rainfall in central Sudan. Int. J. Remote Sens. Appl. 2016, 6, 30–40. [Google Scholar]
  39. Al-Ali, Z.M.; Bannari, A.; El-Battay, A.; Hameid, N. Potential of Spectral Indices for Halophyte Vegetation Cover Detection in Arid and Salt-Affected Landscape. In Proceedings of the 2021 IEEE International Geoscience and Remote Sensing Symposium IGARSS, Brussels, Belgium, 11–16 July 2021; pp. 4632–4635. [Google Scholar]
  40. Atefi, M.R.; Miura, H. Detection of flash flood inundated areas using relative difference in NDVI from sentinel-2 images: A case study of the August 2020 event in Charikar, Afghanistan. Remote Sens. 2022, 14, 3647. [Google Scholar] [CrossRef]
  41. Sun, F.; Sun, W.; Chen, J.; Gong, P. Comparison and improvement of methods for identifying waterbodies in remotely sensed imagery. Int. J. Remote Sens. 2012, 33, 6854–6875. [Google Scholar] [CrossRef]
  42. Du, Y.; Zhang, Y.; Ling, F.; Wang, Q.; Li, W.; Li, X. Water bodies’ mapping from Sentinel-2 imagery with modified normalized difference water index at 10-m spatial resolution produced by sharpening the SWIR band. Remote Sens. 2016, 8, 354. [Google Scholar] [CrossRef]
  43. Jordaan, A.J.; Mlenga, D.H.; Mandebvu, B. Monitoring droughts in Eswatini: A spatiotemporal variability analysis using the Standard Precipitation Index. Jàmbá J. Disaster Risk Stud. 2019, 11, 1–11. [Google Scholar]
  44. Rolbiecki, R.; Yücel, A.; Kocięcka, J.; Atilgan, A.; Marković, M.; Liberacki, D. Analysis of SPI as a drought indicator during the maize growing period in the cukurova region (Turkey). Sustainability 2022, 14, 3697. [Google Scholar] [CrossRef]
  45. Du, J.; Fang, J.; Xu, W.; Shi, P. Analysis of dry/wet conditions using the standardized precipitation index and its potential usefulness for drought/flood monitoring in Hunan Province, China. Stoch. Environ. Res. Risk Assess. 2013, 27, 377–387. [Google Scholar] [CrossRef]
  46. McKee, T.B.; Doesken, N.J.; Kleist, J. 1993: The relationship of drought frequency and duration of time scales. In Proceedings of the Eighth Conference on Applied Climatology, American Meteorological Society, Anaheim, CA, USA, 17–23 January 1993; pp. 179–186. [Google Scholar]
  47. Puttinaovarat, S.; Saeliw, A.; Pruitikanee, S.; Kongcharoen, J.; Chai-Arayalert, S.; Khaimook, K.; Horkaew, P. River classification and change detection from Landsat images by using a river classification toolbox. IAES Int. J. Artif. Intell. 2021, 10, 948. [Google Scholar] [CrossRef]
  48. Forkel, M.; Carvalhais, N.; Verbesselt, J.; Mahecha, M.D.; Neigh, C.S.R.; Reichstein, M. Trend change detection in NDVI time series: Effects of inter-annual variability and methodology. Remote Sens. 2013, 5, 2113–2144. [Google Scholar] [CrossRef]
  49. Ayele, G.T.; Tebeje, A.K.; Demissie, S.S.; Belete, M.A.; Jemberrie, M.A.; Teshome, W.M.; Mengistu, D.T.; Teshale, E.Z. Time series land cover mapping and change detection analysis using geographic information system and remote sensing, Northern Ethiopia. Air, Soil Water Res. 2018, 11, 1178622117751603. [Google Scholar] [CrossRef]
  50. Ngcofe, L.; Hickson, R.; Singh, P. The South African land cover change detection derived from 2013_2014 and 2017_2018 land cover products. South Afr. J. Geomat. 2022, 8, 160–177. [Google Scholar] [CrossRef]
  51. Martins, J.A.; Brand, V.S.; Capucim, M.N.; Machado, C.B.; Piccilli, D.G.A.; Martins, L.D. The impact of rainfall and land cover changes on the flow of a medium-sized river in the South of Brazil. Energy Procedia 2016, 95, 272–278. [Google Scholar] [CrossRef]
  52. Hao, Y.; Hao, Z.; Feng, S.; Zhang, X.; Hao, F. Response of vegetation to El Niño-Southern Oscillation (ENSO) via compound dry and hot events in southern Africa. Glob. Planet. Chang. 2020, 195, 103358. [Google Scholar] [CrossRef]
  53. United Nations Office for the Coordination of Human Affairs. Briefing Note: Overview of El Niño Response in East and Southern Africa. 2016. Available online: https://docs.unocha.org/sites/dms/Documents/2016_11_Elnino_Africa_Breakfast_meeting_FINAL.pdf (accessed on 1 August 2023).
  54. Dala-Corte, R.B.; Melo, A.S.; Siqueira, T.; Bini, L.M.; Martins, R.T.; Cunico, A.M.; Pes, A.M.; Magalhães, A.L.B.; Godoy, B.S.; Leal, C.G.; et al. Thresholds of freshwater biodiversity in response to riparian vegetation loss in the Neotropical region. J. Appl. Ecol. 2020, 57, 1391–1402. [Google Scholar] [CrossRef]
  55. Almouctar, M.A.S.; Wu, Y.; Kumar, A.; Zhao, F.; Mambu, K.J.; Sadek, M. Spatiotemporal analysis of vegetation cover changes around surface water based on NDVI: A case study in Korama basin, Southern Zinder, Niger. Appl. Water Sci. 2020, 11, 4. [Google Scholar] [CrossRef]
  56. Nallaperuma, B.; Asaeda, T. The long-term legacy of riparian vegetation in a hydrogeomorphologically remodelled fluvial setting. River Res. Appl. 2020, 36, 1690–1700. [Google Scholar] [CrossRef]
  57. Lang, S.D. The Application of Remote Sensing in Drought Monitoring: A Case Study of KwaZulu-Natal, South Africa. Ph.D. Dissertation, University of KwaZulu Natal, Pietermaritzburg, South Africa, 2017. [Google Scholar]
  58. Zhang, M.; Chen, S.; Liu, W. Disentangling the Complexity of Regional Ecosystem Degradation: Uncovering the Interconnected Natural-Social Drivers of Quantity and Quality Loss. Land 2023, 12, 1280. [Google Scholar] [CrossRef]
  59. Gojon, A.; Nussaume, L.; Luu, D.T.; Murchie, E.H.; Baekelandt, A.; Saltenis, V.L.R.; Cohan, J.; Desnos, T.; Inzé, D.; Ferguson, J.N.; et al. Approaches and determinants to sustainably improve crop production. Food Energy Secur. 2022, 12, e369. [Google Scholar] [CrossRef]
  60. Moazzam, M.F.U.; Rahman, G.; Munawar, S.; Tariq, A.; Safdar, Q.; Lee, B.-G. Trends of rainfall variability and drought monitoring using standardized precipitation index in a scarcely gauged basin of northern Pakistan. Water 2022, 14, 1132. [Google Scholar] [CrossRef]
  61. Banze, F.; Guo, J.; Xiaotao, S. Variability and trends of rainfall, precipitation and discharges over Zambezi river basin, southern Africa: Review. Int. J. Hydrol. 2018, 2, 1. [Google Scholar] [CrossRef]
  62. Slaughter, A.R.; Mantel, S.K. Water quality modelling of an impacted semi-arid catchment using flow data from the WEAP model. Proc. Int. Assoc. Hydrol. Sci. 2018, 377, 25–33. [Google Scholar] [CrossRef]
  63. Schuldt, B.; Buras, A.; Arend, M.; Vitasse, Y.; Beierkuhnlein, C.; Damm, A.; Gharun, M.; Grams, T.E.E.; Hauck, M.; Hajek, P.; et al. A first assessment of the impact of the extreme 2018 summer drought on Central European forests. Basic Appl. Ecol. 2020, 45, 86–103. [Google Scholar] [CrossRef]
  64. Holzman, M.E.; Rivas, R.E.; Bayala, M.I. Relationship between TIR and NIR-SWIRas Indicator of Vegetation Water Availability. Remote Sens. 2021, 13, 3371. [Google Scholar] [CrossRef]
  65. Dobel, A.J.; O’Hare, M.; Gunn, I.; Edwards, F. Streams and rivers: Report card 2020. In About Drought; UK Centre for Ecology & Hydrology: Wallingford, UK, 2020; 16p. [Google Scholar]
  66. Ngobele, F.J. Using Riparian Vegetation Responses in the Mooi River Catchment within an Ecological Water Requirement Framework. Ph.D. Dissertation, North-West University, Potchefstroom, South Africa, 2021. [Google Scholar]
  67. Pace, G.; Gutiérrez-Cánovas, C.; Henriques, R.; Boeing, F.; Cássio, F.; Pascoal, C. Remote sensing depicts riparian vegetation responses to water stress in a humid Atlantic region. Sci. Total Environ. 2021, 772, 145526. [Google Scholar] [CrossRef]
  68. Birtwistle, A.N.; Laituri, M.; Bledsoe, B.; Friedman, J.M. Using NDVI to measure precipitation in semi-arid landscapes. J. Arid. Environ. 2016, 131, 15–24. [Google Scholar] [CrossRef]
  69. Afuye, G.A.; Kalumba, A.M.; Ishola, K.A.; Orimoloye, I.R. Long-Term Dynamics and Response to Climate Change of Different Vegetation Types Using GIMMS NDVI3g Data over Amathole District in South Africa. Atmosphere 2022, 13, 620. [Google Scholar] [CrossRef]
  70. Xu, Y.; Yang, J.; Chen, Y. NDVI-based vegetation responses to climate change in an arid area of China. Theor. Appl. Climatol. 2015, 126, 213–222. [Google Scholar] [CrossRef]
  71. Mathivha, F.I. Drought in Luvuvhu River Catchment-South Africa: Assessment, Characterisation and Prediction. Ph.D. Dissertation, University of Venda, Venda, South Africa, 2020. [Google Scholar]
  72. Koskey, J.C.; M’erimba, C.M.; Ogendi, G.M. Effects of Land Use on the Riparian Vegetation along the Njoro and Kamweti Rivers, Kenya. Open J. Ecol. 2021, 11, 807–827. [Google Scholar] [CrossRef]
  73. Van Zitters, M. Evaluating the Effect of Active Riparian Rehabilitation Initiatives and Investment on Native Vegetation Recovery, in the Berg-Breede Catchment, Western Cape, South Africa. Ph.D. Dissertation, Stellenbosch University, Stellenbosch, South Africa, 2021. [Google Scholar]
  74. Strydom, W.F. The Impact of State-of-Rivers Reporting on People’s Attitudes towards River Conservation: A Case Study of the Buffalo and Hartenbos & Klein Brak Catchments in South Africa. Ph.D. Dissertation, University of Stellenbosch, Stellenbosch, South Africa, 2010. [Google Scholar]
  75. Chakona, A.; Rennie, C.; Kadye, W.T. First record of Lernaea cyprinacea (Copepoda: Lernaeidae) on an imperilled endemic anabantid, Sandelia bainsii (Teleostei: Anabantidae), from the Eastern Cape province, South Africa. Afr. J. Aquat. Sci. 2019, 44, 183–187. [Google Scholar] [CrossRef]
  76. Saha, A.K.; Kashaigili, J.; Mashingia, F.; Kiwango, H.; Mohamed, M.A.; Kimaro, M.; Igulu, M.M.; Matiku, P.; Masikini, R.; Tamatamah, R.; et al. Determination of Environmental Flows in Data-Poor Estuaries—Wami River Estuary in Saadani National Park, Tanzania. Hydrology 2023, 10, 33. [Google Scholar] [CrossRef]
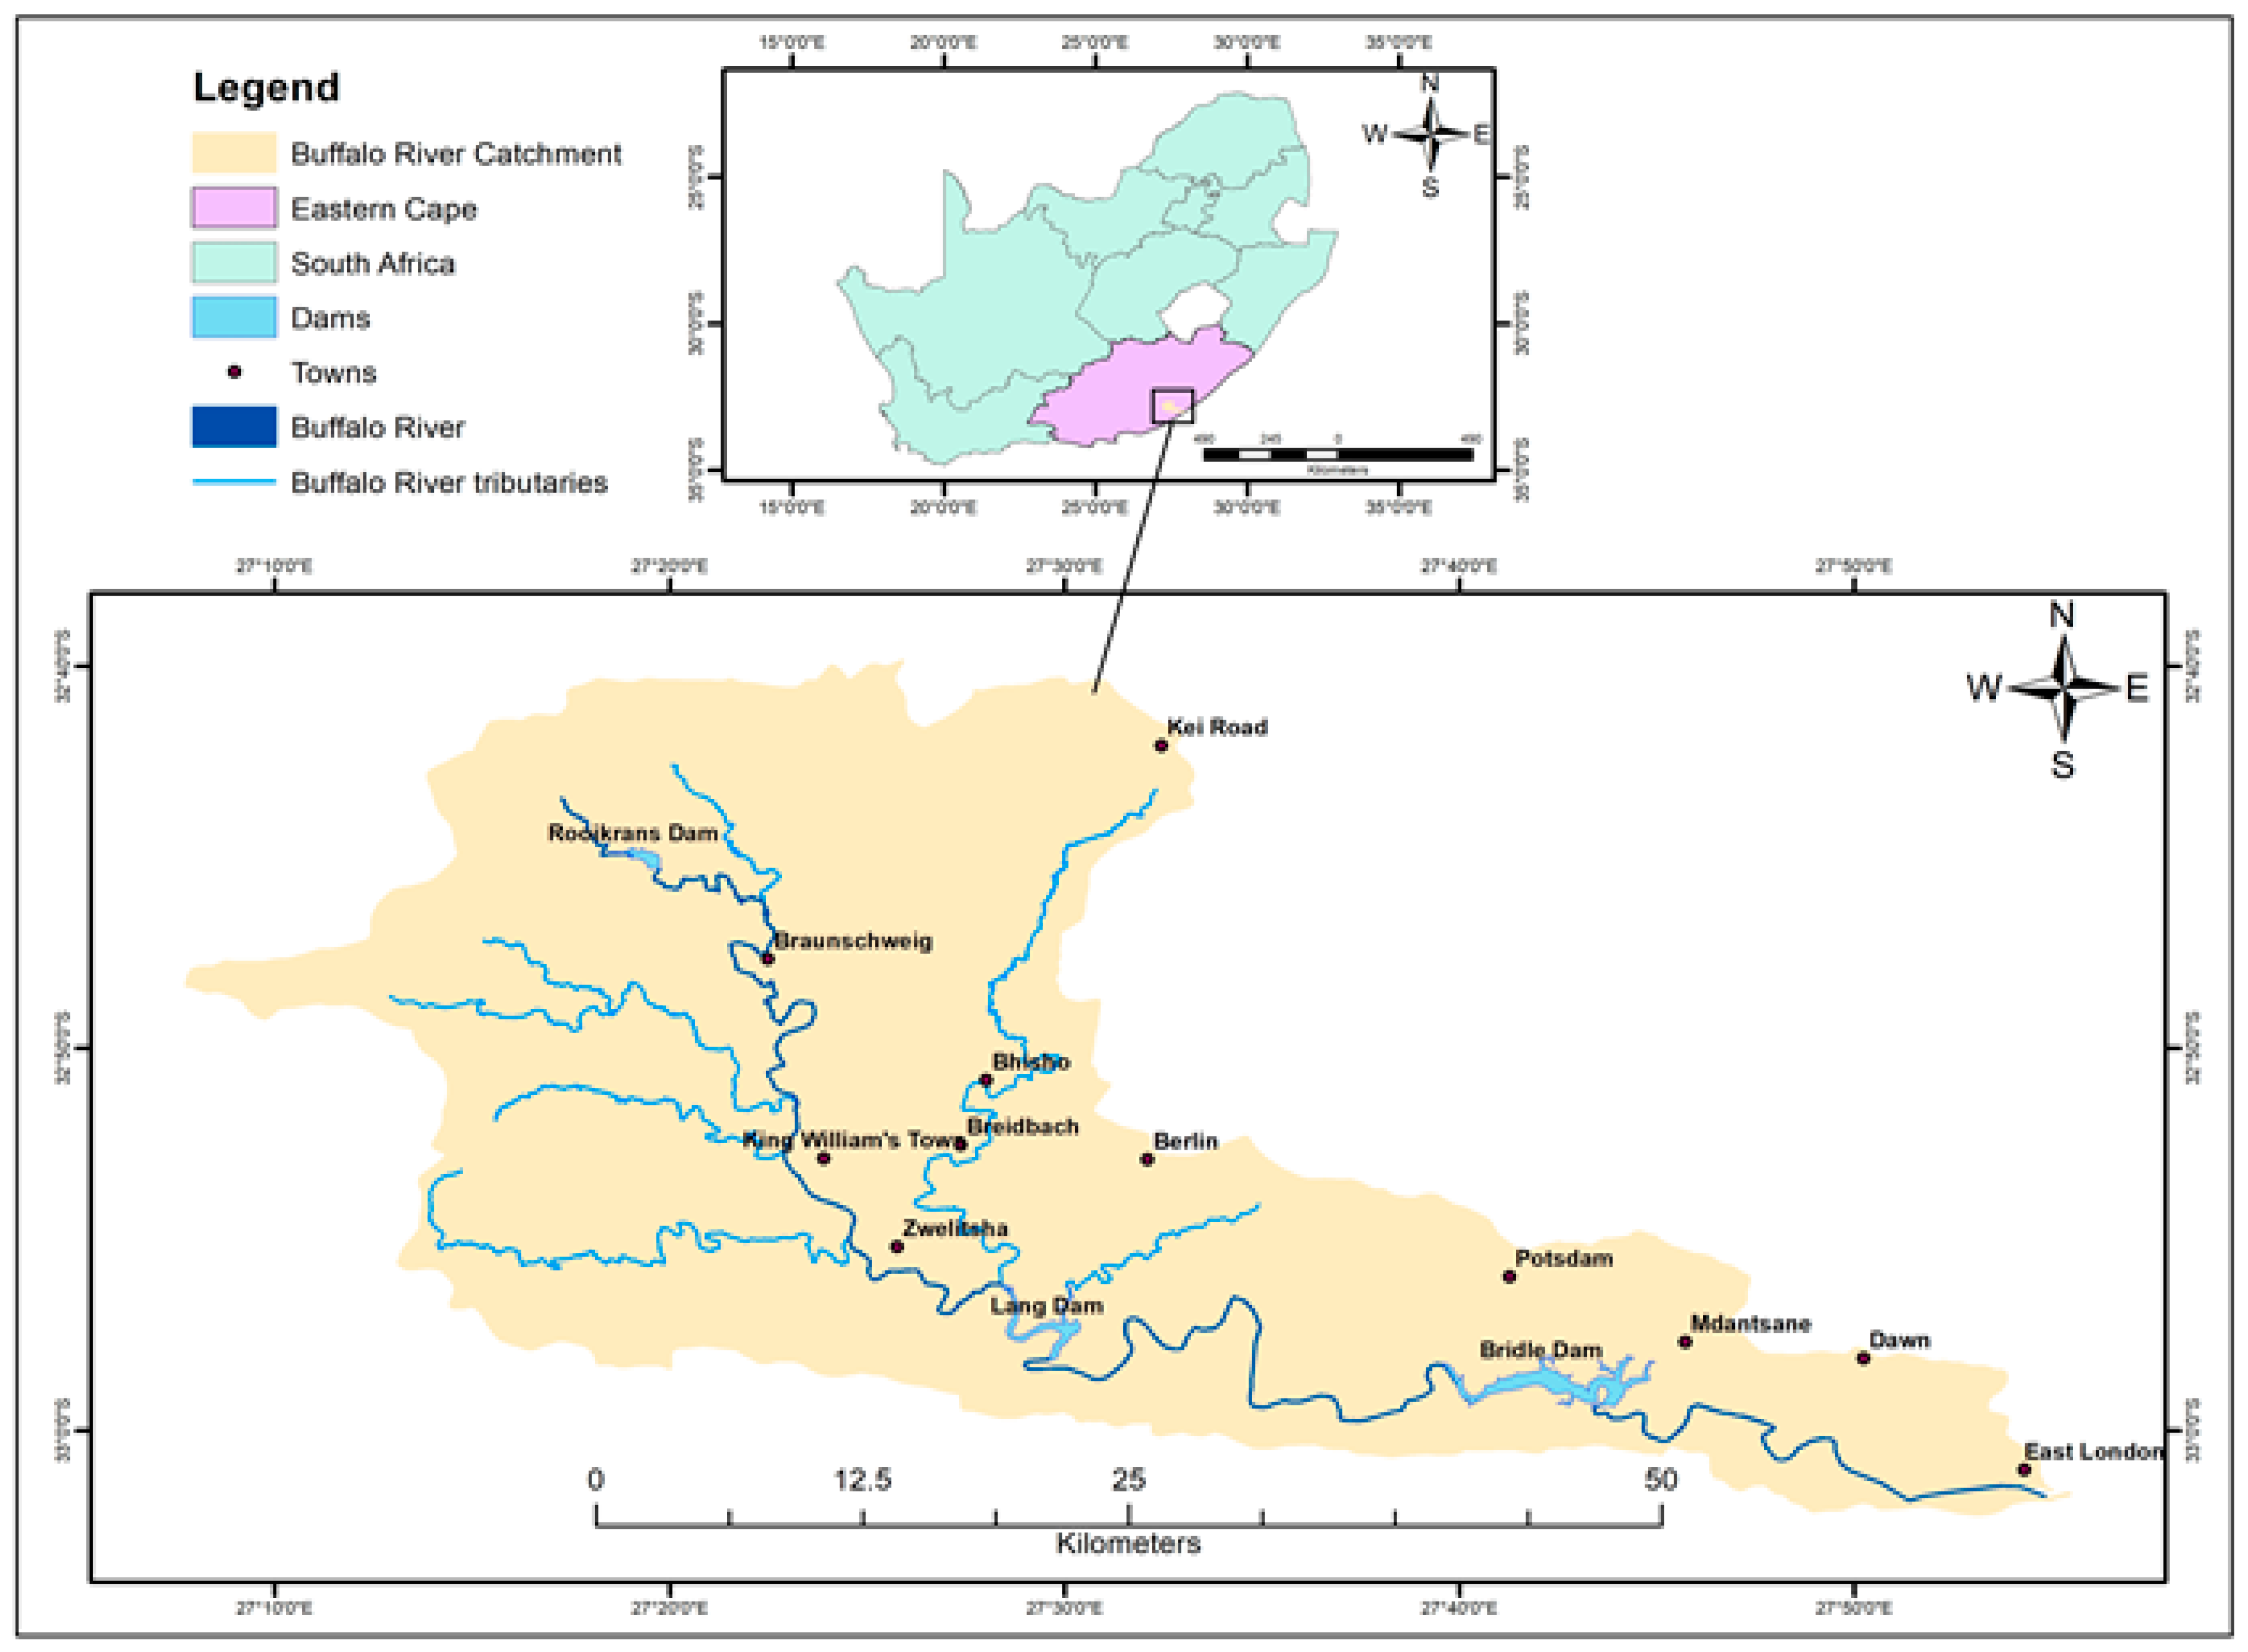
Figure 1. Map of Buffalo River catchment showing dams and its tributaries in the Eastern Cape Province, South Africa.
Climate 12 00007 g001
Figure 2. Flow chart of data preparation and pre-processing.
Climate 12 00007 g002
Figure 3. Spatial and temporal variations of TDVI from 1990 to 2005 along the Buffalo River catchment.
Climate 12 00007 g003
Figure 4. Spatial and temporal variation of NDVI from 1990 to 2020 along the Buffalo River catchment.
Climate 12 00007 g004
Figure 5. Spatial and temporal variation of MNDWI for the Buffalo River Catchment from 1990 to 2020.
Climate 12 00007 g005
Figure 6. Correlation analysis between annual precipitation, streamflow and vegetation series between 1990 and 2020.
Climate 12 00007 g006
Figure 7. SPI drought classification patterns (1990–2020) and correlation between indices and SPI drought patterns.
Climate 12 00007 g007
Table 1. Classification of SPI values (McKee et al., 1993) [46].
SPI ValuesDrought/Wetness Category
2.0+Extremely wet
1.5 to 1.99Very wet
1.0 to 1.49Moderately wet
−0.99 to 0.99Near normal
−1.0 to −1.49Moderate drought
−1.5 to −1.99Severely dry
−2 and lessExtremely dry
Table 2. Accuracy Assessment for TDVI.
TDVI
Years
199020002005201020152020
Kappa coefficient0.910.930.920.890.930.95
Overall classification accuracy (%)88.3495.2291.3195.4194.1891.47
Table 3. Accuracy assessment for NDVI.
NDVI
Years
199020002005201020152020
Kappa coefficient0.790.780.800.880.870.85
Overall classification accuracy (%)82.3484.2285.3185.4184.1888.47
Table 4. Accuracy assessment for MNDWI.
MNDWI
Years
199020002005201020152020
Kappa coefficient0.820.810.730.890.870.85
Overall classification accuracy (%)92.3492.2285.4092.4194.4787.47
Table 5. Correlation results between indices and SPI-3, 6 and 12 months drought Index.
IndicesNDVITDVIMNDWI
NDVI1
TDVI0.441
MNDWI0.070.301
SPI-30.160.400.14
SPI-6−0.38−0.14−0.26
SPI-12−0.40−0.18−0.22
Table 6. (AC) Summary statistics results (1990 to 2020).
(A)
VariablesPrecipitationStreamflowNDVITDVIMNDWI
Precipitation1
streamflow0.771
MNDWI0.580.551
NDVI0.130.470.481
TDVI0.240.180.710.481
(B)
Precipitation and StreamflowPrecipitation and NDVIPrecipitation and TDVIPrecipitation and MNDWI
Coefficient (r):0.770.580.470.24
N7777
T statistic2.701.591.180.56
DF5555
p value0.040.170.290.60
(C)
Streamflow and NDVIStreamflow and TDVIStreamflow and
MNDWI
Coefficient (r):0.550.470.18
N777
T statistic1.491.180.41
DF555
p value0.200.290.70
Disclaimer/Publisher’s Note: The statements, opinions and data contained in all publications are solely those of the individual author(s) and contributor(s) and not of MDPI and/or the editor(s). MDPI and/or the editor(s) disclaim responsibility for any injury to people or property resulting from any ideas, methods, instructions or products referred to in the content.