Article

Microclimate Analysis of Outdoor Showcases in Tropical Climate—Two Case Studies in Al Ain, Abu Dhabi, United Arab Emirates

1
National Research Council of Italy, Institute of Atmospheric Sciences and Climate, 35127 Padua, Italy
2
CMR Center Materials Research snc, 36100 Vicenza, Italy
3
ARS Progetti S.P.A., 00144 Rome, Italy
4
Independent Researcher, 00144 Rome, Italy
5
Conservation Section, Department of Culture and Tourism, Abu Dhabi P.O. Box 94000, United Arab Emirates
*
Author to whom correspondence should be addressed.
Climate 2024, 12(1), 6; https://doi.org/10.3390/cli12010006
Submission received: 23 November 2023 / Revised: 30 December 2023 / Accepted: 3 January 2024 / Published: 6 January 2024
(This article belongs to the Special Issue Climate Variability in the Mediterranean Region)

Abstract

:
Al Ain, near Abu Dhabi, United Arab Emirates, is characterized by hot desert climate with high temperatures, aridity, and almost no rain. Several truncated earthen walls were discovered at the historic house of Sheikh Mohammed Bin Khalifa, a component of the World Heritage Cultural Sites. These remains are preserved in situ, outdoors, protected in glass showcases for public display. As this situation is not documented in the literature, the local Authority has requested to study the showcase environment to optimize conservation. The solar radiation and the projected shades have been modeled over one year; the temperature and humidity inside and outside the showcases, as well as the moisture content, have been measured to assess the potential preservation risks. The paper presents the results, i.e., the direct solar radiation generates extreme conditions of greenhouse effect with extremely high temperatures and forces evaporation from the remains. During the night, the excess moisture condenses on the inner surface of the glass panes, forming large drops that affect viewing and are dangerous for conservation. The repetition of evaporation–condensation cycles accumulates soluble salts on the remains. The paper discusses mitigation strategies (e.g., shading, ventilation, and cooling, to reduce the greenhouse effect) to improve conservation and fruition.

1. Introduction

All heritage places are vulnerable to sea level change and violent weather events, but perhaps archaeological sites are the most vulnerable of all. Archaeological sites which are exposed in areas which are particularly subject to severe winds/sun and sea spray/wave action will require documentation and further action to preserve the burial. Before excavation, most archaeological sites were in a naturally protected environment where they could survive for millennia. After excavation of the burial, they are exposed to weather or to minimal protection, e.g., a roof to protect against rain, but with impacts such as overheating, their environmental conditions have been changed, and thus their expectation of life has been dramatically shortened. The changing patterns of rain, storms and temperature will further impact exposed archaeological remains, and their stabilisation, protection, and use by their associated communities and for research and cultural tourism face many challenges [1]. Archaeological heritage management differs from other forms of heritage management. Its foremost priority remains the preservation of archaeological sites and the material culture they yielded. In the context of economic development, rapid urbanization, and global tourism, historical houses and museums naturally became the safe keepers of the archaeological heritage while providing the general public with a space where the relics could be exhibited [2]. In this respect, many architectural monuments, and even urban districts, are simultaneously archaeological zones because of the underground remains of predecessor buildings [3].
Bait Mohamed Bin Khalifa House (BMBK) [4,5] is a historic house museum, part of The Cultural Sites of Al Ain, UAE, which is a UNESCO World Heritage serial property. The house was built for the late Sheikh Mohammed bin Khalifa Al Nahyan (born 1909–died 1979), the father-in-law of the late Sheikh Zayed bin Sultan Al Nahyan, Founding Father of the United Arab Emirates, and it was rehabilitated in 2021 by the Department of Culture and Tourism—Abu Dhabi, and adapted into a community centre for residents and visitors. It has a permanent exhibition illustrating the nation’s social and architectural past from the 1950s and 1960s.
The house was built in 1958, merging traditional architecture and design with modern materials and building techniques, and for this reason, it is a rare example of a transitional style of architecture. The period of the 1930s–1960s represents, for Abu Dhabi, a time of social and cultural change following the early exploration and discovery of oil. The economic growth helped to stimulate planned urban development and new technological innovations were introduced, particularly in the field of construction, such as the use of reinforced concrete. The traditional vernacular architecture was constructed using local materials like mudbrick, local limestone, gypsum and mortar, and palm trunks and branches. During this transitional period of architecture, new materials like cement and concrete blocks, and new technologies like reinforced concrete, were used in construction, often mixing different techniques and materials or using them in an experimental way, creating a sort of hybrid architectural style.
The house was composed of two two-storied buildings and one service block, organized around a courtyard enclosed by a boundary wall, which is now lost. The house was built up over time. Seven different phases were identified based on building investigations. Archaeological investigations during landscaping and ground reduction works revealed a number of truncated earlier mudbrick, stone, and concrete block walls along the eastern perimeter of the site. It also provided evidence for cooking and food preparation in this area, with several fire pits and a partially buried oven. The archaeological remains were part of an ancient house. The walls were made of local limestone stone and mud, built with the rammed earth technique named pisé, which is especially vulnerable to dampness [6]. The buried remains are around 40 cm high and constitute the foundation of a wall. The oven, called a tanoor (which means “bakery”), was used to cook bread. Its has a circular shape, with mud/clay stones and bricks, and an internal covering of lime plaster. It was built with the bottom below the ground level to avoid wind and to benefit of the natural refractory property of the local ground, thus keeping the selected cooking temperature.
The rehabilitation of the house included the repair and restoration of the buildings and the preservation and exhibition of the archaeological finds that provide an understanding of domestic life in the courtyard as well as the development of the site. These features were exhibited in glass showcases: two outdoors and two indoors. The first outdoor showcase, called the ‘walkway showcase’, preserves earthen foundations of an earlier structure. The second outdoor showcase, called the ‘tanoor’, preserves a circular oven made with mud and brick. Inside the building, in the interpretation room, a linear showcase shows stone foundations of an earlier structure or boundary wall, and another showcase in the classroom shows some remains of old earthen walls. The major problems concerning the outdoor showcases, which are exposed to the intense solar radiation, are different from those of the indoor showcases, which are not considered in this paper.
The two showcases are located in a courtyard, with some garden plants that require minimal watering. In this situation, some water (either from irrigation, or on the occasion of some rare precipitation), may migrate through the porosity of the soil and reach the archaeological remains, increasing their moisture content.
The showcases were built to exhibit the archaeological remains, and at the same time preserve them from harsh environmental conditions, and in particular aeolian erosion, which is typical in desert climates [7,8,9,10]. However, the showcases have generated a particular internal microclimate, different from the original environmental conditions of the relics, and their compatibility had to be assessed.
In the literature, several studies focus on outdoor monuments in mild climates. On the other hand, many archaeological remains are exposed to extreme conditions in a desert climate, and their conservation risk is poorly documented and little known. For instance, hot deserts exist in Australia, and the Heritage Collections Council has published Guidelines to inform about the conservation problems, but without recipes for mitigation. A few examples are reported. The ‘diurnal’ fluctuations are more damaging than relatively large seasonal changes in temperature, where there is plenty of time for materials to adjust to the changed conditions. The other and probably most significant influence of temperature is its relationship with relative humidity ( R H ). High fluctuating temperatures will induce high fluctuating relative humidities, but in the opposite direction, such changes in R H are, in most cases, much more damaging than changes in temperature. As with temperature, a high R H increases deterioration rates of most materials by providing more water to take part in chemical reactions. The main problems caused by too high R H (i.e., R H > 70 % ) are the probability of fungal growth, the corrosion of metals, and the crizzling of glass objects. If R H is too low (i.e., R H < 40 % ), desiccation of organic materials will occur. When there are extreme fluctuations of R H , this creates a dangerous situation. Fluctuations in internal R H levels can be caused by an external fluctuating temperature on a building, direct sunlight being able to enter a building and falling on an object or display case, the turning on and off of incandescent spot lights, an air-conditioning system being turned on during the day and off at night, etc. [11].
At BMBK, two showcases were built around the relics to protect them against the wind erosion, rare precipitation, and unintentional tourism-related injuries. However, the new environmental situation was unknown, and the existing standards do not include directives for this particular situation. The international standards consider the climate in museums and exhibition or storage rooms [12,13,14,15]; the temperature in churches and other places of worship [16]; the ventilation in heritage buildings [17]; and the technical characteristics of showcases in indoor environments [18,19], while the ASHRAE Handbook [15] makes brief comments on some problems of the showcases.
However, despite lacking specific indications to follow, there are some recommendations on research and diagnosis to perform. ICOMOS wrote that before making a decision on structural intervention, it is indispensable to determine first the causes of damage and decay, and then to evaluate the safety level of the structure [20]. Similarly, UNESCO, ICCROM, ICOMOS, and IUCN wrote that it is necessary to establish what information is needed in order to identify and analyse potential risks and to see how they can be reduced [21]. In 2017, at the General Assembly in Salalah, Oman, ICOMOS drafted the Guidelines for the management of public archaeological sites [22]. In the preamble, ICOMOS underlines its opposition to transform the Guidelines into regulations or standards, because archaeological sites are under the rightful control of stakeholders residing in the country and region in which they are located. This explains why there are not standards on this topic. However, the Guidelines recommend some key actions, e.g., (i) to study the environmental impact. An environmental impact assessment should be performed for any proposed development activity that might affect the quality of the environment. (ii) Monitoring system feedback. The results of the monitoring system and programme should be used as decision support tools by site management. (iii) Transparency in monitoring and management. Monitoring results should be made available to all stakeholders on a regular basis [22]. The list drafted by UNESCO of the main risks and impacts on cultural heritage in view of the global warming and climate changes includes the crystallization and dissolution of salts caused by wetting and drying affecting standing structures, archaeology, etc., and biological attacks of organic materials by insects, moulds, and fungi, invasive species such as termites [23]. Indeed, the showcases built around the remains constitute a climate change on the microscale: they protect against wind erosion, rain and accidental impacts, but they might generate other potential risks.
Following the above recommendations, and the novel standard EN 17652 [24], the Conservation Section, Department of Culture and Tourism (DCT), Abu Dhabi, decided to investigate the new environmental conditions and the interactions with the remains, as the first prerequisite to assess potential risks and develop a long-term preservation plan including management, maintenance and prevention. To this aim, DCT appointed a consulting firm working all over the world to provide services, such as surveys, studies, design and technical assistance in fields including cultural heritage and physical infrastructures, and in turn this firm contacted experts in conservation and environmental diagnostic for cultural heritage, with experience in UNESCO commissions and international standardization, to perform a monitoring campaign. This campaign had four tasks: (i) to investigate the micro-environment inside the two outdoor showcases; (ii) to improve public enjoyment by avoiding the formation of drops that prevent the viewing of the archaeological remains; (iii) to improve conservation by verifying whether the extreme environmental conditions that are generated inside the showcases, and their cyclical repetition every day, and every year, constitute a risk for the conservation of the archaeological remains; (iv) to suggest mitigation measures.
With this paper, for the first time, a comprehensive case study concerning outdoor showcases in a hot desert climate, under strong solar irradiation along the Tropic of Cancer, is published. The specific aims are to present the results after one year of environmental monitoring at BMBK; to present the results of a model concerning the daily and annual solar motions in the Tropic, the projected shades and the solar radiation impinging on the two showcases; to discuss the consequences of the extreme greenhouse effect that develops inside the showcases; to discuss the forced evaporation and the subsequent condensation of moisture on the glass panes; to discuss possible mitigation measures; to consider their feasibility and transferability to other similar cases.

2. Study Area

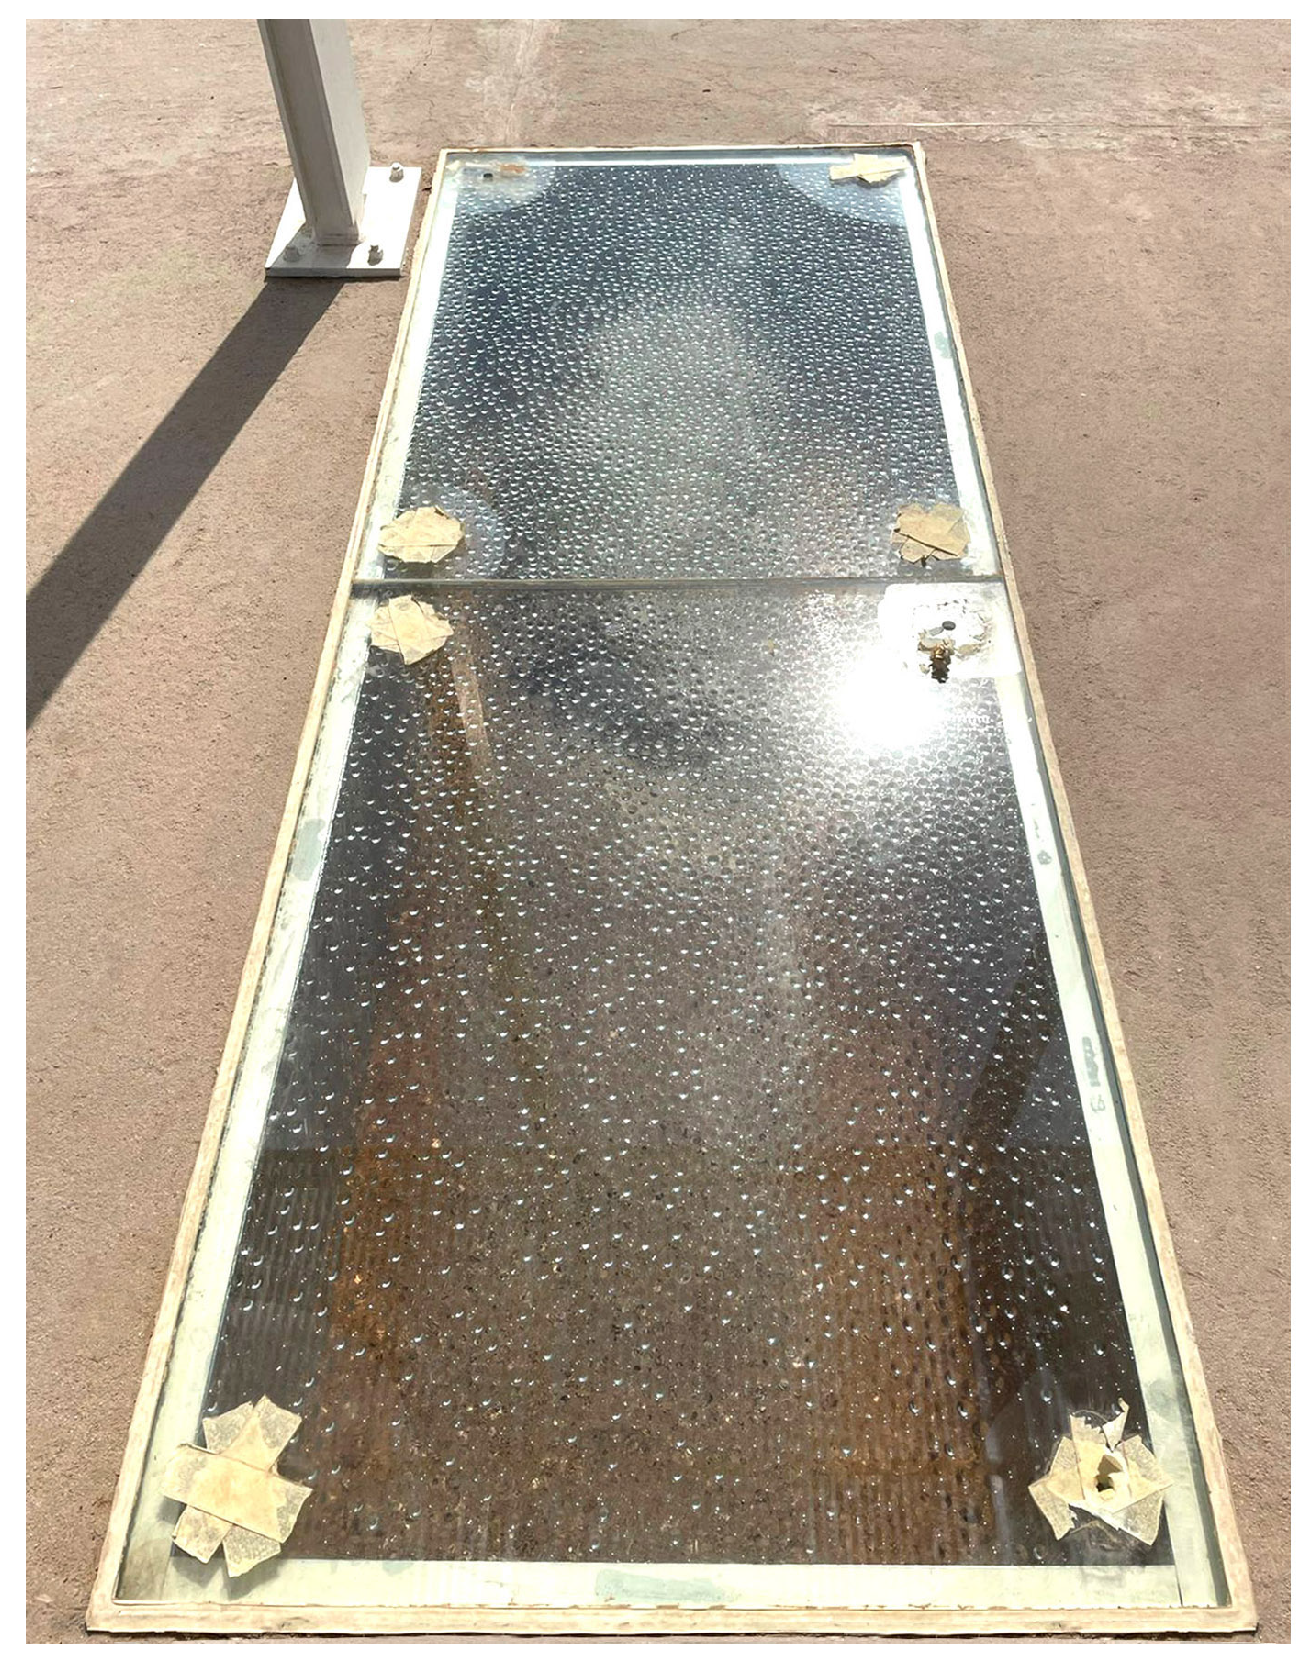
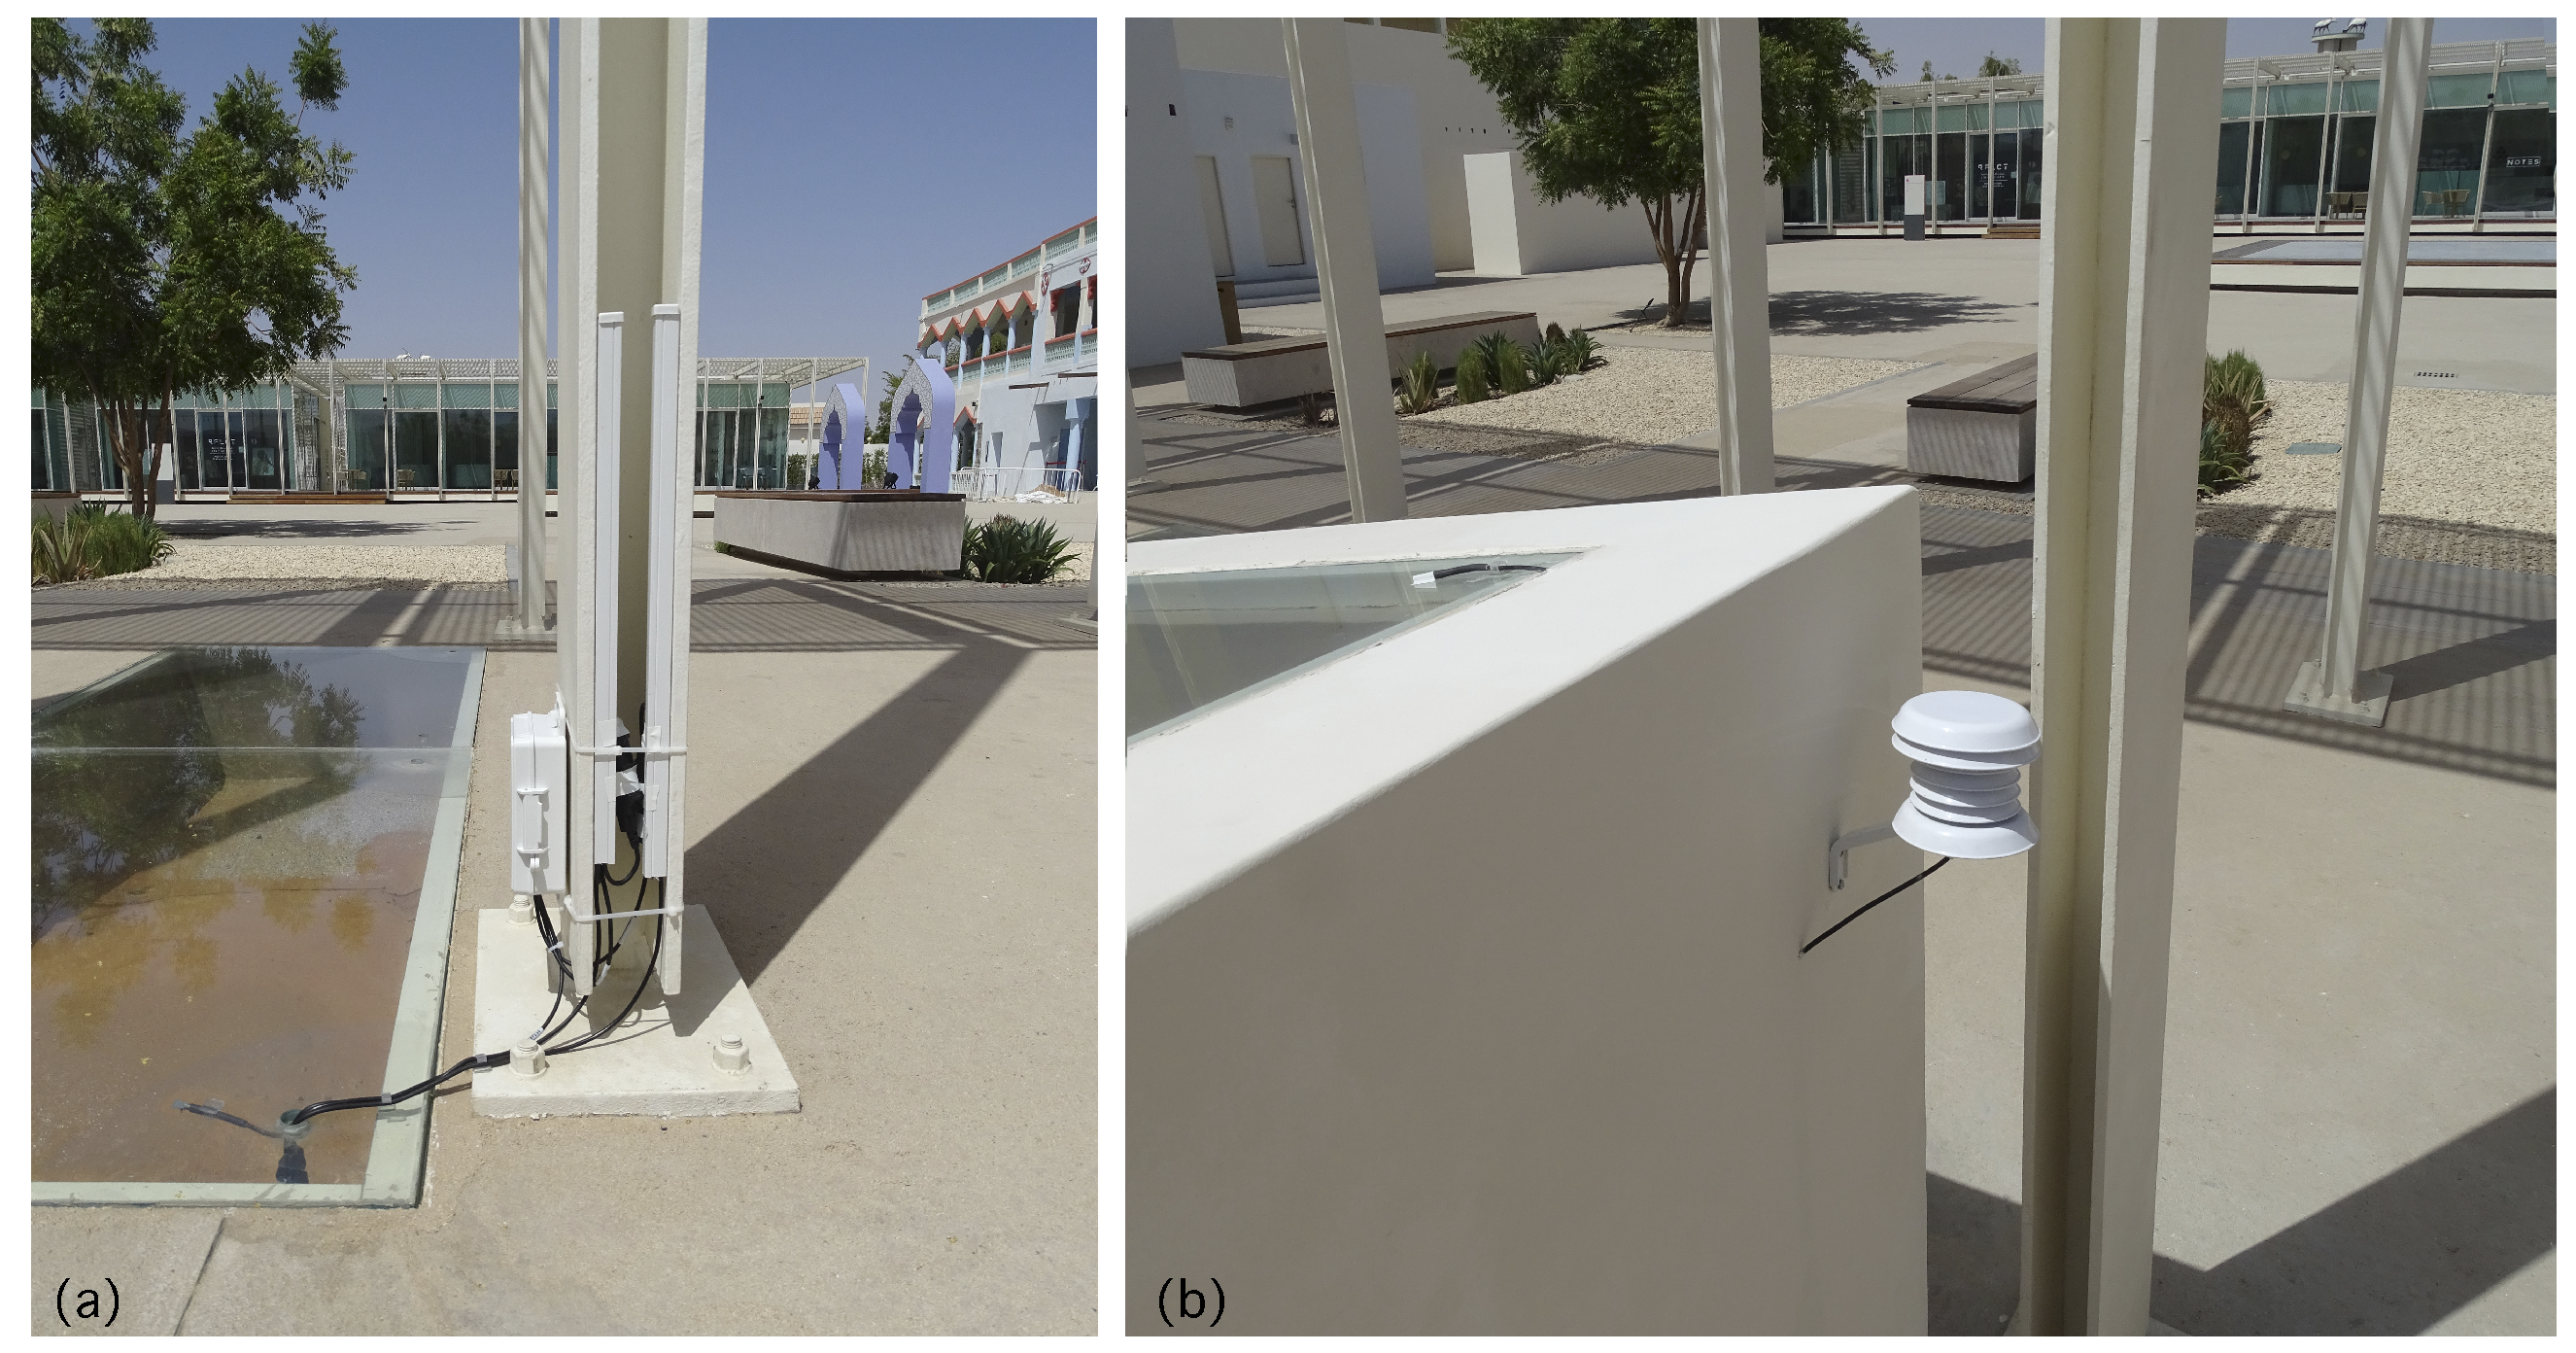
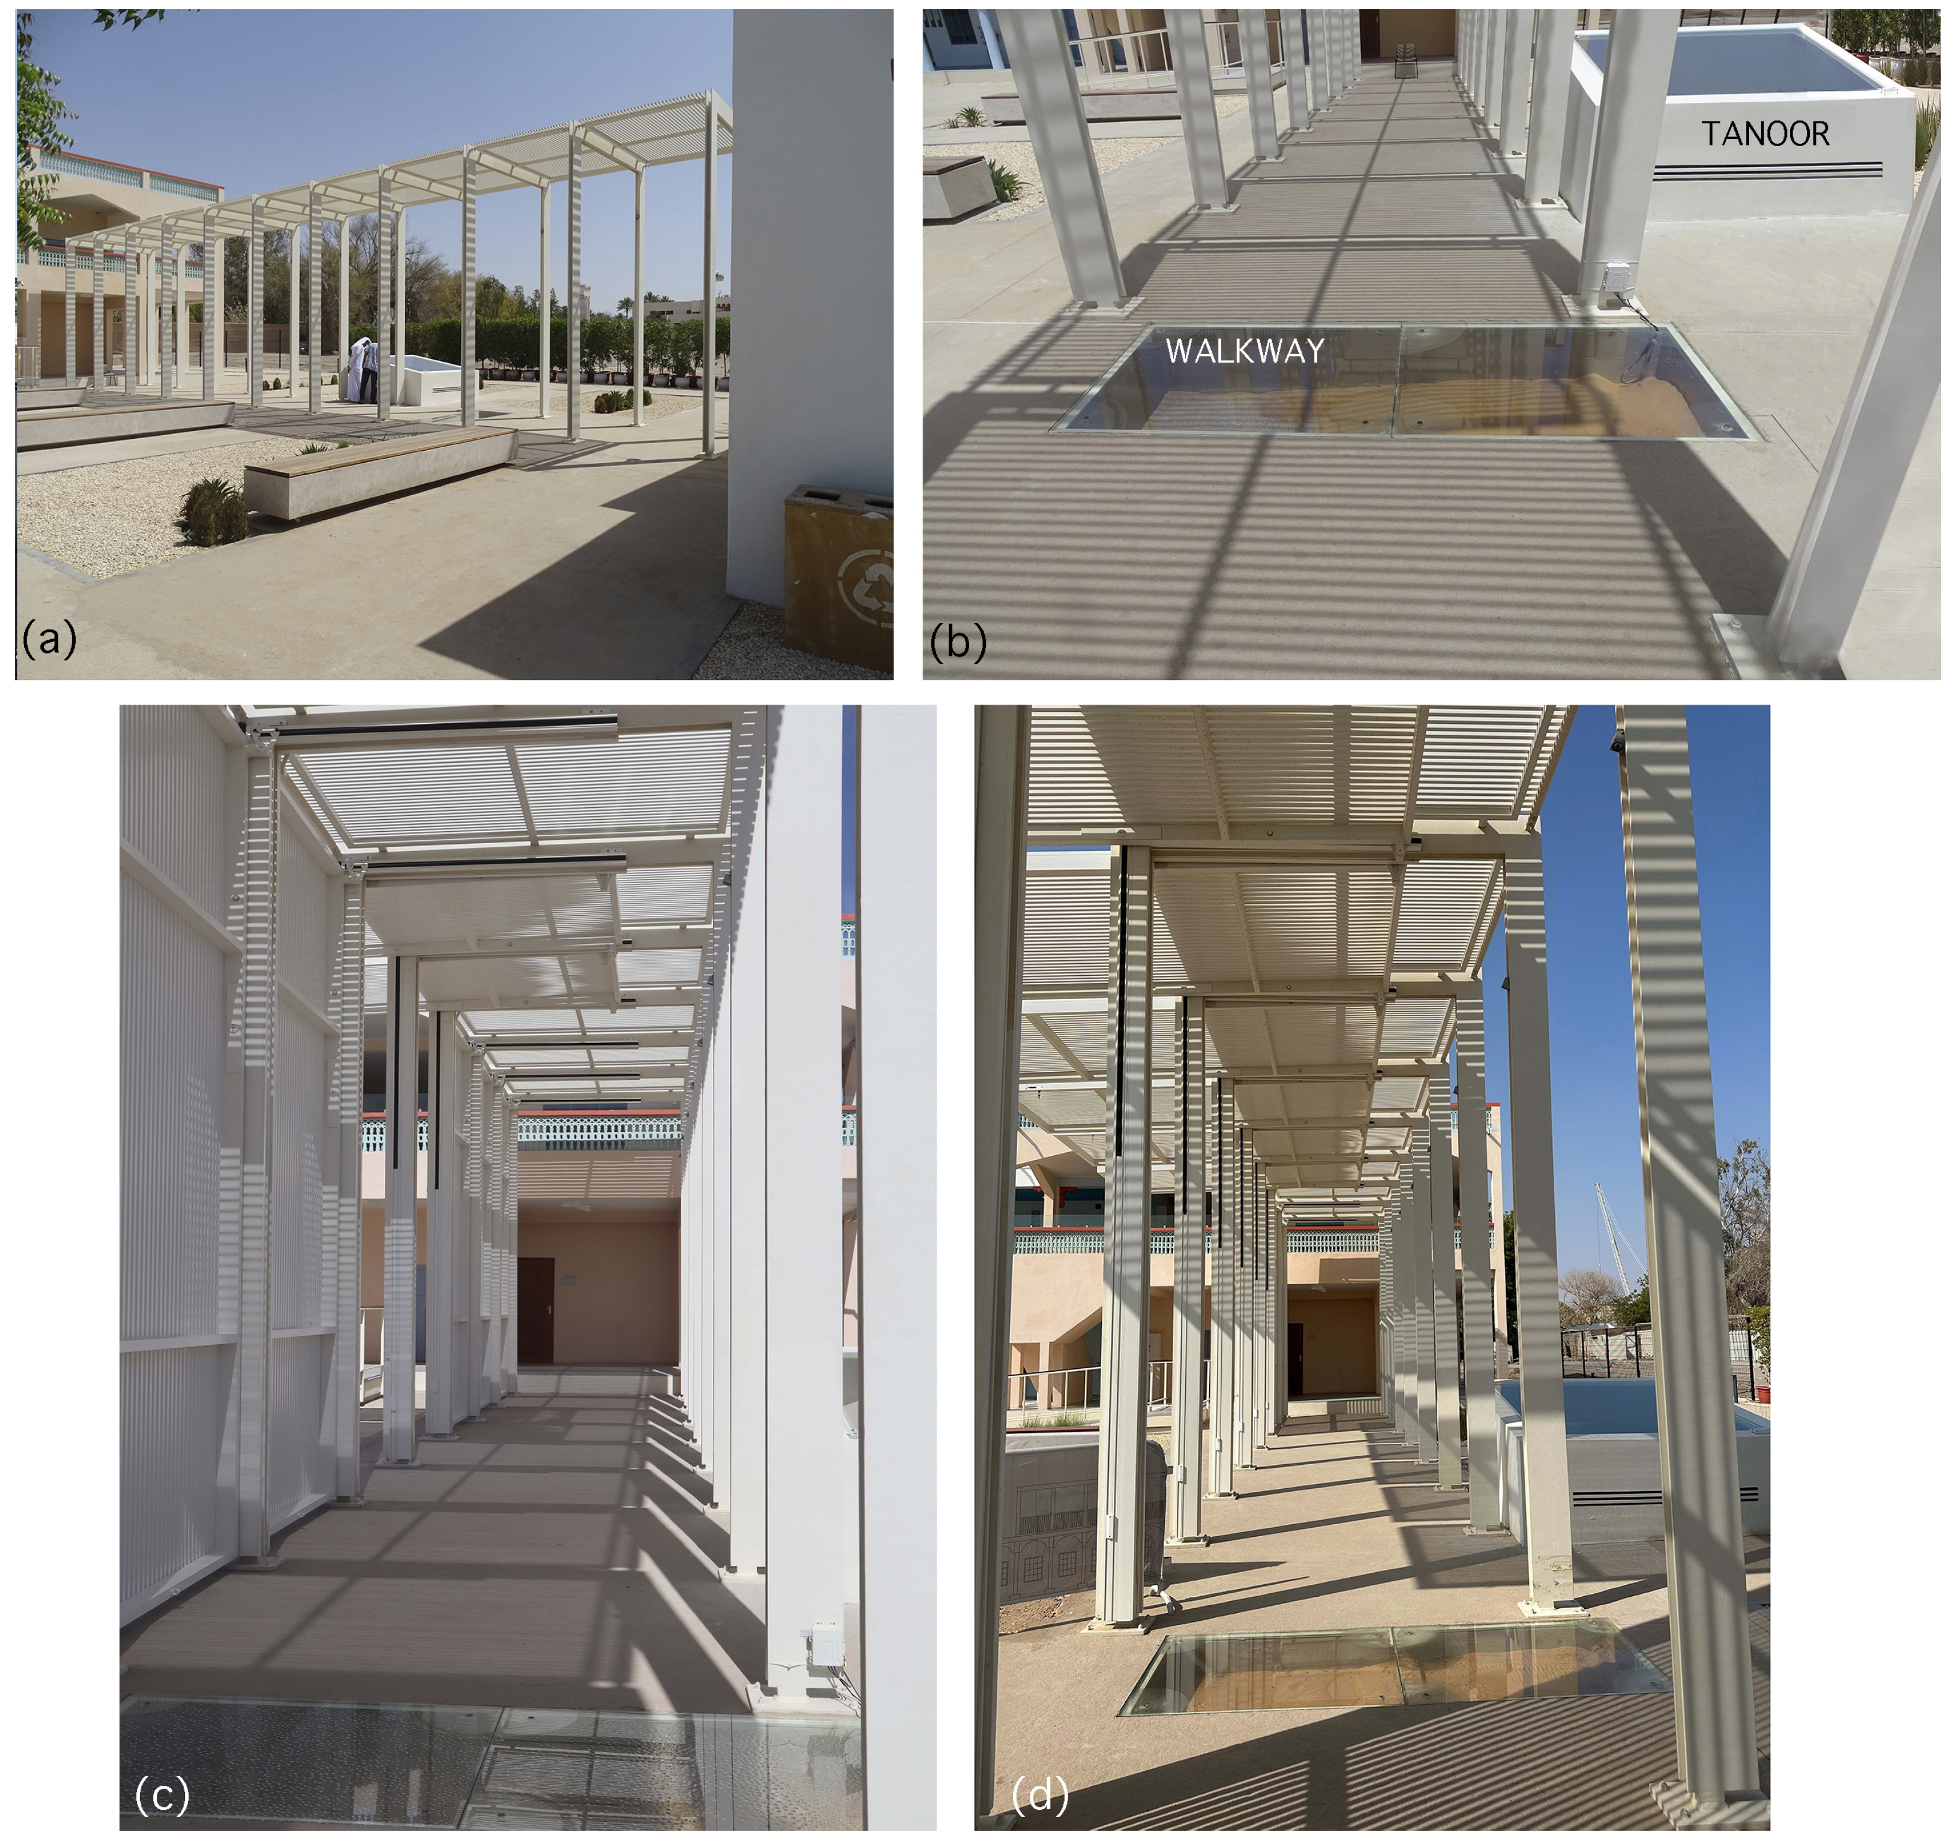
2.1. Description of the Site
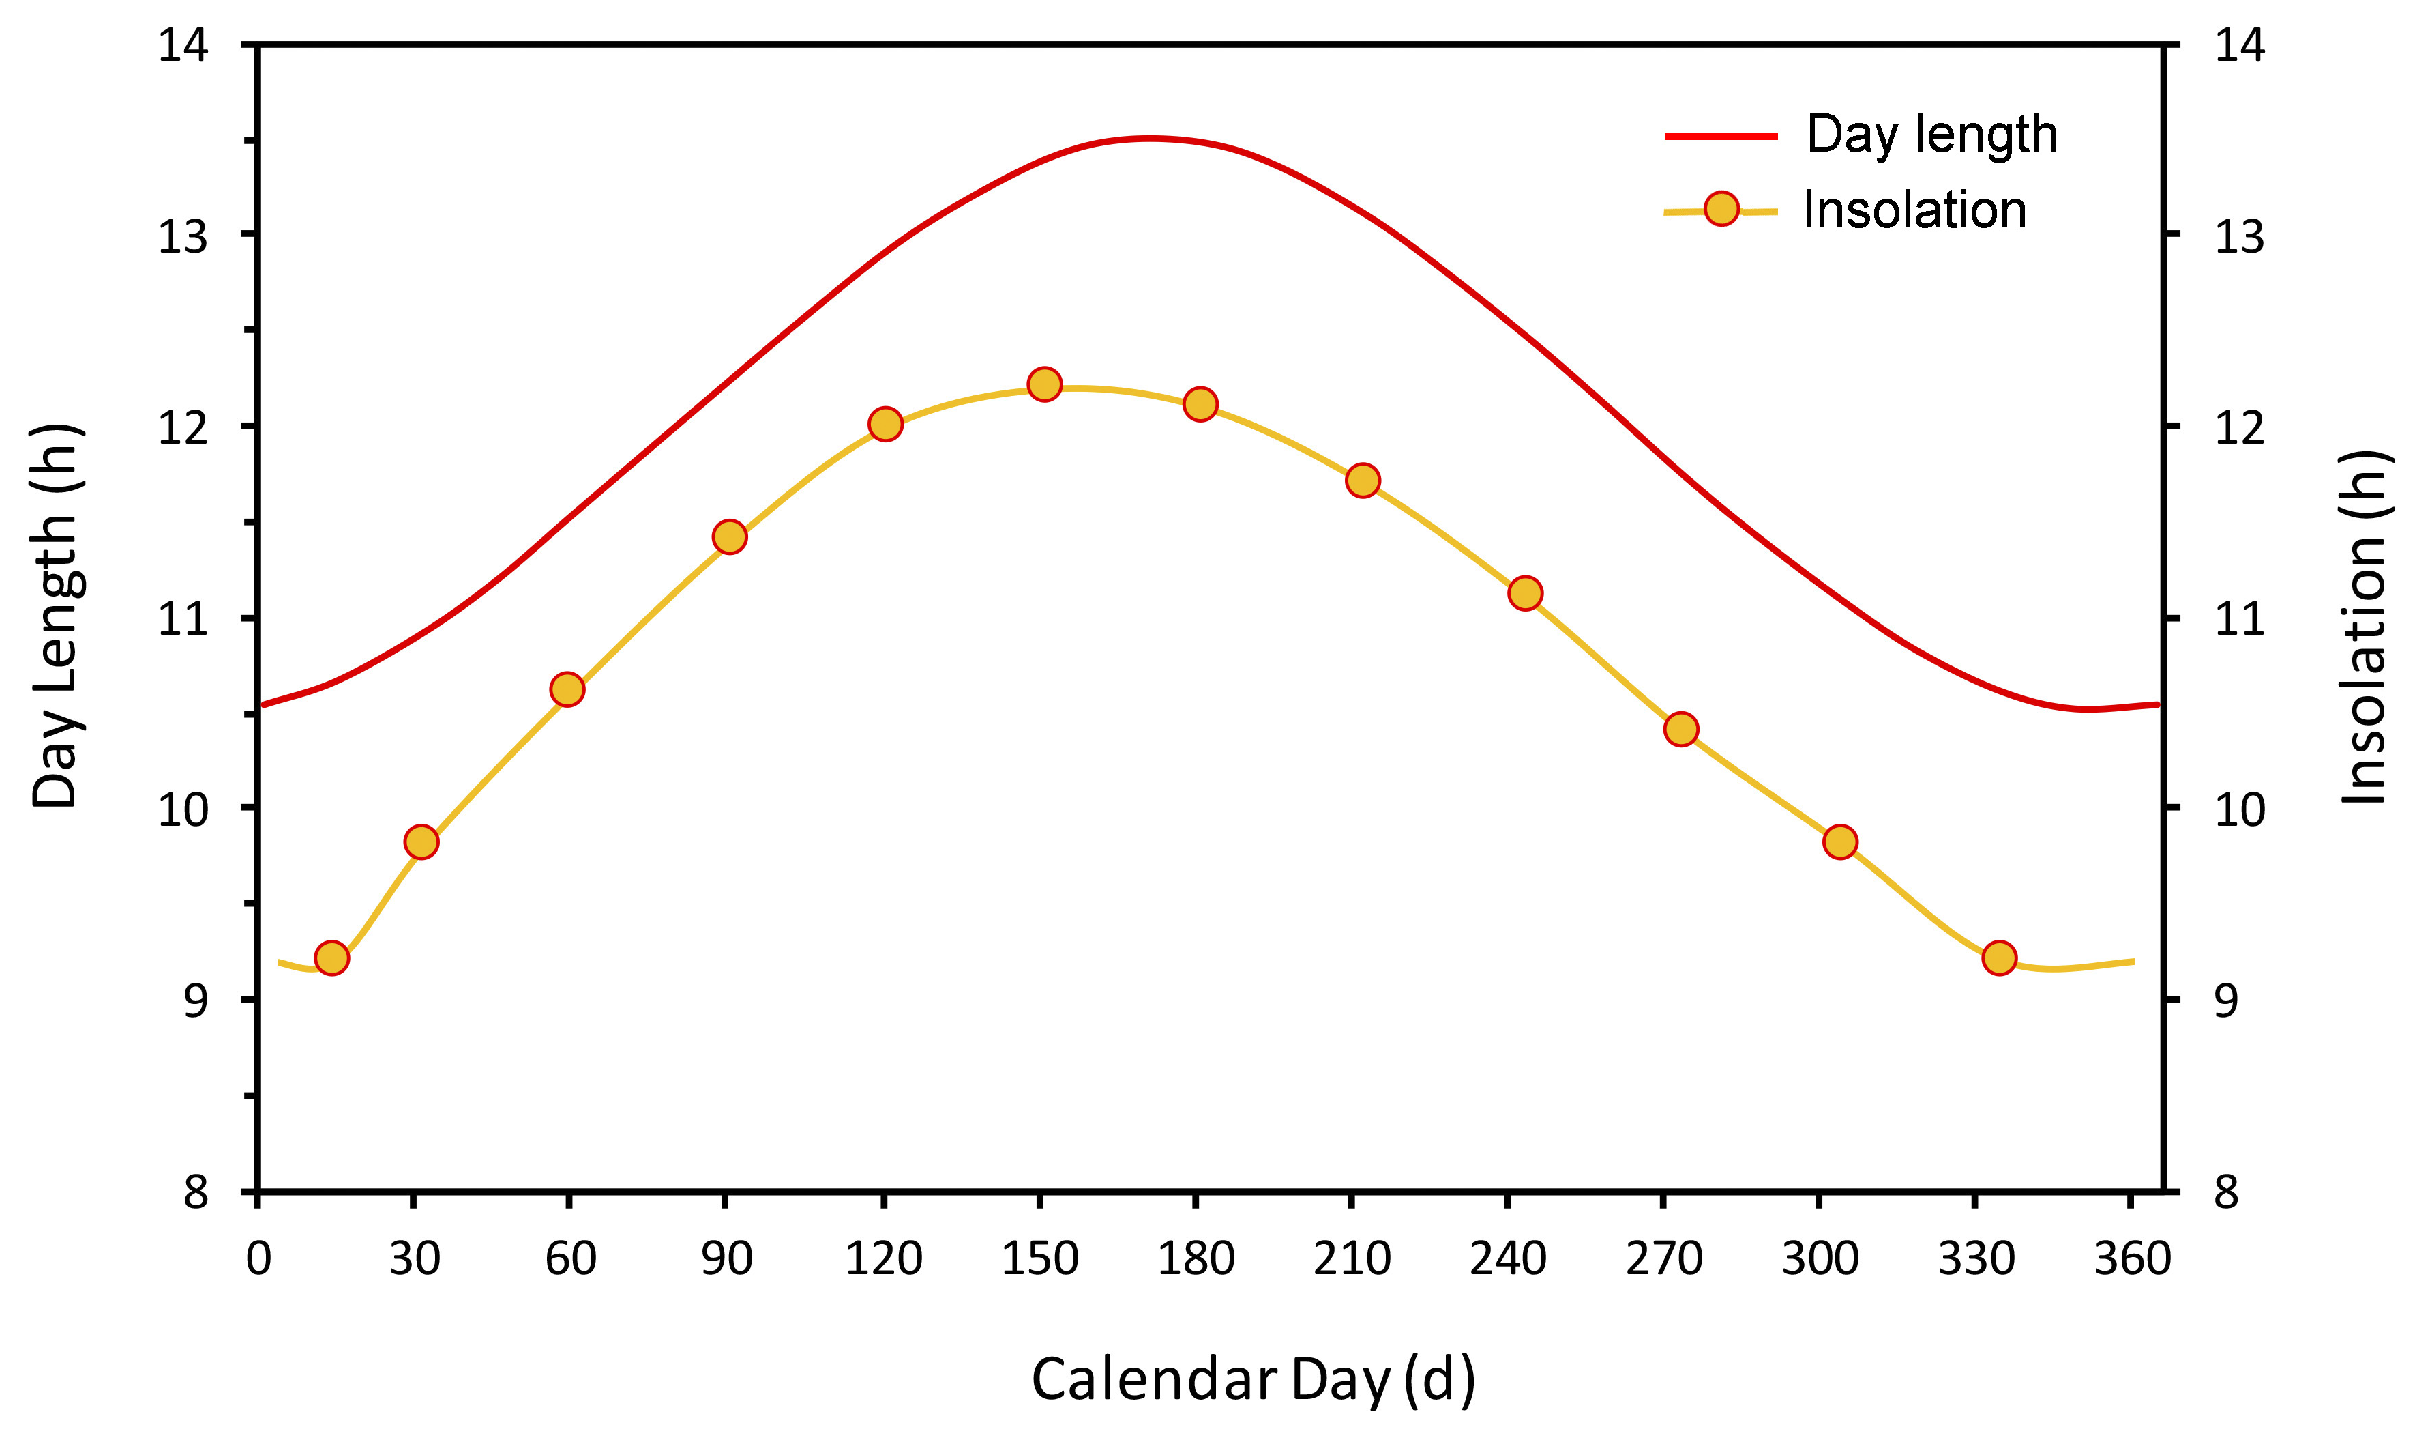
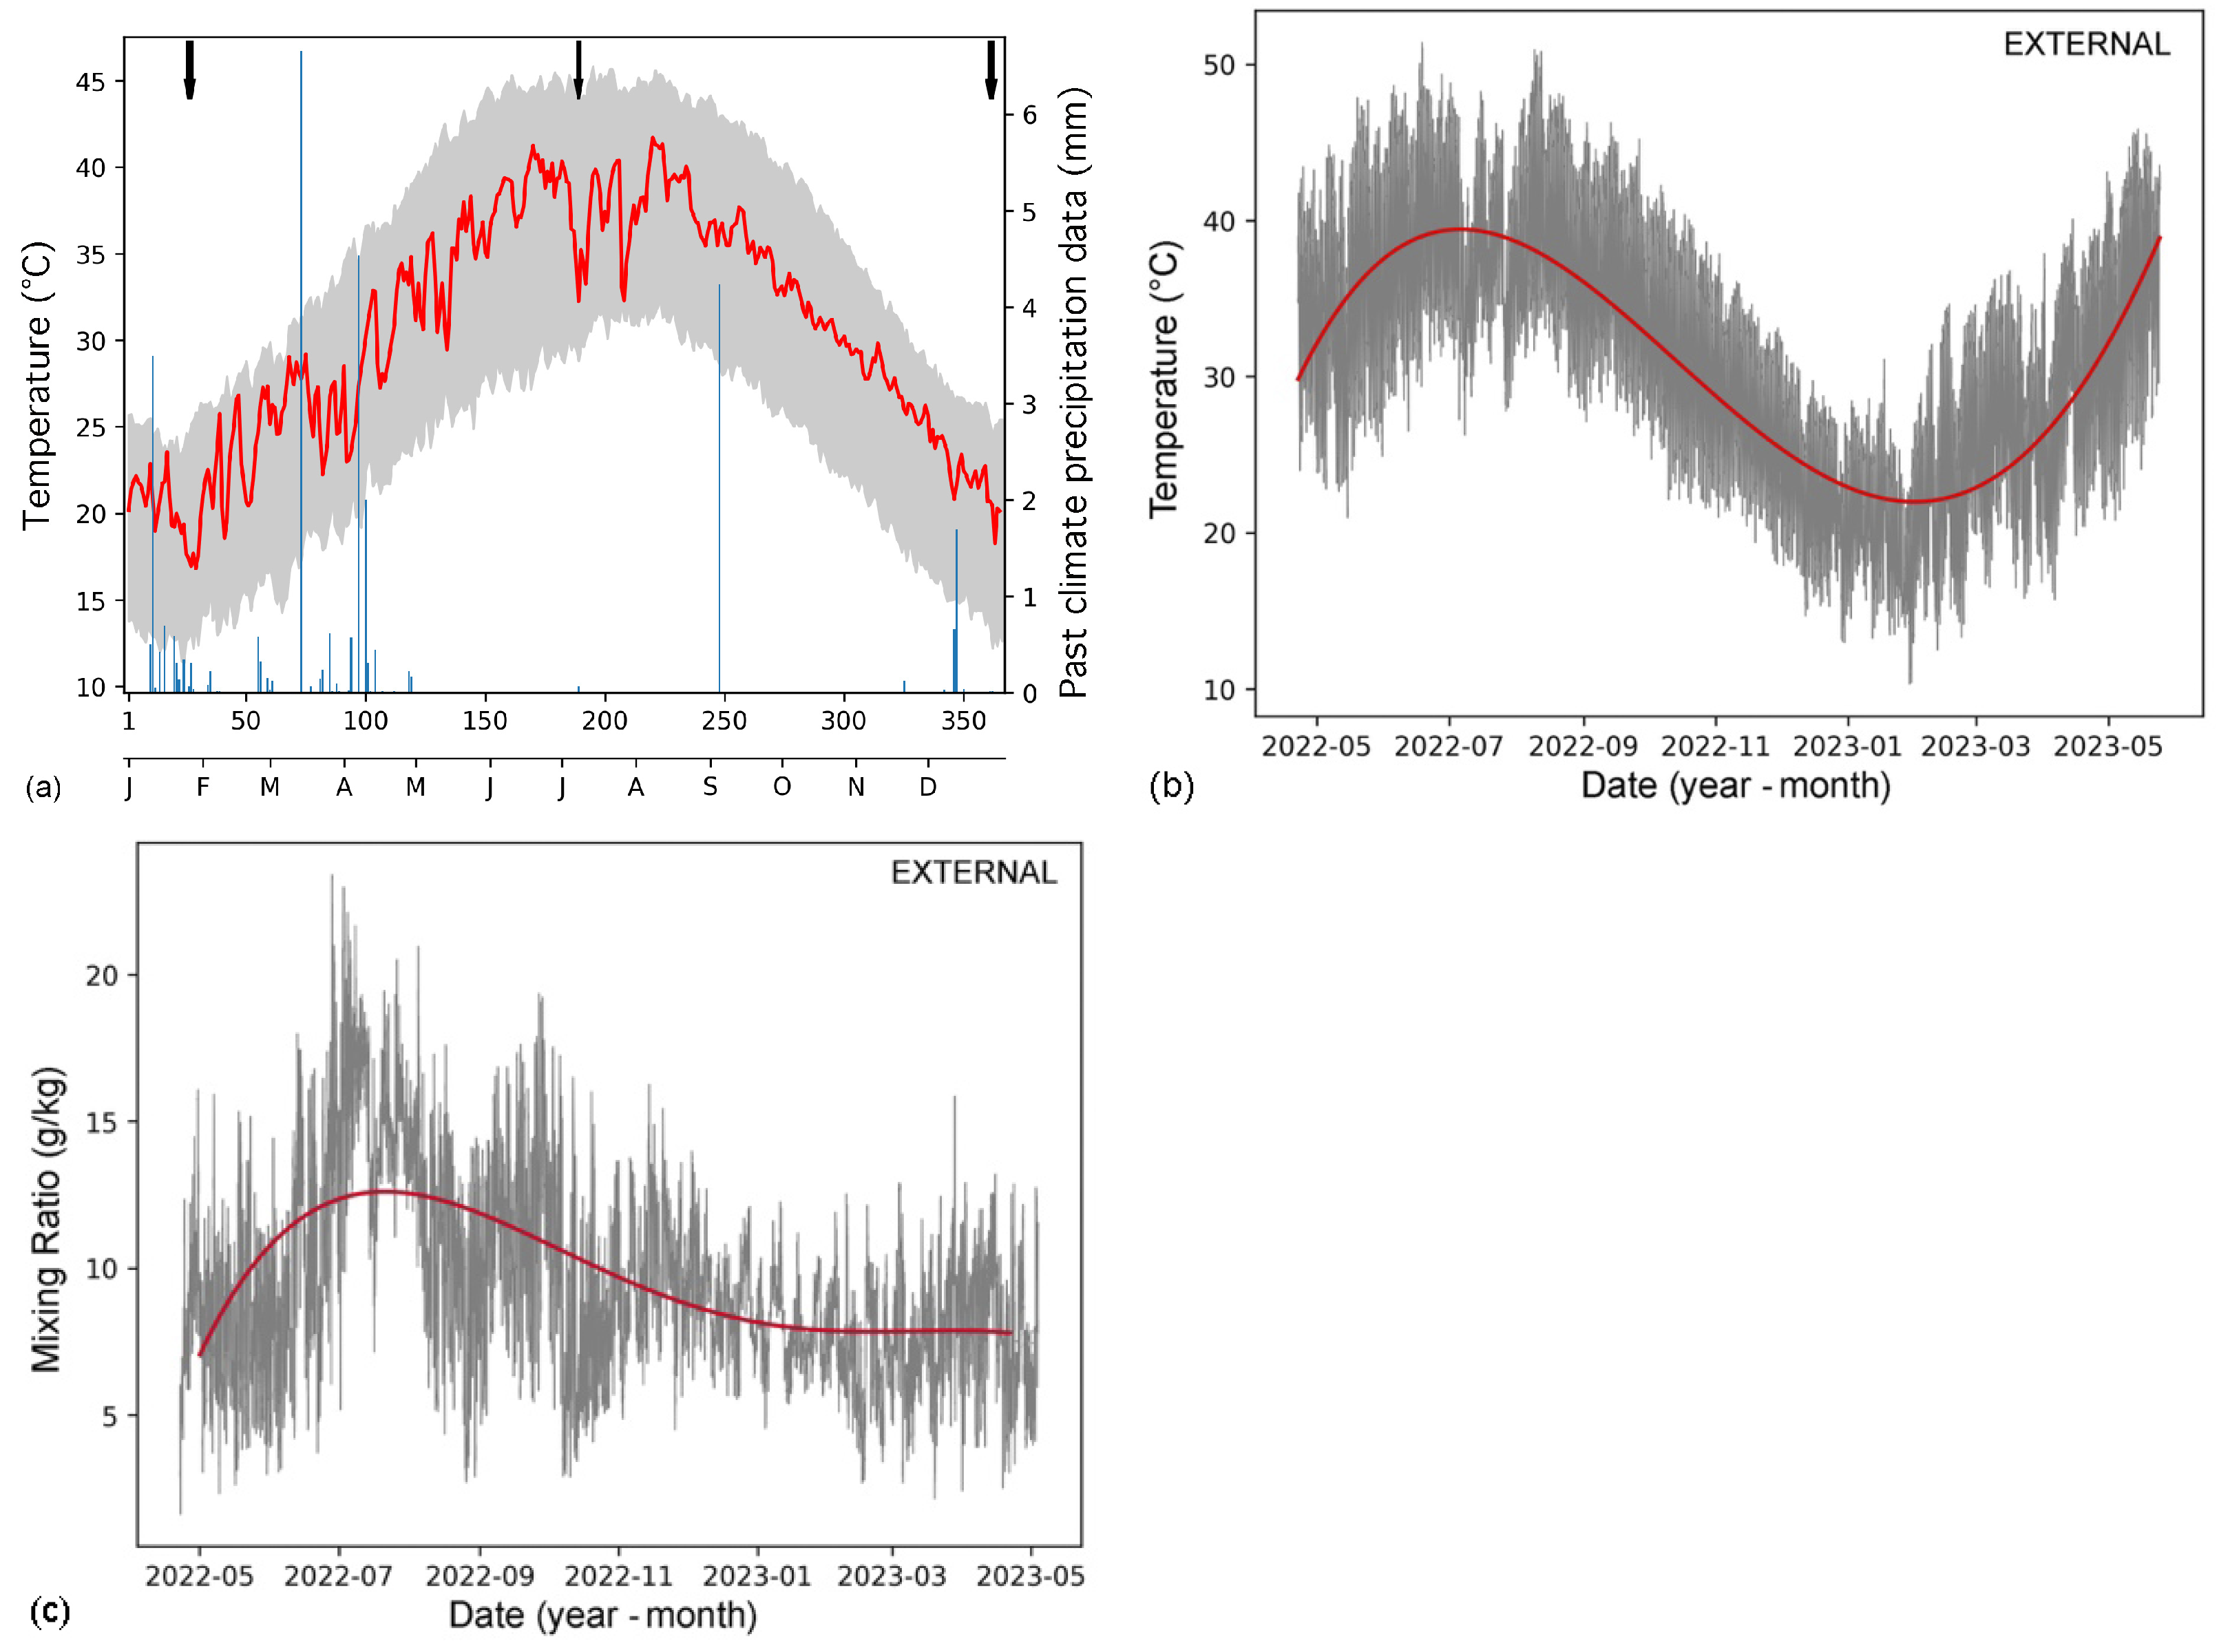
The pergola (Figure 1) was originally planned for the comfort of visitors and to separate the walkway from the main courtyard, when needed. It must be specified that the purpose of the installation was a general use, but not specifically to improve the microclimate of the showcases, even if it was considered that the pergola could be useful in reducing the solar radiation. It is oriented approximately north–south (i.e., 168 ) and is composed of a steel structure 4 m high and 2 m wide, with fixed louvres on the ceiling, and operable louvres on the western side. The operable louvres can be kept standing vertically (as in Figure 1c); lying horizontally, protruding from the ceiling (as in Figure 1d); or even inclined at an angle of 30 . Although the lateral louvres’ panels were part of the original pergola design, they were installed later, at the end of the monitoring campaign, which was carried out in the situation of Figure 1a,b. The slats are fixed normal to the louvres’ panels and provide a partial shade, because part of the solar radiation passes through the gaps between slats.
Some flowerbeds with small plants and a tree are located on both sides of the pergola, and regular watering contributes to the increase in the moisture content of the soil. It is to be investigated whether some irrigation water migrates underground and reaches the archaeological remains in the showcases.
The walkway showcase is located in the middle of the pergola, and the top is made of two thick glass panes at ground level, so that it is possible to walk on it. The tanoor is located at the edge to the east of the walkway showcase and the pergola, and is shaped like a box with an inclined top.
The walkway showcase (Figure 2) was created as a cavity dug into the flooring of a pergola, to expose the buried archaeological remains. The cavity is topped with two glass panes (259 cm total length, 99 cm width, 3 cm thickness) that cover it at ground level. The glass panes have four holes (2 cm diameter) to be picked up and removed. If some water for cleaning, or rainwater collected on the flooring, reaches the glass panes, it may percolate inside. When condensation occurs, drops of water form on the lower surface of the glass. If the condensation is modest, some micro droplets form on the glass, thus fogging the visibility. This phenomenon of light condensation is called misting, or fogging or hazing, used synonymously. Misting involves small amounts of condensed water, and evaporates quickly when the solar radiation hits the glass pane. However, if the glass temperature falls below the dew point, the condensation occurs at higher rates, forming large drops of water that continue to grow over time, fed by further condensation or coalescence (Figure 3). When the drops grow, they become heavy and fall on the archaeological remains. This phenomenon of abundant condensation is called dewing, and the falling drops are dangerous for conservation.
The tanoor showcase (Figure 2) lies on the eastern side of the pergola, close to the walkway, and is covered by the shade of the pergola in the afternoon. The box is made with concrete blocks 20 cm thick, plastered with cement and painted. The topping glass pane ( 205 × 205 cm, 8 mm thickness) lies around 1 m above ground level (i.e., 109 cm on the lower side and 115 cm on the higher side of the supporting walls; the walls are 18 cm thick), and is inclined at an angle of 9 . The inclination brings some advantages compared to a horizontal surface, because the water falling on the upper surface of the pane, or condensing on the lower surface, is partially or totally drained away. Rainwater cannot penetrate inside the showcase if the glass pane is sealed. The drops formed by condensation on the lower pane surface will partly fall and partly flow along the pane and converge in the lowest part of the glass, where they could be collected with a small internal gutter. Even in the absence of a gutter (like now), the condensed water flows along the lowest vertical wall (on the southern side) without falling directly on the earthen remains. The northern and southern walls are provided with narrow slits for natural ventilation, with a mesh to prevent insects from entering. The slits are located on two opposite walls, which increases the efficiency of ventilation. However, the mesh reduces the dynamical cross section and the efficacy of ventilation, introducing a resistance to airflows. Therefore, ventilation is generally poor, except in windy conditions. The exact orientation of the tanoor walls is as follows: north side 348 , east side 78 , south side 168 , west side 258 . The surface area of these walls is as follows: north 2.9 m 2 ; east and west 2.4 m 2 ; south 1.8 m 2 .
The small structural differences between the two showcases are very relevant to the conservation aims, i.e., the walkway is more vulnerable, without ventilation and with more frequent dewing; the tanoor is a little more efficient, a little less vulnerable to external rain and internal drops, and is provided with some ventilation slits. These items will be discussed in the next sections.

2.2. Local Climate

Al Ain is located at the edge of the tropical belt, and is defined as hot arid subtropical desert climate, i.e., BWh in the Köppen–Geiger climate classification [25,26].
The city of Al Ain has evolved from settlements around oases that were irrigated by underground water channels (Aflaj) that bring water from the nearby mountains. Archaeological investigations have shown that over the last 4500 years, the groundwater levels have followed a decrease related to an increasing trend of aridity [27]. Currently, the city is bounded to the west by desert areas, and has developed rapidly over the past two decades. This has determined a marked urban heat island effect [28].
The average temperature ranges between 18.5 C in January and 37.2 C in July (monthly mean during the period 1995–2022, using daily data of the weather station of Al Ain International Airport [29]). From May to October, the monthly average temperature is greater than 30 C . The precipitation is very scarce, with few rainy days (nearly two instances of daily rainfall per year) and a low amount of rain (yearly average is 31 mm in the period 1995–2022). Precipitation generally occurs from January to April. From May to August and in October and November, there is almost no rainfall. The climate is arid, and the atmospheric mixing ratio ( M R ) is very low, ranging between a 8.7 g/kg monthly average in January and 18.5 g/kg in July, with a 13.4 g/kg annual average. The same can be said for the dew point ( D P ) with 12.5 C in January, 25.2 C in July and 19 C annual average. The relative humidity ( R H ) is very low during the day, and high during the night. The R H annual average is nearly 56%.
During the monitoring period, the temperature ranges within the usual values of the region (red line and gray band in Figure 4a,b). From 22 April 2022 to 30 May 2023, there were only five rainy days (black arrows), four of which happened in usually rainy periods (blue lines in Figure 4a). The M R values recorded during this monitoring period are reported in Figure 4c.

3. Methods

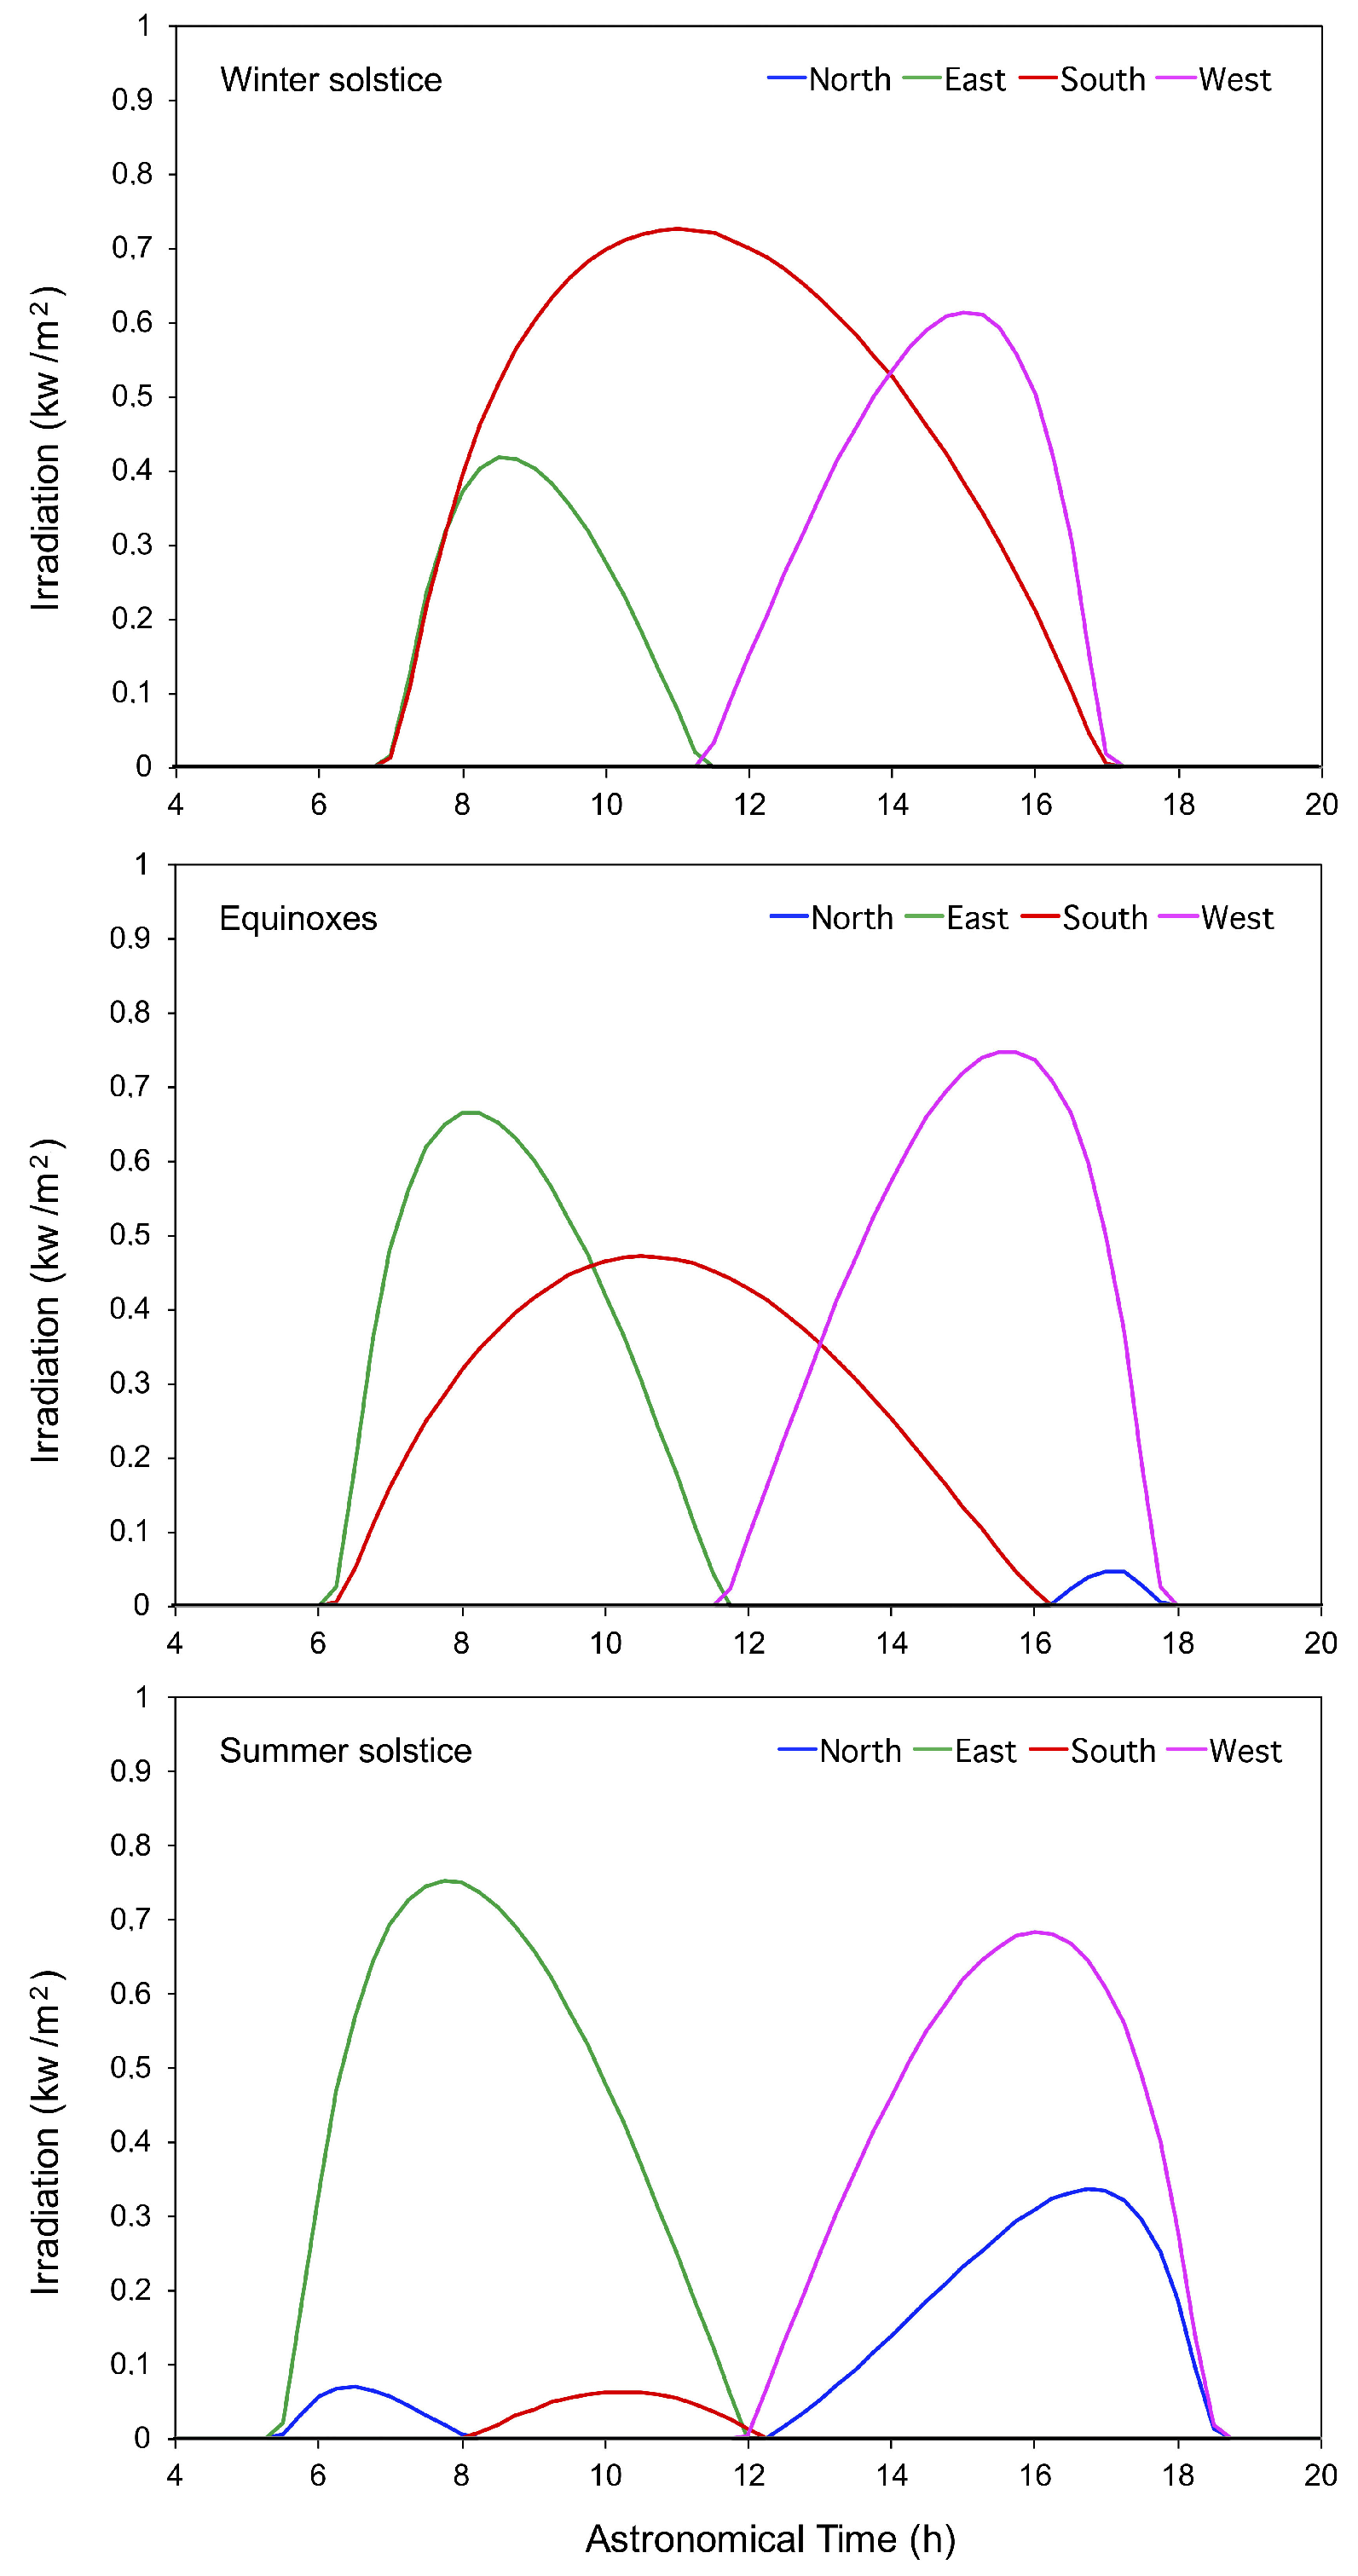
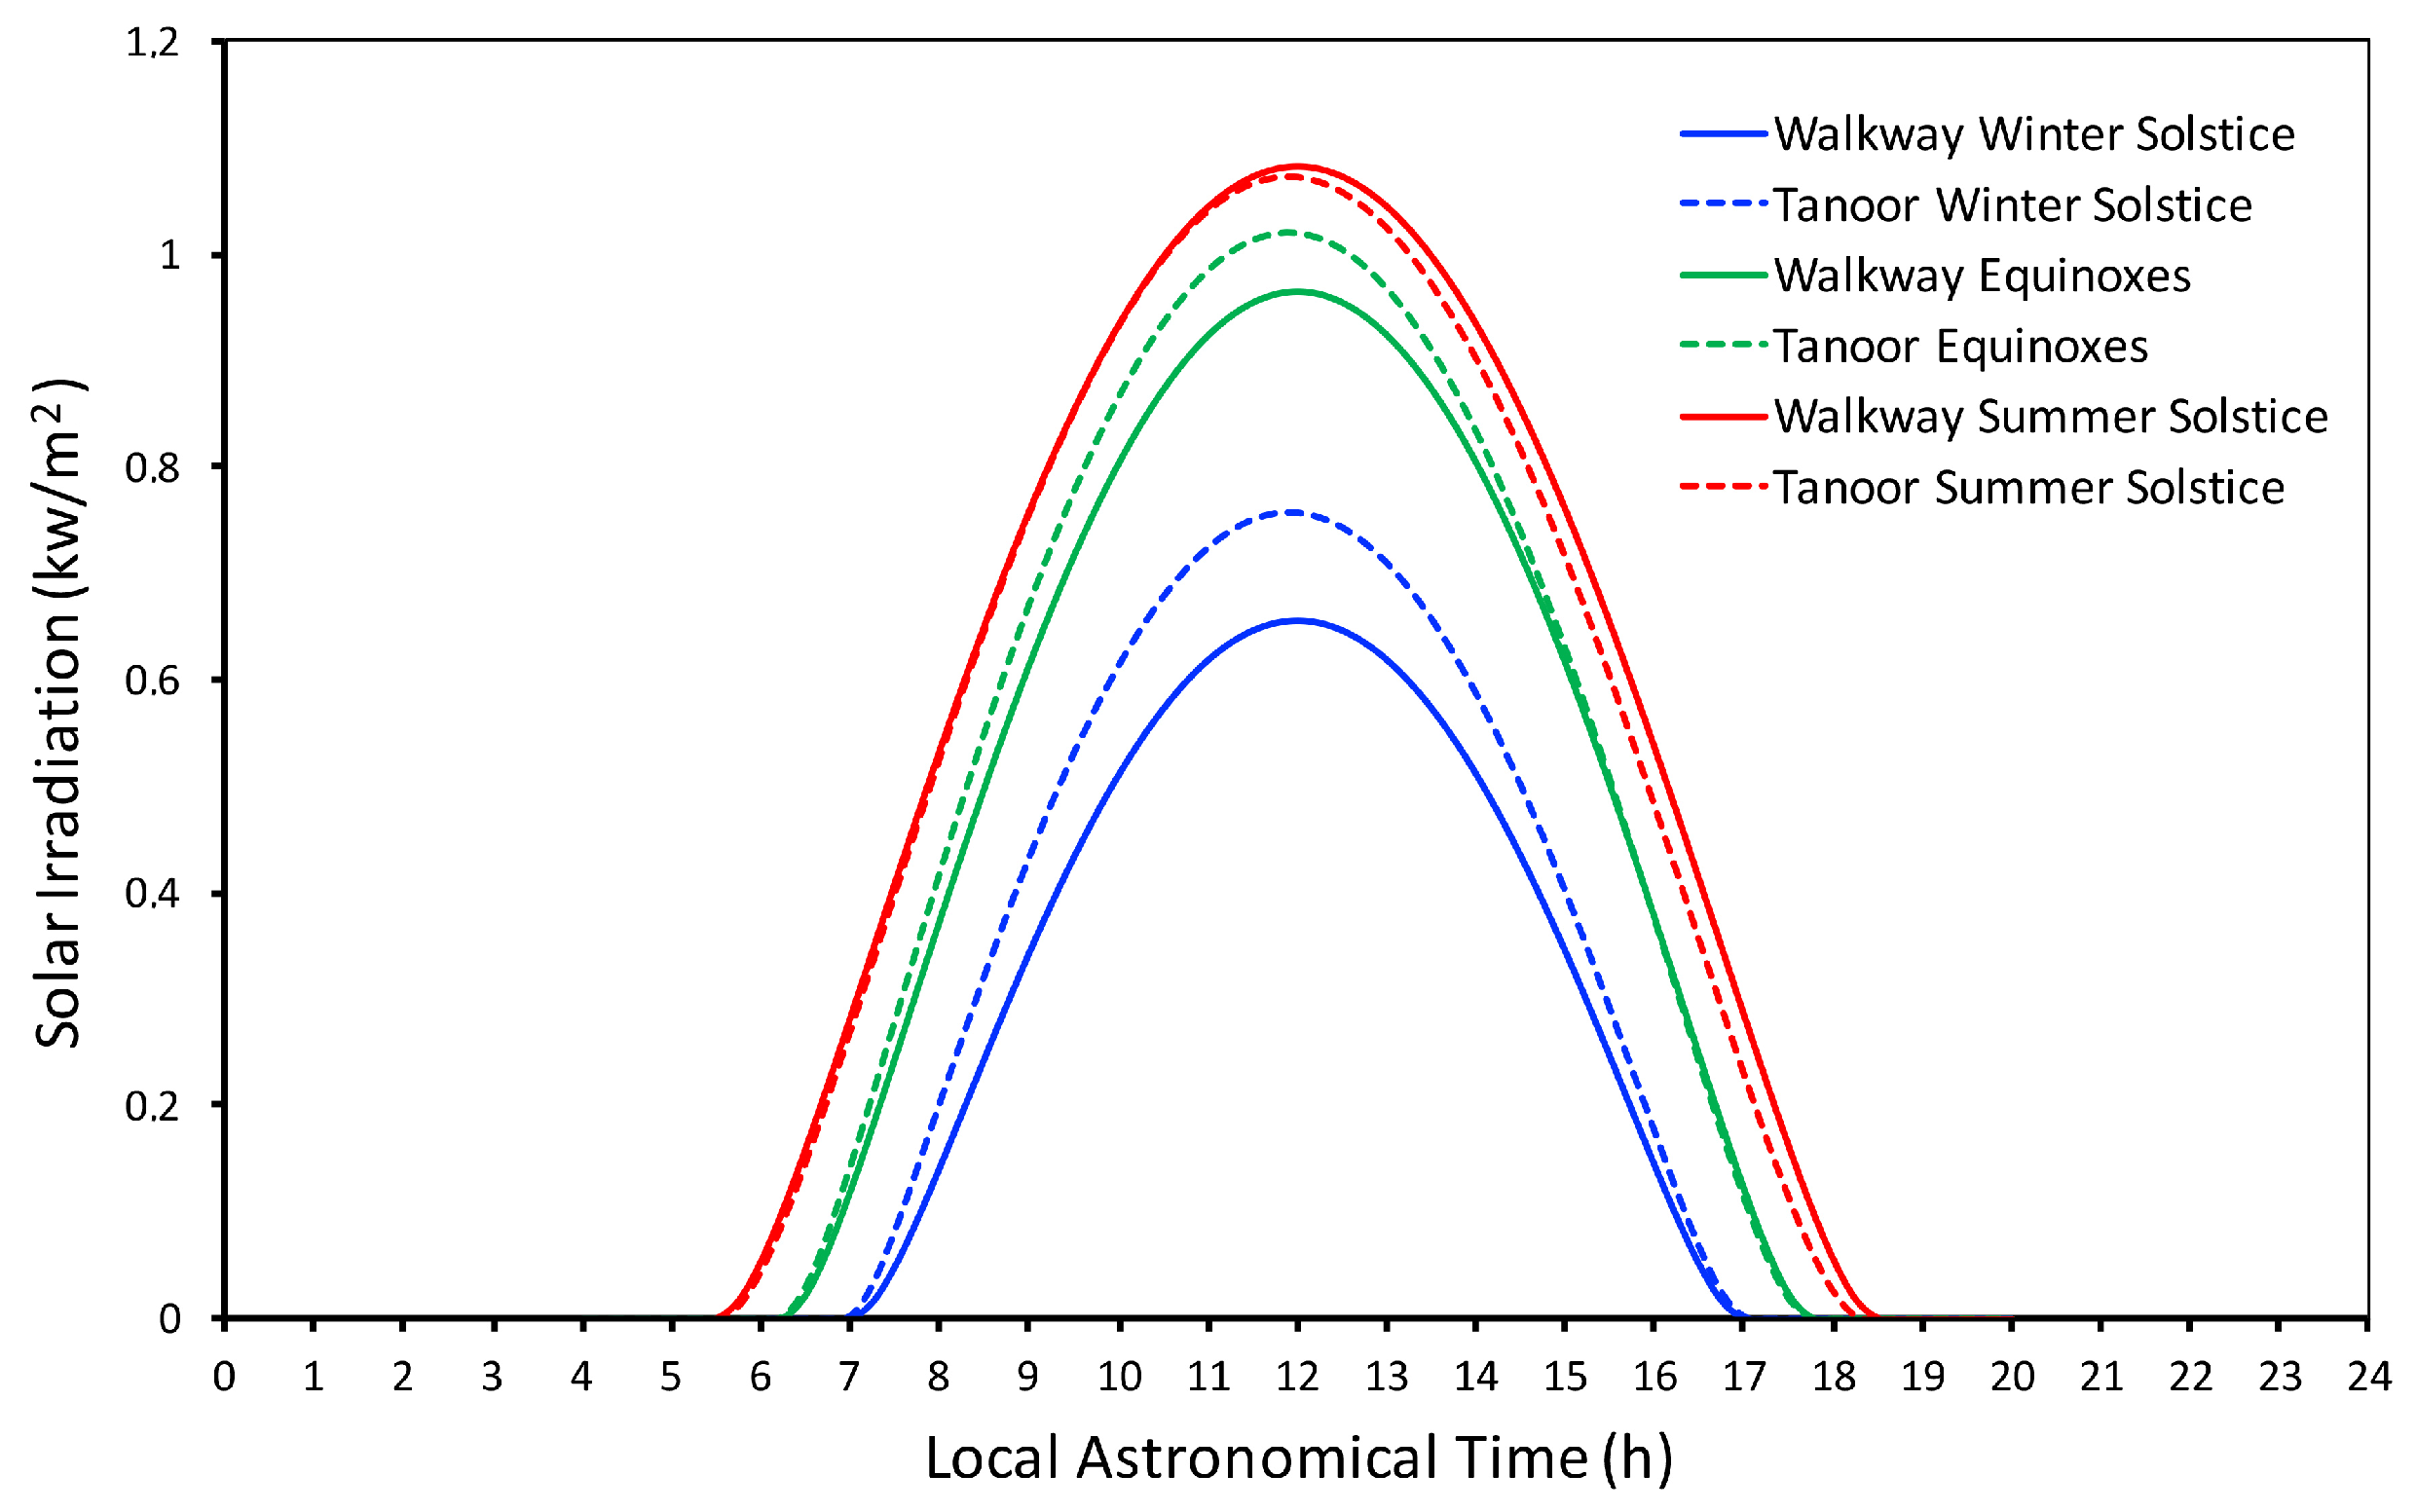
3.1. Model Simulation of the Solar Radiation

The simulation is based on the astronomical formulae to calculate the apparent motions of the Sun and the solar radiation crossing the atmosphere and impinging on horizontal or vertical surfaces, or surfaces with selected inclinations and directions as described elsewhere [8,30,31]. The solar coordinates are constituted of altitude and azimuth. The altitude H is the angular distance representing the elevation of the Sun over the local horizon, and is the complement to the zenith angle Z = 90 H . The altitude is computed by the formula
sin H = sin δ sin ϕ + cos δ cos ϕ cos τ
where ϕ is the latitude, τ the hour angle τ = 180 t / 12 , computed from the time duration t, in hours and tenths of hour, from or to the culmination of the Sun at the true midday, and δ is the declination angle given for the calendar day j by the formula
δ , j = δ , 0 cos 2 π j 365
where j is computed from the day j = 0 at the winter solstice, when δ , 0 = 23 27 .
The azimuth A is the angular distance between the vertical circles containing the Sun and the local meridian with the south point, computed from the local meridian. In this reference, A < 0 in the morning, when the Sun is moving on the eastern sector; A = 0 at noon, and A > 0 in the afternoon, on the western sector. The azimuth A is given by the formula
sin A = cos δ sin τ 1 sin δ sin ϕ + cos δ cos ϕ cos τ
The calculations have been made with reference to the local astronomical time ( A T ), with noon (i.e., 12:00 h) coincident with the upper culmination (i.e., when the Sun crosses the local meridian, i.e., the south of the local horizon). This temporal frame simplifies the calculations, but differs by some minutes from Coordinated Universal Time, UTC +4 h, the time zone of Al Ain [32]. It must be specified that this time shift has no influence on the calculation of the impinging energy and its cumulated values.
The atmospheric attenuation is exponential and varies with wavelength λ (Bouguer–Lambert law), i.e.,
I ( λ ) = I 0 exp ( α ( λ ) m )
where I 0 is the intensity of incident radiation the atmosphere, I ( λ ) is the intensity after having crossed the optical air mass m (i.e., the mass equivalent to the path of atmosphere crossed by the solar beams related to solar altitude), and α ( λ ) is an absorption coefficient that varies with the wavelength and represents the atmospheric absorption and scattering.
All the above formulae, and related plots, have been computed with Excel Microsoft software version 15.33 (2017).

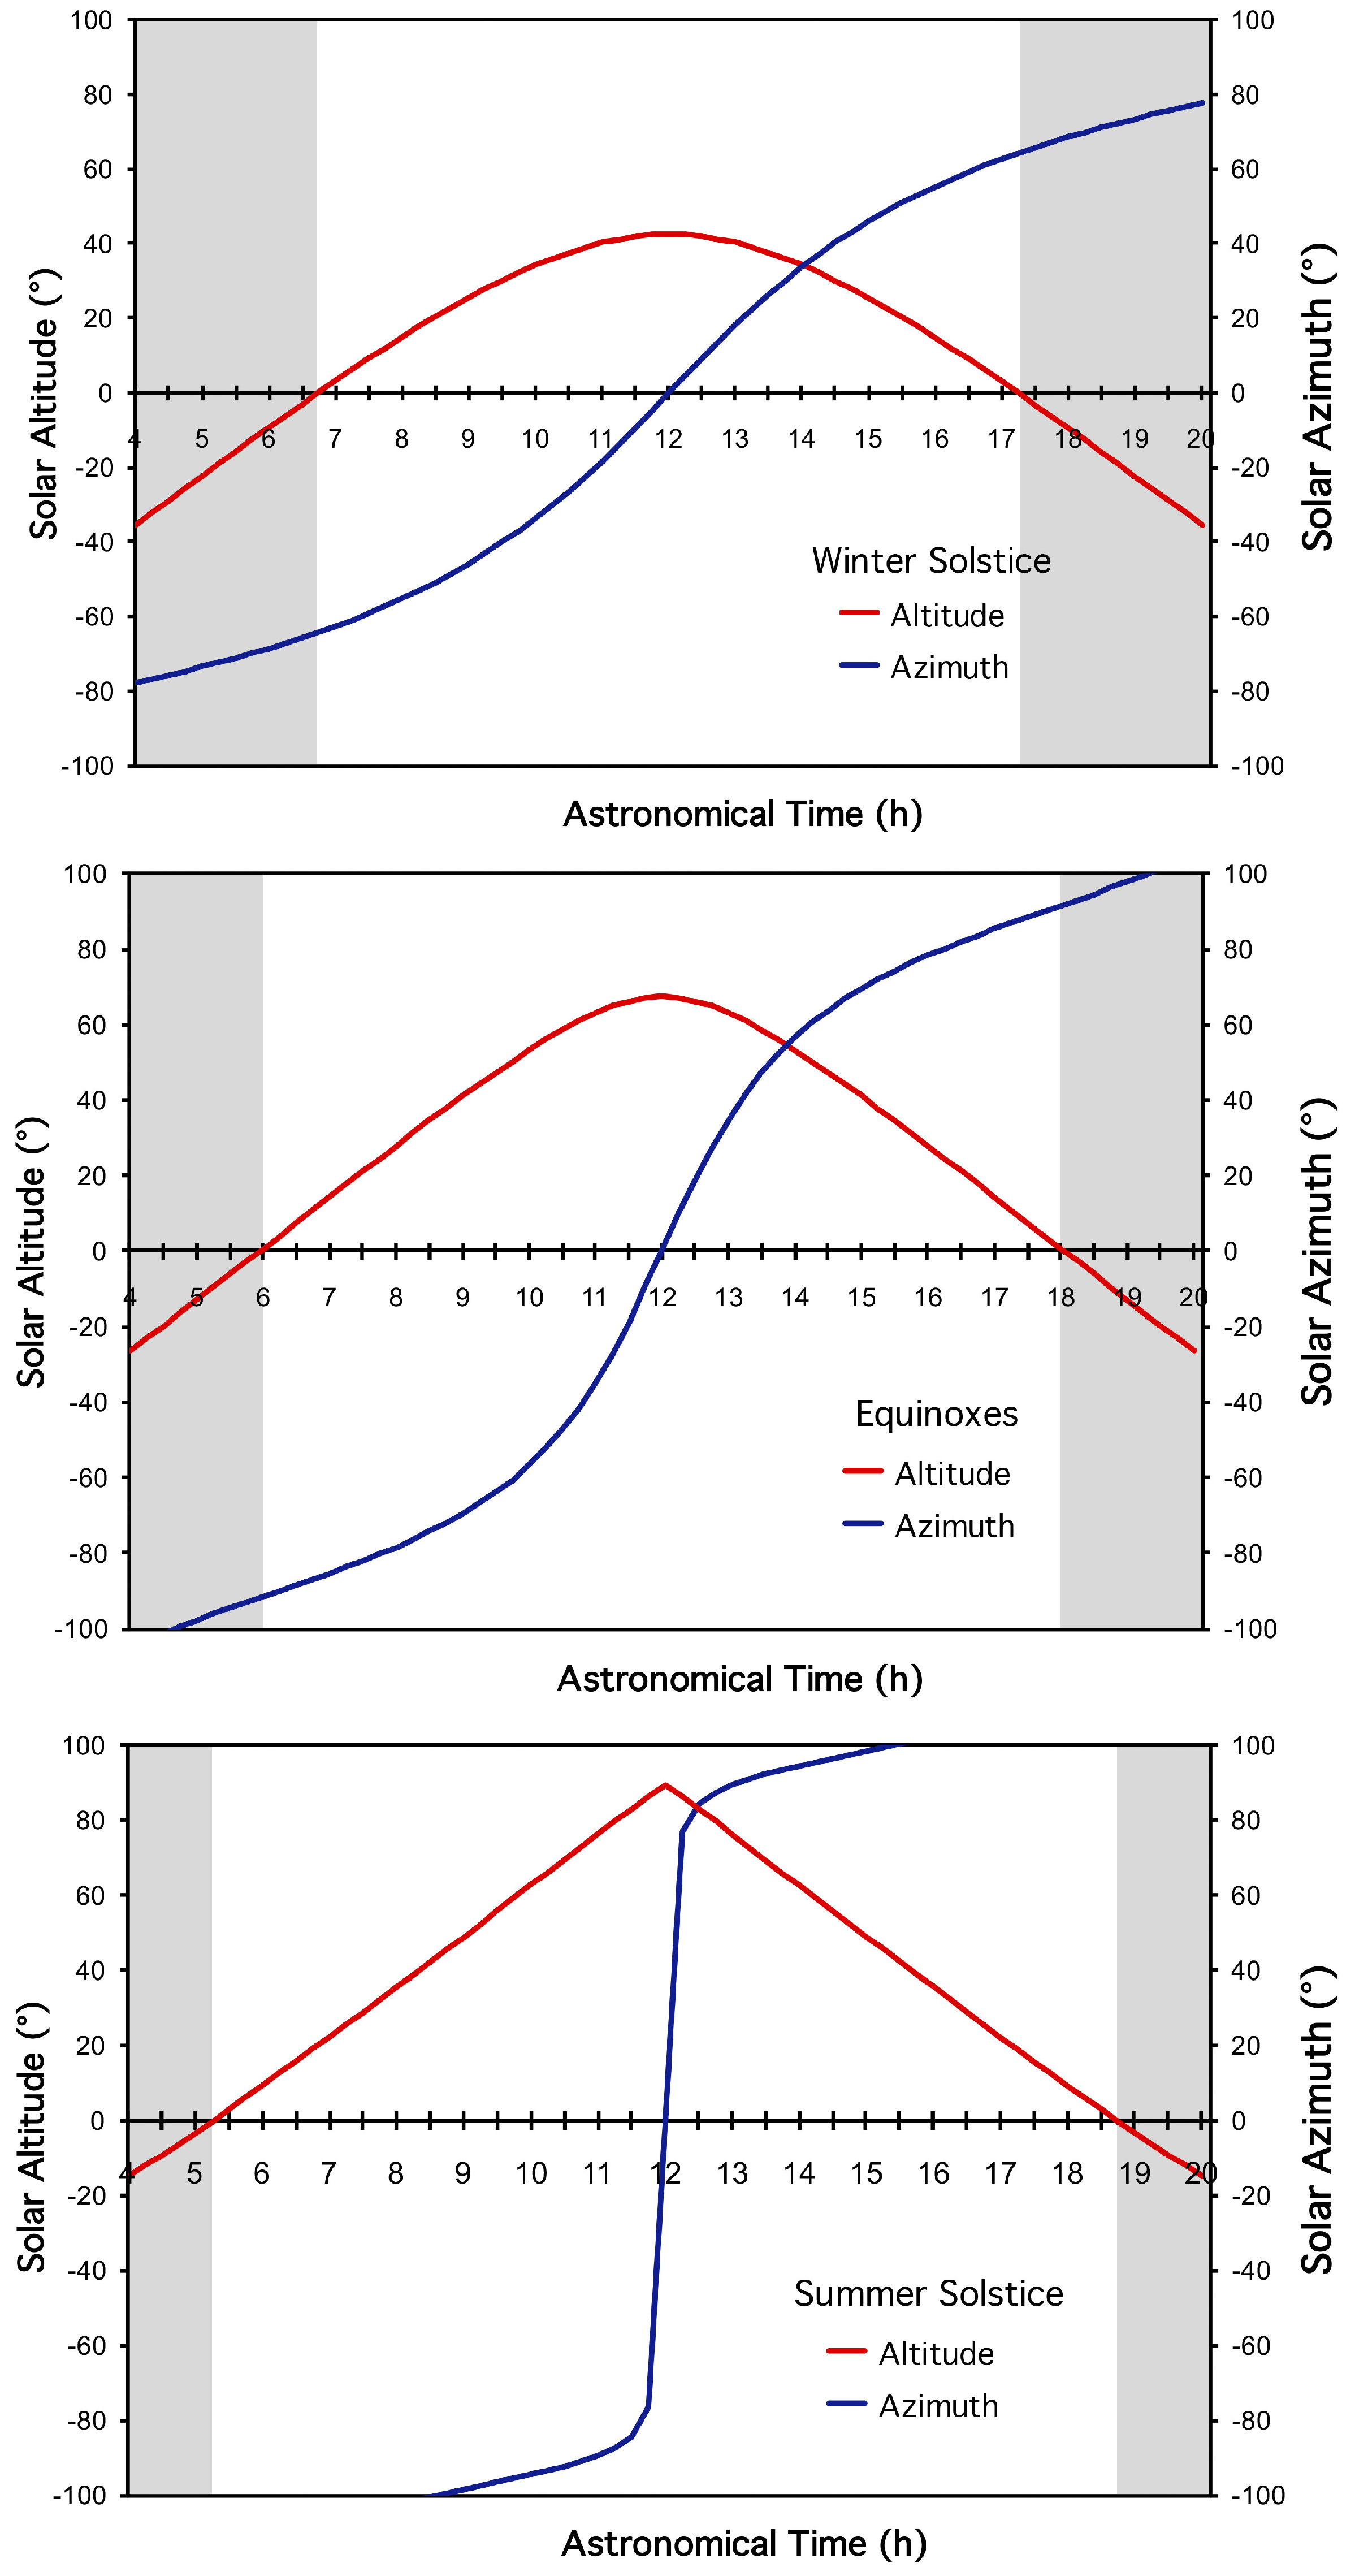
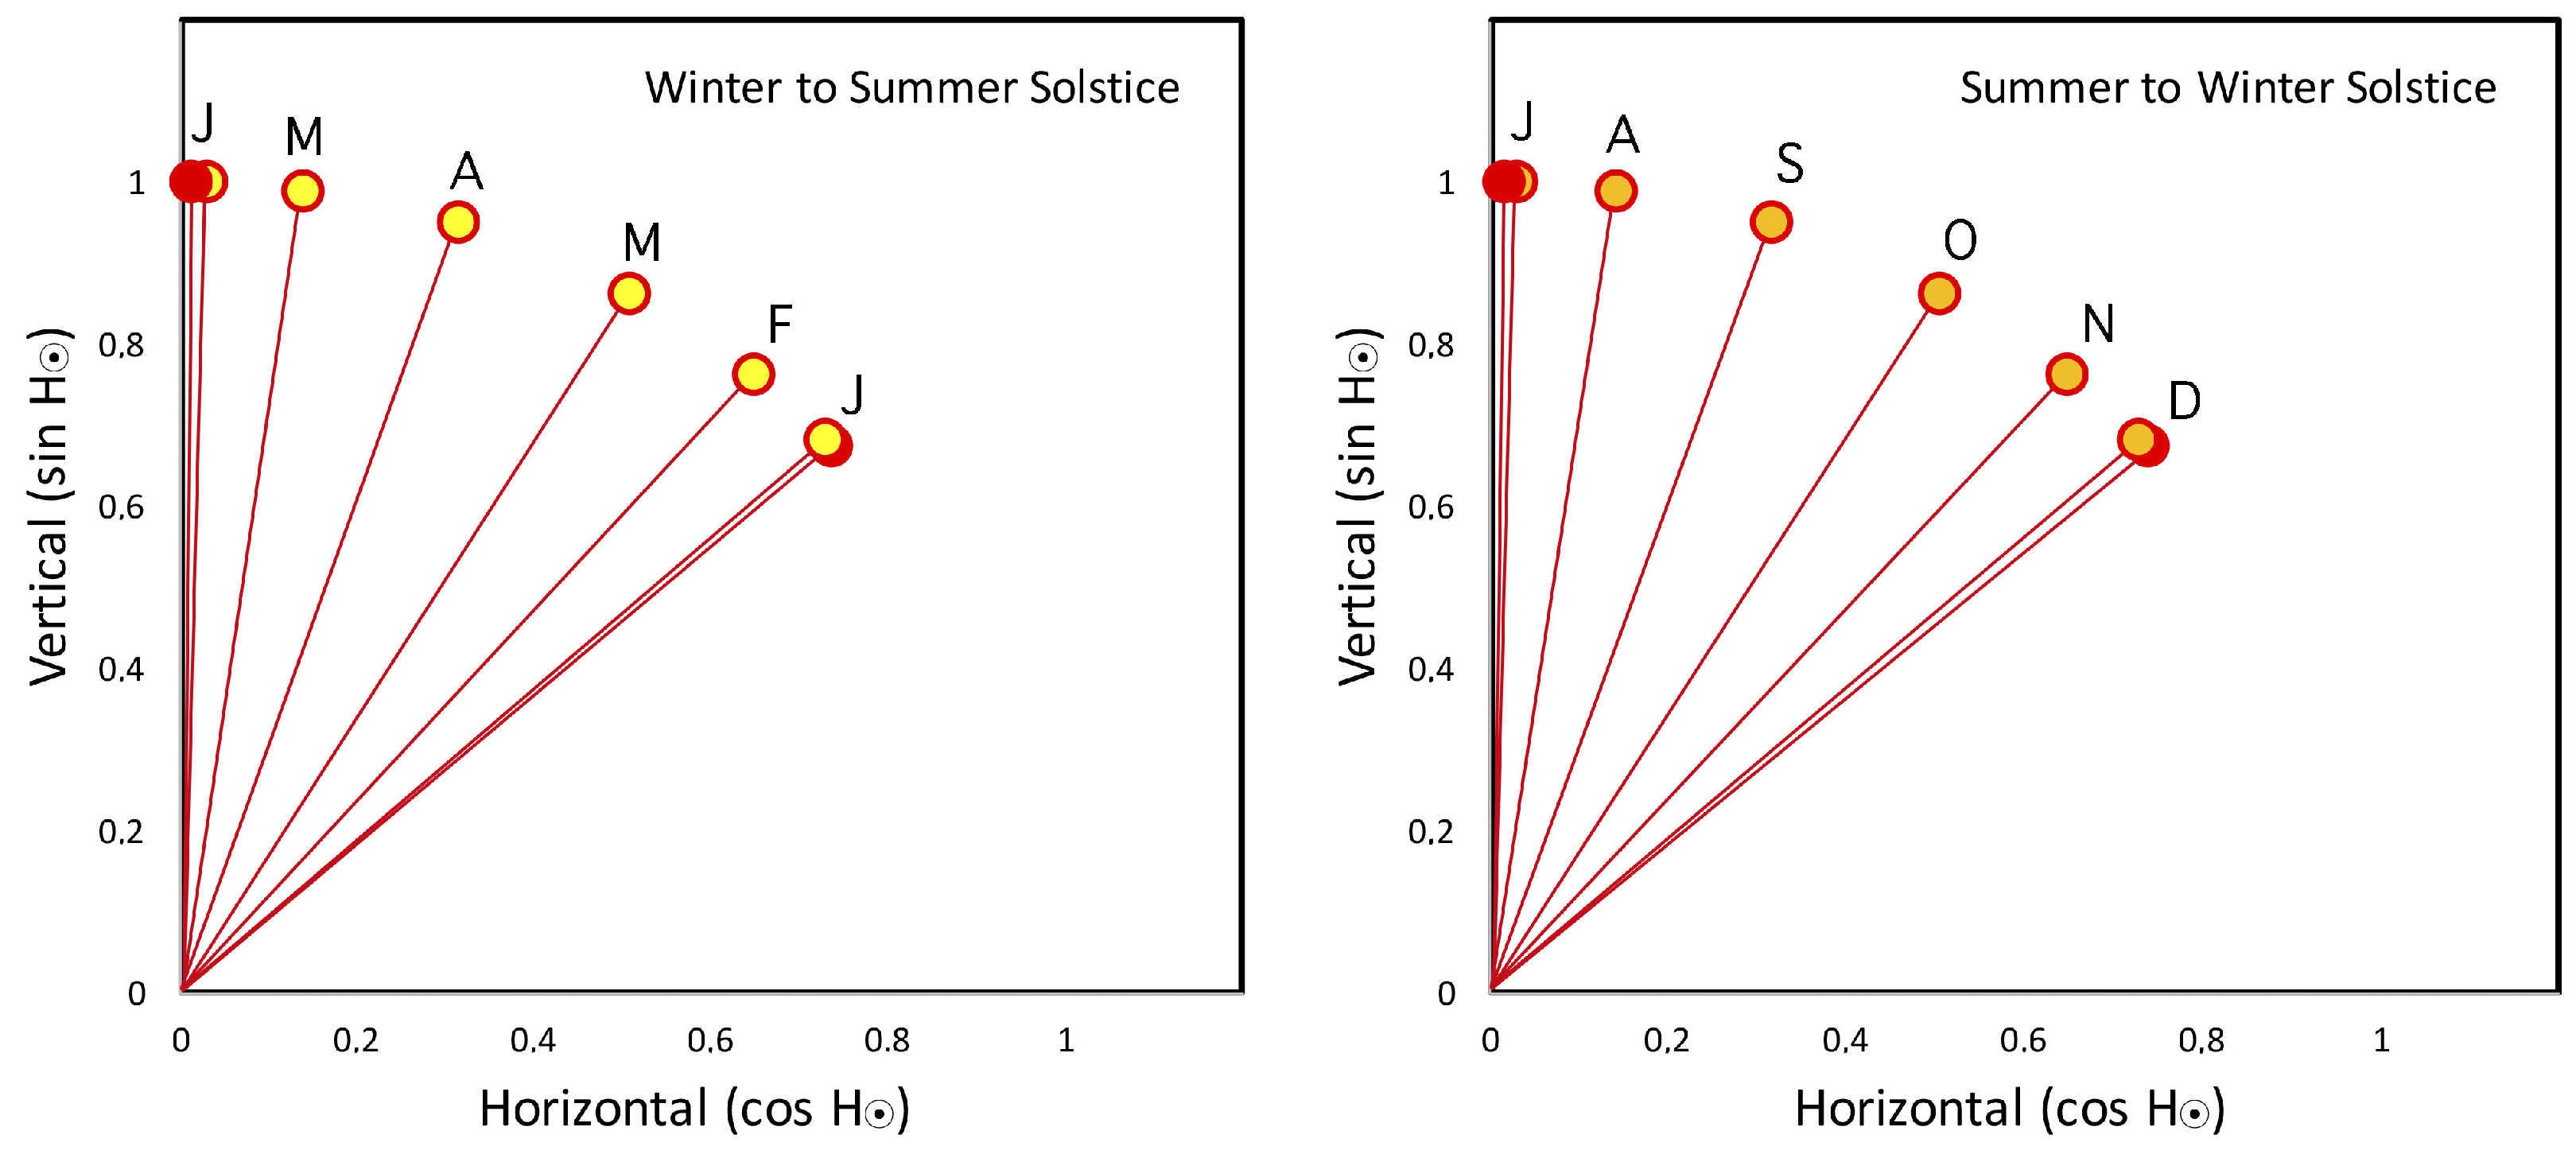
3.1.1. Solar Motions

Daytime is the time elapsed between sunrise and sunset, when H = 0 in the morning and in the afternoon. At the equator, the Sun rises in the east, and sets in the west, vertically, and the daytime period always lasts about 12 h, in all seasons. At the latitude of Al Ain, daytime has a modest variability with the seasons, and lies from around 10.5 h at the winter solstice to 13.5 h at the summer solstice (Figure 5). Daytime at the winter solstice is 23% shorter than at the summer solstice. At higher latitudes, the variability of daytime increases. For instance, at 45 latitude, daytime at the winter solstice is 55% that of the summer solstice. If one excludes the time with cloud cover or precipitation, the average number of sunshine hours per month (average 1991–2021) is about 1 h less [33].
The declination angle δ between the Earth–Sun line and the equatorial plane varies seasonally between ± 23 . 45 . The coordinates of Al Ain are 24 . 22082 north latitude and 55 . 7471 east longitude. As a consequence of this particular latitude (that is in close proximity to the Tropic of Cancer, i.e., 23 . 43621 north latitude), at the summer solstice (21st June), the culmination of the Sun is close to the zenith. When this happens, the Sun is overhead, almost perpendicularly above Al Ain, and shadows almost disappear underfoot. A similar situation has been described for the Great Sphinx and Pyramids, Giza Plateau, Egypt, ( 29 . 976480 north latitude) [34].
The key features of the apparent solar motion around Al Ain are shown in Figure 6. The Sun is represented in terms of the altitude and the azimuth during the summer and the winter solstices, as well as the equinoxes (note that the astronomical situation at the spring and autumn equinoxes is the same).
At the winter solstice, sunrise and sunset occur at 6:56 h and 17:34 h UTC + 4 and the culmination is at 12:14 h measured UTC + 4. In that day, the difference between the official time (i.e., UTC + 4) and A T is 14 min. The altitude of the Sun follows a parabolic trajectory, and reaches the maximum H = 42 . 44 at noon.
At the equinoxes, sunrise and sunset are at 6:21 h and 18:28 h, respectively, and noon is at 12:24 h UTC + 4, i.e., 25 min later than A T . The Sun follows a sharper trajectory and the elevation reaches H = 67 .
At the summer solstice, sunrise and sunset are at 5:30 h and 19:08 h respectively, and noon is at 12:18 h UTC + 4, i.e., 18 min later than A T . Using spherical coordinates, the Sun follows a triangular trajectory, and at noon reaches H = 89 . 14 , close to the zenith. The graph representing the azimuth A is also impressive, because the Sun is overhead. It approaches the local meridian close to the zenith, and enters the opposite sector passing from 90 to + 90 , which gives an apparent sharp transition.

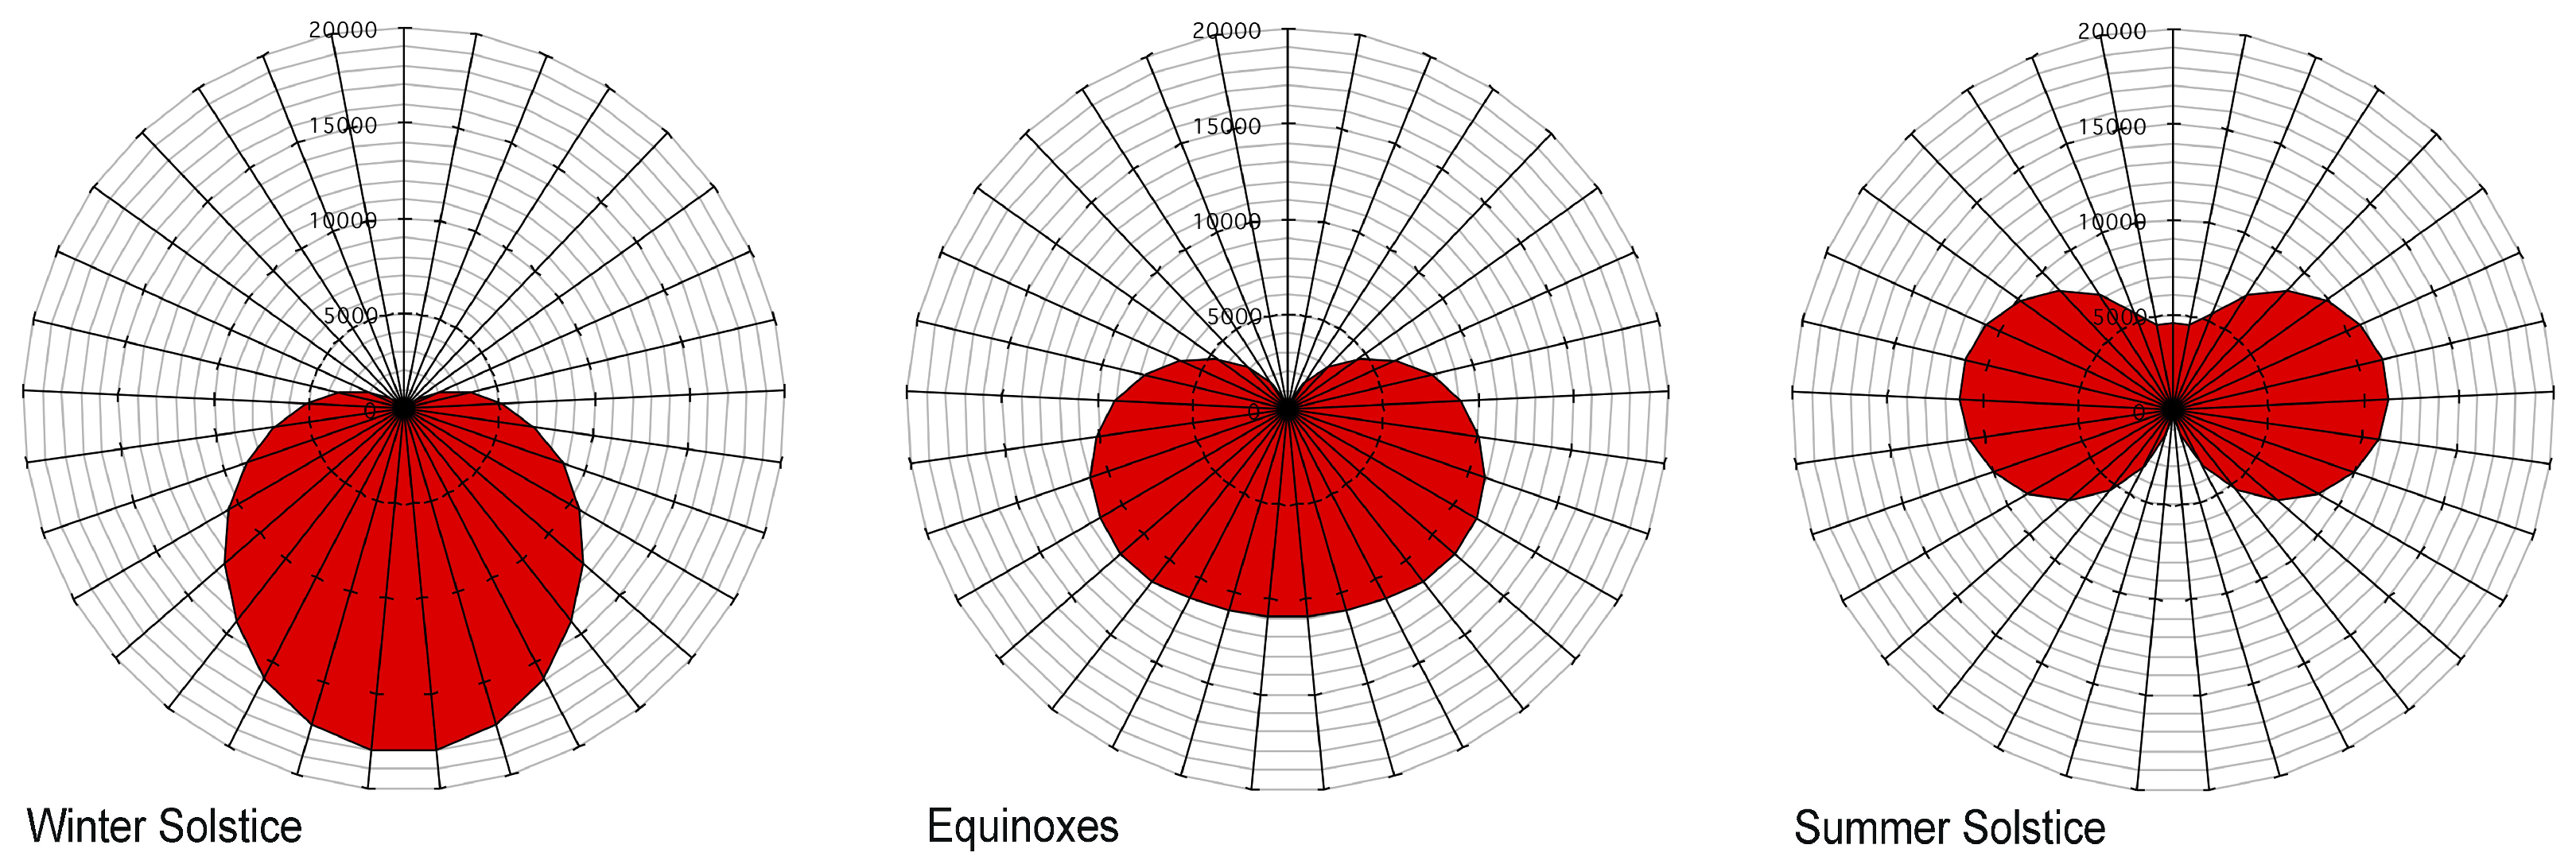
3.1.2. Solar Energy Impinging on the Showcases

The comparison between the solar energy impinging on the glass pane of the tanoor and the walkway at the winter solstice, the equinoxes, and the summer solstice (Figure 7) gives interesting results. At the winter solstice, when the Sun is low over the local horizon, the inclined glass pane of the tanoor collects more energy than the horizontal pane of the walkway. This difference is strongly reduced at the equinoxes. Finally, the situation reverses slightly at the summer solstice, when the Sun approaches the zenith, because the horizontal glass pane of the walkway is almost perpendicular to the solar beams, while the inclined tanoor is not, and collects less energy. The incoming energy increases from the winter solstice to the summer one, passing through the equinox as an intermediate phase. However, the energy at the equinoxes is not centrally located between the values at the two solstices, but is shifted towards the summer solstice. More precisely, at the equinoxes, at noon, the peak of energy is 5% less than that of the summer solstice for the walkway and 11% for the tanoor; at the winter solstice is 30% less for the walkway and 40% for the tanoor.
Looking at the hourly distribution of the solar energy impinging on a horizontal plane with unobstructed horizon during the daytime, the largest amount lies within ± 3 h around noon, i.e., from 9 to 15 h A T . In the official time frame UTC + 4, this interval is slightly variable over the calendar year and is represented by the so-called equation of time, which gives the difference between the apparent Sun (as we see it) and the mean Sun (as given by the clock) [35].
On the horizontal plane, the situation is different from vertical surfaces. The general case of a vertical cylinder in Al Ain is represented in Figure 8. At the winter solstice, the maximum irradiation is from south around noon, while almost the whole northern sector, from west to east, is unreached because the Sun is below the horizon. At the summer solstice, the maximum intensity is reached around the east in the morning, and then around the west in the afternoon; the northern sector has gained solar energy, while the south is not reached because the Sun is overhead, and the beams are parallel to vertical surfaces. A comparison between the vertical and the horizontal plane (e.g., walkway) shows that the latter, going from winter to summer, gradually increases the amount of the collected energy. On the other hand, the vertical surfaces have a different, more complex behaviour. For instance, a vertical surface facing south, and a horizontal surface, have similar trends at the winter solstice, but opposite trends at the summer solstice. This situation may confuse the ideas of those who rely on daily personal sensations, but do not verify them with calculations or measurements.
The solar irradiation impinging on the vertical walls of the tanoor during the two solstices and the equinoxes is reported in Figure 9. For simplicity, in the legend of the figure, the walls are named with the closest compass direction, i.e., the north side faces 348 , east 78 , south 168 , and west 258 . However, the calculations have been made with the exact compass values. At the winter solstice, the southern wall (i.e., the smallest one) receives the most intense irradiation. The western side lies in the shade. At the equinoxes, the southern and the eastern sides receive relevant amounts of energy, with the western side being shaded in the afternoon. On the summer solstice, the most significant impact is on the eastern side.

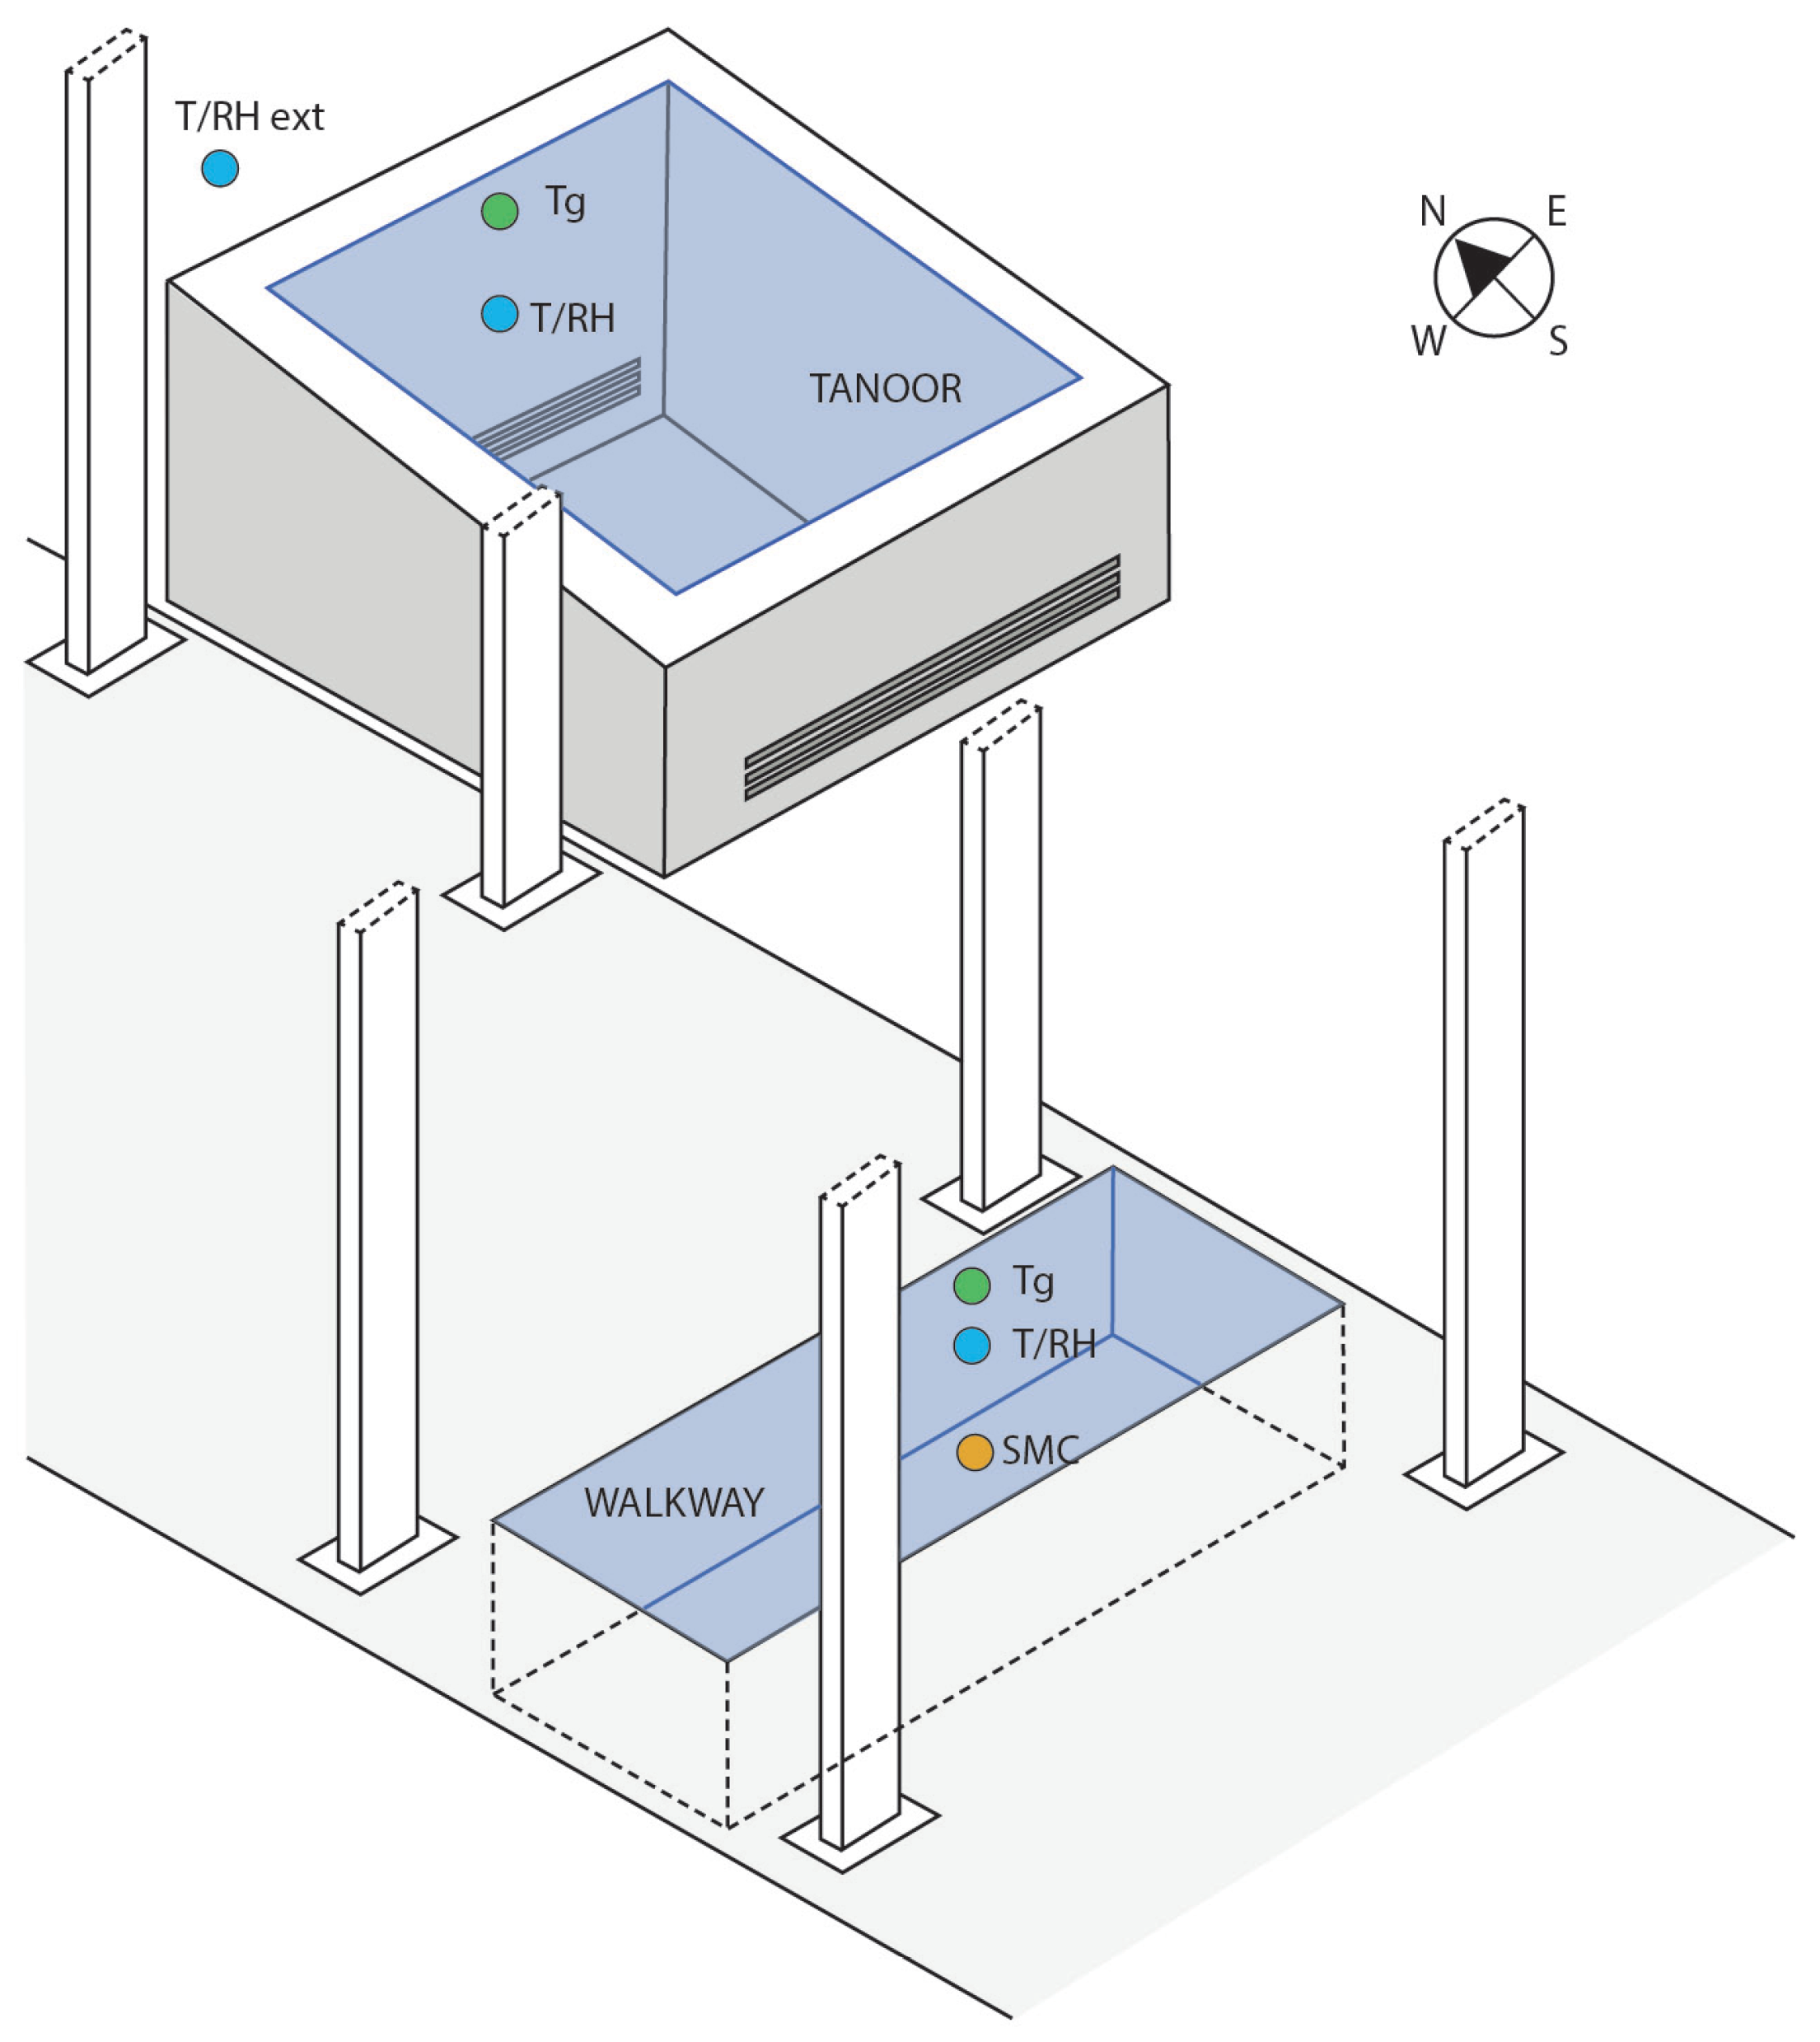
3.2. Microclimate Monitoring

A microclimate monitoring system was installed in order to perform a one-year microclimatic measurement campaign from 22 April 2022 to 30 May 2023. The monitoring included the temperature of the external air ( T E ), the temperature of the air inside the showcases ( T S ) and the temperature of the lower surface of the glass panes ( T G ), which was measured because when T G reaches or drops below the dew point, the glass surface starts misting, or forming drops by condensation. The relative humidity of the air outside and inside the showcases ( R H E , R H S ) was also measured, as well as the soil moisture content ( S M C ) in the walkway showcase, which is more affected by glass misting. As S M C is measured with a dielectric sensor, the output is given in % volumetric water content (VWC), i.e., water volume/soil volume. All sensors were connected to two data loggers (Figure 10a) and sampled every 15 min. The external T E and R H E sensors were protected with a standard multiplate solar shield (Figure 10b) according to EN 15758 [36] and EN 16242 [37] standards, and WMO N. 8 [38]. The types, measuring principles, range, accuracy, and standard reference of all sensors are reported in Table 1. The sensors comply with the European Standards EN 15758 [36] for temperature, EN 16242 [37] for relative humidity, and EN 16682 [39] for moisture content.
The recorded data were processed and plotted with Python (pandas and matplotlib libraries).
From the temperature and relative humidity record, other parameters useful for environmental diagnostic purposes were obtained by calculation [8].
The mixing ratio ( M R ) is the (dimensionless) ratio of the mass of water vapour to the mass of dry air in any selected volume of air. It represents how many grams of water vapour are mixed with 1 kilogram of dry air. It is invariant to changes of temperature, volume and pressure, and changes only when some external vapour is added to the system, or removed from it, or when some external air is mixed with it. This parameter is useful for recognizing when evaporation or condensation occur, and the exchanges between different air masses. It is measured in g/kg. This parameter is calculated by the formula:
M R = 38.015 × R H × 10 7.65 T 243.12 + T p 0.06112 × R H × 10 7.65 T 243.12 + T ( g / kg )
where p is the atmospheric pressure (hPa) and T the air temperature ( C ).
The two showcases considered in this study are very similar to each other in size and location; they are exposed to the same atmospheric input, but the tanoor is equipped with slits for natural ventilation, while the walkway is not. Their comparison of their MR allows us to clarify the role of ventilation, whether this has been implemented according to need, and whether ventilation is a valid methodology.
The dew point ( D P ) is the temperature to which moist air must be cooled at constant atmospheric pressure and constant water vapour content in order for saturation to occur. When the glass pane temperature reaches the dew point, i.e., T g = D P , it starts misting for condensation. When the glass temperature falls below this threshold, i.e., T g < D P , condensation occurs at high rate, forming and growing large water drops. D P is measured in C . This parameter is calculated by the formula:
D P = 243.12 × ln 10 7.65 T 243.12 + T × R H 100 17.62 ln 10 7.65 T 243.12 + T × R H 100 ( C )
Theoretically, condensation occurs when the glass temperature falls below the dew point (red area). However, the presence of contaminant on the glass, (e.g., dust, aerosols) and the uncertainty band of sensors may allow misting for T g W D P W < 2 C (yellow).
Both M R and D P , as well as T G D P , and related plots, have been computed with Python software version 3.12.
For these variables, the methodology is illustrated in Figure 11.

3.3. Soluble Salt Monitoring

The soluble salts on the remains constitute a cumulative quantity destined to increase over time. To fix the first benchmark, in May 2022, during the microclimate campaign, samples of the remains were taken according to EN 16085 standard [40] to measure the concentration of soluble salts. The chemical analyses were performed with scanning electron microscopy (SEM) combined with energy-dispersive X-ray spectroscopy (EDS). This evidenced a patina, with medium–fine grain size, mainly based on calcium sulphate, in hydrated and nonhydrated form, which can be correlated to gypsum derived from sulphation. This patina is not very compact, and is distributed unevenly on the sample under examination. In addition, low concentrations of chlorine and sodium ions were detected, due to contamination of soluble salts, in particular sodium chloride.
The concentration detected in 2022 will be compared with the values that will be found in the subsequent years to assess the growing rate. This is a long–term investigation that should be continued for decades, by repeating the chemical analyses every year or two, but always strictly at the same time of day and same season to avoid misinterpretations due to the daily and seasonal cycles.

4. Results and Discussion

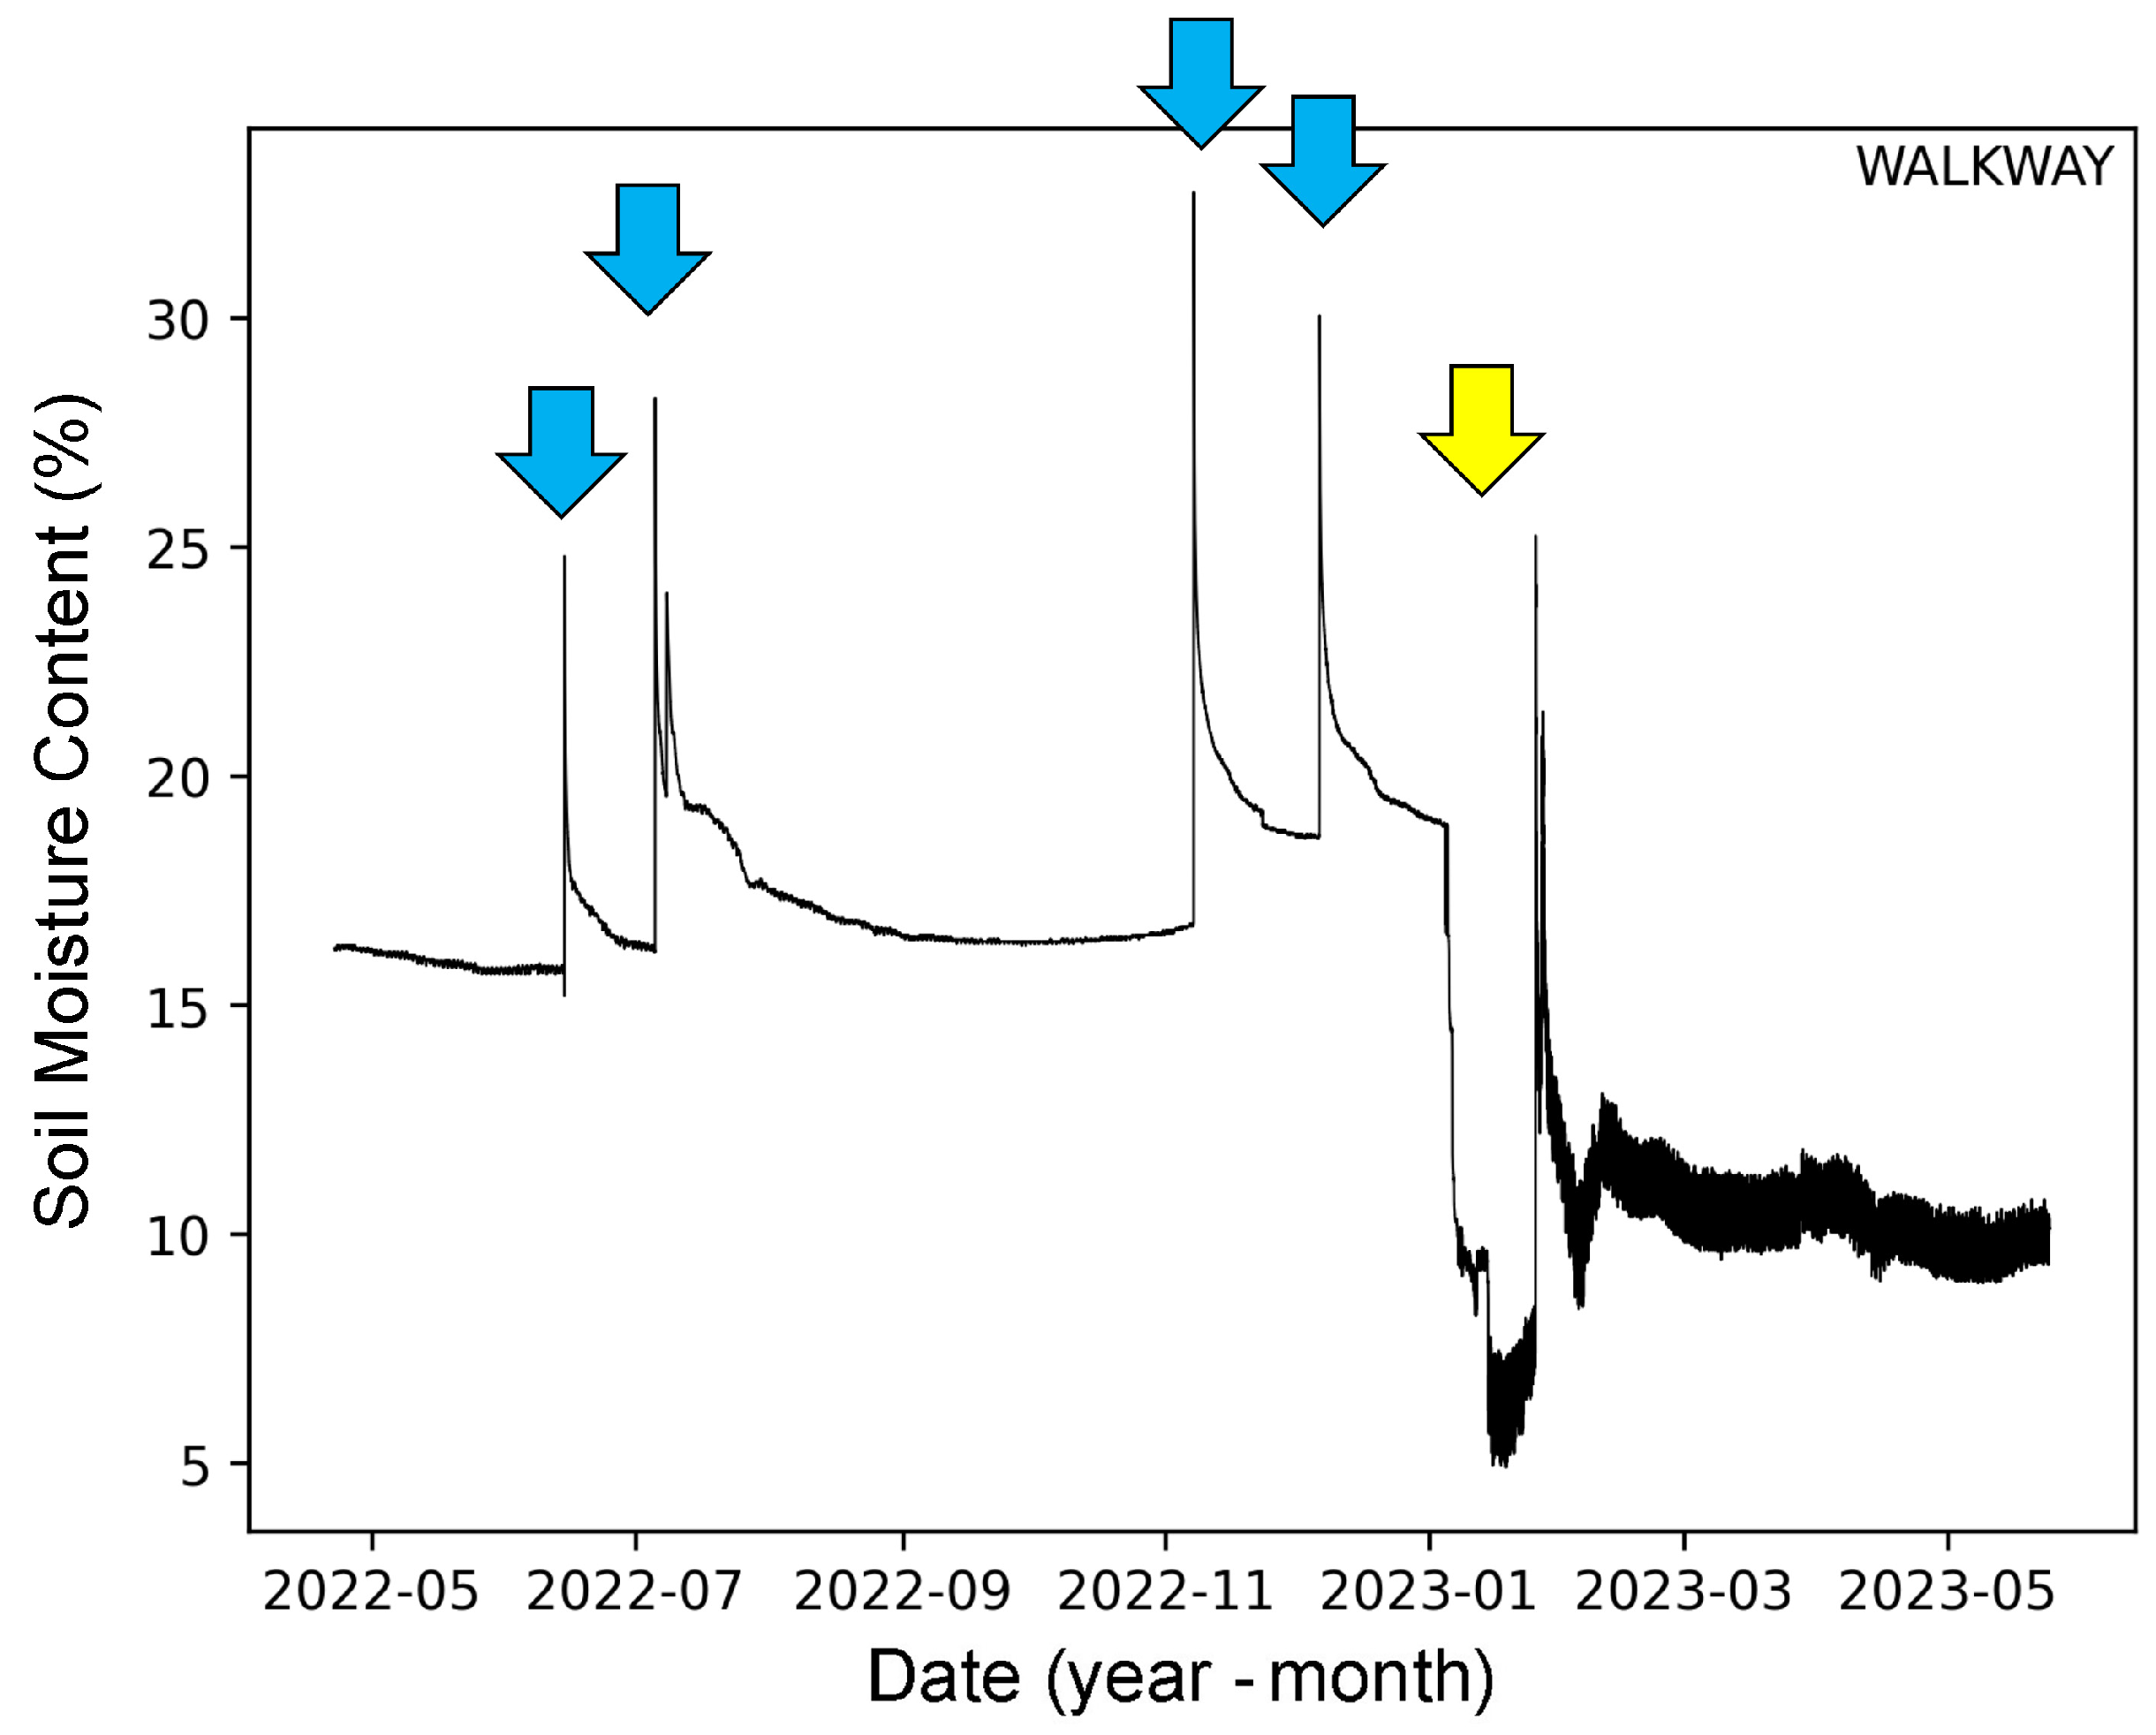
4.1. Soil Moisture Content

The record of the soil moisture content ( S M C ) (Figure 12) shows some peaks (cyan arrows) in 2022. The peaks indicate that some irrigation water has reached the remains. At the beginning of the year 2023, a sharp and long decrease (i.e., evaporation during some maintenance works of the walkway) is visible (yellow arrow). After these works, the S M C returned to a new equilibrium, lower than in 2022 (i.e., from around 17% to 10%).
The present drip irrigation system needs tuning. The allowable amount of irrigation water can be recognized from the plot of the S M C sensor, i.e., to reduce watering until the peaks disappear from the graph. To avoid water leakage, it is advisable to use plants that require less water, e.g., cacti, or keep them at a prudent distance from the remains.

4.2. Daily and Annual Cycles in the Showcases

The situation of the two showcases at the two extreme conditions of the year (in terms of solar radiation) is commented with the help of the recorded data. The dataset includes the temperature and the humidity variables, inside and outside the showcases, at the winter and summer solstices. As usual, daily figures refer to a 24 h time cycle, starting from midnight, i.e., 00:00. For consistency, comments and explanations will start from midnight, even if midnight is not a turning point.

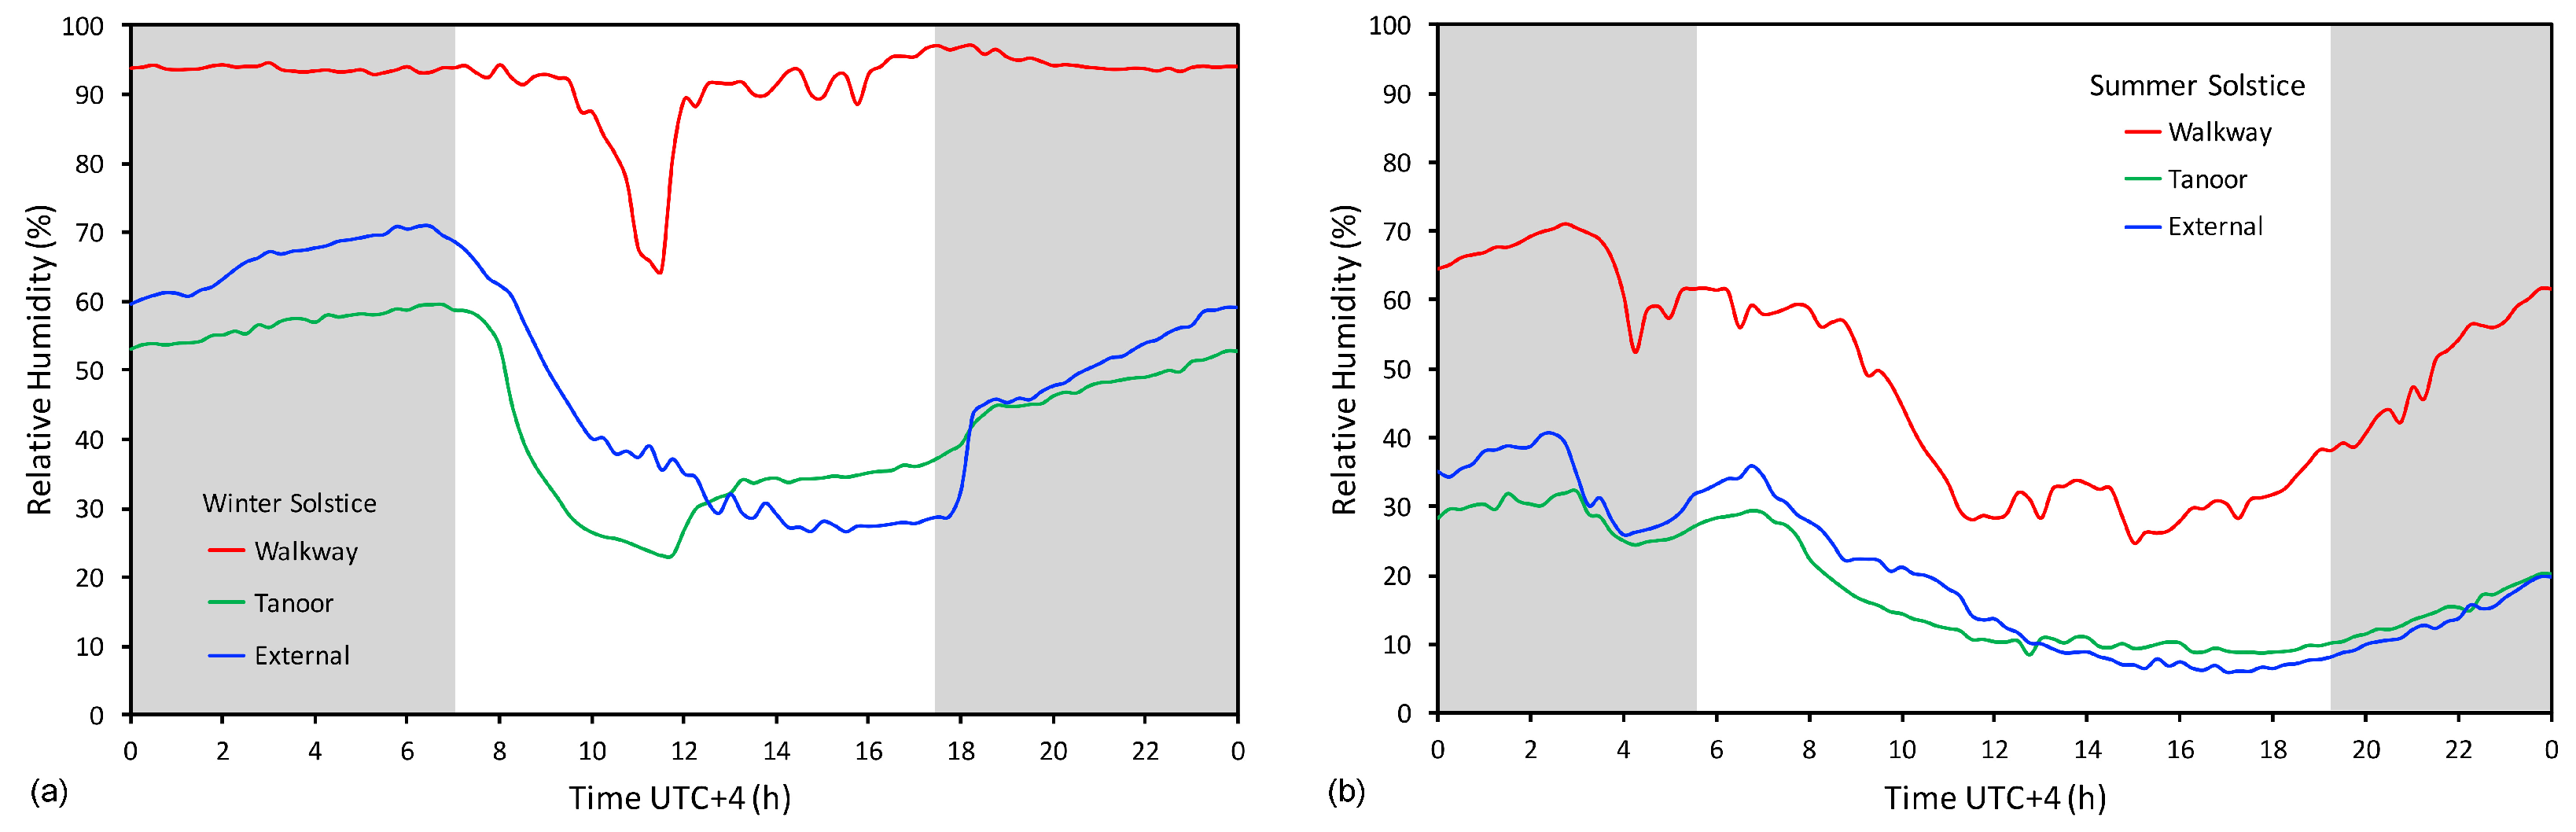
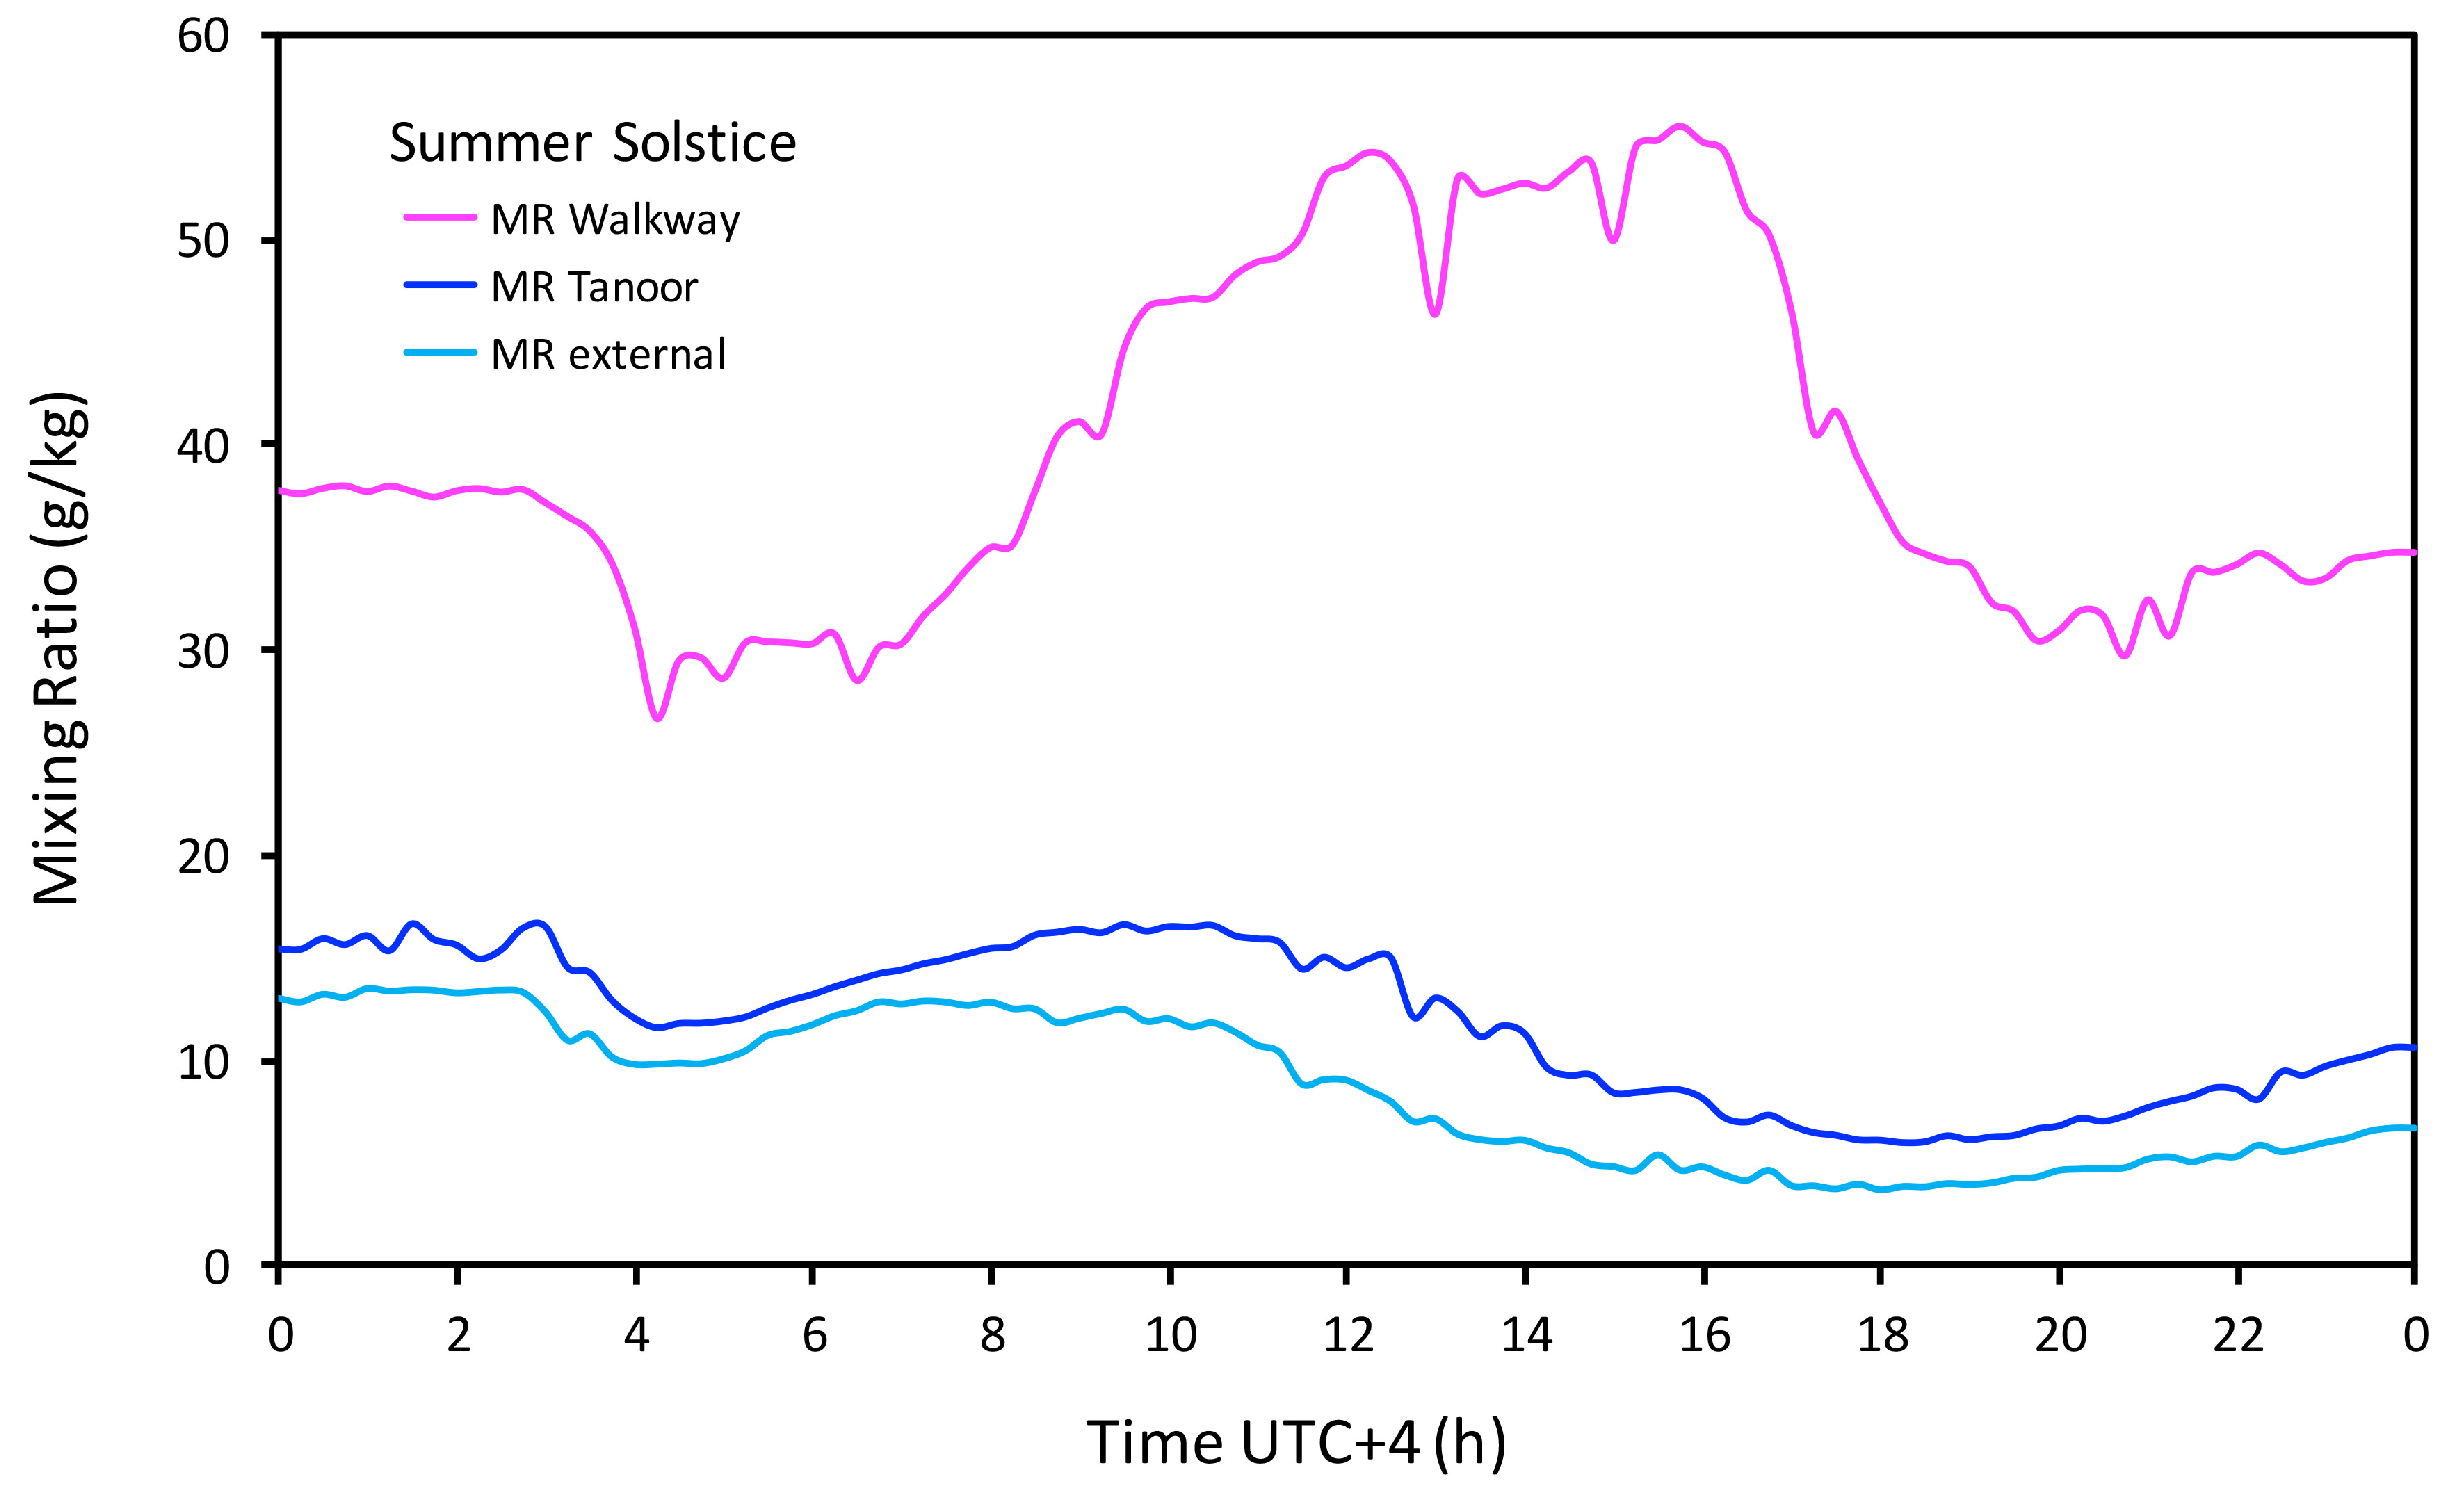
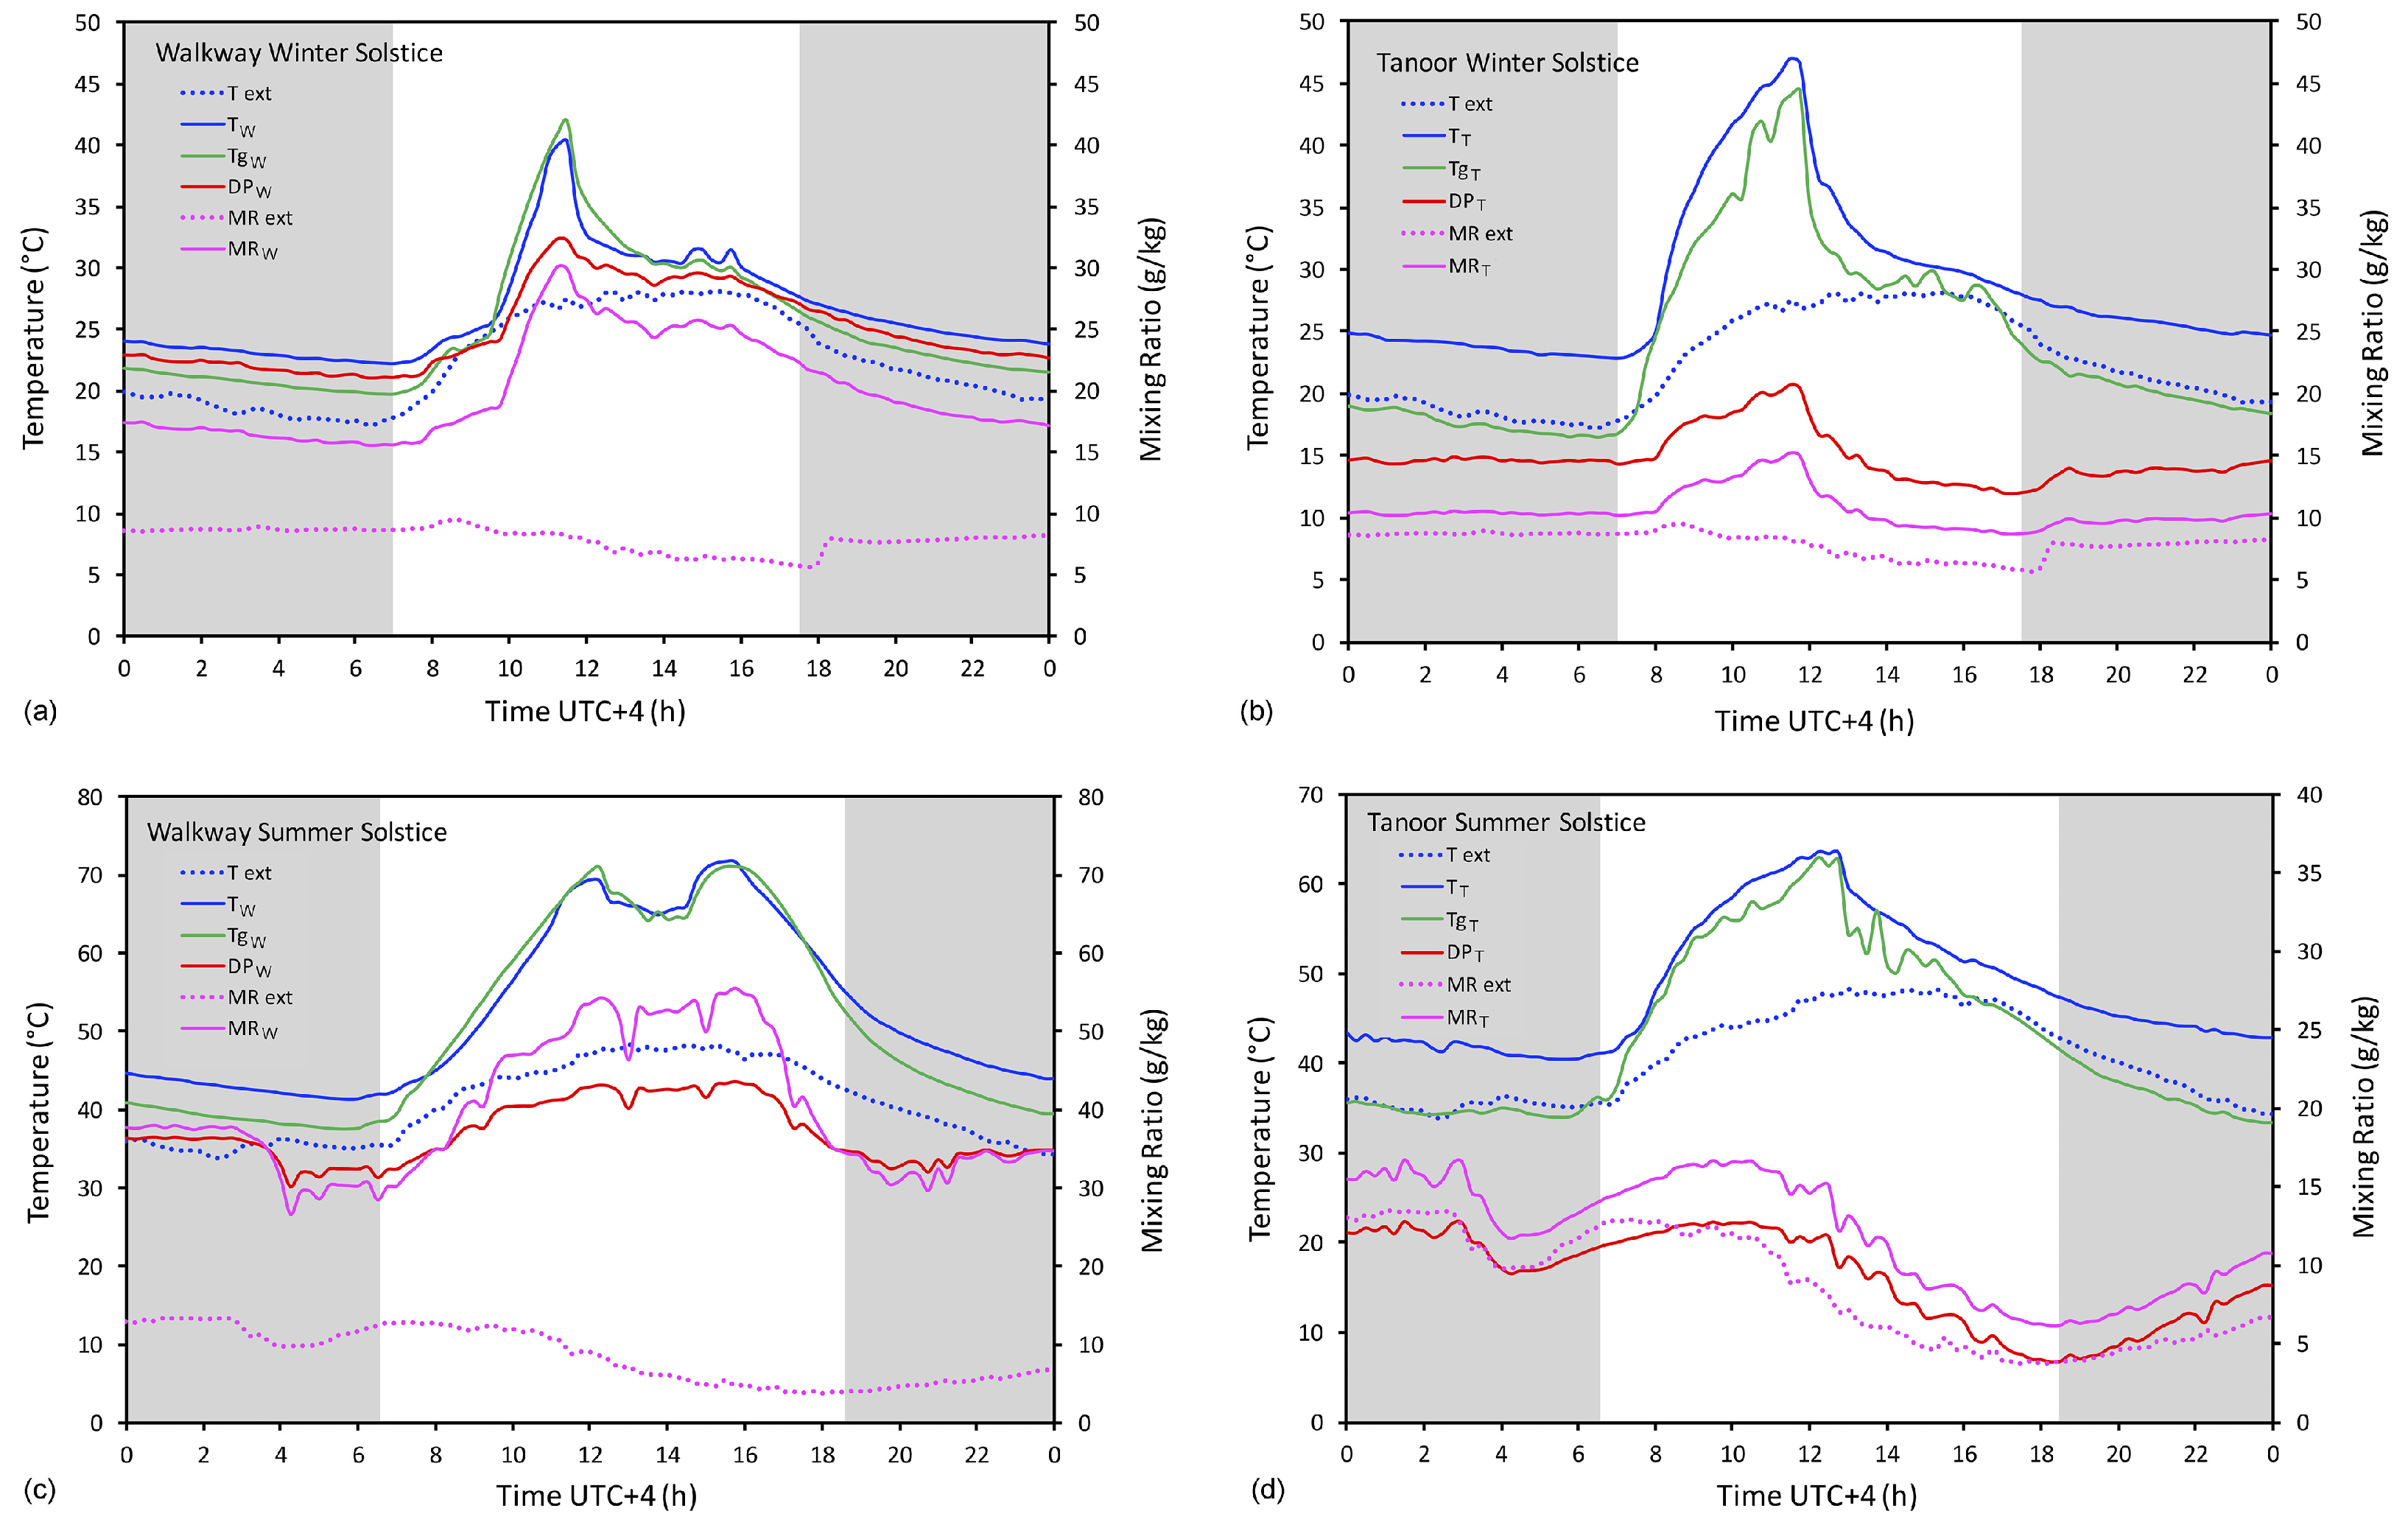
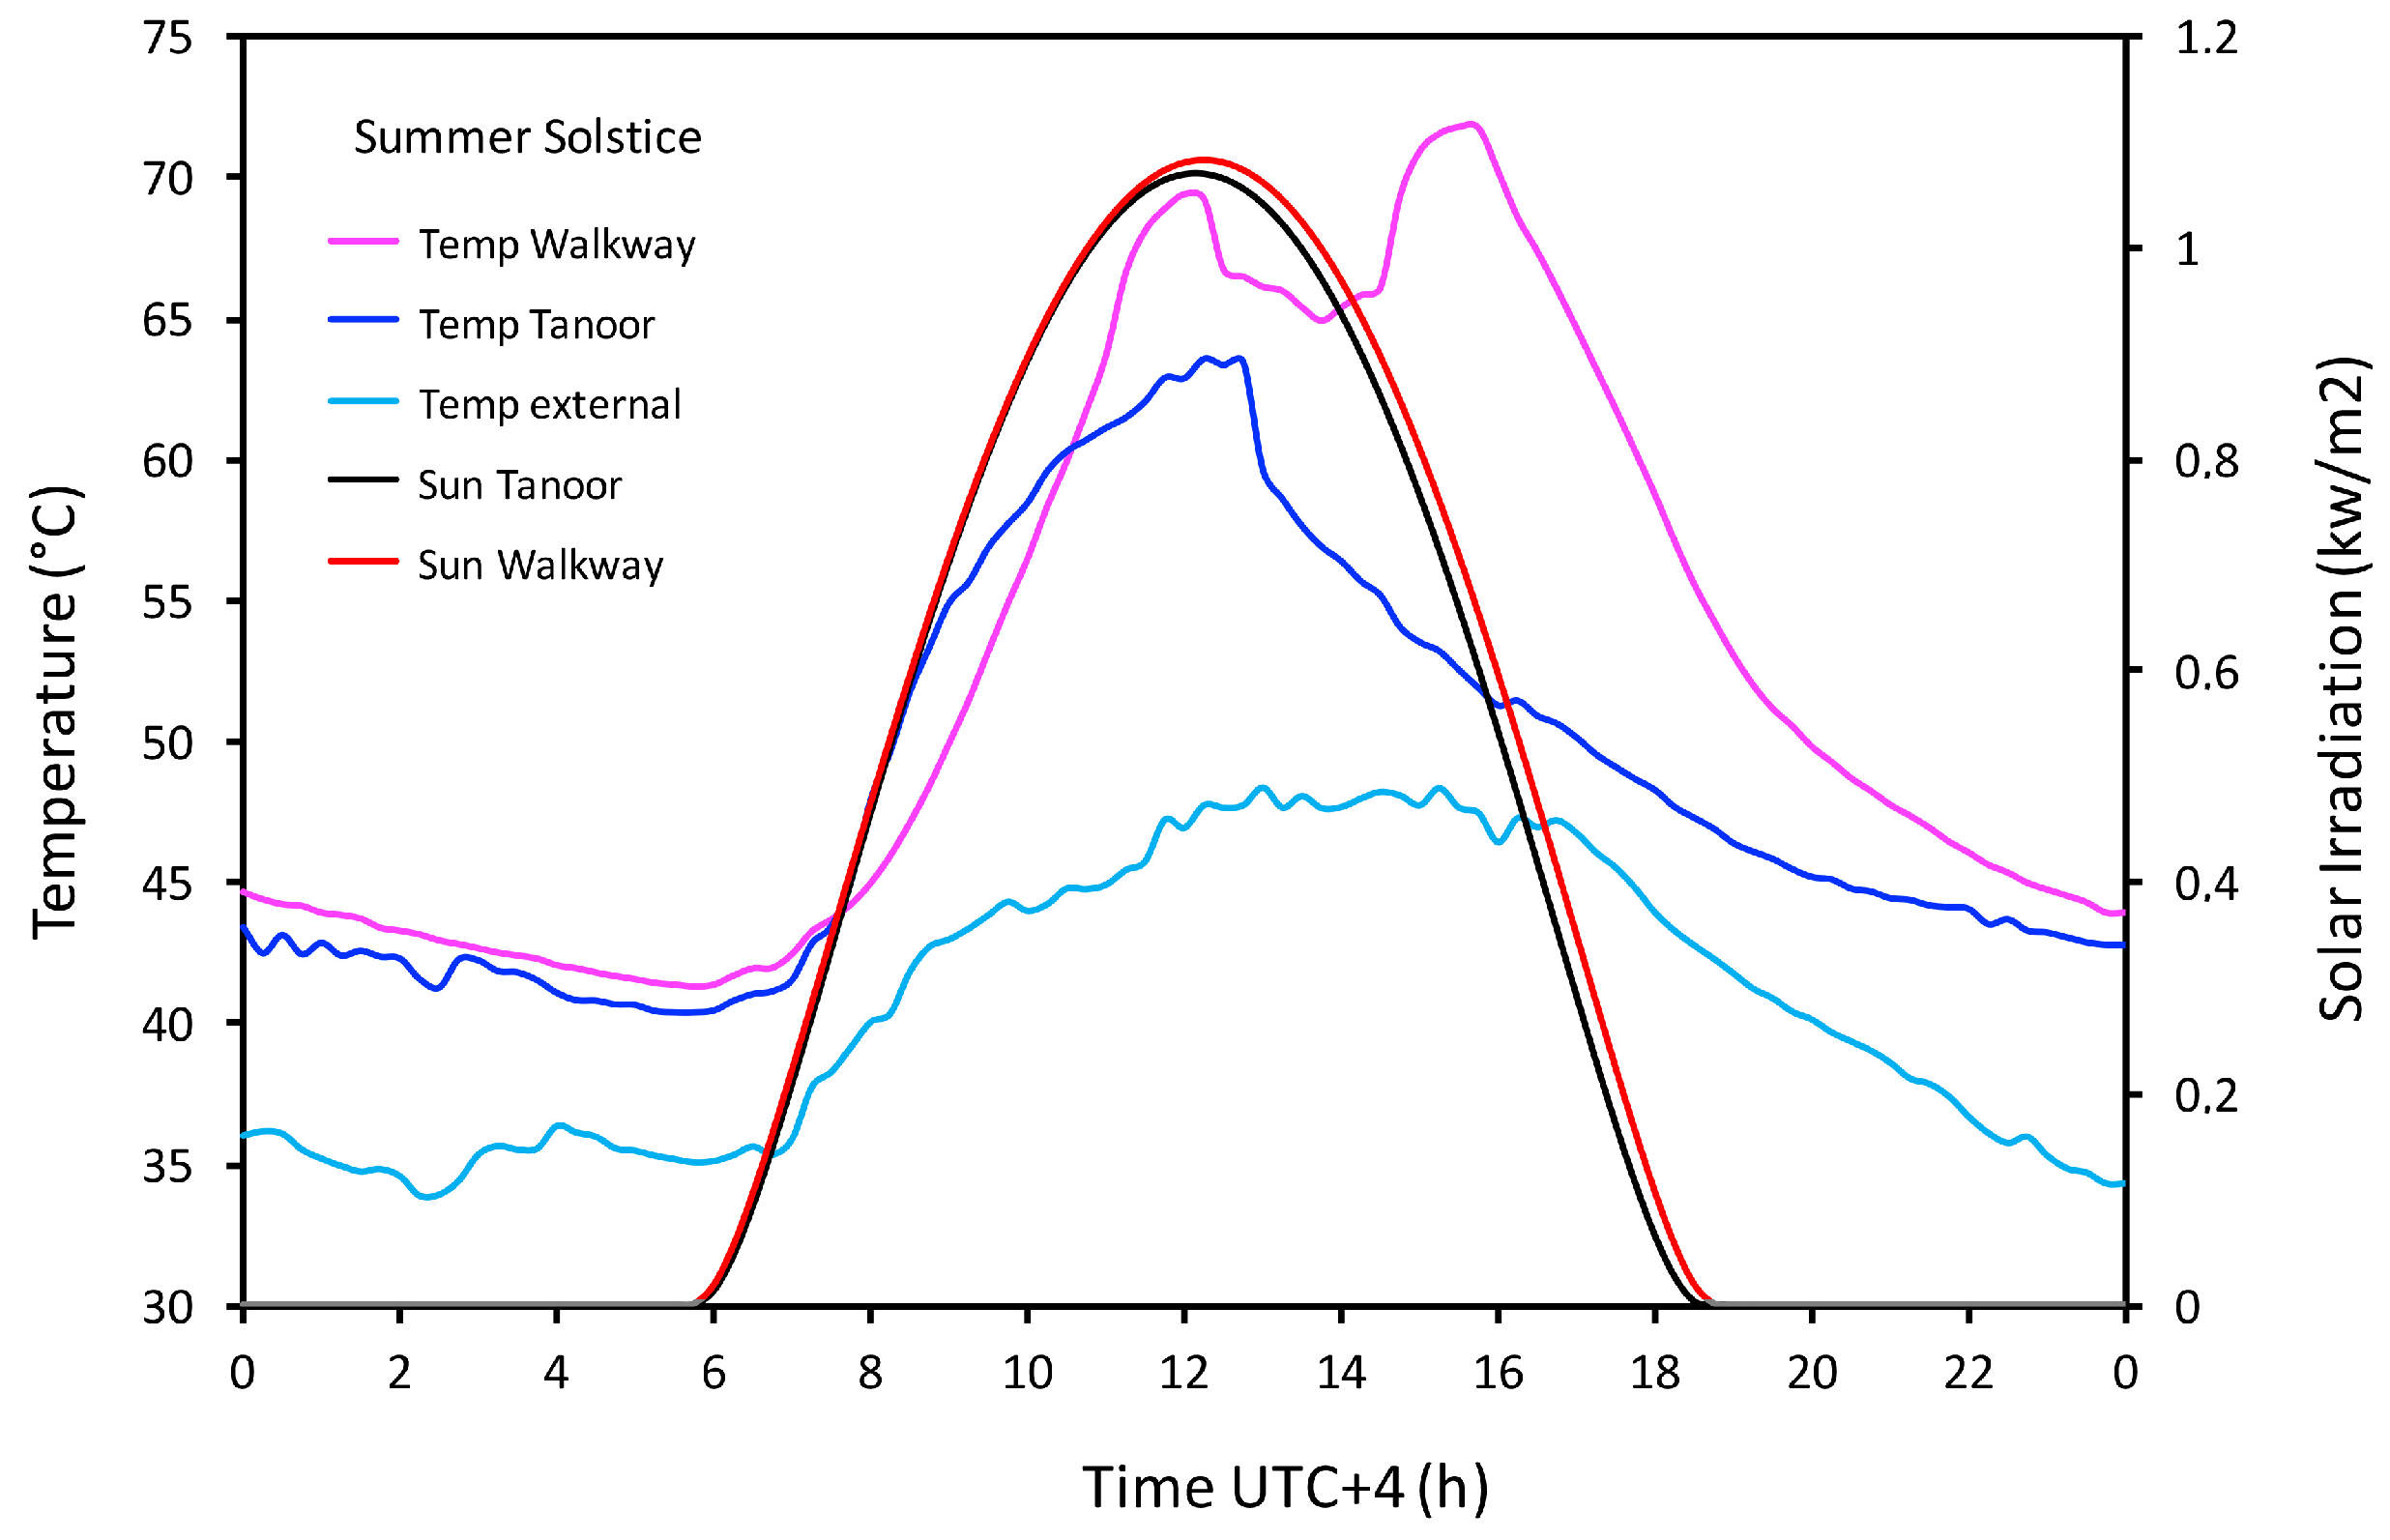
4.2.1. Daily Cycles at the Two Solstices

At the winter solstice, the walkway shows a complex situation (Figure 13a). For the heat accumulated during the previous day, the temperature ( T W ) inside the showcase is some 4 C higher than the external air ( T e x t ), while the temperature of the glass pane ( T g ) reaches an intermediate value, being in contact, and exchanging heat, with both the internal and the external environments. For the evaporation forced by the solar radiation during the previous day, the mixing ratio ( M R ) inside the showcase is almost twice the external value M R e x t , which lies around 8.5 g/kg. The high moisture content raises the dew point ( D P ), which exceeds the glass temperature T g . When T g D P (i.e., the green line is below the red line in the figure), the moisture condenses on the glass, forming drops on the inner part of the pane [8,41]. All the variables (except M R e x t ) have decreasing trends. Sunrise constitutes a turning point. From sunrise (6:56 h UTC + 4) to near noon, all variables (except M R e x t ) change trend, and increase at a high rate until noon. The solar radiation raises the temperature of the glass T g , the showcase becomes a small greenhouse with high temperature and forced evaporation, which is evident from the increase in M R that increases by Δ M R = 14 g / kg , where the symbol Δ denotes a difference between two values of the related variable, in this case a difference in M R . However, during the morning, T g increases faster than D P , and when T g > D P , the drops on the glass pane start to evaporate. On the external environment, the soil warming generates convective air motions with vertical exchanges of upper and lower air masses, which are evidenced by the decrease in moisture content of the external air ( M R e x t ) that continues over the whole afternoon. At sunset, when the solar radiation disappears and the soil cools, the convective motions stop, and M R e x t increases and returns to its basic value in the lower atmosphere.
It should be noted that at 11:30 h UTC + 4, the interior of the walkway and the glass reach their maximum temperatures, about 14–15 C higher than the external air, because the shadow of the pergola reaches the showcase, which starts cooling. Cooling is very rapidly in the first 30 min. After, the showcase reaches a certain equilibrium, determined by the general cooling outside, and the gradual return of the sunshine. However, when the Sun moves away from the ceiling of the pergola, it has a lower altitude H and is weaker. At 16:00 UTC + 4 the cooling dominates and a decreasing trend start for all the variables, except M R e x t , as already commented. The sunset (i.e., H = 0 ) occurs at 17:34 h UTC + 4, and generates two relevant turning points, i.e., (i) the external air temperature that starts cooling; (ii) the glass temperature T g that becomes lower than the D P , starting misting and dewing on the glass pane.
At the winter solstice, the tanoor (Figure 13b) shows a similar but simpler situation. The showcase and glass temperatures reach higher peak values (i.e., T T = 47 C and T g = 44.4 C ), for a slightly different energy balance. The location is eastwards, gaining some 15 min of additional sunshine, and the glass pane is 9 inclined. However, the key difference is given by the ventilation slots that allow air exchanges with the exterior (Figure 11b). During the nighttime, the M R inside the showcase is only 2 g/kg higher than M R e x t .
During the day, the balance between evaporation and ventilation increases the M R by Δ M R = 5 g / kg . The relatively low values of M R generate low values of D P , which always remains D P < T g , thus excluding condensation. The fact that glass is not affected by condensation is positive for the view and enjoyment of the archaeological remains. However, the fact that the showcase overheats by Δ T = 20 C in excess with reference to the external temperature and forces some evaporation from the archaeological remains, which is later dissipated through the ventilation slits, is not positive for conservation (i.e., accumulation of soluble salts on the remains).
In summer, the insolation is strong and lasts longer. The summer solstice is herewith considered to give an overview of what happens over the period from May to October.
At the summer solstice, the walkway (Figure 13c) responds to the solar forcing as follows. During the nighttime, the glass temperature is an intermediate level between the internal and external air temperatures, i.e., T W < T g w < T e x t . During the daytime, the solar radiation overheats the glass, which becomes warmer than the showcase interior. Near noon, from 12:15 h to 15:30 h UTC + 4, the shadow of the pergola erodes the peaks of T W and T g w , causing rapid cooling, i.e., Δ T W = 5 C . However, when the Sun moves away from the ceiling of the pergola, the radiation is strong enough to establish again the previous equilibrium. In the middle of the day, the showcase becomes similar to an oven, reaching 70 C , i.e., with Δ T W = 23 C excess temperature with reference to the external air. This extreme temperature forces evaporation from the showcase bottom and the earthen remains, increasing the moisture content of the air inside the showcase. This forced evaporation lasts from sunrise to 16 h, when the showcase starts to cool. However, although M R W M R e x t , the dew point D P W is unable to reach and exceed the glass temperature (i.e., D P W T g w ), and condensation cannot form on the glass.
The tanoor (Figure 13d) is located east of the pergola; therefore, the strong solar radiation is mainly limited to the morning, which confers a skew distribution to the temperatures and the M R . The behaviour is initially similar to the walkway, with increasing trends in the morning until 12:45 h UTC + 4, when the showcases reach the temperature T T = 63 C . Then, it enters the shade of the pergola, and the temperature T T begins to fall with a continuous trend. The ventilation slits keep the mixing ratio inside the showcase M R T similar to the outside values M R e x t , although with some difference, i.e., Δ M R = 5 g / kg higher inside.
At the winter solstice (Figure 14a), in the open air, the relative humidity R H e x t has a linear, increasing trend during the nighttime, then a rapid decrease after sunset for the solar warming of the ground, and finally reaches a plateau around R H e x t = 27 % in the afternoon. After the sunset, R H e x t shows a sharp rise by Δ R H e x t = 17 % , followed by a slow linear increase. The tanoor follows a similar trend. We have seen (Figure 13b) that the temperature inside the tanoor was initially higher than the external air, but had a similar mixing ratio, and this combination gives a slightly lower relative humidity inside the showcase (i.e., R H T < R H e x t ), and the two trends, i.e., R H e x t and R H T , differ between them by around Δ R H = 10 % . However, at noon, when the tanoor enters the shade of the pergola and cools, R H T has a sharp increase, i.e., Δ R H T = 10 % , followed by a gradual increase that will continue till the next sunrise. The walkway is at saturation, or very close to saturation (i.e., R H W = 95 % ), throughout the whole day, except for the short period in the morning in which the solar radiation impinges on it, causing a sharp decrease in R H W up to 64%. However, when the glass is reached by the shadow of the pergola, the R H W immediately rises to 90%, and later to (near) saturation, around 95%. It must be specified that at these extreme values of temperature and humidity, the uncertainty band of R H sensors increases, so that it is impossible to distinguish between values close to saturation (e.g., 95%) and saturation (i.e., R H = 100 % ).
At the summer solstice (Figure 14b), the three plots R H e x t , R H W , and R H T show the same qualitative behaviour. In particular, R H e x t and R H T have very similar quantitative values, favoured by the ventilation slits, while the closed tanoor has values on average 30% higher (i.e., R H T from 20% to 40% higher) than the other two.

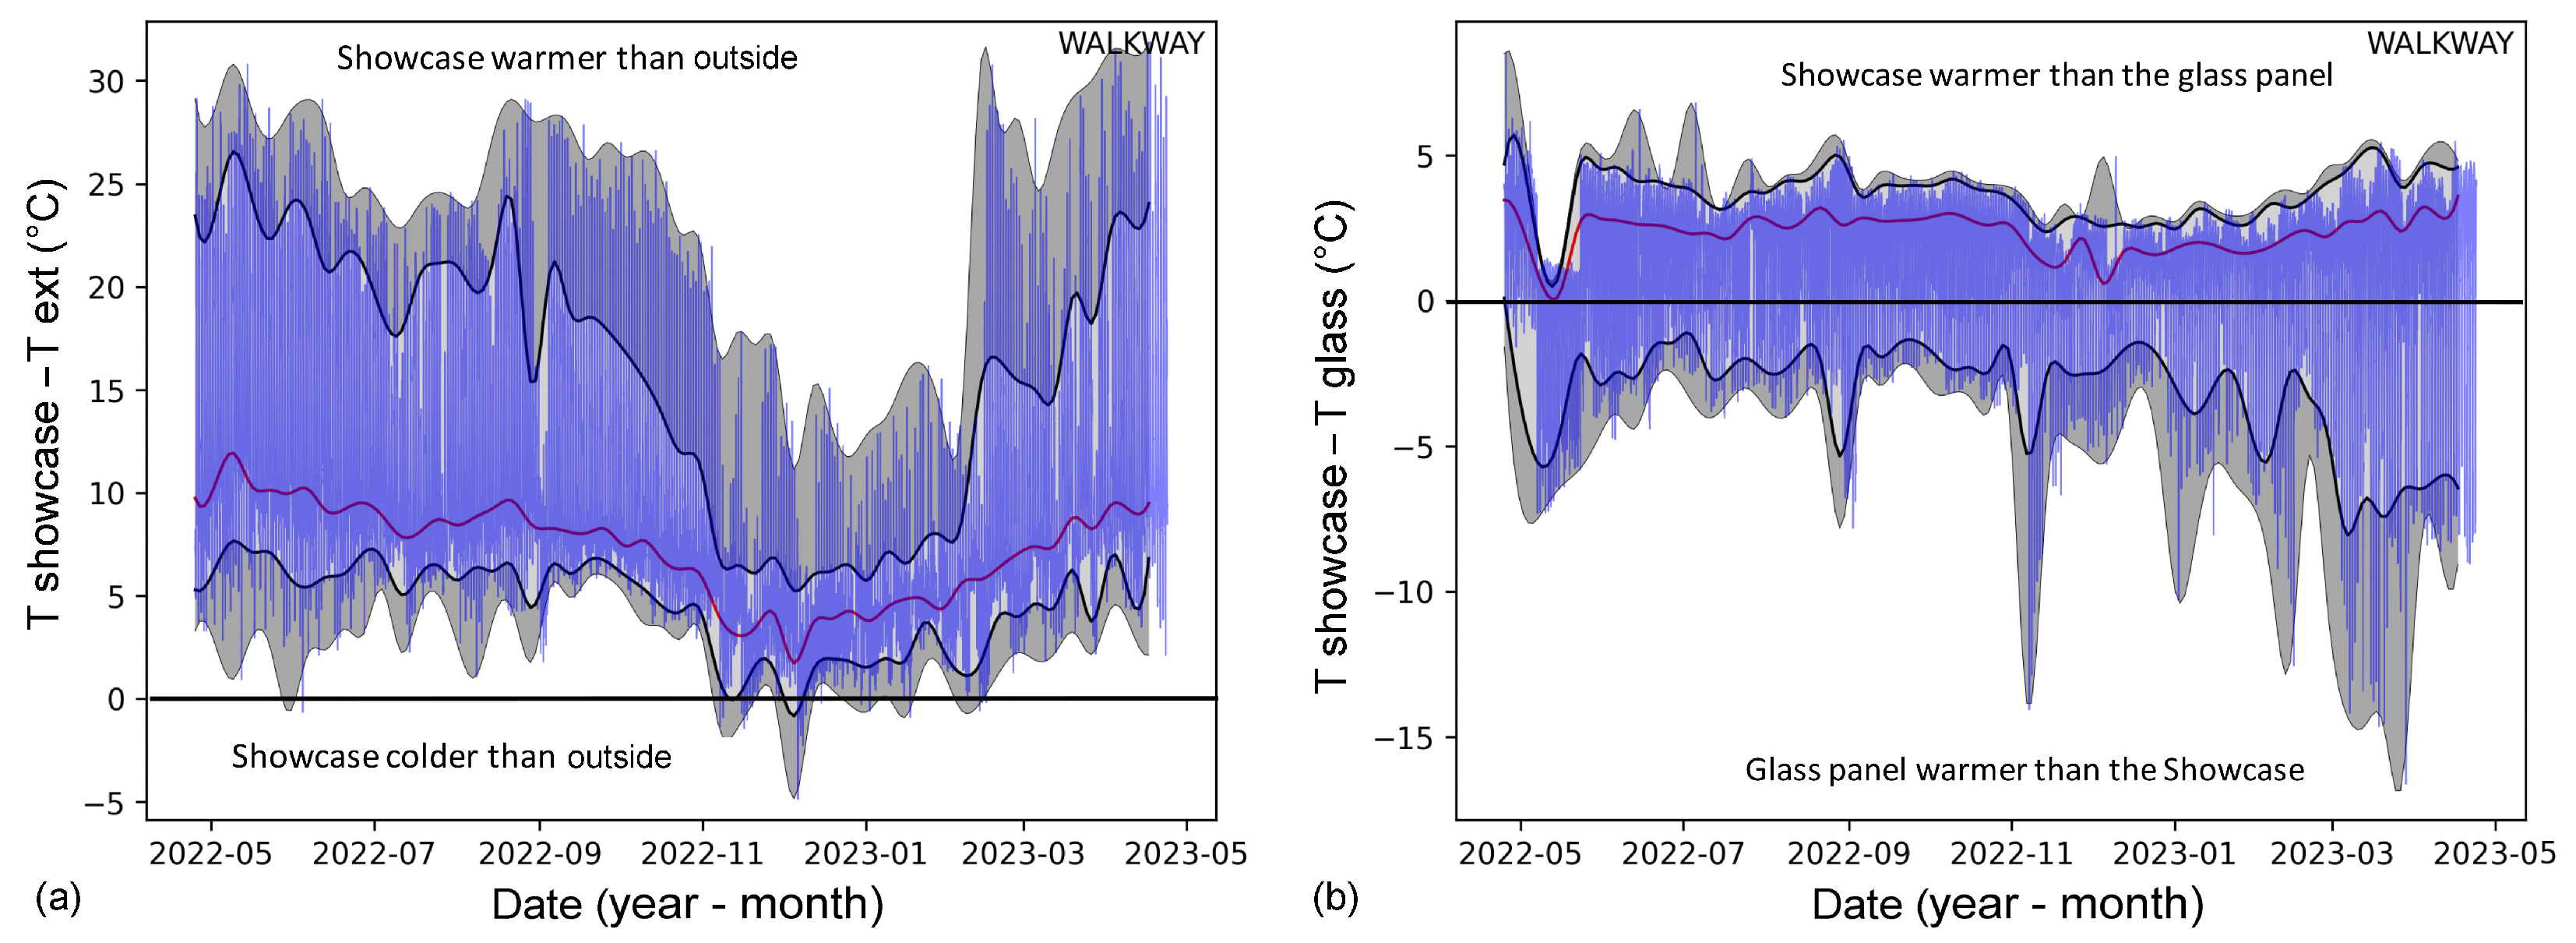
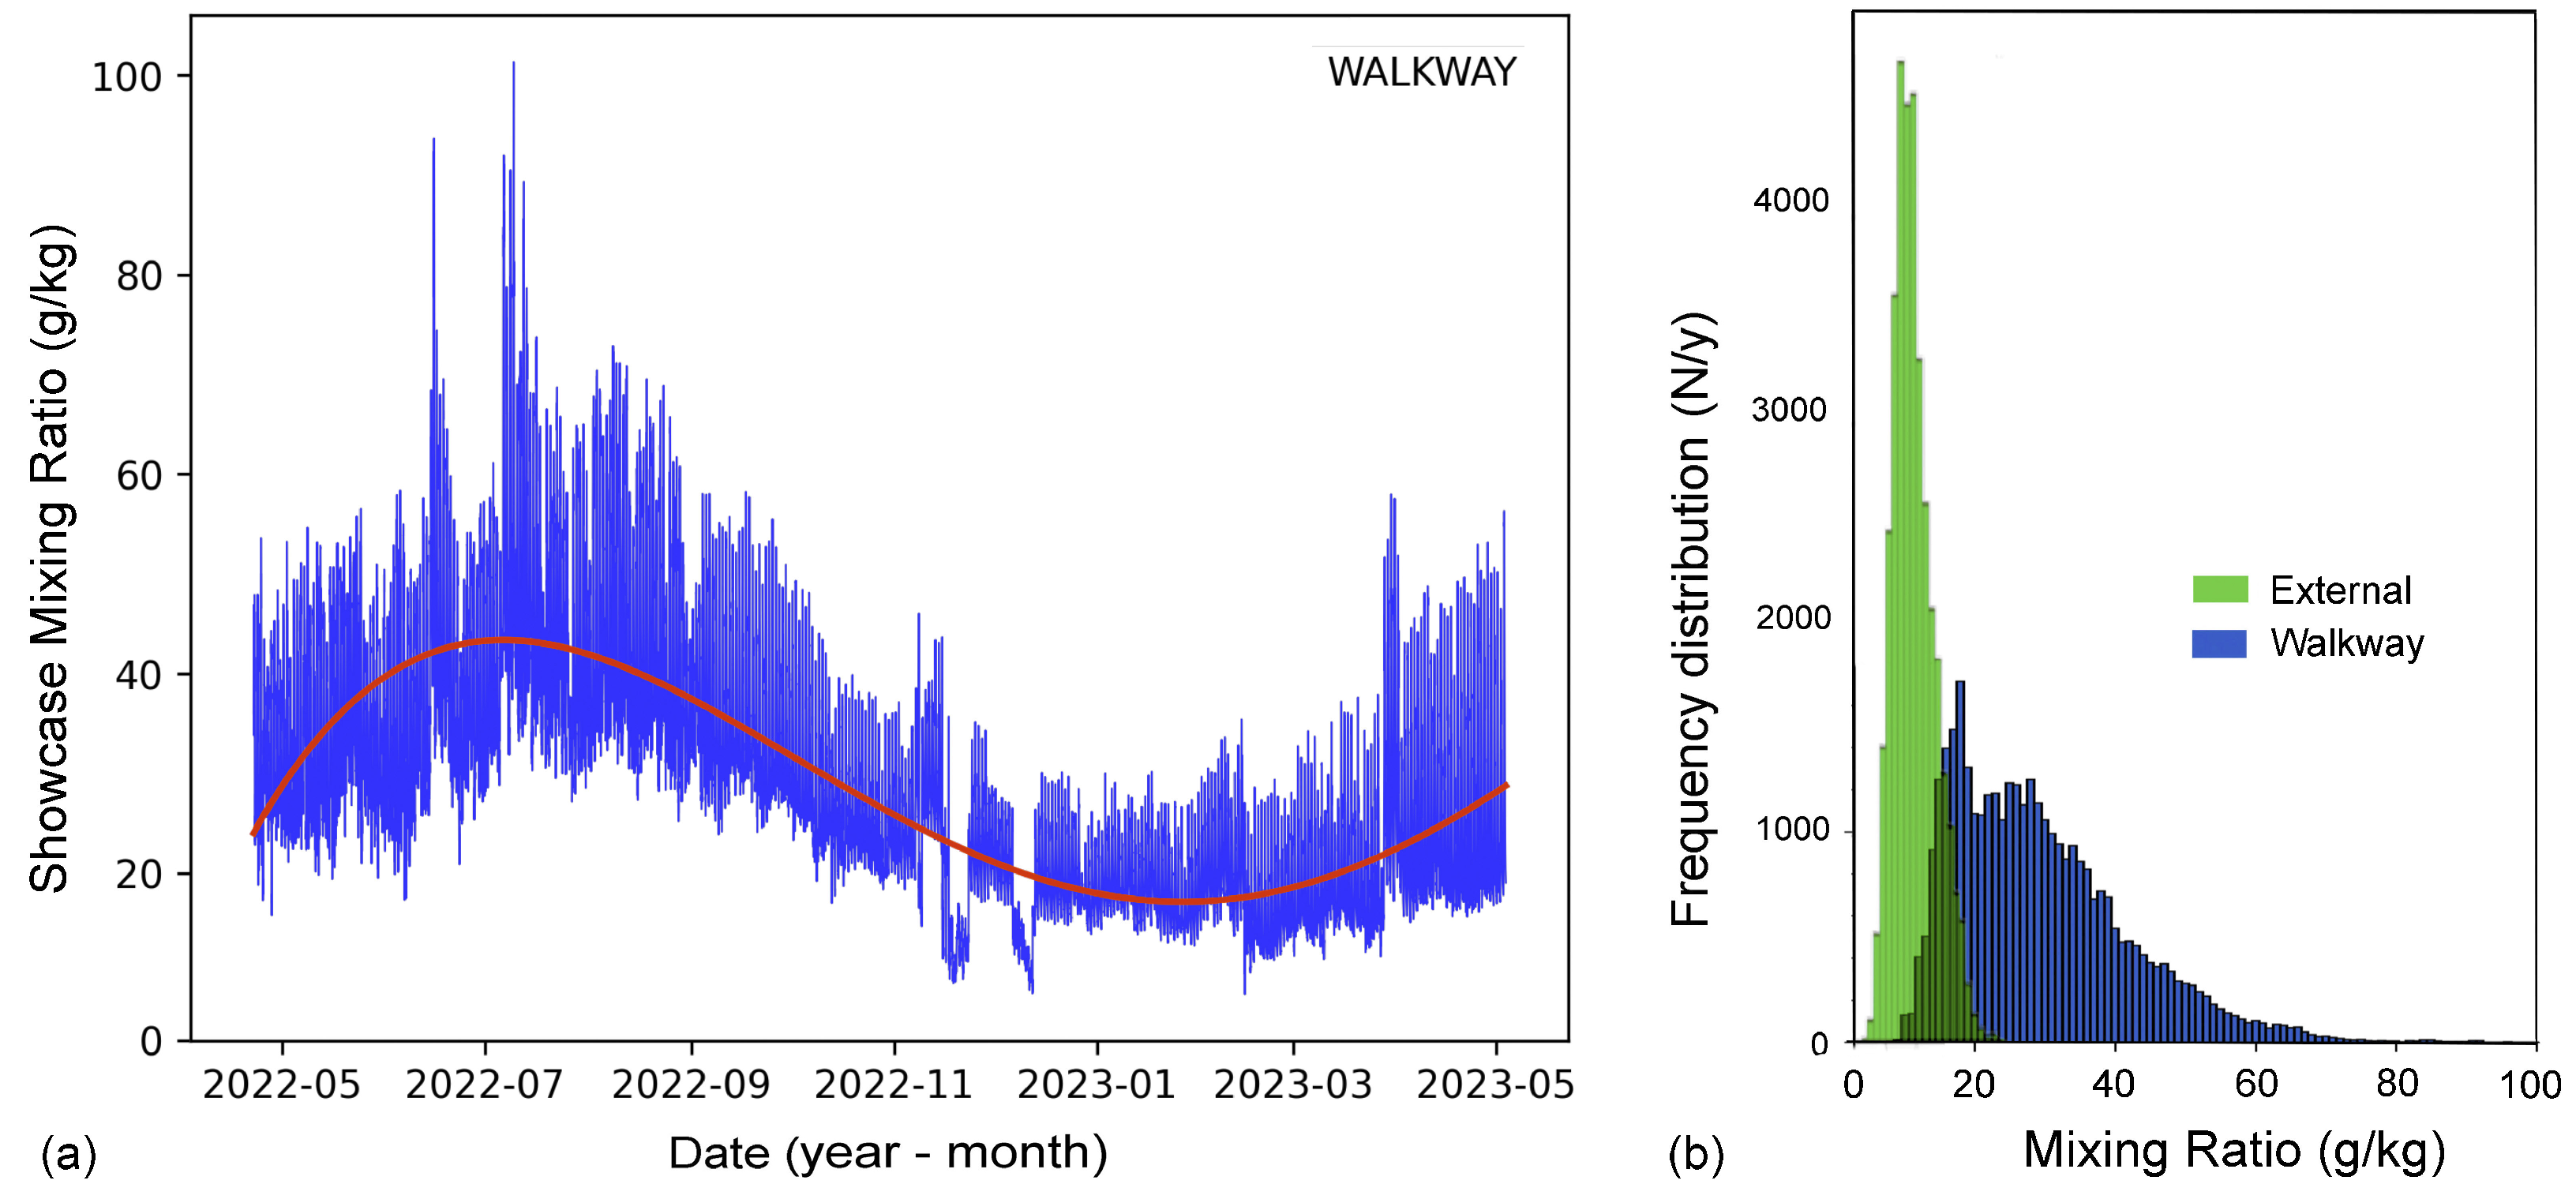
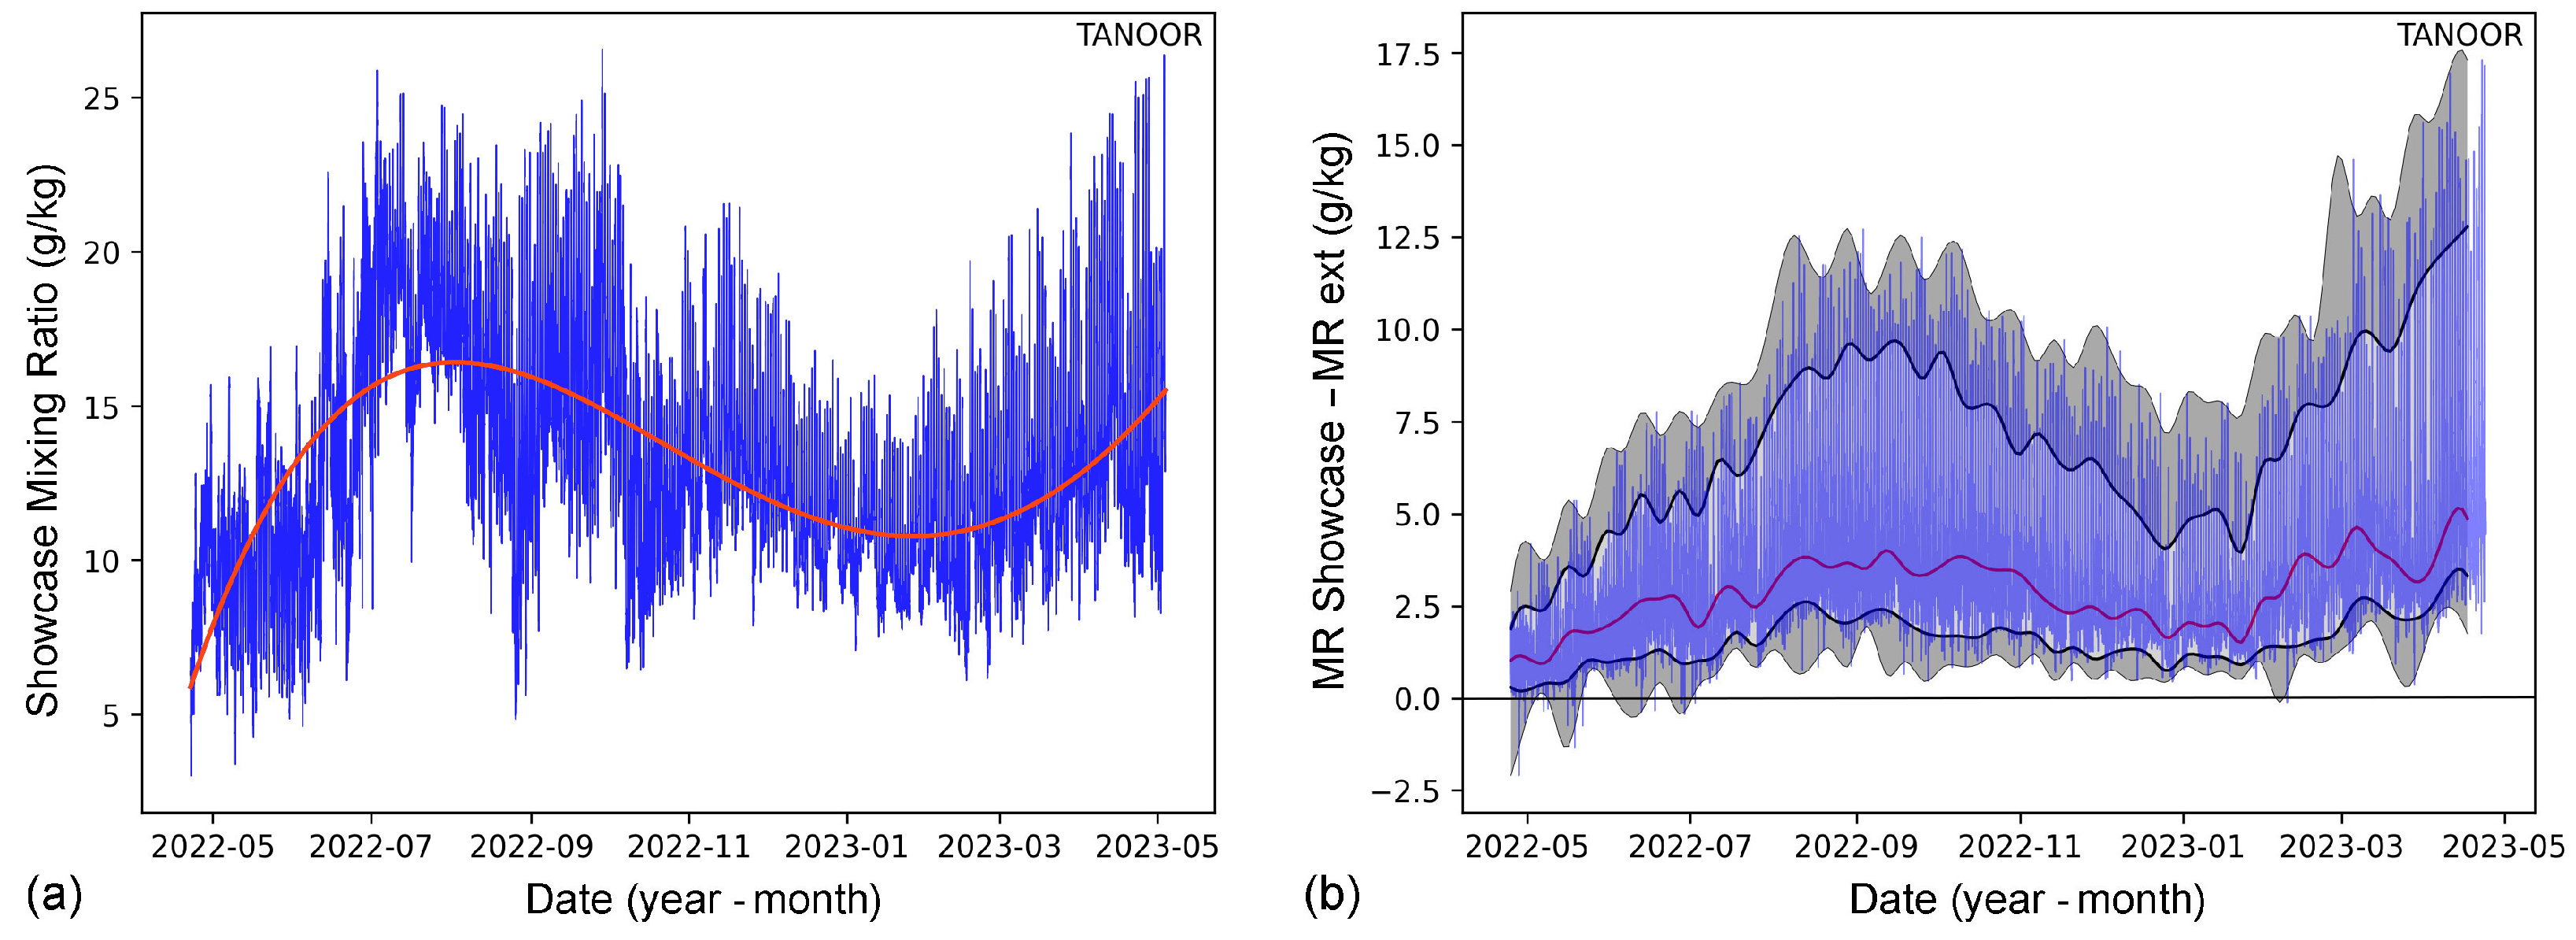
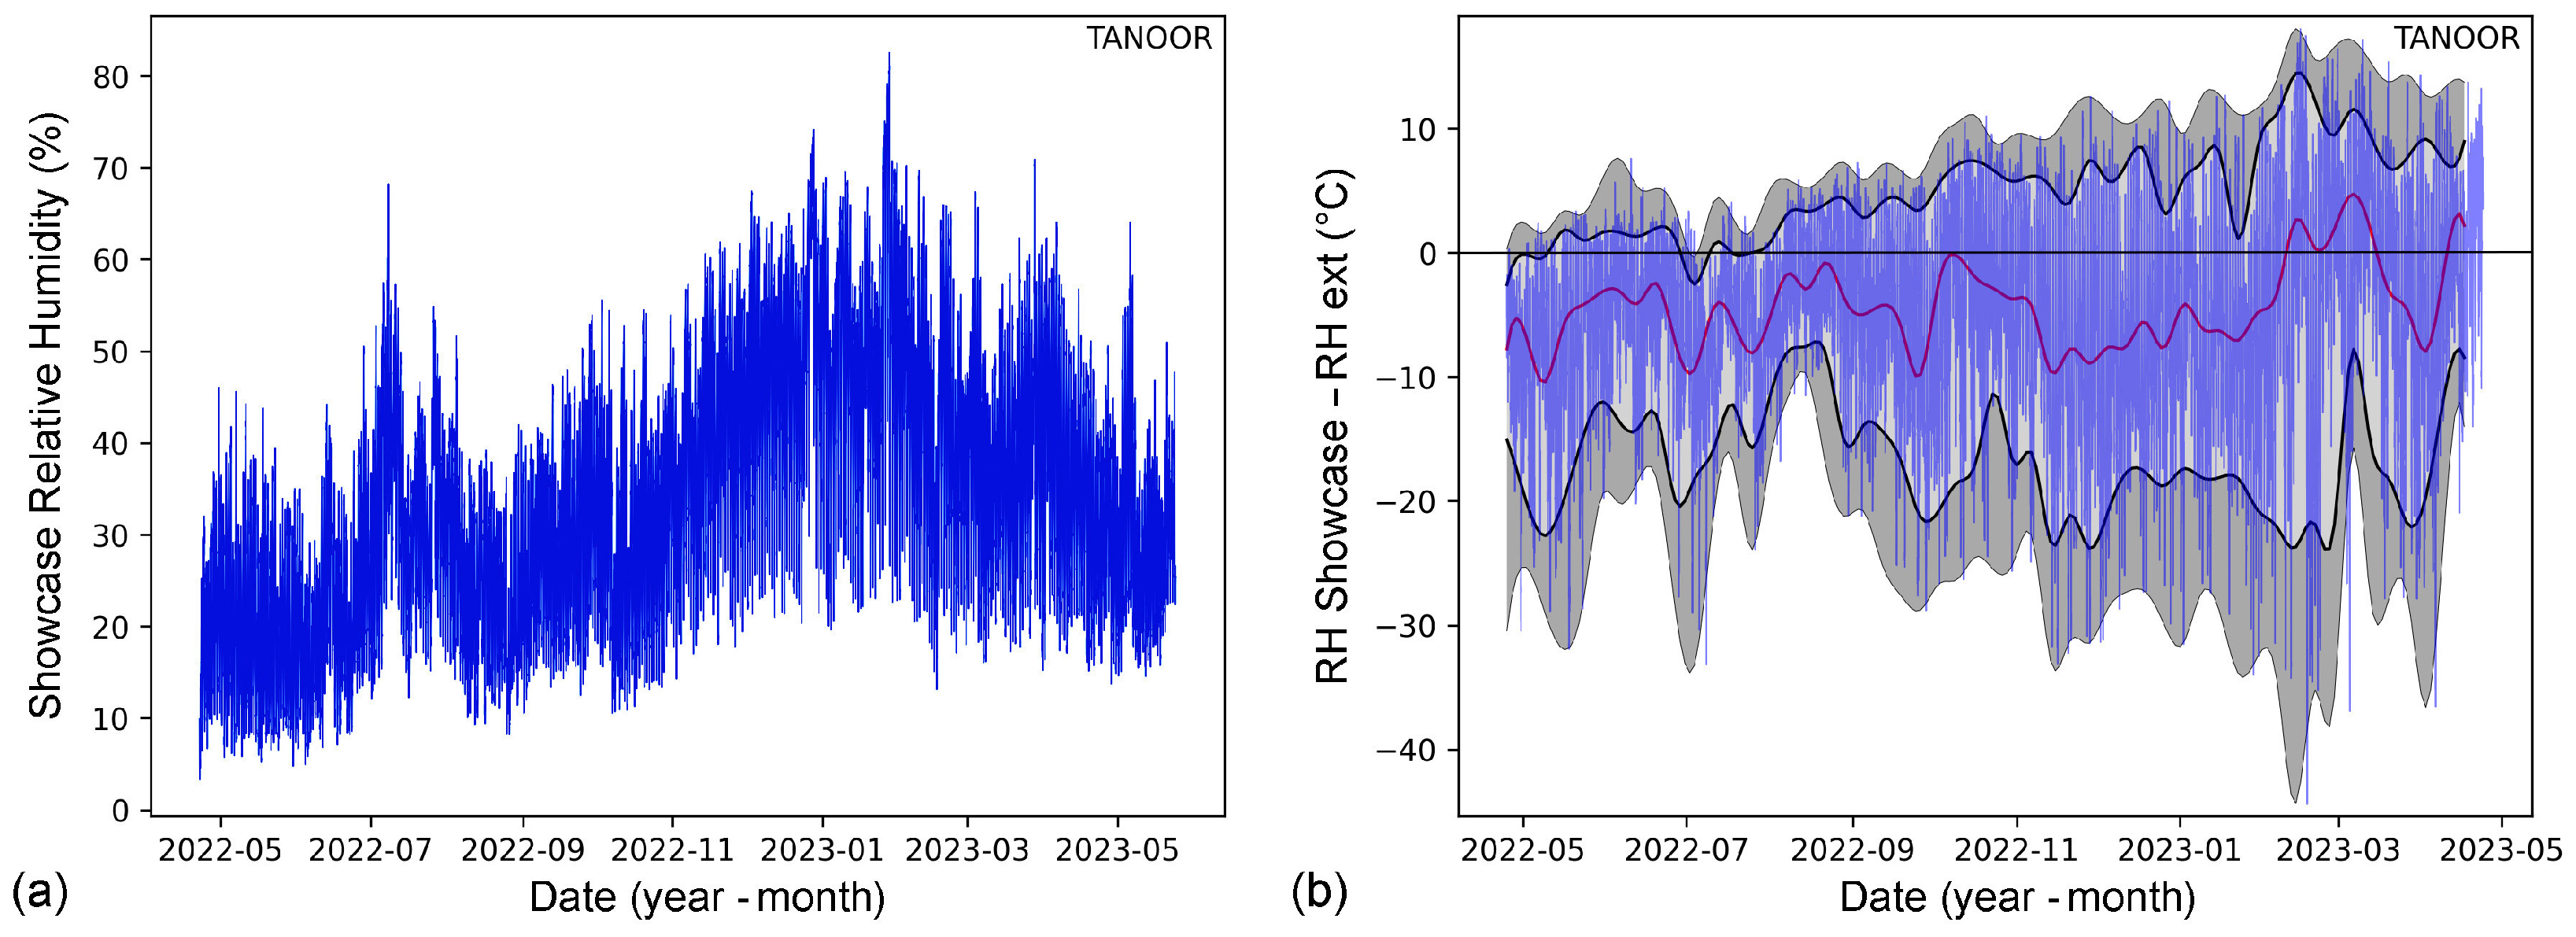
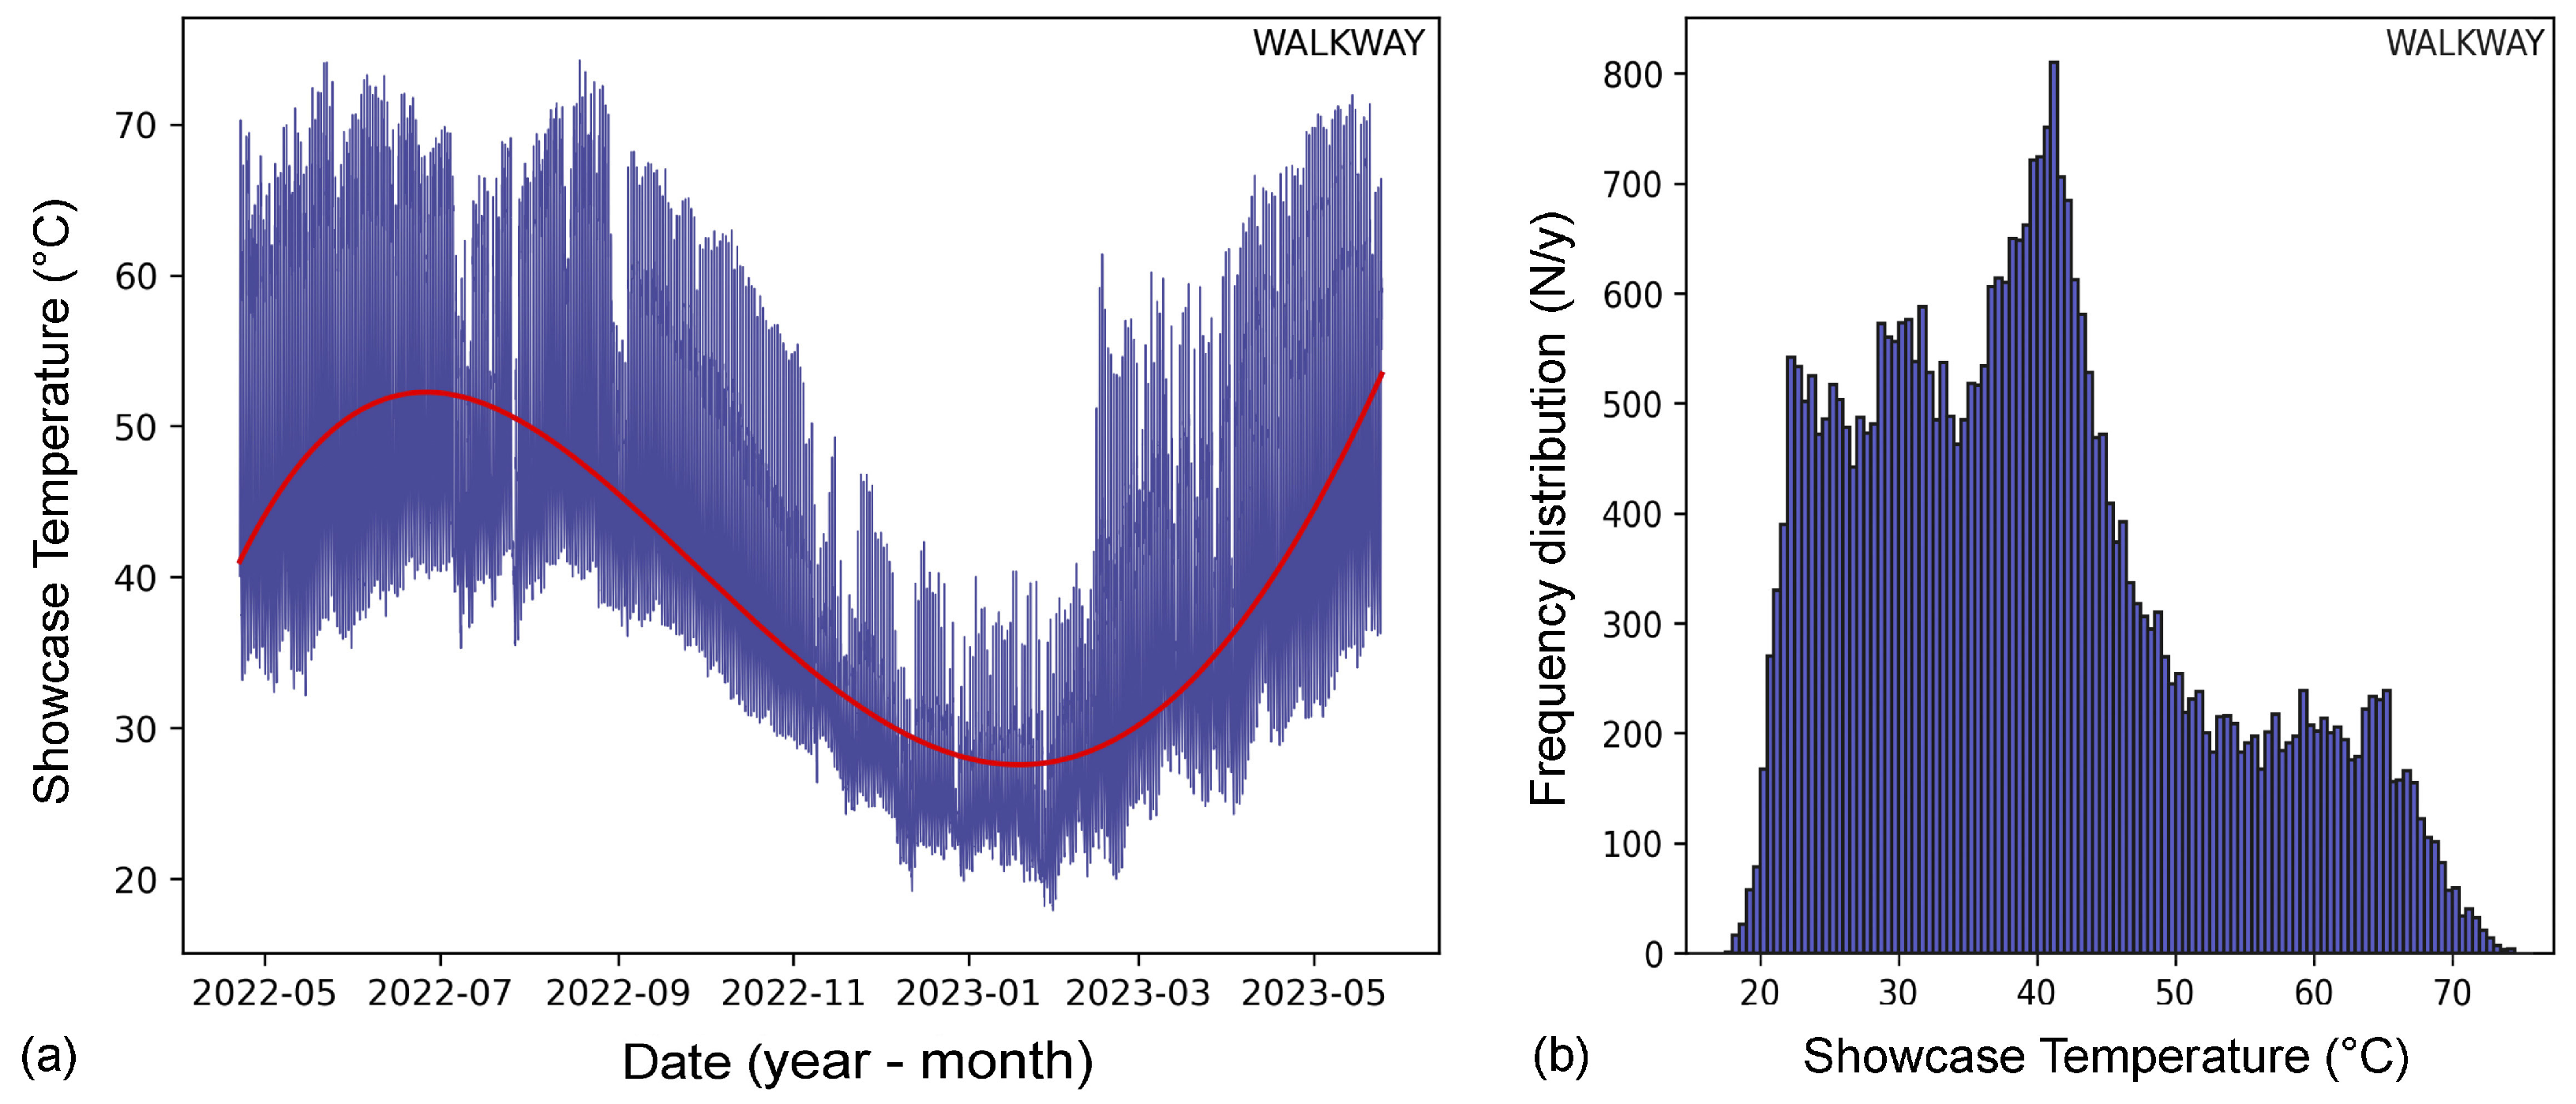
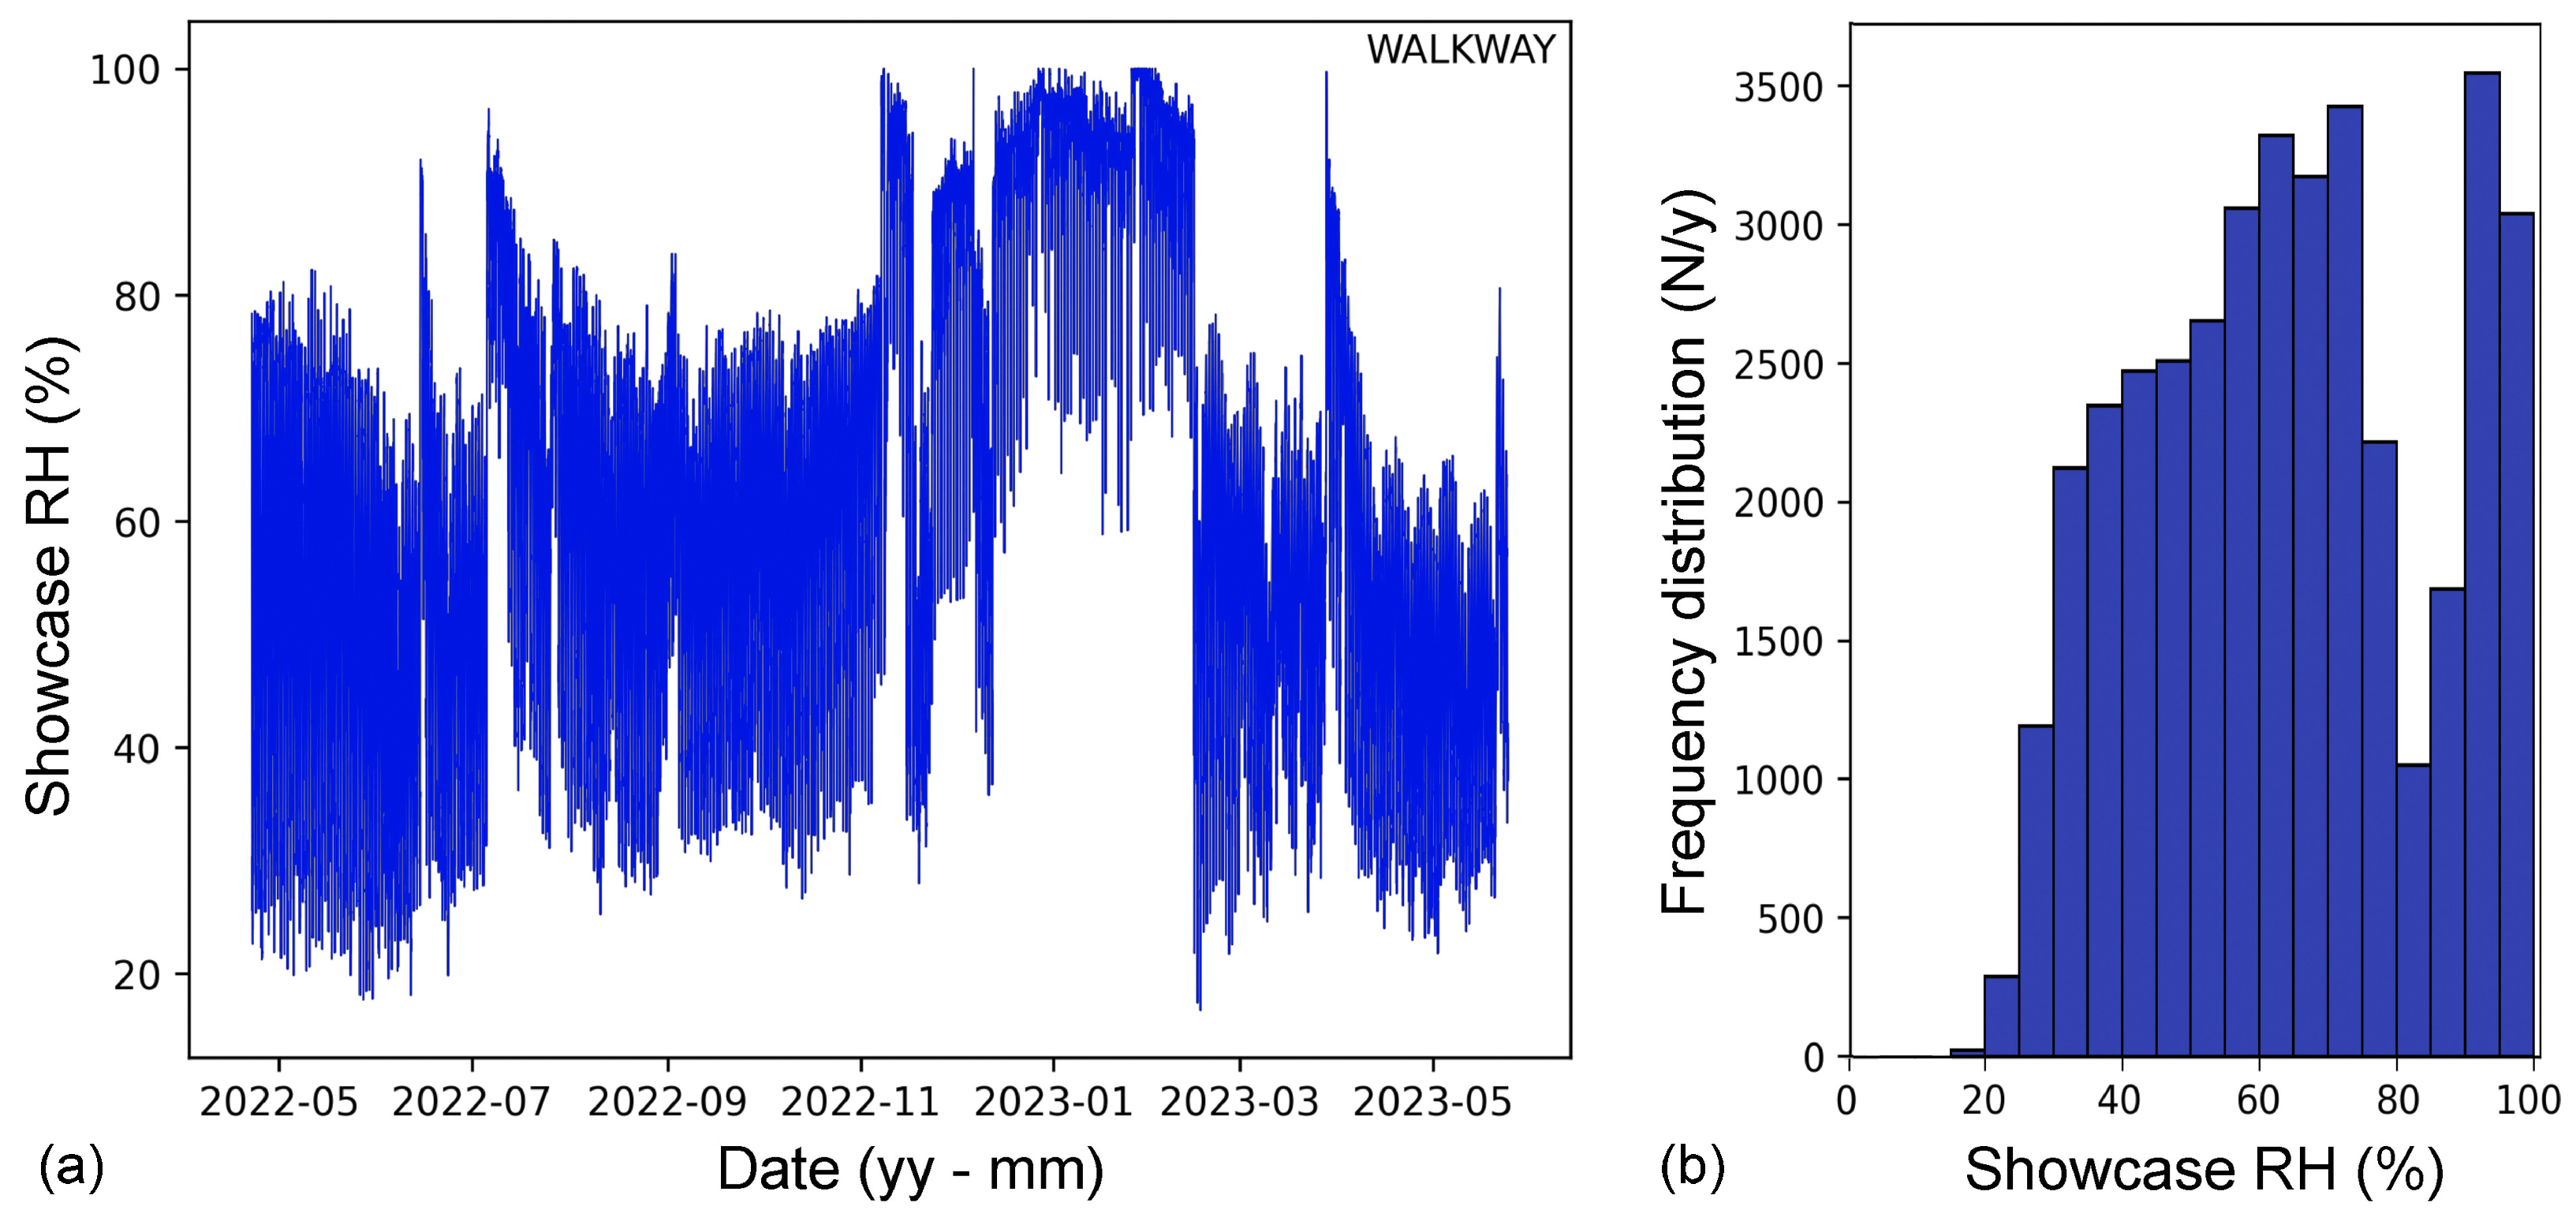
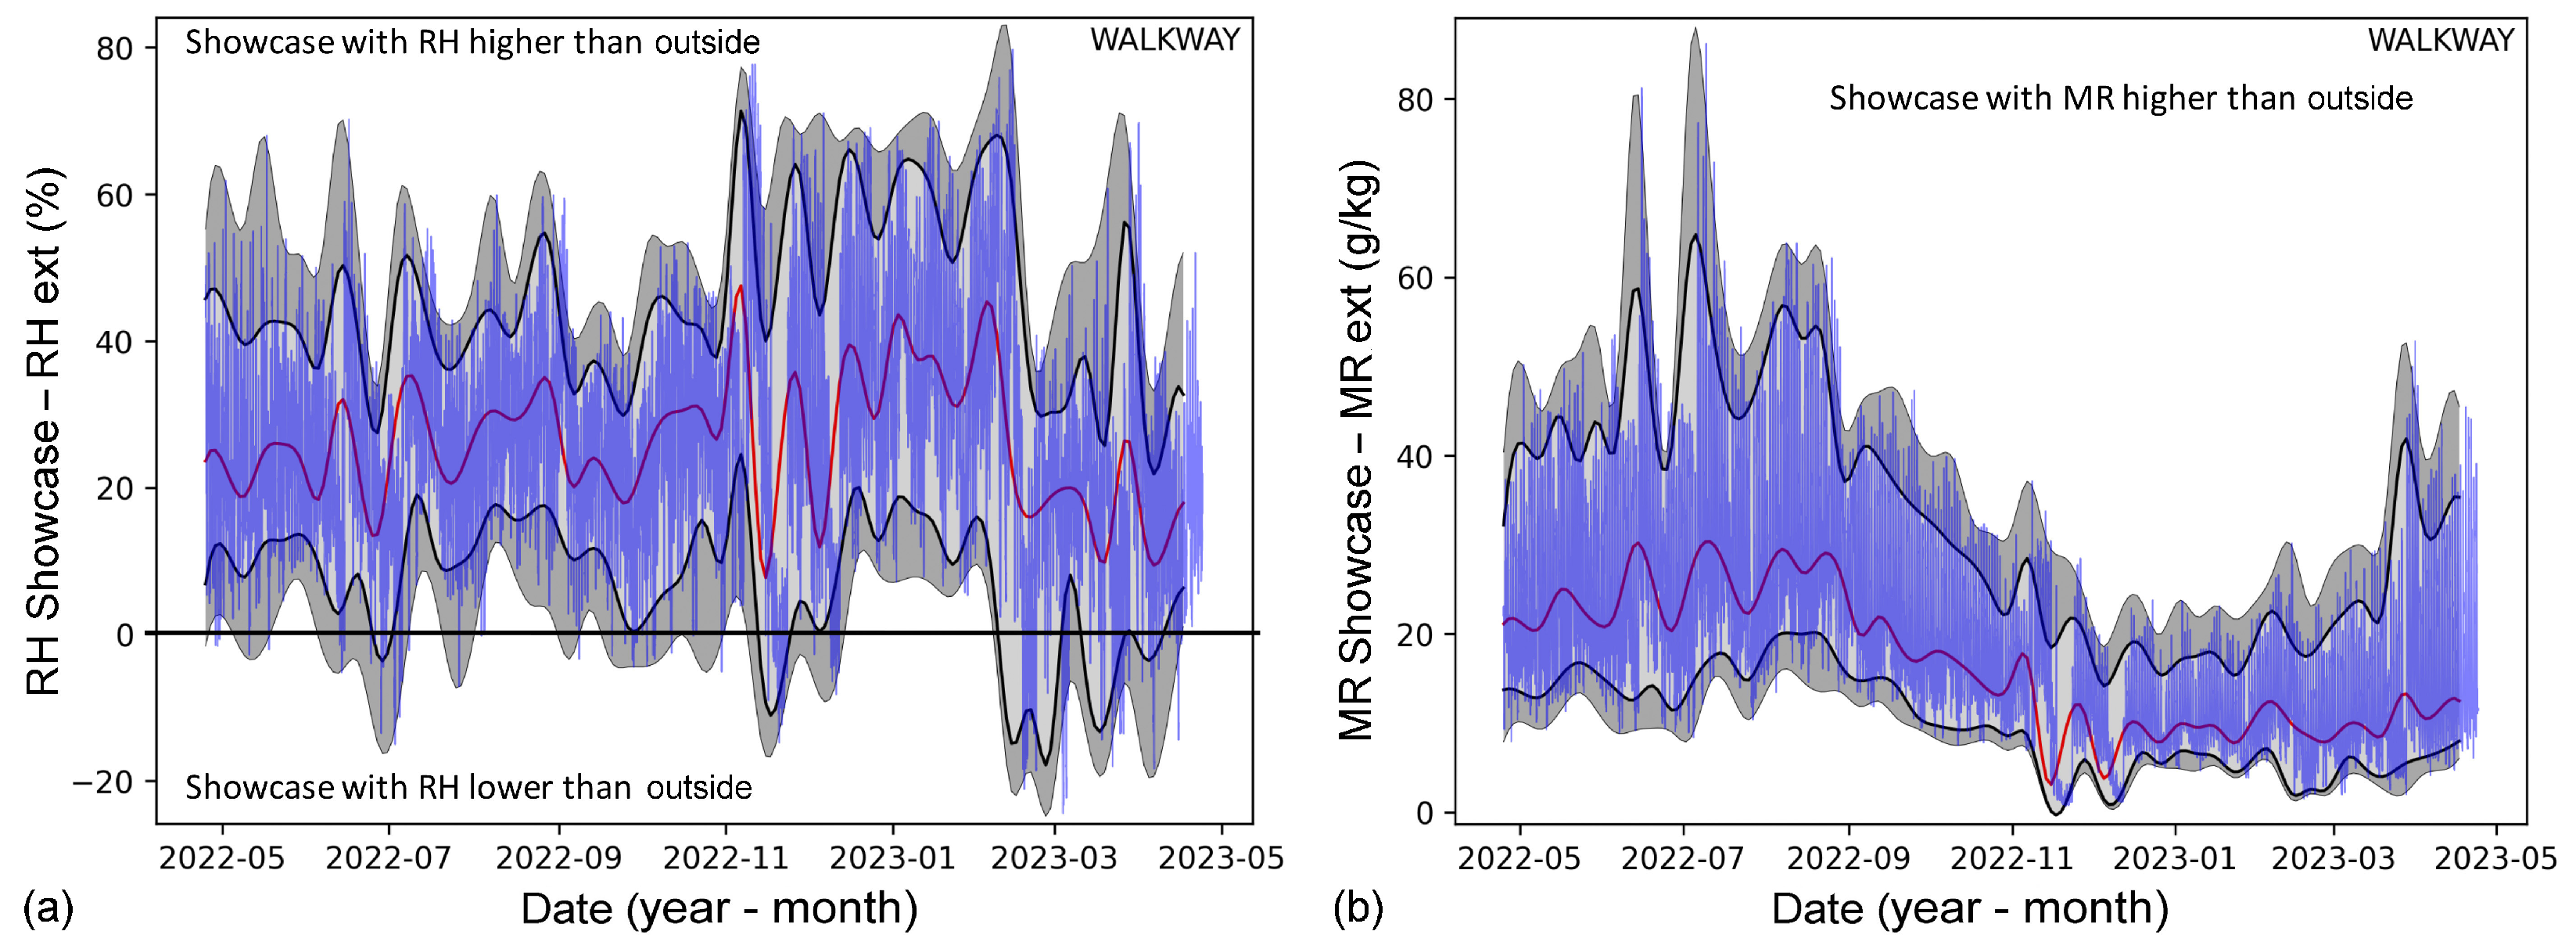
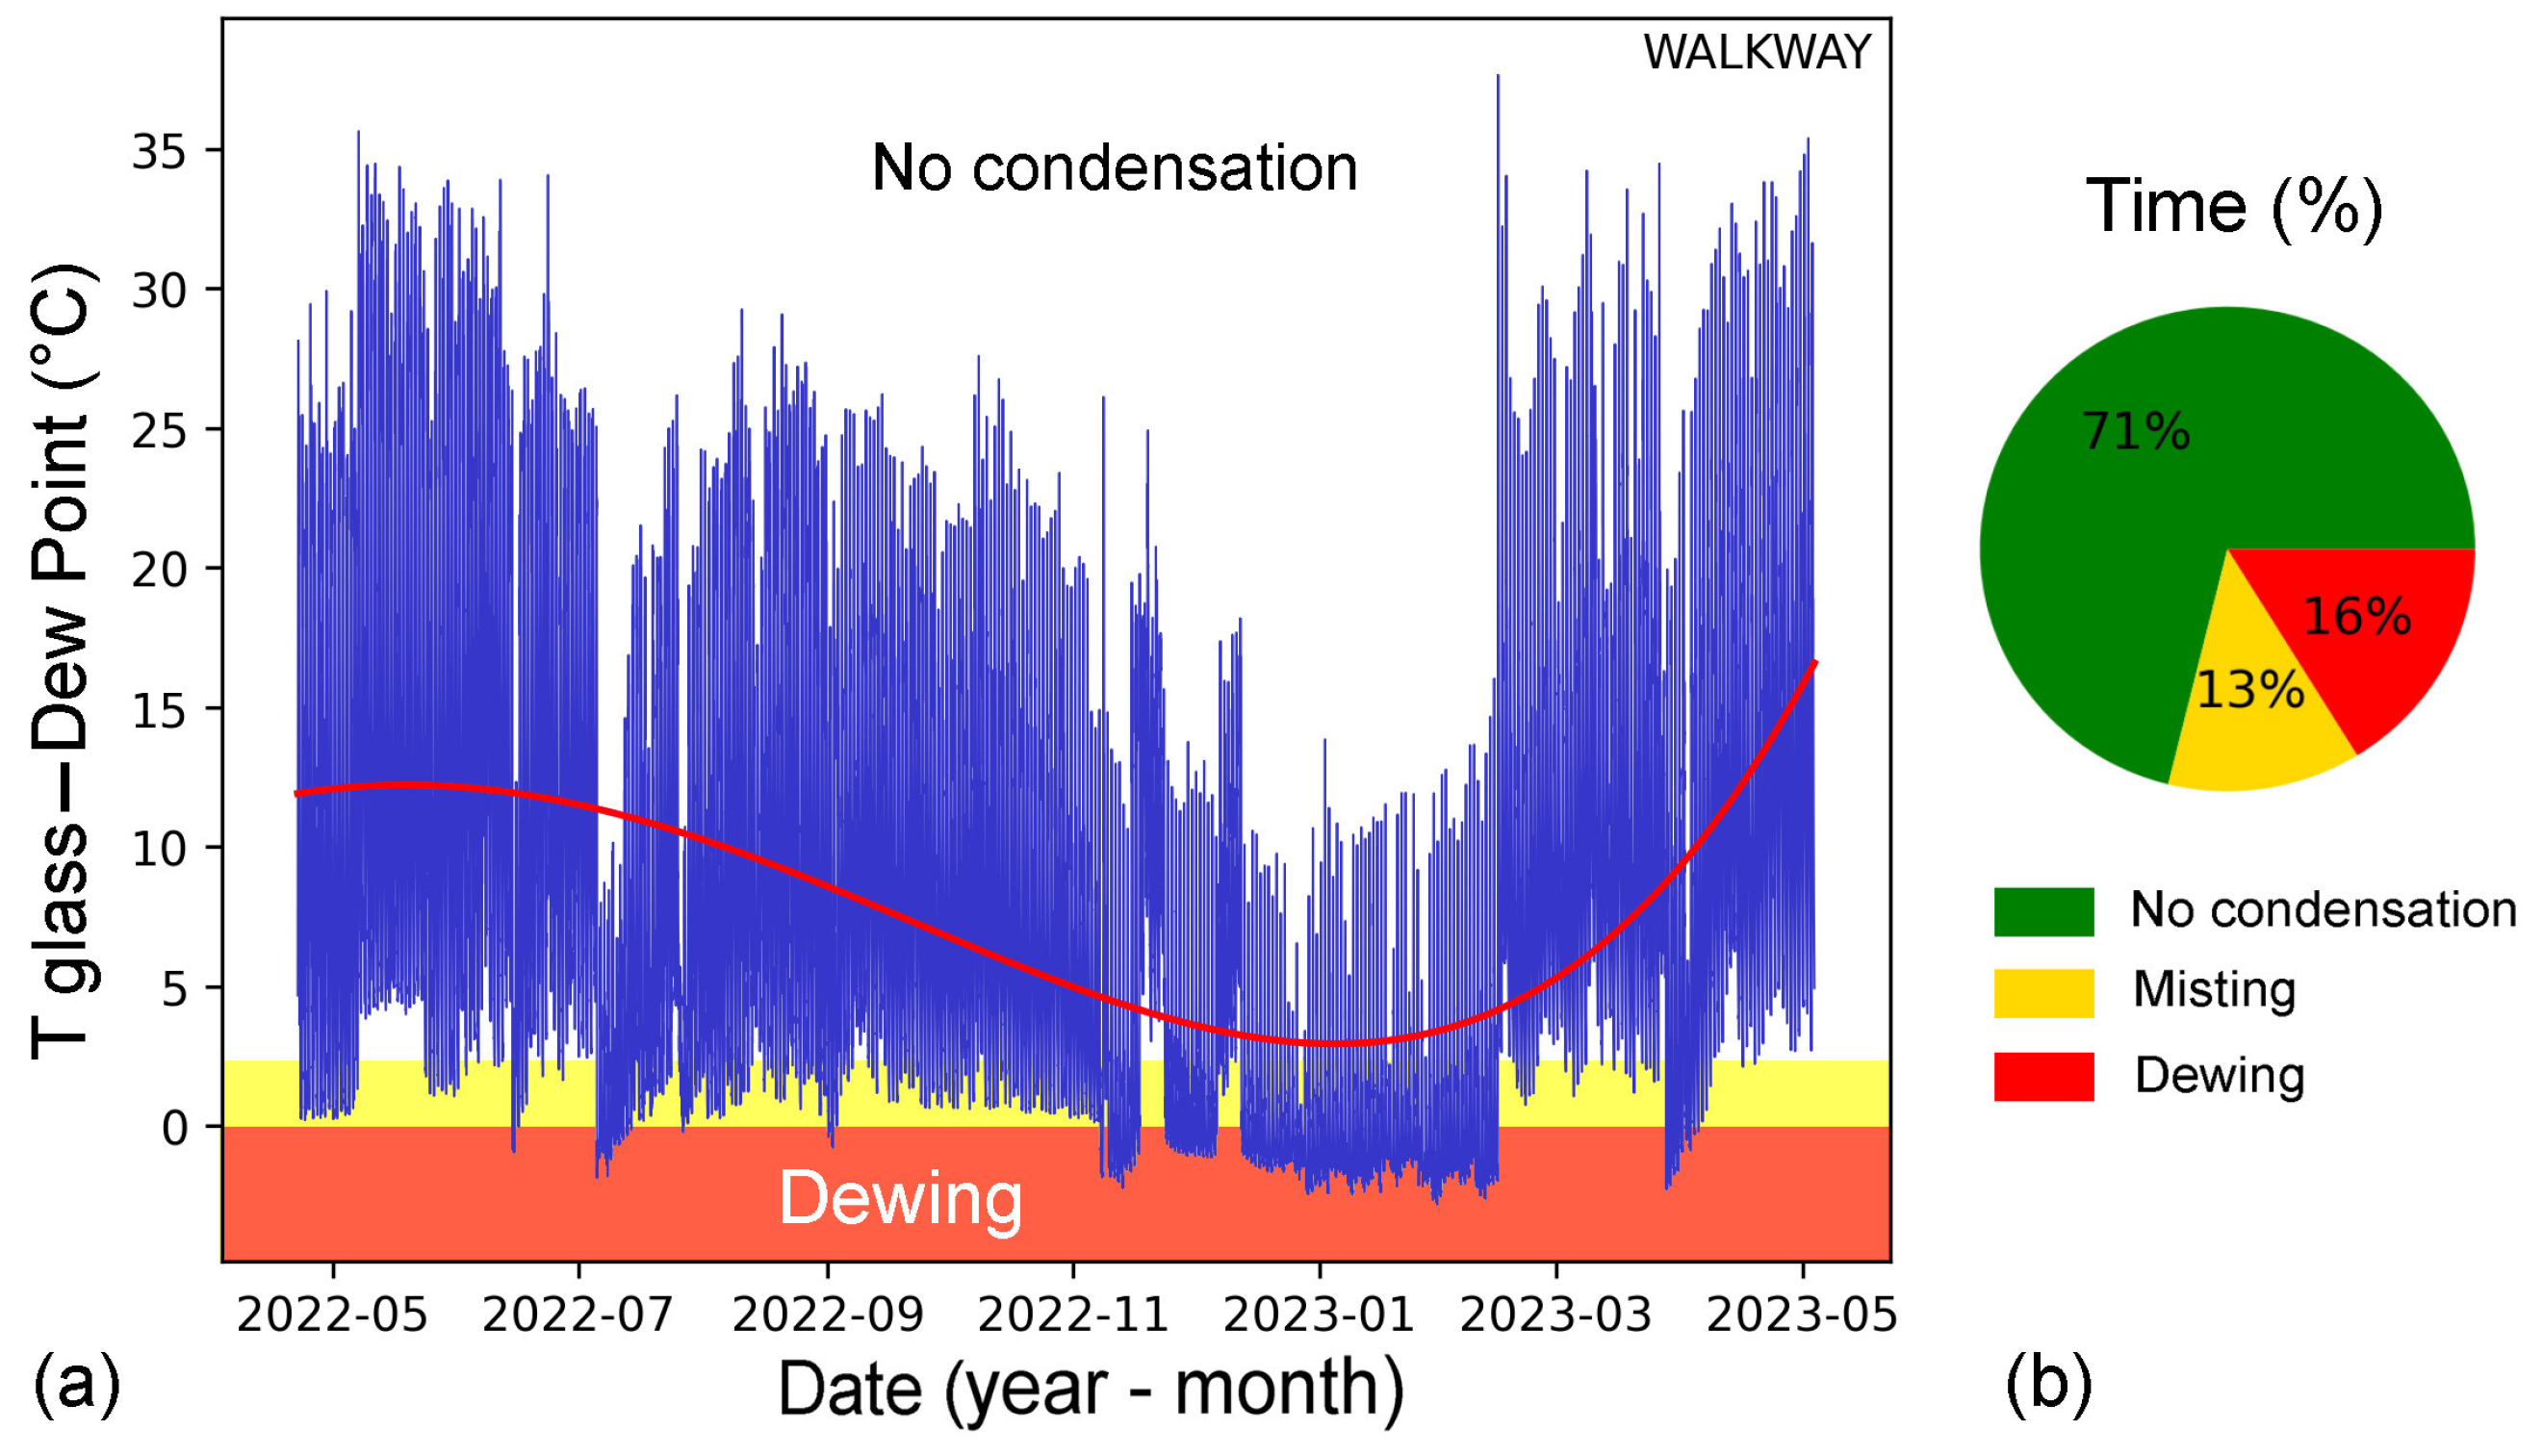
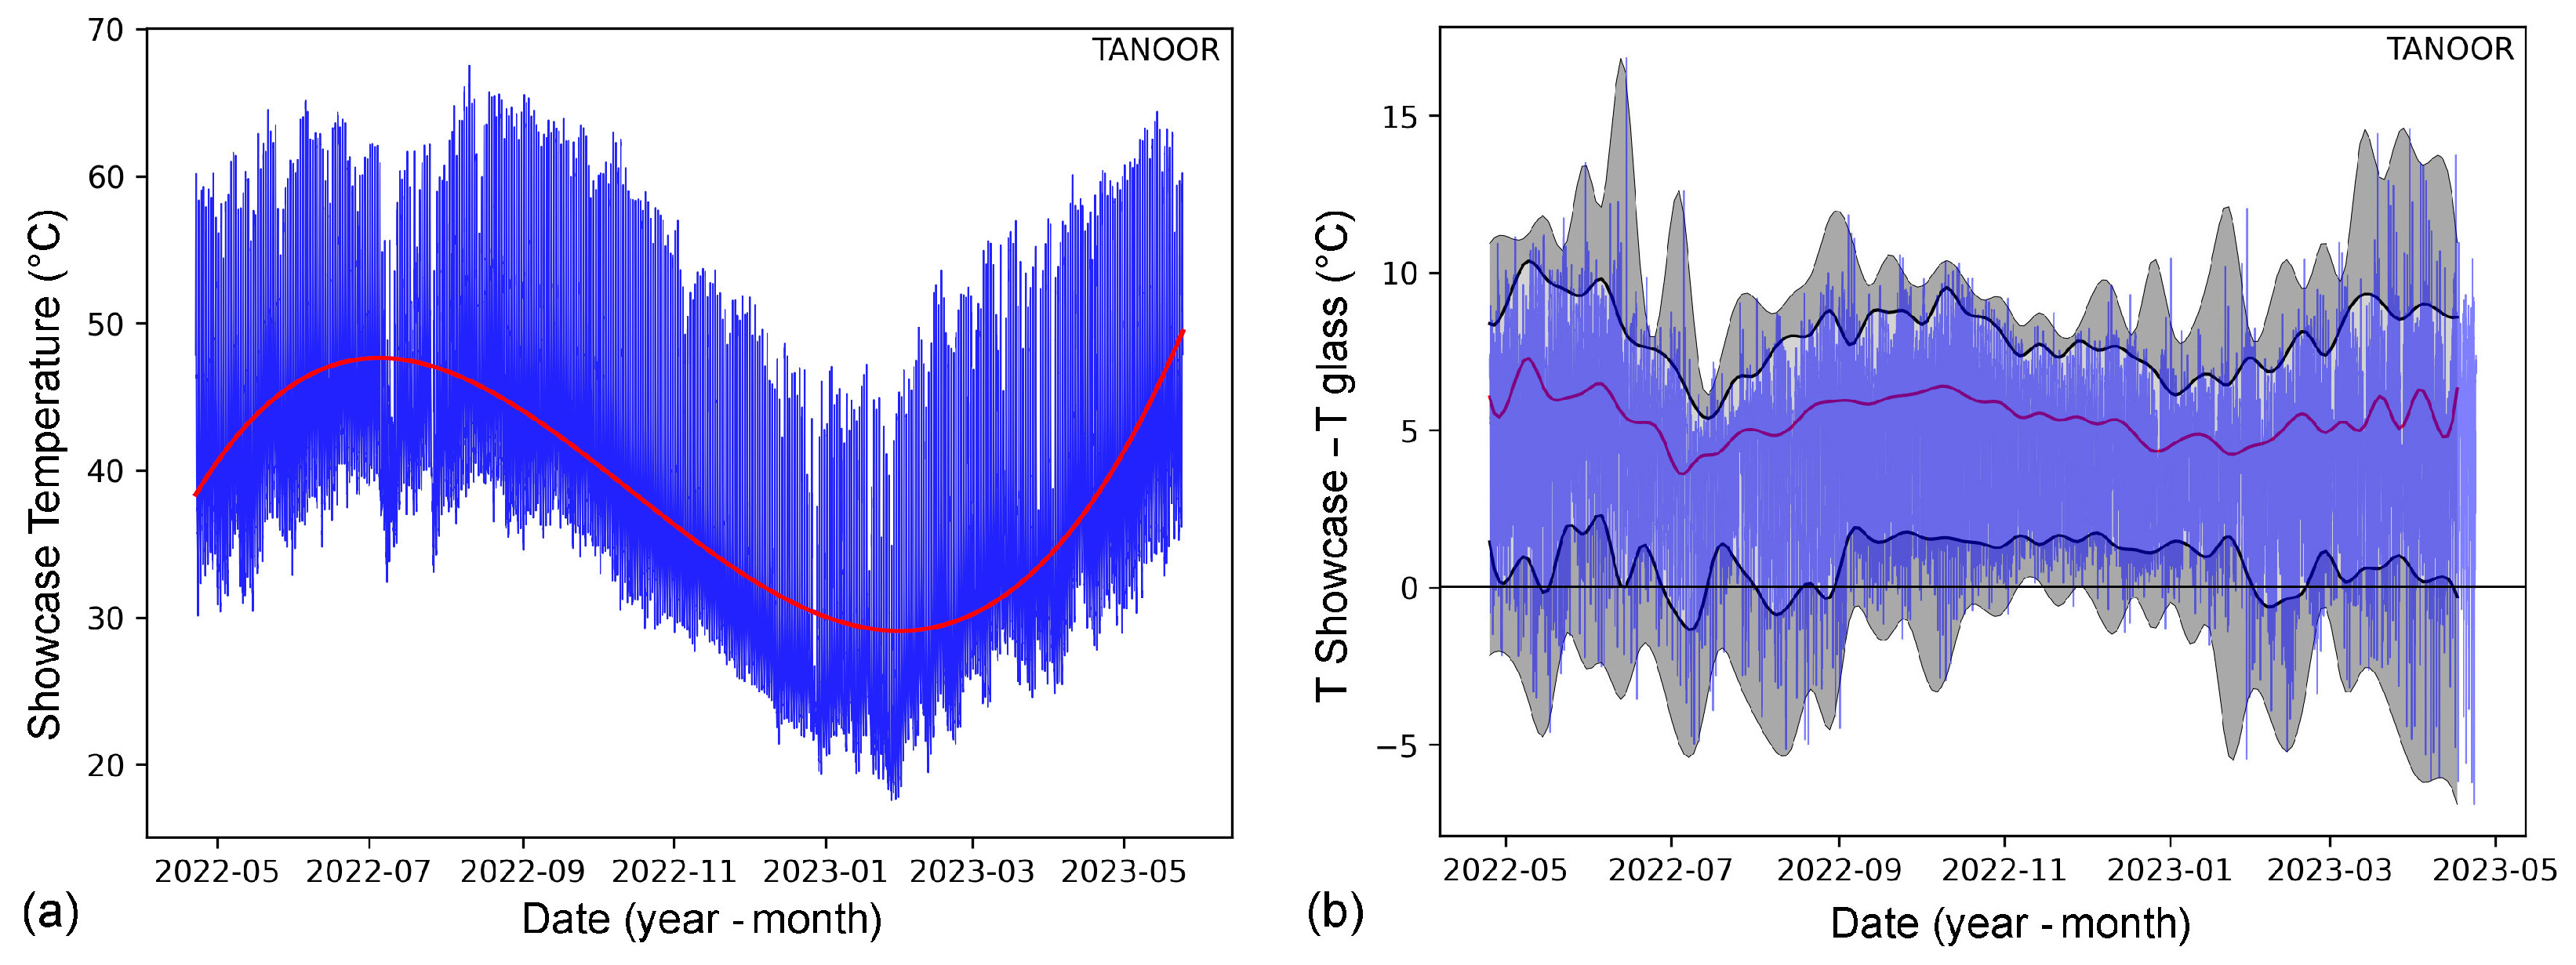
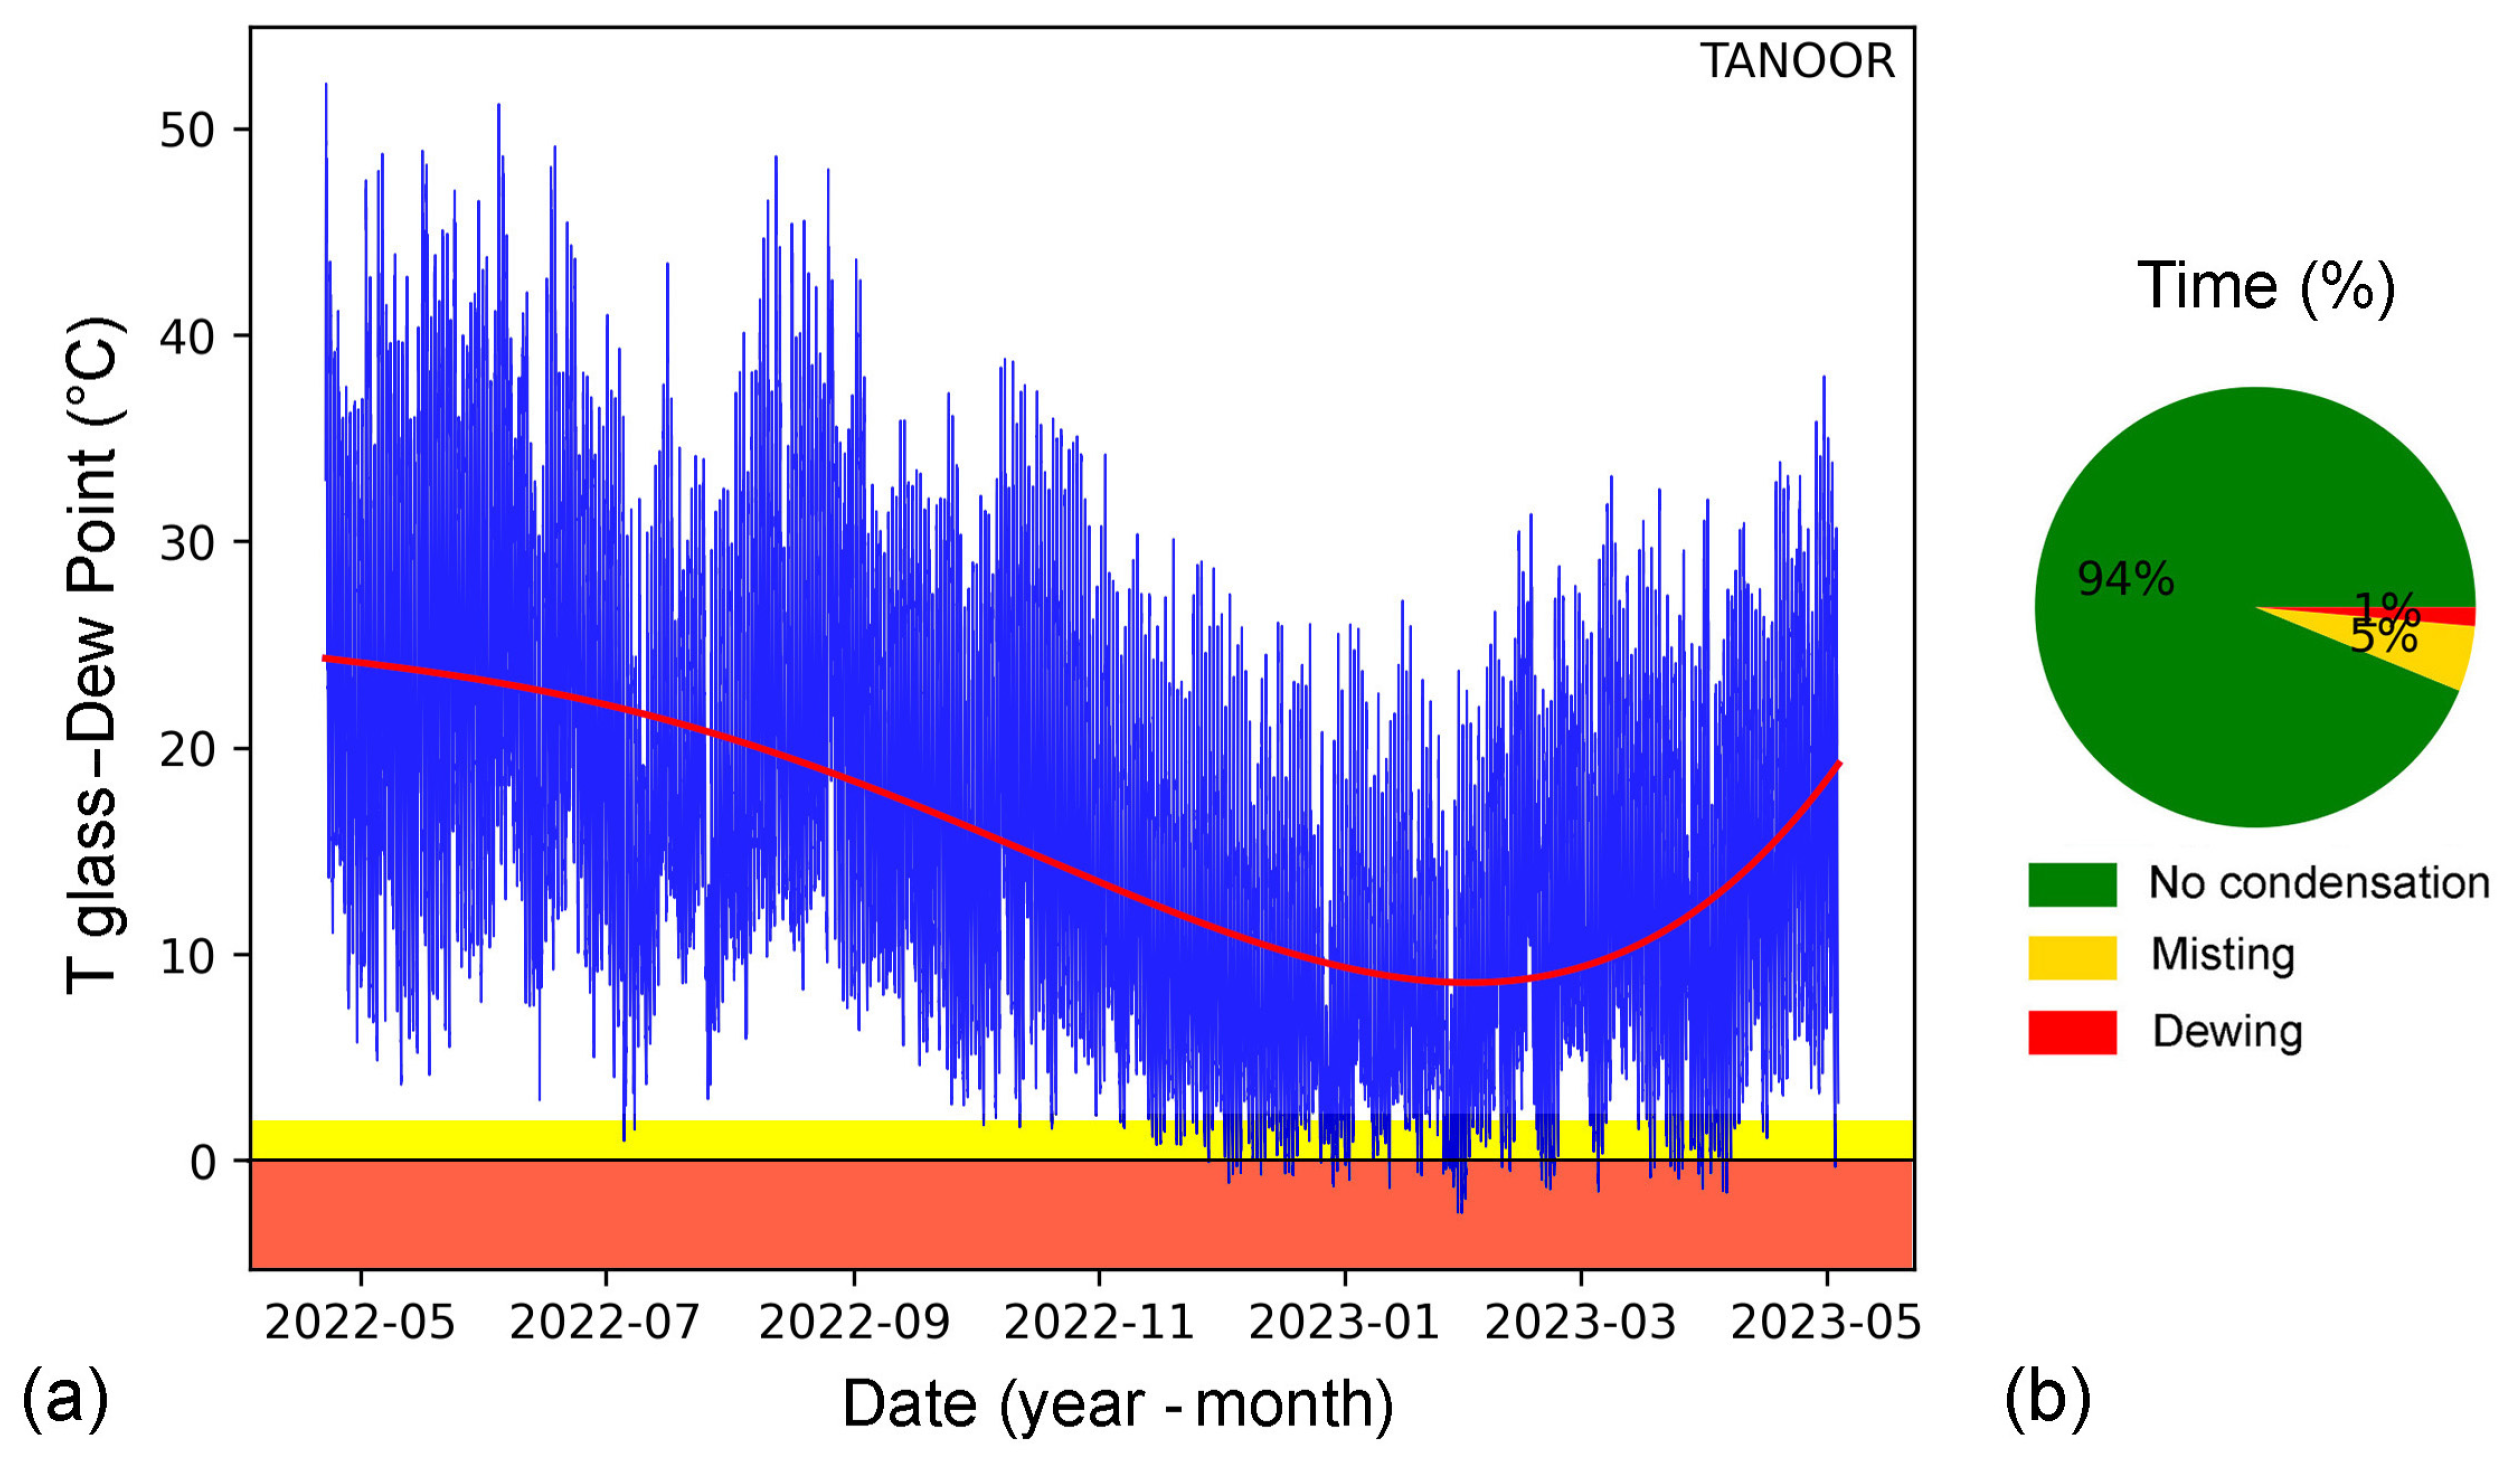
4.2.2. Annual Cycles

Walkway. The annual cycle of temperature in the walkway is represented in Figure 15a. The upper border of the band constitutes the daily maxima; the lower border constitutes of the daily minima; the thickness of the plot represents the amplitude of the daily cycles. The daily cycles are determined by the strong solar heating in association with the greenhouse effect, followed by the nocturnal cooling. From May to October, near to midday, the showcase is like an oven, with T W = 60–70 C , sometimes reaching 75 C .
The interpolation line (red line) represents the annual cycle of the daily averages and has a sinusoidal behaviour. The maximum of the annual cycle is reached in July, and the minimum in January. The frequency distribution of the showcase temperature during the monitoring period is indicated in the histogram (Figure 15b). The mode is close to T W = 40 C , while the range lies between 15 and 75 C .
The distribution of the difference Δ T W e x t between the showcase temperature and the external temperature ( Δ T W e x t = T W T e x t ) is represented in Figure 16a. In this plot, the central interpolation line represents the 50th percentile (i.e., the median) of Δ T W e x t ; the band around it (contoured by two black lines at the 7th and 93rd percentiles) includes the events from the 8th to 92nd percentile. The vertical lines crossing the grey area are the most extreme values. The choice of the above percentiles has been made according to the European Standard EN 15757 ([12,42]). The largest differences ( Δ T W e x t = T W T e x t ) are reached from April to October, and the smallest from November to March, when the Sun is low over the horizon, and the greenhouse effect is modest. Only exceptionally, in winter, the difference vanishes or changes sign.
The difference Δ T W g between the showcase temperature ( T W ) and the temperature ( T g ) of the glass pane ( Δ T W g = T W T g ) is represented in Figure 16b. In the morning, when the solar radiation impinges on the glass and activates the greenhouse effect, the glass becomes hot; T g > T W , and Δ T W g < 0 . When the showcase enters the shade, it starts to cool, and the showcase remains a little warmer than the glass, that exchanges heat with the (colder) air; therefore, Δ T W g > 0 .
Inside the showcase, the record of R H W (Figure 17a), being generated by the joint action of the temperature T W and the mixing ratio M R W , has an irregular character, although with some general features. Winter is characterized by high R H W levels, with saturation or near saturation in the night, and minimum values around 70% near noon. In summer, and the mid-seasons, R H W is highly variable during the day, lying from extreme dryness (i.e., R H W around 20%) to high humidity levels (e.g., R H W = 70–80%). The extreme dryness reached around midday is responsible for the enhanced evaporation, which in turn tends to raise the humidity levels. The histogram of the frequency distribution (Figure 17b) highlights this extreme variability.
The mixing ratio inside the showcase M R W (Figure 18a) is characterized by a sinusoidal annual cycle, with maximum values, and largest daily cycles, in summer. The minimum values, and the most reduced daily cycles, are in the cold season. This is explained because the glass is less heated, the greenhouse effect is modest (being limited to a few C ) and the maximum amount of M R W is limited by the saturation.
In the frequency diagram (Figure 18b), the M R W data (blue columns) are reported together with the external data M R e x t (green columns). Inside the showcase, M R W has a broad distribution, with maxima around 20–30 g/kg and a long tail exceeding 80 g/kg. Outside the showcase, M R e x t reaches the modal value around 10 g/kg, and the distribution ends at 20 g/kg. The impressive difference between internal and external values is due to the evaporation forced in the showcase when it is overheated, with the upper temperature around T W = 70 C (maximum allowable M R W at T W = 70 C : M R W = 190 g / kg at saturation), while the external temperature T e x t is in general below 40 C (maximum allowable M R e x t at T W = 40 C : M R W = 45 g / kg at saturation).
The plot of the difference Δ R H W e x t between the relative humidity inside the showcase R H W and the external values R H e x t (Figure 19a) shows that on average, the humidity level in the showcase is higher than in the external air. This situation does not have a well-defined seasonal trend, except that the maxima of Δ R H W e x t are reached in winter. Sometimes, and especially in spring, some negative values may occur. This variable (i.e., R H ) is affected by marked daily cycles (i.e., the thickness of the band), with differences between the internal and external level reaching 50%. The difference between the showcase and the external air is explained as follows. During the day, for the high temperature levels reached inside the showcase, the inside R H W drops and extracts moisture from the ground and the earthen remains by evaporation. During the nocturnal cooling, this excess of moisture reaches saturation and condenses, generating large R H W cycles.
The plot of the difference Δ M R W e x t between the mixing ratio inside the showcase M R W and the external values M R e x t shows that on average, M R W is permanently higher in the showcase than in the open air (Figure 19b). This difference is explained by the forced evaporation inside the showcase during the daily overheating. The difference is smaller in winter, because the Sun reaches lower elevations, which in turn causes less overheating and less internal evaporation.
The difference between the temperature of the glass ( T g W ) and the dew point ( D P W ) inside the showcase (Figure 20a) determines the conditions for condensation. Over the year, the pie plot in Figure 20b shows that for most of the time, the temperature of the glass is above the critical point for condensation. However, conditions for nocturnal misting, or even dewing, occur frequently, and especially in winter.
Tanoor. The first comparison is with temperature in the most extreme situation of the summer solstice (Figure 21). From sunrise to 10 h, the temperature in the tanoor rises more quickly than in the walkway because the tanoor has a slightly tilted glass pane, as well as some external walls that absorb additional solar radiation, as already commented. After 10 h, natural ventilation brings in cooler air from outside and lets out warmer air from inside. Near noon, the temperature in the tanoor is lower than in the walkway, but is much higher than in the open air, i.e., T W > T T T e x t . Afterward, the walkway—and later, the Tanoor—enter the shade of the pergola. After a while, the walkway is again hit by the Sun, which has moved in the meantime, while the tanoor is not, and this causes two distinct behaviours of the related temperatures and cooling phases.
The exchanges of air between the showcase and the external environment are beneficial to lower the inside temperature T T . However, this does not affect the actual cause of the overheating, i.e., the greenhouse effect that is generated when the glass pane is hit by solar radiation. Inside the showcase, the temperature T T is in average about 5 C higher than T g , and this situation remains almost unchanged throughout the year (Figure 22a). The glass pane, having the lower side in contact with the warmer showcase interior, and the upper side in contact with the open air, reaches an equilibrium temperature intermediate between them, i.e., T T < T g < T e x t (Figure 22b). Short periods with negative differences (i.e., T g > T T ) occur in the early morning, when the solar radiation starts the heating cycle.
An overview of the most extreme situation for the mixing ratio in the two showcases and in the external air at the summer solstice (Figure 23) clearly shows the importance of some ventilation. The M R inside the tanoor is slightly higher than in the open air, but does not reach the extreme values of the walkway.
Over the year, the mixing ratio changes seasonally, with maximum in summer and minimum in winter (Figure 24a), and the same can be said for the difference between the internal and external values (Figure 24b).
In the tanoor, the M R values are always much lower than those observed in the walkway, confirming that even a modest natural ventilation avoids the accumulation of large amounts of water vapour inside the showcase. However, this does not mean that the evaporation from the archaeological remains is reduced, because a slightly lower temperature, associated with a much lower M R , implies a lower R H , as shown in the next figure (Figure 25a). In the walkway, the R H is always higher than in the open air, while in the tanoor, it is lower for most of the time. (Figure 25b).
For the tanoor, the risk that the glass temperature falls below the dew point, with the consequence of glass misting or dewing, is rare (Figure 26a) and for short (nocturnal) periods, being 5% of the total time for misting and 1% for dewing (Figure 26b). This natural ventilation may be a satisfactory remedy against misting, but is not sufficient to counteract the glass overheating, the related greenhouse and the forced evaporation.

5. Mitigation Remedies

The problem of dewing is not only limited to aesthetics, i.e., reduced vision of the exhibits and their enjoyment, but is also risky for the protection and conservation of the remains. Large water drops form and grow on the lower side of the glass panes, and then fall on the earthen remains. The repetition of daily evaporation–condensation cycles is dangerous for conservation, i.e., forced evaporation, dryness, accumulation of soluble salts, and salt crystallization on the surface and subsurface layers.
It should be noted that high humidity levels constitute a habitat potentially favourable for the development of moulds, algae, and other pests [11,43,44]. Although dampness is a necessary requisite, the daily temperature cycles reach high levels and determine a crude pasteurization process [45]. Further study is required to assess the possible types and species of tropical moulds that could survive in such extreme conditions.

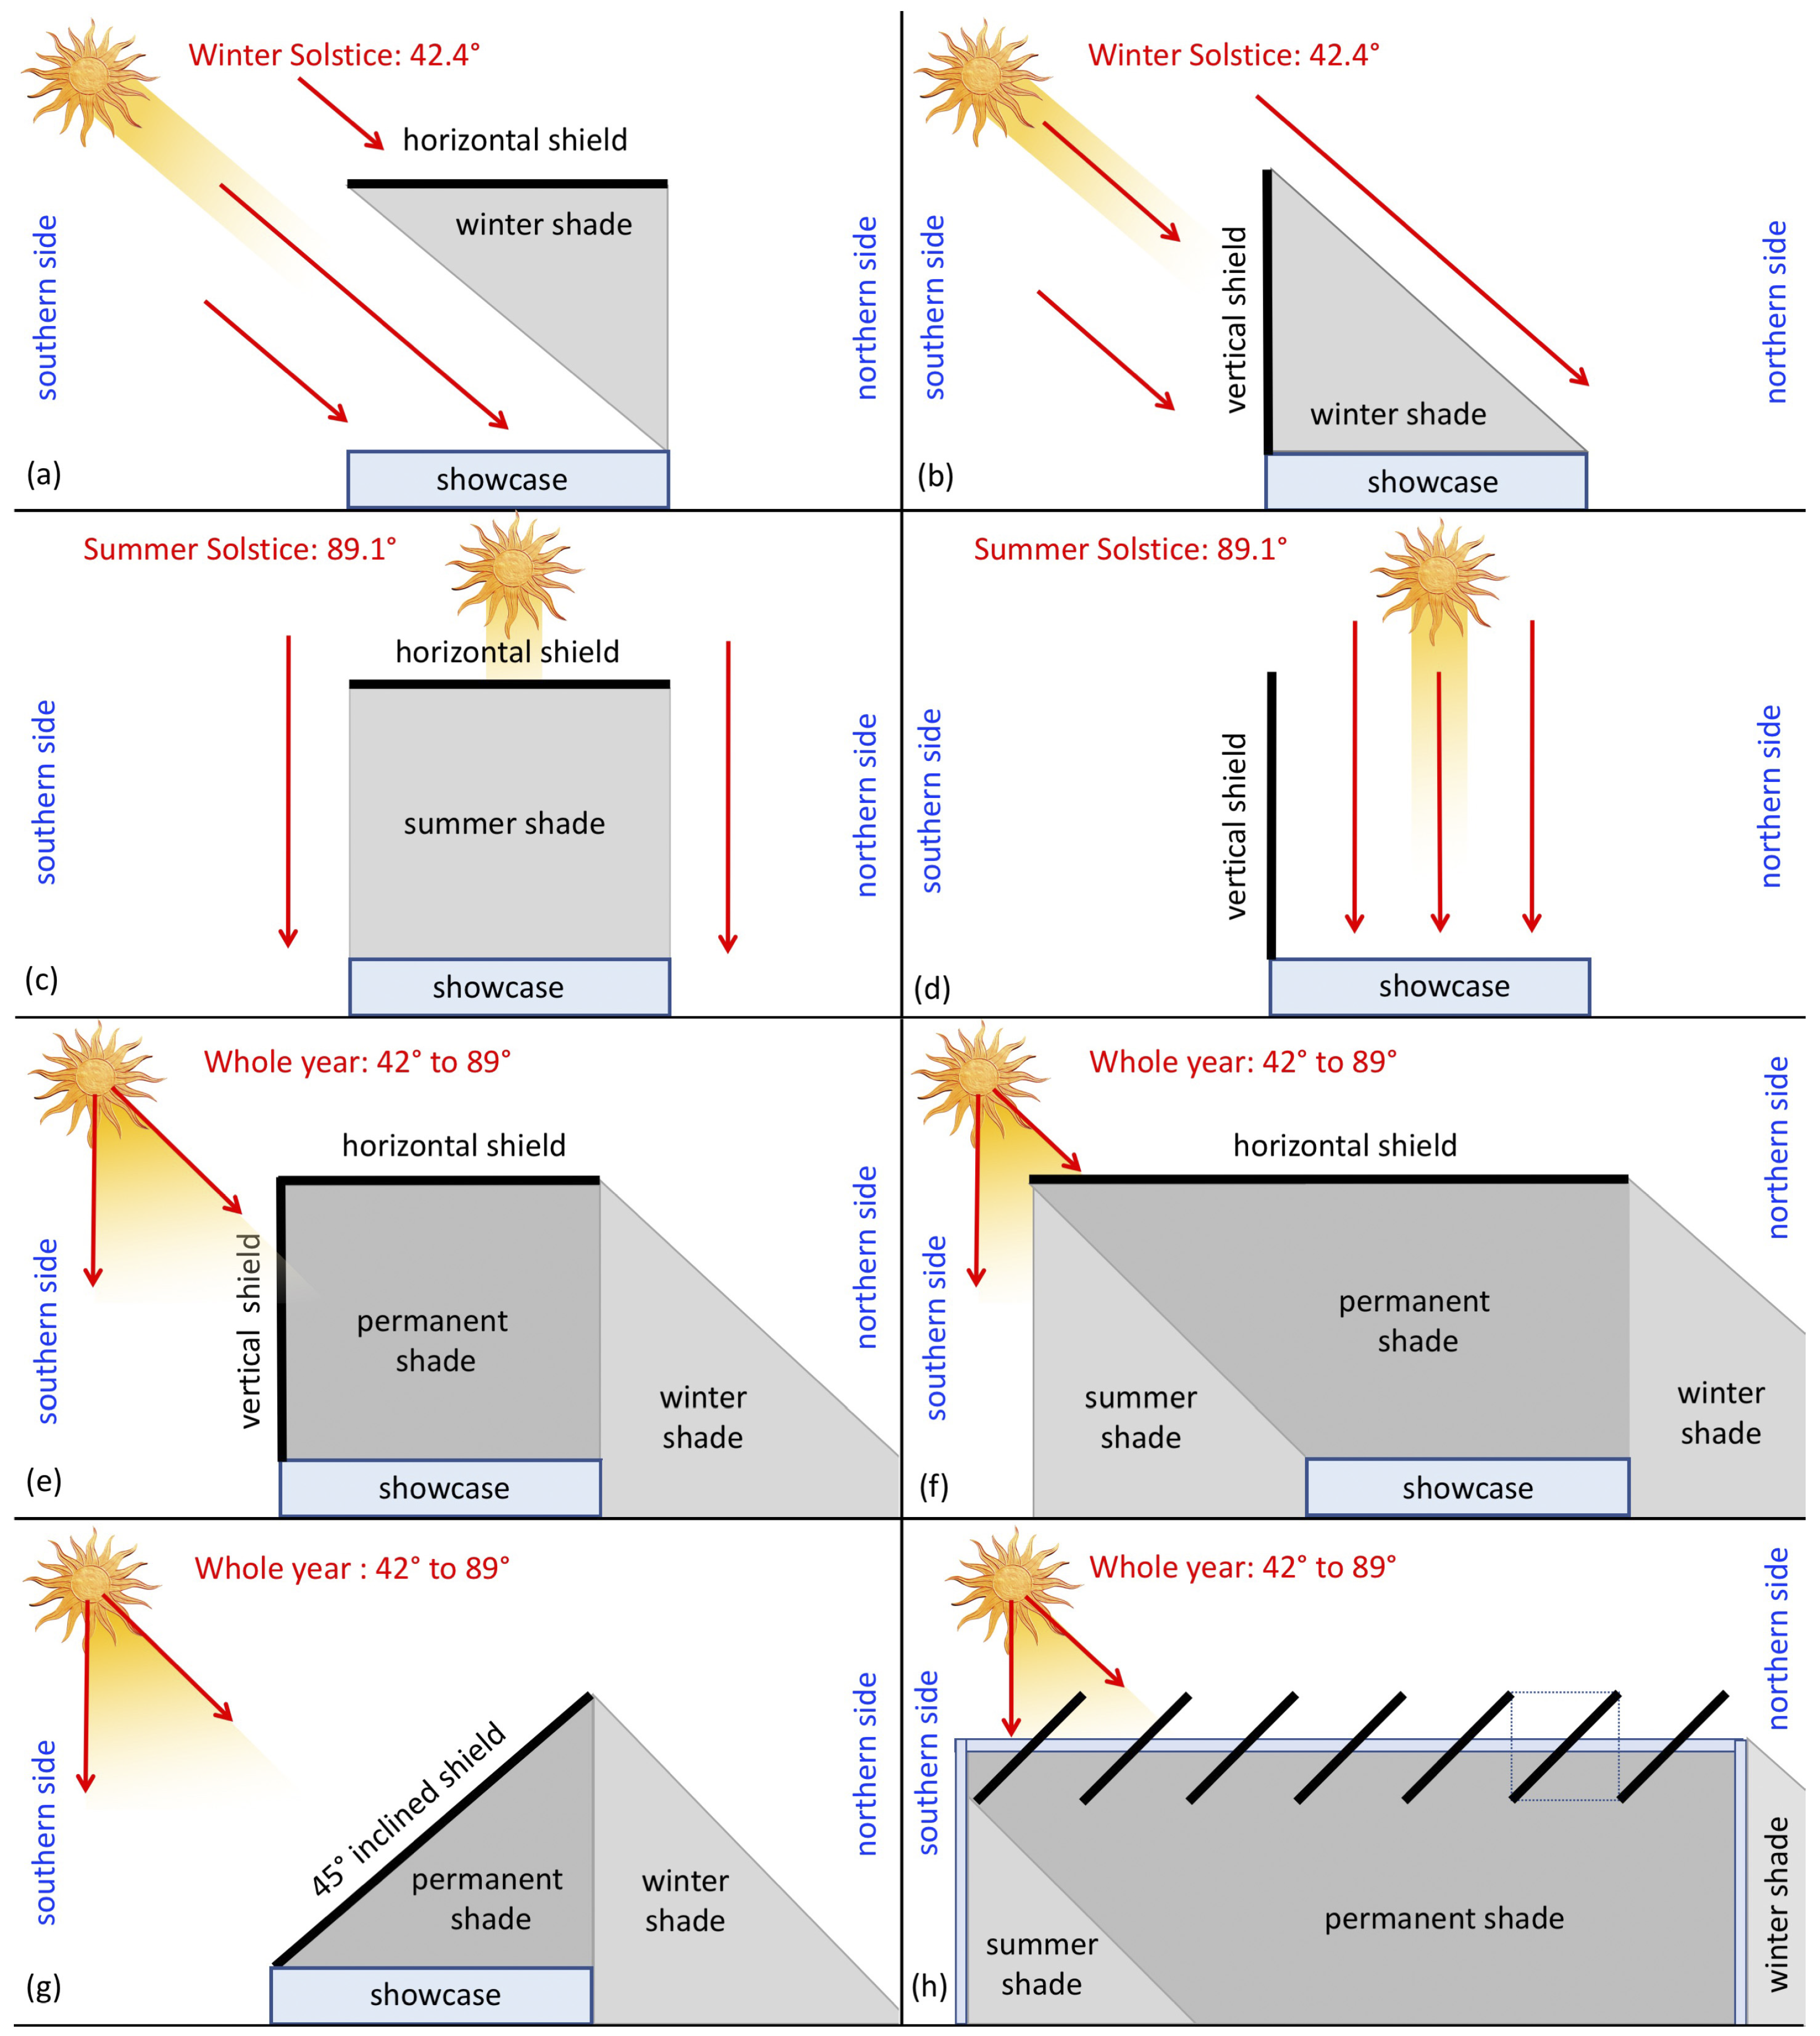
5.1. Theoretically Possible Solutions

Some mitigation remedies are possible, based on the optimization and control of the glass temperature and ventilation, which should be well balanced between them. It may be possible to apply a single remedy, but is better to apply a combination of them. The result will depend both on the choice and on how carefully the methods will be applied.
It is fundamental to control the temperature of the glass panes. Two issues should be considered, i.e., the greenhouse effect by day, and the condensation by night.
During the day, the impact of the solar radiation and the showcase overheating should be reduced. This goal may be reached in various ways, e.g., applying glass panes partially reflecting the solar radiation; shading the glass panes with fixed shields, curtains or mobile carpets; cooling the hot glass panes with sprinkling water at selected time intervals, or scheduling a flow of fresh water flowing on the glass surface. However, it must be considered that cold water can cause glass tensions and breakage. Daytime interventions are preferable because they are finalized to reduce the cause.
During the night, the condensation of the excess moisture may be avoided in two ways: (i) by reducing the excess of moisture with some ventilation, (ii) by increasing the glass pane temperature when it approaches the dew point. The latter can be reached using electrically heated glass panes, and triggering self-heating when the glass is approaching the dew point [46]. During the monitoring period, mist and drops were avoided if the glass temperature was raised of some 10 C . This option is less preferable because it reduces the effect, not the cause.
Ventilation is a key issue. The tanoor showcase, equipped with natural ventilation slits, is in a less critical situation than the walkway. Better ventilation introduces fresh air and removes excess moisture, thus reducing the formation of condensation and dew. It should be paid attention, however, that if only ventilation is adopted, the daily evaporation will transport and accumulate soluble salts on the surface of the archaeological remains, with dangerous consequences for conservation. This remedy would avoid the aesthetic problem of not seeing the exhibits during periods of condensation, but must be applied carefully.
The conservation plan should balance, and combine, some ventilation with reduced overheating of the glass during the day. During the night, electrical glass heating might be used, if necessary, to stop condensation. These interventions will be highly beneficial not only for the vision of the remains, but especially for their conservation.

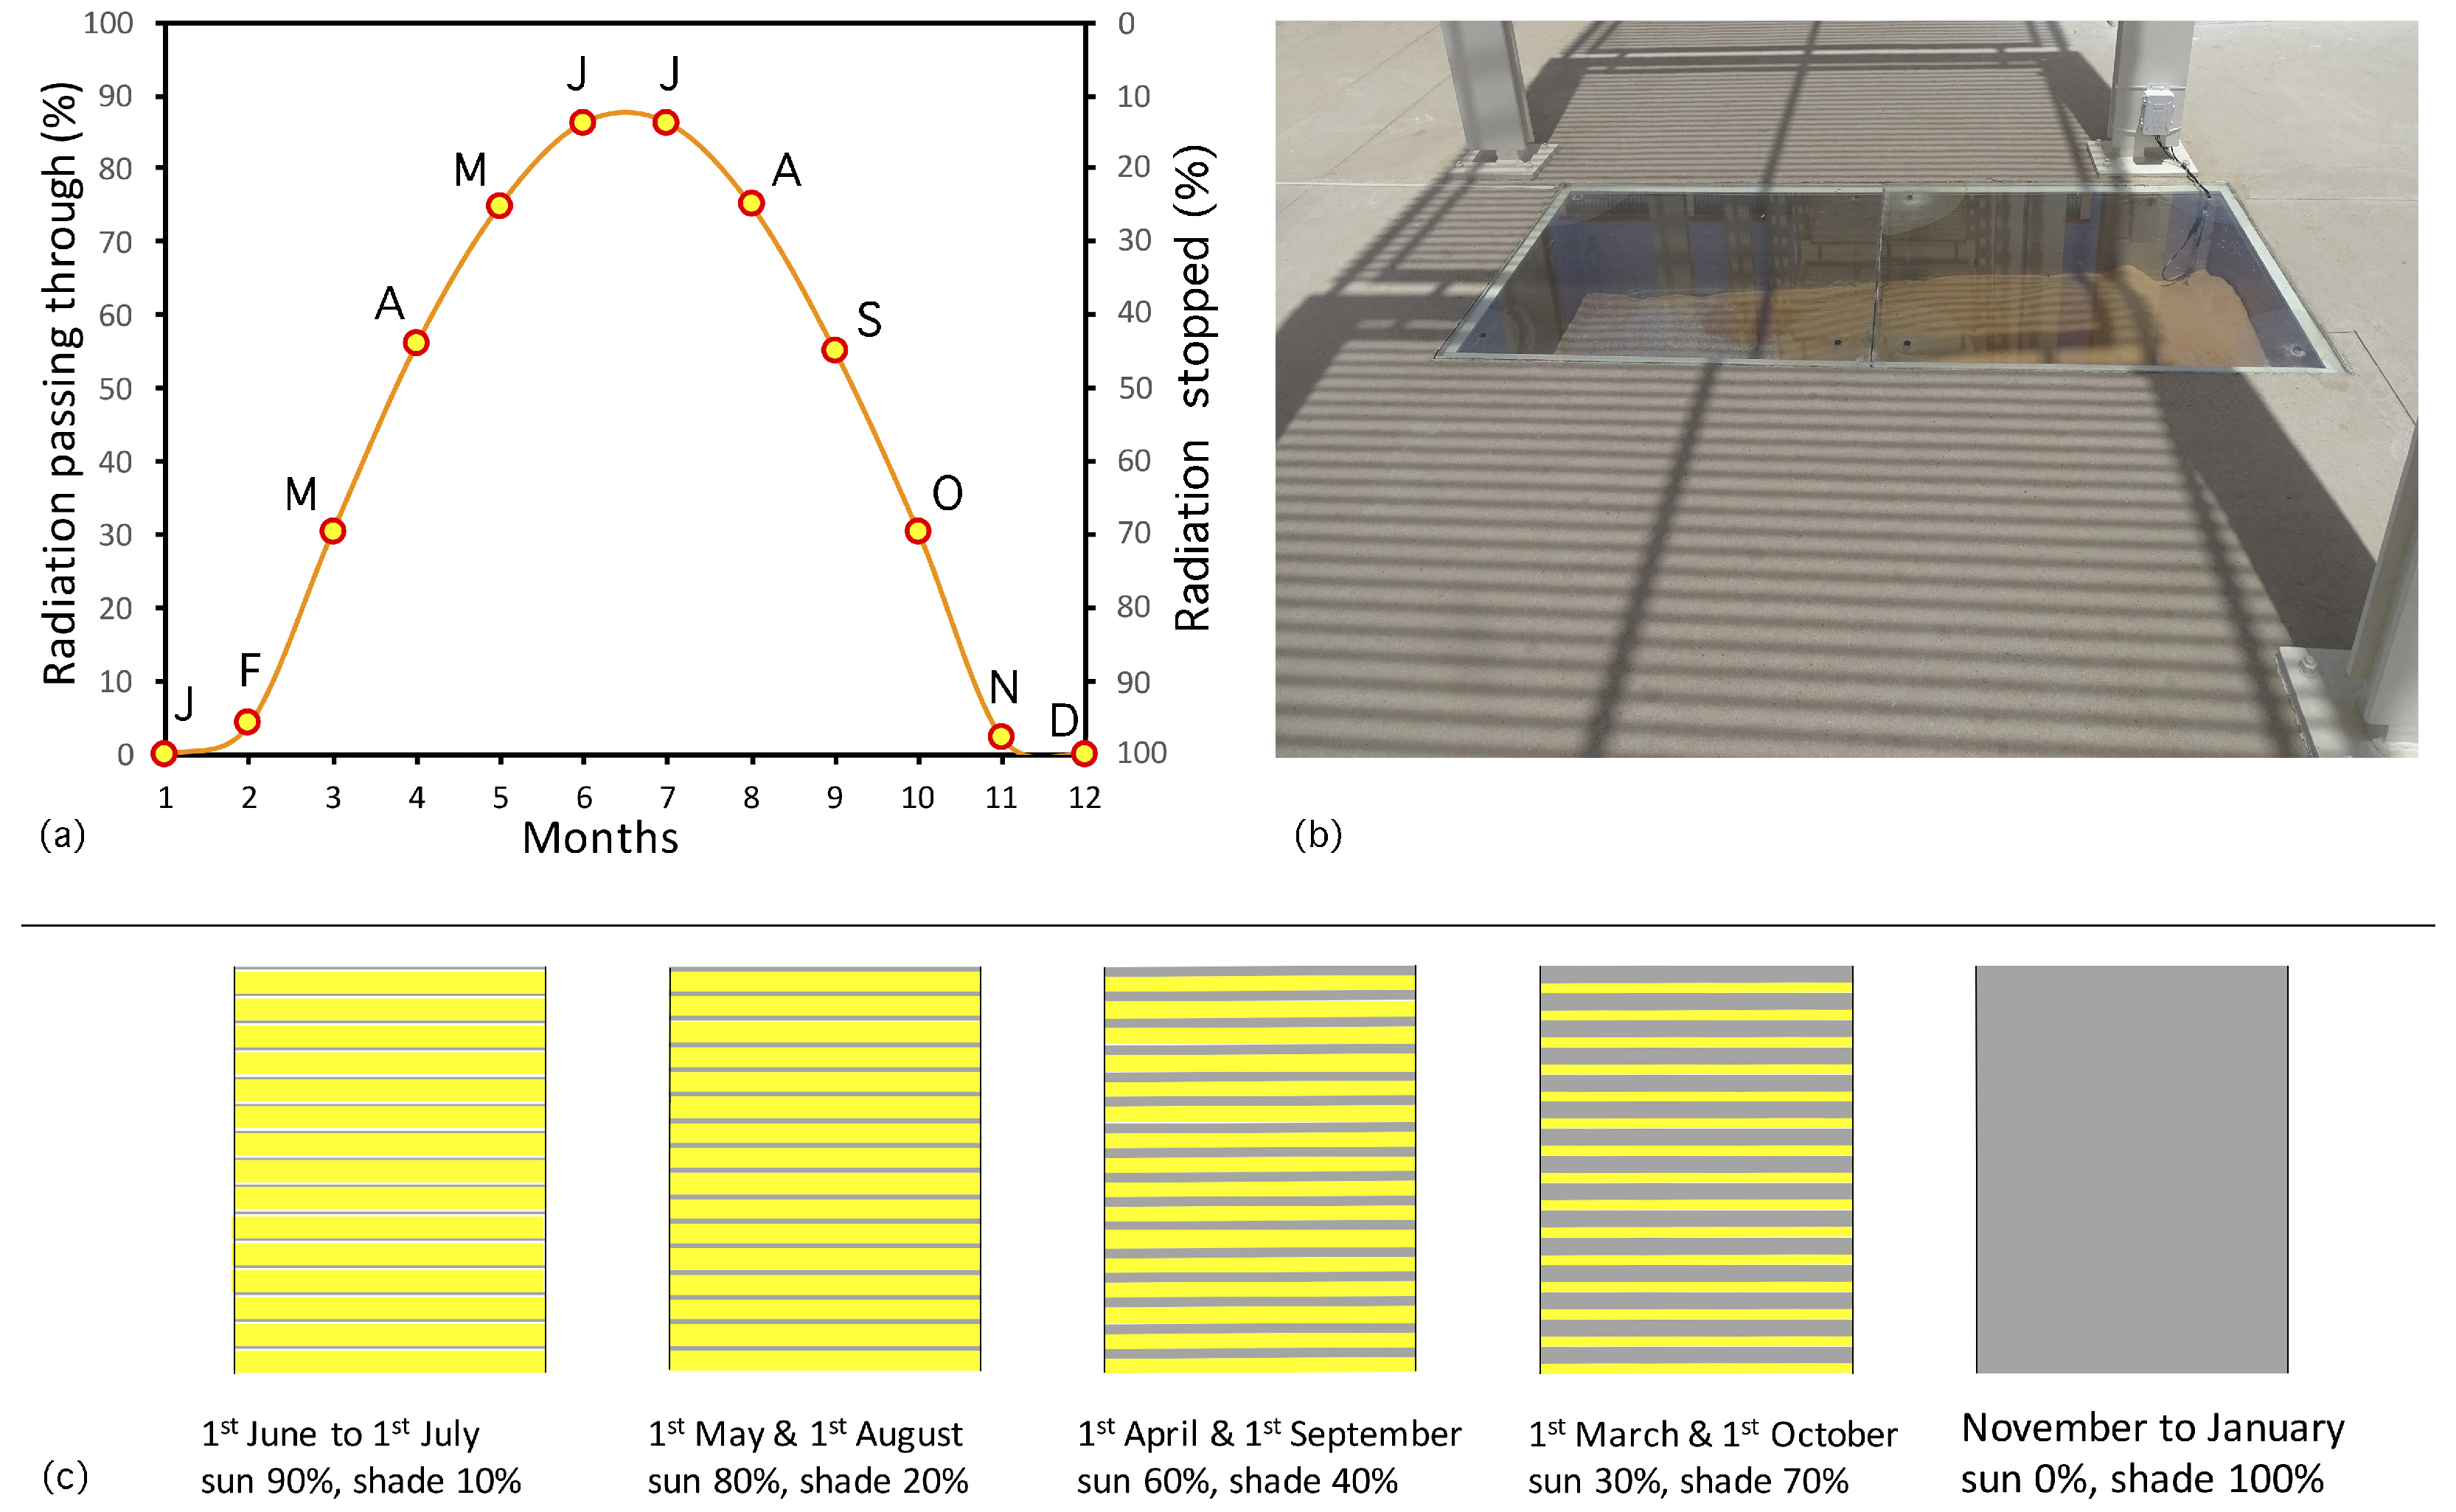
5.2. Adoption of Solar Shields

Solar radiation shields and projected shadow constitute a valid mitigation remedy, because they reduce the solar radiation and the related greenhouse effect. This section is devoted to investigate the benefits from horizontal or vertical shields. The first request is to know month by month the inclination of the solar beams at culmination (Figure 27).
It is useful to consider the efficiency that a solar shield can have when kept horizontal, vertical, or inclined 45 , and its projected shadow, at noon, at the two solstices that constitute the two most extreme situations (Figure 28).
At the winter solstice, at noon, the solar altitude is H = 42 . 44 and shadows are slant, projected with the same angle toward north, and their length is a little longer (i.e., 10% more) than the height of the vertical bodies from which they are generated. This situation favours a screen for solar radiation placed vertically on the south side, rather than a horizontal one (Figure 28a,b).
At the summer solstice, at noon, the Sun is overhead and shadows fall almost vertically. This situation favours a screen for solar radiation placed horizontally, while a vertical one is useless (Figure 28c,d).
The basic solution to shade the showcases near midday throughout the whole year is a combination of a vertical shield for winter, and a horizontal shield for summer (Figure 28e). Alternatively, a horizontal shield extended towards the southern side is effective against the inclined solar beams in winter (Figure 28f). More elegant solutions may be found, using a 45 inclined shield (Figure 28g), or a louvred pergola, but with slats inclined 45 (Figure 28h).
When measurements began, the pergola had installed louvres only on the ceiling (Figure 1a,b), while near the end of the monitoring period, operable louvres were added on the side (Figure 1c,d), which were ordered before the study but delivered after. The slats are perpendicular to the louvre plane, and their dimensions are 2.8 mm thickness; 25 mm horizontally spacing, i.e., the gap between slats; and 25 mm width, i.e., the vertical extension. The maximum shading should occur at noon, when solar radiation is strongest. However, with the slats oriented vertically (as in Figure 28b,d) and the above dimensions, the louvres provide partial shade, since a seasonally varying fraction of radiation passes through the gap between slats.
When the Sun is overhead, the thickness of slats stops 11% of the radiation income. When the solar altitude decreases over the horizon, the slats increase shading, which becomes total when the Sun reaches 45 , from November to January, as shown in Figure 27 and Figure 29a. An example of the shadow falling at noon on the walkway in mid-May or mid-July, when A = 84 and tan Z = 0.1 , is reported in Figure 29b. It can be seen that 80% of the solar radiation passes through the louvred ceiling and reaches the floor, while 20% is stopped.
The shading efficiency can be increased if the width of the slats equals the gap width multiplied by 2 (i.e., the diagonal of a square, as in Figure 28h) and the slats have a convenient inclination (i.e., 45 ), as discussed in the previous section.

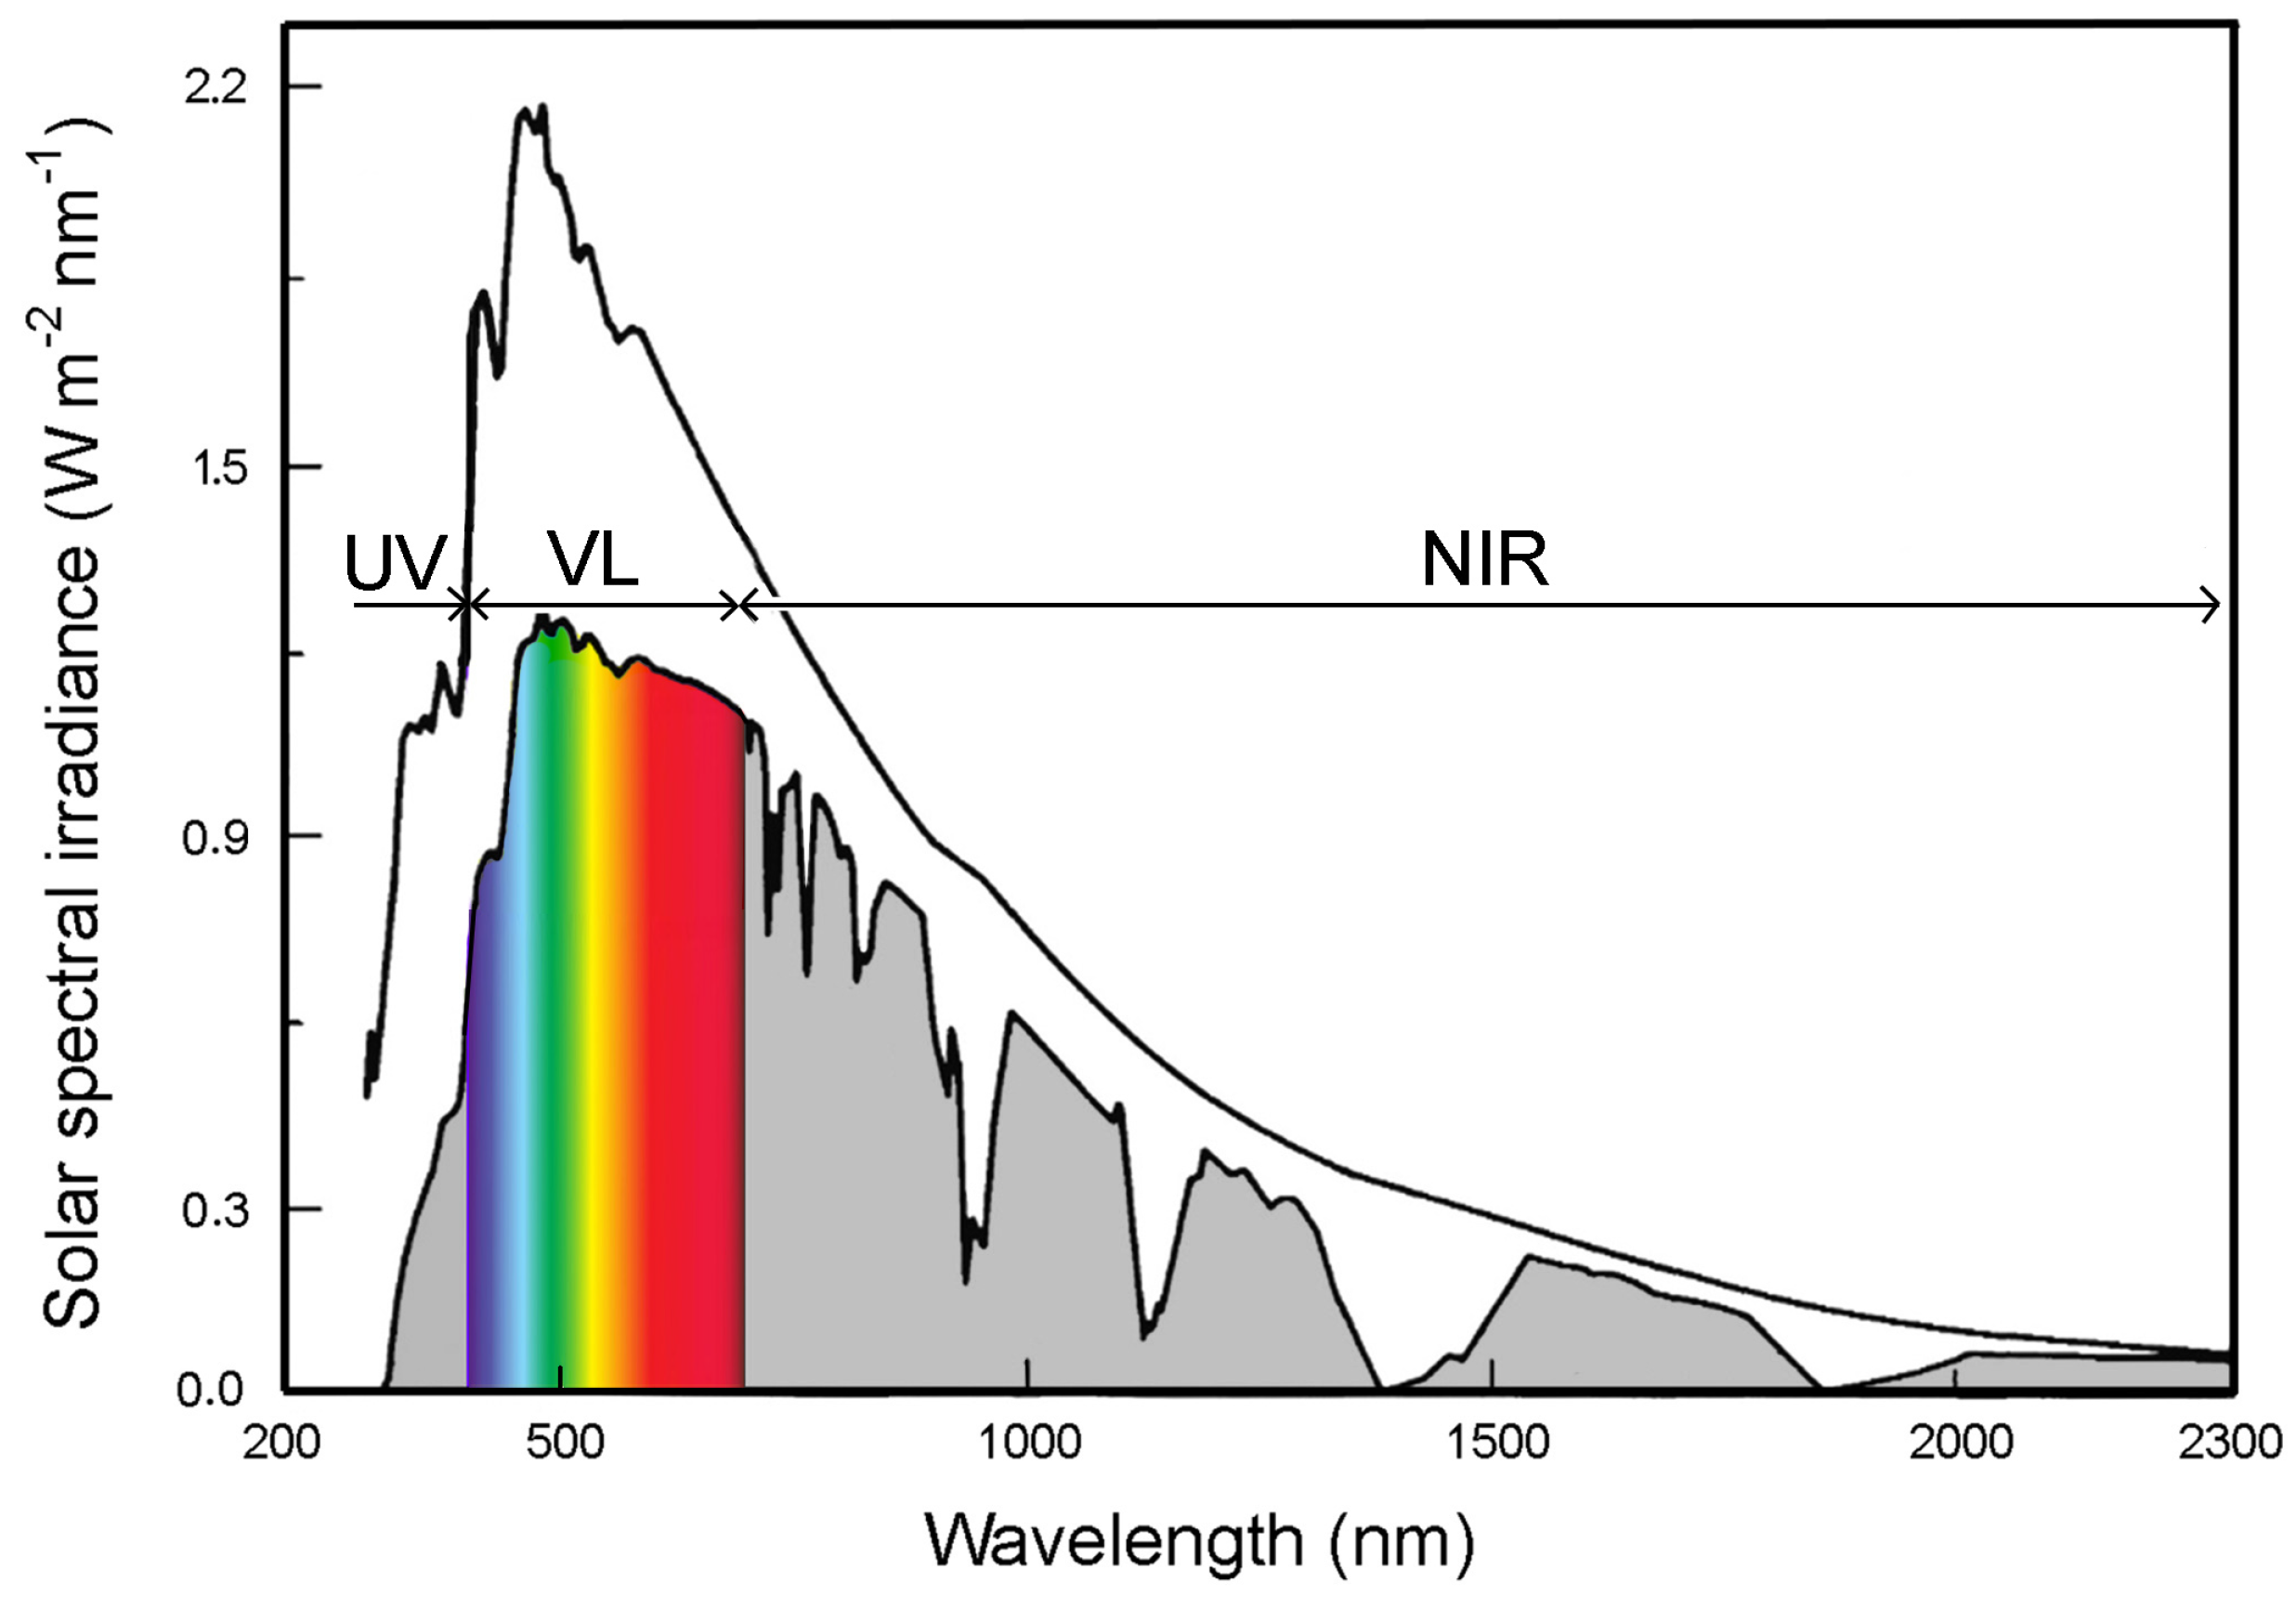
5.3. Adoption of Window Glass Filters

It is known that to improve indoor climate or to save energy, special glasses and window films are produced to selectively absorb and/or reflect the incident light. Window films can be attached either inside or outside of windows. Solar control films are popularly used in summer, to reduce the amount of solar heat entering a building and the need for air conditioning, and in winter, the reflection reduces the heat escaping through glazing. The spectral transmission of solar radiation through different materials is known [47]. In principle, this may seem an easy solution, but needs to be carefully evaluated.
The solar spectral irradiance outside the atmosphere and the quantity that reaches the Earth surface at sea level, after atmospheric absorption and scattering, are reported in Figure 30 [48]. It includes ultraviolet (UV, from 300 to 380 nm), visible light (VL, from 380 to 780 nm), and the near-infrared (NIR, red, from 780 nm to 2300 nm) region of the electromagnetic spectrum. About half of the energy lies in the VL region, and the other half in NIR. The UV ranges from 1% to 7%, depending on the time of day and season.
The greenhouse effect occurs when some radiation is absorbed and transformed into heat, remaining trapped in a closed environment. Glass is transparent to visible light but absorbs infrared (IR) and NIR radiation, which overheat the glass. The VL passes through the glass and reaches the bodies behind. A small fraction of VL is reflected by the bodies, making them visible, while a large part is absorbed, and raises their surface temperature. The bodies release this excess energy with IR radiation, which is absorbed by the glass, further increasing its temperature level.
To improve indoor climate or to save energy, special glasses and solar control films (SCF, popularly called window films) are produced to increase the absorption and/or reflection of impinging light. Window films are passive thin films attached to the inside or outside of windows, and defined by the standard EN15752-1 [49] in terms of their installation position (i.e., internally or externally to a single-glazed window, or in the case of double or triple glazing). The same standard defines their optical properties, i.e., reflectance (i.e., the fraction of solar radiation reflected by the glass and film system), absorptance (i.e., the fraction of solar radiation absorbed by the glass and film system), and transmittance (i.e., the fraction of solar radiation passing through the glass and film system), properties for the UV, visible, and thermal ranges. The standard EN 15752-1 refers to the SCF made of adhesive backed polymeric films based on biaxially oriented polyester film, while the glass products that have an adhesive-backed polymeric film applied are regulated by EN 15775-1 [49]. Their performance depends on the combined effect of the glass substrate and the applied SCF. A critical issue is to reach conditions of overheating and potential thermal shock breakage, that is increased by the solar absorptance of the SCF. Therefore, their application should be carefully evaluated [50].
In hot desert climate, window films have been applied to windows with double glazing, and never with single glazing [50,51,52,53,54,55]. It must be said that in this region, the strongest solar radiation occurs near midday at the solar solstice, when the Sun is overhead, i.e., perpendicular to the soil, but grazing the windows, i.e., it provides almost no energy. Therefore, in summer, the BMBK showcases overheat, while windows are not reached, or receive minimal amounts. Solar beams perpendicular to windows are only found near sunrise and sunset, when the solar altitude is low, and this occurs limited to windows exposed to east and west. The radiation that windows receive at the solstices and equinoxes is represented in Figure 8, for each compass exposure. The maximum power is reached at noon by windows exposed to south, at the winter solstice. This value is very similar to that reached by a horizontal surface in this period, because in this season, at this latitude, the solar elevation at noon is around 45 , and the beams are equally distributed on the horizontal and the vertical surfaces. Over the year, the highest midday value on a south-facing window corresponds to the lowest value on a horizontal showcase; when a horizontal showcase is reached by the largest solar input, vertical windows are unreached.
Using a special glass, or applying a film, has pros and cons that need to be considered. Both reflection and absorption decrease the amount of light entering the showcase and the visibility of the exhibit. Reflection is troublesome to eyes. Absorption increases the glass temperature, and this is a crucial point. At present, the glass reaches 70–80 C , and a further increase can cause serious problems with the dimensional expansion and tensions generated inside the glass pane, thus increasing the risk of breaking. Glass has an amorphous structure and some internal defects can start to break, especially with repeated cycles. Tempered glasses must be used to resist to high thermal stresses. External shading can generate an uneven distribution of tensions between the hottest and less hot parts, and cause the glass to break. Applying a film increases the risk of breakage, especially if it is applied to the internal surface. To decrease the risk, the film should be highly reflective (e.g., 70% or more) and applied to the upper glass surface, with a mirror effect that is noisy and makes it impossible to see inside. In conclusion, glass or films with reflectance index should be excluded for the visual impact, while those with high absorptance are dangerous and must always be subject to careful evaluation. So far, there is no direct experience of applications for external showcases in the tropics, and the high temperatures, and the related risk of breakage, do not encourage its application.

6. Conclusions

In hot climates, the solar radiation is strong, and is very rarely attenuated by cloud cover. During insolation, the thick glass panes accumulate heat and generate a strong greenhouse effect. The glass temperature and the temperature inside the showcases reach very high peak values, and then they cool, but remain always above the external air temperature. The greenhouse, in combination with the poor ventilation, transforms showcases into ovens. These extreme temperatures lower the R H level inside the showcases, forcing evaporation from the archaeological remains, which are dried up and accumulate soluble salts. Inside the showcases, the evaporation increases the concentration of moisture and raises the dew point, and when the glass pane cools during the night, an intense condensation occurs on the glass, forming water drops that fall on the earthen remains. In the long term, the repeated cycles of warm–cold and dry–humid have a negative impact on the archaeological remains kept in showcases, both for the mechanical deformation and salt action. These mechanisms may lead to structural disaggregation, and dampness constitutes a risk for mould and pest colonization.
The negative mechanisms are driven by the intense solar radiation in combination with the glass that generates the greenhouse effect. The solar radiation is the forcing factor and must be reduced either with shade, or by cooling the hot glass panes. This should be the key objective in Al Ain and whenever showcases are exposed to strong solar radiation.
The high temperatures reached inside may be mitigated with some internal ventilation (e.g., tanoor), with the further advantage that the ventilation removes some excess of moisture, as well as the frequency, duration, and intensity of nocturnal condensation and dewing. However, ventilation should be controlled in the context of the temperatures of the glass pane and the showcase. During the night, when the glass temperature is approaching the dew point, some ventilation is useful to remove some moisture, reduce the dew point and avoid condensation. This is especially beneficial for keeping the archaeological remains visible. During the day, ventilation is useful if it is able to control the showcase temperature; however, this is unlikely with small slits. During the day, ventilation may have a dangerous effect when the temperature of the showcase is high, because it would favour evaporation, and therefore dryness and accumulation of soluble salts on the earthen remains. Some ventilation is important, but should be controlled in relation to the showcase temperature, or the control system should be accurately tuned after holistic environmental monitoring.
This study has considered two outdoor showcases in Al Ain, and the conclusions are relevant for other similar situations in the tropics. However, even in temperate climates, predictions of climate changes and worsening scenarios may suggest adopting showcases as a possible mitigation remedy to protect outdoor monuments from extreme weather conditions, e.g., gale winds, driven rain, hail, dryness, and so on. This study highlighted the key problems of outdoor showcases, and has discussed how to encounter them.
The key recommendations derived from this study are:
  • In sunny regions, extreme microclimate conditions may develop inside the showcases exposed outdoors, which are potentially noxious for the conservation of the exhibits;
  • In sunny regions, the glass panes of showcases exposed outdoors are responsible for developing severe greenhouse effects;
  • In sunny regions, the use of external showcases is not recommended;
  • If outdoor showcases are necessary, it is important to prevent the glass from overheating;
  • Protection based on preventing solar radiation from directly hitting the glass is an effective mitigation;
  • Natural ventilation openings that ensure free exchanges of air between the showcase and the outdoor environment may constitute an efficient mitigation remedy to reduce showcase overheating, but can increase the accumulation of soluble salts.

Author Contributions

The Department of Culture and Tourism, Abu Dhabi (DCT) with ARS Progetti S.P.A. (ARS) requested the study, contributed with historic and archaeological issues, and supervised the project. D.C. conceptualized the research, supervised the monitoring plan and the data interpretation, made the model simulation of the solar radiation, and considered the mitigation remedies. R.G. and F.R. cared for the microclimate monitoring, the data handling, and interpretation. A.d.V. cared for the mathematical and computer analyses for microclimate diagrams. M.S. and DCT cared for the feasibility and transferability of the mitigation methodologies. D.C. prepared the first draft of the manuscript; then the manuscript was implemented and revised by all authors. All authors have read and agreed to the published version of the manuscript.

Funding

DCT and ARS financed the microclimate monitoring and a basic report. The subsequent in-depth study presented in this paper, including the solar simulations, has been made without funding.

Data Availability Statement

The datasets recovered during the microclimate studies mentioned in this paper are property of DCT and ARS. Interested people should contact DCT and ARS and motivate their request.

Acknowledgments

The 1990–2020 climate data have been taken from the website of Climate Data for Cities Worldwide, which includes data of the Al Ain International Airport, https://en.climate-data.org/asia/united-arab-emirates/abu-dhabi/al-ain-1210/ (accessed on 24 October 2023). The authors are grateful to the anonymous reviewers for the very useful suggestions, and all the persons and institutions that have facilitated this research.

Conflicts of Interest

The authors declare no conflicts of interest.

Abbreviations

The following symbols, abbreviations, and suffixes are used in this paper:
A solar altitude
δ declination angle
Z zenith angle
Δ difference between two values of a selected variable
Abbreviations
AAIAAl Ain International Airport
ATastronomical time
BMBKBait of Sheikh Mohammed Bin Khalifa
DPdew point
MRmixing ratio
RHrelative humidity
SMCsoil moisture content
Ttemperature
T g temperature of the glass pane
UTCCoordinated Universal Time
Suffixes
extexternal
Ttanoor
Wwalkway

References

  1. ICOMOS Climate Change and Cultural Heritage Working Group. The Future of Our Pasts: Engaging Cultural Heritage in Climate Action; ICOMOS: Paris, France, 2019; Available online: https://indd.adobe.com/view/a9a551e3-3b23-4127-99fd-a7a80d91a29e (accessed on 24 October 2023).
  2. Huijun, Z.; Doyon, L. A Century of Archaeological Heritage Protection and Exhibition in China. Hist. Environ. Policy Pract. 2021, 12, 146–163. [Google Scholar] [CrossRef]
  3. Petzet, M. Principles of Presevation. In ICOMOS. International Charters for Conservation and Restoration; ICOMOS: Paris, France, 2004; pp. 7–30. Available online: http://openarchive.icomos.org/id/eprint/432/ (accessed on 24 October 2023).
  4. Bait Mohammed Bin Khalifa—A Home for the Community. Available online: https://abudhabiculture.ae/en/experience/historic-landmarks/bmbk (accessed on 24 October 2023).
  5. Barucco, P.; Chabbi, A.; Mordanova, A. Bait Mohammed Bin Khalifa, the challenging consolidation of an Emirati “Transition Period” building. In Structural Analysis of Historical Constructions. SAHC 2023; Endo, Y., Hanazato, T., Eds.; Springer: Berlin, Germany, 2023; Volume 1, pp. 1383–1397. [Google Scholar]
  6. Spennemann, D.H.R. Earth to Earth: Patterns of Environmental Decay Affecting Modern Pisé Walls. Buildings 2022, 12, 748. [Google Scholar] [CrossRef]
  7. Camuffo, D. Controlling the Aeolian Erosion of the Great Sphinx. Stud. Conserv. 1993, 38, 198–205. [Google Scholar] [CrossRef]
  8. Camuffo, D. Microclimate for Cultural Heritage—Measurement, Risk Assessment, Conservation, Restoration and Maintenance of Indoor and Outdoor Monuments, 3rd ed.; Elsevier: Amsterdam, The Netherland, 2019. [Google Scholar] [CrossRef]
  9. Martínez-Martínez, J.; Benavente, D.; Jiménez Gutiérrez, S.; del Cura, M.G.; Ordóñez, S. Stone weathering under Mediterranean semiarid climate in the fortress of Nueva Tabarca island (Spain). Build. Environ. 2017, 121, 262–276. [Google Scholar] [CrossRef]
  10. Laity, J.; Bridges, N. 11.14 Abraded Systems. In Treatise on Geomorphology; Shroder, J.F., Ed.; Academic Press: San Diego, CA, USA, 2013; pp. 269–286. [Google Scholar] [CrossRef]
  11. Heritage Collections Council. Guidelines for Environmental Control in Cultural Institutions; Consortium for Heritage Collections and their Environment: Canberra, Australia, 2002; Available online: https://aiccm.org.au/wp-content/uploads/2020/04/environ_1-1.pdf (accessed on 24 October 2023).
  12. EN 15757 Standard; Conservation of Cultural Heritage—Specifications for Temperature and Relative Humidity to Limit Climate—Induced Mechanical Damage. European Committee for Standardization (CEN): Brussels, Belgium, 2010.
  13. EN 16141 Standard; Conservation of Cultural Heritage—Guidelines for Management of Environmental Conditions—Open Storage Facilities: Definitions and Characteristics of Collection Centres Dedicated to the Preservation and Management of Cultural Heritage. European Committee for Standardization (CEN): Brussels, Belgium, 2013.
  14. EN 16893 Standard; Conservation of Cultural Heritag—Specifications for Location, Construction and Modification of Buildings or Rooms Intended for the Storage or Use of Heritage Collection. European Committee for Standardization (CEN): Brussels, Belgium, 2018.
  15. ASHRAE. A24—Museums, Galleries, Archives, and Libraries. In ASHRAE Handbook—HVAC Applications; American Society of Heating, Refrigerating and Air-Conditioning Engineers: Atlanta, GA, USA, 2019; Chapter 24; Available online: https://www.ashrae.org/about/news/2019/ashrae-releases-new-hvac-applications-handbook (accessed on 24 October 2023).
  16. EN 15759-1 Standard; Conservation of Cultural Property—Indoor Climate—Part 1: Guidelines for Heating Churches, Chapels and Other Places of Worship. European Committee for Standardization (CEN): Brussels, Belgium, 2011.
  17. EN 15759-2 Standard; Conservation of Cultural Property—Indoor Climate—Part 2: Ventilation in Historic Buildings and to Protect Collections. European Committee for Standardization (CEN): Brussels, Belgium, 2018.
  18. EN 15999-1 Standard; Conservation of Cultural Heritage—Guidelines for Design of Showcases for Exhibition and Preservation of Objects—Part 1: General Instructions. European Committee for Standardization (CEN): Brussels, Belgium, 2014.
  19. prEN 15999-2 Standard; Conservation of Cultural Heritage—Guidelines for Design of Showcases for Exhibition and Preservation of Objects—Part 2: Technical Aspects. European Committee for Standardization (CEN): Brussels, Belgium, in production.
  20. ICOMOS Climate Change and Cultural Heritage Working Group. Principles for the analysis, conservation and structural restoration of Architectural Heritage adopted by ICOMOS. In Proceedings of the 14th General Assembly of ICOMOS in Victoria Falls in 2003, Paris, France, 27–31 October 2003; Available online: https://www.icomos.org/en/about-the-centre/179-articles-en-francais/ressources/charters-and-standards/165-icomos-charter-principles-for-the-analysis-conservation-and-structural-restoration-of-architectural-heritage (accessed on 24 October 2023).
  21. UNESCO; ICCROM; ICOMOS; IUCN. Managing Disaster Risks for World Heritage; UNESCO: Paris, France, 2010; Available online: https://whc.unesco.org/en/managing-disaster-risks/ (accessed on 24 October 2023).
  22. ICOMOS Climate Change and Cultural Heritage Working Group. Salalah Guidelines for the management of public Archaeological Sites. In Proceedings of the GA 2017 6-3-3 Doctrinal Texts, Paris, France, 11–15 December 2017. [Google Scholar]
  23. UNESCO. Climate Change and World Heritage—Report on Predicting and Managing the Impacts of Climate Change on World Heritage and Strategy to Assist States Parties to Implement Appropriate Management Responses; UNESCO: Paris, France, 2007; Available online: https://unesdoc.unesco.org/ark:/48223/pf0000160019 (accessed on 24 October 2023).
  24. EN 17652 Standard; Cultural Heritage—Assessment and Monitoring of Archaeological Deposits for Preservation in Situ. European Committee for Standardization (CEN): Brussels, Belgium, 2018.
  25. Beck, H.; Zimmermann, N.; McVicar, T.; Vergopolan, N.; Berg, A.; Wood, E. Present and future Köppen-Geiger climate classification maps at 1-km resolution. Sci. Data Vol. 2018, 5, 180214. [Google Scholar] [CrossRef] [PubMed]
  26. Peel, M.C.; Finlayson, B.L.; McMahon, T.A. Updated world map of the Köppen-Geiger climate classification. Hydrol. Earth Syst. Sci. 2007, 11, 1633–1644. [Google Scholar] [CrossRef]
  27. Jorgensen, D.; al Tikiriti, W. A hydrologic and archeologic study of climate change in Al Ain, United Arab Emirates. Glob. Planet. Chang. 2003, 35, 37–49. [Google Scholar] [CrossRef]
  28. Bande, L.; Manadhar, P.; Marpu, P. Definition of local climate zones in relation to ENVI-met and site data in the city of Al Ain, UAE. In Proceedings of the The Sustainable City XIII, WIT Transactions on Ecology and the Environment, Valencia, Spain, 1–3 October 2019; Volume 238, pp. 209–220. [Google Scholar] [CrossRef]
  29. Menne, M.J.; Durre, I.; Korzeniewski, B.; McNeill, S.; Thomas, K.; Yin, X.; Anthony, S.; Ray, R.; Vose, R.S.; E.Gleason, B.; et al. Global Historical Climatology Network—Daily (GHCN-Daily); Version 3; NOAA National Climatic Data Center: Asheville, NC, USA, 2012. [Google Scholar] [CrossRef]
  30. Robinson, N. Solar Radiation; Elsevier: Amsterdam, The Netherland, 1966. [Google Scholar]
  31. Kondratyev, Y. Radiation in the Atmosphere; Academic Press: New York, NY, USA, 1969. [Google Scholar]
  32. Camuffo, D.; della Valle, A.; Becherini, F. From time frames to temperature bias in long temperature series. Clim. Chang. 2021, 165, 38. [Google Scholar] [CrossRef]
  33. AAIA (Al Ain International Airport). Climate Data. 2023. Available online: https://en.climate-data.org/asia/united-arab-emirates/abu-dhabi/al-ain-1210 (accessed on 1 October 2023).
  34. Camuffo, D. A model simulation of the solar energy impinging on stone blocks of the Giza Pyramids. Egypt. J. Archaeol. Restor. Stud. 2018, 8, 83–89. [Google Scholar] [CrossRef]
  35. Linch, P. The equation of time and the analemma. Ir. Math. Soc. Bull. 2012, 69, 47–56. Available online: https://maths.ucd.ie/~plynch/Publications/Analemma-BIMS.pdf (accessed on 24 October 2023). [CrossRef]
  36. EN 15758 Standard; Conservation of Cultural Property—Specifications for Temperature and Relative Humidity to Limit Climate—Induced Mechanical Damage in Organic Hygroscopic Materials. European Committee for Standardization (CEN): Brussels, Belgium, 2010.
  37. EN 16242 Standard; Conservation of Cultural Property—Procedures and Instruments for Measuring Humidity in the Air and Moisture Exchanges between Air and Cultural Property. European Committee for Standardization (CEN): Brussels, Belgium, 2012.
  38. WMO. Guide to Instruments and Methods of Observation: Volume I —Measurement of Meteorological Variables; World Meteorological Organization: Geneva, Switzerland, 2018; Volume 8. [Google Scholar]
  39. EN 16682 Standard; Conservation of Cultural Heritage—Guide to the Measurements of Moisture Content in Materials Constituting Movable and Immovable Cultural Heritage. European Committee for Standardization (CEN): Brussels, Belgium, 2007.
  40. EN 16085 Standard; Conservation of Cultural Property—Methodology for Sampling from Materials of Cultural Property—General Rules. European Committee for Standardization (CEN): Brussels, Belgium, 2012.
  41. Camuffo, D.; Giorio, R. Quantitative Evaluation of Water Deposited by Dew on Monuments. Bound. Layer Meteorol. 2003, 107, 665–672. [Google Scholar] [CrossRef]
  42. Camuffo, D.; della Valle, A.; Becherini, F. The European Standard EN 15757 Concerning Specifications for Relative Humidity: Suggested Improvements for Its Revision. Atmosphere 2022, 13, 1344. [Google Scholar] [CrossRef]
  43. Wahab, A.; Khamidi, M.F.; Ismail, M.R. An Investigation of mould growth in tropical climate buildings. In Proceedings of the 2013 IEEE Business Engineering and Industrial Applications Colloquium (BEIAC), Langkawi, Malaysia, 7–9 April 2013; pp. 316–321. [Google Scholar] [CrossRef]
  44. Querner, P.; Sterflinger, K.; Derksen, K.; Leissner, J.; Landsberger, B.; Hammer, A.; Brimblecombe, P. Climate Change and Its Effects on Indoor Pests (Insect and Fungi) in Museums. Climate 2022, 10, 103. [Google Scholar] [CrossRef]
  45. Deák, T. Food Technologies: Pasteurization. In Encyclopedia of Food Safety; Motarjemi, Y., Ed.; Academic Press: Waltham, MA, USA, 2014; pp. 219–224. [Google Scholar] [CrossRef]
  46. Camuffo, D.; Pagan, E.; Rissanen, S.; Bratasz, Ł.; Kozłowski, R.; Camuffo, M.; della Valle, A. An advanced church heating system favourable to artworks: A contribution to European standardisation. J. Cult. Herit. 2010, 11, 205–219. [Google Scholar] [CrossRef]
  47. Serrano, M.A.; Moreno, J.C. Spectral transmission of solar radiation by plastic and glass materials. J. Photochem. Photobiol. Biol. 2020, 208, 111894. [Google Scholar] [CrossRef] [PubMed]
  48. Mecherikunnel, A.T.; Richmond, J.C. Spectral Distribution of Solar Radiation. Technical Memorandum 82021; Goddard Space Flight Center, NASA: Greenbelt, MD USA, 1980. [Google Scholar]
  49. EN 15752-1 Standard; Glass in Building—Adhesive Backed Polymeric Film—Part 1: Definitions and Requirements. European Committee for Standardization (CEN): Brussels, Belgium, 2014.
  50. Pereira, J.; Teixeira, H.; Gomes, M.; Rodrigues, A.M. Performance of Solar Control Films on Building Glazing: A Literature Review. Appl. Sci. 2022, 12, 5923. [Google Scholar] [CrossRef]
  51. Al-Taqi, R.; Maheshwari, H.; Alasseri, G. Cost Effectiveness for Solar Control Film for Residential Applications. In Proceedings of the Tenth International Conference Enhanced Building Operations, Kuwait City, Kuwait, 26–28 October 2010; Available online: https://oaktrust.library.tamu.edu/handle/1969.1/94138 (accessed on 24 October 2023).
  52. Noh-Pat, F.; Xamán, J.; Álvarez, G.; Chávez, Y.; Arce, J. Thermal analysis for a double glazing unit with and without a solar control film (SnS–CuxS) for using in hot climates. Energy Build. 2011, 43, 704–712. [Google Scholar] [CrossRef]
  53. Xamán, J.; Pérez-Nucamendi, C.; Arce, J.; Hinojosa, J.; Álvarez, G.; Zavala-Guillén, I. Thermal analysis for a double pane window with a solar control film for using in cold and warm climates. Energy Build. 2014, 76, 429–439. [Google Scholar] [CrossRef]
  54. Xamán, J.; Olazo-Gómez, Y.; Zavala-Guillén, I.; Hernández-Pérez, I.; Aguilar, J.; Hinojosa, J. Thermal evaluation of a Room coupled with a Double Glazing Window with/without a solar control film for Mexico. Appl. Therm. Eng. 2017, 110, 805–820. [Google Scholar] [CrossRef]
  55. Sedaghat, A.; Alkhatib, F.; Oloomi, S.A.A.; Sabri, F.; Salem, H.; Sabati, M.; Zafar, W.J.; Malayer, M.A.; Negahi, A. Experimental study on the performance of solar window films in office buildings in Kuwait. J. Nanoparticle Res. 2020, 22, 85. [Google Scholar] [CrossRef]
Figure 1. The pergola and the two showcases. (a) Side view of the pergola as it was during the monitoring period, with the family quarters in the background. Small vegetation and a tree are planted in proximity of the pergola. (b) Detail of the glass top of the walkway showcase in the middle of the pergola and the tanoor showcase on the right side. (c) The pergola as it is now, with the operable louvres in vertical position to separate the walkway from the courtyard. (d) The operable louvres in horizontal position, protruding from the ceiling, to connect the eastern and western courtyards. Note that in both the vertical and horizontal positions the shade is partial, part of the solar radiation passing through the gaps between slats.
Climate 12 00006 g001
Figure 2. Scheme of the two showcases, i.e., walkway (W) in the pergola, and tanoor (T) on the eastern side of the pergola, and the location of the monitoring system. T/RH: temperature (T) and relative humidity ( R H ) sensors; ext: external sensors; Tg: temperature of the glass pane; SMC: soil moisture content.
Climate 12 00006 g002
Figure 3. Dewing at the walkway showcase.
Climate 12 00006 g003
Figure 4. (a) Temperature and precipitation in Al Ain. Gray band: daily minimum and maximum temperatures (average 1995–2022) recorded by WMO Al Ain station at the International Airport; red line: average daily temperatures measured at BMBK, this study; blue lines: daily mean precipitation over 1995–2022 period (right y-axis) recorded by the WMO station; the black arrows highlight rainy days during this monitoring. (b) External temperature, recorded in this study close to the showcases from April 2022 to May 2023; red line: best fit. (c) External mixing ratio, calculated using the data of this study; red line: best fit.
Climate 12 00006 g004
Figure 5. Daytime length calculated from sunrise to sunset, and monthly insolation (average number of sunshine hours) at Al Ain. Personal elaboration of insolation data (average 1991–2021) from [33].
Climate 12 00006 g005
Figure 6. The coordinates i.e., altitude (red) and azimuth (blue) of the Sun during its apparent motion around the local sky of Al Ain at the two solstices and the equinoxes. Daytime (from sunrise to sunset) is white, night-time grey.
Climate 12 00006 g006
Figure 7. Solar energy impinging per second and square meter on the tanoor (dashed line) and the walkway (continuous line) showcases at the winter solstice (blue), the equinoxes (green), and the summer solstice (red).
Climate 12 00006 g007
Figure 8. Solar energy impinging per second and square meter on the surface of a vertical cylinder at Al Ain, at the winter solstice, the equinoxes, and the summer solstice. The figure is representative of the energy falling on any vertical surface (e.g., wall, window) facing a selected compass direction.
Climate 12 00006 g008
Figure 9. Solar energy impinging per second and square meter on the four vertical walls of the tanoor, at the winter solstice, the equinoxes, and the summer solstice. Wall names are attributed with the criterion of the closest compass direction, but calculations are based on actual directions.
Climate 12 00006 g009
Figure 10. (a) Data logger measuring microclimate parameters for the walkway showcase. (b) Temperature and relative humidity sensor, with solar shield, located near the tanoor showcase.
Climate 12 00006 g010
Figure 11. Flow diagrams to illustrate the methodology to investigate (a) the greenhouse effect; (b) the combined effect between the evaporation from the archaeological remains and the air exchanges between the showcase and the exterior; (c) the glass misting and dewing.
Climate 12 00006 g011
Figure 12. Soil moisture content measured at the walkway. Blue arrows: plant watering. Yellow arrow: perturbation for maintenance works.
Climate 12 00006 g012
Figure 13. Temperatures and mixing ratios at the two solstices. (a) Walkway, winter solstice; (b) tanoor, winter solstice; (c) walkway, summer solstice; (d) tanoor, summer solstice. Daytime (from sunrise to sunset) is white, nighttime grey.
Climate 12 00006 g013
Figure 14. Relative humidity in the two showcases and external values at the two solstices. (a) Winter solstice; (b) summer solstice. Daytime (from sunrise to sunset) is white, nighttime grey.
Climate 12 00006 g014
Figure 15. (a) Walkway showcase temperature during the recording period. Vertical blue segments are the (compresses) daily T W cycles. The red interpolation line shows the annual cycle of the daily T W averages. (b) Frequency distribution of the showcase temperature during the monitoring period.
Climate 12 00006 g015
Figure 16. (a) Difference between the walkway showcase temperature and the external temperature ( Δ T W e x t ) during the recording period. Blue line: recorded data; red line: median, i.e., 50th percentile on weekly basis; light gray areas: band from 8th to 92th percentile; dark gray area: bands of the most extreme events, i.e., 0th to 7th percentile and 93rd to 100th percentile. (b) Difference between the showcase temperature and the glass temperature ( Δ T W g ).
Climate 12 00006 g016
Figure 17. (a) Relative humidity inside the walkway showcase during the recording period. Vertical blue segments are the (compresses) daily R H cycles. (b) Frequency distribution of the R H values inside the showcase during the monitoring period.
Climate 12 00006 g017
Figure 18. (a) Mixing ratio inside the walkway showcase during the recording period. Vertical blue segments are the (compresses) daily M R cycles. The red line is the best fit interpolation. (b) Frequency distribution of the M R inside the showcase, and in the external air, during the monitoring period.
Climate 12 00006 g018
Figure 19. (a) Difference between the relative humidity inside the walkway showcase and the external values. Colour code as in Figure 16. (b) Difference between the mixing ratio inside the walkway showcase and the external values.
Climate 12 00006 g019
Figure 20. (a) Difference between the glass temperature and the dew point inside the walkway showcase (blue lines). When the values enter the yellow band, the glass starts misting; when they enter the red band, the glass starts dewing. The red line is the best fit interpolation. (b) Percent of time in which the glass pane is transparent (i.e., no condensation), or is misting or dewing.
Climate 12 00006 g020
Figure 21. Overview of the three temperatures (walkway, tanoor, and external air) and the solar irradiation impinging on the walkway and the tanoor at the summer solstice.
Climate 12 00006 g021
Figure 22. (a) Temperature inside the tanoor showcase. Red interpolation line: annual cycle of the daily T T averages. (b) Difference between the showcase temperature and the glass temperature. Colour code as in Figure 16.
Climate 12 00006 g022
Figure 23. Overview of the mixing ratios in the walkway, tanoor, and open air, at the summer solstice.
Climate 12 00006 g023
Figure 24. (a) Mixing ratio inside the tanoor showcase. (b) Difference between the values of the M R inside the showcase and the M R of the external air. Colour code as in Figure 16.
Climate 12 00006 g024
Figure 25. (a) Relative humidity inside the tanoor showcase. (b) Difference between the values of the R H inside the showcase, and the R H of the external air. Colour code as in Figure 16.
Climate 12 00006 g025
Figure 26. (a) Difference between the glass temperature and the dew point in the Tanoor showcase. When the values enter the yellow band, the glass starts misting; when they enter the red band, the glass starts dewing. (b) Percent of time in which the glass pane is transparent (i.e., no condensation), or is misting or dewing.
Climate 12 00006 g026
Figure 27. Inclination of the solar beams on the first day of every month, January to June (left box) and July to December (right box). Yellow circles: single months; red circles: solstices.
Climate 12 00006 g027
Figure 28. Efficiency of a vertical or a horizontal shield at the winter solstice (a,b) and the summer solstice (c,d), on a north–south cross section, at noon. (a) Winter solstice and horizontal shield; the solar beams (red arrow) are inclined (i.e., H = 42.44 ) and the showcase is reached by them. (b) Winter solstice and vertical shield, the showcase is shaded. (c) Summer solstice and horizontal shield; the Sun is overhead (i.e., H = 89.14 ) and the showcase is shaded. (d) Summer solstice and vertical shield; the Sun is overhead and the showcase is reached by the solar radiation. (e) A combination of a vertical and horizontal shield. (f) Wider horizontal shield, extended towards the southern side. (g) An inclined shield may constitute a good solution, equivalent to the combination of a vertical and horizontal shield, as in (e). (h) Shade obtained in the pergola using slats angled 45 , i.e., normal to the winter beams, and at the same time able to stop the vertical beams in summer.
Climate 12 00006 g028
Figure 29. (a) Solar radiation passing at noon through the louvred panels, crossing the gaps between the slates (left scale) and stopped by the slates (right scale). Circles indicate the first day of the month, e.g., J: 1st January; F: 1st February, and so on. (b) An example of the walkway near noon in mid-May or mid-July, when 80% of the radiation passes through the ceiling and 20% is stopped. (c) Overview of the solar radiation passing through the louvred ceiling and the projected shade on the walkway floor on selected dates of the calendar year.
Climate 12 00006 g029
Figure 30. Solar spectral irradiance outside the atmosphere (upper line) and the quantity that reaches the Earth surface at sea level, after absorption and scattering. UV: ultraviolet from 300 to 380 nm; VL: visible light from 380 to 780 nm); NIR: near-infrared from 780 nm to 2300 nm (adapted from [48].).
Climate 12 00006 g030
Table 1. Technical characteristics of the used sensors.
AcronymVariableUnitMeasuring PrincipleRangeAccuracyIntervalStandard
Ttemperature Cresistance
(Pt 100)
40 ÷ 75 C ± 0.25 C
± 0.2 C
± 0.25 C
40 C  to  0 C
0 C  to  70 C
70 C  to  75 C
EN 15758
R H relative humidity%capacitive 0 % ÷ 100 % ± 2.5 %
± 5 %
± 5 %
10% to 90%
below 10%
above 90%
EN 16242
S M C soil moisture content% (VWC)dielectric (70 Mhz)0% to 55% (volumetric) ± 3.1 % 0 C to 50 C EN 16682
Disclaimer/Publisher’s Note: The statements, opinions and data contained in all publications are solely those of the individual author(s) and contributor(s) and not of MDPI and/or the editor(s). MDPI and/or the editor(s) disclaim responsibility for any injury to people or property resulting from any ideas, methods, instructions or products referred to in the content.

