Towards a Flood Assessment Product for the Humanitarian and Disaster Management Sectors Based on GNSS Bistatic Radar Measurements
Abstract
:1. Introduction
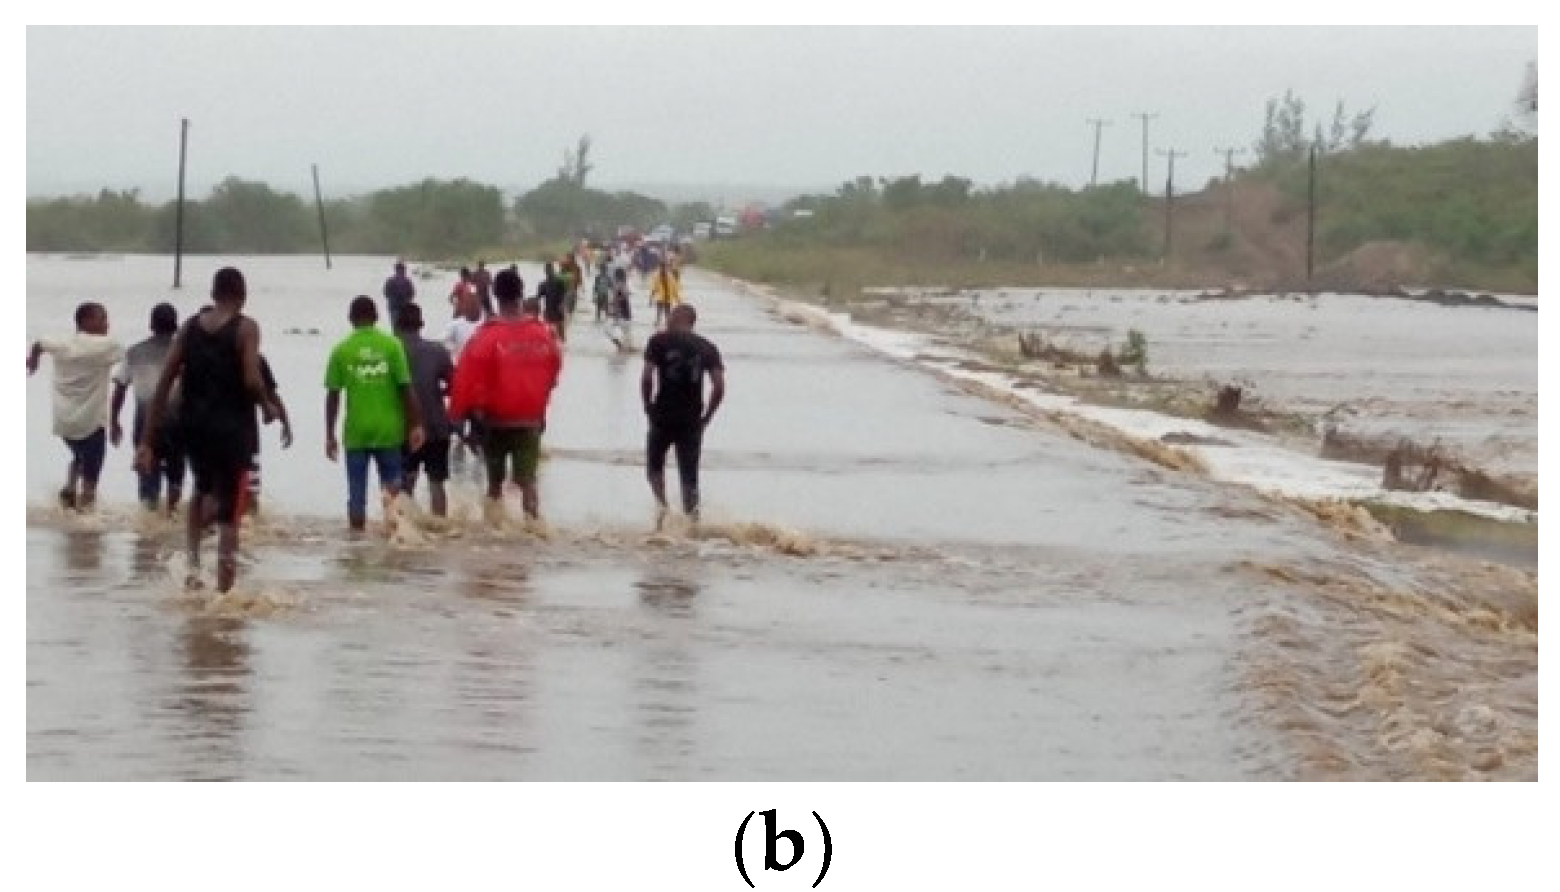
- The Mozambique floods in 2019, caused by two consecutive tropical cyclones (Idai and Kenneth), leading to casualties, however, the majority were not caused by the storm surge flooding, but rather by both inland riverine flooding and urban/peri-urban flash flooding days after landfall [28];
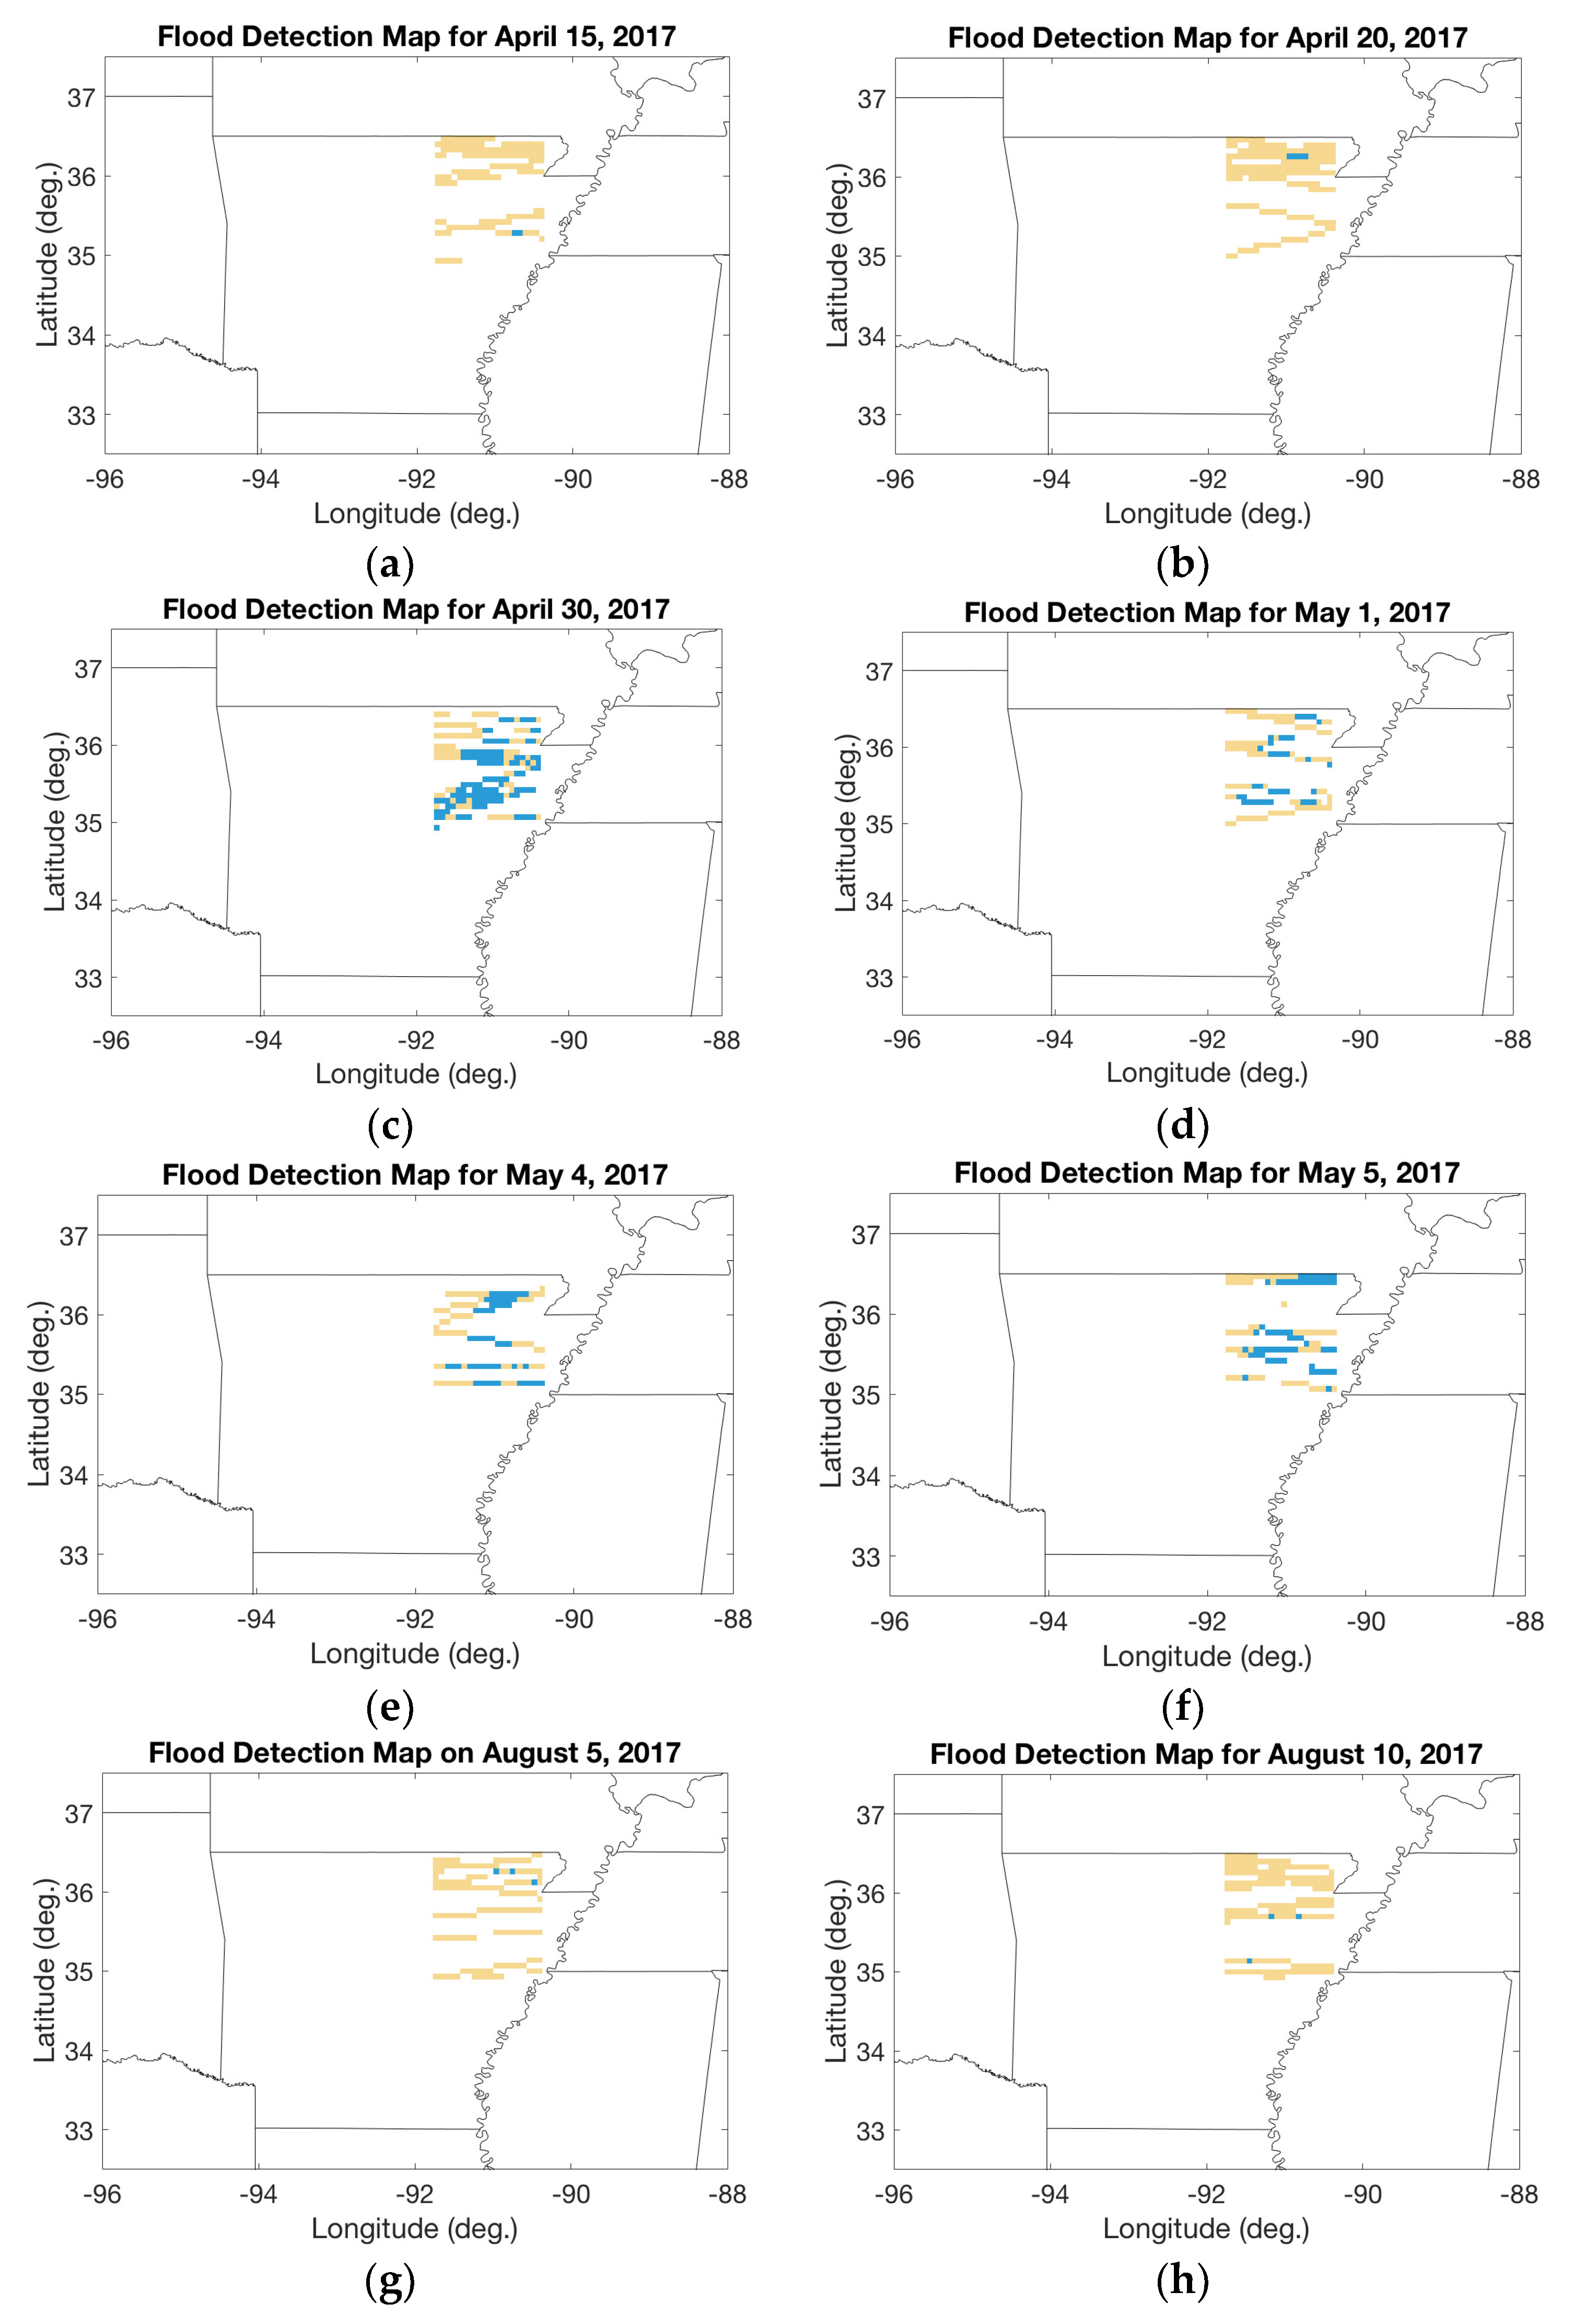
- The Midwest spring floods in 2017, an example of pluvial floods where the primary cause was recurrent intense rain that the ground could not absorb.
2. The Collaboration between Technology, Science, and the Humanitarian Sectors
3. The Technological and Science Component
- Temporal resolution in the order of 1 day. This is key to capturing fast-occurring events, such as flash floods.
- Spatial resolution in the order of 500 m to 1 km. This is key to capturing flooding events at a local scale.
- Selecting measurement directly linked to the presence of standing water.
- Analyze the landscapes in terms of their unique characteristics.
- Use the feedback from the humanitarian sectors to flag false positives from the TSH flood product.
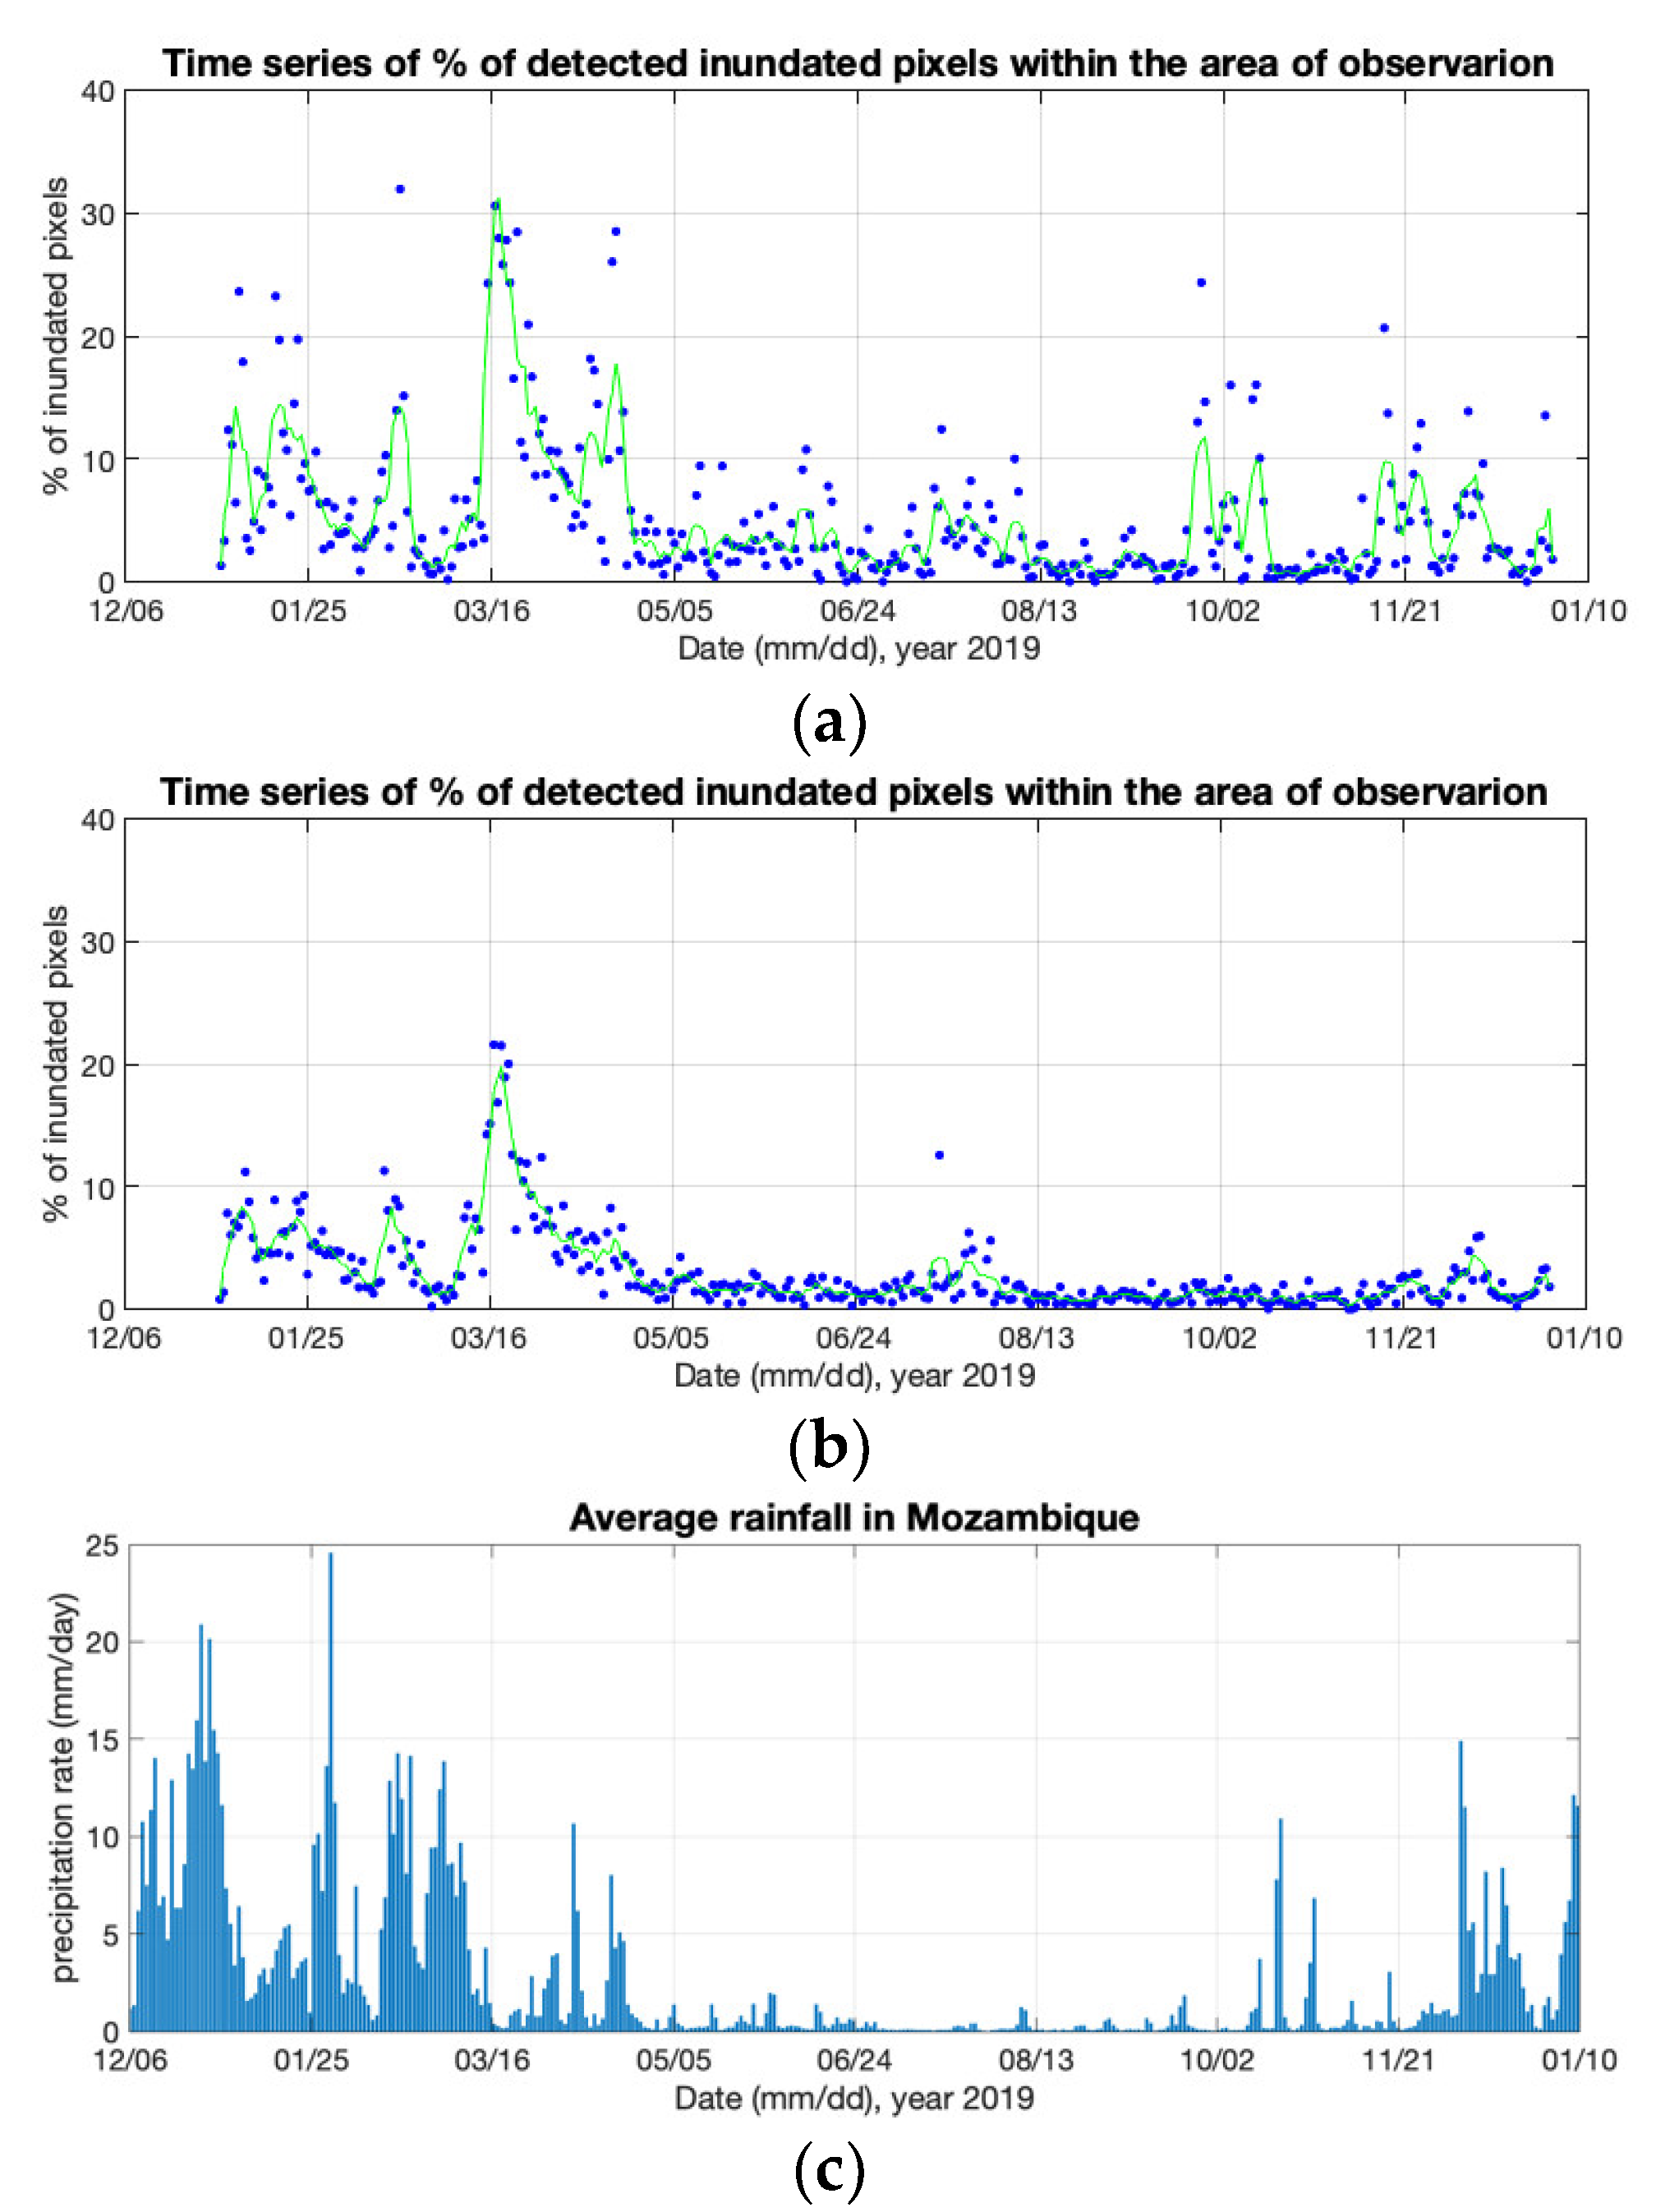
- Provide the number of pixels flooded in a certain area.
- Correlate the inundated pixels with precipitation events in the area.
- Provide a way to understand how the soil is recovered from a flood.
3.1. Technology: The Bistatic Radar Dataset
3.2. Science: The Bistatic Radar Signal Processing
3.2.1. GNSS-R Observables
- The peak value of the reflectivity, which ideally corresponds to the maximum value of the reflectivity and is related to the dielectric properties of the surface.
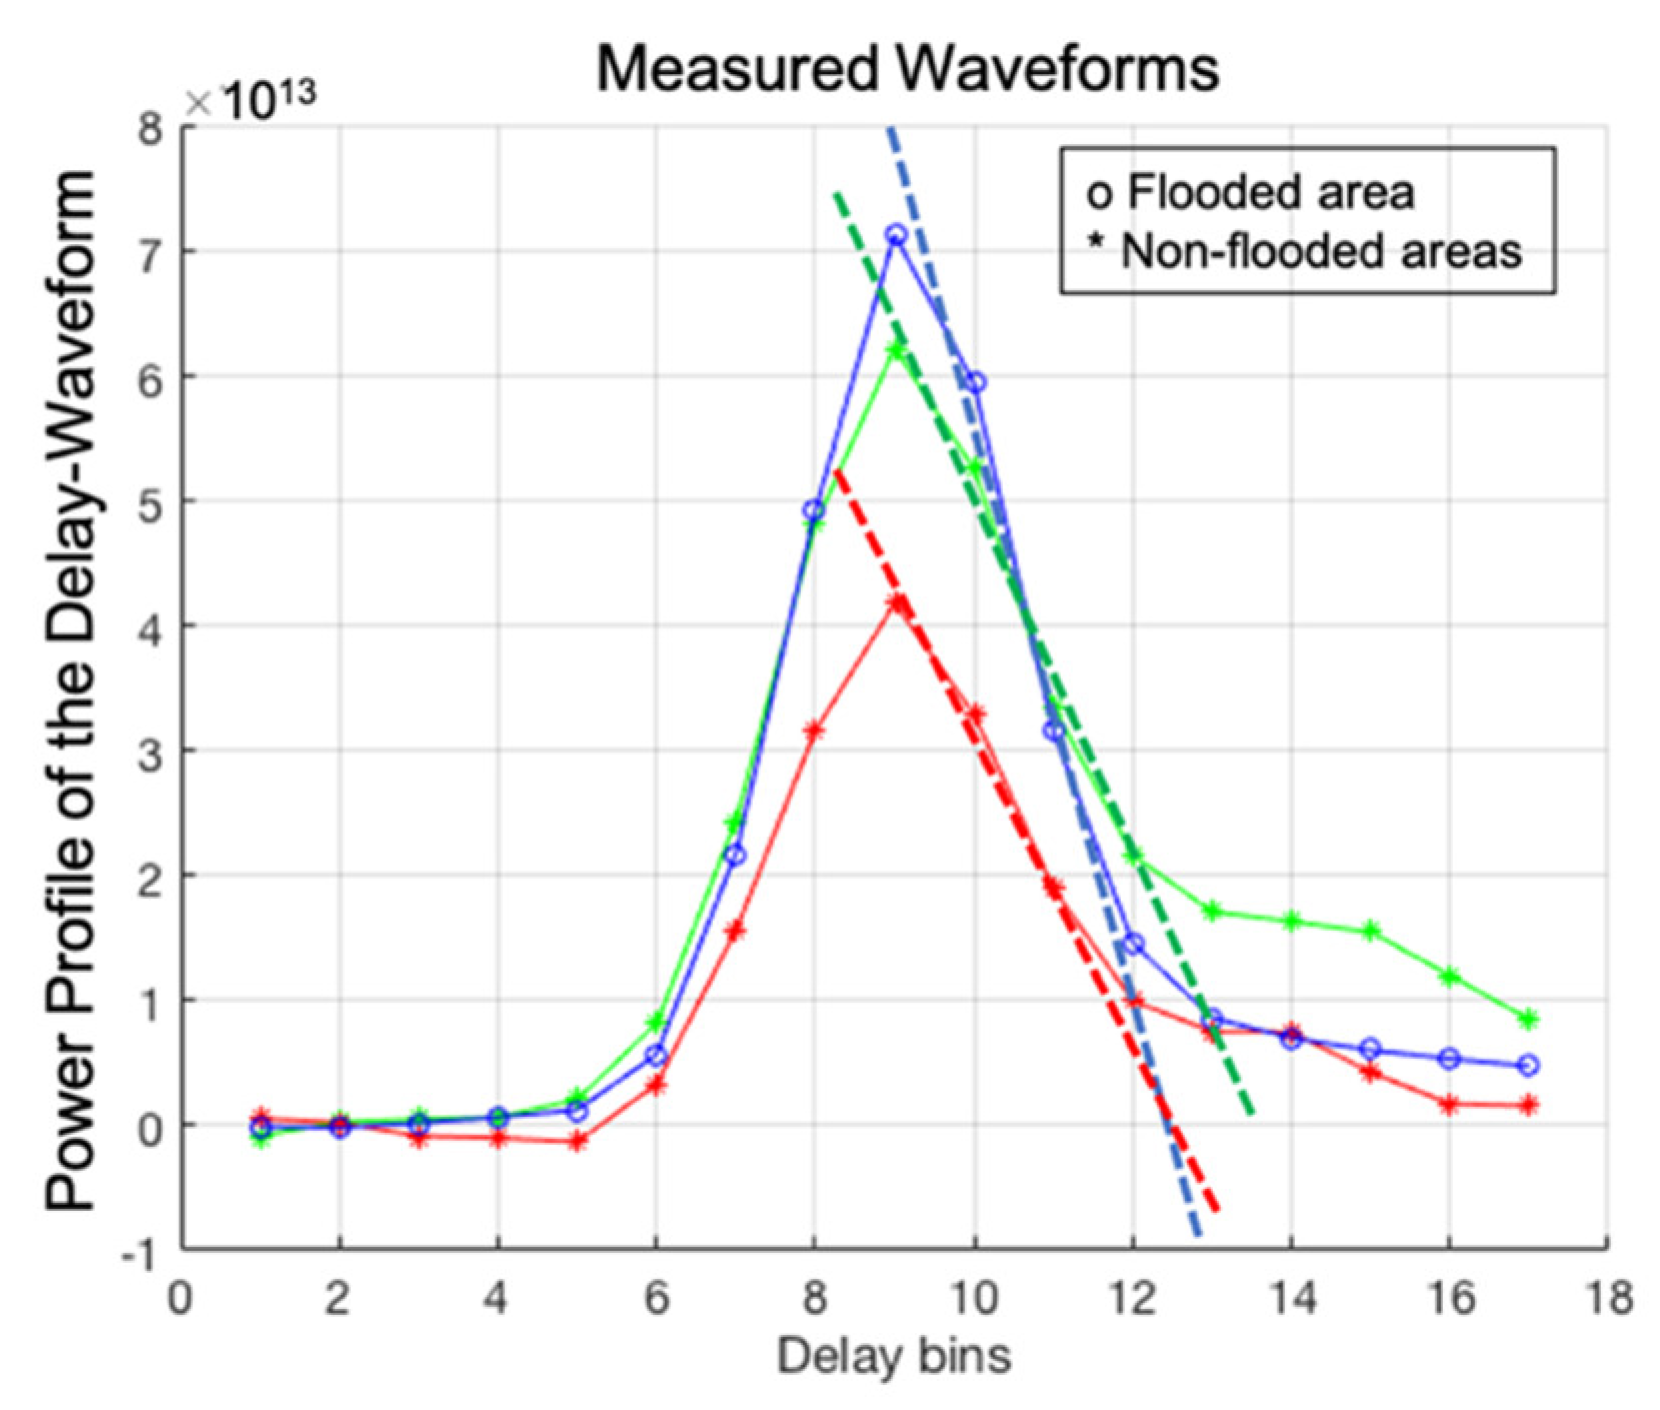
- The trailing-edge slope (TES), which describes the shape of the reflectivity DDM and is computed as the slope to the right of the maximum value of the reflectivity DDM integrated in the Doppler domain (referred to as Integrated Doppler Waveform (IDW) or simply delay-waveform in the literature).
3.2.2. Considerations and Steps of the Classification Algorithm
- A gridding strategy is designed where each measurement is mapped onto the surface with its particular spatial resolution and then re-gridded into a grid cell of 3 km × 3 km, averaging overlapped areas within the same grid pixel.
- CYGNSS data is averaged at 1 s incoherent time, as the new 0.5 s data was not yet available.
- Each 3 km × 3 km pixel within the area under observation is considered independent.
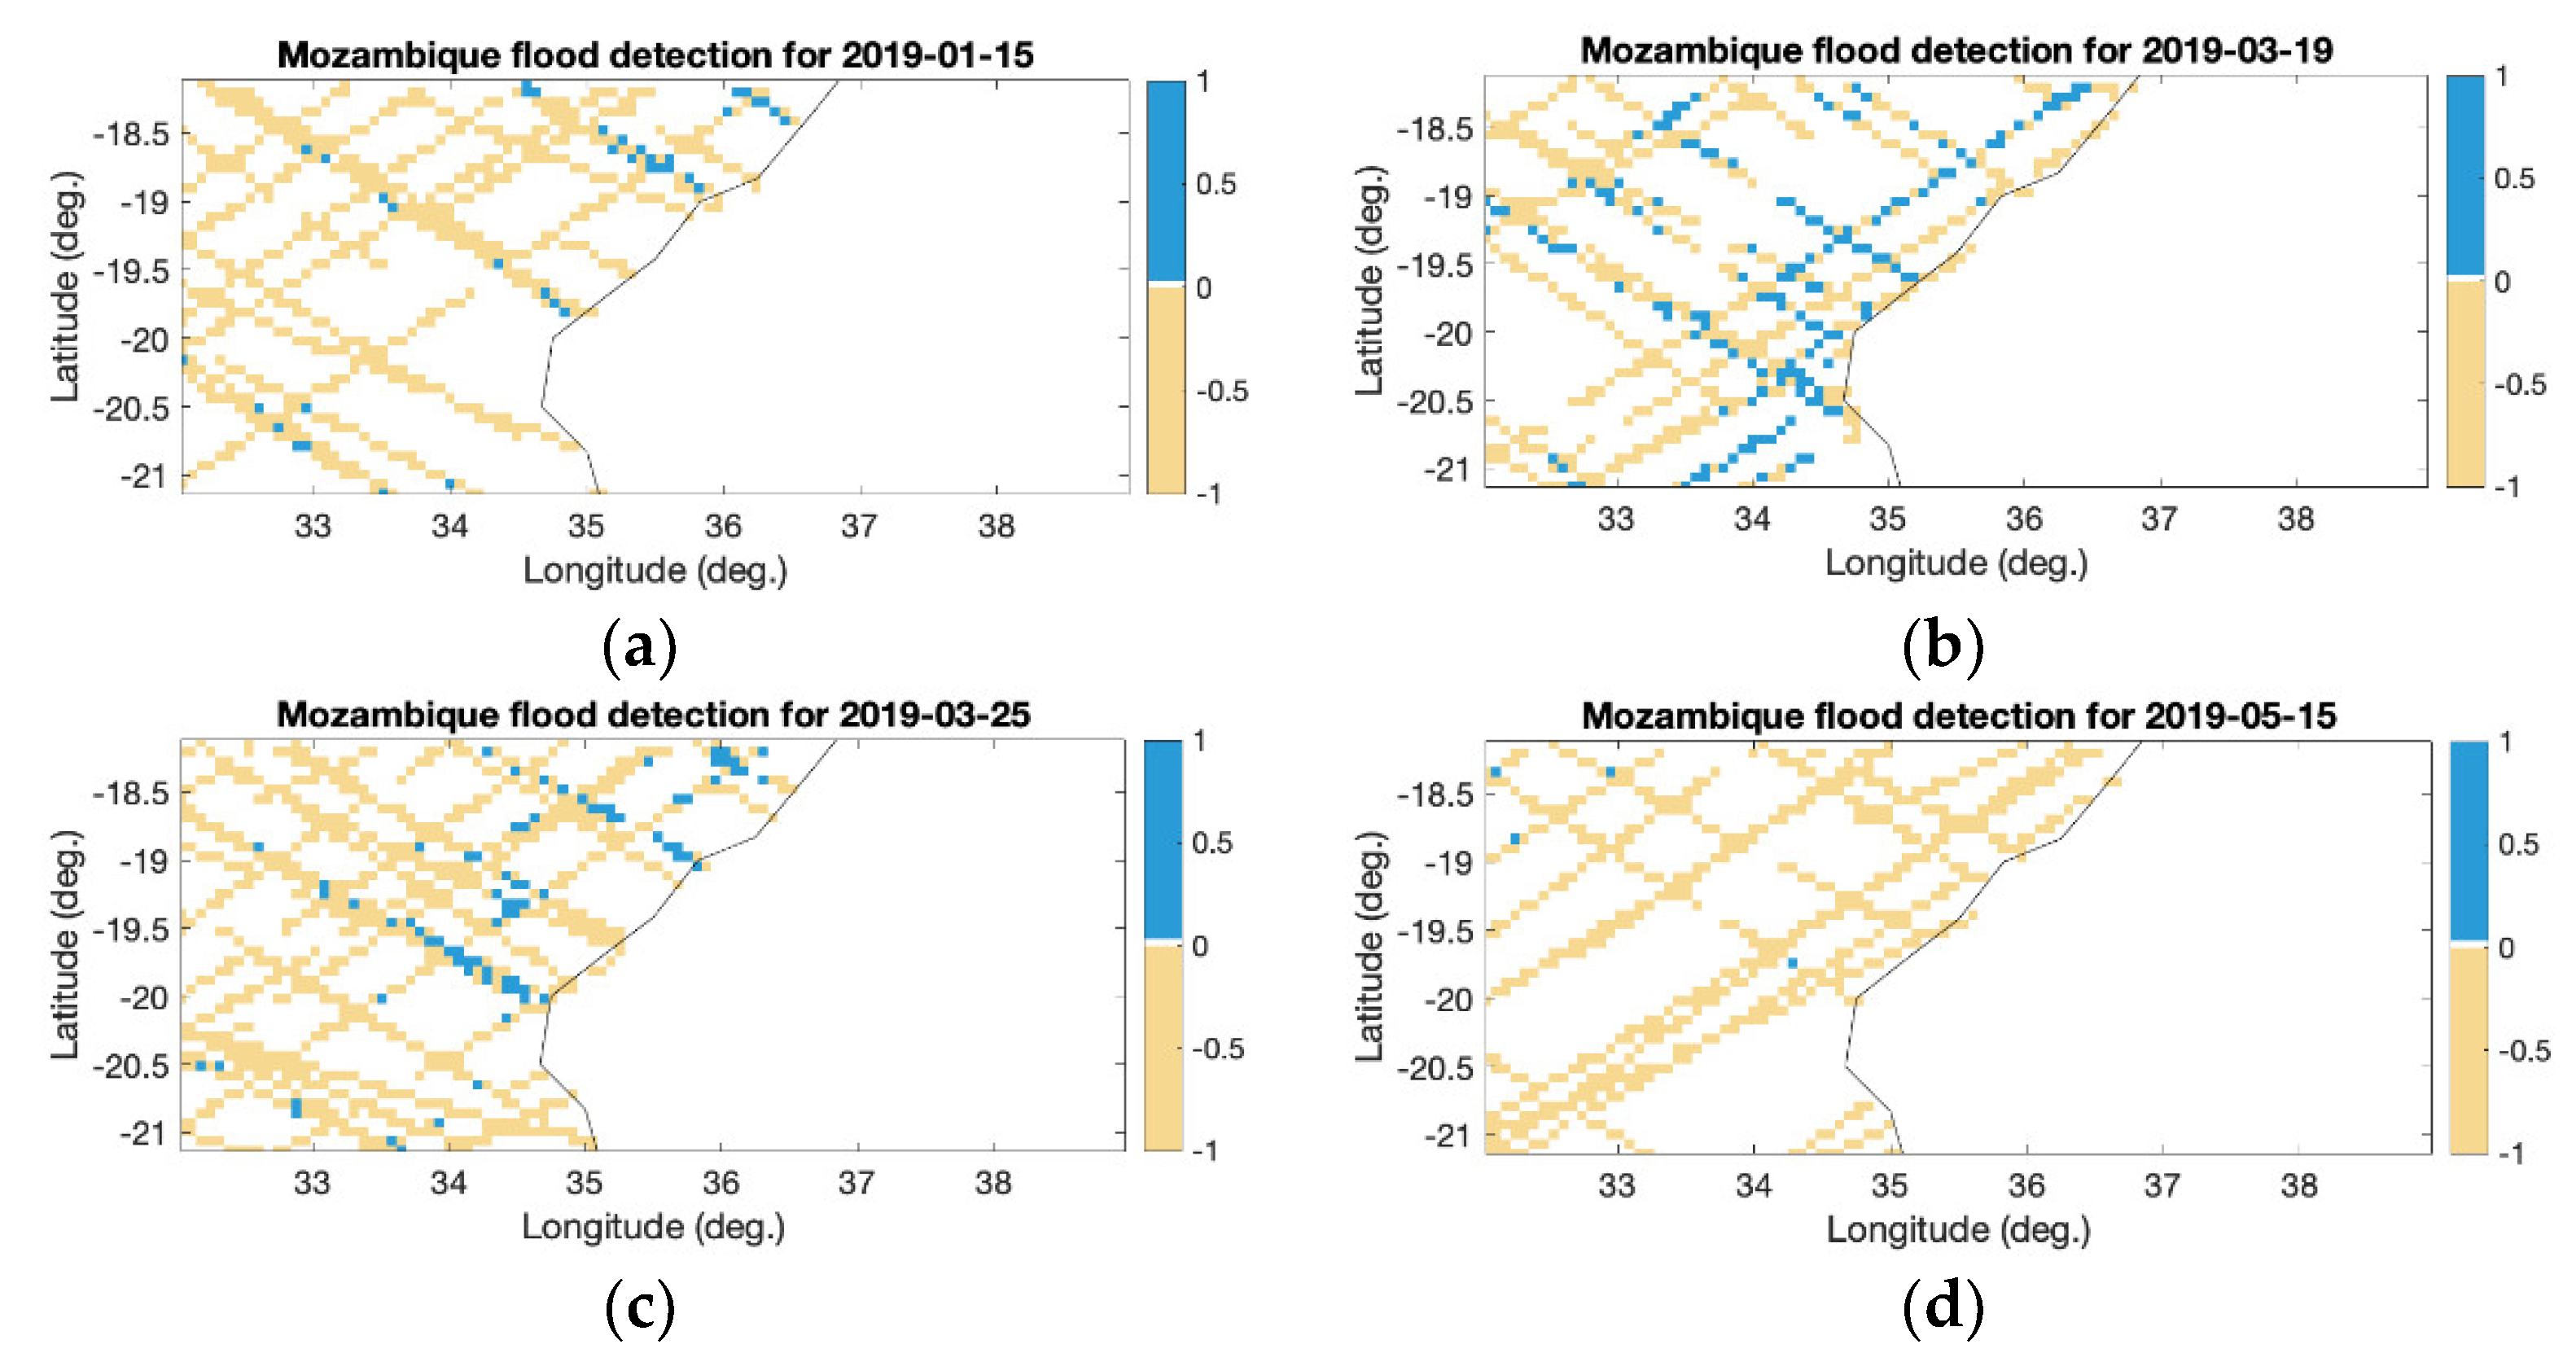
- A 1 or 0 value is assigned to each pixel, being 1 = flooded and 0 = non-flooded.
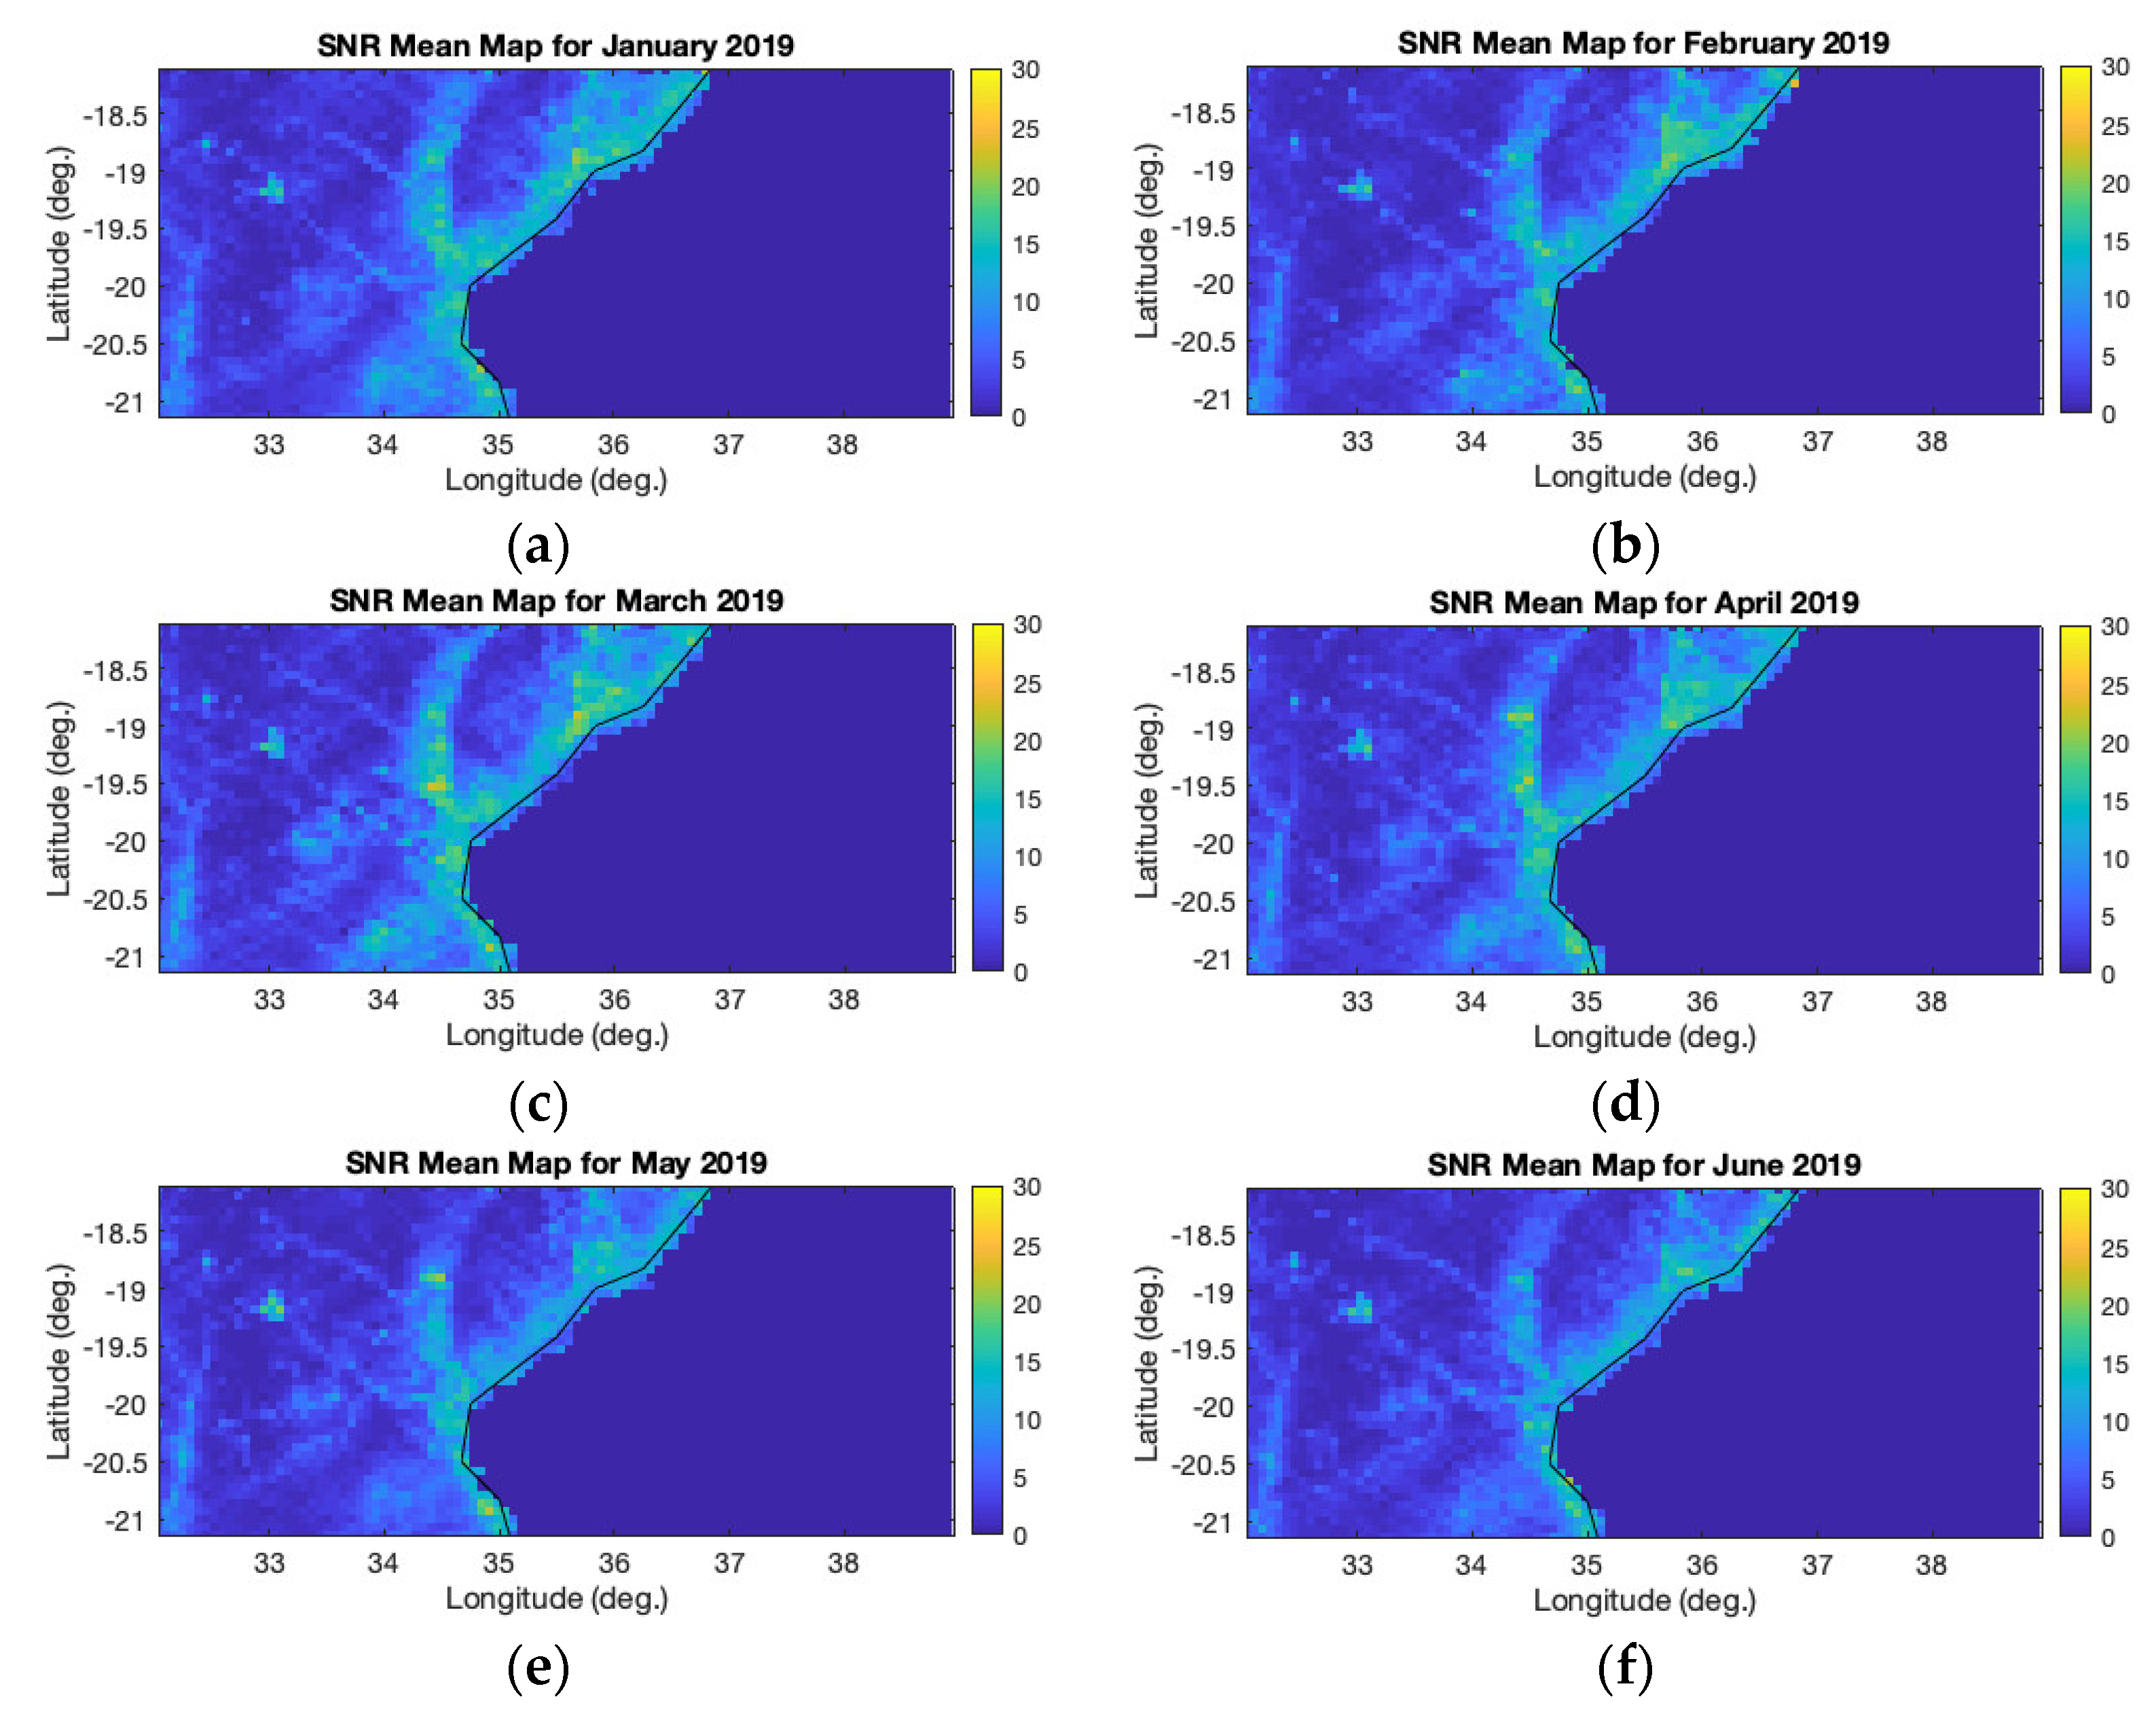
- The best indicator is assumed to be the shape of the waveform, as discussed in Section 3.2.1, but still signal strength is used in combination. The selected observables are therefore TES and the peak SNR. When an SNR increase is observed with respect to previous measurements over the same area, it is indicative of the potential presence of standing water. Therefore, as long as peak SNR is referenced to the previous state, it will remain a good contributor to flooding detection. Steeper (increased) TES indicates an increased likelihood of standing water, and thus being indicative of flooding. Measurements coming from an area producing increased coherent scattering will potentially contain scattering signatures of the standing water. This observable also becomes stronger when referenced to values of the same area at previous instants of time.
- SNR is calibrated using Equation (2). TES is produced from non-normalized waveforms considering the power increase along with the slope. We discarded normalization to avoid equalizing the inhomogeneity of the scene.
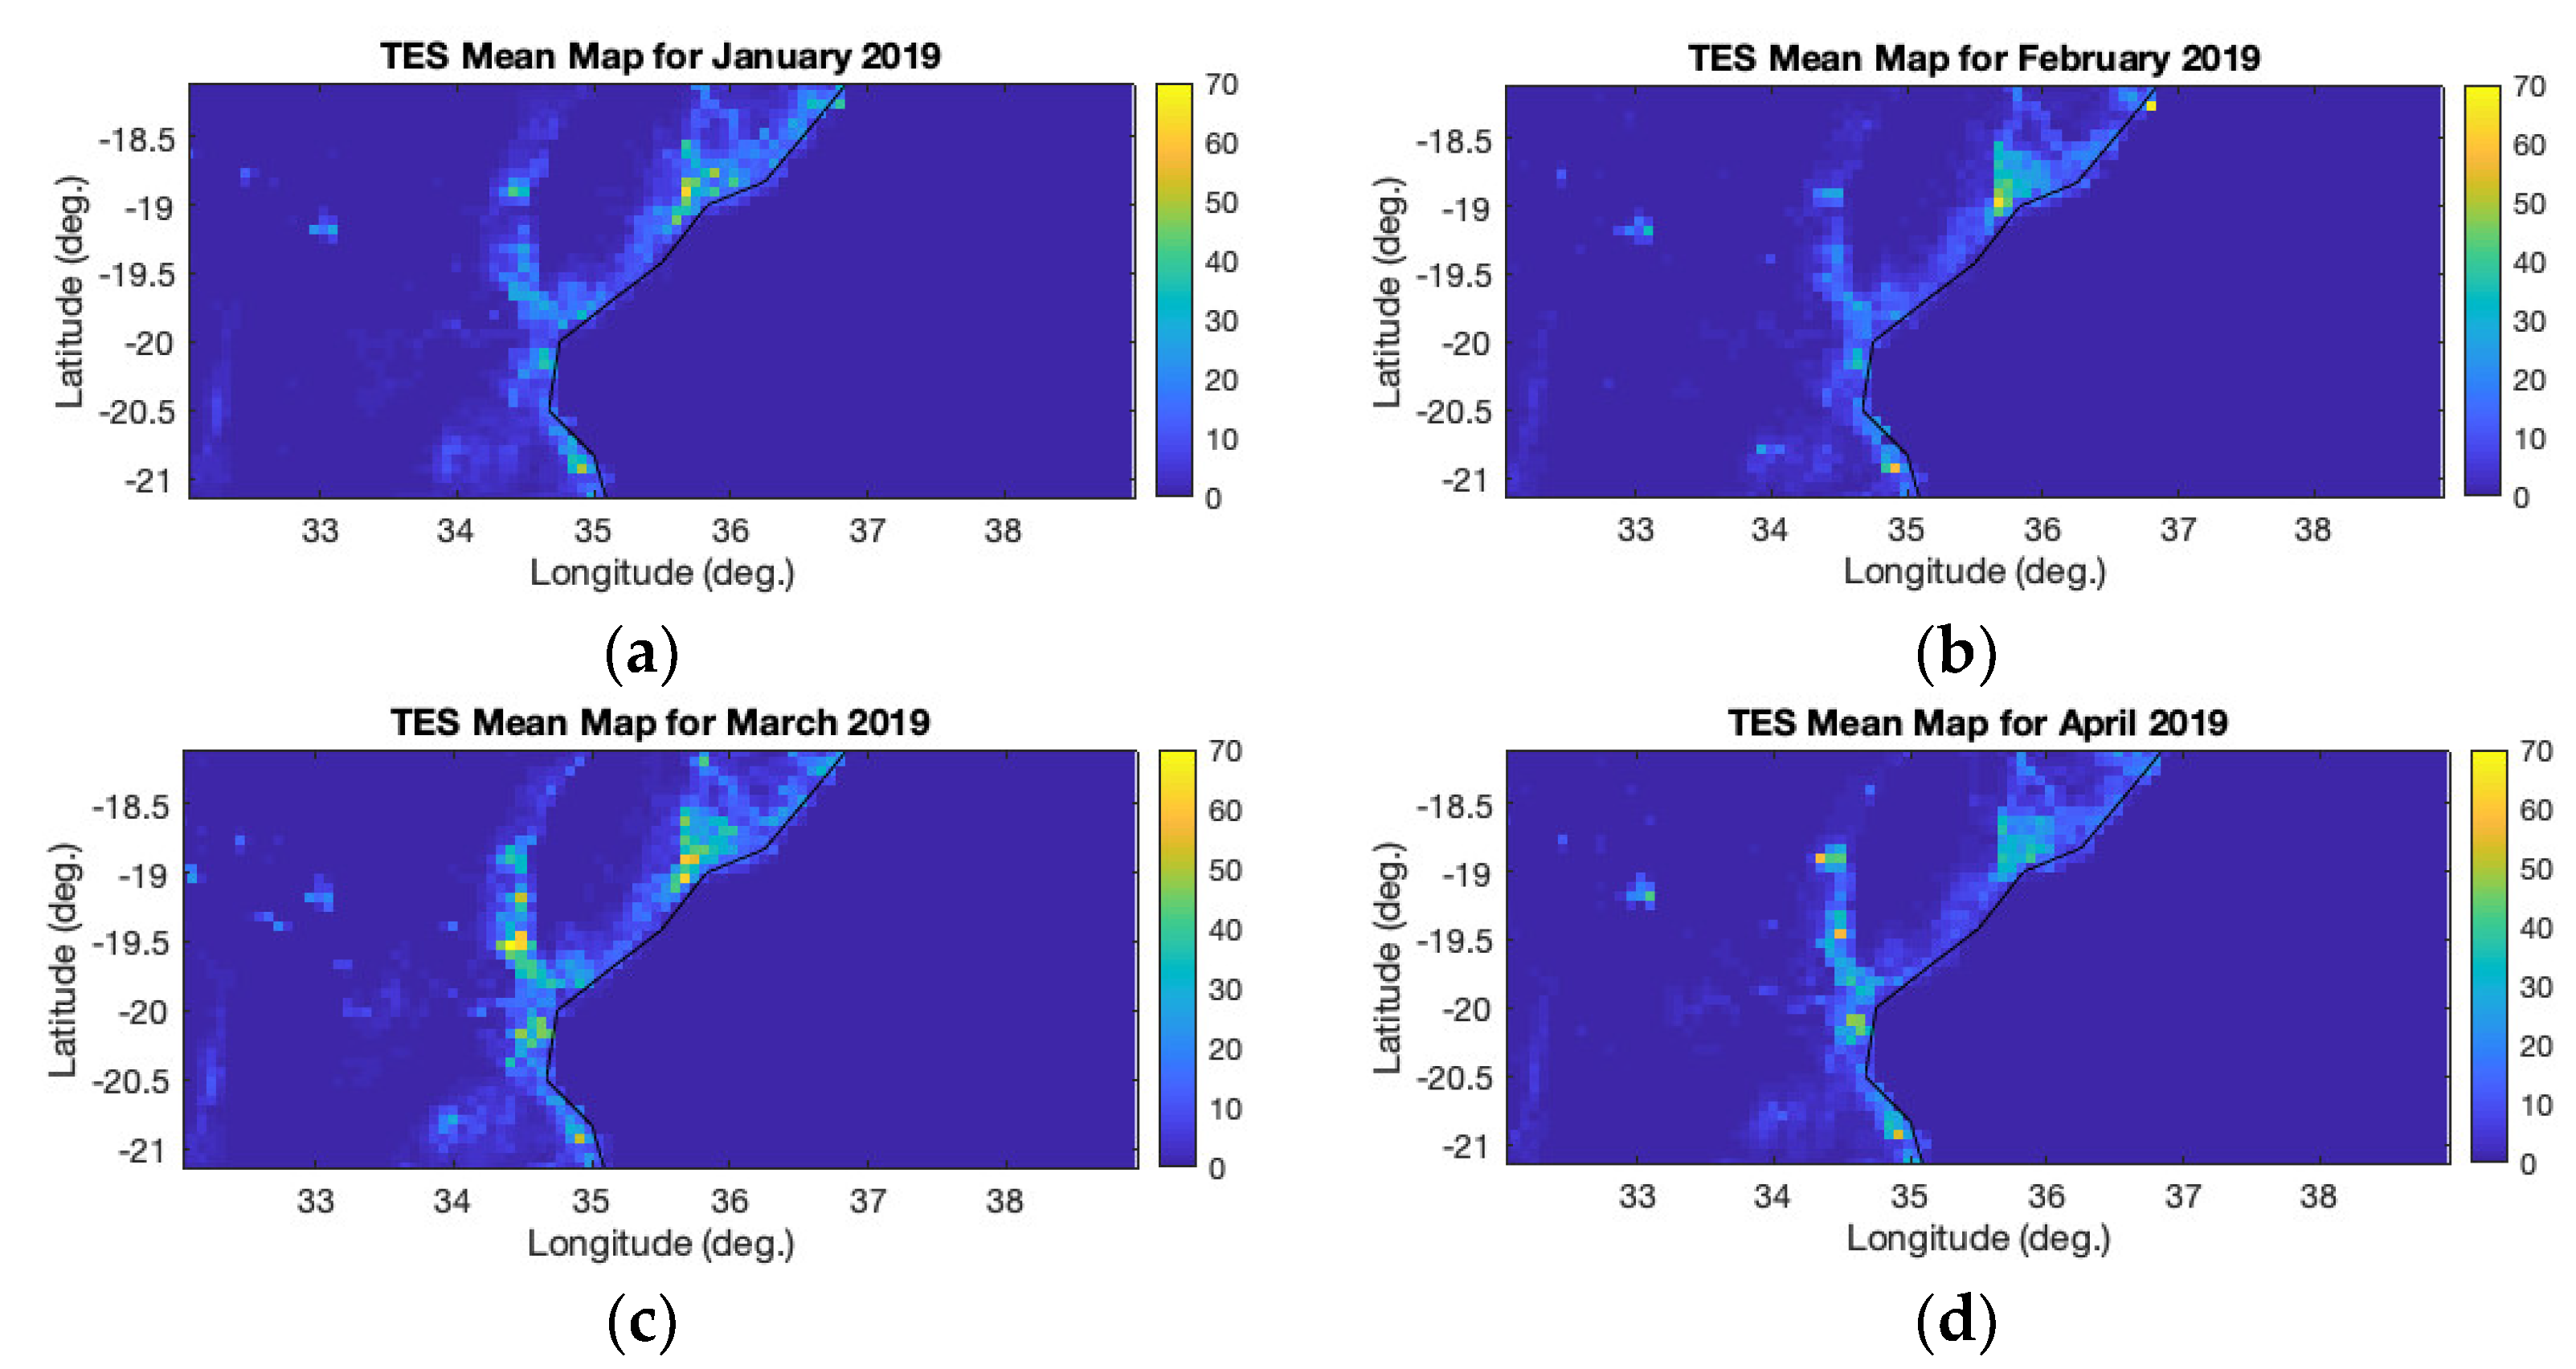
- On a daily basis, 2-D maps in latitude and longitude coordinates of SNR and TES values are created for the area under study.
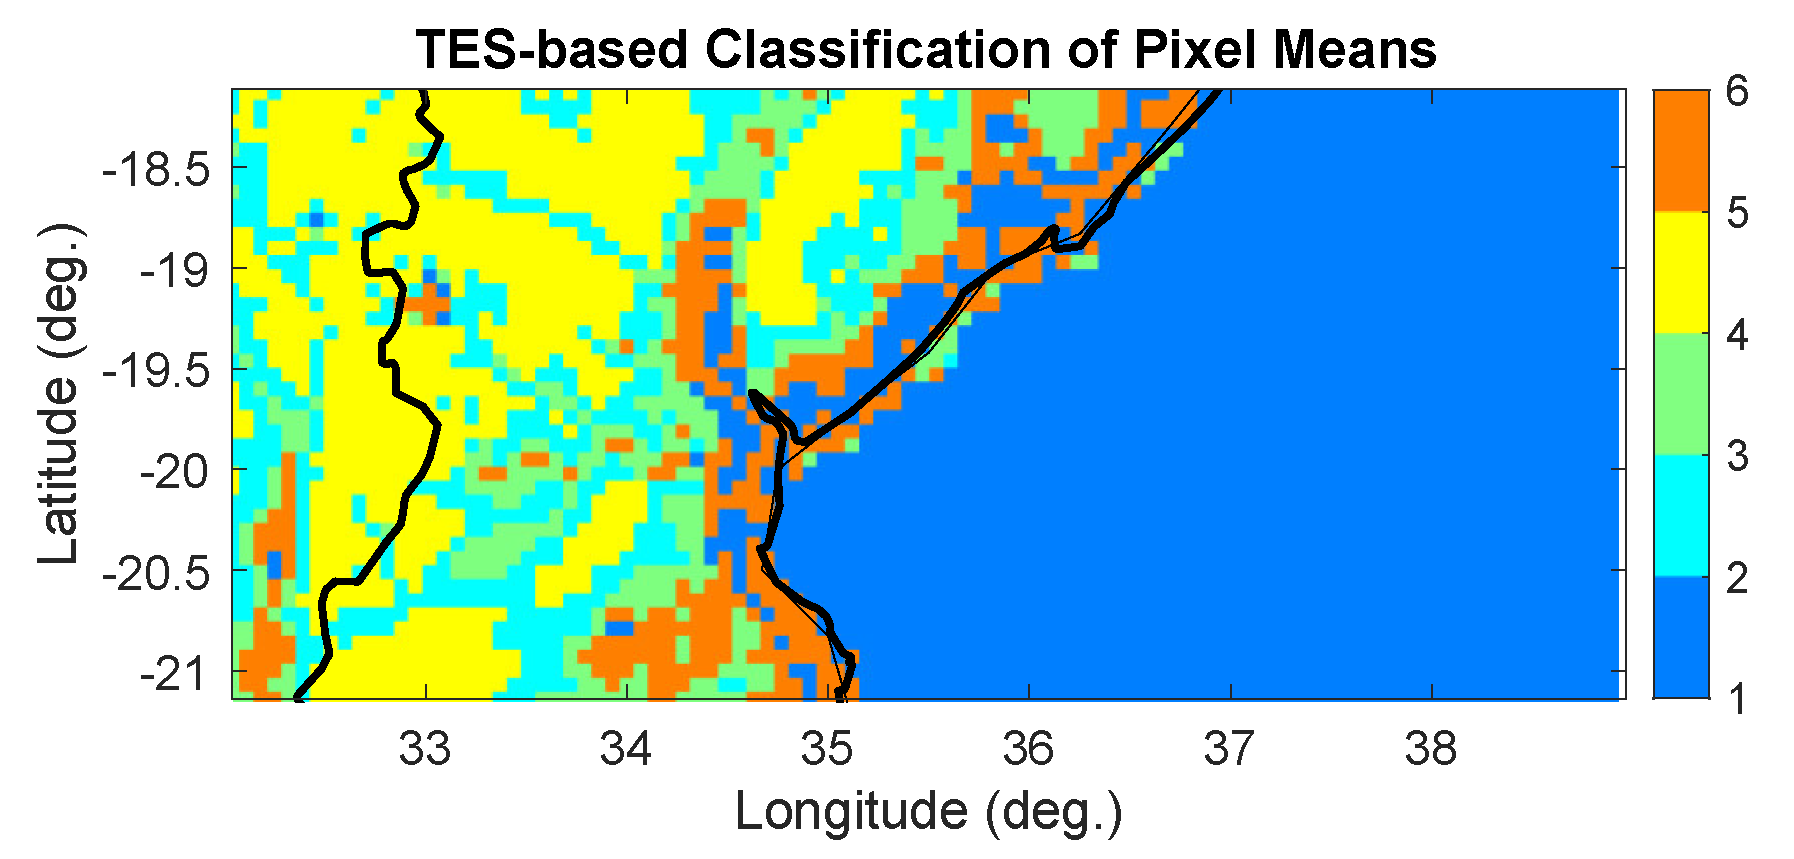
- The 2-D SNR and 2-D TES maps in latitude and longitude coordinates are then analyzed during a whole year to classify the variety of pixels involved in the scene. For this, we use a k-means algorithm [51] that takes in the pixel’s values of the area under study for one whole year and classifies them. The selected number of classes is 6.
- For each class we compute the mean and the standard deviation and set a threshold, computed as the mean plus two sigma, 2-D threshold maps for both SNR and TES variables. This step provides reference values to inform decisions on whether peak SNR increase or TES steepness originates from the presence of standing water.
- The 2-D SNR and 2-D TES maps are then subtracted from the corresponding 2-D threshold maps. Positive values are assigned to flooded pixels and negative values are assigned to non-flooded pixels, generating 2-D maps in latitude and longitude coordinates of flooded and non-flooded pixels.
3.2.3. The Flood Classification Algorithm Main Element: K-Means Clustering
3.3. Case Study 1: Results for 2019 Mozambique Floods
3.3.1. Background
3.3.2. Data Analysis
3.4. Case Study 2: The US Midwest Spring Floods—Northeast Arkansas
3.4.1. Background
3.4.2. Data Analysis
3.4.3. Validation of Floods in Arkansas
4. The Humanitarian Component
4.1. The Translator Role
4.2. The Decision-Maker Role
5. Discussion
5.1. On the Usefulness of Signals-of-Opportunity
5.2. On the Benefit of Multi-Sensor Information
5.3. On the Co-Development of Comprehensive Flood Risk Products
6. Conclusions
Author Contributions
Funding
Institutional Review Board Statement
Informed Consent Statement
Data Availability Statement
Acknowledgments
Conflicts of Interest
Appendix A
- A power threshold is applied to the DDM in order to estimate the area from which the scattering signal is coming from. In order to set a threshold, most of the area representing the total power needs to be accounted for. We select a threshold that gathers the N% of the total power, N being an arbitrary number. According to the results in [34], a threshold of 80% is recommended.
- Map the delay and Doppler values into the surface, drawing the iso-delay and Doppler lines. Both delay and Doppler provide the exact area of the scattering considered. For the sake of simplicity, we use the delay value alone, which translates to an ellipse in the surface. Therefore, the delay gathering 80% of the power is transformed into an ellipse of constant delay on the surface (iso-delay line). The size of the scattering area is set to the semi-major axis of the computed ellipse to represent the scattering area of that particular measurement. The summary table provided in [38] is annexed here in Appendix B, Table A1, for completeness.
- The ellipse is centered in the specular point and is rotated to the scattering plane formed by the receiver and transmitter geometries, with the semi-major ellipse axis aligned with the scattering plane and the semi-minor axis perpendicular to it.
- The ellipse is then elongated by the distance obtained by multiplying the integration time by the velocity of the satellite in the along-track direction.
- The final elongated ellipse is mapped onto the surface with a fine enough grid that allows the delineation of the shape of an ellipse.
Appendix B
| Scenario | N = 80% | N = 75% | N = 70% | N = 65% | N = 60% | |||||
|---|---|---|---|---|---|---|---|---|---|---|
| Sea Ice | 2.8 | 0.9 | 2.4 | 0.8 | 2.1 | 0.6 | 1.8 | 0.3 | 1.8 | 0.25 |
| Lake | 2.7 | 0.8 | 2.6 | 0.9 | 2.3 | 0.7 | 1.5 | 0.25 | 1.5 | 0.26 |
| Wetland | 9.6 | 2.8 | 3.3 | 1.4 | 2.8 | 0.5 | 2.4 | 0.34 | 2.1 | 0.28 |
| Arid Land | 13.3 | 5.8 | 6.4 | 4.2 | 5.3 | 2.6 | 4.9 | 2.3 | 4.3 | 2.4 |
| Low Vegetation | 20.2 | 6.6 | 12.5 | 5.6 | 12.1 | 4.2 | 11.9 | 3.9 | 8.6 | 3.3 |
| High Vegetation | 43.1 | 7.3 | 38.9 | 6.5 | 26.6 | 4.5 | 26.2 | 4.1 | 23.5 | 8.5 |
| Ocean | 45.3 | 8.4 | 44.8 | 7.9 | 44.6 | 7.6 | 42.3 | 6.8 | 41.1 | 6.4 |
Appendix C
| Quality Flag | Flagged in Analysis |
|---|---|
| Poor Overall Quality | No |
| S Band Powered Up | Yes |
| Small Spacecraft Attitude Error | No |
| Large Spacecraft Attitude Error | Yes |
| Blackbody DDM | Yes |
| DDMI Reconfigured | Yes |
| Space wire CRC Invalid | Yes |
| DDM is Test Patten | Yes |
| Channel Idle | Yes |
| Low Confidence DDM Noise Floor | No |
| SP Over Land | No |
| SP Very Near Land | No |
| SP Near Land | No |
| Large Step Noise Floor | No |
| Direct Signal in DDM | Yes |
| Low Confidence GPS EIRP Estimate | Yes |
| RFI Detected | Yes |
| BRCS DDM SP Bin Delay Error | No |
| BRCS DDM SP Bin Doppler Error | No |
| Negative BRCS Value Used for NRBCS | No |
| GPS PVT SP3 Error | No |
| SP Non-Existent Error | Yes |
| BRCS LUT Range Error | No |
| Antenna Data LUT Range Error | No |
| Blackbody Framing Error | Yes |
| FSW Comp Shift Error | No |
References
- Jonkman, S.N.; Vrijling, J.K. Loss of life due to floods. J. Flood Risk Manag. 2008, 1, 43–56. [Google Scholar] [CrossRef]
- Du, W.; FitzGerald, G.J.; Clark, M.; Hou, X.Y. Health impacts of floods. Prehospital Disaster Med. 2010, 25, 265–272. [Google Scholar] [CrossRef] [PubMed]
- Fiorillo, E.; Crisci, A.; Issa, H.; Maracchi, G.; Morabito, M.; Tarchiani, V. Recent changes of floods and related impacts in Niger based on the ANADIA Niger flood database. Climate 2018, 6, 59. [Google Scholar] [CrossRef] [Green Version]
- Morán-Tejeda, E.; Fassnacht, S.R.; Lorenzo-Lacruz, J.; López-Moreno, J.I.; García, C.; Alonso-González, E.; Collados-Lara, A.J. Hydro-meteorological characterization of major floods in Spanish mountain rivers. Water 2019, 11, 2641. [Google Scholar] [CrossRef] [Green Version]
- Demeritt, D.; Nobert, S.; Cloke, H.; Pappenberger, F. Challenges in communicating and using ensembles in operational flood forecasting. Meteorol. Appl. 2010, 17, 209–222. [Google Scholar] [CrossRef]
- Doswell, C.A.; Brooks, H.E.; Maddox, R.A. Flash Flood Forecasting: An Ingredients-Based Methodology. Weather Forecast. 1996, 11, 560–581. [Google Scholar] [CrossRef]
- Lowrie, C.; Kruczkiewicz, A.; McClain, S.N.; Nielsen, M.; Mason, S.J. Evaluating the usefulness of VGI from Waze for the reporting of flash floods. Sci. Rep. 2022, 12, 1–13. [Google Scholar] [CrossRef]
- Revilla-Romero, B.; Hirpa, F.A.; Pozo, J.T.D.; Salamon, P.; Brakenridge, R.; Pappenberger, F.; De Groeve, T. On the use of global flood forecasts and satellite-derived inundation maps for flood monitoring in data-sparse regions. Remote Sens. 2015, 7, 15702–15728. [Google Scholar] [CrossRef] [Green Version]
- Winseminus, H.C.; Van Beek, L.P.H.; Jongman, B.; Ward, P.J.; Bouwman, A. A framework for global river flood risk assessment. Hydrol. Earth Syst. Sci. 2013, 17, 1871–1892. [Google Scholar] [CrossRef] [Green Version]
- Kumar, S.V.; Harrison, K.W.; Peters-Lidard, C.D.; Santanello, J.A., Jr.; Kirschbaum, D. Assessing the Impact of L-Band Observations on Drought and Flood Risk Estimation: A Decision-Theoretic Approach in an OSSE Environment, NASA Soil Moisture Active Passive (SMAP)—Pre-launch Applied Research Special Collection. J. Hydrometeorol. 2014, 15, 2140–2156. [Google Scholar] [CrossRef]
- Wentz, F.J. A well-calibrated ocean algorithm for SSM/I. J. Geophys. Res. 1997, 102, 8703–8718. [Google Scholar] [CrossRef] [Green Version]
- Kerr, Y.H.; Waldteufel, P.; Wigneron, J.P.; Martinuzzi, J.M.; Font, J.; Berger, M. Soil moisture retrieval from space: The Soil Moisture and Ocean Salinity (SMOS) mission. IEEE Trans. Geosci. Remote Sens. 2001, 39, 1729–1735. [Google Scholar] [CrossRef]
- Entekhabi, D.; Yueh, S.; O’Neill, P.; Kellogg, K.; Allen, A.; Bindlish, R. SMAP Handbook; JPL Publication JPL 400-1567; Jet Propulsion Laboratory: Pasadena, CA, USA, 2014; p. 182. [Google Scholar]
- Torres, R.; Snoeij, P.; Geudtner, D.; Bibby, D.; Davidson, M.; Attema, E.; Potin, P.; Rommen, B.; Floury, N.; Brown, M.; et al. GMES Sentinel-1 mission. Remote Sens. Environ. 2012, 120, 9–24. [Google Scholar] [CrossRef]
- Rosenqvist, A.; Shimada, M.; Suzuki, S.; Ohgushi, F.; Tadono, T.; Watanabe, M.; Tsuzuku, K.; Watanabe, T.; Kamijo, S.; Aoki, E. Operational performance of the ALOS global systematic acquisition strategy and observation plans for ALOS-2 PALSAR-2. Remote Sens. Environ. 2014, 155, 3–12. [Google Scholar] [CrossRef]
- Wu, H.; Adler, R.F.; Tian, Y.; Huffman, G.J.; Li, H.; Wang, J. Real-time global flood estimation using satellite-based precipitation and a coupled land surface and routing model. Water Resour. Res. 2014, 50, 2693–2717. [Google Scholar] [CrossRef] [Green Version]
- Simpson, J.; Adler, R.F.; North, G.R. A proposed Tropical Rainfall Measuring Mission (TRMM) satellite. Bull. Am. Meteorol. Soc. 1998, 69, 278–295. [Google Scholar] [CrossRef] [Green Version]
- Near Real Time (NRT) MODIS Flood Mapping. Available online: https://floodmap.modaps.eosdis.nasa.gov (accessed on 10 January 2022).
- Brakenridge, G.R.; Anderson, E. MODIS-based flood detection, mapping, and measurement: The potential for operational hydrological applications. In Transboundary Floods: Reducing the Risks Through Flood Management; Marsalek, J., Ed.; Springer: Dordrecht, The Netherlands, 2006; pp. 1–12. [Google Scholar]
- Advanced Rapid Imaging and Analysis (ARIA) Center for Natural Hazards. Available online: https://aria.jpl.nasa.gov/about (accessed on 10 January 2022).
- Ruf, C.S.; Gleason, S.; Jelenak, Z.; Katzberg, S.; Ridley, A.; Rose, R.; Scherrer, J.; Zavorotny, V. The CYGNSS nanosatellite constellation hurricane mission. In Proceedings of the 2012 IEEE International Geoscience and Remote Sensing Symposium, Munich, Germany, 22–27 July 2012; IEEE: Piscataway, NJ, USA, 2012; pp. 214–216. [Google Scholar]
- Ruf, C.; Unwin, M.; Dickinson, J.; Rose, R.; Rose, D.; Vincent, M.; Lyons, A. CYGNSS: Enabling the Future of Hurricane Prediction. IEEE Geosci. Remote Sens. Mag. 2013, 1, 52–67. [Google Scholar] [CrossRef]
- Hammond, L.M.; Foti, G.; Gommeninger, C.; Srokosz, M. An assessment of CyGNSS v3.0 level 1 observables over the ocean. Remote Sens. 2021, 13, 3500. [Google Scholar] [CrossRef]
- Al-Khaldi, M.M.; Johnson, J.T.; Gleason, S.; Chew, C.C.; Gerlein, C.; Zuffada, C. Inland Water Body Mapping Using CYGNSS Coherence Detection. IEEE Trans. Geosci. Remote Sens. 2021, 59, 7385–7394. [Google Scholar] [CrossRef]
- Chew, C.; Reager, J.T.; Small, E. CYGNSS data map flood inundation during the 2017 Atlantic hurricane season. Sci. Rep. 2018, 8, 9336. [Google Scholar] [CrossRef]
- Wan, W.; Liu, B.; Zeng, Z.; Chen, X.; Wu, G.; Xu, L.; Chen, X.; Hong, Y. Using CYGNSS Data to Monitor China’s Flood Inundation during Typhoon and Extreme Precipitation Events in 2017. Remote Sens. 2019, 11, 854. [Google Scholar] [CrossRef] [Green Version]
- Sendai Framework for Disaster Risk Reduction. Available online: https://www.unisdr.org/we/coordinate/sendai-framework (accessed on 23 May 2019).
- Bofana, J.; Zhang, M.; Wu, B.; Zeng, H.; Nabil, M.; Zhang, N.; Elnashar, A.; Tian, F.; da Silva, J.M.; Botão, A.; et al. How long did crops survive from floods caused by Cyclone Idai in Mozambique detected with multi-satellite data. Remote Sens. Environ. 2022, 269, 112808. [Google Scholar] [CrossRef]
- Donkor, F.K.; Howarth, C.; Ebhuoma, E.; Daly, M.; Vaughan, C.; Pretorius, L.; Mambo, J.; MacLeod, D.; Kythreotis, A.; Jones, L.; et al. Climate services and communication for development: The role of early career researchers in advancing the debate. Environ. Commun. 2019, 13, 561–566. [Google Scholar] [CrossRef]
- Enenkel, M.; Kruczkiewicz, A. The humanitarian sector needs clear job profiles for climate science translators–more than ever during a pandemic. Bull. Am. Meteorol. Soc. 2022, 103, E1088–E1097. [Google Scholar] [CrossRef]
- Alfieri, L.; Cohen, S.; Galantowicz, J.; Schumann, G.J.; Trigg, M.A.; Zsoter, E.; Prudhomme, C.; Kruczkiewicz, A.; de Perez, E.C.; Flamig, Z.; et al. A global network for operational flood risk reduction. Environ. Sci. Policy 2018, 84, 149–158. [Google Scholar] [CrossRef]
- Kruczkiewicz, A.; Bucherie, A.; Ayala, F.; Hultquist, C.; Vergara, H.; Mason, S.; Bazo, J.; De Sherbinin, A. Development of a flash flood confidence index from disaster reports and geophysical susceptibility. Remote Sens. 2021, 13, 2764. [Google Scholar] [CrossRef]
- Hagen, J.S.; Cutler, A.; Trambauer, P.; Weerts, A.; Suarez, P.; Solomatine, D. Development and evaluation of flood forecasting models for forecast-based financing using a novel model suitability matrix. Prog. Disaster Sci. 2020, 6, 100076. [Google Scholar] [CrossRef]
- Pache, A.; Probst, P.; Bey, I.; Röösli, T.; Bresch, D.N.; Kruczkiewicz, A.; Seçkin, E.; Hanau Santini, R.; Siahaan, K.D.; Gantulga, G.; et al. Stepping Up Support to the UN and Humanitarian Partners for Anticipatory Action. WMO Bull. 2022, 71, 46–51. [Google Scholar]
- Pizzi, M.; Romanoff, M.; Engelhardt, T. AI for humanitarian action: Human rights and ethics. Int. Rev. Red Cross 2020, 102, 145–180. [Google Scholar] [CrossRef]
- Zell, E.; Huff, A.K.; Carpenter, A.T.; Friedl, L.A. A user-driven approach to determining critical earth observation priorities for societal benefit. IEEE J. Sel. Top. Appl. Earth Obs. Remote Sens. 2012, 5, 1594–1602. [Google Scholar] [CrossRef]
- Nauman, C.; Anderson, E.; de Perez, E.C.; Kruczkiewicz, A.; McClain, S.; Markert, A.; Griffin, R.; Suarez, P. Perspectives on flood forecast-based early action and opportunities for Earth observations. J. Appl. Remote Sens. 2021, 15, 032002. [Google Scholar] [CrossRef]
- Unwin, M.; Jales, P.; Tye, J.; Gommenginger, C.; Foti, G.; Rosello, J. Spaceborne GNSS-Reflectometry TechDemoSat-1: Early Mission Operations and Exploitation. IEEE J. Sel. Top. Appl. Earth Obs. Remote Sens. 2016, 9, 4525–4539. [Google Scholar] [CrossRef]
- Chew, C.; Lowe, S.; Parazoo, N.; Esterhuizen, S.; Oveisgharan, S.; Podest, E.; Zuffada, C.; Freedman, A. SMAP radar receiver measures land surface freeze/thaw state through capture of forward-scattered L-band signals. Remote Sens. Environ. 2017, 198, 333–344. [Google Scholar] [CrossRef]
- Carreno-Luengo, H.; Lowe, S.T.; Zuffada, C.; Esterhuizen, S.; Oveisgharan, S. Spaceborne GNSS-R from the SMAP mission: First assessment of polarimetric scatterometry. Remote Sens. 2017, 9, 362. [Google Scholar] [CrossRef] [Green Version]
- Rodriguez-Alvarez, N.; Misra, S.; Podest, E.; Morris, M.; Bosch-Lluis, X. The Use of SMAP-Reflectometry in Science Applications: Calibration and Capabilities. Remote Sens. 2019, 11, 2442. [Google Scholar] [CrossRef] [Green Version]
- Rodriguez-Alvarez, N.; Misra, S.; Morris, M. The Polarimetric Sensitivity of SMAP-Reflectometry Signals to Crop Growth in the U.S. Corn Belt. Remote Sens. 2020, 12, 1007. [Google Scholar] [CrossRef] [Green Version]
- Rodriguez-Alvarez, N.; Podest, E.; Jensen, K.; McDonald, K.C. Classifying Inundation in a Tropical Wetlands Complex with GNSS-R. Remote Sens. 2019, 11, 1053. [Google Scholar] [CrossRef] [Green Version]
- Loria, E.; O’Brien, A.; Zavorotny, V.; Downs, B.; Zuffada, C. Analysis of Scattering Characteristics from Inland Bodies of Water Observed by CYGNSS. Remote Sens. Environ. 2020, 245, 111825. [Google Scholar] [CrossRef]
- Zavorotny, V.U.; Voronovich, A.G. Scattering of GPS signals from the ocean with wind remote sensing application. IEEE Trans. Geosci. Remote Sens. 2000, 38, 951–964. [Google Scholar] [CrossRef] [Green Version]
- Voronovich, A.G.; Zavorotny, V.U. Bistatic radar equation for signals of opportunity revisited. IEEE Trans. Geosci. Remote Sens. 2018, 56, 1959–1968. [Google Scholar] [CrossRef]
- Clarizia, M.P.; Ruf, C.S. On the Spatial Resolution of GNSS Reflectometry. IEEE Geosci. Remote Sens. Lett. 2016, 13, 1064–1068. [Google Scholar] [CrossRef]
- Camps, A. Spatial Resolution in GNSS-R Under Coherent Scattering. IEEE Geosci. Remote Sens. Lett. 2020, 17, 32–36. [Google Scholar] [CrossRef]
- Park, J.; Johnson, J.T.; O’Brien, A.; Lowe, S.T. An Examination of TDS-1 GNSS-R Returns over Land Surfaces. In Proceedings of the URSI Radio Science Meeting, Pasadena, CA, USA, 6–9 January 2016. [Google Scholar]
- Park, J.; Johnson, J.T.; O’Brien, A. TDS-1 Coherent Returns over Sea Ice and Land Surfaces. In Proceedings of the GNSS+R 2017 Conference, Ann Arbor, MI, USA, 23–25 May 2017; Available online: http://www.gnssr2017.org/images/Thursday_afternoon/GNSS+R2017_TH_PM_7_Park_TDS1_Coherent_Returns_over_Sea_Ice_and_Land_Surfaces.pdf (accessed on 3 June 2019).
- Lloyd, S.P. Least Squares Quantization in PCM. IEEE Trans. Inf. Theory 1982, 28, 129–137. [Google Scholar] [CrossRef] [Green Version]
- Ruf, C.; Scherrer, J.; Rose, R.; Provost, D. Algorithm Theoretical Basis Document Level 1B DDM Calibration. University of Michigan Document No. 148-0137. Revision 3. 2020. Available online: http://cygnss.engin.umich.edu/wp-content/uploads/sites/534/2021/07/148-0137_ATBD-L1B-DDM-Calibration_R3_release.pdf (accessed on 10 January 2022).
- Clarizia, M.P.; Zavarotny, V.; Ruf, C. Level 2 Wind Speed Retrieval Algorithm Theoretical Basis Document. University of Michigan Document No. 148-0138 Rev 6. 2020. Available online: http://cygnss.engin.umich.edu/wp-content/uploads/sites/534/2021/07/148-0138-ATBD-L2-Wind-Speed-Retrieval-R6_release.pdf (accessed on 10 January 2022).
- Jensen, K.; McDonald, K.; Podest, E.; Rodriguez-Alvarez, N.; Horna, V.; Steiner, N. Assessing L-Band GNSS-Reflectometry and Imaging Radar for Detecting Sub-Canopy Inundation Dynamics in a Tropical Wetlands Complex. Remote Sens. 2018, 10, 1431. [Google Scholar] [CrossRef] [Green Version]
- Ahlmer, A.K.; Cavalli, M.; Hansson, K.; Koutsouris, A.J.; Crema, S.; Kalantari, Z. Soil moisture remote-sensing applications for identification of flood-prone areas along transport infrastructure. Environ. Earth Sci. 2018, 77, 533. [Google Scholar] [CrossRef] [Green Version]
- Valjarević, A.; Filipović, D.; Valjarević, D.; Milanović, M.; Milošević, S.; Živić, N.; Lukić, T. GIS and remote sensing techniques for the estimation of dew volume in the Republic of Serbia. Meteorol. Appl. 2020, 27, 1–14. [Google Scholar] [CrossRef]
- Mavhura, E. Learning from the tropical cyclones that ravaged Zimbabwe: Policy implications for effective disaster preparedness. Nat. Hazards 2020, 104, 2261–2275. [Google Scholar] [CrossRef]
- Phiri, D.; Simwanda, M.; Nyirenda, V. Mapping the impacts of cyclone Idai in Mozambique using Sentinel-2 and OBIA approach. S. Afr. Geogr. J. 2021, 103, 237–258. [Google Scholar] [CrossRef]
- Du, J.; Kimball, J.S.; Sheffield, J.; Pan, M.; Fisher, C.K.; Beck, H.E.; Wood, E.F. Satellite Flood Inundation Assessment and Forecast Using SMAP and Landsat. IEEE J. Sel. Top. Appl. Earth Obs. Remote Sens. 2021, 14, 6707–6715. [Google Scholar] [CrossRef]
- Goddard Earth Sciences Data and Information Services Center (2016), TRMM (TMPA-RT) Near Real-Time Precipitation L3 1 Day 0.25 Degree x 0.25 Degree V7, Edited by Andrey Savtchenko, Greenbelt, MD, Goddard Earth Sciences Data and Information Services Center (GES DISC). Available online: https://disc.gsfc.nasa.gov/datasets/TRMM_3B42RT_Daily_7/summary (accessed on 10 January 2022).
- U.S. Geological Service Water Watch Interactive Flooding Maps. Available online: https://waterwatch.usgs.gov/?id=ww_flood (accessed on 23 May 2019).
- Website Gathering Information on the Flooding Occurring in North-East Arkansas during the Midwest Spring Floods on 20017. Available online: https://weather.com/storms/severe/news/flood-threat-forecast-south-mississippi-valley-april2017 (accessed on 23 May 2019).
- Wu, H.; Adler, R.F.; Hong, Y.; Tian, Y.; Policelli, F. Evaluation of Global Flood Detection Using Satellite-Based Rainfall and a Hydrologic Model. J. Hydrometeorol. 2012, 13, 1268–1284. [Google Scholar] [CrossRef]
- Global Flood Monitoring System (GFMS). Available online: http://flood.umd.edu/ (accessed on 24 February 2022).
- Huffman, G.J.; Adler, R.F.; Bolvin, D.T.; Nelkin, E.J. The TRMM Multi-satellite Precipitation Analysis (TMPA). In Chapter 1 in Satellite Applications for Surface; Hydrology, F.H., Gebremichael, M., Eds.; Springer: Berlin/Heidelberg, Germany, 2010; ISBN 978-90-481-2914-0. [Google Scholar]
- Kruczkiewicz, A.; Klopp, J.; Fisher, J.; Mason, S.; McClain, S.; Sheekh, N.M.; Moss, R.; Parks, R.M.; Braneon, C. Opinion: Compound risks and complex emergencies require new approaches to preparedness. Proc. Natl. Acad. Sci. USA 2021, 118, e2106795118. [Google Scholar] [CrossRef] [PubMed]
- Bednarek, A.T.; Wyborn, C.; Cvitanovic, C.; Meyer, R.; Colvin, R.M.; Addison, P.F.; Close, S.L.; Curran, K.; Farooque, M.; Goldman, E.; et al. Boundary spanning at the science–policy interface: The practitioners’ perspectives. Sustain. Sci. 2018, 13, 1175–1183. [Google Scholar] [CrossRef] [PubMed] [Green Version]
- Sharma, P.; Joshi, A. Challenges of using big data for humanitarian relief: Lessons from the literature. J. Humanit. Logist. Supply Chain Manag. 2020, 10, 423–446. [Google Scholar] [CrossRef]
- Kruczkiewicz, A.; Braun, M.; McClain, S.; Greatrex, H.; Padilla, L.; Hoffman-Hernandez, L.; Siahaan, K.; Nielsen, M.; Llamanzares, B.; Flamig, Z. Flood Risk and Monitoring Data for Preparedness and Response. In Global Drought and Flood; Wu, H., Lettenmaier, D.P., Tang, Q., Ward, P.J., Eds.; American Geophysical Union: Washington, DC, USA, 2021. [Google Scholar] [CrossRef]
- Gros, C.; Easton-Calabria, E.; Bailey, M.; Dagys, K.; de Perez, E.C.; Sharavnyambuu, M.; Kruczkiewicz, A. The effectiveness of forecast-based humanitarian assistance in anticipation of extreme winters: A case study of vulnerable herders in Mongolia. Disasters 2022, 46, 95–118. [Google Scholar] [CrossRef]
- Thalheimer, L.; Simperingham, E.; Jjemba, E.W. The role of anticipatory humanitarian action to reduce disaster displacement. Environ. Res. Lett. 2022, 17, 014043. [Google Scholar] [CrossRef]
- Dilling, L.; Lemos, M.C. Creating usable science: Opportunities and constraints for climate knowledge use and their implications for science policy. Glob. Environ. Change 2011, 21, 680–689. [Google Scholar] [CrossRef]
- Lemos, M.C.; Finan, T.J.; Fox, R.W.; Nelson, D.R.; Tucker, J. The use of seasonal climate forecasting in policymaking: Lessons from Northeast Brazil. Clim. Change 2002, 55, 479–507. [Google Scholar] [CrossRef]
- Garrison, J.; Lin, Y.-C.; Nold, B.; Piepmeier, J.R.; Vega, M.A.; Fritts, M.; Du Toit, C.F.; Knuble, J. Remote sensing of soil moisture using P-band signals of opportunity (SoOp): Initial results. In Proceedings of the 2017 IEEE International Geoscience and Remote Sensing Symposium (IGARSS), Fort Worth, TX, USA, 23–28 July 2017; pp. 4158–4161. [Google Scholar] [CrossRef]
- Yueh, S.H.; Shah, R.; Xu, X.; Stiles, B.; Bosch-Lluis, X. A Satellite Synthetic Aperture Radar Concept Using P-Band Signals of Opportunity. IEEE J. Sel. Top. Appl. Earth Obs. Remote Sens. 2021, 14, 2796–2816. [Google Scholar] [CrossRef]
- CYGNSS Dataset. Available online: https://podaac.jpl.nasa.gov/dataset/CYGNSS_L1_V2.1 (accessed on 10 January 2022).
- Earthdata Search. Available online: https://search.earthdata.nasa.gov/search (accessed on 10 January 2022).









| Event | Year | Cost | Deaths |
|---|---|---|---|
| California floods | 2017 | 1.2B | 5 |
| Midwest Spring Floods | 2017 | 1.7B | 20 |
| Hurricane Harvey | 2017 | 125B | 89 |
| Peru floods | 2017 | 9B | 113 |
| Hurricane Florence | 2018 | 24B | 54 |
| Japan floods | 2018 | 8B | 225 |
| Kerala Floods | 2018 | 5.5B | 483 |
| Midwestern US floods | 2019 | 2.9B | 3 |
| Mozambique Floods | 2019 | 2B | 761 |
| Indian Monsoon Floods | 2019 | 7.4B | 1600 |
| China Floods | 2020 | 32B | 219 |
| European Floods | 2021 | 11.8B | 243 |
| Mission | Time Span | Area Revisit | Coverage | Flood detection—Suitable? |
|---|---|---|---|---|
| CYGNSS [21,22] | 2017–present | 1 day | +/−37° lat, sufficient | Ideal |
| SMAP Reflectometer [39,40,41,42] | 2015–present | Monthly | Global, sparse | Non-feasible |
| TechDemoSat-1 [38] | 2014–2019 | 1 day | Global, medium | Good, but decommissioned |
| Event | Year | Cause | Area of Extension |
|---|---|---|---|
| Mozambique floods | 2019 | Cyclone Idai and Cyclone Keneth | 3000 km2 |
| US Midwest Spring Floods | 2017 | Recurrent thunderstorms | 400 km2 |
| Reference (Depth Above Threshold in mm) | Discrepancy (%) |
|---|---|
| 0.001–10 | 18.08 |
| 10–20 | 3.01 |
| 20–50 | 4.42 |
| 50–100 | 1.72 |
| 100–200 | 1.18 |
| >200 | 3.12 |
| Total | 31.54 |
Publisher’s Note: MDPI stays neutral with regard to jurisdictional claims in published maps and institutional affiliations. |
© 2022 by the authors. Licensee MDPI, Basel, Switzerland. This article is an open access article distributed under the terms and conditions of the Creative Commons Attribution (CC BY) license (https://creativecommons.org/licenses/by/4.0/).
Share and Cite
Rodriguez-Alvarez, N.; Kruczkiewicz, A. Towards a Flood Assessment Product for the Humanitarian and Disaster Management Sectors Based on GNSS Bistatic Radar Measurements. Climate 2022, 10, 77. https://doi.org/10.3390/cli10050077
Rodriguez-Alvarez N, Kruczkiewicz A. Towards a Flood Assessment Product for the Humanitarian and Disaster Management Sectors Based on GNSS Bistatic Radar Measurements. Climate. 2022; 10(5):77. https://doi.org/10.3390/cli10050077
Chicago/Turabian StyleRodriguez-Alvarez, Nereida, and Andrew Kruczkiewicz. 2022. "Towards a Flood Assessment Product for the Humanitarian and Disaster Management Sectors Based on GNSS Bistatic Radar Measurements" Climate 10, no. 5: 77. https://doi.org/10.3390/cli10050077
APA StyleRodriguez-Alvarez, N., & Kruczkiewicz, A. (2022). Towards a Flood Assessment Product for the Humanitarian and Disaster Management Sectors Based on GNSS Bistatic Radar Measurements. Climate, 10(5), 77. https://doi.org/10.3390/cli10050077


