Article

Sub-Hourly Precipitation Extremes in Mainland Portugal and Their Driving Mechanisms

by
João A. Santos
1,* and
Margarida Belo-Pereira
2
1
Centre for the Research and Technology of Agroenvironmental and Biological Sciences, CITAB, Universidade de Trás-os-Montes e Alto Douro, UTAD, 5000-801 Vila Real, Portugal
2
Instituto Português do Mar e da Atmosfera, Divisão de Meteorologia Aeronáutica, Rua C do Aeroporto, 1749-077 Lisboa, Portugal
*
Author to whom correspondence should be addressed.
Climate 2022, 10(2), 28; https://doi.org/10.3390/cli10020028
Submission received: 18 January 2022 / Revised: 3 February 2022 / Accepted: 17 February 2022 / Published: 19 February 2022
(This article belongs to the Special Issue Extreme Weather Events)

Abstract

:
Sub-hourly heavy precipitation events (SHHPs) frequently underlie major meteorological hazards, but their comprehensive analysis is still lacking in Portugal. A 71-weather-station dataset for 2000–2020 is used in this article to (1) diagnose SHHPs corresponding to a 10-min precipitation event of at least 5.0 mm, (2) characterize their spatial-temporal distribution, and (3) identify their associated synoptic-scale conditions. Two synoptic types are associated with SHHPs: remote (RemL) and regional (RegL) low-pressure systems. RegL SHHPs display two marked maxima in spring and autumn, while RemL SHHPs show a single maximum in autumn. Most RegL events occur in the afternoon/evening, while RemL events show a slight bias toward midday occurrences. In the case of RemL, the wind is stronger for 2 to 3 h before and during SHHPs, veers from 180° to 210° near the event, the pressure decreases until 20 min before the event, and the wet-bulb temperature decreases around the time of the event and remains low, thus reflecting cold-front passages. For RegL, maximum winds coincide with precipitation peaks, and the wet-bulb temperature briefly decreases in association with downdrafts. A preliminary relationship between the SHHPs and mesoscale convective systems is established by detecting sudden surface-pressure surges, which are indicative of mesohighs caused by evaporatively cooled downdrafts. A calendar of mesohigh episodes linked to SHHPs is provided herein and their signatures are illustrated for the “Pedrógão-Grande” fires. Indicators of several downbursts, cold pools, and mesohighs were identified by the AROME forecast. This first, systematized analysis paves the way to identifying dynamic precursors, enabling their integration into early warning systems and climate projections.

1. Introduction

Heavy precipitation events are widely recognized as being a major meteorological hazard that may cause casualties, property damage/losses, and fatalities [1,2,3,4]. Moreover, these events can have significant socio-economic impacts, namely, in the agricultural sector [5], energy sector, telecommunication infrastructures and transport [6,7,8], and urban drainage systems [9,10], among many other vulnerable sectors and activities.
Improved knowledge on heavy precipitation events is particularly imperative in the context of climate change, as extreme precipitation events are likely to increase in many regions worldwide in the upcoming decades, which will be manifested in terms of both their frequency of occurrence and intensity [11,12]. Being among the regions most exposed to climate change (the so-called hotspots), southern Europe and the Mediterranean Basin are projected to undergo significant drying trends that will be reinforced by warming trends and strengthened evapotranspiration [11,12]. Overall, the foreseen intensification of aridity conditions will tend to exacerbate the impacts of heavy precipitation events, such as by challenging water management and drainage infrastructures, as well as favoring damaging surface runoff, surface-water floods, and flash floods. Flood risk in the Mediterranean region is already closely associated with heavy precipitation events [3].
In particular, the precipitation regime of the Iberian Peninsula has been studied on both monthly and daily timescales [13,14,15], revealing pronounced seasonal cycles and sharp spatial gradients, which are typical features of the Mediterranean climate. In mainland Portugal, the precipitation regime can primarily be explained by the variability in large-scale atmospheric circulation over the Eastern North Atlantic, and precipitation is highly concentrated in the wintry half of the year [16], mostly favored by westerly/south-westerly flows [16,17]. The establishment of persistent large-scale eddies in the prevailing westerly flow [18,19], frequently connected to eddy-driven jet stream wave-breaking episodes [20,21], underlies the strong irregularity and inter-annual variability of precipitation in Portugal. Convective precipitation demonstrates a bimodal distribution in mainland Portugal [22], with a peak in April and another in October, which is also consistent with the seasonal cycle of hailfall and lightning [23,24]. Sub-hourly heavy precipitation events in other parts of the Iberian Peninsula, namely, its western half, have also been related to similar large-scale circulation patterns (westerly/south-westerly flow), with analogous seasonality [25]. However, these events in eastern Spain [26] are usually driven by different weather systems, originating and developing in the Mediterranean Sea (with a clear connection with sea surface temperatures) rather than in the North Atlantic, thus underlying the remarkable differences in their respective seasonal regimes.
Despite the projected downward trend in annual/seasonal total precipitation over mainland Portugal under future climate conditions [27,28,29], the occurrence of heavy precipitation events is also expected to increase in some areas of the country [30], although the susceptibility of the different Portuguese regions to precipitation extremes is heterogeneous [31]. Recurrent damaging floods in many flood-susceptible areas of the country have been related to the occurrence of heavy precipitation events forced by large-scale atmospheric flow anomalies [32]. Hence, extremely high flow rates and floods are likely to become more frequent in numerous Portuguese hydrological basins under future climates (e.g., see [33]). However, studies are still missing at shorter timescales (minutes to hours) that do play a prominent role in triggering flash floods over small urban watersheds [9,10].
Short-duration heavy precipitation events are frequently associated with the occurrence of mesoscale convective systems (MCS) [9,34,35], such as squall lines and bow echoes [36,37,38]. Cold pools and mesohighs commonly develop in association with MCS [37,38,39,40]. Cold pools are evaporatively cooled areas of downdraft air on the rear side of MCS, spreading out horizontally underneath a thunderstorm cloud. In environments that favor sub-cloud evaporative cooling [41,42], MCS may produce a strong downdraft that induces strong and damaging divergent winds on or near the earth’s surface, which has been defined as a downburst by Fujita [43]. Downbursts are called microbursts when an outflow diameter of less than 4 km and a duration of less than 5 min is observed. Otherwise, they are referred to as macrobursts. The signature of downbursts can be detected in weather station records through a pronounced short-duration drop in temperature (cold pool), accompanied by a surface pressure surge (mesohigh), although their synchrony is slightly dependent on the developmental stage of the system [39]. Air temperature can decrease by 4–13 °C, whereas pressure can rise by 0.6–9 hPa in the sub-hourly timescale [40]. On 23 December 2009, in southern Portugal, the signature of a downburst was identified that was associated with a bow echo embedded in a squall line, fostered by an upper-level cold front [36]. During this event, in a 10-min period, precipitation exceeded 11 mm, accompanied by a temperature drop of 2.5 °C and a pressure rise of 2.5 hPa. Similar signatures were observed in other regions of Europe, associated with similar phenomena [38,44], although bow echoes are more frequently documented in the USA [43,45].
Operationally available sub-hourly surface parameters allow detection of the aforementioned dynamical mechanisms [46], which recurrently underlie the occurrence of short-duration heavy precipitation events that may represent serious meteorological hazards. Hence, an understanding of the driving thermodynamical-dynamical mechanisms of such phenomena is essential to enhance the performance and quality of the current weather warning systems, with warnings commonly issued by national or regional weather services. Improvements in those warnings will enhance the perception of their added value in the population. Therefore, the main objectives of the present study are (1) to define and identify sub-hourly (10-min) heavy precipitation events (SHHPs) in mainland Portugal, using a relatively dense operational network of weather stations, (2) to categorize the underlying large-scale dynamical conditions, (3) to characterize the severity of meteorological conditions during these events, (4) to assess their seasonal and diurnal variability, (5) to assess their temporal evolution, and (6) to discuss their relationship with mesoscale convective systems and mesohigh formation. A representative case study will be inspected to highlight archetypal synoptic-scale and mesoscale signatures, using weather station data, radiosonde, satellite, and radar products that are operationally available in weather monitoring and forecasting, thus also providing wide-ranging guidelines for tracking sub-hourly heavy precipitation events. Moreover, the AROME [47] forecasts, which are operationally used by the Portuguese Weather Service (Instituto Português do Mar e da Atmosfera, IPMA), will also be analyzed. Data and methods will be described in Section 2, and the results will be presented and discussed in Section 3. Section 4 will summarize the main conclusions and provide some perspectives for subsequent research.

2. Materials and Methods

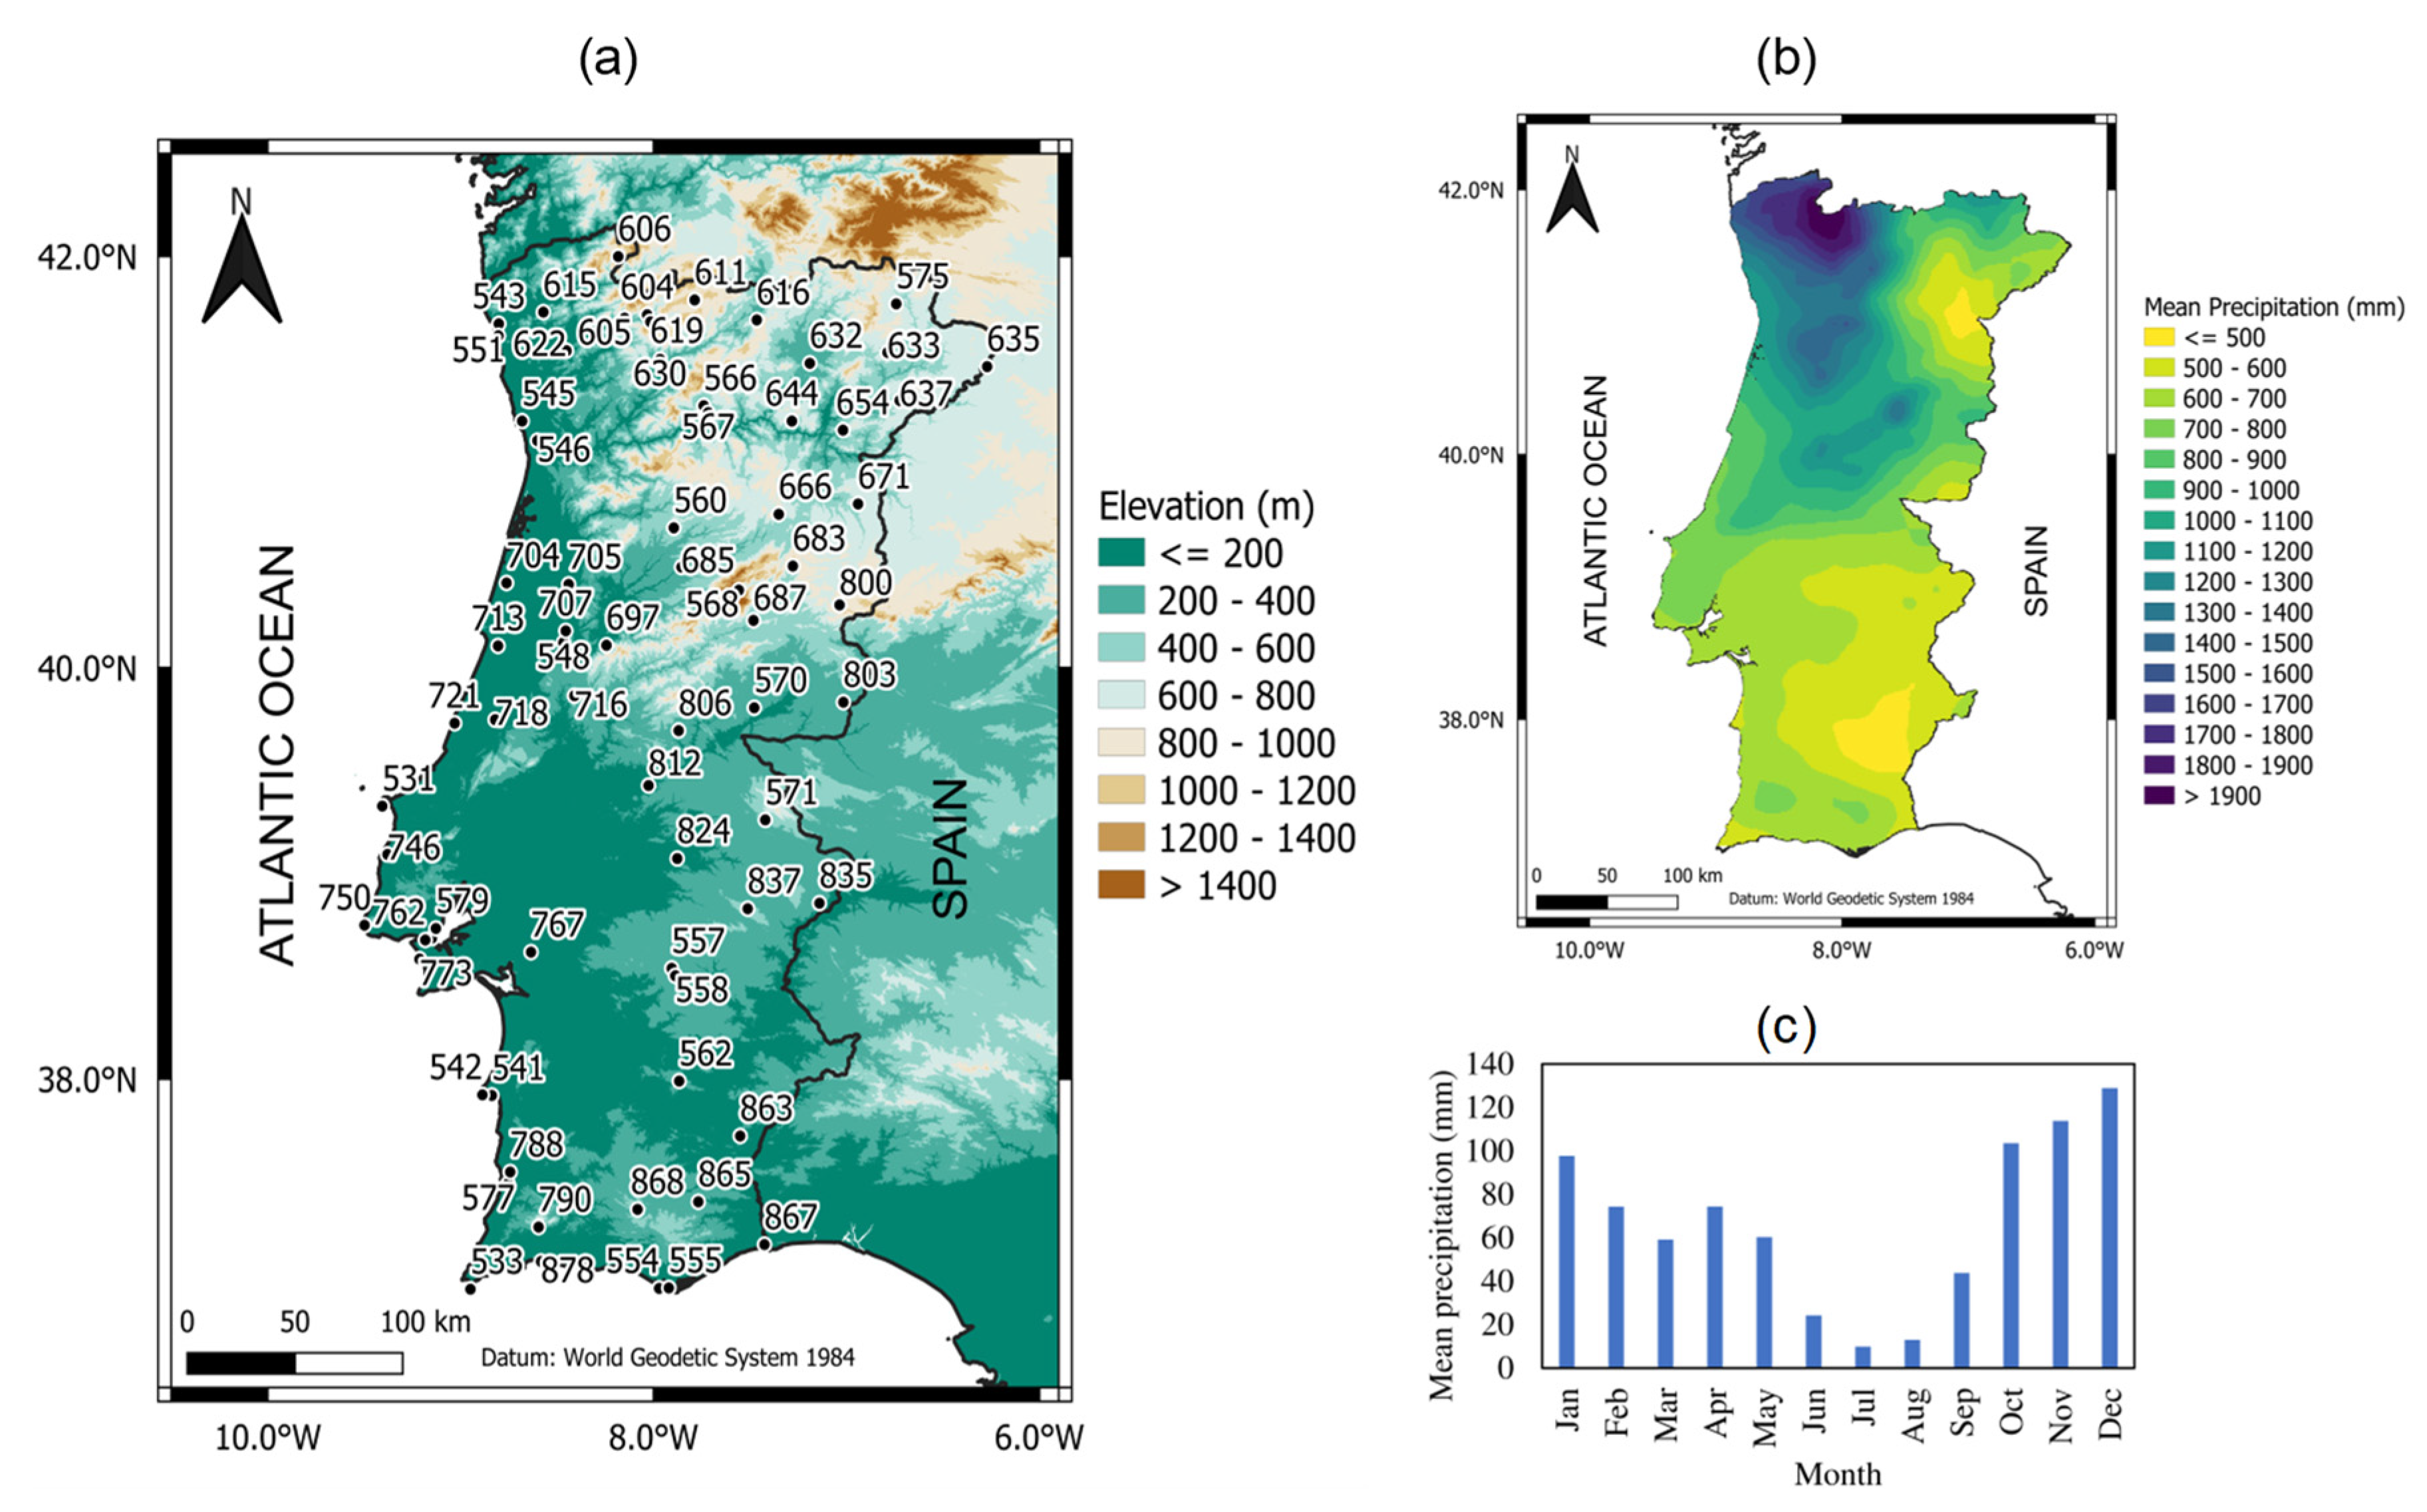
2.1. Observational Data

This study uses 10-min data over mainland Portugal derived from 71 operational automated weather stations (WS) maintained by the Portuguese Weather Service. The complete list of WS is provided in Table S1 (Supplementary Material), along with their designations, codes, geographical coordinates (latitude and longitude), and elevation. Their geographical distribution throughout mainland Portugal hints at the relatively high density and uniformity of the meteorological network, with fairly good coverage of the territory (Figure 1a). Elevation varies significantly, ranging from 4 m (WS 713: Figueira da Foz) to 1380 m (WS 568: Penhas Douradas), the latter being located on the highest mountain in mainland Portugal (Serra da Estrela). The northern half of the country features a complex topography, whereas its southern half is generally characterized by lowland or smooth hilly areas (Figure 1a).
These terrain characteristics play a key role in the spatial distribution of precipitation over Portugal, as well as in the development of orographically driven convection systems [22,23]. Mean annual total precipitation in Portugal, for the baseline 1981–2010 (30 years), varies from approximately 400 mm in the southernmost areas (e.g., southern coast of the Algarve), to 2000 mm and more in the high-elevation areas of the northwest (e.g., the Peneda-Gerês mountain range) (Figure 1b). This latter region is much more exposed to the Atlantic winds than southern Portugal, which is protected by the strong condensation barrier effect fostered by the Atlantic-facing mountain slopes. This sharp southeast-northwest gradient is remarkable and has a major influence on the Portuguese landscape and ecosystems, with a gradual transition from Mediterranean-type to Atlantic-type. Nonetheless, the seasonality of the precipitation regime in Portugal is of the Mediterranean type throughout the territory (Figure 1c), with a pronounced maximum in autumn–winter (October–January) and monthly precipitation of >100 mm (with a daily mean precipitation rate of >3 mm day−1), and a minimum in summer (July–August), with monthly precipitation of <20 mm.
The aforementioned WS provide 10-min records of several atmospheric variables, including not only 10-min total precipitation (mm), which is the central variable in the present study, but also the 10-min means of air temperature (°C), pressure (hPa), relative humidity (%), wind velocity (ms−1) and direction (°), wind gust (ms−1) and gust direction (°). The wind gust (ms−1) and gust direction (°), referring to the maximum value of the previous 10 min, are also recorded. Wind gusts are defined based on 3-second averages of the wind intensity. Preliminary data quality checking is performed by IPMA, and erroneous values are treated thereafter as missing values. Considering that automated WS started to be installed in the late 90s (only a few were operational before 2000), the study period of 2000–2020 (21 years) has been chosen. However, several WS were installed much later and have large data gaps within the selected period. The corresponding percentages of missing data on 10-min precipitation events according to weather station are shown in Table S1. They vary from 0% (567: Vila Real CC) to 95% (707: Coimbra and 746: Santa Cruz). Missing data are not replaced but are instead discarded from the analysis. Nevertheless, most of the missing values occur because the available periods of the WS are frequently shorter than the full reference period (2000–2020). Within the available periods, missing data is always below 25%. Although significant data gaps are present in the WS time series, particularly for those with codes starting with a 7 (installed in 2019), all WS are retained to attain the maximum possible number of records. A large sample of events is critical to ensure the robustness of the results. Temporal variability may be significantly biased by missing data. As such, inter-annual variability will not be analyzed herein since the recording periods are quite variable among WS. Nonetheless, both seasonal and diurnal variability will be analyzed, as they are much less affected by the non-overlapping of recording and reference periods.

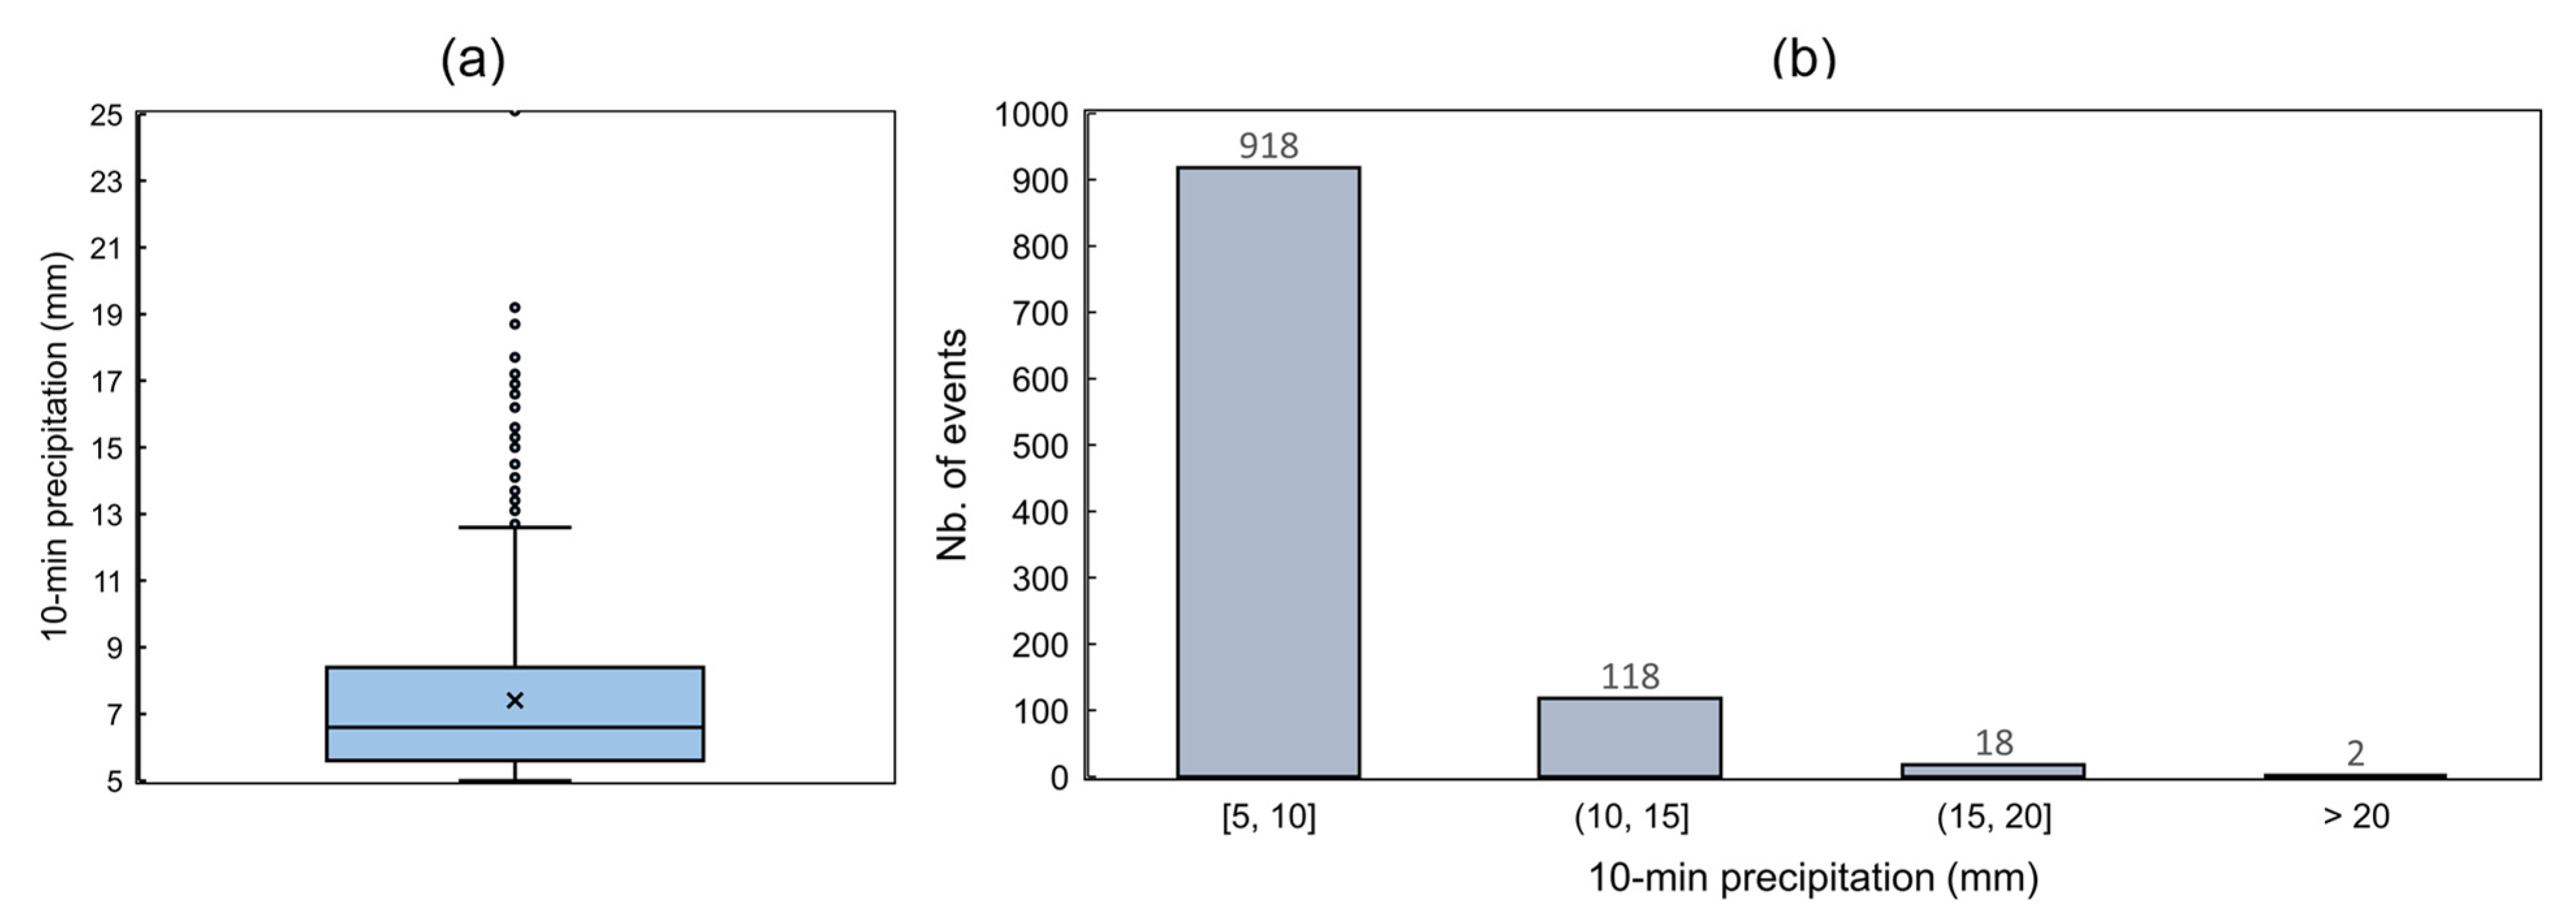
2.2. Sub-Hourly Heavy Precipitation Events

Sub-hourly heavy precipitation (SHHP) events have been identified using percentile-based definitions [49]. The 99th percentiles of the 10-min total precipitation for all WS, taking only those subsamples with precipitation records (non-zero values) and that have a median of 2.4 mm and a maximum of 3.9 mm. SHHPs are considered to be 10-min periods with total precipitation equal to or greater than 5.0 mm for a given WS, which means that in all WS, the frequency of occurrence of these events is <1% of all 10-min precipitation records. This threshold can therefore be considered sufficiently high to ensure that only the most extreme precipitation events are selected for analysis. Consequently, for time-spaced events of less than one hour recorded by the WS, only the peak event with the highest total precipitation is considered. This approach avoids the multiple reporting of events driven by the same meteorological situation.

2.3. Reanalysis and Numerical Weather Prediction Forecasts

SHHP events will also be categorized as a function of different large-scale circulation-forcing events. For that purpose, hourly mean sea-level pressure (SLP) fields (in Pa) from the ERA5 reanalysis are used [50]. Data were supplied by the Copernicus Climate Change Service (C3S, https://climate.copernicus.eu/) Climate Data Store (CDS), accessed on 18 March 2021 [51]. Gridded data are retrieved within a Euro-Atlantic sector (30–60° N, 30° W–10° E), on a 0.25° latitude × 0.25° longitude grid (~20–30 km spatial resolution).
Moreover, forecasts of the non-hydrostatic limited-area model AROME [47] will also be analyzed for a case study of a downburst. At the Portuguese Weather Service, the AROME model runs operationally, with a 2.5 km horizontal resolution and boundary conditions provided by the ARPEGE model [47].

2.4. Meridional Pressure Gradient Index

Categorization of the hourly fields was carried out using a meridional pressure gradient (MPG) index, which is defined as the difference between SLP at 40° N and SLP at 50° N, and zonally averaged within the belt at 15–5° W, i.e., [SLP40° N–SLP50° N]15–5°W. The two latitude parallels used in MPG allow a clear distinction to be made between two major precipitation-generating weather types [16,17]: remote low-pressure systems, located northward/northwestward of mainland Portugal, and regional low-pressure systems located over or near to Iberia. The first (second) type is then associated with positive (negative) MPG index values.

2.5. Mesohigh Detection Criteria

The formation of mesohighs associated with MCS during SHHP events (subsample) is also assessed. The two criteria used to identify these mesohighs are as follows: (1) surface pressure must increase by at least 1.0 hPa in the 10 or 20 min preceding the event, and (2) decrease by at least 0.25 hPa in the following 20 min. These criteria are consistent with the outcomes from previous studies [36,38,40]. Moreover, their skill in capturing the reported mesohighs and/or downbursts associated with MCS, previously identified using radar images, was attested.

3. Results

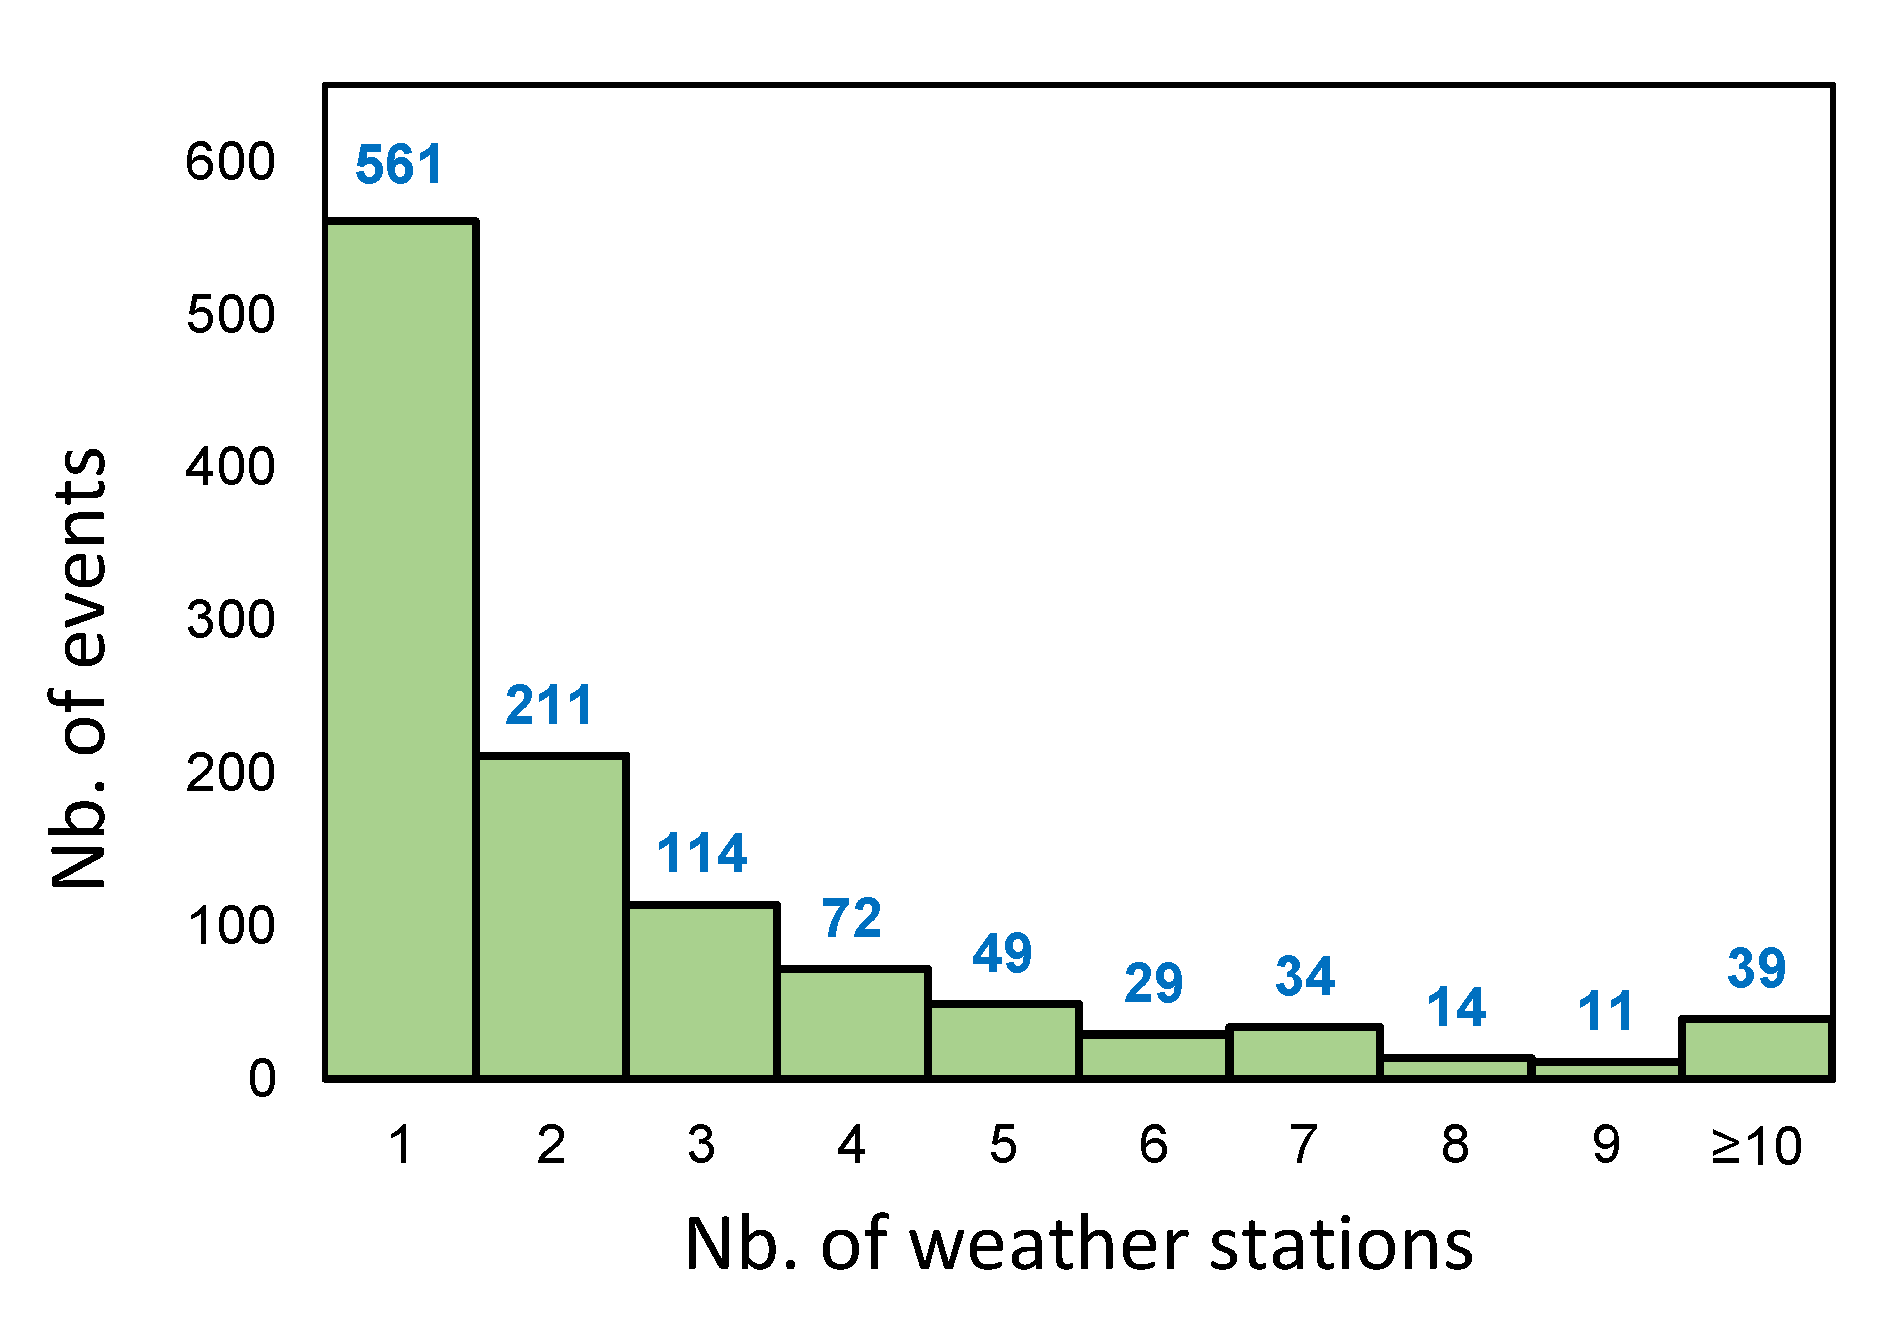
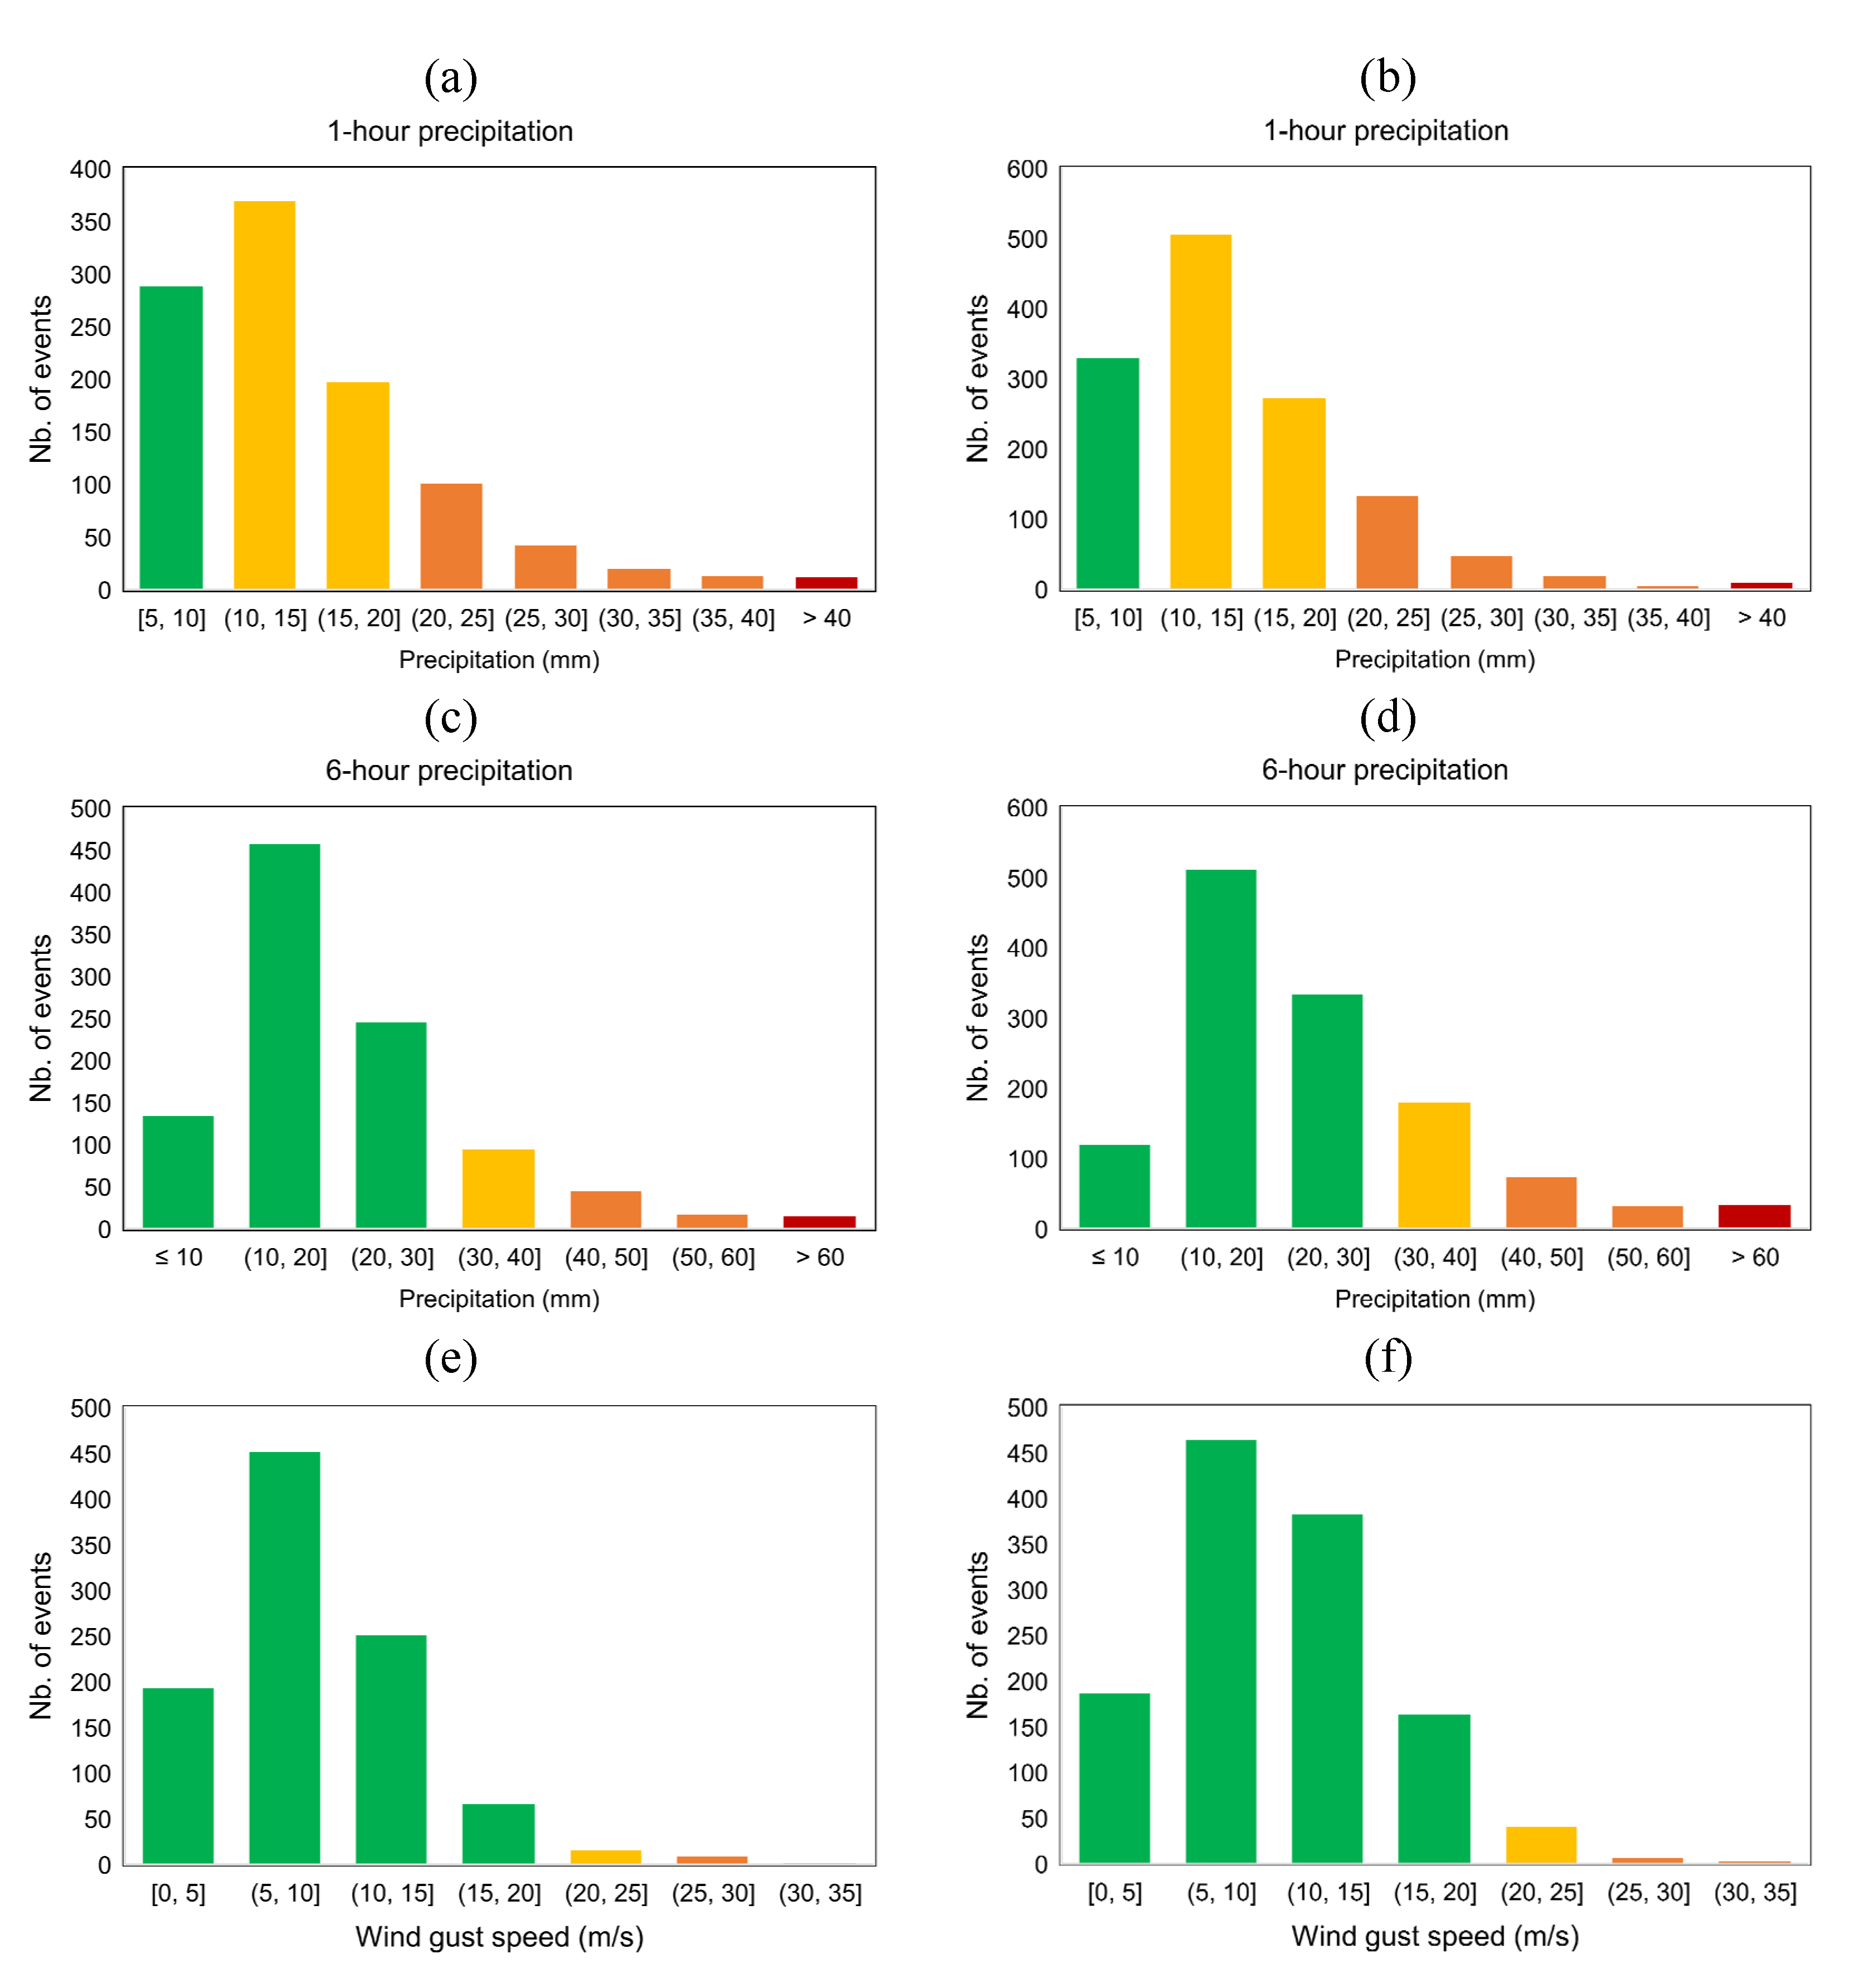
3.1. Sub-Hourly Heavy Precipitation Events

A total of 2951 SHHP events were identified. The statistical distribution of their corresponding precipitation amounts depicts strong positive skewness, which is a typical feature of precipitation, particularly at shorter timescales (Figure 2). Values ranged from 5.0 mm (minimum by definition) to an absolute maximum of 46.8 mm. For this distribution, the first quartile was 5.6 mm, the median 6.4 mm, the mean 7.2 mm, and the third quartile 7.9 mm. The corresponding histogram also shows that the bulk of the events reported precipitation of up to 10 mm. Preliminary analysis also revealed that several SHHP events did occur at different locations on the same day. The 2951 events occurred on a total of 1134 days. The empirical distribution of the SHHP events as a function of the number of WS that recorded an SHHP event on the same day reveals that isolated events were recorded on 561 days, i.e., recorded at a single WS (Figure 3). In the remaining events (ca. 80%), at least two WS recorded an SHHP event on the same day. It is still noteworthy that on 39 days, more than 10 WS registered SHHP events, which illustrates their wide spatial extension. Isolated SHHP events, i.e., those not accompanied by other events on the same day that are reported at other WS, are not henceforward considered to guarantee that all events did have a physical existence. Nevertheless, a sensitivity analysis showed that this choice has had no significant implication for the main findings. A total of 573 SHHP days that fulfill the conditions of having at least two WS with 10-min precipitation events of ≥5.0 mm are identified, which also corresponded to 2390 SHHP events.
The heaviest recorded precipitation event in the whole database (46.8 mm) occurred on 20 October 2004, at 07:00 UTC, by the WS 545 weather station (Porto Pedras Rubras). However, for the same day, five additional SHHP events were also recorded in other WS, thus hinting at the event’s spatial extension (Figure 4a). The corresponding synoptic analysis chart, at 00:00 UTC, reveals two strong low-pressure cores, one located just westward of Iberia and another in the Biscay Gulf, accompanied by a cold front traveling over the country with an intense meridional pressure gradient (Figure 4c). Thus, this specific SHHP event is linked to deep frontal conditions driven by remote low-pressure systems. The second-heaviest event occurred on 5 November 2006, 08:20 UTC, and generated precipitation of 38.7 mm at WS 570 (Castelo Branco). An SHHP event was also recorded on the same day in another WS in southern Portugal (Figure 4b). The respective synoptic analysis chart at 00:00 UTC shows a low-pressure system westward of Iberia, with an occluded front and an instability line over southern Portugal (Figure 4d). This system was accompanied by a large area of high pressure extending from the British Isles toward central Europe and the southeastern Mediterranean. This event is then related to a regional low-pressure system with an inverted meridional pressure gradient (pressure increasing northward).
As the synoptic analysis charts are for 00:00 UTC, the ERA5 SLP patterns are also shown at the exact hour of each SHHP event, to better characterize the conditions during each event (Figure 4e,f). Generally, they emphasize the above-described synoptic features, showing, in the first event, a northeastward displacement of the low-pressure systems nearer Iberia and, in the second event, the persistence of the same pattern. The spatial patterns of daily total precipitation, based on the IBERIA01 gridded dataset [48] defined on a 0.1° grid, reveal distributions that are generally coherent with the aforementioned synoptic systems, as well as with the location of the SHHP events (Figure 4a,b). These two exceptionally severe SHHP events highlight two different underlying synoptic-scale atmospheric circulations. However, the conditions for the third- to tenth-heaviest events corroborate this dichotomy (Figure S1).

3.2. Association between Events and Synoptic Types

The 573 SHHP days selected above are categorized according to the underlying synoptic-scale atmospheric flow into two types. The hourly ERA5 SLP fields that corresponded to the UTC hour of occurrence of the severest SHHP event on a given day were used. As defined in Section 2, this classification is based on the hourly MPG index derived from these SLP fields. Of the 573 days identified, 269 (~47%) were associated with negative MPG-index values (inverted meridional pressure gradient), whereas 304 (~53%) were connected to positive MPG-index values (Figure 5a). Therefore, the dataset of SHHP days is distributed nearly equally between the two synoptic types. Nonetheless, there is a clear difference in the distribution of values on the two sides of the MPG index, making the full distribution positively skewed. The negative index is more concentrated in relatively low (central) values than the positive index, thus reflecting a generally weaker MPG, rarely below –20 hPa/10° of latitude. Conversely, the positive MPG index is spread over a larger range of values. It can reach values higher than 30 hPa/10° of latitude, i.e., 40° N SLP is at least 30 hPa higher than 50° N SLP, which is a manifestation of very strong westerly flow between these two latitude parallels.
The remarkably different atmospheric conditions under the two synoptic types are highlighted by their corresponding SLP composites (Figure 5b,c), which correspond to the average of all hourly SLP fields for all SHHP days that were classified in each type. The negative MPG pattern depicted a relatively weak low-pressure system with a core just westward of Iberia (Figure 5b). It was accompanied by a high-pressure belt with a maximum over the British Isles. This is a clear signature of mid-latitude blocking highs and inverted dipolar structures over Western Europe and the adjacent North Atlantic. This synoptic type is henceforth known as a Regional Low (RegL). Regarding the SLP composite for positive MPG index values, it exhibited a deep low-pressure core westward of the British Isles (Figure 5c), which is an indicator of mid-latitude cyclones traveling from the North Atlantic toward Northern Europe (storm track). Furthermore, a strong meridional (north–south) trough, with an axis roughly along the 10° W longitude line, is apparent, suggesting the presence of cold fronts propagating over mainland Portugal. Thus, although the low-pressure centers were remotely located, near the British Isles or over the Biscay Gulf, they triggered rain-generating conditions over mainland Portugal, mostly through cold fronts developing on their southern flanks. This synoptic type is therefore designated hereafter as Remote Low (RemL). The designation of the above-mentioned synoptic types (RegL and RemL) was chosen to be consistent with the literature, namely, previous weather type classifications in Portugal and their relationship with precipitation [16,17]. However, the present study classification is devoted only to SHHPs and is not related to general daily precipitation.
The abovementioned severest SHHPs are a clear manifestation of the two synoptic types: 20 October 2004 demonstrated RemL (Figure 4a,c,e and Figure 5c), while 5 November 2006 demonstrated RegL (Figure 4b,d,f and Figure 5b), thus corroborating the dynamic consistency of the chosen types. A visual inspection of all hourly fields revealed very high consistency among the SLP patterns for each synoptic type, even for those showing near-zero MGP-index values. A sensitivity analysis considering only the absolute values of this index above a given threshold was also carried out, using thresholds varying from 0 to 10 hPa; however, no significant changes in the results were found, besides the anticipated decrease in the number of categorized events and the overall strengthening of the gradients in the SLP patterns and corresponding composites (not shown).

3.3. Event Characterization

The systematized analysis of the SHHP events in mainland Portugal, as well as their connection to specific synoptic-scale conditions, is unprecedented. In this section, the SHHP events for each synoptic type (RegL and RemL events) are characterized separately to highlight their differences. For this purpose, several atmospheric variables recorded by the WS are used, where the events were recorded. Moreover, the percentage of these events that would have led to weather warnings is evaluated according to the thresholds used by IPMA: yellow, orange, or red warnings, issued for either precipitation or wind. Severe weather warnings are issued for precipitation using the following criteria for 1 h of total precipitation: yellow warning (10–20 mm), orange warning (20–40 mm), or red warning (≥40 mm). Warnings could also be issued based on 6 h of total precipitation, as follows: yellow warning (30–40 mm), orange warning (40–60 mm), or red warning (≥60 mm). Severe weather warnings are also issued when wind gusts are expected to exceed 20 ms−1 (https://www.ipma.pt/en/otempo/prev-sam/, accessed on 3 February 2022).
Although the distributions of 10-min precipitation events for each type are very similar to the full distribution (Figure 2 and Figure S2), RegL events tend to present higher values than RemL events, with medians of 6.6 mm or 6.3 mm, and means of 7.4 mm or 7.0 mm, respectively. The 1-h accumulated precipitation, centered in the 10-min events, shows a peak in the 10–15 mm group for both RegL and RemL, thus suggesting that most of the events are accompanied by precipitation over longer periods, although it is less intense (Figure 6a,b). Weather warnings based on 1 h of precipitation are verified in ~73% of the SHHP events in RegL and ~75% in RemL; i.e., three in every four events resulted in severe 1-h precipitation occurrences, regardless of the type. For 6 h of precipitation, the results reveal a much weaker connection with the SHHP events, with warnings in ~18% of the SHHP events in RegL and ~28% in RemL (Figure 6c,d). As a result, the much lower incidence of warnings for precipitation based on the 6-h thresholds, compared with the 1-h thresholds, emphasizes the predominantly short duration of SHHP events, although they frequently extend for more than 10 minutes, as seen above for 1-h precipitation events.
Regarding the 10-min surface pressure values at the WS during SHHP events, it is clear that for RegL the distribution is negatively skewed, whereas for RemL it is nearly symmetrical. Overall, SLP tended to be higher in RegL than in RemL, which is also consistent with their synoptic patterns (Figure S2), although very low values (<1000 hPa) are also occasionally recorded for RegL. Relative humidity values show that RemL events tend to be moister, which agrees with the stronger advection of moist air masses from the North Atlantic (Figure 5c). Lastly, the dry-bulb, dewpoint, and wet-bulb equivalent temperatures are very similar between RegL and RemL (Figure S2), but RegL shows some extreme values, predominantly in temperatures at the upper side, while extreme values occur in the lower-side temperatures for RemL.
Sub-hourly wind gusts may also be important indicators of the severity of SHHP events. However, for both RegL and RemL, less than 5% of the events recorded severe winds gusts (≥20 m s−1), according to the warning scale for wind gusts (Figure 6e,f). Despite the moderate wind gusts, there was a clear peak in the interval of 5–10 m s−1, showing that relatively windy conditions prevailed during the SHHP events in both synoptic types. Moreover, RemL tended to be windier than RegL, which is dynamically coherent with its synoptic pattern, showing strong south-westerly flow over mainland Portugal, commonly generated by cold fronts (Figure 5c). The high frequency of wind direction within the south-to-west quadrant is also consistent with the aforesaid RemL pattern (Figure 6g,h). For RegL, the dominance of this quadrant was less noticeable but is still clear. South-westerly flow is typically associated with the advection of relatively warm and moist air masses from the subtropical North Atlantic toward mainland Portugal. These air masses undergo gradual cooling, condensation, and latent heat release, thus generating favorable conditions for precipitation occurrence, although it does not necessarily lead to more extreme SHHP events. Similar considerations can be made for both mean 10-min wind speed and direction values (Figure S2).

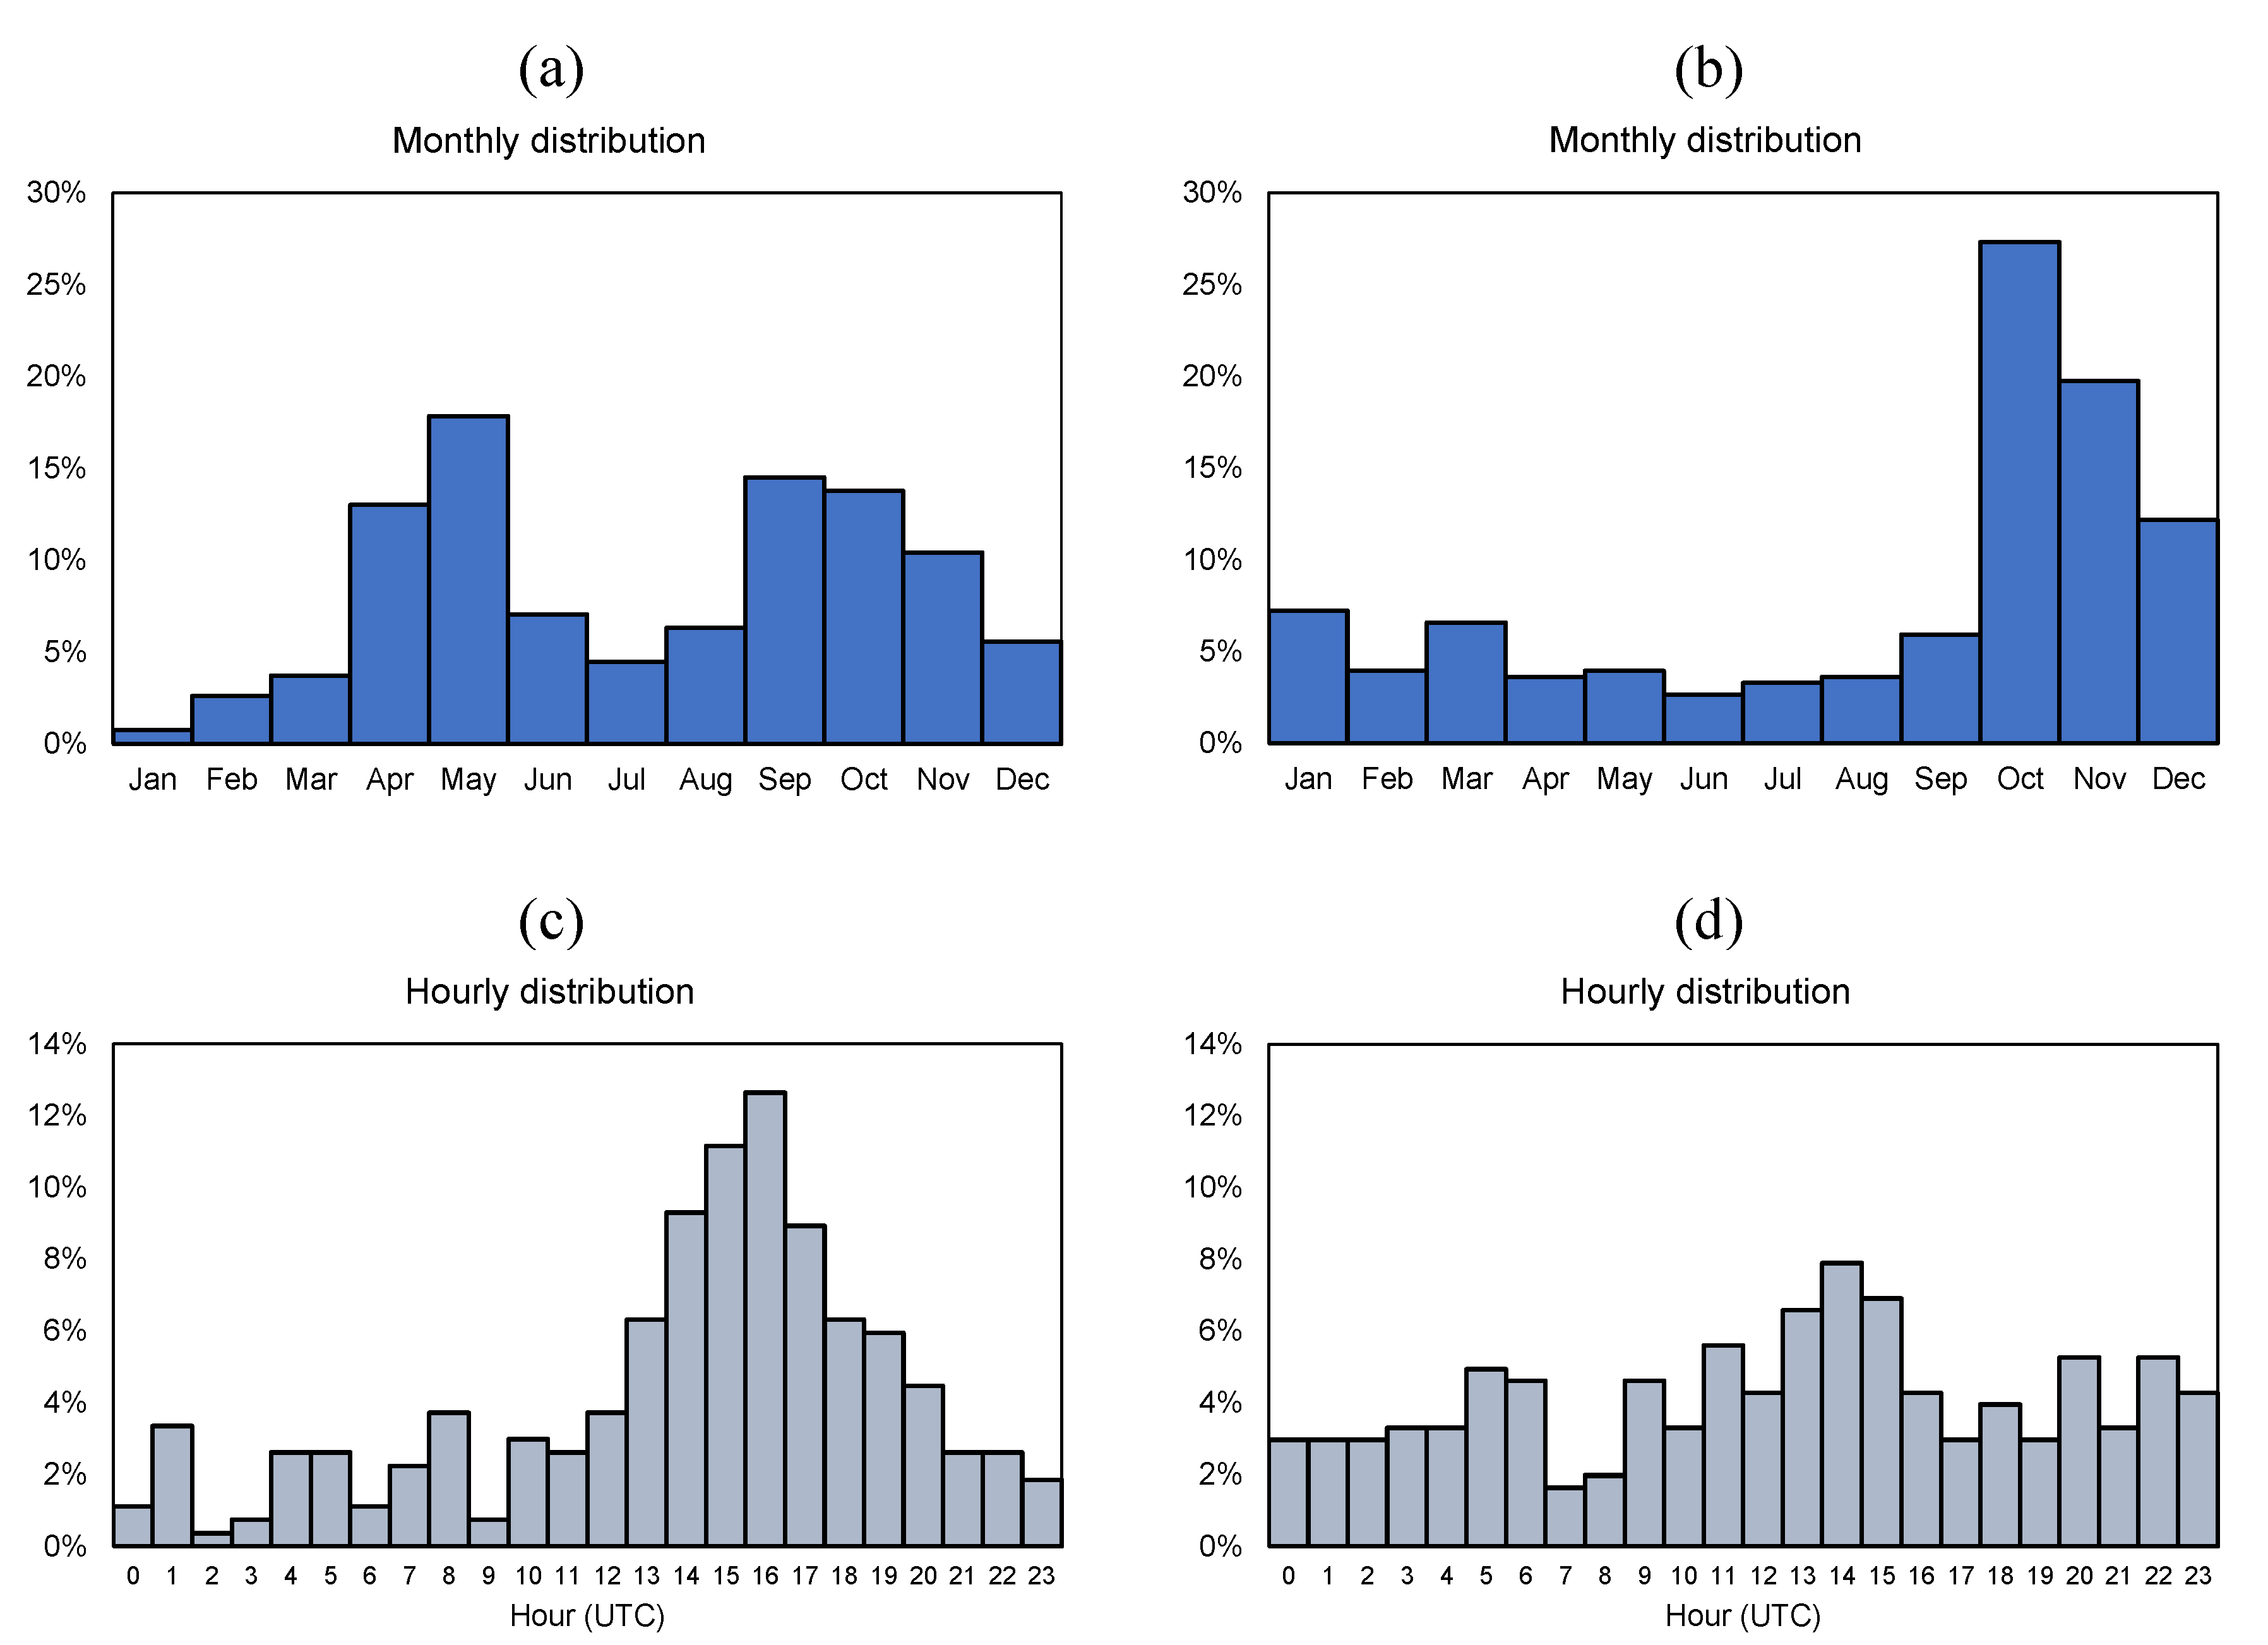
3.4. Seasonal and Diurnal Variability

The seasonality of RegL depicted two clear maxima (April–May, September–October, Figure 7a), while a single maximum can be found in RemL (October–November, Figure 7b). This result is consistent with previous studies on convection in mainland Portugal [22], which show the same two maxima as in RegL, thus suggesting a closer relationship of RegL events with thermally driven mesoscale convective systems. This assumption is also supported by the diurnal cycle of RegL events, evincing a pronounced maximum in the mid- to late afternoon (Figure 7c). Conversely, a much more uniform distribution is seen for the diurnal cycle of RemL events (Figure 7d), despite the maximum appearing in the early afternoon. RemL events seem to be related to baroclinically driven mesoscale systems, fostered by frontal systems. On the whole, these temporal features of both RegL and RemL are consistent with the synoptic patterns described above (Figure 5).

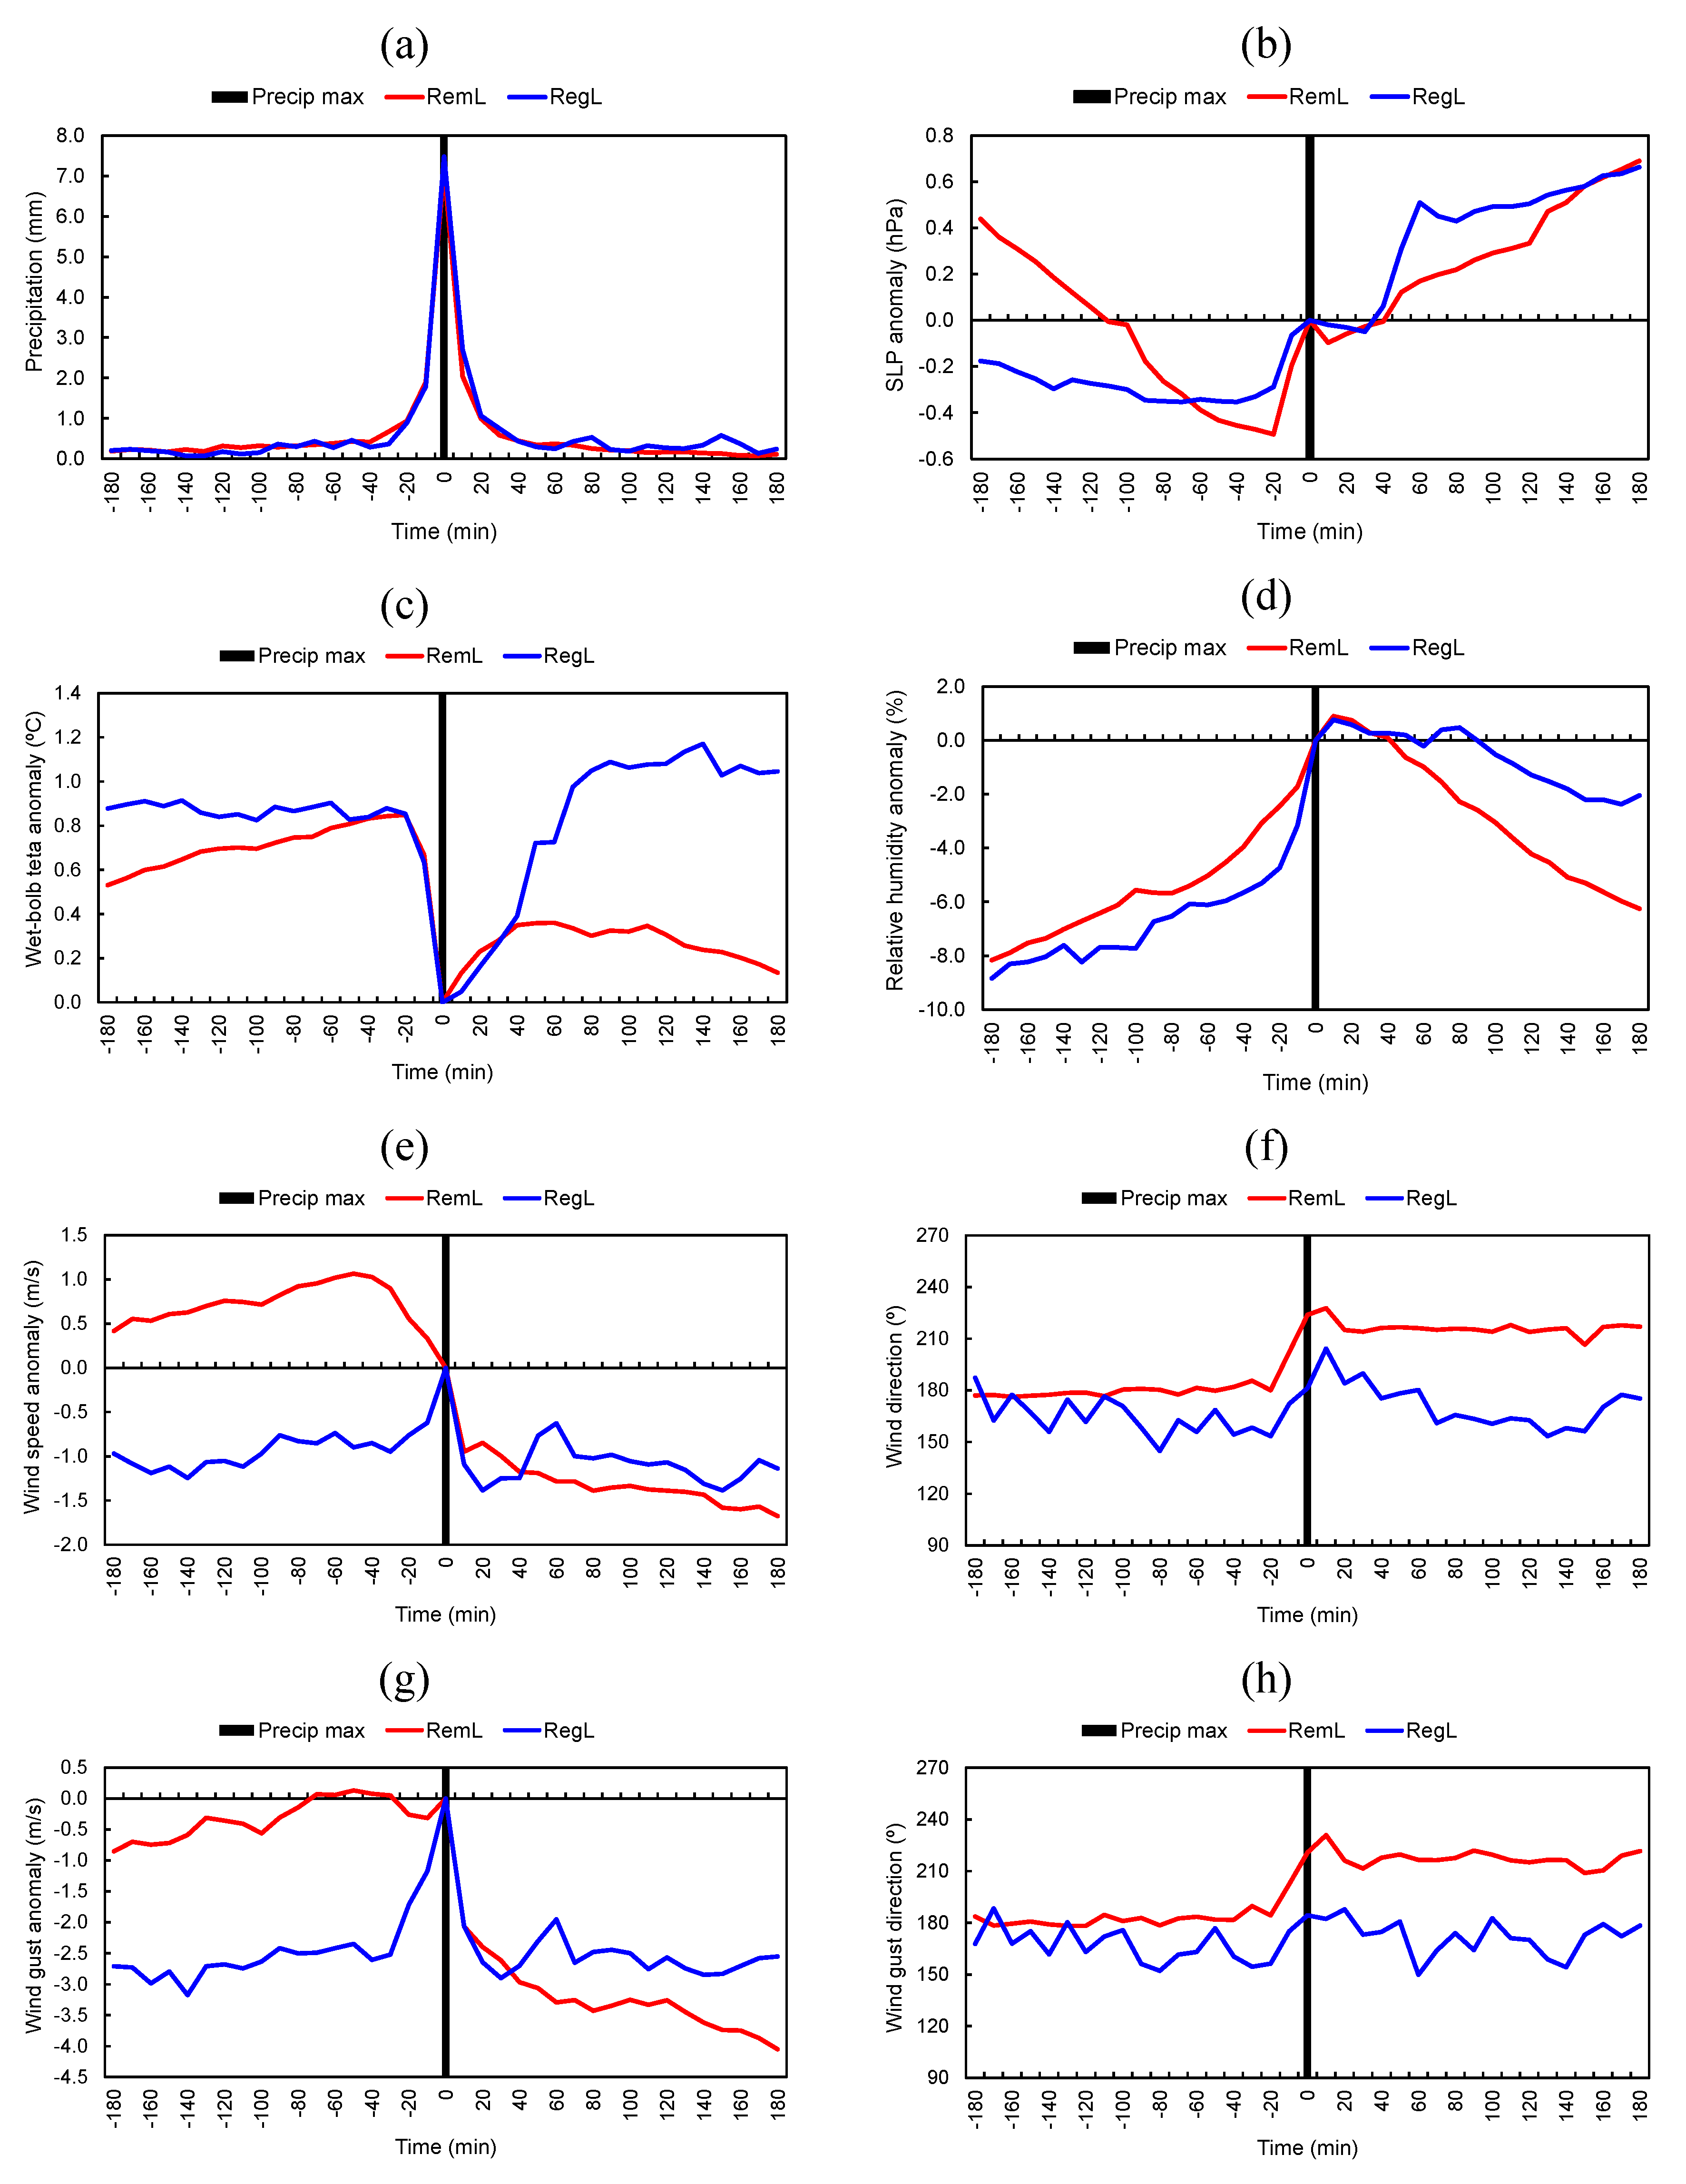
3.5. Temporal Evolution

Further insight into these SHHP events can be obtained through the analysis of their time series at a given WS, i.e., the evolution of the atmospheric variables during a period that comprises not only the event occurrence but also its preceding and succeeding instants. A 6-h period is chosen, centered at the event occurrence (180 min before and after the event), which might be considered long enough to capture the main changes in atmospheric conditions interrelated with the SHHP events. The temporal evolution was assessed for all WS. However, for the sake of brevity, only two WS will be discussed here: 545 (Porto Pedras Rubras) and 579 (Lisboa Gago Coutinho), both located near the main international Portuguese airports in Porto and Lisbon, respectively. The first WS (Porto) recorded 133 SHHP events (26 RegL and 107 RemL); the corresponding 6-h chronological profiles of different atmospheric variables by synoptic type are displayed in Figure 8. The second WS (Lisbon) recorded 87 SHHP events (35 RegL and 52 RemL); the respective profiles are shown in the Supplemental Material since very similar features to the first WS were found (Figure S3), although with a lower number of events. In effect, a detailed comparison between all WS profiles revealed quite similar behavior in all atmospheric variables (not shown). Hence, on average, the two selected WS are representative of the conditions over the whole of the country.
As expected, a nearly symmetrical and very pronounced peak of precipitation is seen at the event occurrence, thus hinting at the severity and short duration of most of the events (Figure 8a). However, no clear distinction can be found between RegL and RemL. Regarding the SLP anomaly, a pressure surge at the event occurrence was clear in both synoptic types, particularly in RemL (Figure 8b). SLP tended to decrease before the event and decrease after the event, as evidenced by the nearly V-shaped profiles interrupted by the pressure surges. The web-bulb potential temperature anomalies reveal a different evolution for each synoptic type (Figure 8c). A steep decrease is apparent in both RegL and RemL during the events, but a much slower recovery rate is found for RemL than for RegL. As the temperature is a reliable air mass tracer, this finding suggests a replacement of the air mass in RemL and its continuity in RegL. The evolution of relative humidity also supports the previous assumptions, with a sustained increase before the event occurrence, a particularly steep increase during it, maximum relative humidity 10–20 min after the event (due to the evaporation of precipitated water), followed by a smoother decrease thereafter in RemL than in RegL (Figure 8d).
The mean wind speed for RemL highlights the typical conditions of a cold front passage, with relatively strong winds before the event (pre-frontal air mass) and much weaker winds after the event in the post-front air mass (Figure 8e). For RegL, an isolated peak during the event can be found, without any suggestion of a sharp transition between pre-event and post-event meteorological conditions. For RemL, near the event occurrence, the wind veered from the south (180°) to nearly south-west (230° immediately after the event and then stabilizing at approximately 210°), this being consistent with the passage of a cold front (Figure 8f). On the other hand, for RegL, the wind veered during the rain event but recovered its former direction shortly after. Similar results are found for wind gusts (Figure 8g,h), although the changes were generally more abrupt, especially for the wind gust speed at the event occurrence in RegL, with a notably sharp maximum.
The outcomes from the analysis of the time series are consistent, on one hand, with the passage of frontal systems, mostly cold fronts, in RemL, largely characterized by air mass advection and baroclinically driven convection and, on the other hand, with instability lines in RegL, mainly featuring thermally driven convection. In both synoptic types, deep convection, regardless of its thermodynamic–dynamic genesis, plays a key role in the occurrence of SHHP events. Furthermore, as was mentioned in Section 1, surface pressure surges allied with heavy short-duration precipitation (frequently rain or hail) are a clear manifestation of mesohighs and of the possible downbursts associated with MCS.

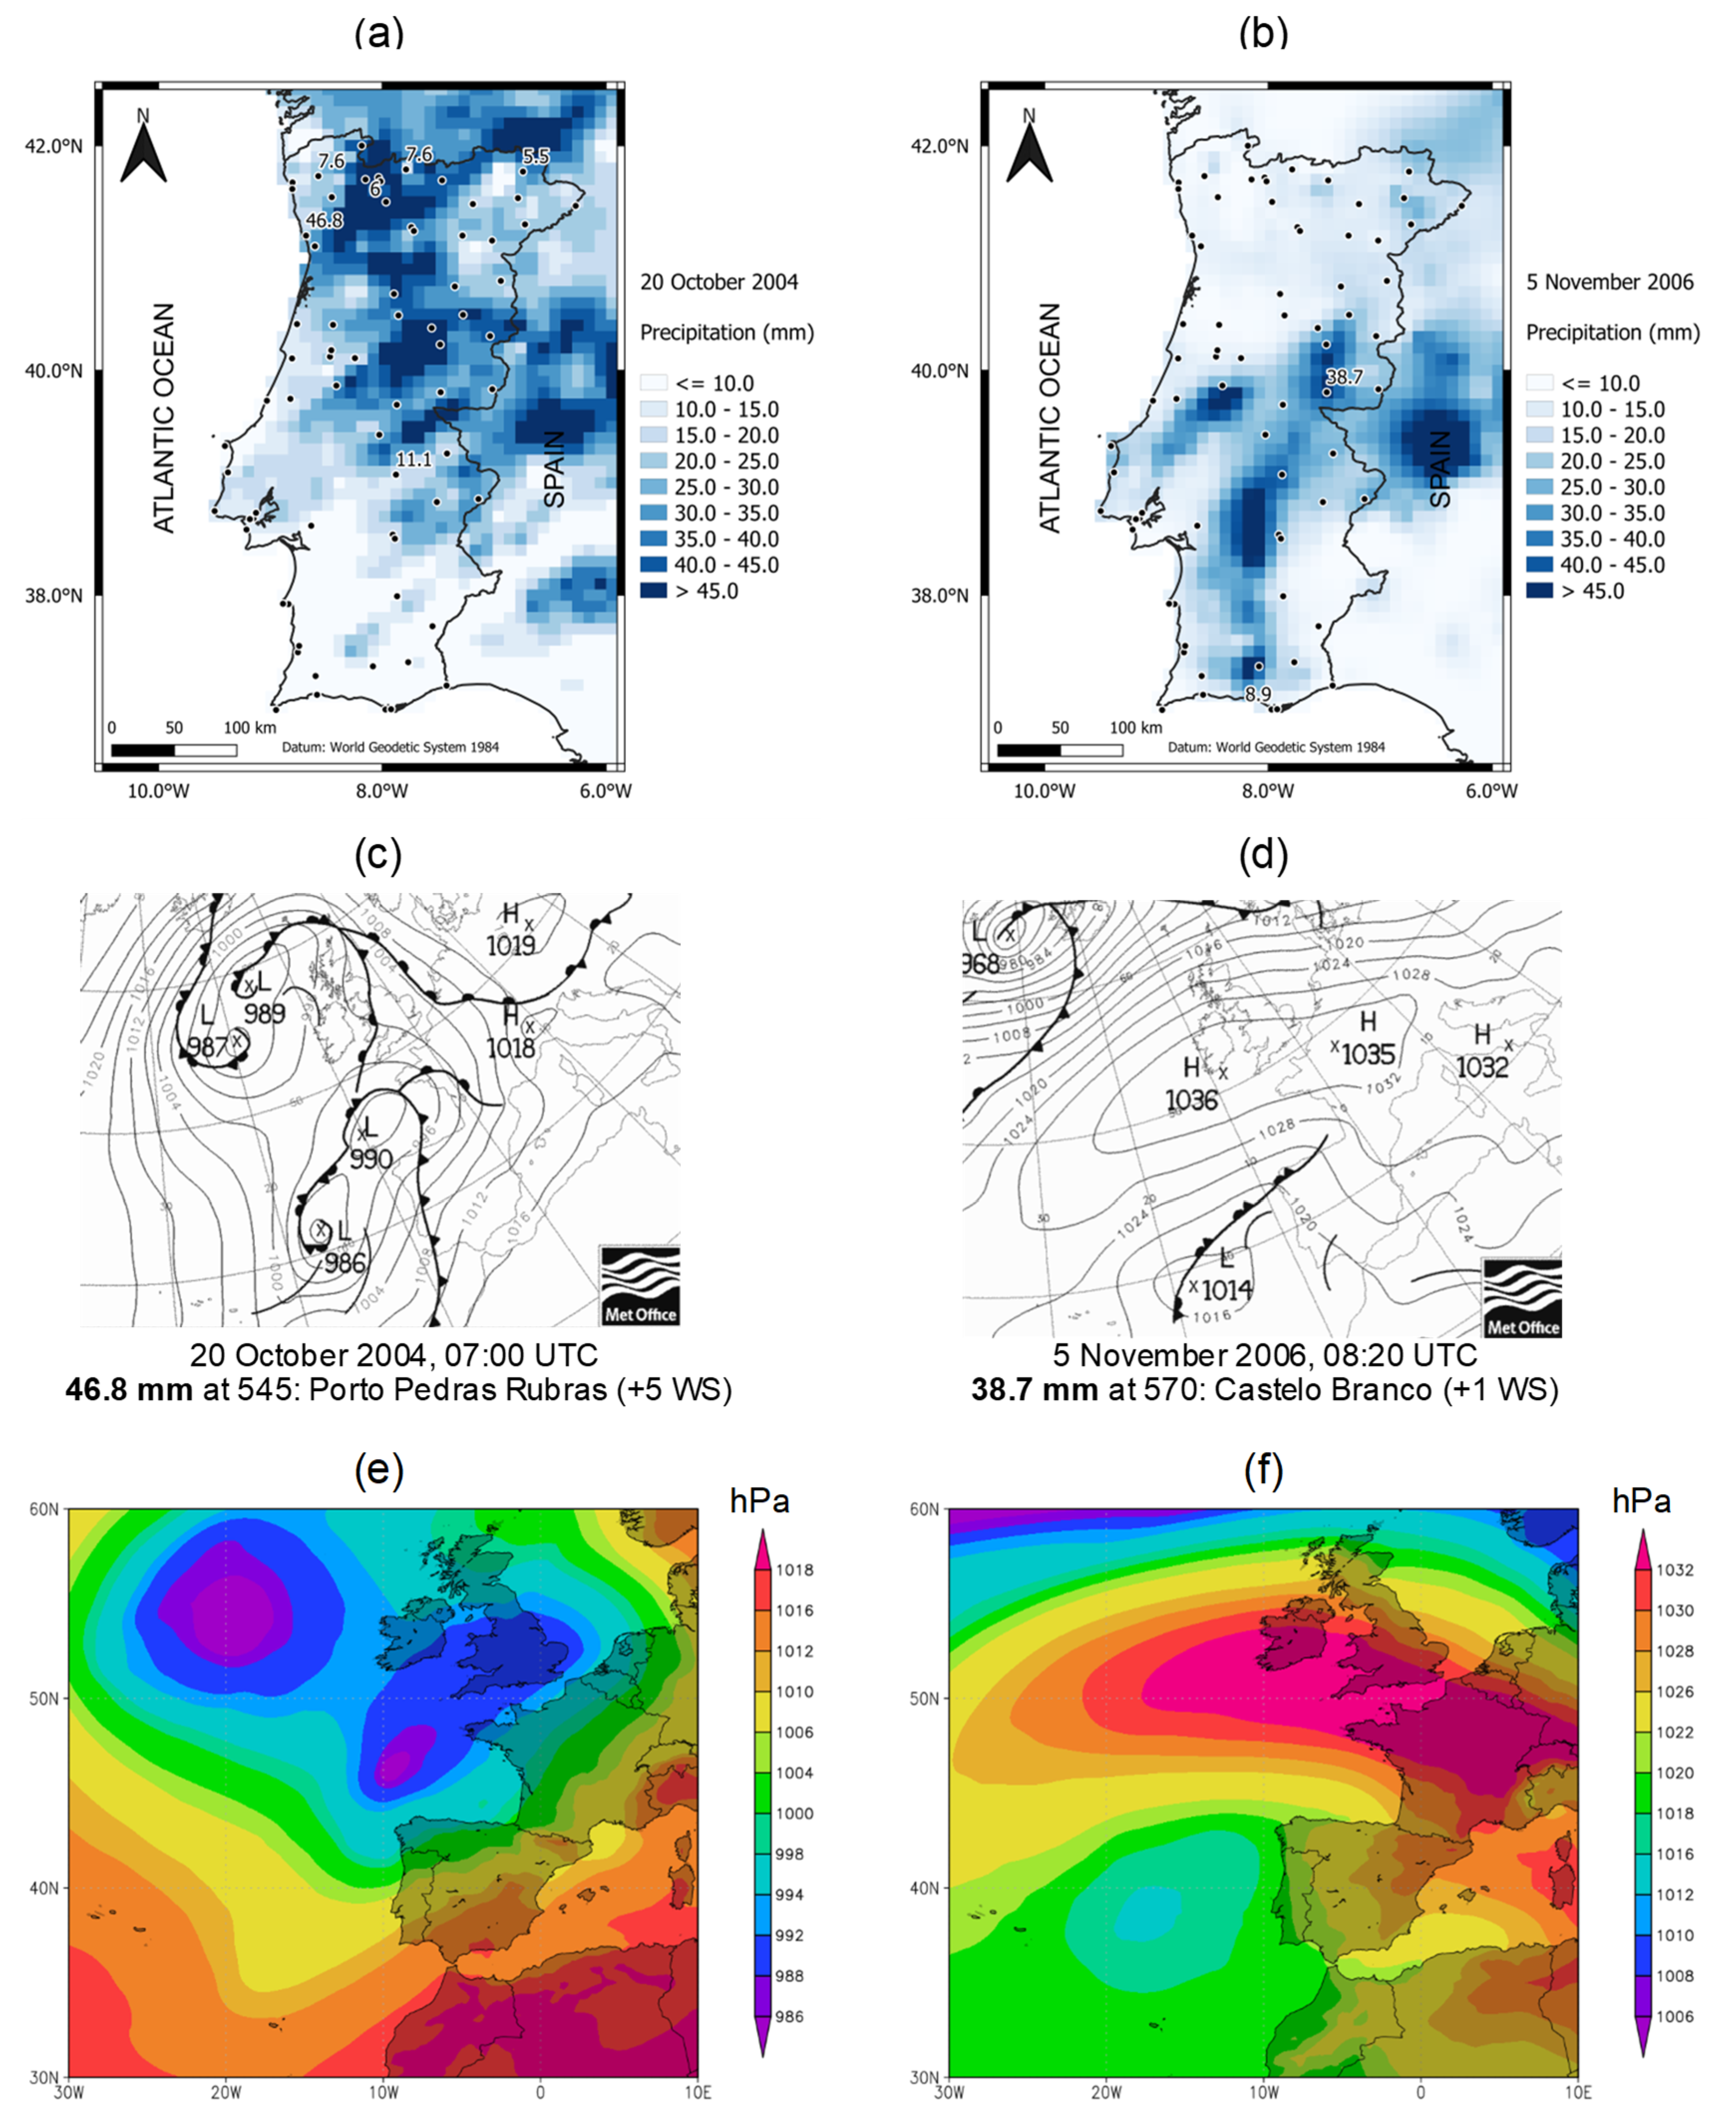
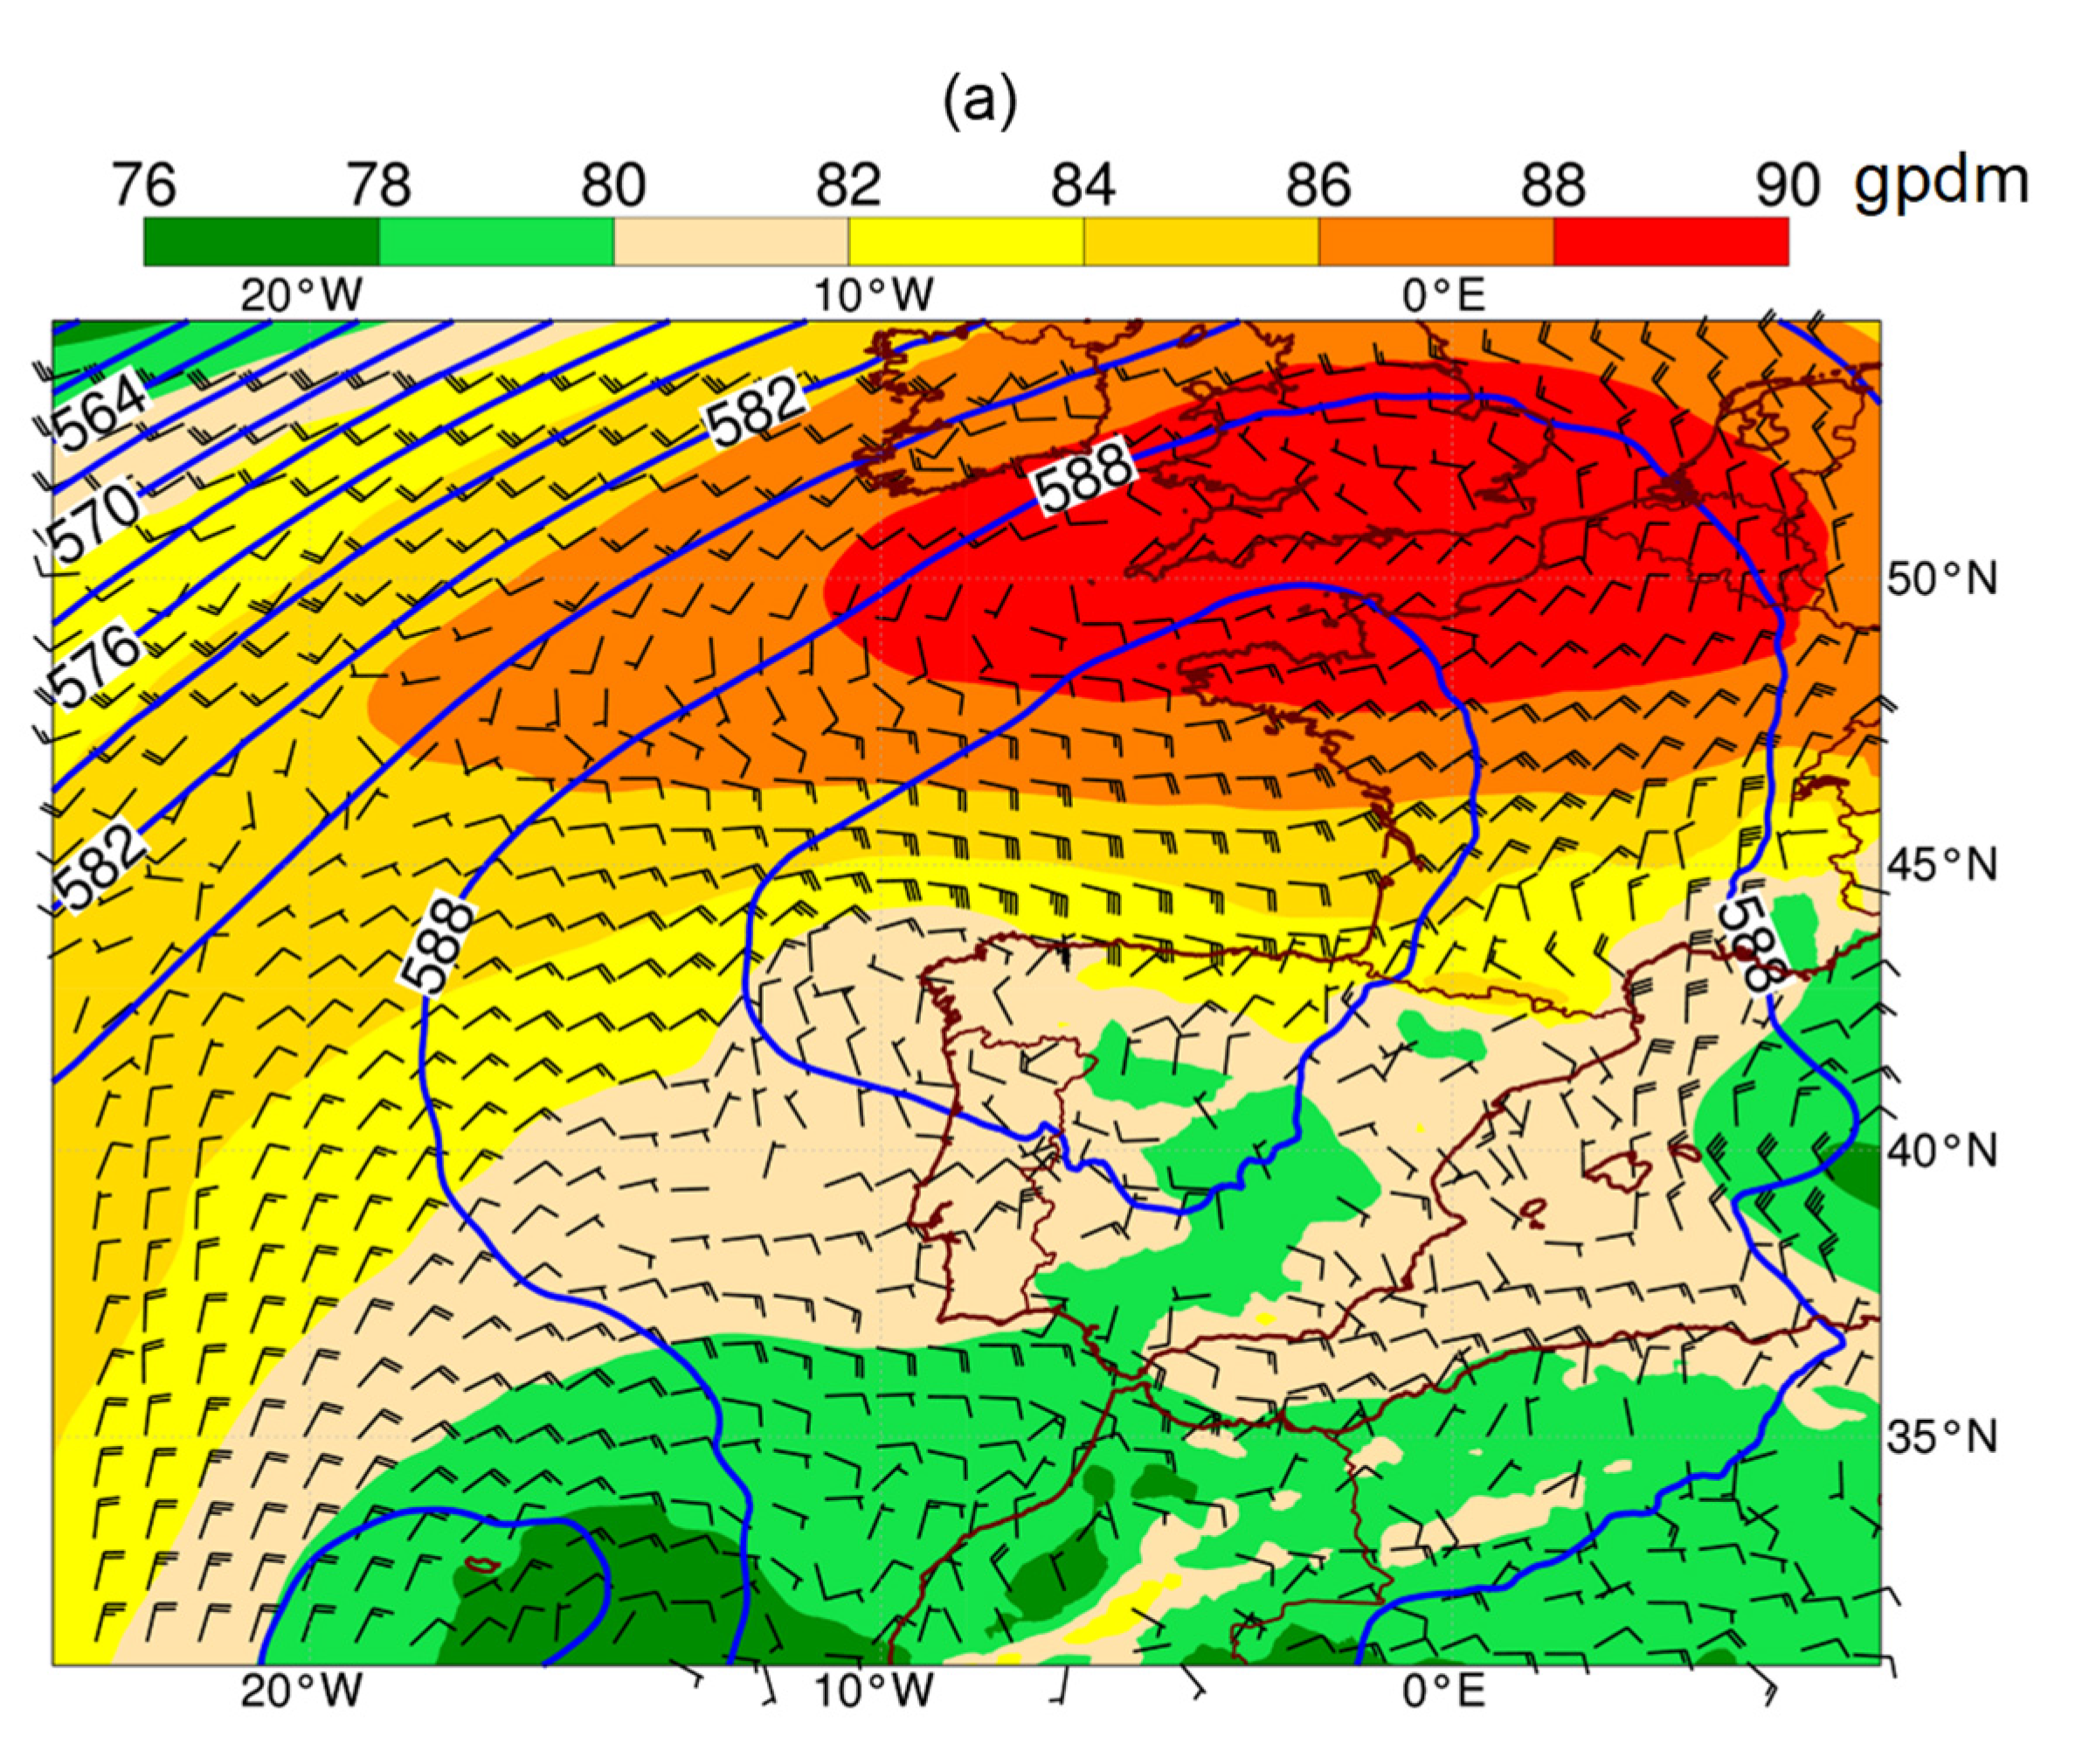
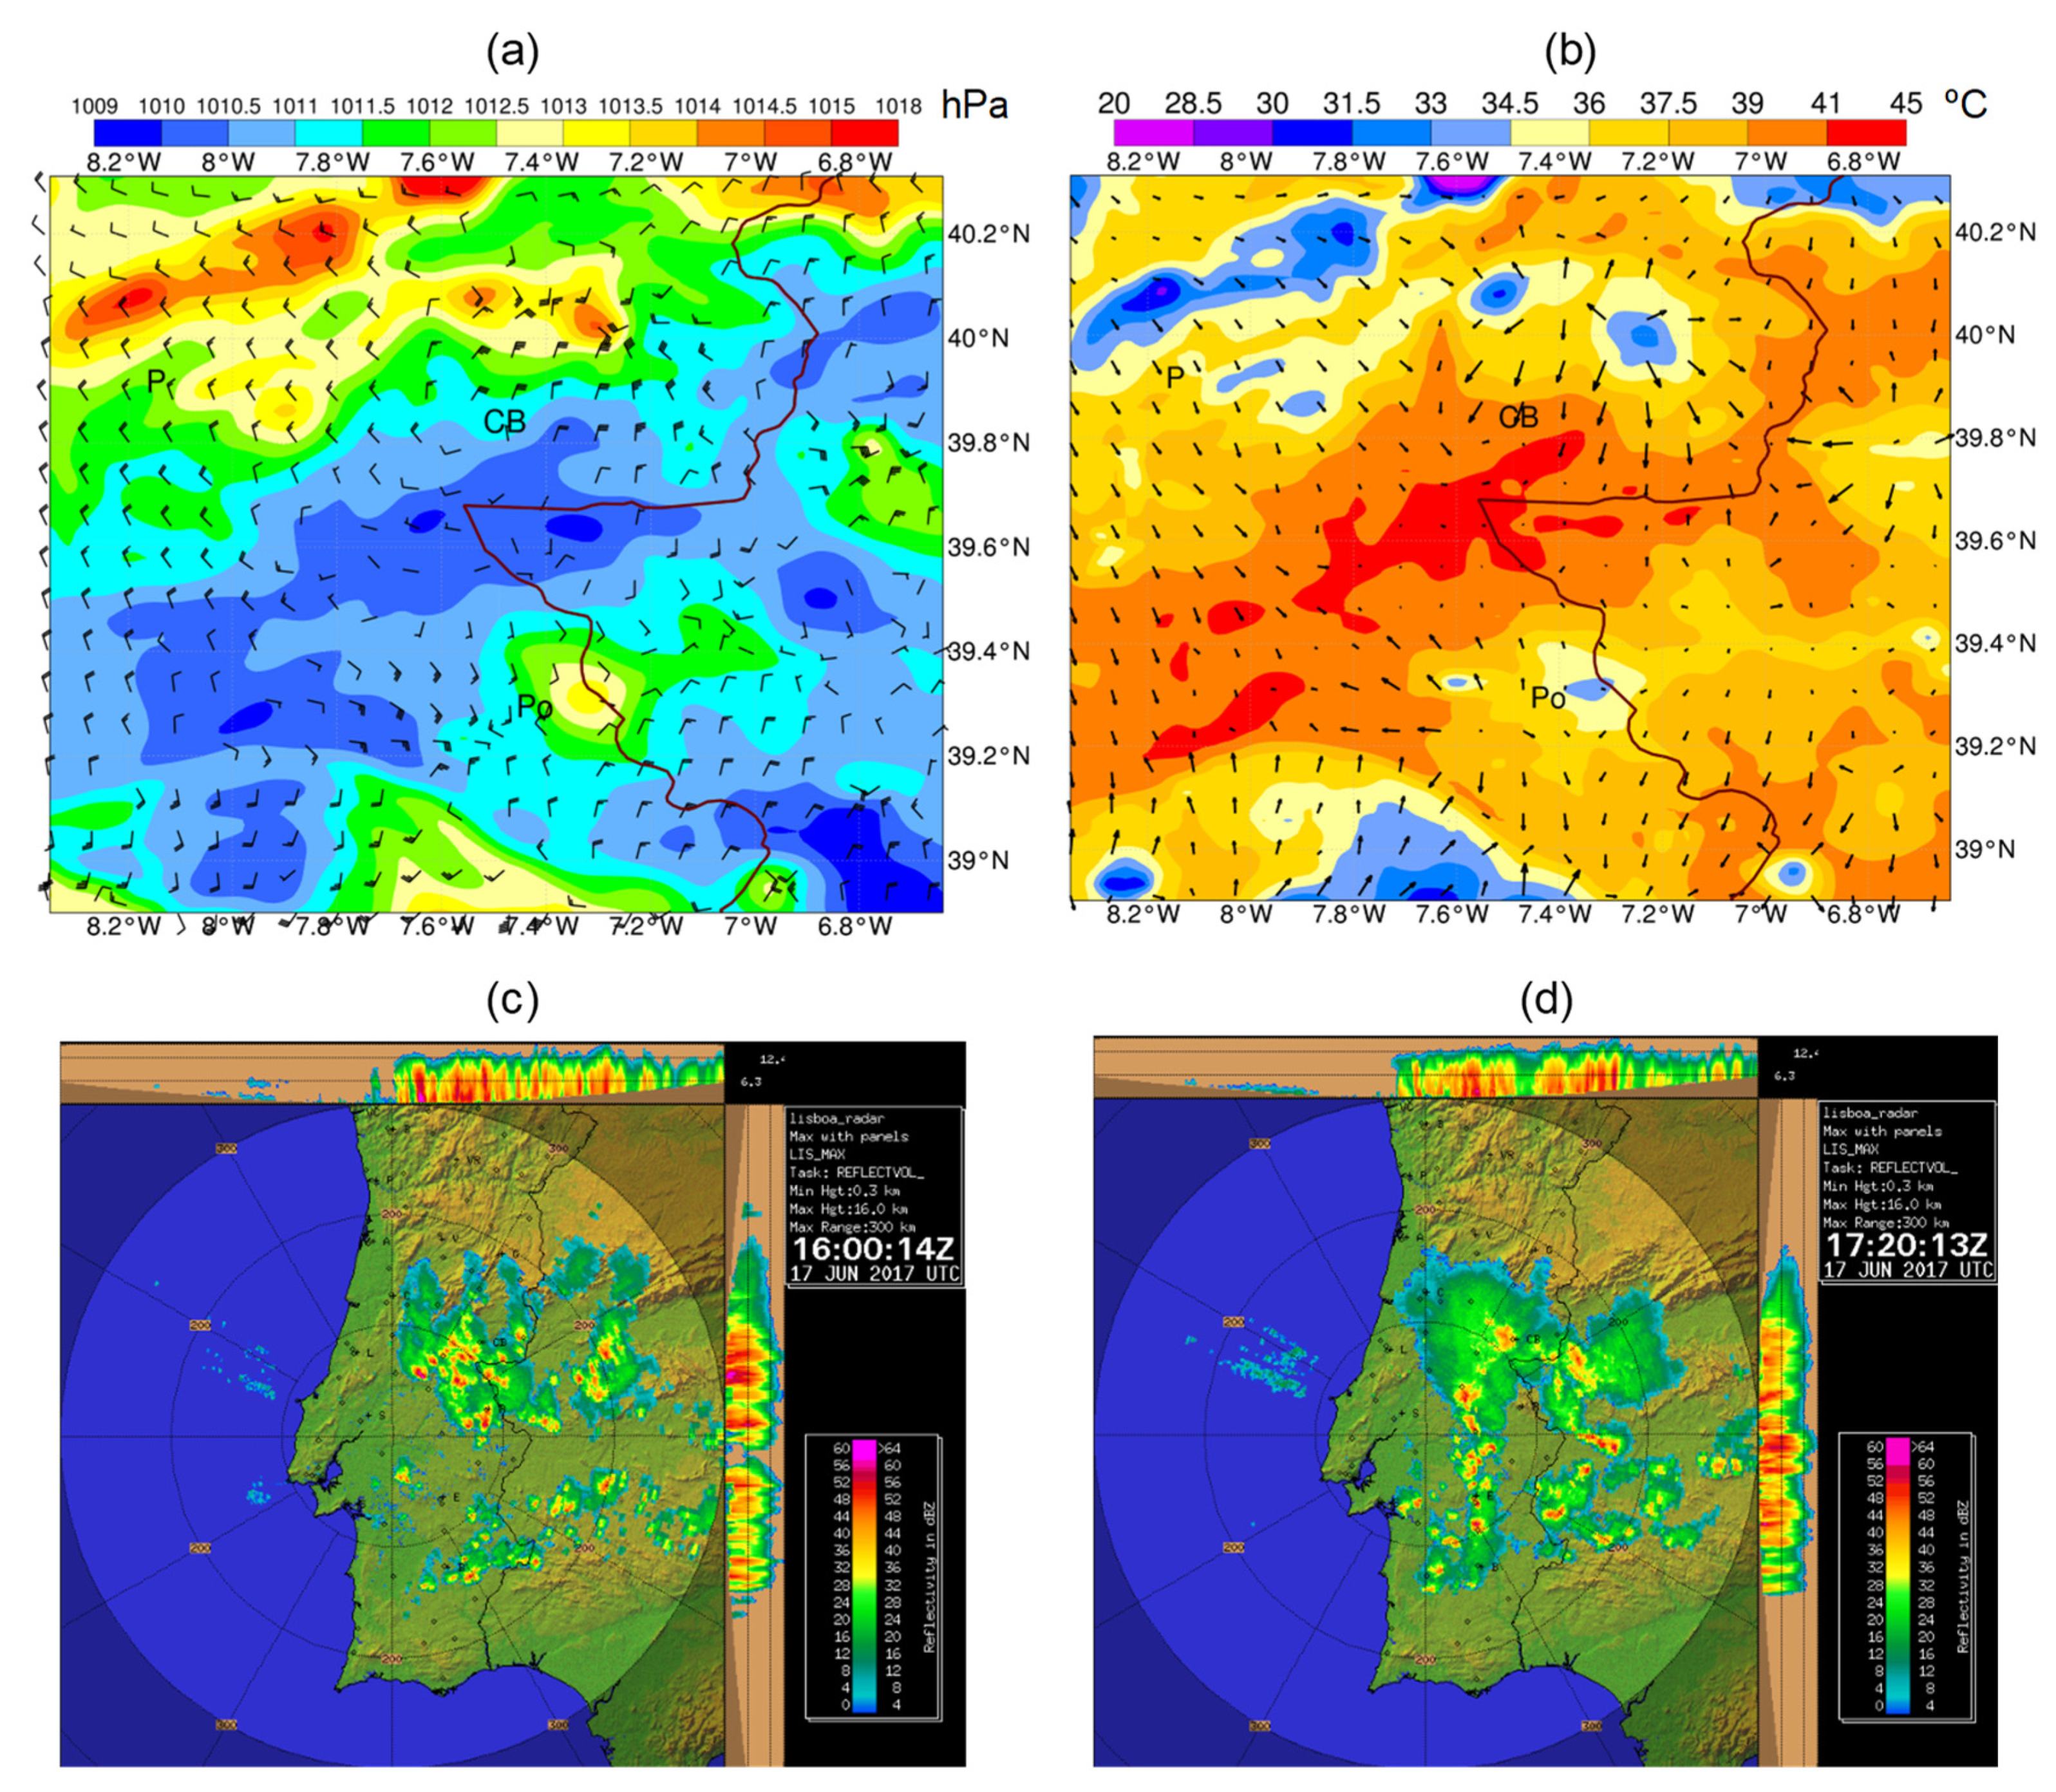
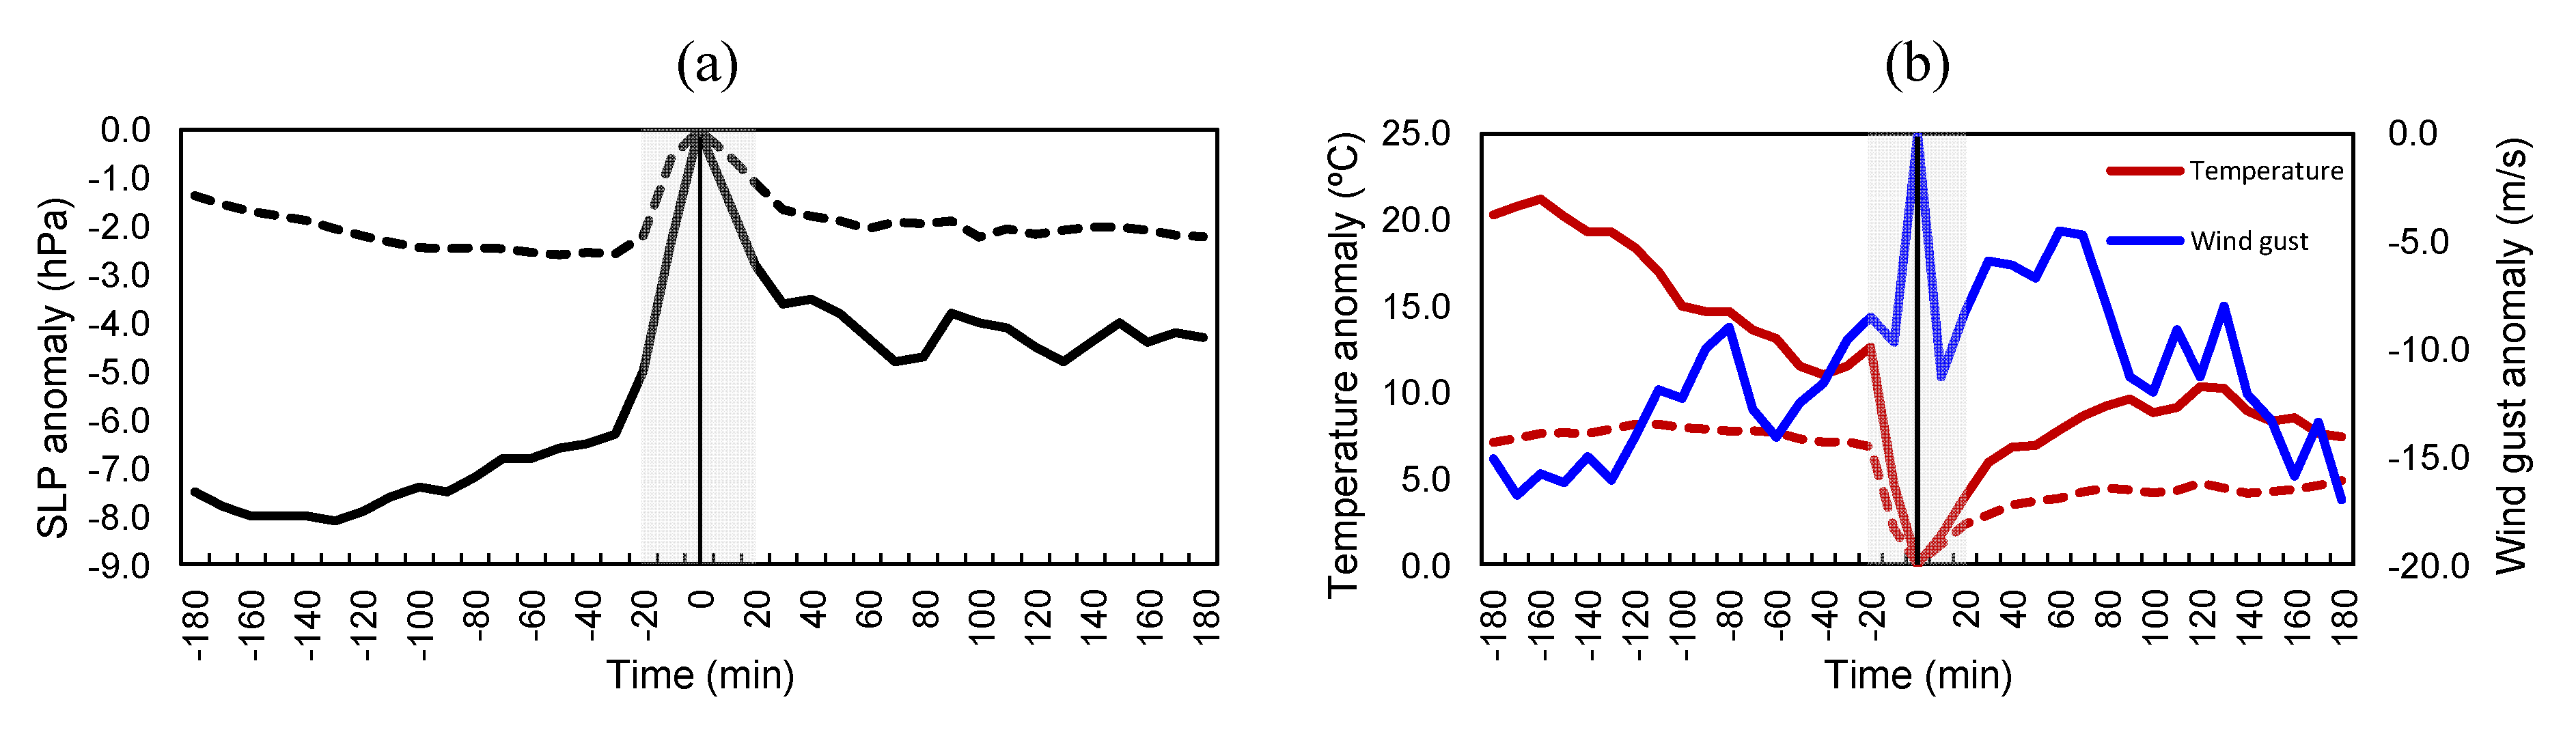
3.6. Mesohighs Associated with MCS: A Case Study

A catalog of the identified mesohigh episodes associated with 10-min precipitations of ≥5 mm in mainland Portugal, with RegL (28 episodes) and RemL (51 episodes) shown separately, is provided in the Supplemental Materials (Tables S2 and S3). This catalog was derived by applying the two criteria stated in Section 2. It is worth mentioning that these criteria are applied only to the subsample of WS that had surface pressure records (Table S1). Furthermore, not all mesohigh episodes were related to SHHP events, which implies that this calendar is not a full list of these episodes.
In particular, for the WS 570 (Castelo Branco), eight surface-pressure surges are identified, five under RegL and three under RemL (Table 1). This station is selected herein for illustration purposes since it is the station with more events. Moreover, a particularly severe weather episode, recorded at this WS on 17 June 2017, will be analyzed in greater detail (case study). On this day, several downbursts developed in association with a multicell convective system over central Portugal. These downbursts occurred concurrently with forest fires in the region, contributing to the rapid spreading and explosive intensification of fires [52]. These fires in central Portugal (also known as the Pedrógão Grande fires) caused a tragic death toll (66 deaths, officially), several hundreds of people were injured, and there were substantial socioeconomic losses, with damage to property, infrastructures, livestock losses, and the destruction of countless ecosystems and natural life.
On 17 June 2017, mainland Portugal was under the influence of a strong mid-tropospheric anticyclonic circulation southward of the British Isles (visible at 925 hPa) and extending to mid-levels over the Biscay Gulf and northern Iberia (Figure 9a). At low tropospheric levels, a thermal low-pressure system was settled over inner Iberia, with a clear signature at the 925 hPa geopotential height (Figure 9a). Otherwise, the central region of mainland Portugal was characterized by a very warm and dry low tropospheric environment, such as in WS 570 (Castelo Branco) at 12:00 UTC, with a 2-meter temperature as high as 38.1 °C, but a 2-meter dewpoint temperature of only 9.2 °C (Figure 9b). The skew-T Log-P diagram, based on the European Centre for Medium-range Weather Forecasts (ECMWF) analysis also reveals a moderate CAPE value (ca. 482 J kg−1), a free convection level at 615 hPa, and a null-buoyancy level at around 240 hPa, thus anticipating conditions favorable for deep convection throughout the mid and upper troposphere (Figure 9b). Additionally, it displays a nearly dry-adiabatic sub-cloud layer (up to 615 hPa), favorable for the development of a hybrid downburst [42].
The forecasts of the numerical weather prediction model, “Application of Research to Operations at Mesoscale”, AROME [47], valid for 18:00 UTC, reveal two cores of high SLP (>1014 hPa) slightly to the north of WS 570, where the wind gust displays a divergent pattern (Figure 10a), with maximum values exceeding 22.5 m s−1 (45 kt), thereby representing a clear signature consistent with two mesohighs. Other mesohighs are also visible over Spain and near WS 571 (Portalegre), this being the last one in a dissipative stage. The comparison of SLP and 2-meter temperature forecasts show that the mesohighs and cold pools nearly overlap (Figure 10b). In the mesohigh northeastward of WS 570, in association with the cold pool, the 2-meter temperature decreases by nearly 7 °C within a radius of 20–25 km, whereas the 80-m wind also reveals a strikingly divergent pattern, with maximum values over 22.5 m s−1 (Figure 10b). For this cold pool, the AROME model also predicted local increases in relative humidity (Figure S4). The presence of mesohighs and cold pools, with strong divergent winds, clearly suggests the occurrence of multiple downbursts. These downbursts were favored by the aforementioned evaporative cooling in the dry sub-cloud layer and negative buoyancy.
The IPMA-Coruche Doppler weather radar confirmed the occurrence of several downbursts in central Portugal during the afternoon of 17 June 2017 [52]. The boundary between the cold pool and the surrounding environment, commonly called the outflow boundary, is indeed known to be the primary mechanism for sustaining multicell thunderstorms [53]. On that day, the radar images corroborated the rapid and intense development of multicell convective storms. At 16:00 UTC, several convective cells were already visible throughout the region (Figure 10c); in the next 70–80 min, a convective cell hit Castelo Branco (WS 570), as evidenced by the 10-min precipitation of 7 mm. In effect, at 17:20 UTC, the strong aggregation of convective cells and an extensive anvil formation over a vast area are noteworthy (Figure 10d). Moreover, the satellite sandwich product discloses an overshooting over the station (Figure S5).
At WS 570, at the time of the SHHP event, the surface pressure increased by 7 hPa (Figure 11a), reflecting the presence of the mesohigh. This pressure surge was accompanied by a steep decrease in temperature (of nearly 10 °C) and a well-defined wind gust peak (Figure 11b). The corresponding meteogram provides further details, namely, a dramatic increase in relative humidity (70%) and an irregular variation in wind direction (Figure S6). All these features are coherent with the development of an MCS and the accompanying mesohigh/downbursts. On average, for the mesohigh events recorded at WS 570, the mean pressure rise was about 2 hPa (Figure 11a), which is consistent with surface pressure surges within convective systems reported by previous studies [40]. Similar behavior to the case study is also found for the 2-meter air temperature, averaged over all the recorded pressure surges, although it exhibited a smoother curve and weaker temperature drop, as is to be expected from a central tendency measure (Figure 11b).

4. Discussion

Although short-duration/sub-hourly heavy precipitation events (SHHP) are key drivers of meteorological hazards, such as flash floods, and are projected to become more intense and frequent under future climate conditions, their analysis is still in its infancy in mainland Portugal. Their study is undertaken here using a vast WS network (71 stations), covering the whole of the country and in a temporal window of 2000–2020. An SHHP event corresponds to an amount of precipitation in 10 min that is equal to or greater than 5.0 mm, which is shown to be a sufficiently high threshold to guarantee that only the most extreme events are selected (above the 99th percentile of the precipitation distribution when all precipitation days and WS are pooled). Furthermore, to enhance the robustness of the findings, only SHHP events that were concomitant with at least one other event on the same day are considered herein. However, it is also shown that less than 20% of the events occurred at a single WS (561 out of 2951). Therefore, no significant changes were found when considering all events (including single-site events) or multi-site events.
A detailed inspection of the SHHP-related meteorological conditions, using a meridional pressure gradient (MPG index) defined on an hourly timescale, revealed two main synoptic-scale weather types: remote and regional low-pressure systems (RemL and RegL, respectively). These conditions are illustrated for the two most extreme SHHP events. SHHP events are frequently associated with the fulfillment of the criteria for issuing severe precipitation warnings of 1-h precipitation (three warnings in every four events), but much less frequently with 6-h precipitation (one warning in every four events). The typically short duration of these events is apparent from this analysis. Wind gust warnings are also not common during SHHP events (warnings in less than 5% of the events). On the monthly/seasonal timescale, RegL SHHP events show two pronounced maxima in spring and autumn, whereas RemL SHHP events have a single maximum in autumn. Moreover, RegL events are largely concentrated in the afternoon and evening, while RemL events are much more uniformly distributed during the day, despite some bias toward mid-day and early afternoon. These features suggest that RegL events tend to be thermally driven, whereas RemL events tend to be baroclinically driven in association with traveling frontal systems, although it is not possible to separate both mechanisms as they are frequently intertwined. For example, the prevalence of mid-day occurrence in RemL events is a clear signal of thermal forcing as a result of solar radiation. Nevertheless, a more in-depth analysis of the dynamic characteristics of each synoptic type is beyond the scope of the present study but should be carried out in forthcoming research.
The analysis of temporal evolution revealed some noteworthy features related to the SHHP occurrences. For RemL, the wind is stronger 2 to 3 h before and during SHHPs, veering from 180° to 210° near the event; the SLP decreases until 20 min before the event, increasing afterward; wet-bulb temperature decreases around the time of the event and remains low. These signatures reflect cold-front passages, associated with low cores centered over the Biscay Gulf, or southward of the British Isles. For RegL, maximum winds coincide with precipitation peaks, and wet-bulb temperature briefly decreases during the SHHP event, suggesting that for RegL, SHHP events are mostly caused by convection lines. A preliminary linkage between the SHHPs and mesoscale convective systems is established by detecting sudden surface pressure surges, which are manifestations of mesohighs caused by evaporatively cooled downdrafts from precipitating clouds. A calendar of mesohigh episodes for all WS was produced, classified by synoptic type, thus permitting future research on these episodes. Although mesohighs associated with MCS are here identified in terms of SHHP events, some mesohighs may be linked to weaker precipitation events. Thus, this calendar is not a complete inventory of mesohighs in mainland Portugal.
The events of 17 June 2017 were considered herein as a case study, owing to their reported severity, but particularly because of the linkage to the occurrence of unprecedented forest fires in Portugal, with the loss of many human lives and catastrophic implications over a wide range of socio-economic sectors and natural systems. The distinctive markers of mesohighs, cold pools and the associated downbursts, were identified by weather stations. These signatures were also present in the AROME forecasts issued the day before the event. These downbursts were caused by an MCS (visible in satellite images and radar reflectivity), which developed in an environment characterized by weak synoptic forcing, accompanied by moderate CAPE and an inverted V-profile, with a very warm and dry layer from the surface to 650 hPa, which is typical of hybrid downbursts [42].
The present study provides a first inspection of the capability of AROME for forecasting downbursts over Portugal, showing that this model was able to identify coherent signatures indicative of downburst outflows, namely, the divergent pattern, the cold pool, and a mesohigh. A more comprehensive analysis will be required to assess the AROME performance under a wider range of conditions and for the whole dataset of the identified events, which is beyond the scope of the present study. This future investigation should also include the evaluation of the microburst windspeed potential index (MWPI), as defined by [54]. In addition, the false-alarm rates of these predictors should also be evaluated in forthcoming research.

5. Conclusions

The present study is the first to provide a comprehensive assessment of short-duration precipitation events in mainland Portugal, including an analysis of their underlying synoptic and mesoscale conditions, as well as their connection to MCS mesohighs (and implicitly to cold pools and possibly to downbursts). Their potentially damaging impacts on many natural systems and socio-economic sectors, which are expected to be aggravated by their likely strengthening under future warmer climate conditions, deserve further research to improve our current knowledge of their driving mechanisms, leading to improvements in both weather warnings and climate change projections. To achieve this purpose, the identification of dynamic precursors and their integration into numerical weather forecasting, early warning systems, and climate model experiments under anthropogenic radiative forcing, is of foremost relevance for effective risk reduction.

Supplementary Materials

The following supporting information can be downloaded at: https://www.mdpi.com/article/10.3390/cli10020028/s1, Table S1: List of the selected 71 weather stations (WS) in mainland Portugal. Their codes, name, latitude, longitude, and elevation (meters above mean sea level) are shown. The start and end years of the available data by weather station are also listed (end years for currently operational stations are indicated by -). The corresponding percentages of missing data in the 10-min precipitation over the recording period are also provided. Stations with surface pressure records are highlighted in their codes with *. Data source: IPMA. Table S2: List of mesohigh episodes associated with SHHP events for the synoptic-type RegL, with the year, month, day, and 10-min occurrence (in chronological order). The weather station (WS) code is also indicated. Table S3: List of mesohigh episodes associated with SHHP events for the synoptic-type RemL, with the year, month, day, and 10-min occurrence (in chronological order). The weather station (WS) code is also indicated. Figure S1: Synoptic analysis charts for the third-to-tenth severest SHHP events (10-min precipitation ≥25 mm). The first two severest events are shown in Figure 4. Source: Met Office (metoffice.gov.uk accessed on 3 February 2022). Figure S2: Distribution of the outlined atmospheric variables recorded at the weather stations, at the occurrence of the sub-hourly extreme precipitation events and by class separately (left panels: RegL, right panels: RemL). Figure S3: Mean chronological series over a 6-h window centered at the instant of the event occurrences (87 events with 10-min precipitation ≥5.0 mm, 35 RegL and 52 RemL), for the Lisbon weather station (579: Lisboa Gago Coutinho) and for: (a) precipitation, (b) sea-level pressure anomaly (w. r. t. the event instant), (c) wet-bulb potential temperature anomaly, (d) relative humidity anomaly, (e) wind speed anomaly, (f) wind direction, (g) wind gust, (h) wind gust direction. The event occurrence is tracked with a vertical black line. Figure S4: AROME forecast (H + 30) of 2-meter relative humidity (in %) on 17 June 2017, valid at 18:00 UTC. Figure S5: Satellite sandwich product on 17 June 2017, at 17:00 UTC. This product blends the High-Resolution Visible (HRV) image (background) with a color-enhanced IR10.8 image, showing the details of the cloud top temperature (in K). Figure S6: Meteogram based on the 10-min observations at weather station 570 (Castelo Branco), on 17 and 18 June 2017.

Author Contributions

Conceptualization, J.A.S. and M.B.-P.; data curation, M.B.-P.; formal analysis, J.A.S. and M.B.-P.; funding acquisition, J.A.S.; investigation, J.A.S. and M.B.-P.; methodology, J.A.S. and M.B.-P.; resources, J.A.S.; software, J.A.S. and M.B.-P.; validation, J.A.S. and M.B.-P.; visualization, J.A.S. and M.B.-P.; writing—original draft, J.A.S.; writing—review and editing, J.A.S. and M.B.-P. All authors have read and agreed to the published version of the manuscript.

Funding

This work is funded by the Clim4Vitis project “Climate change impact mitigation for European viticulture: knowledge transfer for an integrated approach”, funded by European Union’s Horizon 2020 Research and Innovation Programme, under grant agreement nº 810176 and FCT—Portuguese Foundation for Science and Technology, under the project UIDB/04033/2020.

Institutional Review Board Statement

Not applicable.

Informed Consent Statement

Not applicable.

Data Availability Statement

Not applicable.

Acknowledgments

We acknowledge the ERA5 dataset from the Copernicus Climate Change Service (C3S) and the IBERIA01 dataset from DIGITAL.CSIC (http://dx.doi.org/10.20350/digitalCSIC/8641, accessed on 3 February 2022). We also would like to thank the editor and the four anonymous reviewers for their very useful contributions.

Conflicts of Interest

The authors declare no conflict of interest.

References

  1. Krøgli, I.K.; Devoli, G.; Colleuille, H.; Boje, S.; Sund, M.; Engen, I.K. The Norwegian forecasting and warning service for rainfall- and snowmelt-induced landslides. Nat. Hazards Earth Syst. Sci. 2018, 18, 1427–1450. [Google Scholar] [CrossRef] [Green Version]
  2. Petrucci, O.; Aceto, L.; Bianchi, C.; Bigot, V.; Brázdil, R.; Pereira, S.; Kahraman, A.; Kılıç, Ö.; Kotroni, V.; Llasat, M.C.; et al. Flood Fatalities in Europe, 1980–2018: Variability, Features, and Lessons to Learn. Water 2019, 11, 1682. [Google Scholar] [CrossRef] [Green Version]
  3. Cortès, M.; Turco, M.; Llasat-Botija, M.; Llasat, M.C. The relationship between precipitation and insurance data for floods in a Mediterranean region (northeast Spain). Nat. Hazards Earth Syst. Sci. 2018, 18, 857–868. [Google Scholar] [CrossRef] [Green Version]
  4. Gaume, E.; Bain, V.; Bernardara, P.; Newinger, O.; Barbuc, M.; Bateman, A.; Blaškovičová, L.; Blöschl, G.; Borga, M.; Dumitrescu, A.; et al. A compilation of data on European flash floods. J. Hydrol. 2009, 367, 70–78. [Google Scholar] [CrossRef] [Green Version]
  5. Mäkinen, H.; Kaseva, J.; Trnka, M.; Balek, J.; Kersebaum, K.C.; Nendel, C.; Gobin, A.; Olesen, J.E.; Bindi, M.; Ferrise, R.; et al. Sensitivity of European wheat to extreme Weather. Field Crops Res. 2018, 222, 209–217. [Google Scholar] [CrossRef]
  6. Hooper, E.; Chapman, L.; Quinn, A. Investigating the impact of precipitation on vehicle speeds on UK motorways. Meteorol. Appl. 2014, 21, 194–201. [Google Scholar] [CrossRef]
  7. Taszarek, M.; Kendzierski, S.; Pilguj, N. Hazardous weather affecting European airports: Climatological estimates of situations with limited visibility, thunderstorm, low-level wind shear and snowfall from ERA5. Weather Clim. Extrem. 2020, 28, 100243. [Google Scholar] [CrossRef]
  8. Groenemeijer, P.; Becker, N.; Djidara, M.; Gavin, K.; Hellenberg, T.; Holzer, A.; Juga, I.; Jokinen, P.; Jylha, K.; Lehtonen, I.; et al. Past Cases of Extreme Weather Impact on Critical Infrastructure in Europe. RAIN-Risk Analysis of Infrastructure Networks in Response to Extreme Weather; ESSL: Wesssling, Germany, 2015; p. 130. [Google Scholar]
  9. Smith, J.A.; Miller, A.J.; Baeck, M.L.; Nelson, P.A.; Fisher, G.T.; Meierdiercks, K.L. Extraordinary Flood Response of a Small Urban Watershed to Short-Duration Convective Rainfall. J. Hydrometeorol. 2005, 6, 599–617. [Google Scholar] [CrossRef]
  10. Yang, L.; Smith, J.; Baeck, M.L.; Smith, B.; Tian, F.; Niyogi, D. Structure and evolution of flash flood producing storms in a small urban watershed. J. Geophys. Res. Atmos. 2016, 121, 3139–3152. [Google Scholar] [CrossRef]
  11. IPCC. Climate Change 2014: Synthesis Report. Contribution of Working Groups I, II and III to the Fifth Assessment Report of the Intergovernmental Panel on Climate Change; Core Writing Team, Pachauri, R.K., Meyer, L.A., Eds.; IPCC: Geneva, Switzerland, 2014; p. 151. [Google Scholar]
  12. IPCC. Global Warming of 1.5 °C. An IPCC Special Report on the Impacts of Global Warming of 1.5 °C above Pre-Industrial Levels and Related Global Greenhouse Gas Emission Pathways, in the Context of Strengthening the Global Response to the Threat of Climate Change, Sustainable Development, and Efforts to Eradicate Poverty; World Meteorological Organization, Ed.; IPCC: Geneva, Switzerland, 2018; p. 32. [Google Scholar]
  13. Cardoso, R.M.; Soares, P.M.M.; Miranda, P.M.A.; Belo-Pereira, M. WRF high resolution simulation of Iberian mean and extreme precipitation climate. Int. J. Climatol. 2013, 33, 2591–2608. [Google Scholar] [CrossRef]
  14. Belo-Pereira, M.; Dutra, E.; Viterbo, P. Evaluation of global precipitation data sets over the Iberian Peninsula. J. Geophys. Res. Atmos. 2011, 116, D20101. [Google Scholar] [CrossRef]
  15. Ramos, A.M.; Trigo, R.M.; Liberato, M.L.R. A ranking of high-resolution daily precipitation extreme events for the Iberian Peninsula. Atmos. Sci. Lett. 2014, 15, 328–334. [Google Scholar] [CrossRef]
  16. Santos, J.A.; Corte-Real, J.; Leite, S.M. Weather regimes and their connection to the winter rainfall in Portugal. Int. J. Climatol. 2005, 25, 33–50. [Google Scholar] [CrossRef]
  17. Trigo, R.M.; DaCamara, C.C. Circulation weather types and their influence on the precipitation regime in Portugal. Int. J. Climatol. 2000, 20, 1559–1581. [Google Scholar] [CrossRef]
  18. Santos, J.A.; Andrade, C.; Corte-Real, J.; Leite, S. The role of large-scale eddies in the occurrence of winter precipitation deficits in Portugal. Int. J. Climatol. 2009, 29, 1493–1507. [Google Scholar] [CrossRef]
  19. Santos, J.A.; Pinto, J.G.; Ulbrich, U. On the development of strong ridge episodes over the eastern North Atlantic. Geophys. Res. Lett. 2009, 36, L17804. [Google Scholar] [CrossRef] [Green Version]
  20. Woollings, T.; Pinto, J.G.; Santos, J.A. Dynamical Evolution of North Atlantic Ridges and Poleward Jet Stream Displacements. J. Atmos. Sci. 2011, 68, 954–963. [Google Scholar] [CrossRef]
  21. Santos, J.A.; Woollings, T.; Pinto, J.G. Are the Winters 2010 and 2012 Archetypes Exhibiting Extreme Opposite Behavior of the North Atlantic Jet Stream? Mon. Weather Rev. 2013, 141, 3626–3640. [Google Scholar] [CrossRef] [Green Version]
  22. Santos, J.A.; Belo-Pereira, M. A comprehensive analysis of hail events in Portugal: Climatology and consistency with atmospheric circulation. Int. J. Climatol. 2019, 39, 188–205. [Google Scholar] [CrossRef] [Green Version]
  23. Sousa, J.F.; Fragoso, M.; Mendes, S.; Corte-Real, J.; Santos, J.A. Statistical–dynamical modeling of the cloud-to-ground lightning activity in Portugal. Atmospheric Research 2013, 132–133, 46–64. [Google Scholar] [CrossRef]
  24. Santos, J.A.; Reis, M.A.; Sousa, J.; Leite, S.M.; Correia, S.; Janeira, M.; Fragoso, M. Cloud-to-ground lightning in Portugal: Patterns and dynamical forcing. Nat. Hazards Earth Syst. Sci. 2012, 12, 639–649. [Google Scholar] [CrossRef] [Green Version]
  25. Morán-Tejeda, E.; Llorente-Pinto, J.M.; Ceballos-Barbancho, A.; Tomás-Burguera, M.; Azorín-Molina, C.; Alonso-González, E.; Revuelto, J.; Herrero, J.; López-Moreno, J.I. The significance of monitoring high mountain environments to detect heavy precipitation hotspots: A case study in Gredos, Central Spain. Theor. Appl. Climatol. 2021, 146, 1175–1188. [Google Scholar] [CrossRef]
  26. Llasat, M.C.; del Moral, A.; Cortès, M.; Rigo, T. Convective precipitation trends in the Spanish Mediterranean region. Atmos. Res. 2021, 257, 105581. [Google Scholar] [CrossRef]
  27. Vergara-Temprado, J.; Ban, N.; Schär, C. Extreme Sub-Hourly Precipitation Intensities Scale Close to the Clausius-Clapeyron Rate Over Europe. Geophys. Res. Lett. 2021, 48, e2020GL089506. [Google Scholar] [CrossRef]
  28. Santos, J.A.; Belo-Pereira, M.; Fraga, H.; Pinto, J.G. Understanding climate change projections for precipitation over western Europe with a weather typing approach. J. Geophys. Res. Atmos. 2016, 121, 1170–1189. [Google Scholar] [CrossRef] [Green Version]
  29. Prein, A.F.; Rasmussen, R.M.; Ikeda, K.; Liu, C.; Clark, M.P.; Holland, G.J. The future intensification of hourly precipitation extremes. Nat. Clim. Change 2017, 7, 48–52. [Google Scholar] [CrossRef]
  30. Santos, M.; Fonseca, A.; Fragoso, M.; Santos, J.A. Recent and future changes of precipitation extremes in mainland Portugal. Theor. Appl. Climatol. 2019, 137, 1305–1319. [Google Scholar] [CrossRef]
  31. Santos, M.; Fragoso, M.; Santos, J.A. Regionalization and susceptibility assessment to daily precipitation extremes in mainland Portugal. Appl. Geogr. 2017, 86, 128–138. [Google Scholar] [CrossRef]
  32. Santos, M.; Santos, J.A.; Fragoso, M. Atmospheric driving mechanisms of flash floods in Portugal. Int. J. Climatol. 2017, 37, 671–680. [Google Scholar] [CrossRef]
  33. Fonseca, A.R.; Santos, J.A. Predicting hydrologic flows under climate change: The Tâmega Basin as an analog for the Mediterranean region. Sci. Total Environ. 2019, 668, 1013–1024. [Google Scholar] [CrossRef]
  34. Moore, J.T.; Glass, F.H.; Graves, C.E.; Rochette, S.M.; Singer, M.J. The Environment of Warm-Season Elevated Thunderstorms Associated with Heavy Rainfall over the Central United States. Weather Forecast. 2003, 18, 861–878. [Google Scholar] [CrossRef] [Green Version]
  35. Houze Jr., R. A. Mesoscale convective systems. Rev. Geophys. 2004, 42, RG4003. [Google Scholar] [CrossRef] [Green Version]
  36. Pinto, P.; Belo-Pereira, M. Damaging Convective and Non-Convective Winds in Southwestern Iberia during Windstorm Xola. Atmosphere 2020, 11, 692. [Google Scholar] [CrossRef]
  37. Lee, W.-C.; Wakimoto, R.M.; Carbone, R.E. The Evolution and Structure of a “Bow–Echo-Microburst” Event. Part II: The Bow Echo. Mon. Weather Rev. 1992, 120, 2211–2225. [Google Scholar] [CrossRef] [Green Version]
  38. Mathias, L.; Ermert, V.; Kelemen, F.D.; Ludwig, P.; Pinto, J.G. Synoptic Analysis and Hindcast of an Intense Bow Echo in Western Europe: The 9 June 2014 Storm. Weather Forecast. 2017, 32, 1121–1141. [Google Scholar] [CrossRef]
  39. Adams-Selin, R.D.; Johnson, R.H. Mesoscale Surface Pressure and Temperature Features Associated with Bow Echoes. Mon. Weather Rev. 2010, 138, 212–227. [Google Scholar] [CrossRef] [Green Version]
  40. Engerer, N.A.; Stensrud, D.J.; Coniglio, M.C. Surface Characteristics of Observed Cold Pools. Mon. Weather Rev. 2008, 136, 4839–4849. [Google Scholar] [CrossRef]
  41. Wakimoto, R.M. Forecasting Dry Microburst Activity over the High Plains. Mon. Weather Rev. 1985, 113, 1131–1143. [Google Scholar] [CrossRef] [Green Version]
  42. Ellrod, G. Environmental Conditions Associated with the Dallas Microburst Storm Determined from Satellite Soundings. Weather Forecast. 1989, 4, 469–484. [Google Scholar] [CrossRef] [Green Version]
  43. Fujita, T.T. Tornadoes and Downbursts in the Context of Generalized Planetary Scales. J. Atmos. Sci. 1981, 38, 1511–1534. [Google Scholar] [CrossRef] [Green Version]
  44. Clark, M.R. Doppler radar observations of non-occluding, cyclic vortex genesis within a long-lived tornadic storm over southern England. Q. J. R. Meteorol. Soc. 2012, 138, 439–454. [Google Scholar] [CrossRef]
  45. Keene, K.M.; Schumacher, R.S. The Bow and Arrow Mesoscale Convective Structure. Mon. Weather Rev. 2013, 141, 1648–1672. [Google Scholar] [CrossRef] [Green Version]
  46. Clark, M.R. Investigating cold-frontal gradients in surface parameters using operationally-available minute-resolution data. Meteorol. Appl. 2013, 20, 405–416. [Google Scholar] [CrossRef]
  47. Termonia, P.; Fischer, C.; Bazile, E.; Bouyssel, F.; Brožková, R.; Bénard, P.; Bochenek, B.; Degrauwe, D.; Derková, M.; El Khatib, R.; et al. The ALADIN System and its canonical model configurations AROME CY41T1 and ALARO CY40T1. Geosci. Model Dev. 2018, 11, 257–281. [Google Scholar] [CrossRef] [Green Version]
  48. Herrera, S.; Cardoso, R.M.; Soares, P.M.; Espírito-Santo, F.; Viterbo, P.; Gutiérrez, J.M. Iberia01: A new gridded dataset of daily precipitation and temperatures over Iberia. Earth Syst. Sci. Data 2019, 11, 1947–1956. [Google Scholar] [CrossRef] [Green Version]
  49. Dunkerley, D. Sub-Daily Rainfall Intensity Extremes: Evaluating Suitable Indices at Australian Arid and Wet Tropical Observing Sites. Water 2019, 11, 2616. [Google Scholar] [CrossRef] [Green Version]
  50. Hersbach, H.; Bell, B.; Berrisford, P.; Hirahara, S.; Horányi, A.; Muñoz-Sabater, J.; Nicolas, J.; Peubey, C.; Radu, R.; Schepers, D.; et al. The ERA5 global reanalysis. Q. J. R. Meteorol. Soc. 2020, 146, 1999–2049. [Google Scholar] [CrossRef]
  51. Hersbach, H.; Bell, B.; Berrisford, P.; Biavati, G.; Horányi, A.; Muñoz Sabater, J.; Nicolas, J.; Peubey, C.; Radu, R.; Rozum, I.; et al. ERA5 hourly data on single levels from 1979 to present. In Copernicus Climate Change Service (C3S) Climate Data Store (CDS); 2018; Available online: https://cds.climate.copernicus.eu/cdsapp#!/dataset/reanalysis-era5-single-levels?tab=overview (accessed on 3 February 2022). [CrossRef]
  52. Pinto, P.; Silva, Á. Atmospheric flow and a large fire interaction: The unusual case of Pedrogão Grande, Portugal (17 June 2017). In Advances in Forest Fire Research 2018; Viegas, D.X., Ed.; Imprensa da Universidade de Coimbra: Coimbra, Portugal, 2018; Volume 1, p. 1414. [Google Scholar]
  53. Parker, M.D. Simulated Convective Lines with Parallel Stratiform Precipitation. Part I: An Archetype for Convection in Along-Line Shear. J. Atmos. Sci. 2007, 64, 267–288. [Google Scholar] [CrossRef]
  54. Pryor, K.L. Progress and Developments of Downburst Prediction Applications of GOES. Weather Forecast. 2015, 30, 1182–1200. [Google Scholar] [CrossRef]
Figure 1. (a) Hypsometric chart of mainland Portugal (elevation in m), along with the 71-weather-station network (data selected within the period of 2000–2020 (21 years)) of sub-hourly data (10-min timescale). Stations are labeled according to their corresponding IPMA codes (cf. Table S1). Data source: IPMA. (b) Mean annual total precipitation (in mm) over mainland Portugal (baseline: 1981–2010). Data source: IBERIA01 [48]. (c) Bar chart showing the climate-mean monthly total precipitation averaged over mainland Portugal.
Climate 10 00028 g001
Figure 2. (a) Boxplot and (b) histogram of the precipitation totals (in mm) during the sub-hourly (10-min) heavy precipitation events (SHHP), i.e., sub-hourly periods with precipitation equal to or above 5.0 mm (2951 events) and pooled together for the entire 71-weather-station (WS) network.
Climate 10 00028 g002
Figure 3. Distribution of SHHPs, according to the number of weather stations with an SHHP event record on the same day. The number of events is shown on top of each bar.
Climate 10 00028 g003
Figure 4. (a,b) Location and 10-min total precipitation (in mm) of all SHHP events in each day, overlaid by the corresponding IBERIA01 daily precipitation (0.1° grid, in mm). (c,d) Synoptic analysis charts at 00:00 UTC for the two severest SHHP events (20 October 2004 and 5 November 2006). The UTC hour of the event, the recorded precipitation amount, and the WS, as well as the number of other WS recording an SHHP on the same day, are also indicated. Synoptic analysis charts are provided by the Met Office (metoffice.gov.uk). (e,f) Corresponding ERA5 SLP patterns (in hPa) at the day and exact hour of the event (07:00 UTC and 08:00 UTC, respectively).
Climate 10 00028 g004
Figure 5. (a) Histogram of the distribution of the pressure-gradient index ([SLP40° N–SLP50° N]15–5°W) for all SHHP days (573); (b) composite of the ERA5 hourly mean sea-level pressure (in hPa) corresponding to the SHHP days for the regional low group (RegL, 269 days). Hourly SLP fields correspond to the hour of occurrence of the severest SHHP event on a given day; (c) the composite is the same as in (b) but shows data for the remote low group (RemL, 304 days).
Climate 10 00028 g005
Figure 6. Distribution of the (a,b) 1-h precipitation, (c,d) 6-h precipitation, (e,f) wind gust speed and (g,h) wind gust direction recorded at the weather stations at the occurrence of the sub-hourly extreme precipitation events, and separately by class (left panels: RegL, right panels: RemL). In all panels except for wind gust direction, colors correspond to the respective severe weather warning scale in use by the Portuguese weather service (yellow, orange and red, green for no warning being issued).
Climate 10 00028 g006aClimate 10 00028 g006b
Figure 7. Histogram of the monthly distribution of the occurrences (in %) of SHHP multi-site events for (a) RegL and (b) RemL. (c,d) are the same as (a,b) but show the hourly distribution.
Climate 10 00028 g007
Figure 8. Mean chronological series over a 6-h period centered at the instant of the event occurrences (133 events with 10 min of precipitation ≥5.0 mm, 26 RegL and 107 RemL), for the Porto weather station (545: Porto Pedras Rubras), shown for: (a) precipitation, (b) sea-level pressure anomaly (with respect to the event instant), (c) wet-bulb potential temperature anomaly, (d) relative humidity anomaly, (e) wind speed anomaly, (f) wind direction, (g) wind gust, (h) wind gust direction. The event occurrence is tracked with a vertical black line.
Climate 10 00028 g008
Figure 9. (a) ECMWF analyses of geopotential height (in gpdm) at 500 hPa (contours) and 925 hPa (shading), along with the 925 hPa winds, on 17 June 2017 at 18:00 UTC. (b) The skew-T Log-P diagram at WS 570 (Castelo Branco), based on ECMWF analysis on 17 June 2017 at 12:00 UTC. The air temperature (red line), dewpoint temperature (green dashed line), and parcel trajectory (black dashed line) are plotted. The positive buoyancy (red) and negative buoyancy (blue) areas are also plotted.
Climate 10 00028 g009aClimate 10 00028 g009b
Figure 10. (a) AROME forecast of SLP (shading, in hPa) and 10-meter wind gust (wind barbs) valid at 18:00 UTC. Half wind barb corresponds to 5 kt (2.57 m s−1) (b) AROME forecast of 2-meter temperature (shading, in °C) and 10-meter wind (wind arrows) valid at 18:00 UTC. The locations of Pedrógão (P), Portalegre (Po) and Castelo Branco (CB) are also shown in the maps. (c) Maximum reflectivity (in dBZ) from the IPMA-Coruche Doppler weather radar image at 16:00 UTC (reflectivity in dBZ) on 17 June 2017, (d) radar image as in (c) but at 17:20 UTC (the exact time of the occurrence of the SHHP event at Castelo Branco).
Climate 10 00028 g010
Figure 11. (a) Chronological profile (solid curve) of sea level pressure anomalies (w. r. t. the event instant) for the case study (17 June 2017), over a 6-h window centered at the instant of the SLP surge, recorded at WS 570 (Castelo Branco). The event occurrence is tracked with a vertical black line. The vertical grey-shaded bar represents the ± 20-minute interval for the application of the conditions for pressure surge identification (see text for details). The corresponding mean profile taken for all pressure surges recorded at WS 570 (8 events with 10-min precipitation ≥5.0 mm, 5 RegL, and 3 RemL) is also shown (dashed curve). (b) Profile shown as in (a) but with data for the 2-meter temperature and wind gust anomalies for the case study (17 June 2017). The mean 2-meter temperature anomalies for all pressure surges are also plotted (dashed curve).
Climate 10 00028 g011
Table 1. List of the sea-level pressure surges recorded at the WS 570 (Castelo Branco), giving the year, month, day, and hour of occurrence, sea-level pressure (SLP) at peak precipitation, 10-min precipitation, wind gust speed, wind gust direction, and synoptic type (RemL or RegL, the former shown in italic font). The selected case study (17 June 2017) is highlighted in bold font.
YearMonthDayHour
(UTC)
SLPPrecipitation
(mm)
Wind Gust Speed
(ms−1)
Wind Gust Direction
(°)
Type
200173017:001017.47.115.751RegL
2001102011:401006.77.510.0248RemL
200381015:501014.09.417.7158RegL
201111211:401005.26.78.4208RemL
2013122417:001003.95.822.8270RemL
20147215:301017.111.116.4101RegL
201561414:001014.59.714.3259RegL
201761717:201018.97.020.2135RegL
Publisher’s Note: MDPI stays neutral with regard to jurisdictional claims in published maps and institutional affiliations.

