Article

Local Perspectives on Climate Change, Its Impact and Adaptation: A Case Study from the Westfjords Region of Iceland

by
Deirdre Bannan
1,*,
Rannveig Ólafsdóttir
2 and
Benjamin David Hennig
2
1
The University Centre of the Westfjords, Suðurgata 12, 400 Ísafjörður, Iceland
2
Department of Geography and Tourism Studies, Faculty of Life and Environmental Sciences, University of Iceland, 101 Reykjavík, Iceland
*
Author to whom correspondence should be addressed.
Climate 2022, 10(11), 169; https://doi.org/10.3390/cli10110169
Submission received: 11 October 2022 / Revised: 29 October 2022 / Accepted: 1 November 2022 / Published: 4 November 2022

Abstract

:
Climate change is one of the most pressing issues of our time. Rising temperatures, changing precipitation and more weather extremes pose risks to local societies worldwide. Yet, climate change is most often presented and reported on a global or national scale. This paper aims to analyze the key aspects of climate change on the local scale by assessing temporal and spatial changes in temperature and precipitation in the Westfjords in north-western Iceland and evaluate their impacts on the region’s livability. Existing temperature and precipitation data were used to model trends in climate change at an unprecedented resolution. The results show that the period of 2001–2020 was warmer than the 1961–1990 reference period in almost every month of every year, and that warming was more pronounced in the winter months. Furthermore, precipitation increased during 1991–2020 period compared to 1961–1990. These detected local patterns confirm some of the major predictions about climate change on the global scale. Considering the impact of climate change at the local level is critical, as it allows the community to envisage their future and provides better possibilities to mitigate, prepare for or adapt to the predicted changes.

1. Introduction

Global warming and climate change are increasingly affecting climates and ecosystems around the world [1]. The consequences of greenhouse gas emissions can be seen, among other events, in the melting of glaciers, ecosystem changes, global warming and increased climate extremes. This combination of rising temperatures and rising CO2 levels is furthermore predicted to have a multitude of potential implications, including sea level rises, ocean acidification, ecosystem disruption, changes to weather patterns and, subsequently, impacts on human life [1,2,3,4,5]. The effects of climate change on the high northern latitudes seem to be greater than those elsewhere, with temperatures rising proportionally higher both at sea and on land, with associated consequences [6,7]. This is emphasized by the Arctic Monitoring and Assessment Program (AMAP), reporting that the annual mean surface temperature rise in the Arctic was three times higher than the global average for the period of 1971–2019 [2]. An increase in precipitation, particularly during the colder months, has also been observed during these past decades.
Despite clear signs of climate change and a growing number of studies demonstrating unequivocal changes, there are still many who view the impacts of climate change as problems that are somehow far away, either in space or in time [8,9]. This disconnect from the problem means that there is scope for continued and improved climate change communication. For Iceland, an island located just south of the Arctic circle, the European Social Survey undertaken between 2016 and 2017 indicated that over 90% of Icelanders believed that climate change is happening and is, at least in part, caused by humans [10]. However, a separate survey conducting interviews with Icelanders found that almost all the participants viewed climate change as a problem for future generations rather than themselves [11]. In spite of a high awareness of climate change, Iceland only showed very modest decreases in its total equivalent CO2 emissions during 2009–2019, with emissions from industrial processes increasing over this timeframe [12]. Several studies, therefore, recommend including a local perspective on climate change as a means of causing the public to become more engaged [13,14,15]. Jones et al., moreover, point out that a reduction in the psychological distance increases intentions to engage in carbon mitigation activities [14]. This demonstrates the importance of local events in climate change communication and citizen involvement as a way of increasing personal engagement with these issues. Therefore, it is important to understand how such changes are occurring at a local level, so that possible local consequences can be identified and the local societies and their people can better adapt to these changing realities. This paper attempts to analyze climate change from a local perspective, focusing on the Westfjords region in north-western Iceland, and assess its impact on the physical, biological and social systems in place.
Iceland grazes the Arctic circle and is likely to increasingly feel the effects of climate change in the future. Research shows that in recent decades, the climate has changed considerably in Iceland. Crochet and Jóhannesson (2011) showed that the decades of 1991–2000 and 2001–2010 were warmer on average by up to 1.25 ℃, compared to the 1961–1990 mean temperatures [16]. Similarly, the Icelandic Meteorological Office (IMO) reports that between 1980 and 2016, there was a warming trend of 0.47 ℃ per decade [17]. Continuing changes will affect some of the country’s key industries, such as fishing, aquaculture, agriculture and tourism, subsequently impacting the livelihood of many localities in Iceland, especially in the more scattered settlements such as those in the Westfjords. Potential changes in fisheries’ catches and the loss of infrastructure due to climate change are discussed as risks for the Arctic and other areas of the globe in the most recent report from the IPCC [18]. There is a clear level of warming due to anthropogenic forces that will continue into the next century, even if carbon emissions were to slow down or cease altogether [19]. As such, the IPCC discusses not only the risks of climate change but also adaptation strategies for dealing with these risks. For some ecosystems, including certain polar ecosystems, climate change is believed to be nearing the time limit for effective adaptation strategies [18]. The overall aim of this paper is, therefore, to describe the temporal and spatial changes in temperature and precipitation in the Westfjords region and evaluate their impacts on the region’s livability by: (i) determining whether changes in the local temperature and precipitation patterns over the last few decades can be detected; (ii) assessing whether the detected changes line up with national or global observations and predications about the climate; and (iii) creating a thematic point map to visualize the potential impacts of climate change on the Westfjords region.

2. Materials and Methods
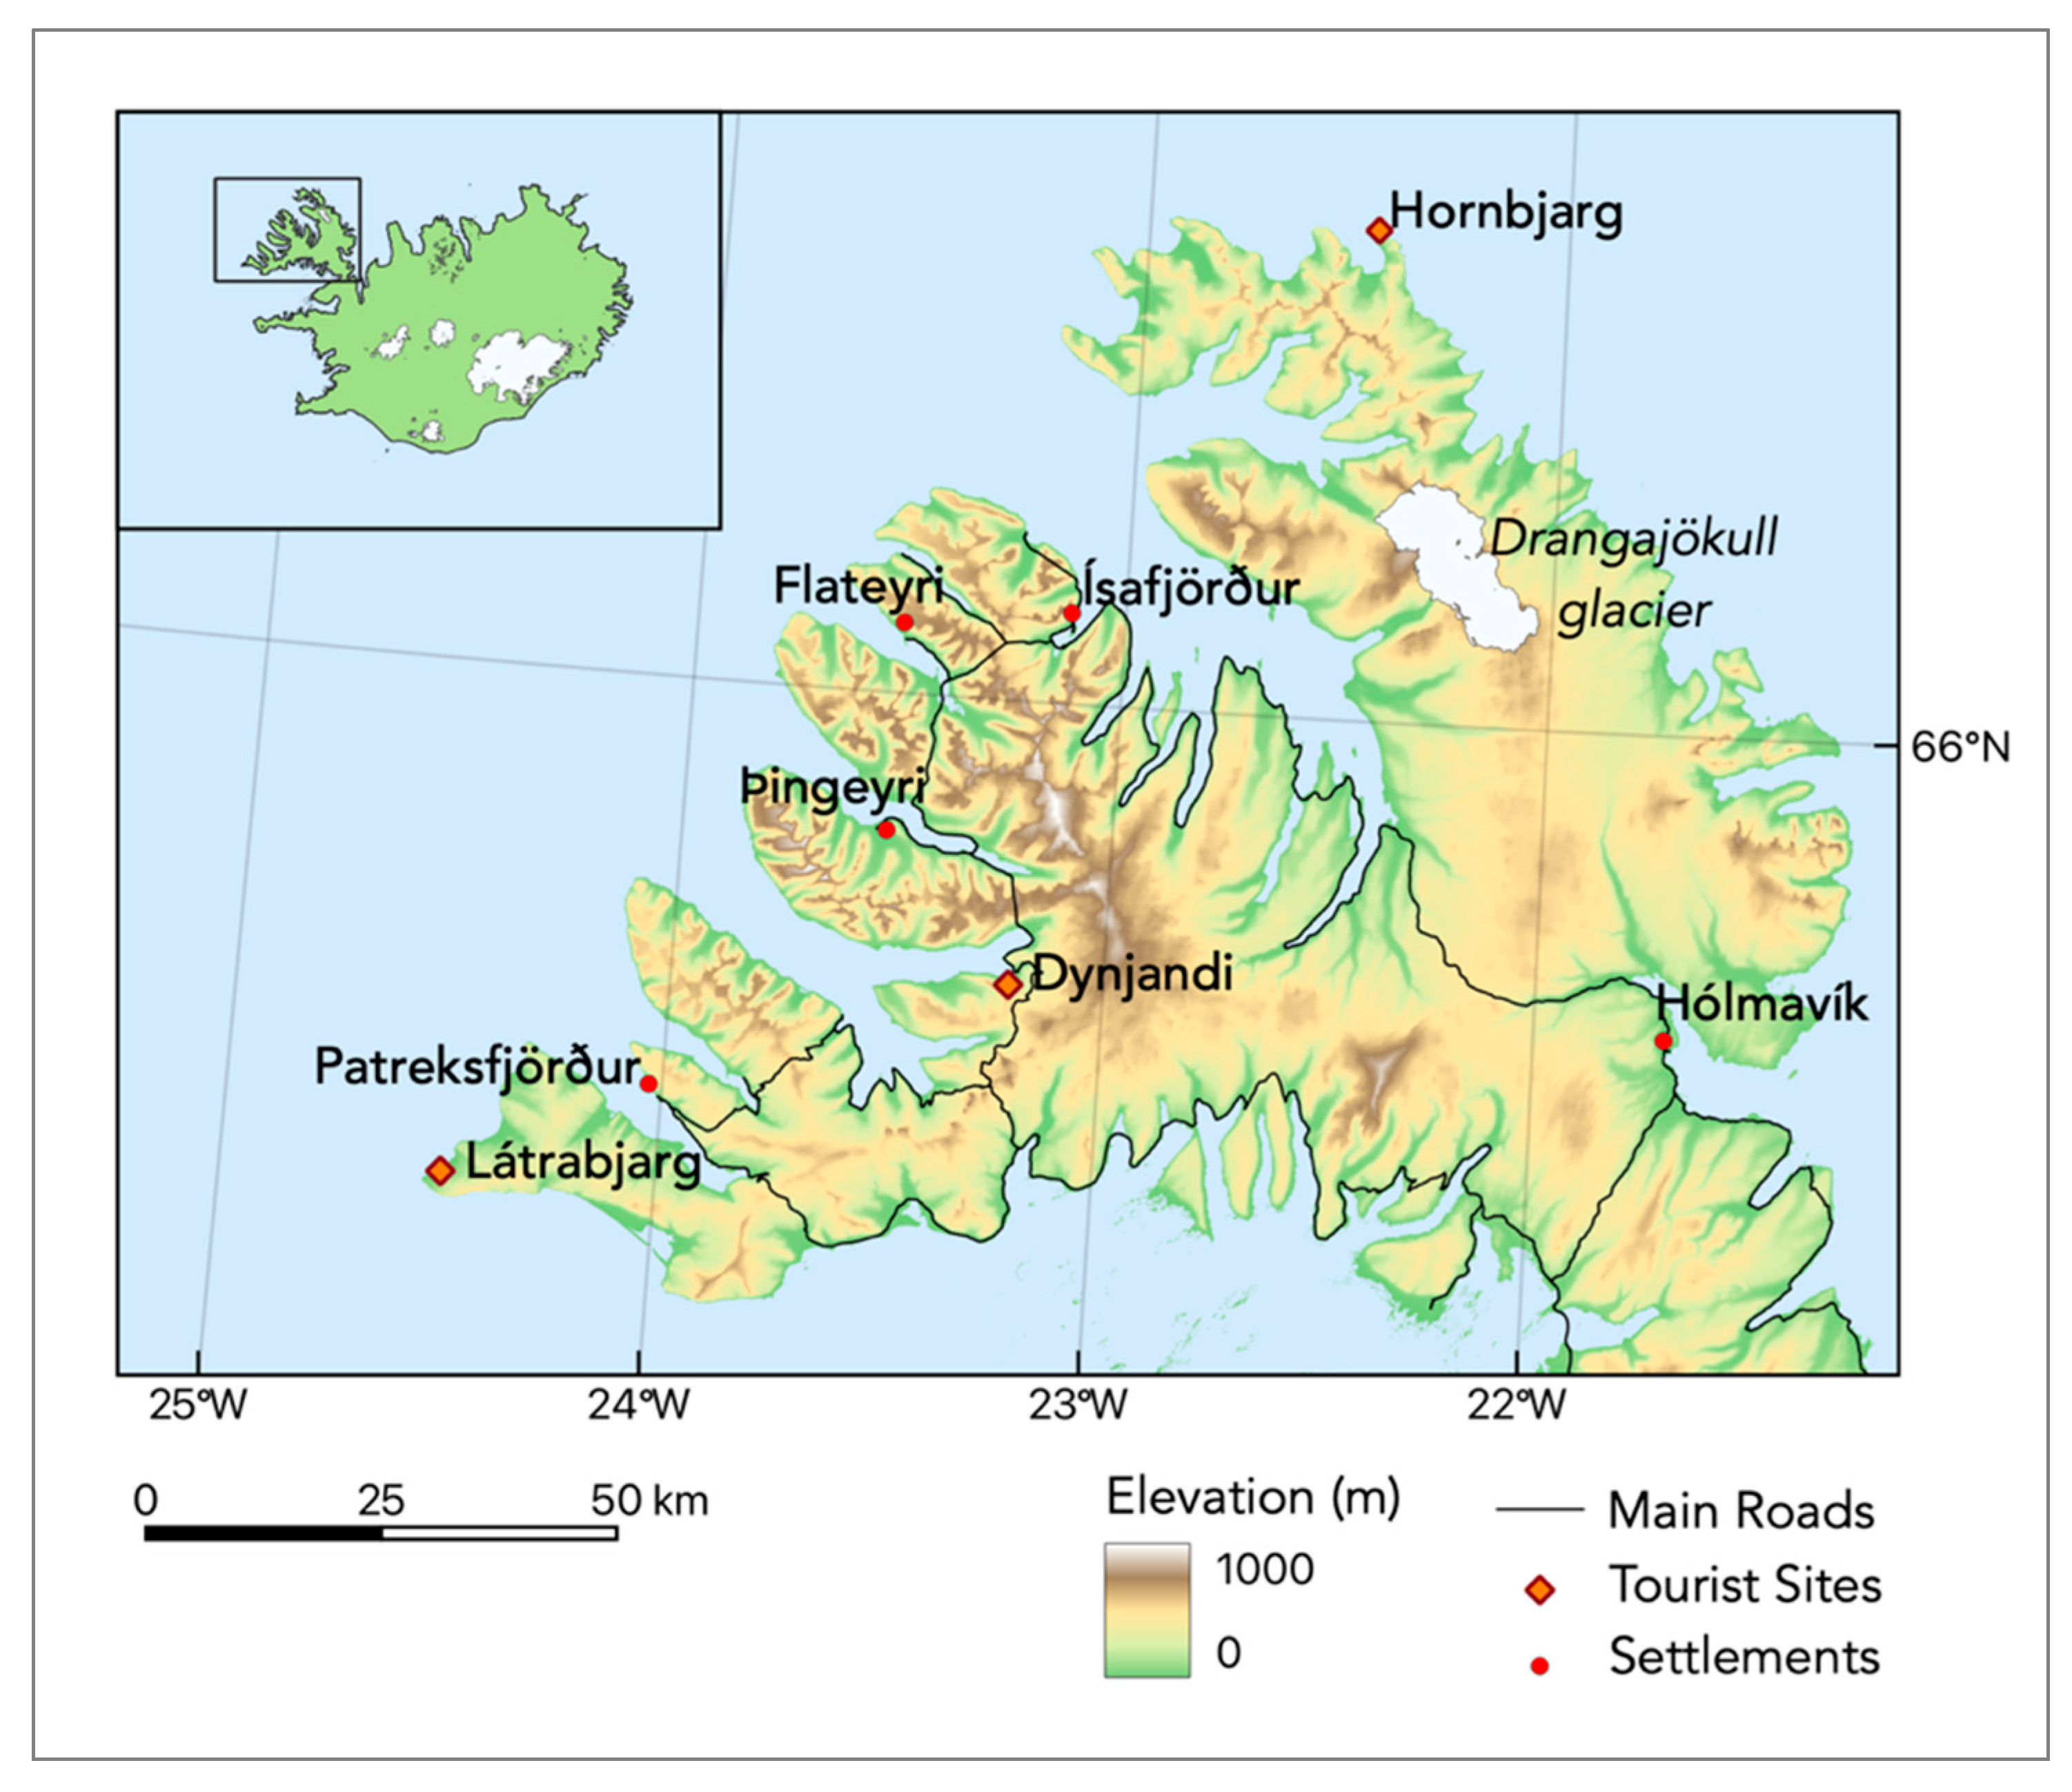
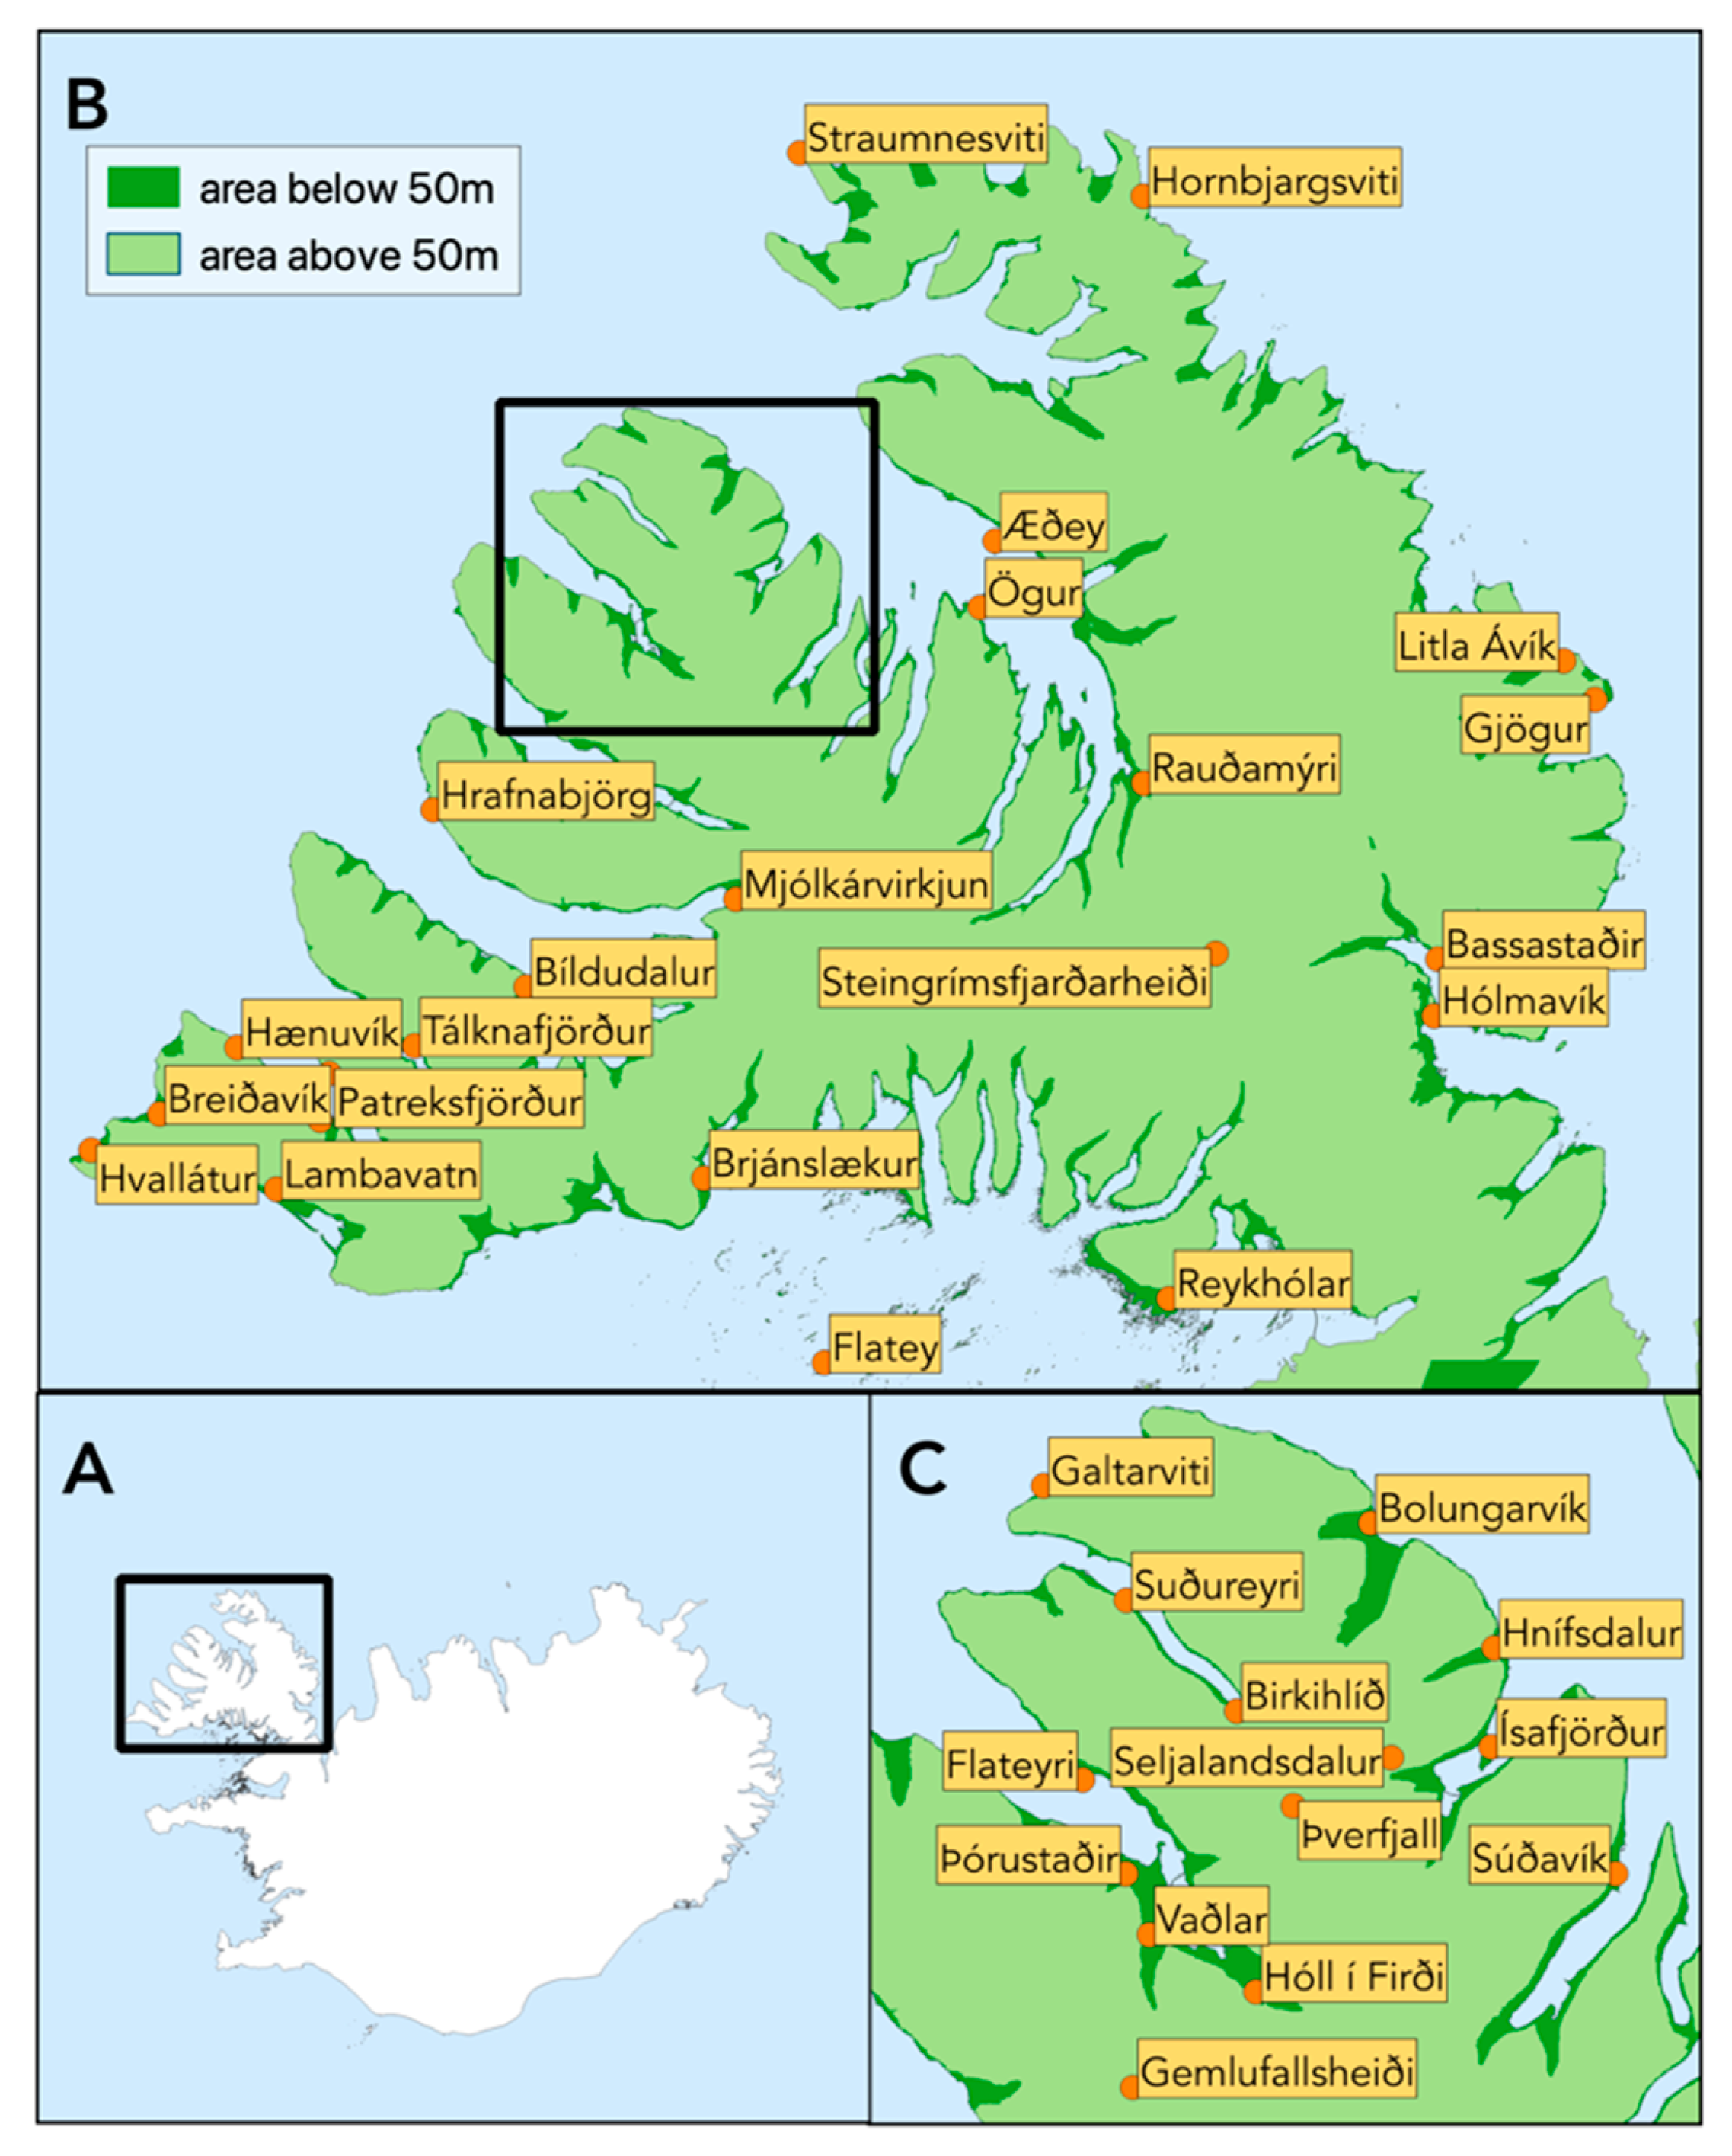
2.1. Study Area

Iceland is situated in the middle of the North Atlantic Ocean on the Mid-Atlantic Ocean Ridge, the active geological border between the Eurasian and North American tectonic plates. The Westfjords region is in the country’s most north-westerly corner, extending approximately between the latitudes of 65°25′ and 66°25′ N and longitudes of 21°15′ and 24°30′ W (Figure 1). It covers about 9000 km2, or a little less than 9% of the land area of Iceland [20]. The landscape is mountainous, characterized by narrow fjords, steep slopes and little lowlands. The elevation ranges from sea level to 998m [20]. One glacier, Drangajökull, is located in the northern part, being about 140 km2 in size, and it has been receding since the beginning of the last century, when it was about 200 km2 [21,22]. The sparse vegetation cover is dominated by grass-, heath- and scrublands, and moss heaths and non-vegetated habitats dominate the higher elevations [23]. Despite the sparse vegetation cover, the Westfjords region is important for many subarctic flora and fauna populations. These include Arctic foxes (Vulpes lagopus), Iceland’s only native land mammal [24], and numerous bird cliffs that are important breeding grounds for many sea birds [25]. The surrounding oceans have commercially important fish stocks, such as cod and halibut [26], and many non-commercially important species.
The climate is a subpolar oceanic climate, which is relatively mild for such a high latitude and is subject to high winds and frequent precipitation [27]. In 2007, the reported mean temperature range for Iceland for areas below 400 m was −2 to +9 °C, with the warmest month being July and the coldest being January [28]. Long-term climate observations specifically focusing on the Westfjords region have, to the best of our knowledge, not been reported in the literature. The region is nonetheless vulnerable to disruptions from severe weather, such as snow avalanches, landslides, slush flows, rock falls and debris flows [29,30]. Hence, the region’s topography and climate leave its residents and infrastructure vulnerable to a variety of slope processes, as well as road closures in winter.
The total population was 7205 as of the 1 January 2022, that is, about 2% of the Icelandic population [31]. Most settlements are located on the coast. Ísafjörður is the largest town in the region, with 2730 residents as of the 1 January 2022 [31], and acts as a service center for many of the smaller populated areas in the region. Throughout the centuries, the main occupation in the Westfjords region has been agriculture and fisheries, both of which have been gradually decreasing during recent decades. During the last decade, aquaculture and tourism have been seen as positive benefits for the region’s rural development [32]. Most of the aquaculture companies operate using open-sea cages in the fjords, which provide good shelter for the cages. Before the COVID-19 pandemic, 10.7% of all foreign visitors to Iceland visited the Westfjords [33]. Nature-based tourism is a major attraction, including hiking, biking, horseback riding, bird watching and simply driving for the scenery [34]. For the past few years, all the forms of adventure and sports tourism have been rapidly growing, such as sea angling, kayaking, climbing, mountaineering, mountain biking and cross-country skiing. Cruise tourism was the fastest-growing and brought the most visitors to the Westfjords prior to COVID-19. In 2019, there were 126 cruises that came to Ísafjörður, compared to 61 in 2015, and 26 that came to Patreksfjörður, compared to 1 in 2015 [35].

2.2. Climate Data Collection

The climatic data used in this study were obtained from the Icelandic Meteorological Office. Some were obtained from their website (www.vedur.is), and some were obtained through email request. Data were obtained from 37 registered weather station in the Westfjords region operated by the Icelandic Meteorological Office. The stations measure various parameters and have been operating for varying timespans. They are primarily coastal and low-lying rather than mountainous (Figure 2). Approximately 91% of the land in the Westfjords is above 50m in elevation [36]. Since most of the weather stations are concentrated around the habited areas, only four of the stations used are located above 50 m.
A station was considered to have covered a full decade if 8 out of 10 years of recordings were available. This is in line with the World Meteorological Organization (WMO) guidelines, stating that data should be available for 80% of the years of the averaging period before creating a mean [37]. Overall, the temperature data used were from 28 different stations, and precipitation data were collected from 27 different stations (Table 1). More complete temperature data were available for the two most recent decades, with 18 and 21 stations collecting temperature data for the periods of 2001–2010 and 2011–2020, respectively. There are 12 or fewer stations with a complete decade’s worth of temperature recordings for each decade between 1951 and 2000, and all of these stations are located below 50m a.sl. There was less variability in the numbers of stations collecting precipitation data for each decade, with between 10 and 15 stations available for each decade of 1961–2020. Only two stations, Lambavatn and Mjólkárvirkjun, had continuous recordings of precipitation data for sixty years, which are used for the temporal analysis. If a station had changed in altitude but remained in a similar location, all measurements were converted to sea level estimations, and it was considered to be the same station. To give an example, Æðey station took recordings at 5 m a.s.l. from 1961 to 2012 and then at 21 m a.s.l from 2012 to 2020, and these recordings were combined as 0 m a.s.l estimations.

2.3. Climate Data Analysis

The average temperature and precipitation for different time periods were calculated and plotted using R studio software (version 1.4.1106). Temperature anomalies are expressed in degrees Celsius (°C) and compared to a 30-year reference period, i.e., 1961–1990. Precipitation anomalies are expressed as a percentage of this same period. Anomalies were calculated for each decade, year, month and for the winter and summer seasons, with the winter period defined as December, January and February (DJF), and the summer period defined as June, July and August (JJA). A representative temperature for the Westfjords was calculated by combining the sea level estimates from all the stations with 60 years of continuous temperature data collection. These were Bolungarvík, Gjögur, Hornbjargsviti, Æðey, Reykhólar and Lambavatn. Only one station, Bolungarvík, had continuous temperature data from 1898 to 2020, and these data were used to model the long-term decadal temperature trend.
For the spatial analysis, the temperature and precipitation data were interpolated using inverse distance weighted (IDW) interpolation. IDW predicts a value for an unknown point, with the known values closest to the unknown point having the greatest influence on the predicted value. Thus, the influence of a measurement decreases with increased distance from the unknown location, hence the name inverse distance weighted [38]. QGIS software (version 3.18.2) was used to create spatially interpolated maps. Base maps of Iceland and a digital elevation model (DEM 10 × 10 m) were obtained from the National Land Survey of Iceland. Prior to interpolation, all the temperature data were converted to a sea level estimate using a constant lapse rate of −6.5 °C per 1000 m. The data were then interpolated using the inbuilt IDW function in QGIS and a distance coefficient of 2. The temperature data were readjusted to the terrain level from the sea level after interpolation using the constant lapse rate and the elevations from the DEM. The precipitation point data were interpolated using the same approach as that used for the temperature data. However, no adjustments were made for the elevation, as precipitation does not have a simple relationship with elevation [39].

2.4. Mapping Potential Local Impacts

To visualize the potential impacts of climate change in the Westfjords region, a thematic point map was generated by overlaying some of the climatological results on the map with summaries and graphics related to the potential impacts. This thematic mapping is based on a comprehensive literature review focusing on the impacts that have been observed or predicted for Iceland and its waters. When information was not available for Iceland, analogous locations were examined, including other sub-Arctic areas, areas of northern Europe or parts of the north Atlantic that have the same or similar climate and industries to the Westfjords of Iceland.

3. Results

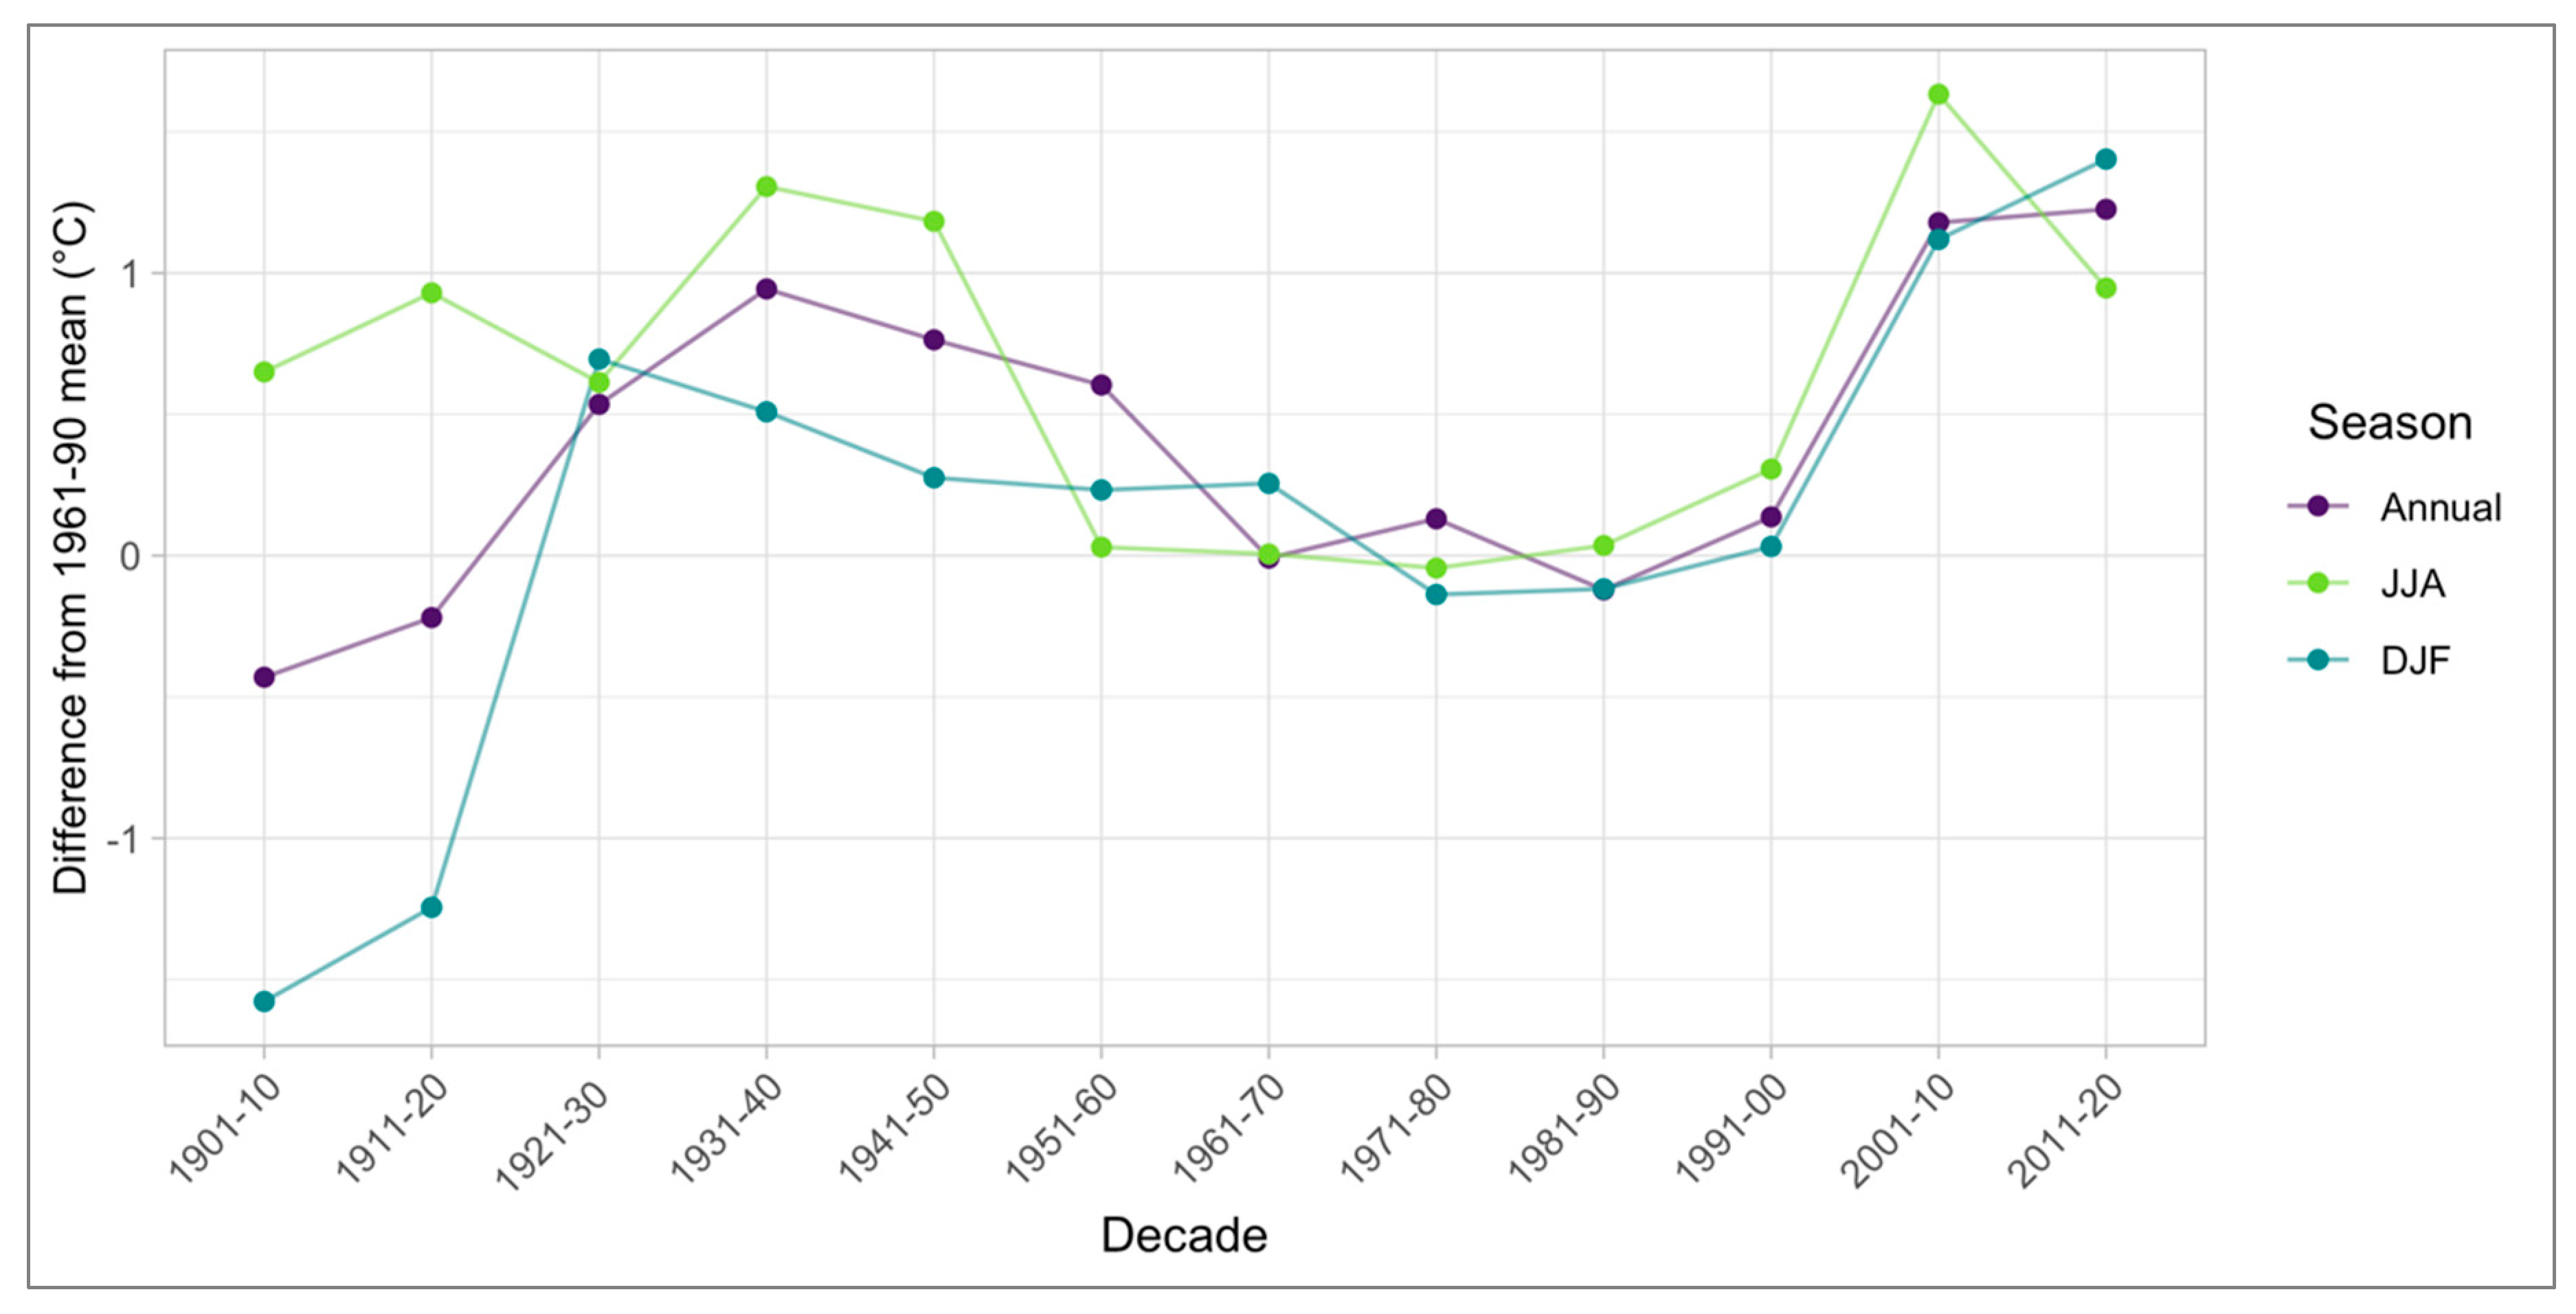
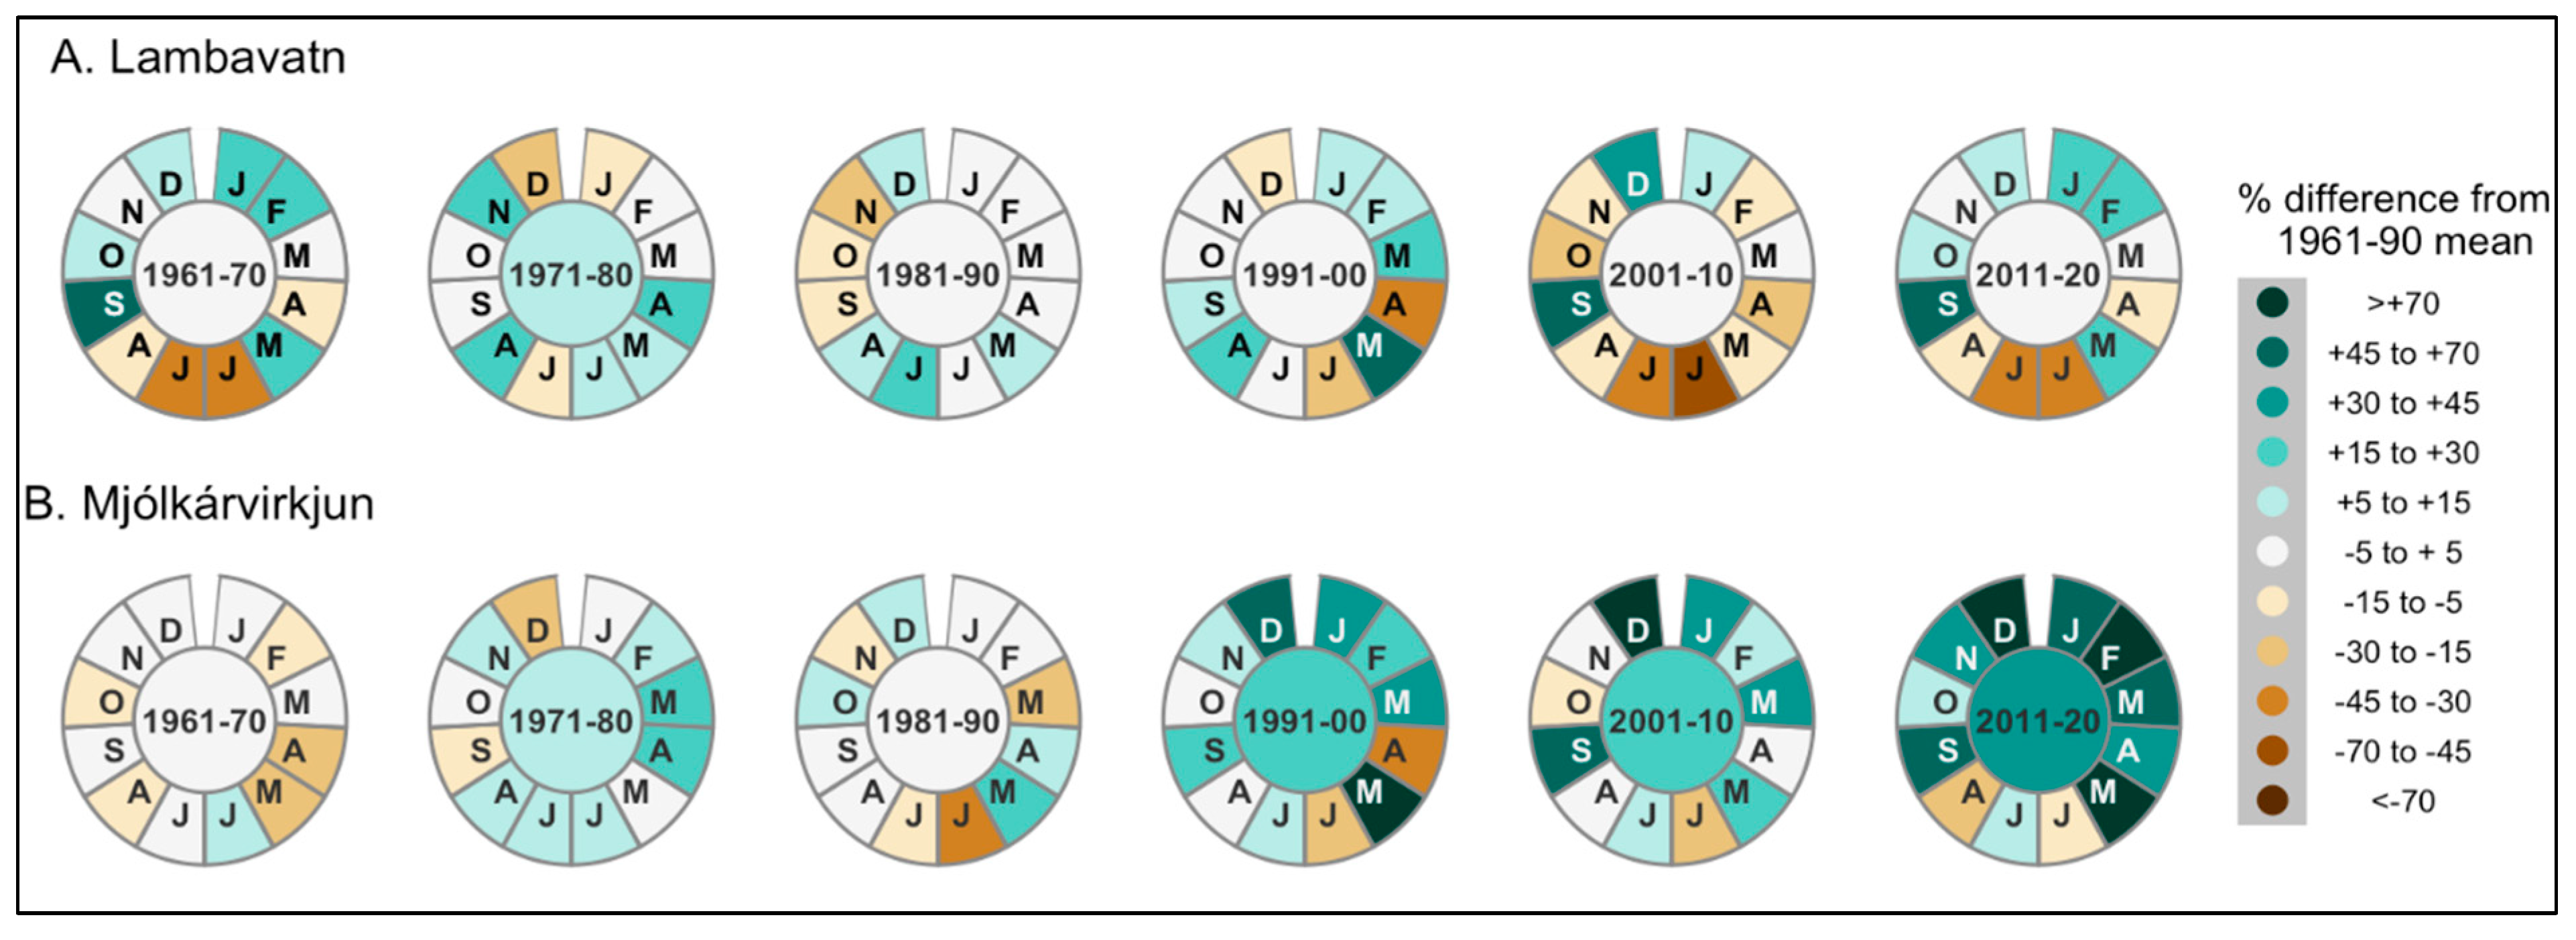
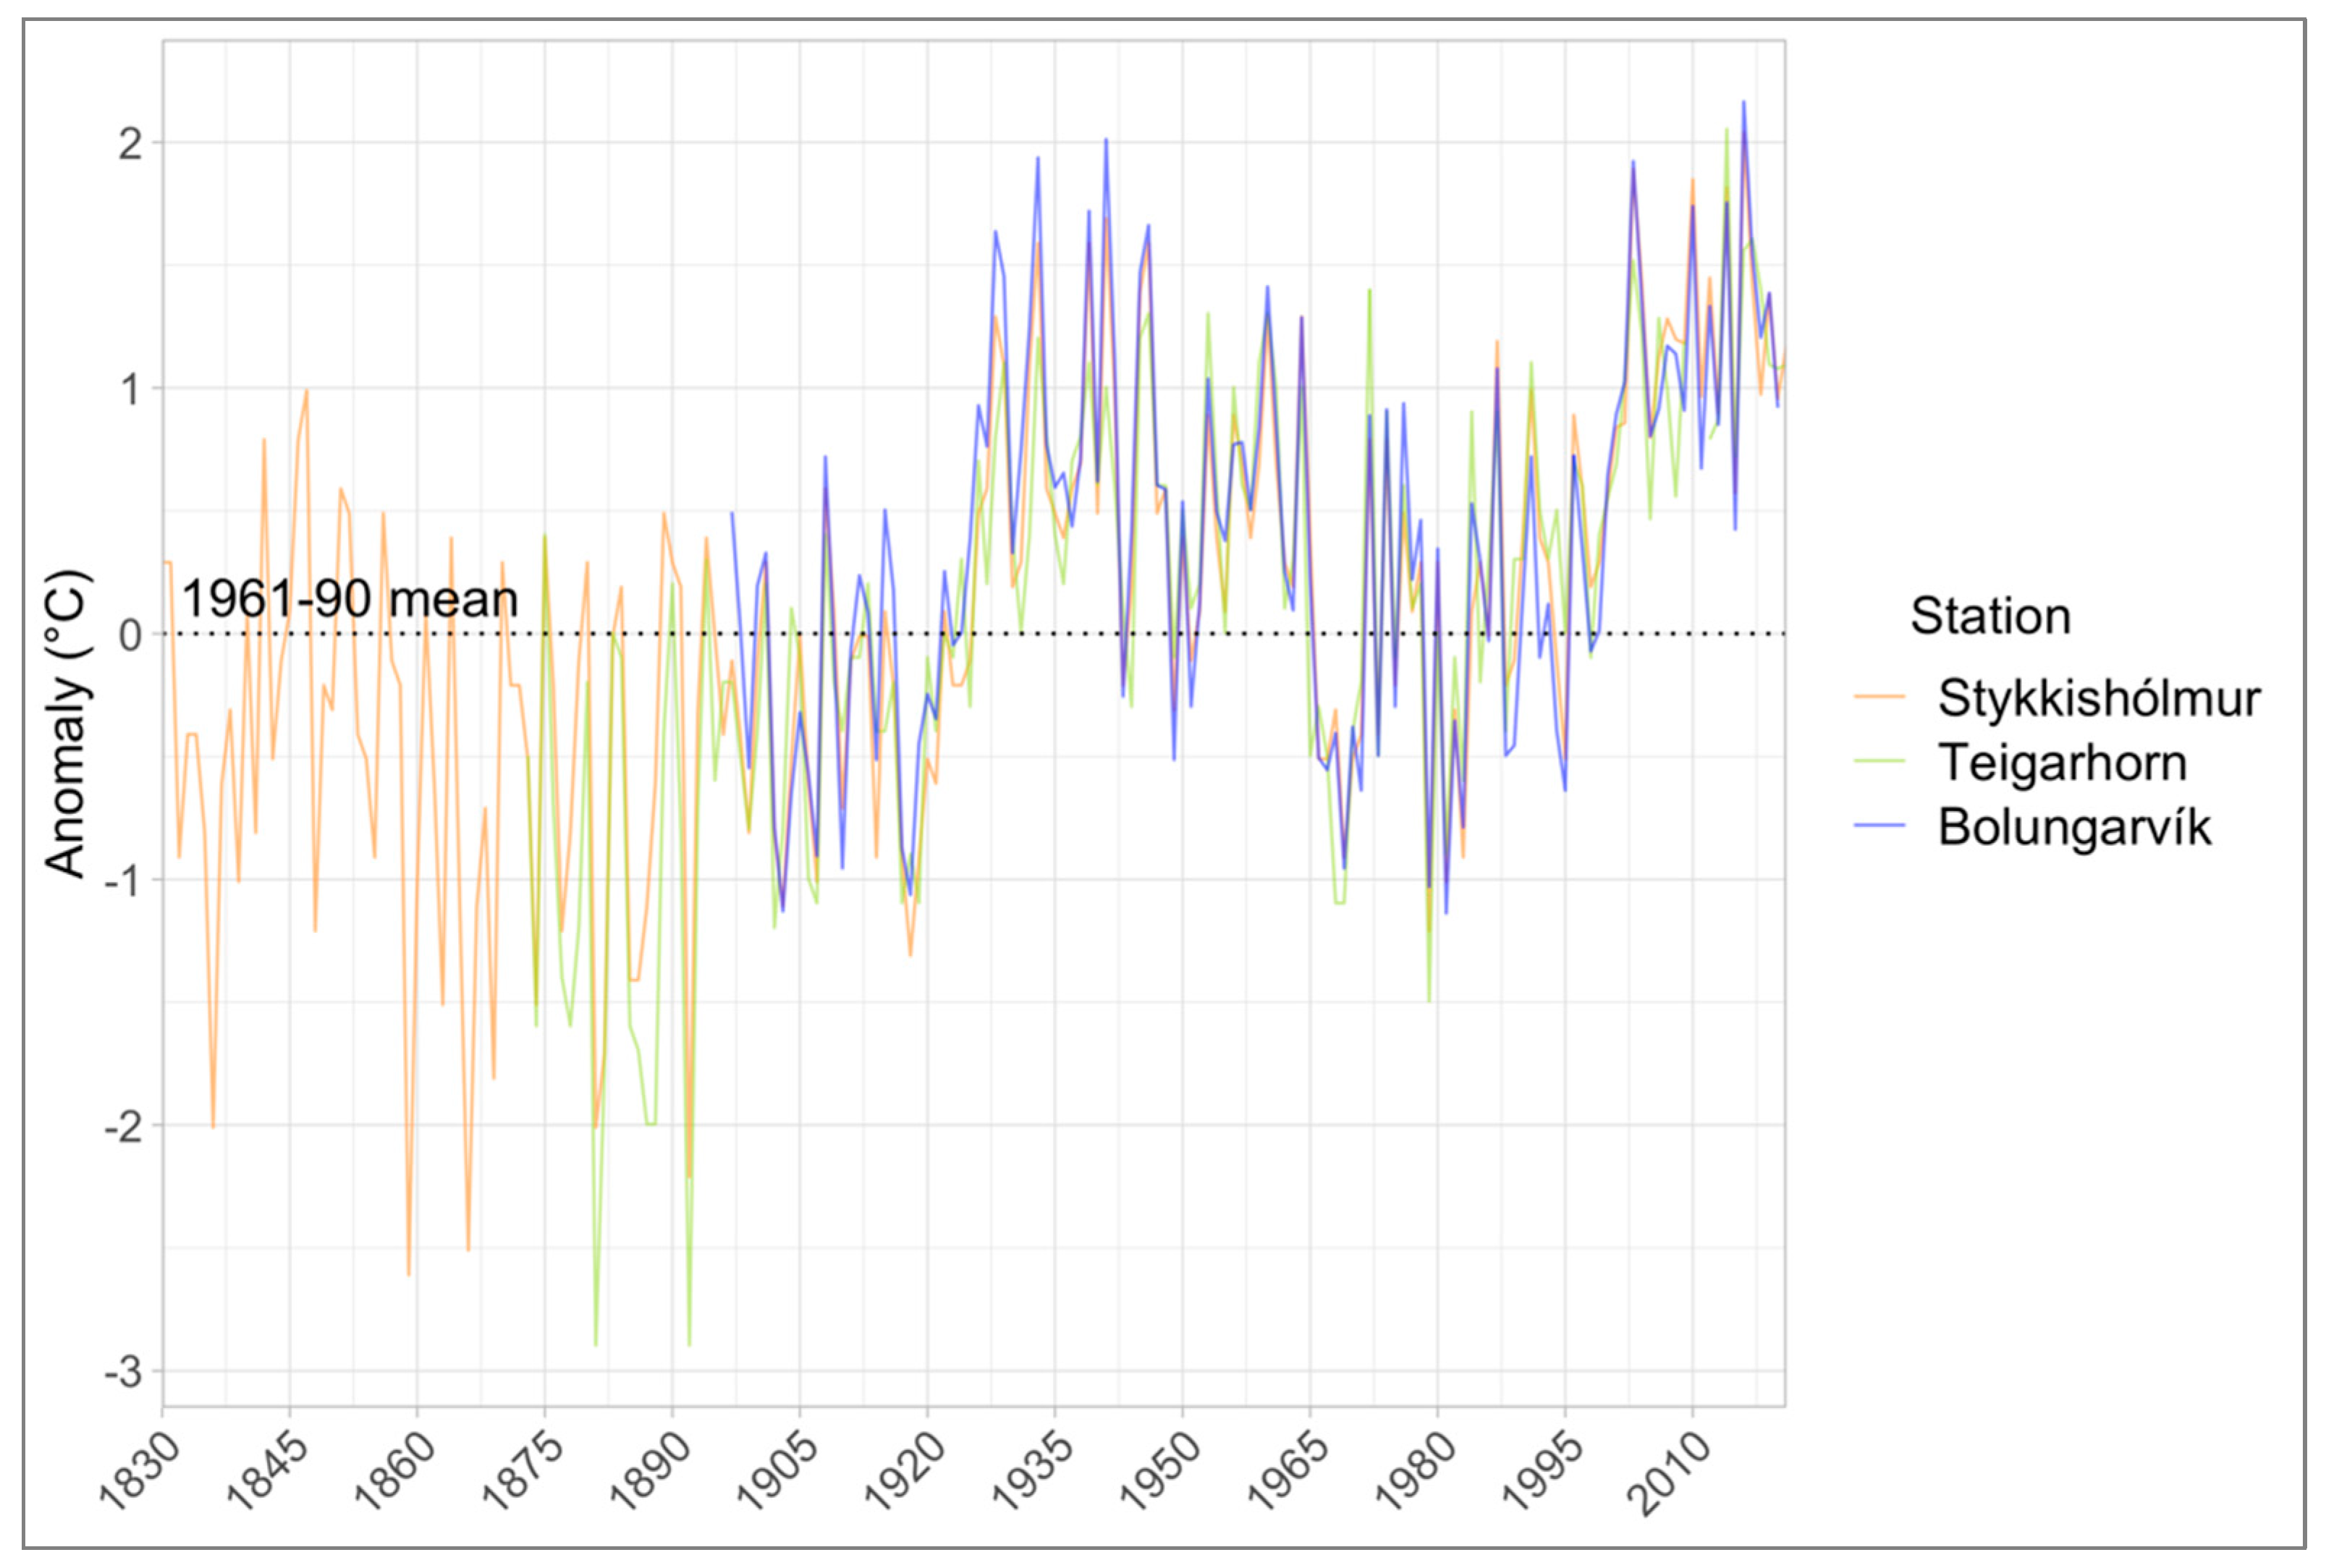
3.1. Temporal Changes in Temperature and Precipitation in the Westfjords

The analysis of the long-term temporal changes in temperature at Bolungarvík shows a net rise in the annual as well as seasonal (winter and summer) temperatures during the last 120 years (1901–2020) (Figure 3). Winter temperatures (DJF) show the most change, or a total rise of 2.98 °C during this period, and summer temperatures (JJA) show the least. The winter temperatures, furthermore, show high fluctuations, the greatest being a 1.94 °C increase between 1911–1920 and 1921–1930. Winter temperatures fall slightly between 1921–1930 and 1991–2000, while summer temperatures fall steeply between 1941–1950 and 1951–1960 and remain below the 1901–1910 temperatures until 1981–1990. All three components analyzed rise from 1981–1990 to 2001–2010, with summer temperatures falling over the last decade. Winter temperatures show the greatest total change. Between 1901–1910 and 2011–2020, annual warming progressed at a rate of +0.15 °C per decade, at +0.27 °C per decade during winter and +0.03 °C per decade during summer.
An analysis of the average temperature anomalies for each month per decade at Bolungarvík shows that each decade varies differently from the reference period (1961–1990) (Figure 4). The periods of 1901–1920, 1961–1970 and 1981–1990 are colder than the reference period. The periods of 1921–1960, 1971–1980 and 1991–2020 are warmer than the reference period. The winter months during the period of 1901–1920 are particularly cold compared to the reference period, while the summer months are warmer. Every month from 2001 to 2020 is warmer than the reference period. The greatest negative difference from the reference period is seen in February 1910–1920, which was on average 2.94 °C less than the average temperature for February 1961–1990, and the greatest positive difference is seen in June 2001–2010, where the temperatures averaged 1.97 °C greater than the reference period.
When examining a larger area, the analyses show similar temperature patterns to those in Bolungarvík during the last sixty to seventy years. The analysis of the data from stations with ≥60 years of continuous temperature collections, i.e., Gjögur (1949–2020), Hornbjargsviti (1949–2020), Æðey (1954–2020), Reykhólar (1961–2020) and Lambavatn (1961–2020), show that all three components analyzed, i.e., the annual, summer and winter periods, rise from 1981 to 1990, with the greatest change occurring between the 1991–2000 and 2001–2010 anomalies (Figure 5). Between these two decades, the annual temperature increased by 1.05 °C, the summer temperature by 1.11 °C and the winter temperature by 1.26 °C. The annual and summer anomalies decreased slightly between 2001–2010 and 2011–2020, while they continued to rise during winter. The winter component shows the greatest change. Between 1981–1990 and 2011–2020, annual warming progressed at a rate of 0.47 °C per decade, with winter warming at 0.55 °C per decade and summer at 0.28 °C per decade.
Every month in the decades 2001–2010 and 2011–2020 was warmer than the 1961–1990 reference period (Figure 6). Furthermore, the temperatures during 2011–2020 show stronger warming in the winter than in the summer. The temperatures during 1961–1980, 1971–1980 and 1981–1990 show the least deviation from the reference period. The analysis of the individual years during this period shows that the warmest years are 2003 (2.16 °C anomaly), 2014 (2.15 °C anomaly) and 2016 (2.16 °C anomaly). The coldest year is 1981, with an anomaly of −1.21 °C. Every individual year from 2000 to 2020 has a positive annual temperature anomaly.
When examining these stations separately, it is noteworthy that the greatest changes in the winter temperatures are observed in, and increase towards, the north (Figure 7). Hence, the temperature anomalies follow a similar pattern at each station. The stations rarely differ in regard to whether a month was colder or warmer than the 1961–1990 reference period. Gjögur and Hornbjargsviti show that 1951–1960 was warmer than the reference period. The temperatures during 1961–1990 do not show large deviations from the mean, aside from the month of March, being around 1 °C higher than the average during the decade of 1971–1980. The monthly temperatures for the decade of 1991–2000 fluctuated between being above and below the reference period, but the average annual temperatures were higher. Every month in the decades of 2001–2010 and 2011–2020 was warmer than the reference period according to all the stations.
The analysis of the temporal changes in precipitation anomalies between the two stations containing long-term datasets, i.e., Lambavatn and Mjólkárvirkjun, shows a different annual pattern, with more precipitation at Mjólkárvirkjún, especially during the winter months over the last three decades. The results indicate an increasing trend in the precipitation after 1990 in both areas (Figure 8). However, at Lambavatn, these decades experienced precipitation that was within 5% of the reference period during 1991–2020. The stations correspond with one another for some months. For example, from 1991 to 2020, June was drier than the reference period, and September was wetter. Mjólkárvirkjun experienced a wetter month than the reference period for every month except for June and August in the decade of 2011–2020. The greatest positive difference in rainfall was observed in May 1991–2000 in Lambavatn, with +67.26% rainfall, and December 2001–2010 in Mjólkárvirkjun, with +108.98% rainfall, compared to the 1961–1990 reference period. Conversely, the greatest negative difference in rainfall was observed in June 2001–2010 in Lambavatn, with −45.37% rainfall, and April 2001–2010 in Mjólkárvirkjun, with −33.72% rainfall, compared to the 1961–1990 reference period.

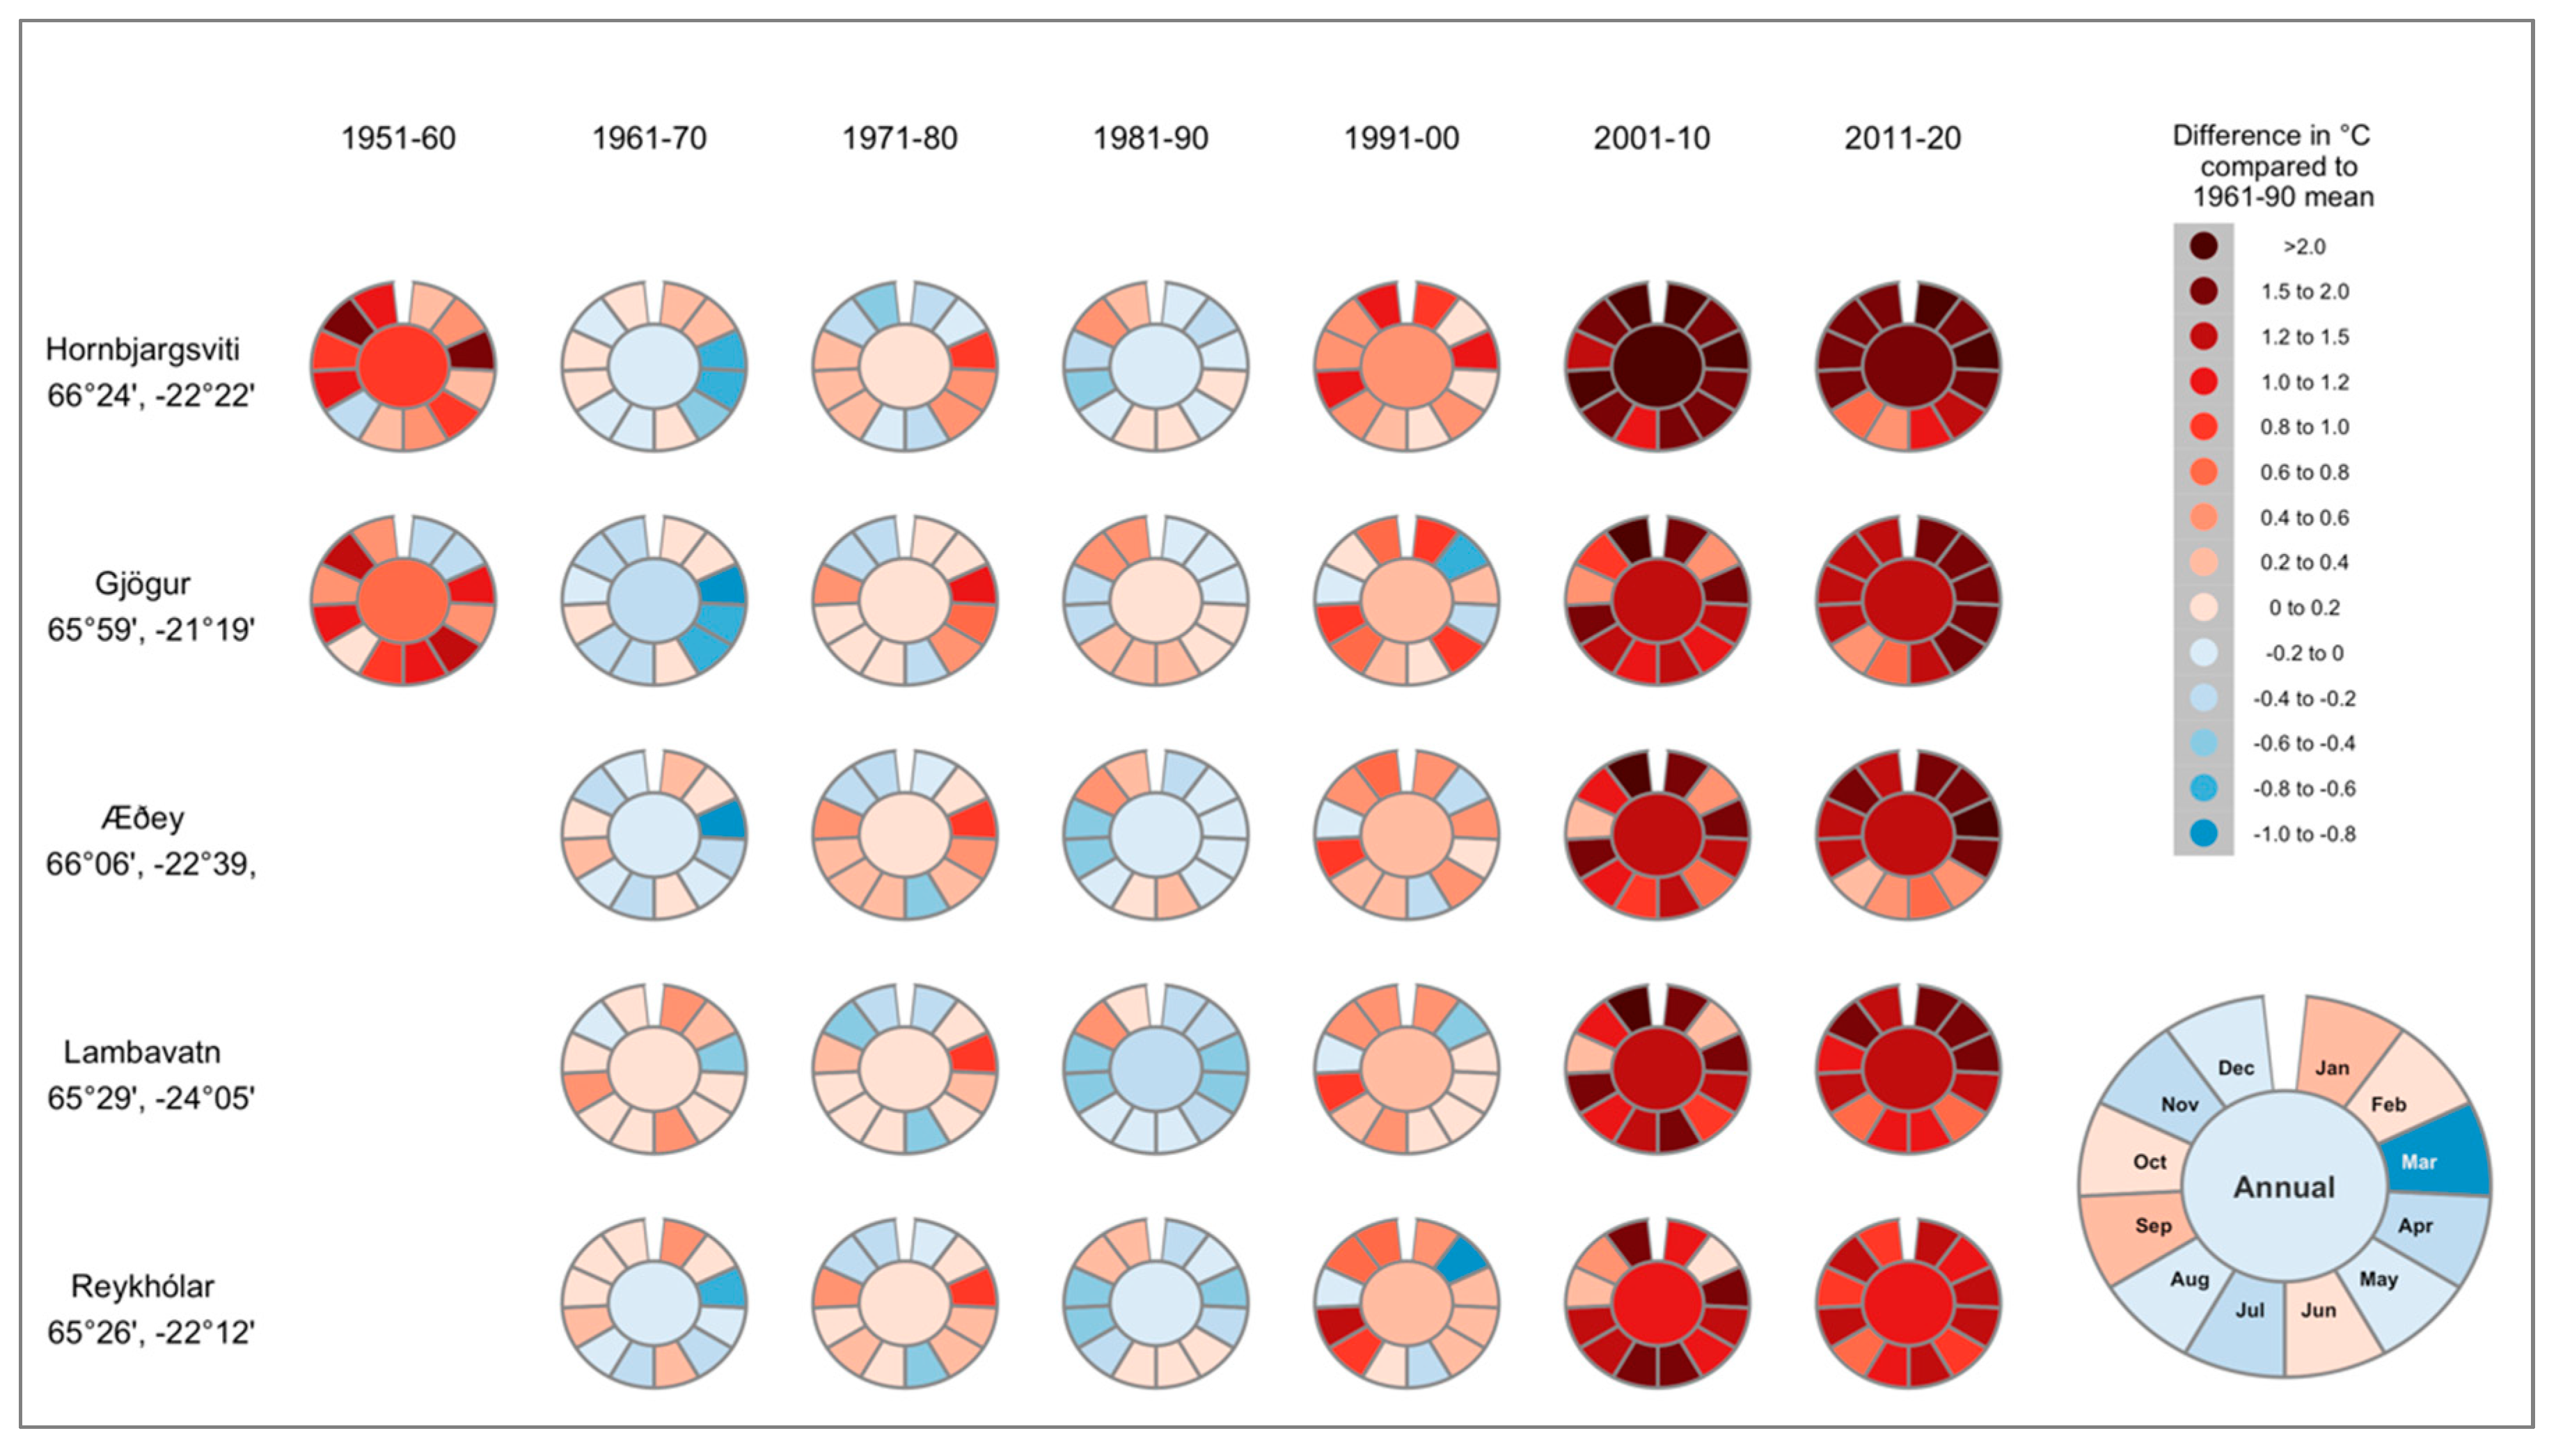
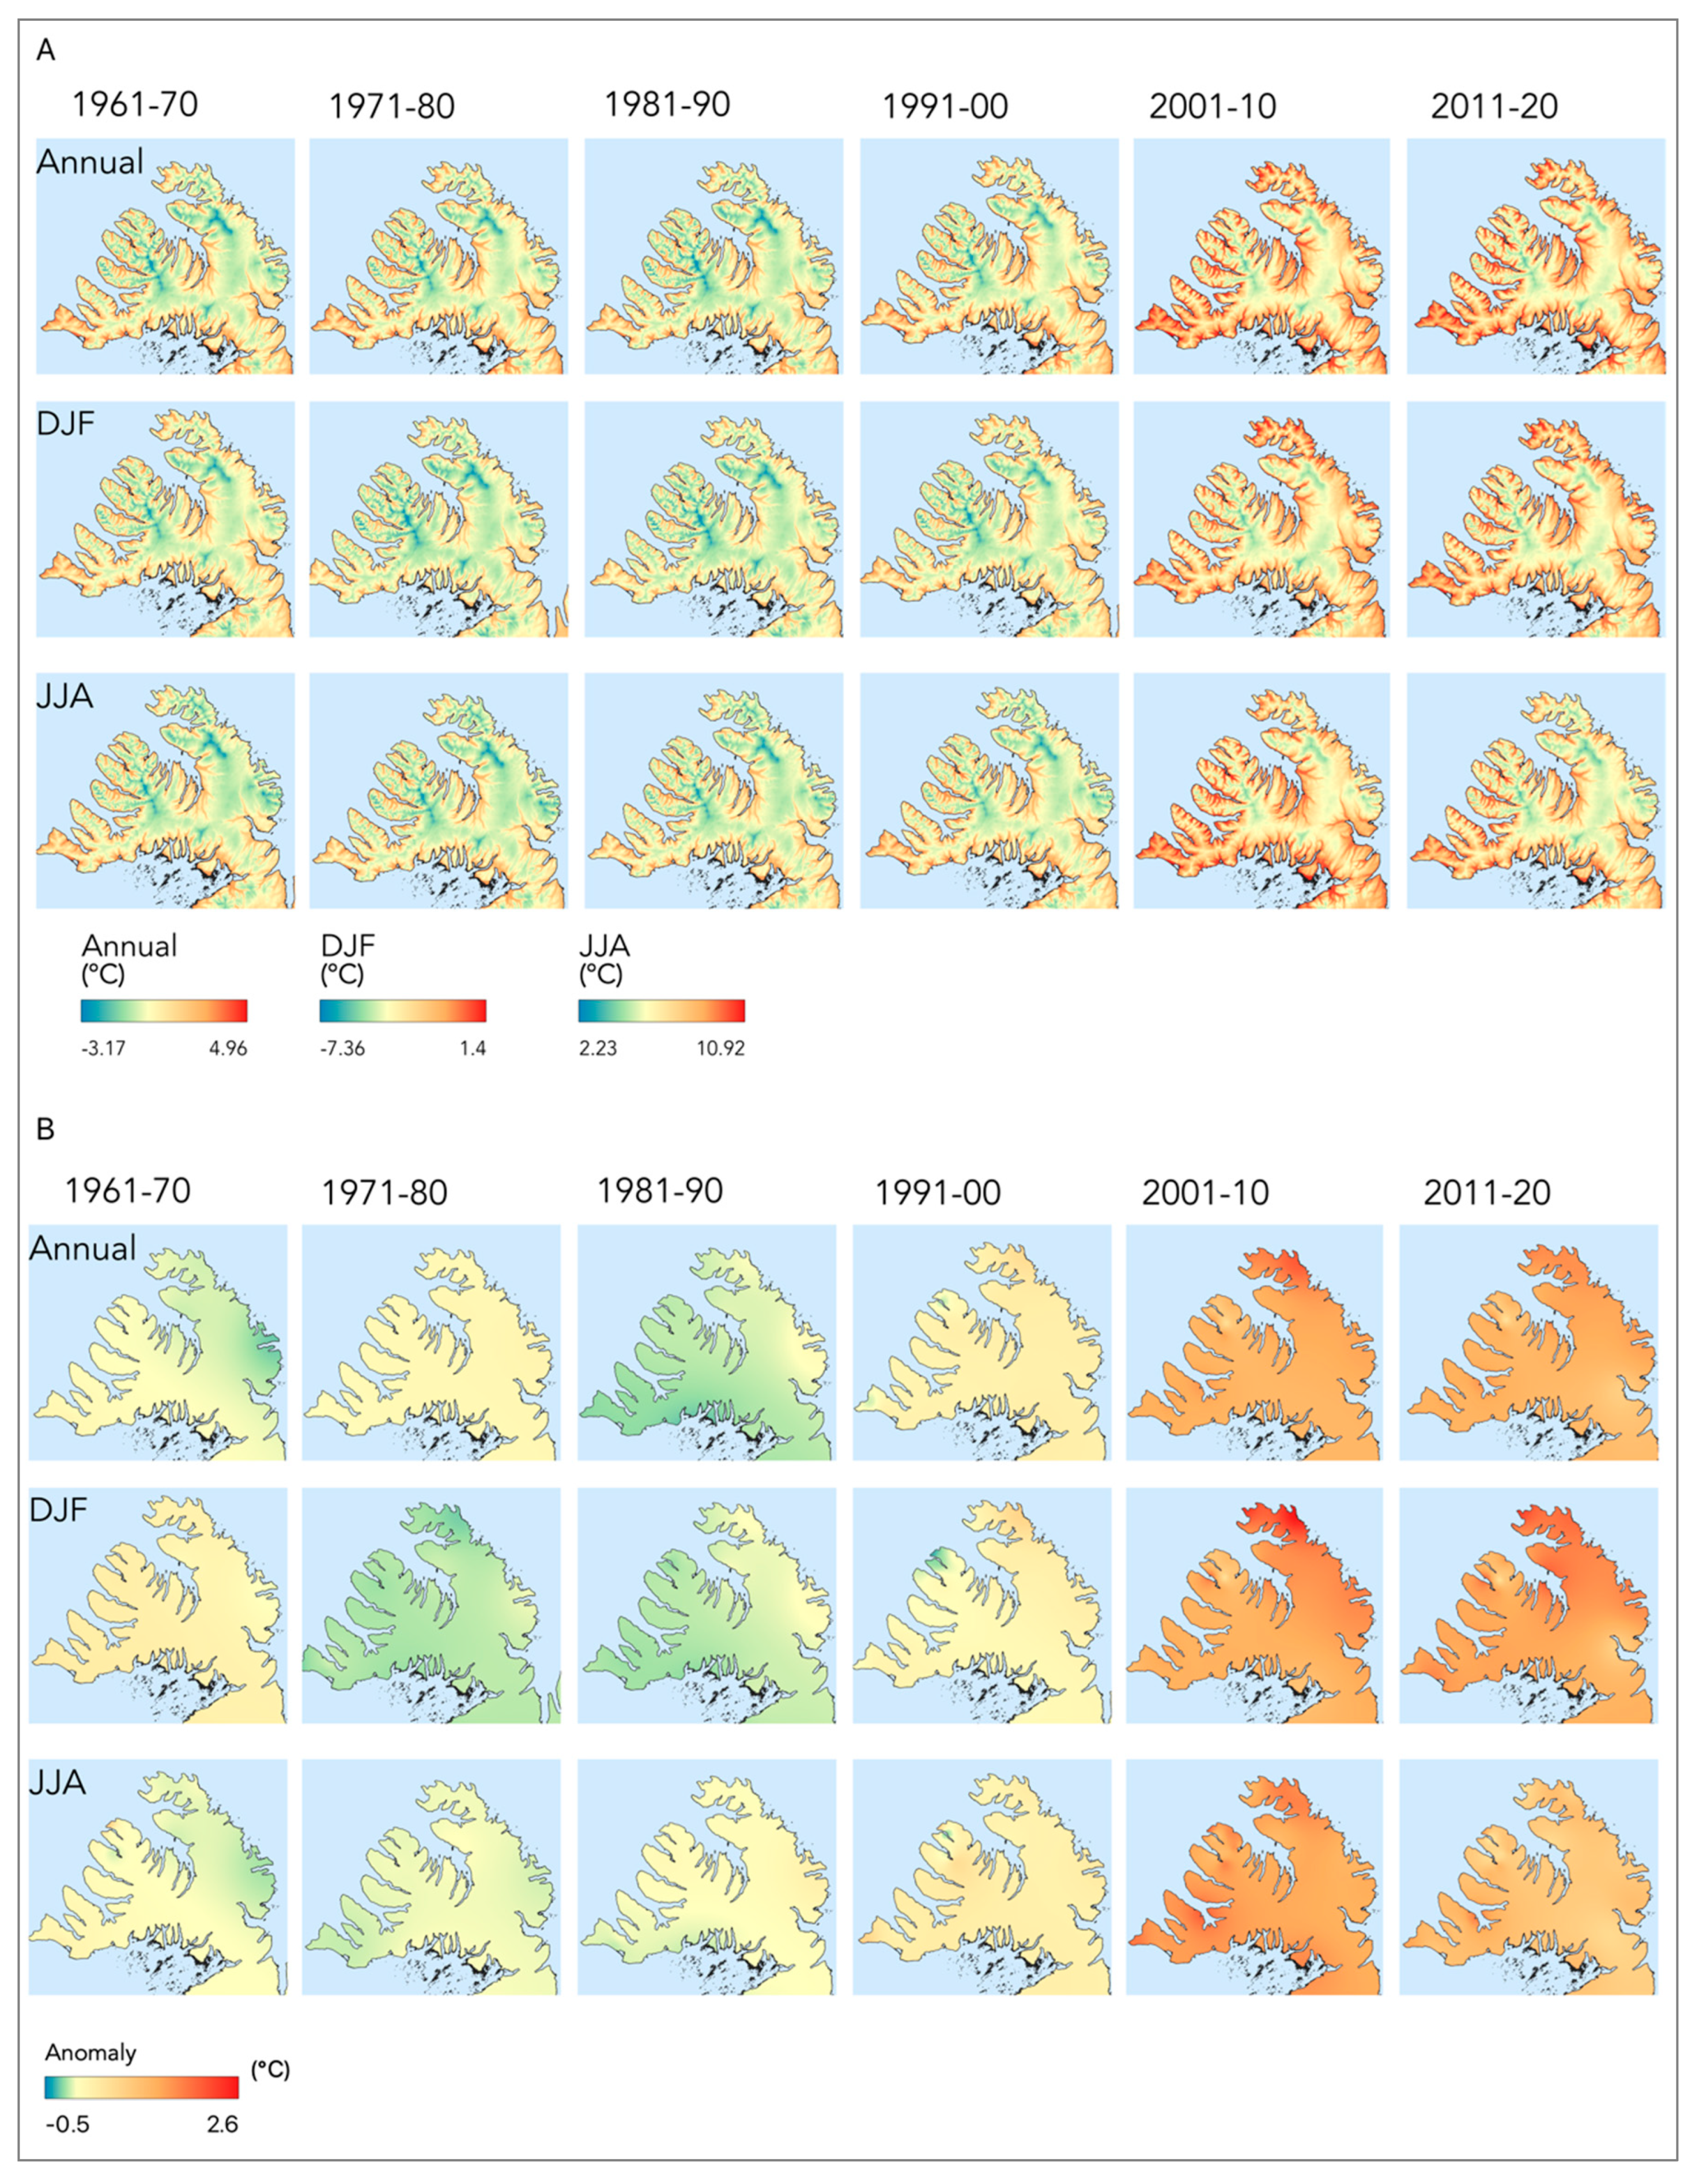
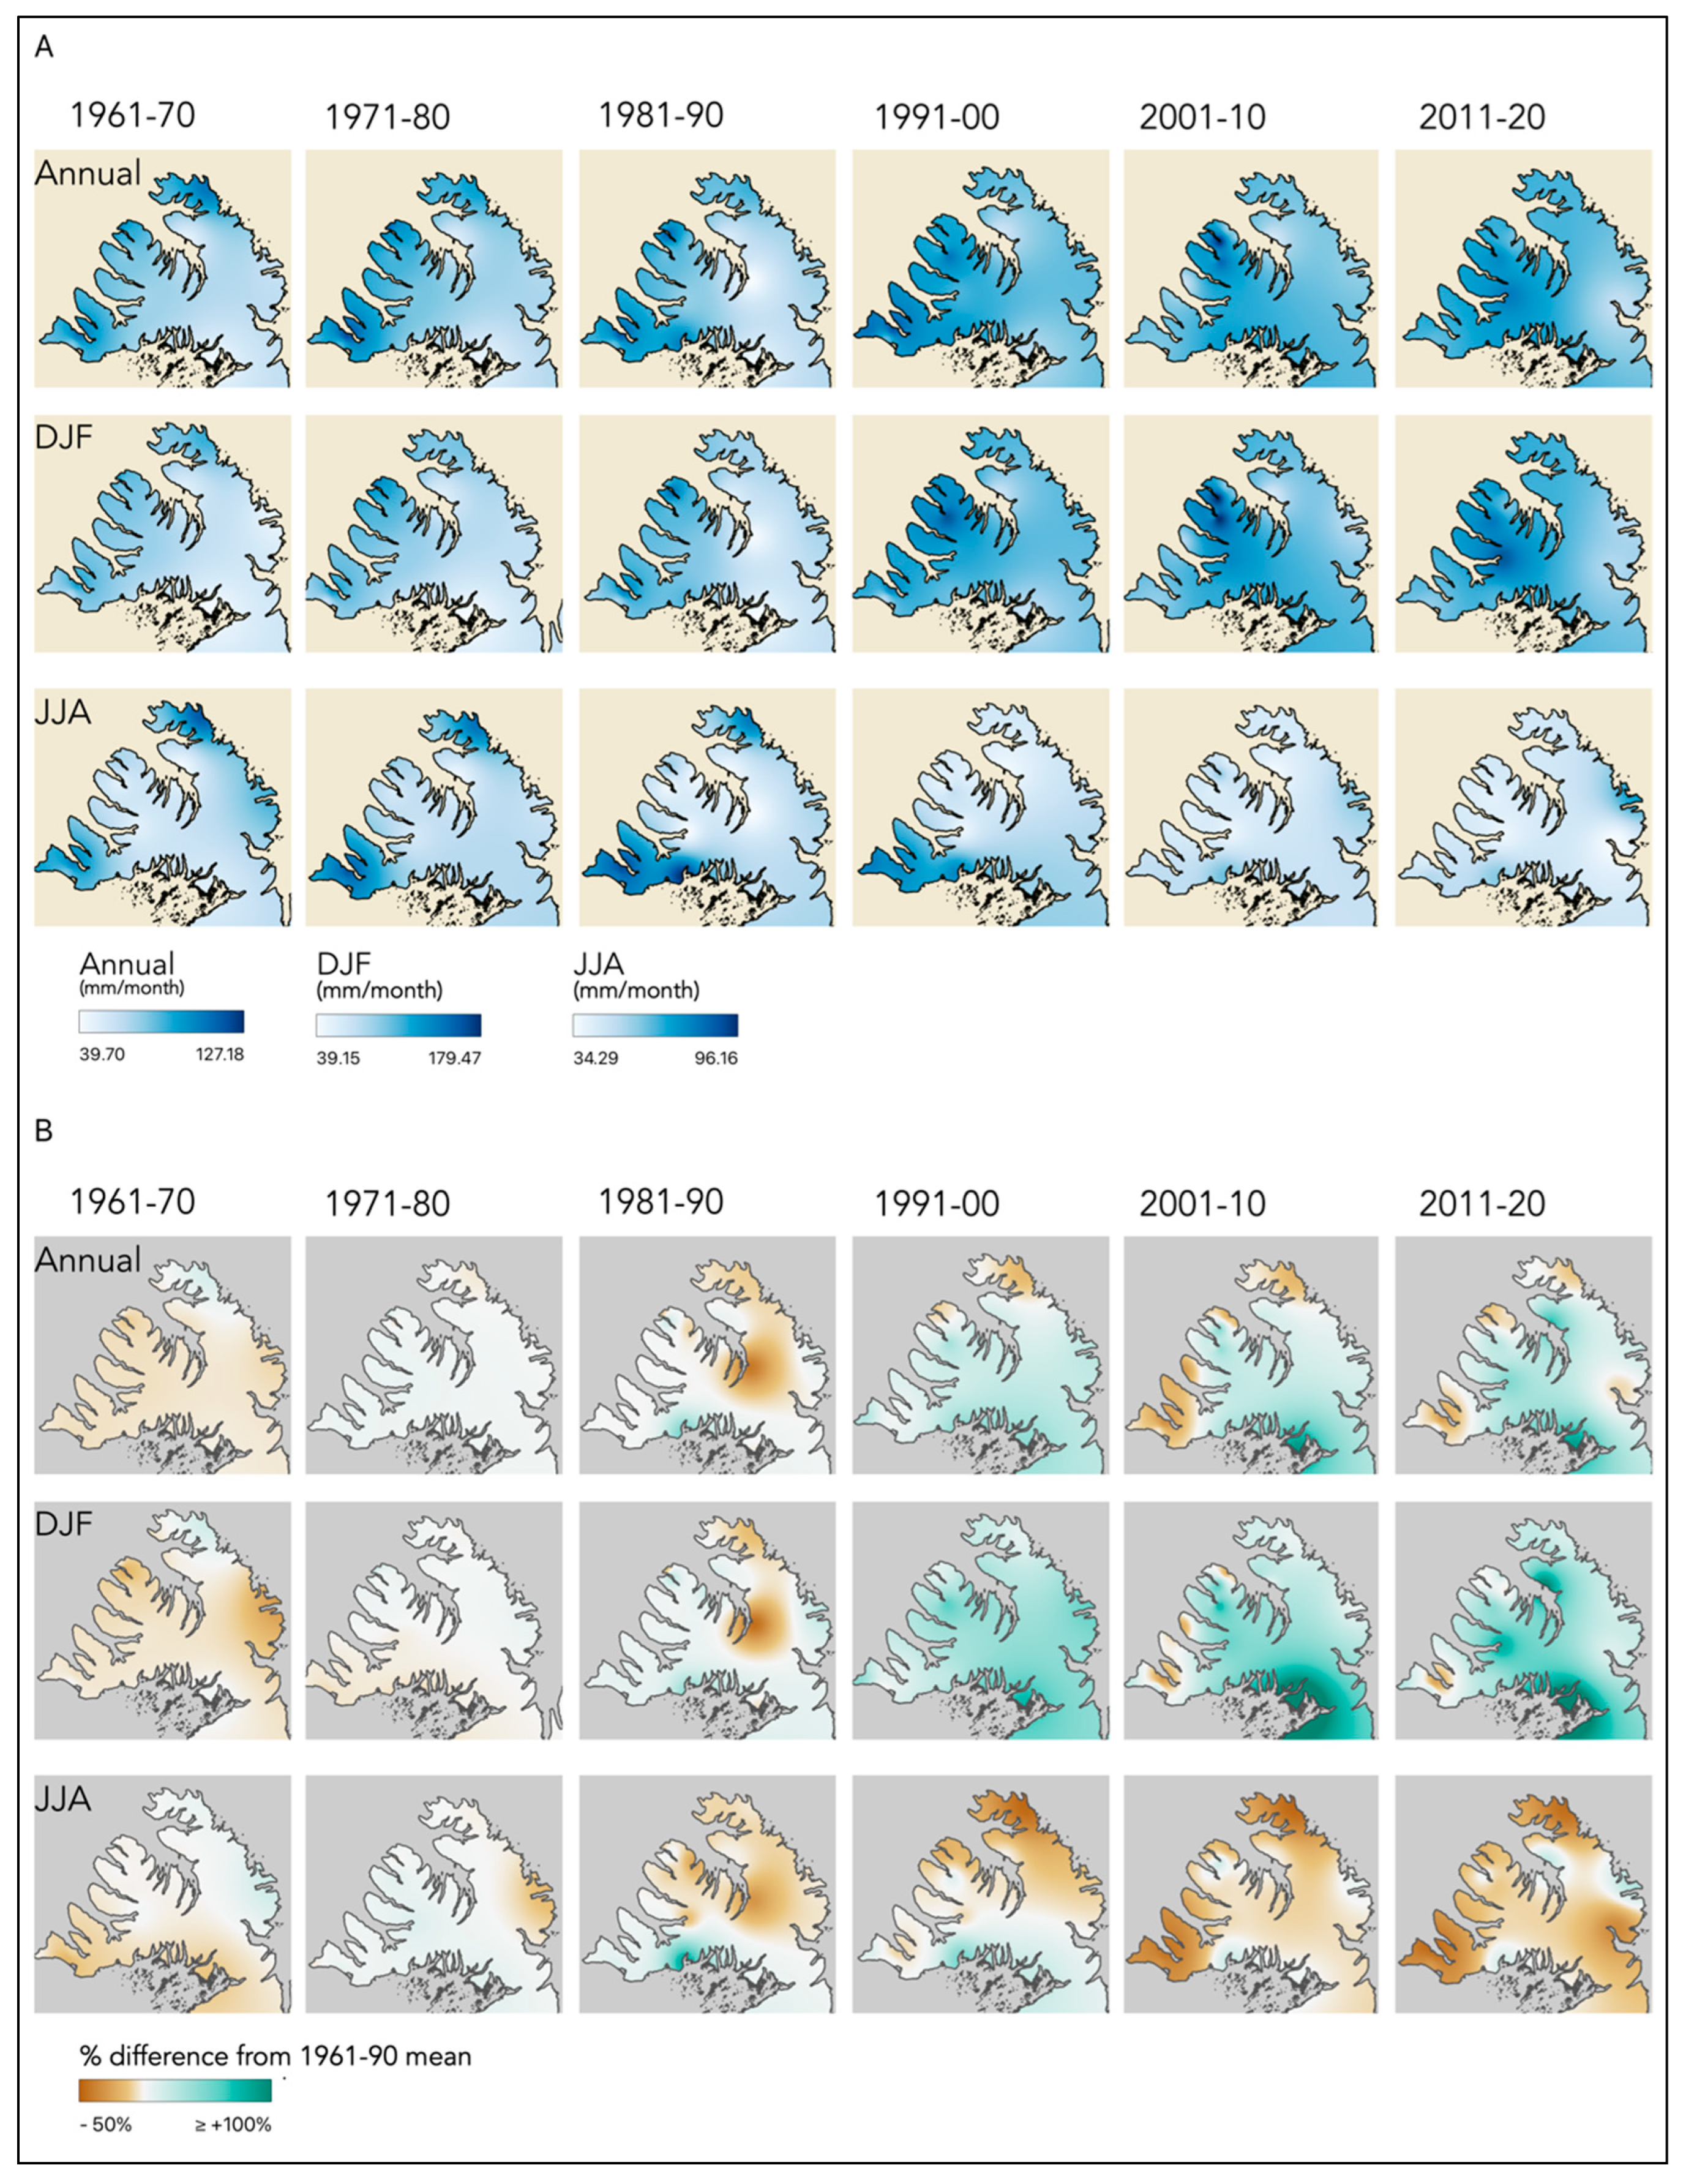
3.2. Spatial Changes in Temperature and Precipitation in the Westfjords

The spatial analyses of the absolute and relative temperature changes in the Westfjords show that the annual, summer and winter temperatures in 2001–2010 and 2011–2020 were warmer across all elevations compared to the 1961–1990 mean (Figure 9A,B). Winter warming appears to be strongest in the northernmost point of the Westfjords. Summer temperatures in 2011–2020 were cooler across all elevations compared to 2001–2010.
The spatial analysis of the relative and absolute precipitation changes in the last sixty years (1961–2020) shows that the annual decadal precipitation appeared to be heavier across the Westfjords region during 1991–2020 compared the 1961–1990 mean (Figure 10A,B). The winter (DJF) trend follows a similar pattern of heavier precipitation in the most recent thirty years, especially in the central-western part of the Westfjords region. The summer (JJA) component shows, on the other hand, a trend of decreasing precipitation. In the summer, the northernmost region of the Westfjords showed less precipitation during 1991–2020 compared to 1961–1990, and the southwestern part of the Westfjords showed less precipitation in the period of 2001–2020 than that of 1961–2000.
While the trends of increasing temperatures and changing precipitation patterns are part of a wider global trend, the impacts of these changes will affect the everyday lives of people in the Westfjords. A summary of the potential local impacts is provided in Figure 11. The major physical impact due to climate change is associated with the increased instability of the many slopes that characterize the landscape of the region to a large extent. The weather conditions and topography of the Westfjords region are already favorable for slope processes. The main triggering conditions for avalanches in the Westfjords are strong northerly winds and heavy precipitation, which create large snow accumulations on unstable slopes [40,41]. The indications of warmer weather and increased precipitation observed in our analysis are likely to influence the number of avalanches. For example, a recent study focusing on the effects of climate change on avalanche accidents and survival suggests that warming weather may decrease avalanches at low elevations but increase the number of wet snow avalanches at higher elevations [42]. This same study notes that wet snow avalanches contain denser snow and are therefore more difficult to perform rescues in. Debris flows in Ísafjörður are triggered by rapid snowmelt or prolonged rainfall [43]. The water saturates the sediment stack, rendering it unstable and increasing the likelihood of a debris flow. Increased slope processes in the Westfjords due to climate change could thus lead to damage to infrastructure, evacuations, road closures, increased expenditure on protection and, in the worst case, loss of life.
Climate change will also influence the current forms of land use in the region, such as the fisheries, aquaculture, agriculture and tourism. Satellite data show that Iceland, similar to much of the circumpolar region, has become greener in recent decades, with a particular rise in greenness in the west and north-western parts of the country [17,44]. While a longer growing season due to rising temperatures may benefit agriculture in Iceland, it may be limited by reduced precipitation or increased evapotranspiration, leading to periods of drought [6,45]. Fish are Iceland’s second largest export, constituting 22% of all exports, and the seafood and fishing industries, together, employ 6% of workers [46]. The abundance and distribution of marine species have both been observed to be changing and are predicted to change further with the changing climate [26,47,48]. Existing models predict an increase in the available fish biomass in the northern Atlantic, particularly above the 60° latitude, over the coming century [49,50]. Lam et al. stress that even if climate change has a positive economic effect on Icelandic and other northern fisheries, ocean acidification will have a negative economic effect. However, this would still result in net positive economic effects [51]. Nevertheless, more recent research suggests that the future of cod stocks is less certain, stating either that it may not experience a great deal of net change [52] or that it will vary depending on the sublocation [50]. The expanding mackerel stock has already caused management disputes between the North Atlantic countries. As the stock has expanded into Greenlandic and Icelandic waters, which previously had no share in the catch, it has become difficult to agree on quotas, and the lack of shared management is potentially leading to overfishing [53]. This phenomenon has been dubbed the mackerel wars, and it is possible that similar disputes could arise in the future as commercially important fish change their behavior and distribution due to climate change [46,53]. The impacts of climate change on fish stocks will have not only economic impacts but also ecological impacts. Declines in the puffin and Arctic tern populations have been linked to declines in the population of sand eels, their main food source [54,55]. According to Hansen et al., sand eels show a lower recruitment and smaller body size in warmer ocean conditions, partially due to the development of smaller gonads in warmer winter conditions [54].
The total aquaculture production in 2019 in Iceland was 34,000 tonnes, 27,000 of which was salmon, largely located in the Westfjords [56]. Salmon are temperature-sensitive fish and show increased stress and a reduced growth performance at temperatures above 16 °C [57]. According to Eskafi et al., sea temperatures within the fjords in the Westfjords region currently only reach a maximum of around 10 °C [58], which might reduce the risks associated with climate change for salmon aquaculture in the Westfjords. Klinger et al. indicate that the temperature projections for the waters around Iceland will be beneficial for salmon growth until 2050 [59]. Rising ocean temperatures may, however, leave salmon more susceptible to disease. Salmon lice (Lepeophtheirus salmonis and Caligus spp.) are parasitic copepods that feed on the mucus and surface tissue of their hosts, causing lesions and inducing a stress response [60]. They are an economic concern, being the most costly of all the parasites affecting aquaculture and representing fish welfare concern. Outbreaks of salmon lice in salmon farms may also affect wild populations [61]. A recent study [62] showed that infection pressure from farmed to wild salmon increases with rising temperatures, with an estimated twofold increase in the infection pressure if temperatures rise from 9 °C to 11 °C. The increase in the infection pressure is greater at rises from lower temperatures (i.e., 6 °C to 8 °C) and lower at rises from higher temperatures (i.e., 12 °C to 14 °C). These temperature rises are comparable to the events that may unfold in the Westfjords region and imply that salmon aquaculture, as well as wild salmon, will see greater pressure from salmon lice infestations in the future.
The economic importance of tourism has gradually been increasing in the Westfjords. Before the COVID-19 pandemic, the region was gaining increasing attention from the international travel media, and recently, it was selected by Lonely Planet as one of top ten regions to travel to in 2022 [63]. Skiing has long been popular in the Westfjords, particularly in Ísafjörður, where growing numbers of skiing events are hosted each year. Skiing is one industry that is viewed as being particularly under threat from climate change. A European modelling study predicts that Iceland could see a reduction of 50–75 days per year (from 200–250), where snow above 800 m would be at least 30 cm deep by the turn of the century [64]. In the Eastern European Alps, it is suggested that only 69% of ski resorts will survive past 2050, even allowing for snowmaking capabilities [65]. Hence, there are numerous potential socio-economic consequences related to a reduction in the ski season, such as the loss of jobs and social gatherings. All other types of outdoor recreation, as well as wildlife and nature-based tourism, in general, will also be impacted by climate change, mainly due to risks related to increased slope processes and coastal erosion.

4. Discussion

4.1. Local Climate Change Trends

The climate seems to be changing faster now than before. The most recent report of the IPCC stressed that rising temperatures, changing precipitation patterns and more weather extremes pose risks to socio-economic systems, ecosystems and physical systems worldwide [18]. The results from this study demonstrate that the Westfjords region is warming. A warming trend was observed from 1981–1990 to 1990–2000, but it has been particularly pronounced since the turn of this century, with sustained positive anomalies under almost all conditions. The results further show that the largest change occurred around the turn of this century, or between 1991–2000 and 2001–2010. This warming was not unprecedented, as a similar jump occurred in the beginning of the 20th century, or between 1911–1920 and 1921–1930, as seen in the long-term dataset from Bolungarvík. This increase is consistent with other long-term climate datasets in Iceland. There are only three climatic stations in Iceland that have available data extending back to the 19th century. The other two are Stykkishólmur (65°05′ N/22°44′ W), with data available from 1823, and Teigarhorn (64°41′ N/14°21′ W), with data available from 1873. They all show a sharp rise around the 1920s, which is traditionally seen as the end of the Little Ice Age in Iceland [66] (Figure 12). Natural forces are, however, believed to have played a greater role in the early twentieth century warming than anthropogenic forces [67,68]. This late-twentieth- and early-twenty-first-century warming that is has been observed globally is, on the other hand, believed to be largely driven by the anthropogenic release of greenhouse gases [1,69].
The reported global temperature rises between 1980 and 2019 amount to 0.18 °C per decade [69]. The results of this study show that, in the Westfjords, temperatures rose much more, or by 0.47 °C per decade from 1981–1990 to 2011–2020, which is 2.61 times the global rate. This supports previous studies stressing that the Arctic is warming faster than other places on the planet [2,6,70]. The reported global long-term temperature rise during the last 140 years, between 1880 and 2019, was 0.07–8 °C per decade [69], while in Bolungarvík, from 1901–1910 to 2011–2020, the rate was 0.15 °C per decade. In both the global and local timelines (1981 to 2020 and 1901 to 2020), it is noteworthy that the rate of warming has been slower in the summer and higher in the winter. Depending on the definition of the Arctic used, this could be seen as an example of Arctic amplification. Evidence for stronger seasonality is furthermore observed in the early part of the twentieth century. Hence, the results show that before 1920, winters tended to be colder than the average, and summers were warmer than the average. This contrasts strongly with the first twenty years of the twenty-first century, in which nearly all summer and winter periods have been warmer than the reference period (1961–1990). During both periods, i.e., the long-term 1901–2020 and the shorter 1951–2020 periods, winters showed a greater total difference from the reference temperatures, and summers showed the least. This indicates a reduction in the amplitude of the seasonal cycle and that warming is stronger in the winter. This is in line with the events that have been observed above the 60° N latitude, where, for this area as a whole, a reduction in the amplitude of the seasonal cycle has been reported [6].
Furthermore, the results show a clear change in the local precipitation pattern. Hence, evidence of drier summers and wetter winters in the last 20–30 years can be seen in both the temporal and spatial analysis of the precipitation. The temporal trends indicate wetter winter months during the last thirty years and a dryer-than-average June for the same period. The spatial trend also stresses a wetter winter period from 1991 to 2020 and a dryer summer period in the northern part of the Westfjords from 1991 to 2020 and in the southwest part from 2001 to 2020. These results support the prediction put forward in the IPCC report, stating that wetter winters at higher latitudes are going to be a feature of our changing climate [1]. It further supports the observations made by Box et al., revealing that increased precipitation above the 50° latitude was greater during the colder months (defined by the authors as October–May) in the period of 1971–2017, and that the extent of the increase was greatest after the mid-1980s [6]. Increased winter precipitation, combined with the warmer winter weather, indicates that the Westfjords region is now experiencing more precipitation falling as rain instead of snow during the winter months. Drier and warmer summers could leave the Westfjords at risk of periods of drought. However, some caution needs to be exercised when interpreting the precipitation results. Einarsson, in his summary of the Icelandic climate, discusses the fact that Icelandic rain gauges are liable to underestimating the amount of precipitation, particularly if it is accompanied by high winds or falls as snow, by as much as 25% [71]. While there has likely been some improvement in the data collection since 1984, a recent report by the IMO (2020) acknowledges persistent errors in the precipitation measurements. It specifically mentions two stations in the Westfjords region, Ísafjörður and Súðavík, in regard to their complex terrain, leading to difficulties in collecting accurate data [72].

4.2. Global Changes, Local Consequences

The local consequences of global climate change in the Westfjords will inevitably have significant impacts on the region’s physical as well as anthropogenic environment well into this century. The magnitude of these impacts is believed to depend on the quantity of the emissions released; thus, there is a strong case to be made for reducing emissions locally and globally [1,7]. Iceland is committed to cutting carbon emissions by 40% by 2030 and becoming carbon neutral by 2040 [73]. While this is admirable, carbon emissions will continue to rise past this point globally, and the long life of a CO2 molecule and the thermal inertia of the oceans mean that the effects of emissions will be felt far into the future. As such, a level of inevitable warming would occur even if all fossil fuel emissions were to cease [19]. A limit to the amount of mitigation that can be achieved leaves room for adaptation and planning in the Westfjords region. Indicators should be chosen carefully so as to assess the effectiveness of any measures that are taken [74]. This is emphasized in the most recent report of the IPCC that discusses not only the risks of climate change but also adaptation strategies for dealing with these risks [18]. There are numerous adaptation measures that could be implemented to address the potential impacts of climate change. These include investment in infrastructure to protect habited areas and roads from landslides and avalanches. The careful management of all fish stocks will be critical as the uncertainties of climate change play out. Increased understanding through the advance monitoring of climate-driven impacts on fish and habitats, as well as reductions in non-climate stressors and temporary closure of fisheries, when necessary, are likewise critical [50]. Fish stocks will continue to adapt to climate change with no respect for international boundaries, and as fishing encompasses a large part of the Westfjords’ and Iceland’s economy, it is in the country’s interest to establish international agreements and to set quotas that are sustainable. The same applies to other local industries in the Westfjords, such as aquaculture, agriculture and tourism, all of which are based on the utilization of the region’s natural resources. Adaptation to changing conditions due to global climate change must be based on sustainability so as to secure the long-term wellbeing of communities. Klinger et al. predict that the water temperature in Iceland will be beneficial for salmon aquaculture until 2050 [59]. Thus, in this respect, climate change may aid aquaculture production. This could have positive effects on employment and the economy within the Westfjords; however, recent research stresses that the temperature rise comes with an increased risk of disease among farmed salmon [60,62]. Hence, managing and treating sea lice infestations will bring greater costs to aquaculture in the Westfjords and raise concerns about animal welfare, which could impact public opinion on salmon aquaculture. Infections spread from farmed to wild salmon populations could anger local wild salmon fishers and damage the wild salmon fishing tourism. Investing in alternative winter recreational sports or relocating ski centers to higher locations could provide further means to adapt to a decreasing ski season. A review by Steiger et al. indicates that people would prefer to alter the location or time of their skiing rather than switch to an alternative activity [75]. However, Moen and Fredman suggest investment in year-round tourist activities as a promising alternative to skiing for both countering the negative economic effects of climate change and fostering a positive social effect [76]. It is therefore important to examine the big picture so as to understand how the numerous local factors are interconnected in each region and how global climate change affects them. It is no less important to increase the residents’ awareness and understanding of climate change and its potential consequences on the local conditions and, at the same time, on their livability in the region.

5. Conclusions

Considering the impact of climate change at a local level is valuable, as it allows the local community to visualize their future and offers them the chance to mitigate, prepare for or adapt to any impacts. Using an approach that utilizes long-term weather observations to model the key indicators of climate change at a regional and local level, such as the one presented in this paper, provides us with a better understanding of the implications that such changes may have on local livelihoods. Presenting the impacts that may directly affect residents’ livelihoods may, moreover, help the affected populations to better understand climate change and its local impacts. This can aid in the development of more effective strategies to support mitigation and adaptation measures.

Author Contributions

Conceptualization, D.B., R.Ó. and B.D.H.; methodology, D.B., R.Ó. and B.D.H.; validation, D.B., R.Ó. and B.D.H.; formal analysis, D.B.; investigation, D.B.; resources, D.B., R.Ó. and B.D.H.; writing—original draft preparation, D.B.; writing—review and editing, D.B., R.Ó. and B.D.H.; visualization, D.B.; supervision, R.Ó. and B.D.H.; project administration, R.Ó. and B.D.H. funding acquisition, R.Ó. All authors have read and agreed to the published version of the manuscript.

Funding

This paper was partly funded by European Union’s Horizon 2020 research and innovation program under grant agreement No. 869580.

Acknowledgments

This research forms part of a larger project sponsored by the European Union’s Horizon 2020 research and innovation program under grant agreement No. 869580, entitled Global drivers, local consequences: Tools for global change adaptation and sustainable development of industrial and cultural Arctic “hubs”.

Conflicts of Interest

The authors declare no conflict of interest.

References

  1. IPCC. Summary for Policymakers. In Climate Change 2021: The Physical Science Basis. Contribution of Working Group I to the Sixth Assessment Report of the Intergovernmental Panel on Climate Change; Cambridge University Press: Port Melbourne, Australia, 2021; in press. [Google Scholar]
  2. AMAP. Arctic Climate Change Update 2021: Key Trends and Impacts. Summary for Policy-Makers; Arctic Monitoring and Assessment Programme (AMAP): Tromsø, Norway, 2021; p. 16. [Google Scholar]
  3. Doney, S.C.; Fabry, V.J.; Feely, R.A.; Kleypas, J.A. Ocean Acidification: The Other CO2 Problem. Annu. Rev. Mar. Sci. 2009, 1, 169–192. [Google Scholar] [CrossRef] [PubMed] [Green Version]
  4. Perner, K.; Moros, M.; Otterå, O.H.; Blanz, T.; Schneider, R.R.; Jansen, E. An Oceanic Perspective on Greenland’s Recent Freshwater Discharge since 1850. Sci. Rep. 2019, 9, 17680. [Google Scholar] [CrossRef] [PubMed] [Green Version]
  5. Rocklöv, J.; Dubrow, R. Climate Change: An Enduring Challenge for Vector-Borne Disease Prevention and Control. Nat. Immunol. 2020, 21, 479–483. [Google Scholar] [CrossRef] [PubMed]
  6. Box, J.E.; Colgan, W.T.; Christensen, T.R.; Schmidt, N.M.; Lund, M.; Parmentier, F.-J.W.; Brown, R.; Bhatt, U.S.; Euskirchen, E.S.; Romanovsky, V.E.; et al. Key Indicators of Arctic Climate Change: 1971–2017. Environ. Res. Lett. 2019, 14, 045010. [Google Scholar] [CrossRef]
  7. Overland, J.; Dunlea, E.; Box, J.E.; Corell, R.; Forsius, M.; Kattsov, V.; Olsen, M.S.; Pawlak, J.; Reiersen, L.-O.; Wang, M. The Urgency of Arctic Change. Polar Sci. 2019, 21, 6–13. [Google Scholar] [CrossRef]
  8. Ballew, M.T.; Leiserowitz, A.; Roser-Renouf, C.; Rosenthal, S.A.; Kotcher, J.E.; Marlon, J.R.; Lyon, E.; Goldberg, M.H.; Maibach, E.W. Climate Change in the American Mind: Data, Tools, and Trends. Environ. Sci. Policy Sustain. Dev. 2019, 61, 4–18. [Google Scholar] [CrossRef]
  9. Whitmarsh, L.; Capstick, S. Perceptions of Climate Change. In Psychology and Climate Change; Elsevier: Amsterdam, The Netherlands, 2018; pp. 13–33. ISBN 978-0-12-813130-5. [Google Scholar]
  10. Poortinga, W.; Fisher, S.; Bohm, G.; Steg, L.; Whitmarsh, L.; Ogunbode, C. European Attitudes to Climate Change and Energy. Topline Results from Round 8 of the European Social Survey; European Social Survey ERIC: London, UK, 2018. [Google Scholar]
  11. Jalbert, M.; McClung, J.; Seibert, B.; Yeung, P. Perceptions of Climate Change in Iceland; Worchester Polytechnic Institute: Worcester, MA, USA, 2018. [Google Scholar]
  12. Statistics Iceland Statistics Iceland: Greenhouse Gas Emissions from Iceland (NIR). Available online: https://statice.is/statistics/environment/emission/greenhouse-gas-emissions-from-iceland/statistics/environment/emission/greenhouse-gas-emissions-from-iceland (accessed on 4 January 2022).
  13. Chadwick, A.E. Climate Change Communication. Available online: https://oxfordre.com/communication/view/10.1093/acrefore/9780190228613.001.0001/acrefore-9780190228613-e-22 (accessed on 3 January 2022).
  14. Jones, C.; Hine, D.W.; Marks, A.D.G. The Future Is Now: Reducing Psychological Distance to Increase Public Engagement with Climate Change. Risk Anal. 2017, 37, 331–341. [Google Scholar] [CrossRef]
  15. Sheppard, S.R.J.; Shaw, A.; Flanders, D.; Burch, S.; Wiek, A.; Carmichael, J.; Robinson, J.; Cohen, S. Future Visioning of Local Climate Change: A Framework for Community Engagement and Planning with Scenarios and Visualisation. Futures 2011, 43, 400–412. [Google Scholar] [CrossRef]
  16. Crochet, P.; Jóhannesson, T. A Data Set of Gridded Daily Temperature in Iceland, 1949–2010. Jokull 2011, 61, 1–18. [Google Scholar]
  17. IMO (Icelandic Meteorological Office) Climate Report|Climate of Iceland. Available online: https://en.vedur.is/climatology/iceland/climate-report (accessed on 5 June 2021).
  18. IPCC. Climate Change 2022 Impacts, Adaptation and Vulnerability; IPCC: Geneva, Switzerland, 2022. [Google Scholar]
  19. Mauritsen, T.; Pincus, R. Committed Warming Inferred from Observations. Nat. Clim. Chang. 2017, 7, 652–655. [Google Scholar] [CrossRef]
  20. NLSI (National Land Survey of Iceland) Geodatabase IS50v. Available online: https://www.lmi.is/is/landupplysingar/gagnagrunnar/nidurhal (accessed on 17 March 2022).
  21. Björnsson, H. Jöklar á Íslandi [Glaciers in Iceland]; Forlagið: Reykjavík, Iceland, 2019. [Google Scholar]
  22. Þórarinsson, S. Flatarmál Nokkurra Íslenzkra Jökla Samkvæmt Herforingjaráðskortunum. [The Area of Some Icelandic Glaciers According to the Danish General Council Maps]. Jökull 1958, 8, 25. [Google Scholar]
  23. Icelandic Institute of Natural History Vistgerðir á Íslandi [Habitat Types in Iceland]. Available online: https://vistgerdakort.ni.is/ (accessed on 25 April 2022).
  24. Botková, K.; Unnsteinsdóttir, E.R. Arctic Fox in Iceland—Protection of Furry Tourist Attraction; Mendel University: Brno, Czech Republic, 2015. [Google Scholar]
  25. Gardarsson, A. The Density of Seabirds West of Iceland. Rit Fiskid. 1999, 16, 155–169. [Google Scholar]
  26. Gunnlaugsson, S.B.; Valtysson, H. Sustainability and Wealth Creation, but No Consensus: Recent Decades in Iceland’s ITQ-Managed Fisheries. Mar. Policy 2022, 135, 104836. [Google Scholar] [CrossRef]
  27. Decaulne, A.; Saemundsson, T. Geomorphic Evidence for Present-Day Snow-Avalanche and Debris-Flow Impact in the Icelandic Westfjords. Geomorphology 2006, 80, 80–93. [Google Scholar] [CrossRef]
  28. Bjornsson, H.; Jonsson, T.; Gylfadottir, S.; Olason, E. Mapping the Annual Cycle of Temperature in Iceland. Meteorol. Z. 2007, 16, 45–56. [Google Scholar] [CrossRef]
  29. Decaulne, A. Snow-Avalanche and Debris-Flow Hazards in the Fjords of North-Western Iceland, Mitigation and Prevention. Nat. Hazards 2007, 41, 81–98. [Google Scholar] [CrossRef]
  30. 3Icelandic Road Administration Road Conditions in the Westfjords. Available online: http://www.road.is/travel-info/road-conditions-and-weather/westfjords-road-conditions-map/ (accessed on 2 February 2022).
  31. Icelandic Regional Development Institute Íbúafjöldi Sveitarfélaga Og Byggðakjarna (1. Janúar 2022) [Population of Municipalities and Settlements (1 January 2022). Available online: https://www.byggdastofnun.is/is/utgefid-efni/maelabord/ibuafjoldi-1-januar (accessed on 25 April 2022).
  32. Edvardsdóttir, A.G.; Ólafsdóttir, R.; Williams, A. Wicked Problems, Regional Development and Rural Sustainability: A Case Study from Iceland. Res. Glob. 2022, in press. [Google Scholar]
  33. ITB (Icelandic Tourism Board) Tourism in Iceland in Figures. Available online: https://www.ferdamalastofa.is/is/tolur-og-utgafur/ferdtjonusta-i-tolum#2020 (accessed on 18 June 2022).
  34. Hale, B.W. Mapping Potential Environmental Impacts from Tourists Using Data from Social Media: A Case Study in the Westfjords of Iceland. Environ. Manag. 2018, 62, 446–457. [Google Scholar] [CrossRef]
  35. ITB (Icelandic Tourism Board) Cruise Ship Traffic in Iceland. Available online: https://www.maelabordferdathjonustunnar.is/en/tourists-to-iceland/cruise-ships (accessed on 18 June 2022).
  36. NLSI (National Land Survey of Iceland) Iceland Digital Elevation Model. Available online: https://atlas.lmi.is/mapview/?application=DEM (accessed on 17 March 2022).
  37. WMO. WMO Guidelines on the Calculation of Climate Normals; World Meterological Organization: Geneva, Switzerland, 2017; p. 18. [Google Scholar]
  38. Samanta, S.; Pal, D.K.; Lohar, D.; Pal, B. Interpolation of Climate Variables and Temperature Modeling. Theor. Appl. Climatol. 2012, 107, 35–45. [Google Scholar] [CrossRef]
  39. Lloyd, C.D. Assessing the Effect of Integrating Elevation Data into the Estimation of Monthly Precipitation in Great Britain. J. Hydrol. 2005, 308, 128–150. [Google Scholar] [CrossRef]
  40. Haraldsdóttir, S.H.; Ólafsson, H.; Durand, Y.; Giraud, G.; Mérindol, L. A System for Prediction of Avalanche Hazard in the Windy Climate of Iceland. Ann. Glaciol. 2004, 38, 319–324. [Google Scholar] [CrossRef] [Green Version]
  41. Nawri, N. Large-Scale Atmospheric Conditions Associated with Major Avalanche Cycles and Cold Season Weather Hazards in Iceland; Icelandic Meterological Office: Reykjavík, Iceland, 2013; p. 99. [Google Scholar]
  42. Strapazzon, G.; Schweizer, J.; Chiambretti, I.; Brodmann Maeder, M.; Brugger, H.; Zafren, K. Effects of Climate Change on Avalanche Accidents and Survival. Front. Physiol. 2021, 12, 450. [Google Scholar] [CrossRef] [PubMed]
  43. Conway, S.J.; Decaulne, A.; Balme, M.R.; Murray, J.B.; Towner, M.C. A New Approach to Estimating Hazard Posed by Debris Flows in the Westfjords of Iceland. Geomorphology 2010, 114, 556–572. [Google Scholar] [CrossRef] [Green Version]
  44. Raynolds, M.; Magnússon, B.; Metúsalemsson, S.; Magnússon, S.H. Warming, Sheep and Volcanoes: Land Cover Changes in Iceland Evident in Satellite NDVI Trends. Remote Sens. 2015, 7, 9492–9506. [Google Scholar] [CrossRef]
  45. King, M.; Altdorff, D.; Li, P.; Galagedara, L.; Holden, J.; Unc, A. Northward Shift of the Agricultural Climate Zone under 21st-Century Global Climate Change. Sci. Rep. 2018, 8, 7904. [Google Scholar] [CrossRef] [Green Version]
  46. Østhagen, A.; Spijkers, J.; Totland, O.A. Collapse of Cooperation? The North-Atlantic Mackerel Dispute and Lessons for International Cooperation on Transboundary Fish Stocks. Marit. Stud. 2020, 19, 155–165. [Google Scholar] [CrossRef]
  47. Astthorsson, O.S.; Gislason, A.; Jonsson, S. Climate Variability and the Icelandic Marine Ecosystem. Deep Sea Res. Part II Top. Stud. Oceanogr. 2007, 54, 2456–2477. [Google Scholar] [CrossRef]
  48. Jansen, T.; Hansen, F.T.; Bardarson, B. Larval Drift Dynamics, Thermal Conditions and the Shift in Juvenile Capelin Distribution and Recruitment Success around Iceland and East Greenland. Fish. Res. 2021, 236, 105845. [Google Scholar] [CrossRef]
  49. Bryndum-Buchholz, A.; Boyce, D.; Tittensor, D.; Christensen, V.; Bianchi, D.; Lotze, H. Climate-Change Impacts and Fisheries Management Challenges in the North Atlantic Ocean. Mar. Ecol. Prog. Ser. 2020, 648, 1–17. [Google Scholar] [CrossRef]
  50. Peck, M.; Pinnegar, J.K. Impacts of Climate Change on Fisheries and Aquaculture: Synthesis of Current Knowledge, Adaptation and Mitigation Options; FAO Fisheries and Aquaculture Technical Paper 627; Food & Agriculture Org.: Rome, Italy, 2019; ISBN 978-92-5-130607-9. [Google Scholar]
  51. Lam, V.W.Y.; Cheung, W.W.L.; Sumaila, U.R. Marine Capture Fisheries in the Arctic: Winners or Losers under Climate Change and Ocean Acidification? Fish Fish. 2016, 17, 335–357. [Google Scholar] [CrossRef]
  52. Oostdijk, M.; Sturludóttir, E.; Santos, M.J. Risk Assessment for Key Socio-Economic and Ecological Species in a Sub-Arctic Marine Ecosystem Under Combined Ocean Acidification and Warming. Ecosystems 2021, 25, 1117–1134. [Google Scholar] [CrossRef]
  53. Boyd, R.; Thorpe, R.; Hyder, K.; Roy, S.; Walker, N.; Sibly, R. Potential Consequences of Climate and Management Scenarios for the Northeast Atlantic Mackerel Fishery. Front. Mar. Sci. 2020, 7, 639. [Google Scholar] [CrossRef]
  54. Hansen, E.S.; Sandvik, H.; Erikstad, K.E.; Yoccoz, N.G.; Anker-Nilssen, T.; Bader, J.; Descamps, S.; Hodges, K.; Mesquita, M.D.S.; Reiertsen, T.K.; et al. Centennial Relationships between Ocean Temperature and Atlantic Puffin Production Reveal Shifting Decennial Trends. Glob. Chang. Biol. 2021, 27, 3753–3764. [Google Scholar] [CrossRef] [PubMed]
  55. Petersen, A.; Robertson, G.J.; Thorstensen, S.; Mallory, M.L. Annual Survival of Arctic Terns in Western Iceland. Polar Biol. 2020, 43, 1843–1849. [Google Scholar] [CrossRef]
  56. Solås, A.-M.; Kvalvik, I.; Simonsen, K.; Thorarinsdottir, R.I.; Young, N.; Johnsen, J.P.; Sønvinsen, S.A.; Robertsen, R. Salmon Farming in the North—Regulating Societal and Environmental Impacts; Nofima: Tromsø, Norwegian, 2020; ISBN 978-82-8296-664-1. [Google Scholar]
  57. Islam, M.J.; Kunzmann, A.; Slater, M.J. Responses of Aquaculture Fish to Climate Change-Induced Extreme Temperatures: A Review. J. World Aquac. Soc. 2021, 53, 314–366. [Google Scholar] [CrossRef]
  58. Eskafi, M.; Ásmundsson, R.; Jónsson, S. Feasibility of Seawater Heat Extraction from Sub-Arctic Coastal Water; a Case Study of Onundarfjordur, Northwest Iceland. Renew. Energy 2019, 134, 95–102. [Google Scholar] [CrossRef]
  59. Klinger, D.H.; Levin, S.A.; Watson, J.R. The Growth of Finfish in Global Open-Ocean Aquaculture under Climate Change. Proc. R. Soc. B Biol. Sci. 2017, 284, 20170834. [Google Scholar] [CrossRef]
  60. Godwin, S.C.; Krkosek, M.; Reynolds, J.D.; Bateman, A.W. Sea-Louse Abundance on Salmon Farms in Relation to Parasite-Control Policy and Climate Change. ICES J. Mar. Sci. 2021, 78, 377–387. [Google Scholar] [CrossRef]
  61. Overton, K.; Dempster, T.; Oppedal, F.; Kristiansen, T.S.; Gismervik, K.; Stien, L.H. Salmon Lice Treatments and Salmon Mortality in Norwegian Aquaculture: A Review. Rev. Aquac. 2019, 11, 1398–1417. [Google Scholar] [CrossRef] [Green Version]
  62. Sandvik, A.D.; Dalvin, S.; Skern-Mauritzen, R.; Skogen, M.D. The Effect of a Warmer Climate on the Salmon Lice Infection Pressure from Norwegian Aquaculture. ICES J. Mar. Sci. 2021, 78, 1849–1859. [Google Scholar] [CrossRef]
  63. Lonely Planet The Westfjords. Available online: https://www.lonelyplanet.com/iceland/the-westfjords (accessed on 18 June 2022).
  64. Morin, S.; Samacoïts, R.; François, H.; Carmagnola, C.M.; Abegg, B.; Demiroglu, O.C.; Pons, M.; Soubeyroux, J.-M.; Lafaysse, M.; Franklin, S.; et al. Pan-European Meteorological and Snow Indicators of Climate Change Impact on Ski Tourism. Clim. Serv. 2021, 22, 100215. [Google Scholar] [CrossRef] [PubMed]
  65. Demiroglu, O.C.; Lundmark, L.; Saarinen, J.; Müller, D.K. The Last Resort? Ski Tourism and Climate Change in Arctic Sweden. J. Tour. Futur. 2019, 6, 91–101. [Google Scholar] [CrossRef] [Green Version]
  66. Mckinzey, K.M.; Ólafsdóttir, R.; Dugmore, A.J. Perception, History, and Science: Coherence or Disparity in the Timing of the Little Ice Age Maximum in Southeast Iceland? Polar Rec. 2005, 41, 319–334. [Google Scholar] [CrossRef] [Green Version]
  67. Bengtsson, L.; Semenov, V.A.; Johannessen, O.M. The Early Twentieth-Century Warming in the Arctic—A Possible Mechanism. J. Clim. 2004, 17, 4045–4057. [Google Scholar] [CrossRef]
  68. Brönnimann, S. Early Twentieth-Century Warming. Nat. Geosci. 2009, 2, 735–736. [Google Scholar] [CrossRef]
  69. Blunden, J.; Arndt, D. State of the Climate in 2019. Bull. Am. Meterological Soc. 2020, 101, S1–S429. [Google Scholar] [CrossRef]
  70. Previdi, M.; Smith, K.L.; Polvani, L.M. Arctic Amplification of Climate Change: A Review of Underlying Mechanisms. Environ. Res. Lett. 2021, 16, 093003. [Google Scholar] [CrossRef]
  71. Einarsson, M.A. Climate of Iceland. World Surv. Climatol. 1984, 15, 673–697. [Google Scholar]
  72. Massad, A.; Petersen, N.; Þórarinsdóttir, T.; Roberts, M. Reassessment of Precipitation Return Levels in Iceland; Vedurstofa Islands: Reykjavik, Iceland, 2020; p. 140. [Google Scholar]
  73. Government of Iceland Climate Change. Available online: https://www.government.is/topics/environment-climate-and-nature-protection/climate-change/ (accessed on 23 January 2022).
  74. Kenney, M.A.; Janetos, A.C. National Indicators of Climate Changes, Impacts, and Vulnerability. Clim. Chang. 2020, 163, 1695–1704. [Google Scholar] [CrossRef]
  75. Steiger, R.; Scott, D.; Abegg, B.; Pons, M.; Aall, C. A Critical Review of Climate Change Risk for Ski Tourism. Curr. Issues Tour. 2019, 22, 1343–1379. [Google Scholar] [CrossRef] [Green Version]
  76. Moen, J.; Fredman, P. Effects of Climate Change on Alpine Skiing in Sweden. J. Sustain. Tour. 2007, 15, 418–437. [Google Scholar] [CrossRef]
Figure 1. The location of the Westfjords region in Iceland (data source: IS50v geodatabase, obtained from the Natural Land Survey of Iceland).
Climate 10 00169 g001
Figure 2. Locations and names of weather stations used in this study. ((A) = the location of the Westfjords region within Iceland, (B,C) = distribution of weather stations in relation to elevation, C = dense network of stations around the most populous region of the Westfjords).
Climate 10 00169 g002
Figure 3. Temperature anomalies for each decade, 1901–2020, in Bolungarvík (JJA = June, July, August; DJF = December, January, February).
Climate 10 00169 g003
Figure 4. Long-term temperature anomalies for each month per decade, 1901–2020, Bolungarvík average. The figure presents a “temperature circle” for each decade. There are 12 outer segments for each month, labelled chronologically and progressing clockwise. The uppermost and righthand “J” is January, the “F” to the right is February, and so on. Each color represents the difference in degrees Celsius compared to the 1961–1990 reference period. The color in the center represents the annual average temperature anomaly for the decade.
Climate 10 00169 g004
Figure 5. Temperature anomaly for each decade, 1951–2020, Westfjords average (average created from Gjögur (1949–2020), Hornbjargsviti (1949–2020), Æðey (1954–2020), Bolungarvík (1949–2020), Reykhólar (1961–2020) and Lambavatn (1961–2020)).
Climate 10 00169 g005
Figure 6. Temperature anomalies for each month per decade, 1951–2020, Westfjords average (average created from six stations, i.e., Gjögur (1949–2020), Hornbjargsviti (1949–2020), Æðey (1954–2020), Bolungarvík (1949–2020), Reykhólar (1961–2020) and Lambavatn (1961–2020)).
Climate 10 00169 g006
Figure 7. Average temperature anomalies for each decade, 1950–2020, Hornbjargsviti and Gjögur, and 1960–2020, Æðey, Lambavatn and Reykhólar.
Climate 10 00169 g007
Figure 8. Average precipitation anomalies for each decade, 1960–2020, Lambavatn and Mjólkárvirkjun.
Climate 10 00169 g008
Figure 9. Spatial distribution of absolute temperature changes (A) and temperature changes relative to the 1961–1990 mean (B) for each decade of 1961–2020. DJF: December, January, February. JJA: June, July, August.
Climate 10 00169 g009
Figure 10. Spatial distribution of absolute precipitation changes (A) and precipitation changes relative to the 1961–1990 mean (B) for each decade of 1961–2020. DJF: December, January, February. JJA: June, July, August. 3.3. Local impact of climate change in the Westfjords.
Climate 10 00169 g010
Figure 11. Potential local impacts due to climate change in the Westfjords region.
Climate 10 00169 g011
Figure 12. Average temperature anomalies over time for Stykkishólmur, Teigarhorn and Bolungarvík.
Climate 10 00169 g012
Table 1. Summary of temperature and precipitation data availability for the Westfjords region.
#StationElevation (m.a.s.l)1951–601961–701971–801981–901991–002001–102011–201961–90 1TempPrecip
1Bolungarvík18T 2TTTTXXT1898–20201995–2018
2Gjögur5/31XXXXTTTX1949–20201949–1993
3Hornbjargsviti27/22XXXXTTTX1949–20201949–1995
4Kvígindisdalur49XXXXX X1949–20041949–2004
5Flatey3TXXX X1952–19891956–1989
6Reykhólar27 XXXXTTX1961–20201961–2004
7Æðey5/21 XXXXXTX1954–20201954–2012
8Lambavatn4 XXXXXXX1961–20201961–2020
9Mjólkárvirkjun8 PPPPPPPNA1959–2020
10Þórustaðir20 XXXX X1961–19981961–1998
11Suðureyri3 XXX X1961–19891961–1989
12Galtarviti20 XXX X1953–19941953–1994
13Hvallátur17 XXX X1953–19891953–1989
14Ísafjörður2 PPXX 1999–20201981–2020
15Brjánslækur23 PPPP NA1997–2020
16Rauðamýri- P NA1978–1989
17Hóll í Firði30 XXX 1983–20201983–2020
18Breiðavík20 X 1990–20031990–2003
19Litla Ávík15 XX 1996–20201996–2020
20Bíldudalur16 XX 1998–20201998–2020
21Súðavík10 XX 1996–20201999–2020
22Hnífsdalur- PP NA1995–2020
23Flateyri3 TT 1997–2020NA
24Þverfjall753 TT 1994–2020NA
25Ögur40 TT 1997–2020NA
26Straumnesviti7 TT 1996–2020NA
27Seljalandsdalur550 TT 2001–2020NA
28Steingrímsfjarðarheiði440 TT 1995–2020NA
29Patreksfjörður43 TT 1996–2020NA
30Birkihlíð- P NA1998–2014
31Vaðlar- P NA2000–2011
32Hrafnabjörg- P NA1995–2012
33Gemlufallsheiði250 T 2010–2020NA
34Tálknafjörður9 T 2009–2020NA
35Hólmavík10 T 2008–2020NA
36Bassastaðir- P NA2005–2020
37Hænuvík- P NA2005–2020
TOTAL T51212121018211228NA
TOTAL P312121510141212NA27
1 Indicates if data was available for a 30 year reference period. 2 T = Temperature data available, P = Precipitation data available, X = both temperature and precipitation data available.
Publisher’s Note: MDPI stays neutral with regard to jurisdictional claims in published maps and institutional affiliations.

