Article

Variation Patterns of the ENSO’s Effects on Dust Activity in North Africa, Arabian Peninsula, and Central Asia of the Dust Belt

1
Department of Environmental & Ocean Sciences, University of San Diego, San Diego, CA 92110, USA
2
State Key Laboratory of Loess and Quaternary Geology, Institute of Earth Environment, Chinese Academy of Sciences, Xi’an 710061, China
*
Author to whom correspondence should be addressed.
Climate 2022, 10(10), 150; https://doi.org/10.3390/cli10100150
Submission received: 24 August 2022 / Revised: 21 September 2022 / Accepted: 9 October 2022 / Published: 13 October 2022
(This article belongs to the Special Issue Climate Change Impacts at Various Geographical Scales)

Abstract

:
El Niño/Southern Oscillation (ENSO) events produce anomalous oceanographic and atmospheric conditions in regions far from the equatorial central-eastern Pacific, which modulate the atmospheric and surface processes that influence the dust emission, transport, and deposition in many places on Earth. In this study, we examined the MERRA-2 dust column mass density data in five subregions of the “dust belt”: eastern and western Arabian Peninsula, western and eastern Central Asia, and North Africa-Sahara during 1980–2021. We discovered that, while there is a common dust season from April to July, the specific dust seasons in these subregions are different with the peaks of dust activity occurring at different times of the year. In the meantime, the modulating effects of ENSO also peak at different times within the respective dust seasons. For example, ENSO has a persistent effect on dust activity during April-August in the eastern Arabian Peninsula, while its influence in eastern Central Asia lasts from February to November. For different well-recognized factors of dust activities, such as precipitation/humidity, wind, vegetation, and soil moisture, their responses to ENSO are also different in these subregions. For precipitation, humidity, and soil moisture, their responses to ENSO are mostly positive in winter and spring/early summer months during El Niño years, while mean daily maximum wind responded positively in spring, but it did so negatively in summer. During the three months when the ENSO’s effects were strongest, these factors could explain 25.1–58.6% of the variance in the dust column mass density in combination with the ENSO’s modulation effects. However, the highest model-explained variance was obtained for the North Africa–Sahara subregion where the intensity of dust activity was not statistically correlated with ENSO.

1. Introduction

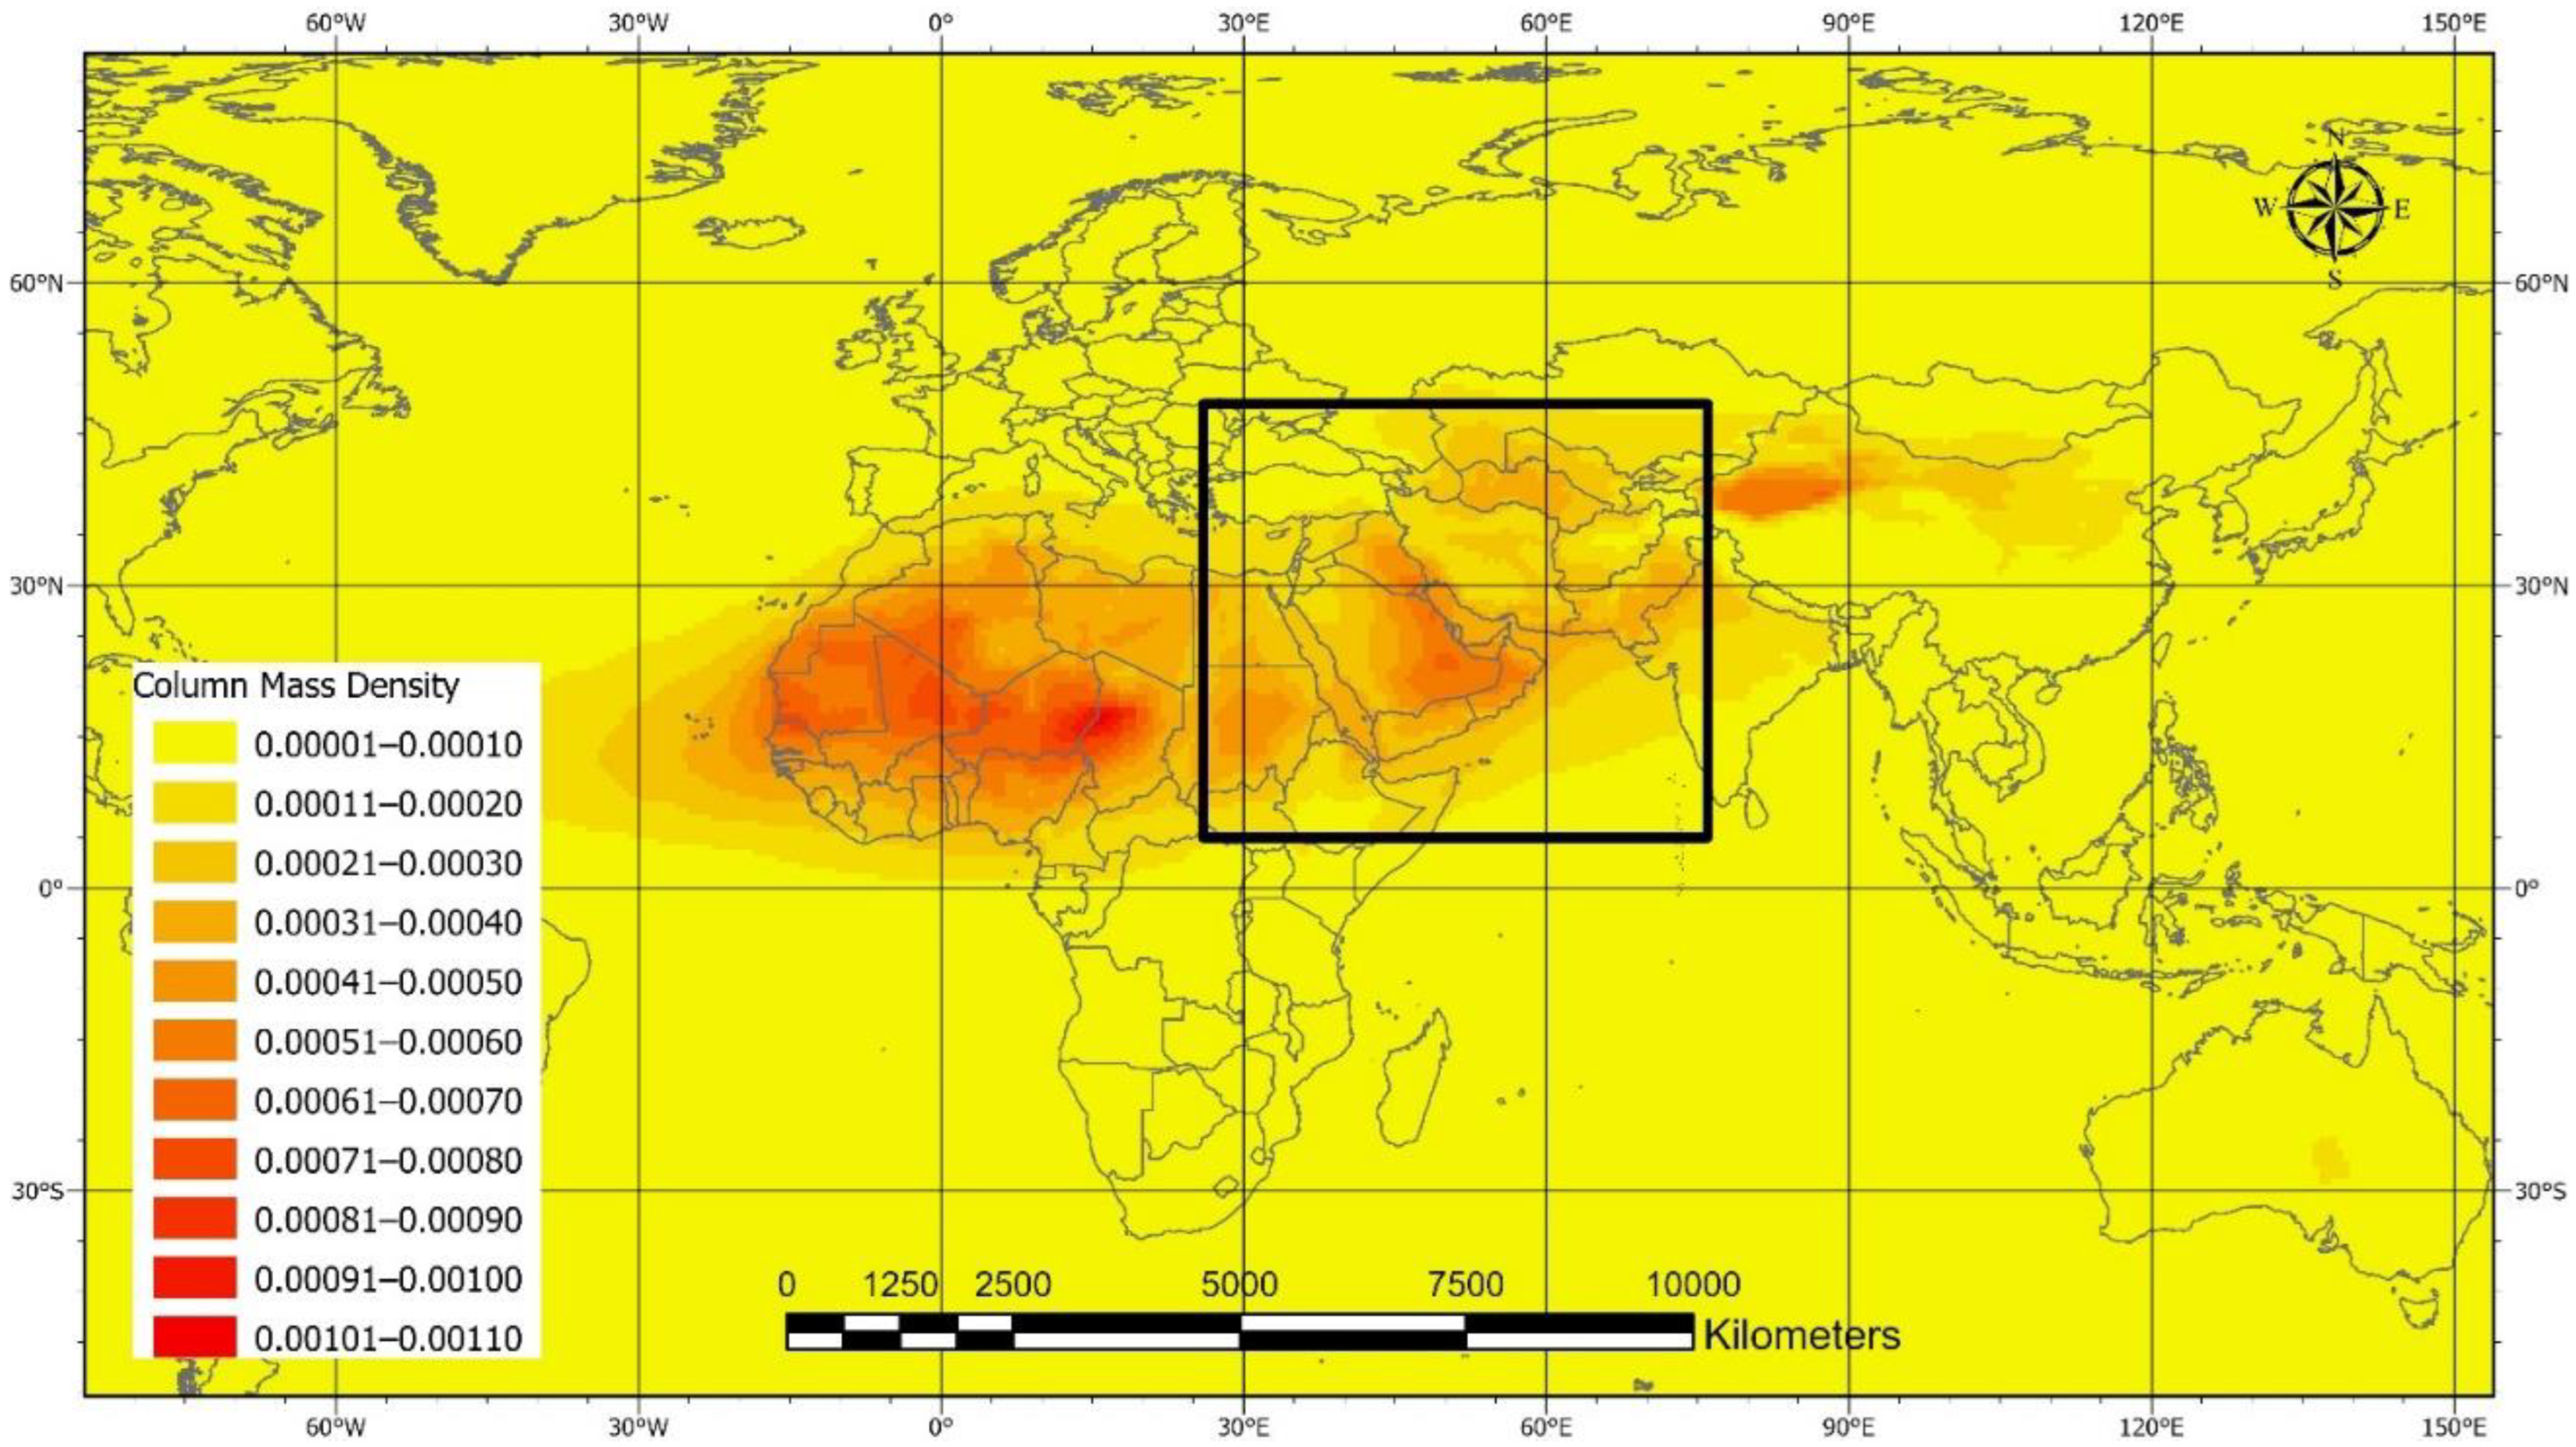
Globally, the dust cycle links and affects many facets of the Earth’s climate. Dust aerosols can have significant impacts on regional and even global climates. For example, dust aerosols may modulate the Asian monsoon circulations by weakening the land-ocean thermal contrast (e.g., [1,2,3]), and influencing the precipitation, the cloud characteristics, and the energy budget of the Earth by acting as condensation nuclei [4,5,6]. They may travel long distances to have impacts on the global biogeochemical cycles (e.g., [7,8]) and impact human health [9,10,11,12]. The “dust belt”, referring to an arid and semi-arid region stretching from the west coast of North Africa to East Asia [13,14], is considered the largest source of mineral dust aerosol on Earth (Figure 1). The “dust belt” contains many of the large deserts of the world and it is known for frequent dust storms that are associated with strong winds and poor vegetation cover [13]. Because of its vast size, the “dust belt” is located in multiple climate zones with different atmospheric processes and circulation patterns, vegetation types, and topographic features. Therefore, different patterns of dust distribution and transportation pathways are often seen in the major dust events originating from this region [13].
El Nino Southern Oscillation (ENSO) is a large-scale anomalous condition that is associated with the sea surface temperature (SST) anomalies in the central-eastern equatorial Pacific [15]. ENSO is known to impact the weather patterns in many different regions all over the globe through teleconnections of the El Niño (EN) and La Niña (LN) phases [16,17], including affecting dust activities in various regions within the “dust belt”, such as the Arabian Peninsula [18], North Africa [19], Central Asia [20,21], and northwestern China [22]. Recently, Huang et al. [23] found a negative correlation between the winter NINO3.4 Index and the mean dust column content during the following spring and summer months in a large region inside the “dust belt”, and named it as the Key Region, which stretches from northeastern Africa to the Arabian Peninsula, to Central Asia (5–48° N, 26–76° E) (Figure 1). Their results indicated that the dust activities decrease in the summer following the most intense El Nino months (November through January) and enhance in the summer following the La Nina winter [23]. While these results were confirmed in another recent study [24], previous studies have found that the dust activities in this Key Region can be highly variable, both spatially and temporally (e.g., [18,25,26,27]), and they are associated with complex synoptic-scale processes that are often not in sync within this large region [28,29]. Even the Arabian Peninsula was considered to be too large due to a significant amount of internal variation in the rainfall patterns [18] considering the high degree of spatial and temporal variability in rainfall [30,31,32,33] since it is treated as a major factor of the spatial variation of the dust emission and the settlement processes. On the other hand, both the atmospheric and surface processes may have different patterns of seasonality, which are governed by the seasonal shifts of the planetary wind belts. At the synoptic scale, a high surface wind speed can significantly enhance the amount of dust emission and its transport [28,29,34], which may be related to extratropical cyclonic activities in winter and spring, covering areas with linear dimensions of 1000–2000 km [35], or intense convective storms in late spring and summer that have much smaller dimensions [28,36,37]. For example, a recent study [38] examined the dust storm events over Saudi Arabia in relation to the weather patterns and discovered that there were more dust storms in the years with lower temperatures, which is especially associated with westerly winds from the Sahara Desert. Additionally, some studies (e.g., [39,40]) identified that the northwesterly or northerly winds are a major cause of dust emission over the Arabian Peninsula and Iran-Pakistan-Afghanistan regions, respectively, while others such as Ackerman and Cox [41] have attributed the southerly winds as the main cause for the dust emission in the Oman region. More specifically, the dust events in the Middle East region have been linked to the Shamal winds during summer [28,30]. Besides the weather conditions, the surface conditions, especially the amount of vegetation cover and soil moisture levels, may also play important roles in dust emission and its settlement processes [42,43,44], while both vegetation cover and soil moisture are regulated by the amount of antecedent and concurrent precipitation [45].
Figure 1. MERRA-2 long-term mean dust column mass density (unit: kg m−2) during January 1980 to December 2021. Data were obtained from NASA GIOVANNI in GEOTIFF format (https://giovanni.gsfc.nasa.gov/giovanni/#service=TmAvMp&starttime=1980-01-01T00:00:00Z&endtime=2021-12-31T23:59:59Z&data=M2TMNXAER_5_12_4_DUCMASS (accessed on 11 August 2022)). The black box is the Key Region (5–48° N, 26–76° E) which was defined in Huang et al. [23].
Climate 10 00150 g001
Dust activities in arid and semi-arid regions are influenced by many factors. Numerous previous studies have examined the contributions of these factors to the dust activities in different regions. For example, wind is often considered the direct forcing mechanism of dust emission, suspension, and transport (e.g., [46,47,48,49]), while precipitation is the major factor limiting the dust activities by causing the wet deposition of it and providing moisture to enhance the amount of vegetation cover and increase the cohesion or crusting of the surface soil or sediment [47]. Atmospheric humidity is closely related to the precipitation process, and it is also a factor in cloud formation and wet deposition processes by utilizing dust aerosols as the condensation nuclei [50]. Therefore, it was suggested that both the wind speed and the relative humidity should be considered in estimating the dust aerosol emission in semi-arid regions [32]. For the bare ground surfaces, wet soils have higher cohesion between the mineral particles than dry soils do, which reduces the dust emission [51]. In the meantime, vegetation shields the underneath soil/sediment from direct wind stress and, therefore, reduces dust emission [52,53], and this effect tends to vary at a much longer time scale (from weeks to months) than the variation in the soil moisture (from hours to days) [51]. For large regions, the satellite-based normalized difference vegetation index (NDVI) has been used frequently to represent the degree of vegetation cover or above-ground biomass [54,55]. A recent study [56] examined the dust variation patterns in several Middle Eastern countries and used the NDVI to represent the vegetation conditions, while another, ref. [44], used the 16-day NDVI time-series data to correlate with the aerosol optical depth (AOD) data and observed an inverse relationship between the two series.
Since both the dust activity and its potential influencing factors vary significantly within the “dust belt”, there is a need to examine the internal differences in the relationship between dust activity and ENSO. In this current study, we divide the Key Region in Huang et al. [23] into subregions to analyze the spatial and temporal variations in the dust activity and its relationship with the ENSO cycle. For these subregions, we hope to identify different sets of influential factors of the dust activity, which are the main mechanisms that connect the ENSO cycle and local weather and surface conditions, and thereby further our understanding of the impacts of the ENSO cycle on the dust aerosol processes.

2. Data and Methods

2.1. Study Region

Huang et al. [23] indicated that the dust column mass density, wind fields, precipitation, and the surface conditions (soil moisture and vegetation) responded differently to ENSO in various parts within the Key Region. Since the previous studies found that there were significant variations in the dust activity within the Arabian Peninsula [18] and the eastern Arabian Peninsula is an area of unique characteristics in terms of its dust activities [43,57] and it seemed to be especially impacted by the ENSO cycle [23], we first divided the entire Peninsula into the Eastern Arabian Peninsula (EAP, 12–27° N, 48–60° E) and the Western Arabian Peninsula (WAP, 12–32° N, 34–48° E) (Figure 2). In the north of the Arabian Peninsula is Central Asia, and we divided this also into the western and eastern parts: Central Asia West (CAW, 3048° N, 26–51° E, including parts of Eastern Europe), and Central Asia East (CAE, 30–48° N, 51–76° E), which are separated by the Caspian Sea (Figure 2). We also included the Sahara Desert of North Africa (NAS, 1230° N, 10° W–34° E) for the purpose of comparison (Figure 2), whose dust activity is most intense (Figure 1), but does not appear to be modulated by the ENSO cycle as the dust mass density in NAS was above normal during both El Niño and La Niña events [23]. On the other hand, Li et al. [24] indicated a significant association between the surface dust concentration across North Africa and the Southern Oscillation Index (SOI), with there being high dust concentrations during the La Niña months.

2.2. Data and Methods

In the past, conducting studies on dust events was extremely difficult for large regions due to the lack of observations in the sparsely populated areas. Since the 1980s, satellite-based observations have become widely available, especially with the deployment of moderate resolution, wide-swath sensors such as the Advanced Very High Resolution Radiometer [58] and Moderate Resolution Imaging Spectroradiometer (MODIS) [59]. The MODIS program can provide a daily-to-weekly coverage of the repeated measurements of AOD that have significantly improved the capability of the continuous monitoring of the dust aerosol concentrations in the atmosphere and the surface conditions across large regions on Earth [60]. To remediate the temporal and spatial gaps in the satellite and the ground-based observational data, the MERRA-2 dataset integrates the satellite and ground observations with the modeled estimates and contains various measures of the aerosol concentrations [61]. An extensive evaluation of the MERRA-2 data against the satellite- and ground-based dust aerosol data was performed by Huang et al. [23]. It was concluded that the MERRA-2 dust aerosol data are robust and representative of the atmospheric dust AOD conditions (Supplementary Information of Huang et al. [23]). The MERRA-2 data have been used in many recent studies of the interannual variability of the dust aerosols (e.g., [24,62,63,64,65]). Following these studies, we mainly used the MERRA-2 monthly dust column content (mass density in kg m−2) with a spatial resolution of 0.5 × 0.625 latitude and longitude as the area-averaged time series for all gridded values within the specific subregions from 1980 to 2021 to represent the intensity of the dust activity. The MERRA-2 data can be obtained from the Goddard Earth Sciences Data and Information Service Center’s Interactive Online Visualization and Analysis Infrastructure (Giovanni) website of NASA (https://giovanni.gsfc.nasa.gov/giovanni/ (accessed on 31 March 2022)).
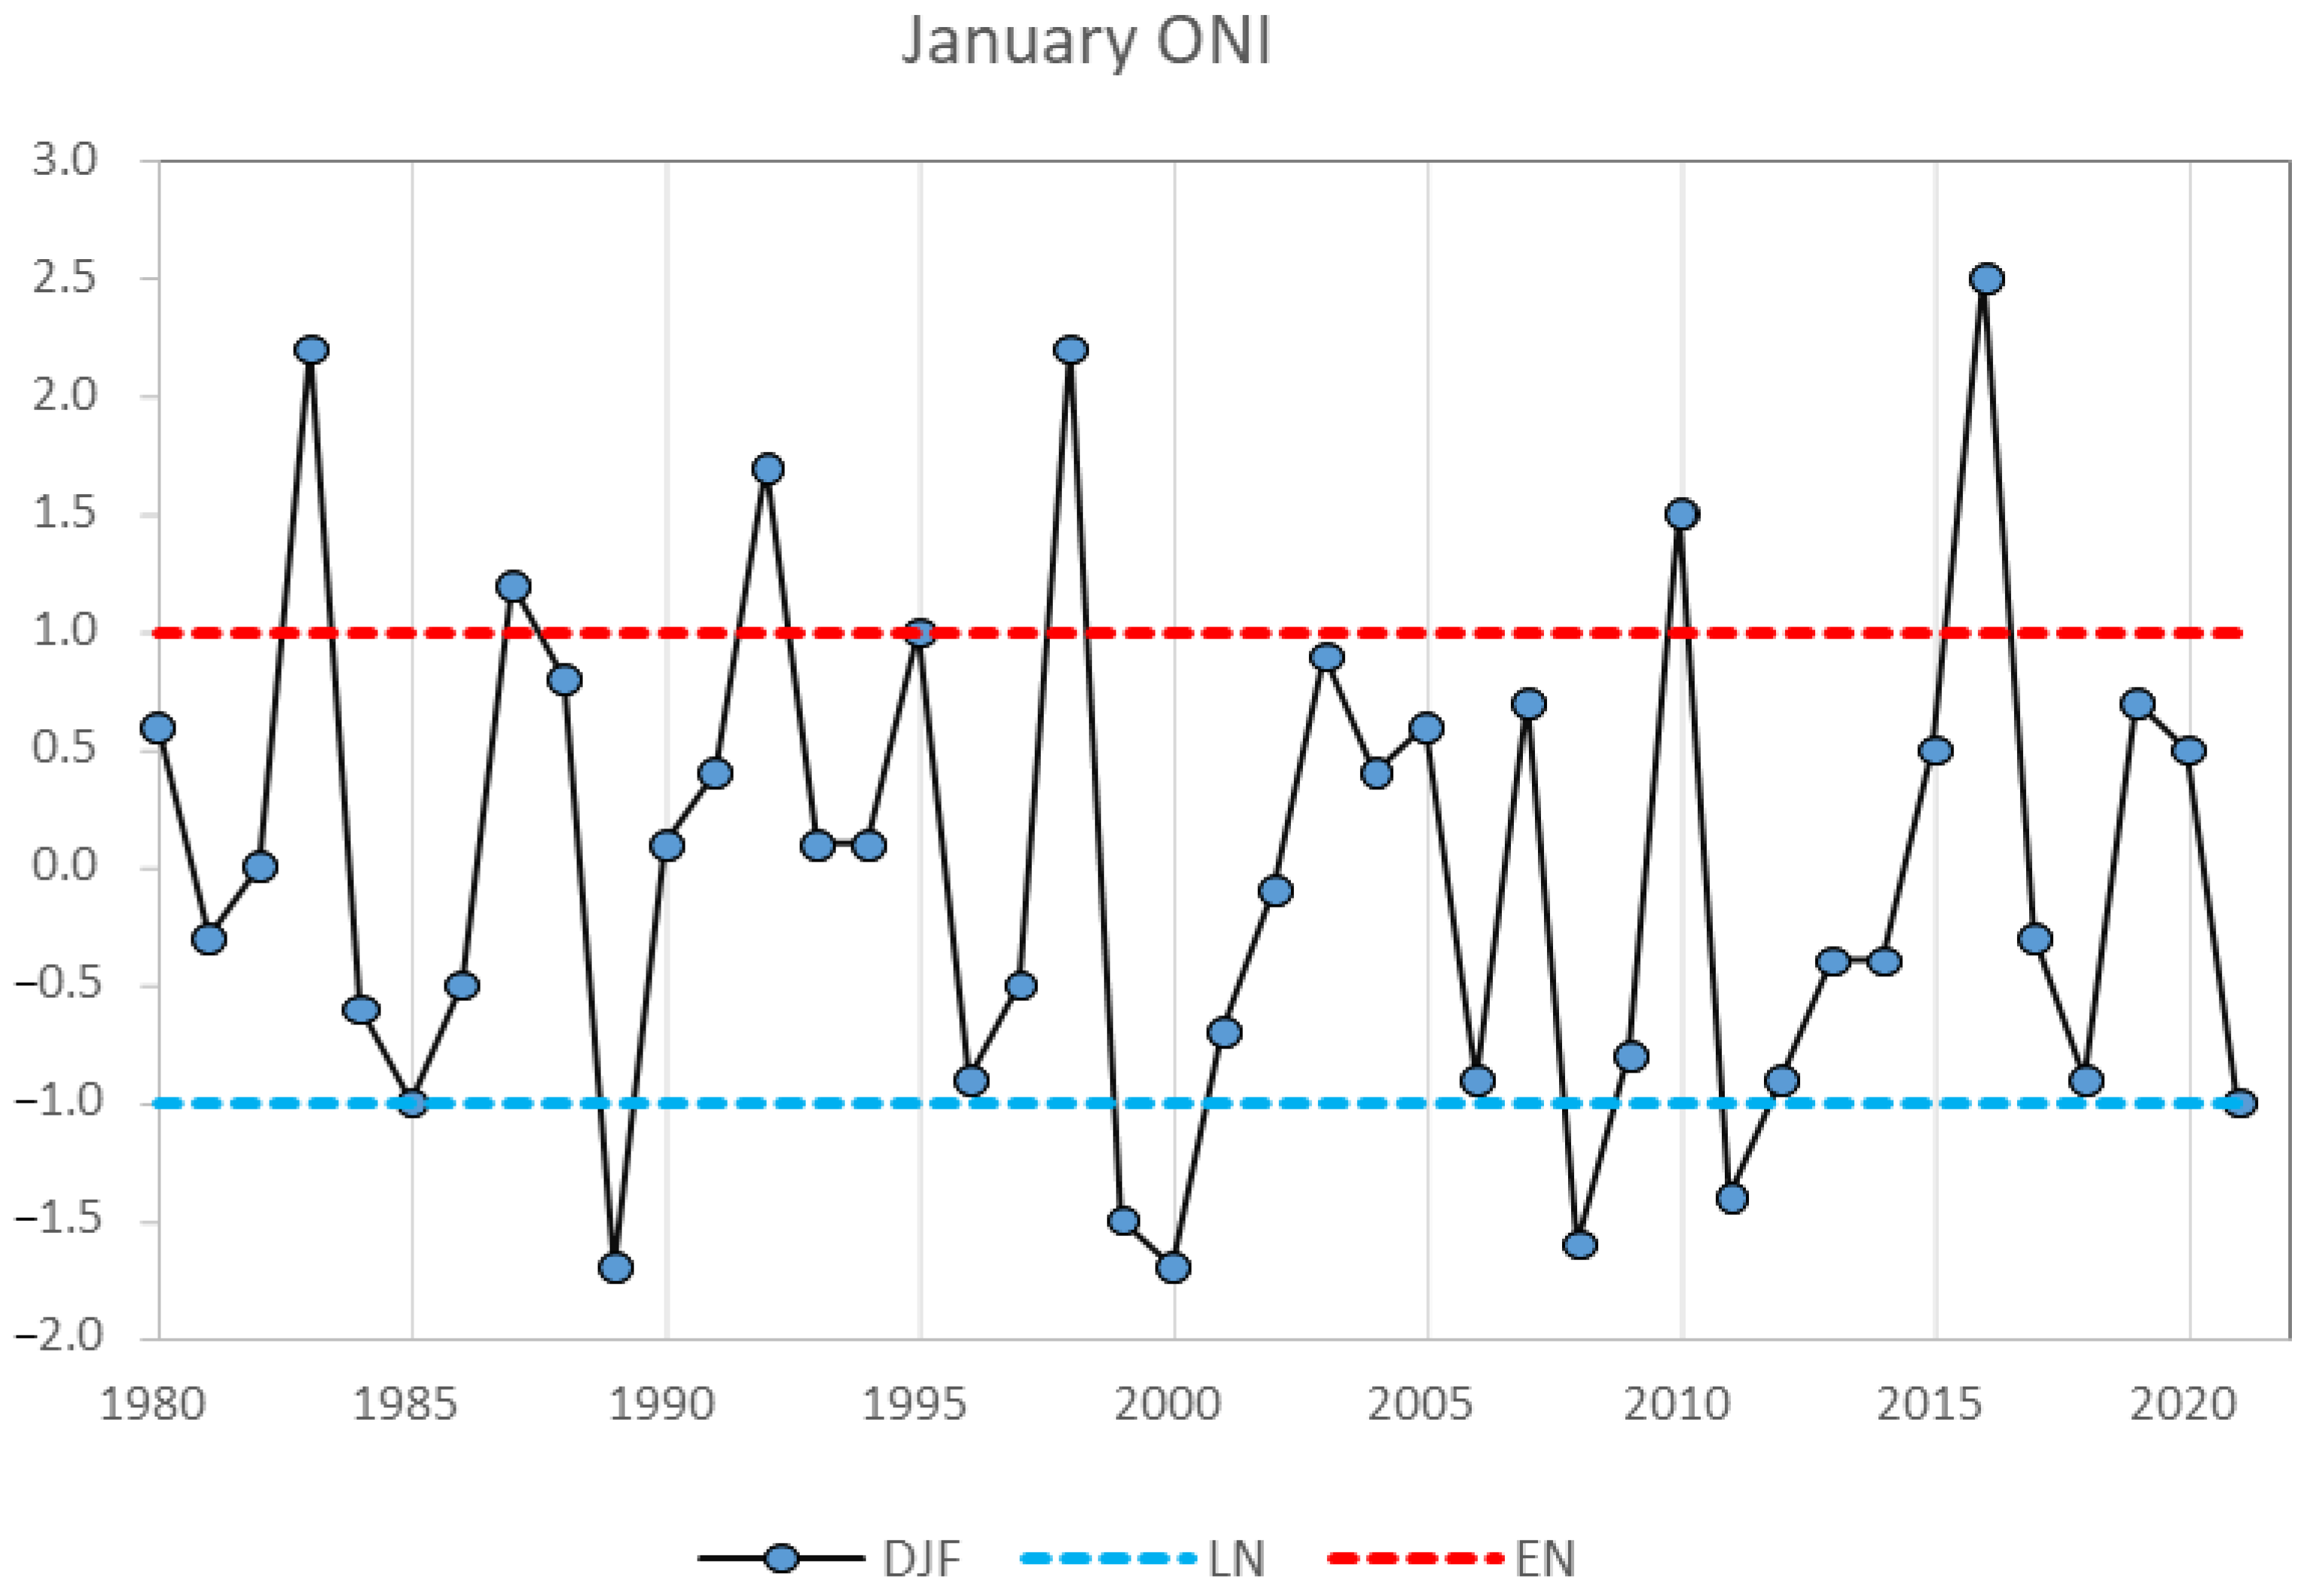
To characterize the ENSO cycle, we identified the years in which there were EN and LN conditions using the Oceanic NINO Index (ONI) (https://origin.cpc.ncep.noaa.gov/products/analysis_monitoring/ensostuff/ONI_v5.php (access on 24 April 2022)), which is based on the 3-month moving averages of the Extended Reconstructed Sea Surface Temperature anomalies (ERSST, ref. [66], available from the Climate Prediction Center of NOAA at https://www.cpc.ncep.noaa.gov/products/analysis_monitoring/ensostuff/detrend.nino34.ascii.txt (accessed on 24 April 2022)) in the NINO3.4 region (5° N–5° S, 120–170° W) of the central-eastern equatorial Pacific [15] during 1980–2021 to match the MERRA-2 dust column mass density data (Figure 3). In other words, the January ONI is equivalent to the 3-month averages of the ERSST-based NINO3.4 index for the months December, January, and February (DJF) and, therefore, it is noted as ONI_DJF in the following. For the analyses of the major factors of the dust activity, such as precipitation and wind, we used the entire monthly ONI_DJF series which dated back to 1950 (standard deviation = 1.02). For these monthly time-series, when the ONI_DJF value was greater than 1.0 (lower than −1.0), then all the months of the entire year from January to December were classified as the EN (LN) condition, while the other months were classified as the normal condition (N).
In this study, we first identified the dust seasons in these subregions based on the long-term means of the MERRA-2 dust column mass density and their monthly contributions to the annual total. We determined the seasonality by calculating the long-term means by the months for the MERRA-2 monthly dust column mass density time-series. Then, we calculated the anomalies from the monthly means for all the subregions by removing the seasonality component (long-term monthly averages during 1980–2021). A One-Way ANOVA [67] was used to compare the group means of the dust mass density anomaly series for the EN, LN, and normal conditions for the subregions, which was also confirmed by the non-parametric test for multiple comparisons, the Kruskal–Wallis H test or the One-Way ANOVA on ranks [67]. The Tukey’s studentized range test, which is also known as the Tukey–Kramer test [68,69] or the Tukey’s HSD test, was used to determine the statistical significance of all of the pairwise comparisons of the group means.
Then, we attempted to establish the linkages between the ENSO cycle and the monthly and seasonal dust column mass density series of the subregions. A Spearman’s rank correlation was chosen over the Pearson’s correlation to avoid the potential issues that are related to the non-linearity or the small sample sizes of the variables that are involved [70]. By doing so, we hope to identify the months/seasons when the impact of ENSO was most prominent for a given subregion. To explain such linkages, we also analyzed the relationships between ENSO and the major factors of the dust activity, including precipitation, humidity, surface wind speed, soil moisture, and vegetation conditions that are represented by the NDVI. Whenever possible, we used the full data records (up to 1950–2021) to enhance the robustness of the statistical analysis results. We further focused on the months when the ENSO’s modulation effects were most pronounced on the dust column mass density in each subregion. To examine the combined effects of multiple factors, we used the stepwise multiple linear regression analysis [71] with the criterion for a variable to enter the model being set at the 0.1 significance level because we aimed to avoid missing any of the important factors in this analysis. In the correlation and regression analyses involving ONI_DJF, we used the 3-month mean series of the dust mass density and the major factors to match the way in which ONI was obtained from the original SST data. All of the statistical analyses were performed using IBM SPSS version 28.0, while the maps were produced using ArcGIS Pro version 2.8 (ESRI, Redlands, CA, USA), unless they are noted otherwise.
For most of the meteorological variables that are mentioned above, we used the ERA v5 reanalysis data (https://www.ecmwf.int/en/forecasts/datasets/reanalysis-datasets/era5/ (access on 11 August 2022)), which were extracted from KNMI Climate Explorer (https://climexp.knmi.nl/start.cgi (access on 11 August 2022)) to generate the monthly time series for the subregions during 1950–2021. KNMI Climate Explorer is a climatic data dissemination site and a web-based analytical tool that is maintained by the Royal Netherlands Meteorological Institute, the Dutch National Weather Service (https://www.knmi.nl/over-het-knmi/about (accessed on 11 August 2022)). Because of its extensive data collection and analytical capability, it has been used in many previous studies for a variety of temporal and spatial analyses [72]. Table 1 lists the variables representing the major factors of the dust activity, which are considered in this study and the respective data sources. It is noted that the MERRA-2 dataset does not provide the NDVI or vegetation data (such as the leaf area index or LAI) with interannual variations. Therefore, we used the monthly NOAA/NCEI CDR NDVI data with a 0.1° spatial resolution since 1981, which was home-processed by KNMI (http://climexp.knmi.nl/select.cgi?ndvi_noaa_01 (accessed on 20 September 2022)).

3. Results

3.1. Seasonality of Dust Activities in Subregions

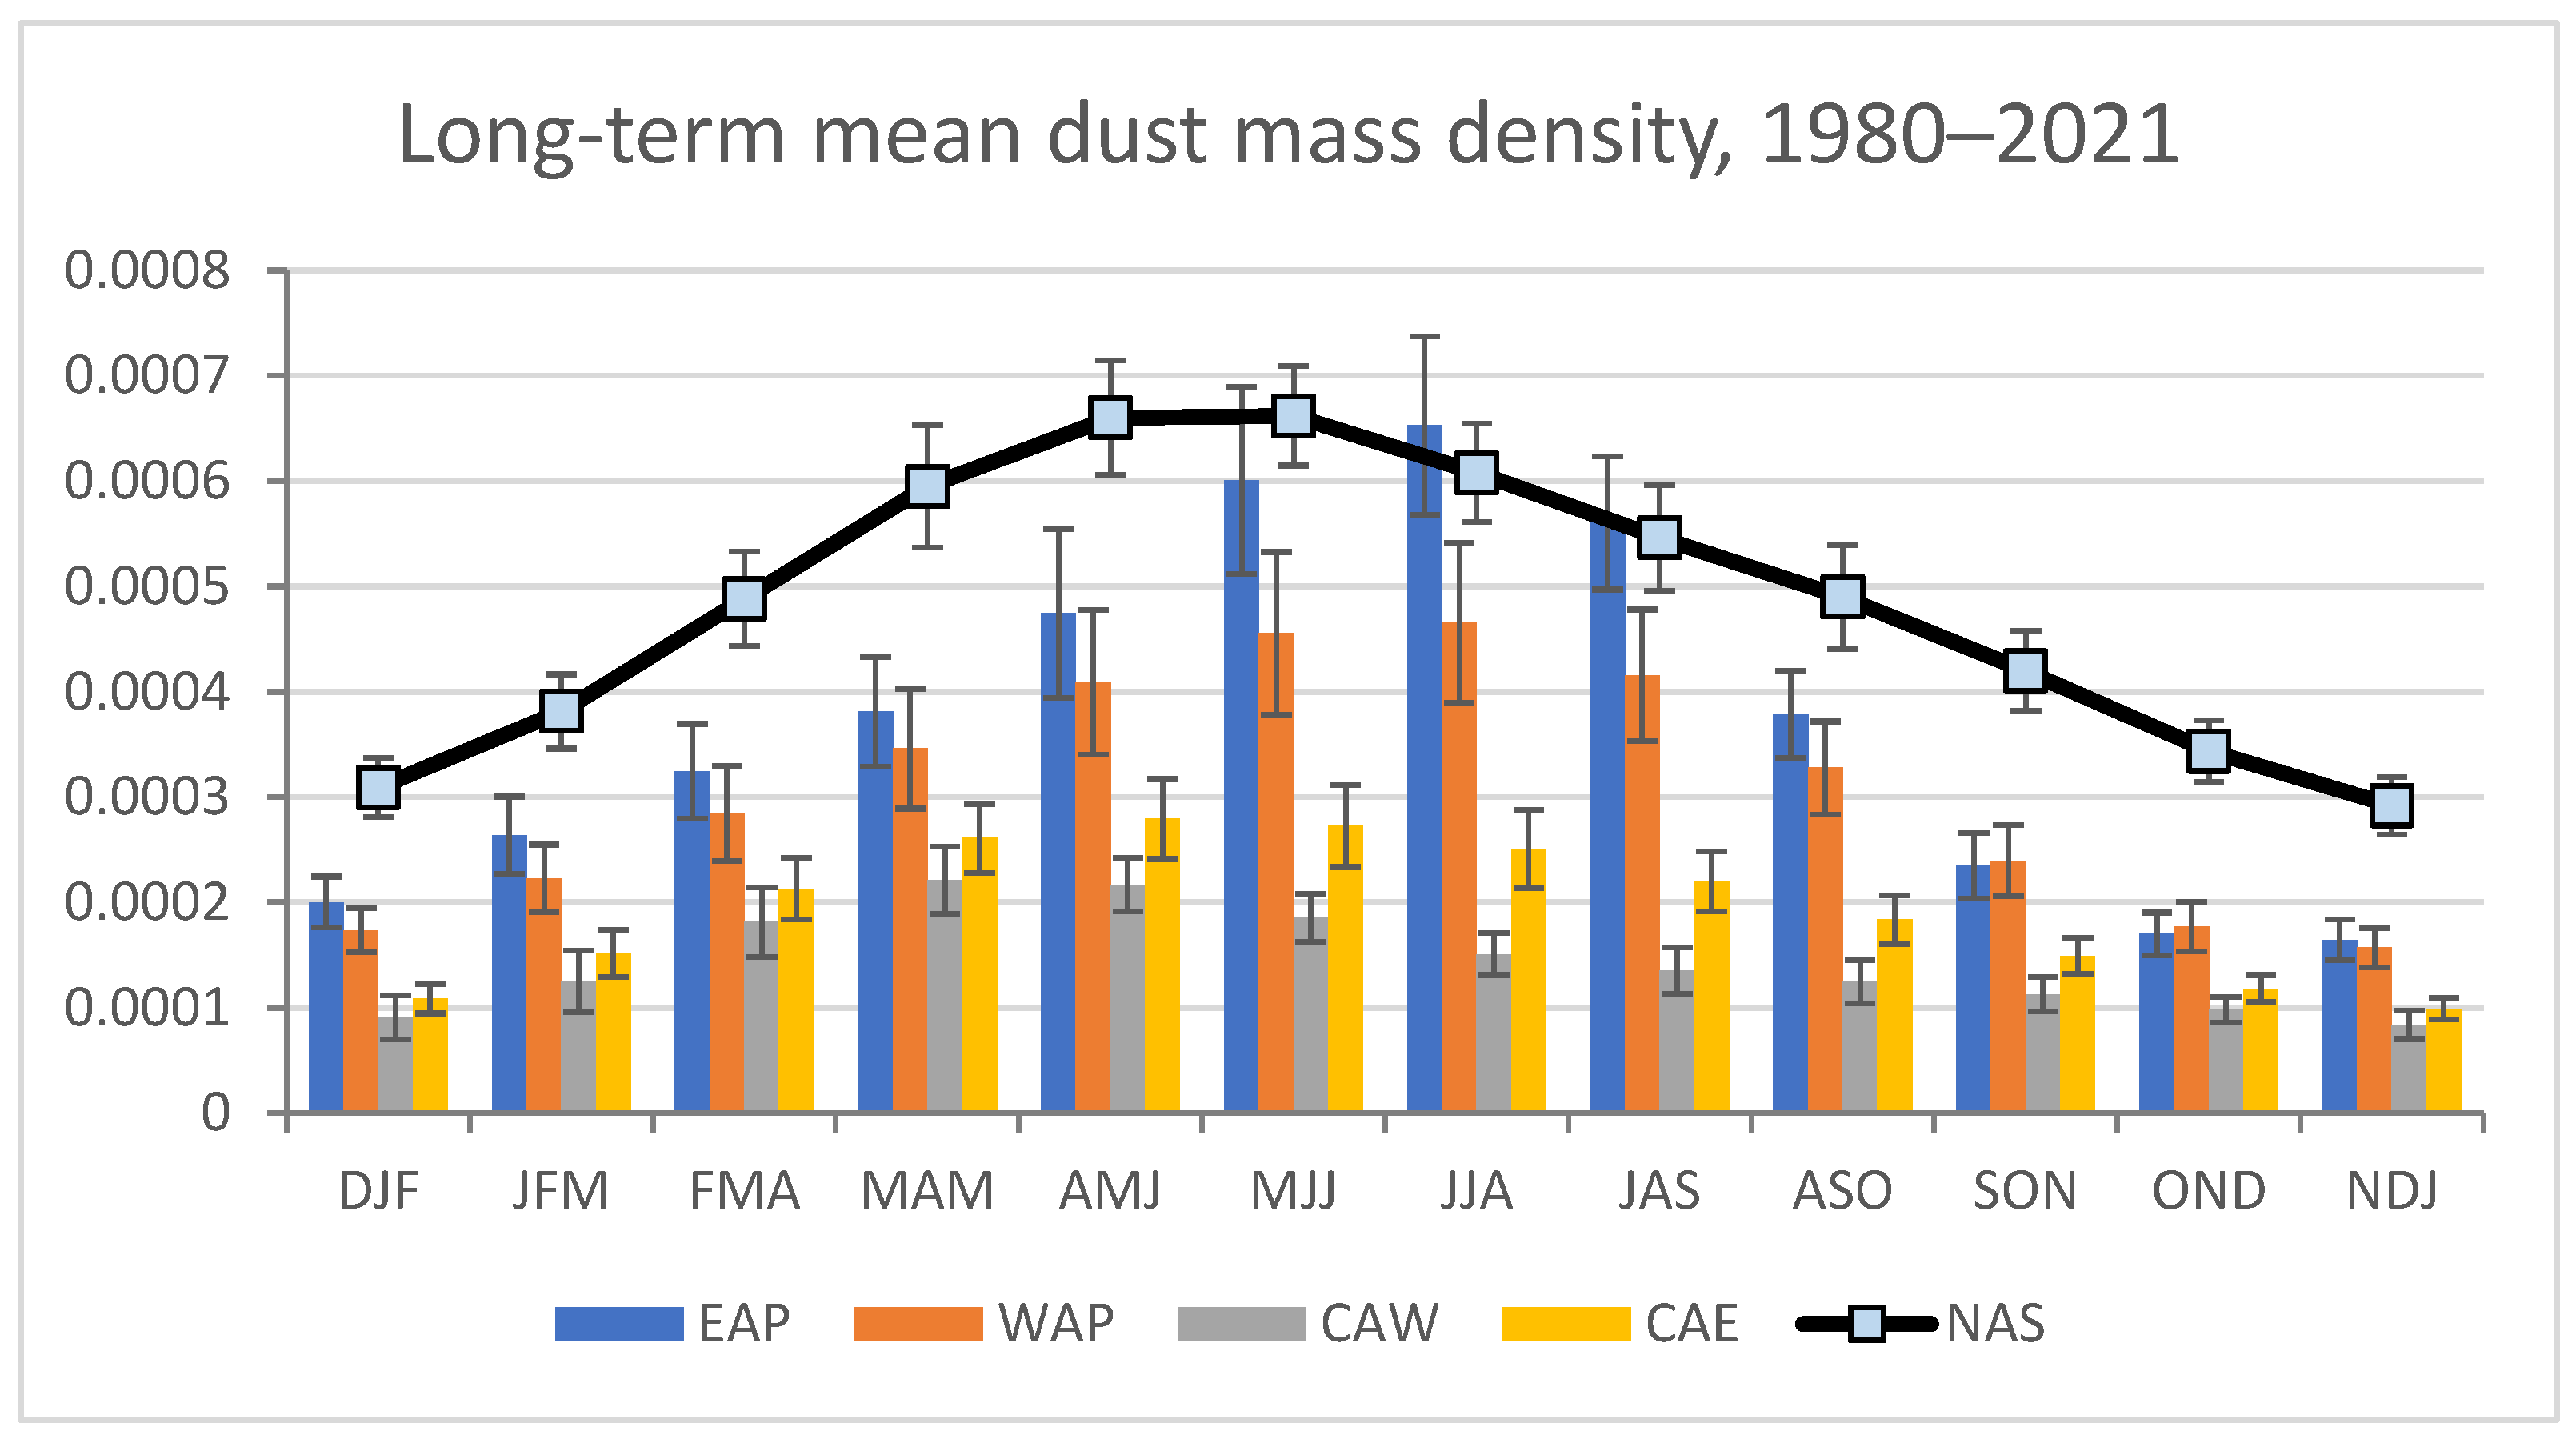
Figure 4 shows the seasonal variation patterns of the dust column mass density in the subregions. In general, NAS has the highest dust mass density, which is followed by those of EAP and WAP. While April–July are the peak dust months for NAS, the EAP and WAP subregions both have similar seasonal variation patterns with peaks in the early summer (June–July). In contrast, the Central Asia subregions have peak values in mid- to late spring (April–May). In order to better characterize the season/months that contribute that most to the annual total dust mass density, we also calculated the mean monthly percentages (Table 2). Based on the monthly contributions to the annual totals, we identified the respective dust seasons for these subregions (Table 2). Then, we calculated Spearman’s rank correlations between ONI_DJF and the mean dust-season dust column mass density series by the subregions. Of the four subregions inside the Key Region, the dust–season mean dust mass density series were significantly correlated with ENSO for EAP, CAW, and CAE, all of which had negative rank correlations (rho values), while the dust activity in WAP and NAS did not have statistically significant correlations with ENSO at the 0.05 level (Table 2).

3.2. Intensities of Dust Activity during the EN, LN, and Normal Events

In order to determine whether the dust mass density values in the subregions were statistically different during the EN and LN years, we conducted a One-Way ANOVA on the monthly anomaly series, using the ENSO classification that is based on the ONI_DJF values, with 84 months of EN, 84 months of LN, and 336 months of normal conditions for a total of 504 months during 1980–2021 (42 years). For all of the subregions except NAS, the mean dust column mass density anomaly values were highest (most positive) during the LN condition, which were followed by those during the normal condition, and then, the EN means were the lowest ones (most negative) (Figure 5). The results of the One-Way ANOVA show that significant differences existed among the EN, normal, and LN group means, which were confirmed by the nonparametric Kruskal–Wallis H test (Table 3). The Tukey’s HSD test indicated that the comparisons between the EN vs. the LN and the EN vs. the normal conditions were statistically significant for all of the subregions except NAS, while those between the LN and the normal conditions were significant only for the CAE subregion at the 0.05 level. For the NAS subregion, there was no significant difference between any of the ENSO conditions (Table 3).

3.3. Correlations between ENSO and Dust Activity in Different Times of the Year

Although Table 2 shows that there are statistically significant correlations between the dust–season mean series of the dust mass density and ENSO, it is unclear how the modulation effects of ENSO are distributed between the different months or seasons. Since the ONI index is based on the 3-month moving averages of the monthly NINO3.4 index, we calculated the 3-month moving averages of the individual monthly dust mass density series, and then we correlated the 12 monthly series with the ONI_DJF series (Figure 6). For the EAP subregion, statistically significant correlations were found from the spring to summer months (from AMJ to JAS). The CAW subregion displayed a bi-modal pattern, with there being a peak during the early spring months (FMA) and another in the late summer/early fall months (JAS). The CAE subregion showed the most persistent relationship between ENSO and the dust activity, with there being statistically significant correlations from spring to fall (from FMA to SON), while the dust mass density series of WAP and NAS did not show any statistically significant correlation with ENSO across the year (Figure 6).

3.4. Mechanisms of the ENSO-Dust Linkages in Different Subregions

3.4.1. Precipitation and Humidity

Figure 7a shows the Spearman’s rank correlation coefficients between ONI_DJF and the 3-month precipitation series during 1950–2021 in the subregions to test the hypothesis that ENSO may affect the dust activities in these subregions by modulating the precipitation amount during different seasons of the year. Generally speaking, from winter to late summer, positive correlations existed between the ONI_DJF and the precipitation factor, suggesting that during the EN years, there tended to be more precipitation than there was during the LN years (Figure 7a). Among these subregions, CAE shows the strongest and most persistent linkage between ENSO and the precipitation factor. For EAP, the ENSO’s impact on precipitation during the late spring and summer months seems to partially explain the correlation between ENSO and the dust mass density (Figure 6) during the same time. For CAW, ENSO may have a weak moderation effect on the amount of precipitation in late spring to early summer (AMJ). For WAP and NAS, however, ENSO does not seem to have persistent or strong enough effects on precipitation to further affect the dust activity during or prior to the dust season (Figure 7a).
Figure 7b shows the rank correlations between ONI_DJF and the 3-month mean surface water vapor content. These relationships show similar patterns as the correlations between ONI_DJF and precipitation do (Figure 7a). For example, in both EAP and WAP, there are relatively strong positive correlations during the winter months, while the ENSO’s impacts continued into the late spring and summer months in EAP only. On the other hand, the ENSO cycle seems to have a persistent impact on the surface water vapor content in CAE, but not so in CAW. Again, the correlations became negative during the fall months. Since humidity is a character of a given air mass, while precipitation involves more complex cloud processes and surface interactions, the effects of ENSO’s modulation on the level of humidity appear to be more consistent than that on precipitation (Figure 7a).

3.4.2. Wind

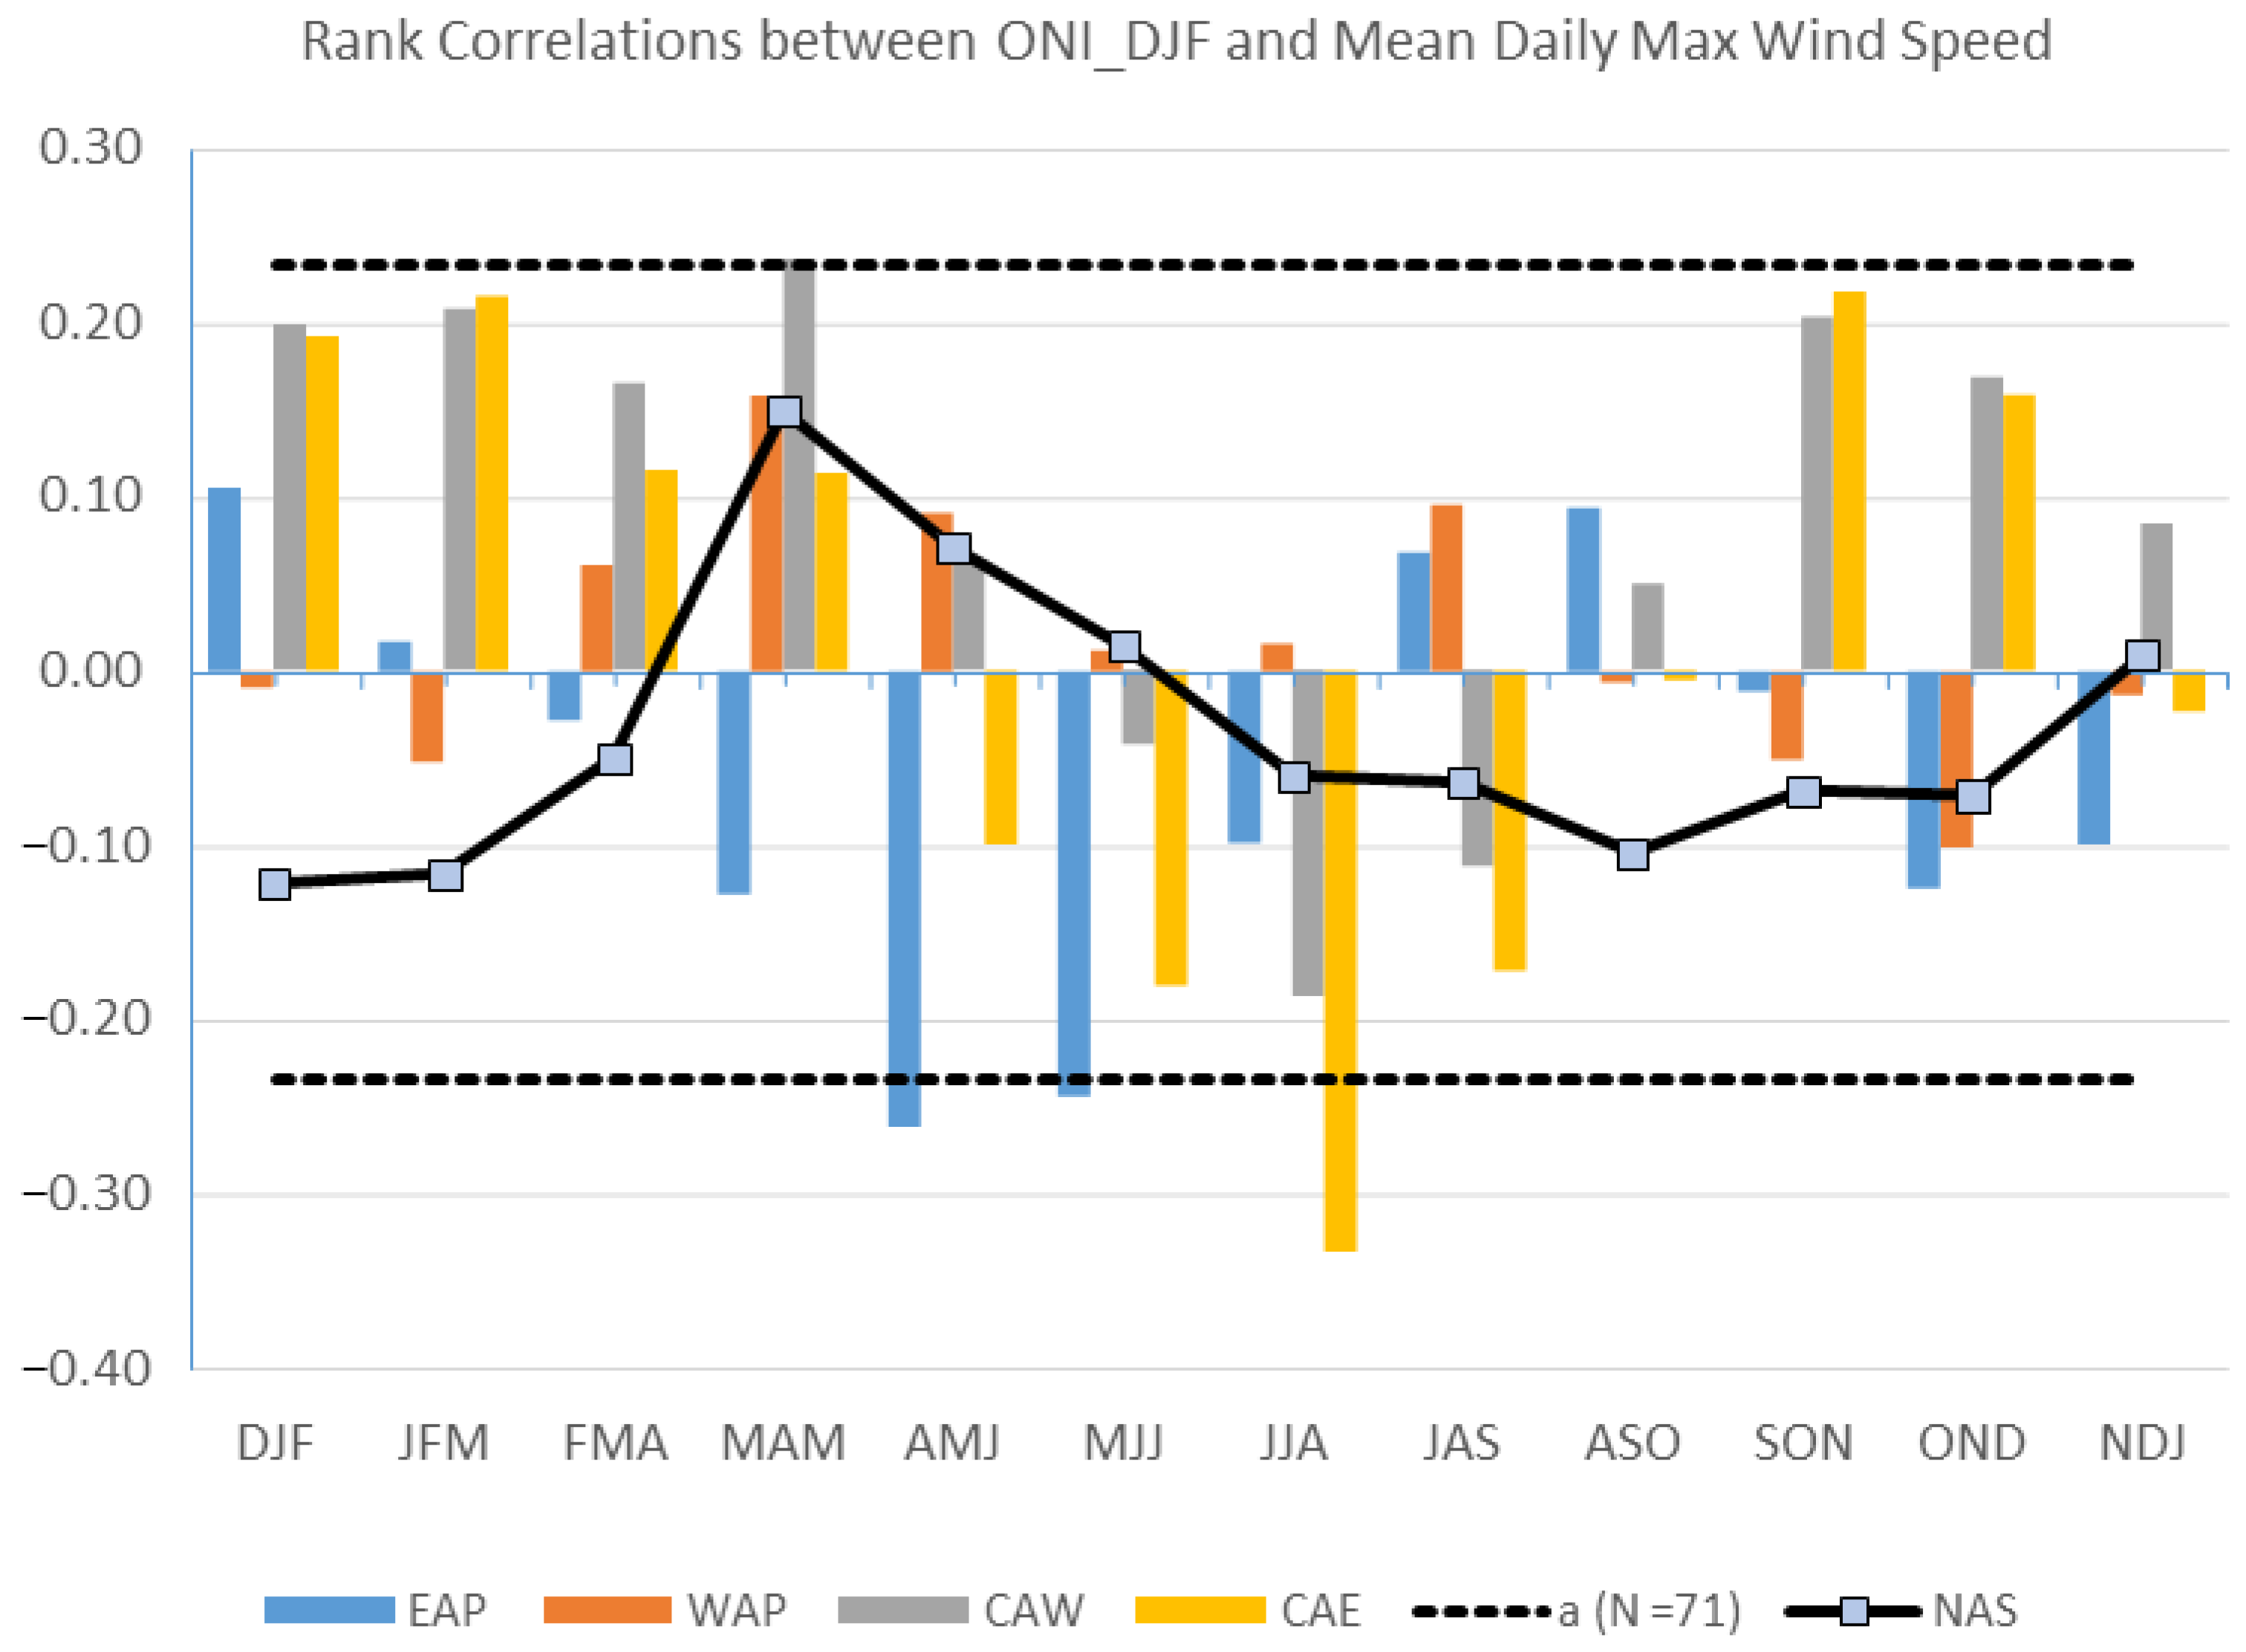
Figure 8 shows the rank correlations between ONI_DJF and the 3-month mean daily maximum wind speed series in the subregions. It can be seen that significant negative correlations exist between the ONI and the mean daily maximum wind speed series during the late spring/early summer months (AMJJ) in the EAP subregion, while the strongest negative correlation is observed for the CAE subregion in summer (JJA). The negative correlations for WAP, CAW, and NAS are weaker in general. It is also interesting to note that the correlations between the ONI_DJF and the wind speed are mostly positive in winter, spring, and fall months, although they are not statistically significant (except for CAW during spring). No significant correlation was observed between ONI_DJF and the wind speed in the NAS subregion.

3.4.3. Vegetation and Soil Moisture

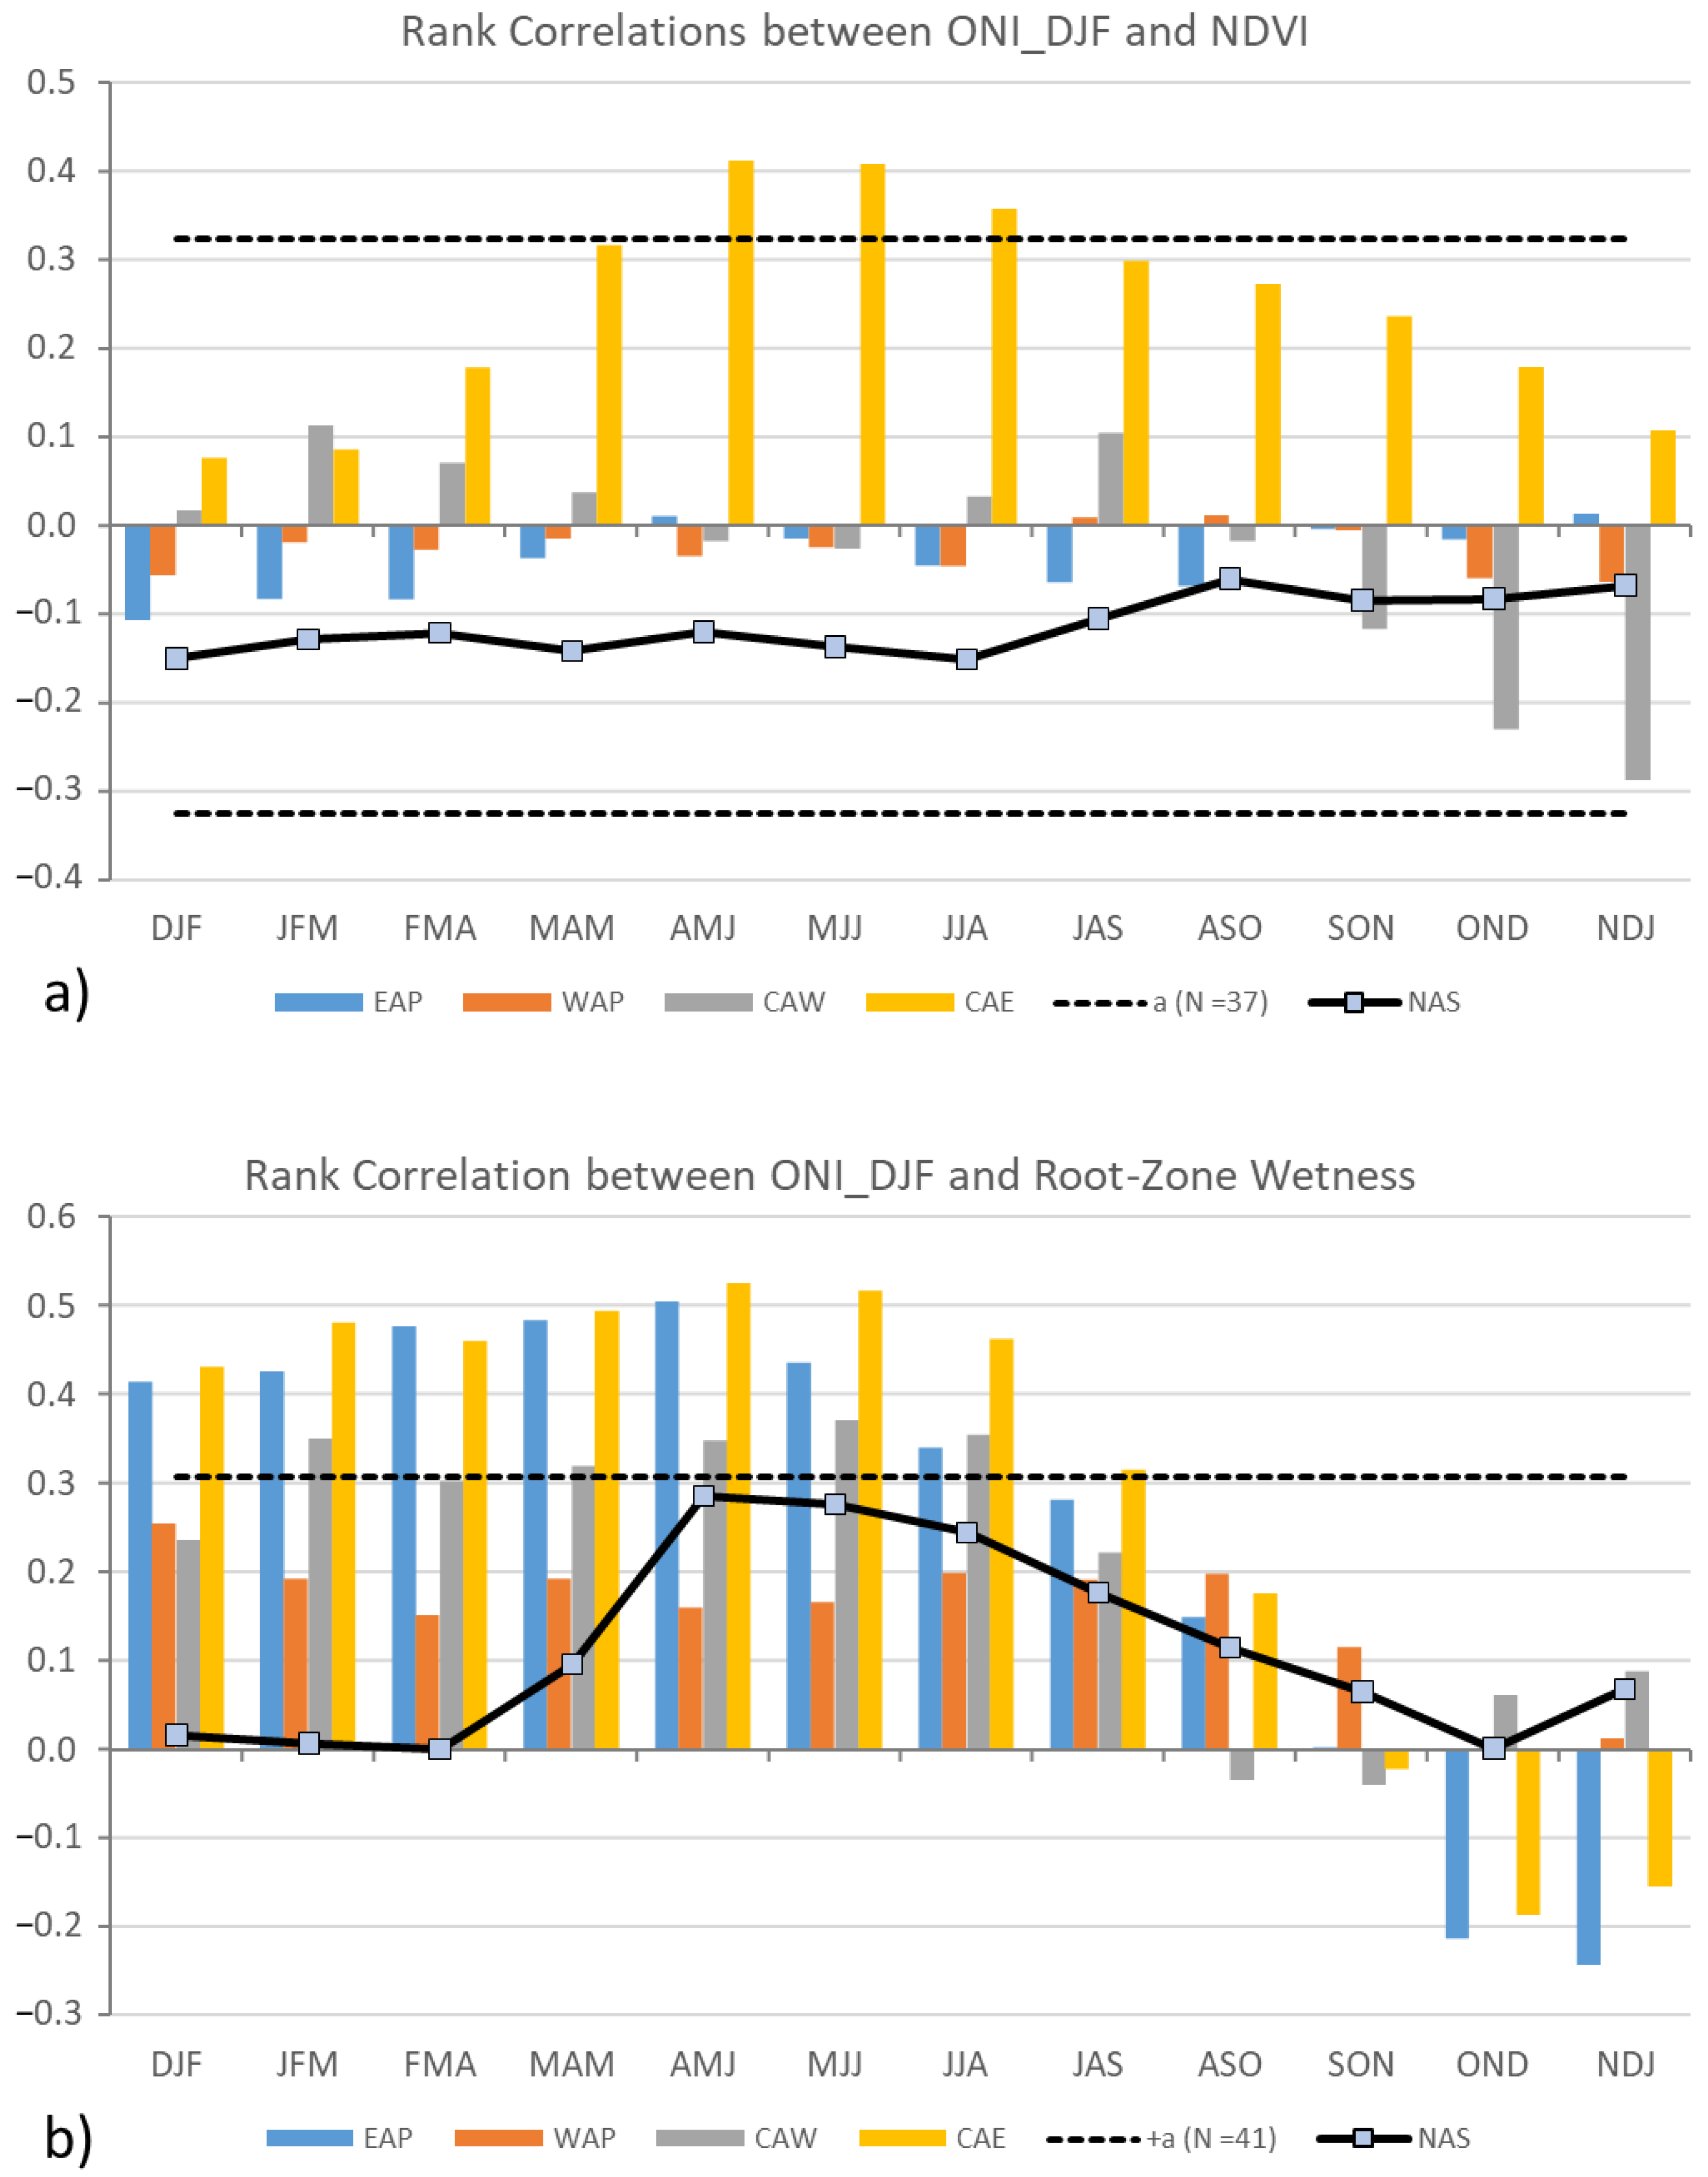
Figure 9a shows the Spearman’s correlations between ONI_DJF and the 3-month mean NDVI series. It has long been argued that vegetation cover is key to preventing dust emission in arid and semi-arid regions. However, this is only true in the CAE subregion where the vegetation cover seems to respond to the impacts of the ENSO cycle. In other words, while the vegetation remains an important factor of the dust activity (as shown later in Table 4), it does not show clear variation patterns which correspond to the modulation effects of ENSO in Figure 9a. On the other hand, the soil moisture’s responses to the ENSO’s impacts are more persistent in these subregions (Figure 9b), showing patterns that are similar to those between the ONI_DJF and the precipitation/humidity (Figure 7), with there being relatively strong positive correlations in winter, spring, and summer in EAP, CAW, and CAE, but no significant correlation was found in WAP and NAS. In general, during the EN years, the soil moisture conditions in all of the subregions were wetter than normal from winter to summer to some extent, especially for EAP, CAW, and CAE, while during the LN years, the soils were drier than they normally are during these months.

3.4.4. Combined Effects of Multiple Factors on Dust Activity

As stated earlier, we took an empirical approach to first establish the relationships between the intensity of dust activity in a given subregion with the ENSO cycle. Then, we examined the ENSO’s effects on the factors which are known to influence the dust emission, transport, and settlement processes within each subregion. Now, we would like to focus on such relationships during the dust season, especially for those months when the ENSO’s impacts are statistically significant during the respective dust seasons. To illustrate the combined effects of these factors on the dust activities in these subregions, we performed a multiple linear regression using the 3-month column dust mass density as the dependent variable when the correlation that it had with ONI_DJF was the highest within the dust season (Table 2 and Figure 6). For example, for the EAP subregion, the dust column mass density that was averaged during June–August (EAP_JJA) was selected as the dependent variable. Similarly, WAP_JAS (July–September), CAW_FMA (February–April), CAE_AMJ (April–June), and NAS_ASO (August–October) were selected as the dependent variables. Then, the amount of precipitation, the mean maximum daily wind speed, the NDVI, and the soil moisture level were averaged/summed for the same 3-month periods and used as the independent variables together with ONI_DJF. Since the humidity is highly correlated with precipitation, we did not use it in the regression analysis. On the other hand, to consider the effects of the antecedent precipitation, we also added the cumulative precipitation from the beginning of the year to the respective 3-month period as an independent variable for a given subregion.
The results of the regression analysis show that these models can explain 25.1–58.6% of the variances of the dust column mass density, with wind speed and vegetation (NDVI) being among the variables that entered the most of the models (Table 4). The lists of the independent variables by the models that are in Table 4 follow the sequences in which these variables entered the models in stepwise regression. The standardized coefficients (absolute values) indicate the relative contributions that are made by the individual variables to the variation of the dependent variable. For example, in WAP, the contribution by the NDVI (–0.361) to the dust activity intensity was greater than that of the mean maximum daily wind speed (0.277) (Table 4). ONI_DJF remained to be an important variable for the models of EAP and CAW, suggesting that its effects were not fully represented by the other variables that entered the models for these subregions. As expected, ONI_DJF did not enter the models for the WAP and NAS subregions as its correlations with the dust column mass density never reached a statistical significance during any time of the year (Figure 6). It also did not enter the model of CAE; however, the January-June cumulative precipitation made the largest contribution to the variation in the CAE dust activity (Table 4), and it probably represented the modulation effects of ENSO, as indicated by its strong correlation with ONI_DJF (rho = 0.591, p < 0.001). Generally speaking, the regression models are statistically valid, with them having highly significant F values from the ANOVA test, and all of the independent variables that were included in the models are statistically significant at the 0.10 level. We also included the collinearity diagnostics in the results (Table 4). Both the collinearity tolerance values (all are >0.5) and the variance inflation factor (VIF) values (all are <2) suggest that the collinearities among the independent variables in the models, if there are any, were not severe enough to cause major concerns of biased estimates of the regression coefficients [71] (however, see the discussion below).

4. Discussion

4.1. Spatial and Temporal Patterns of ENSO’s Effects in the “Dust Belt”

In Huang et al. [23], the entire Key Region (5–48° N, 34–76° E) was used to examine the effects of ENSO on the April–July dust activity. In this current study, we divided the Key Region into four subregions and discovered that the dust activities have slightly different seasonality patterns in these subregions (Figure 4 and Table 2) due to the combined effects of the climatological characteristics of the dry seasons, windy months, and surface conditions which are conducive to enhanced dust activities. The seasonal patterns of the ENSO’s impacts are also different as represented by the correlations between the dust column mass density and ONI_DJF (Figure 6), while the months from spring to late summer are the general common period of enhanced dust activities (Figure 4) with there being strong ENSO impacts in the entire region; it is interesting to note that there is a single-peak pattern in the EAP subregion and a double-peak pattern in the CAW subregion (and CAE to certain extent) in terms of the seasonality of the ENSO’s impact in these subregions (Figure 6). Because of the common dust season in all of the subregions, we believe that the analysis of the large-scale circulation patterns during April–July that are associated with the EN and LN conditions in Huang et al. [23] can be applied here. For the early fall months, however, we speculate that the modulation by ENSO on the westerly circulation becomes more important, especially for the two further northern subregions (CAW and CAE). Our results also confirmed that the ENSO’s impacts are not statistically significant in NAS, in contrary to Li et al. [24]. Although the mean dust mass density anomaly is higher than that which is normal during the LN months (Figure 5), the means during EN and normal months are not statistically different, probably due to large degrees of temporal variations.

4.2. Uncertainties in the Relationship between ENSO and Dust Activity

The results from both the correlation and multiple linear regression analyses confirmed the modulation effects of the ENSO cycle on the dust activity in these subregions, especially in EAP, CAW, and CAE, as well as the effects of the major factors of the dust activity that are considered in this study. In the results of the regression analysis (Table 4), the coefficients of most independent variables have correct signs representing the actual physical processes. For example, the mean daily maximum wind speed entered all of the models with a positive sign, except for CAW, thereby confirming the results from many previous studies in different areas in the “dust belt” (e.g., [28,29,30,34,38,39,40,41]. It is interesting to note that the February–April NDVI and the soil moisture in the CAW model both had positive signs, rather than them having negative impacts on the variation of the dust column mass density. In fact, their rank correlations with the February-April CAW dust column mass density were also positive, but they were not statistically significant (rho = 0.282, p = 0.091 for NDVI and rho = 0.151, p = 0.341 for soil moisture). These results show the complexity of the effects of the surface conditions on the dust activities. For example, vegetation of different heights may cause variations in the near-surface aerodynamic conditions that reduce the wind speed, limit the dust emission, and enhance the dry deposition, but it may also cause turbulence in the near-surface air column and prolong the suspension of the dust aerosol particles in the air [73].
We noticed that the concurrent 3-month precipitation only entered the model for NAS, and it apparently had a positive effect on the dust activity, contrary to what was expected. The amount of precipitation during August–October in this region was low and highly variable. In fact, the Spearman’s rank correlation between the August–October dust column mass density and the amount of precipitation in NAS is negative (−0.255), but it is not statistically significant (p = 0.103). The August–October precipitation also made the lowest contribution to the variation in the NAS dust column mass density when it was compared to the wind speed and the soil moisture (Table 4). More importantly, the reversed sign of the precipitation variable was possibly caused by the strong correlation between the August–October precipitation and the soil moisture (rho = 0.615, p < 0.001). As both of these variables entered the model, this seems to be a case of incorrect estimation of the regression coefficients due to collinearity, with acceptable collinearity tolerance and VIF values (Table 4).
It should be pointed out that at different times of the dust season in a given subregion, different factors may increase or decrease their impacts on the dust activity as they are determined by both seasonal and interannual variation patterns. Local and regional processes, which are superimposed on large-scale variation patterns, may increase the uncertainties in specifying the relationships between ENSO and the dust activity. This probably explains the low-to-moderate amounts of the explained variances of the dust column mass density for the individual subregions (Table 4). For example, the ENSO’s modulation effects on the dust activities in CAE are strong during April–June (Figure 6), while ONI_DJF was also significantly correlated with the amount of April–June precipitation (Figure 7a) and the NDVI (Figure 9a). In the regression model for CAE, however, ONI_DJF, the amount of April–June precipitation, and the NDVI did not enter the model, possibly with their influences being represented by the cumulative January–June precipitation instead (rho = 0.799 between January–June precipitation and April–June precipitation and rho = 0.576 between January–June precipitation and April–June NDVI, respectively), which also contributed most to the variation of the April–June CAE dust column mass density (Table 4). These uncertainties show the limitations of the empirical approach that was used in this study.

4.3. Potential Linkages among the Subregions

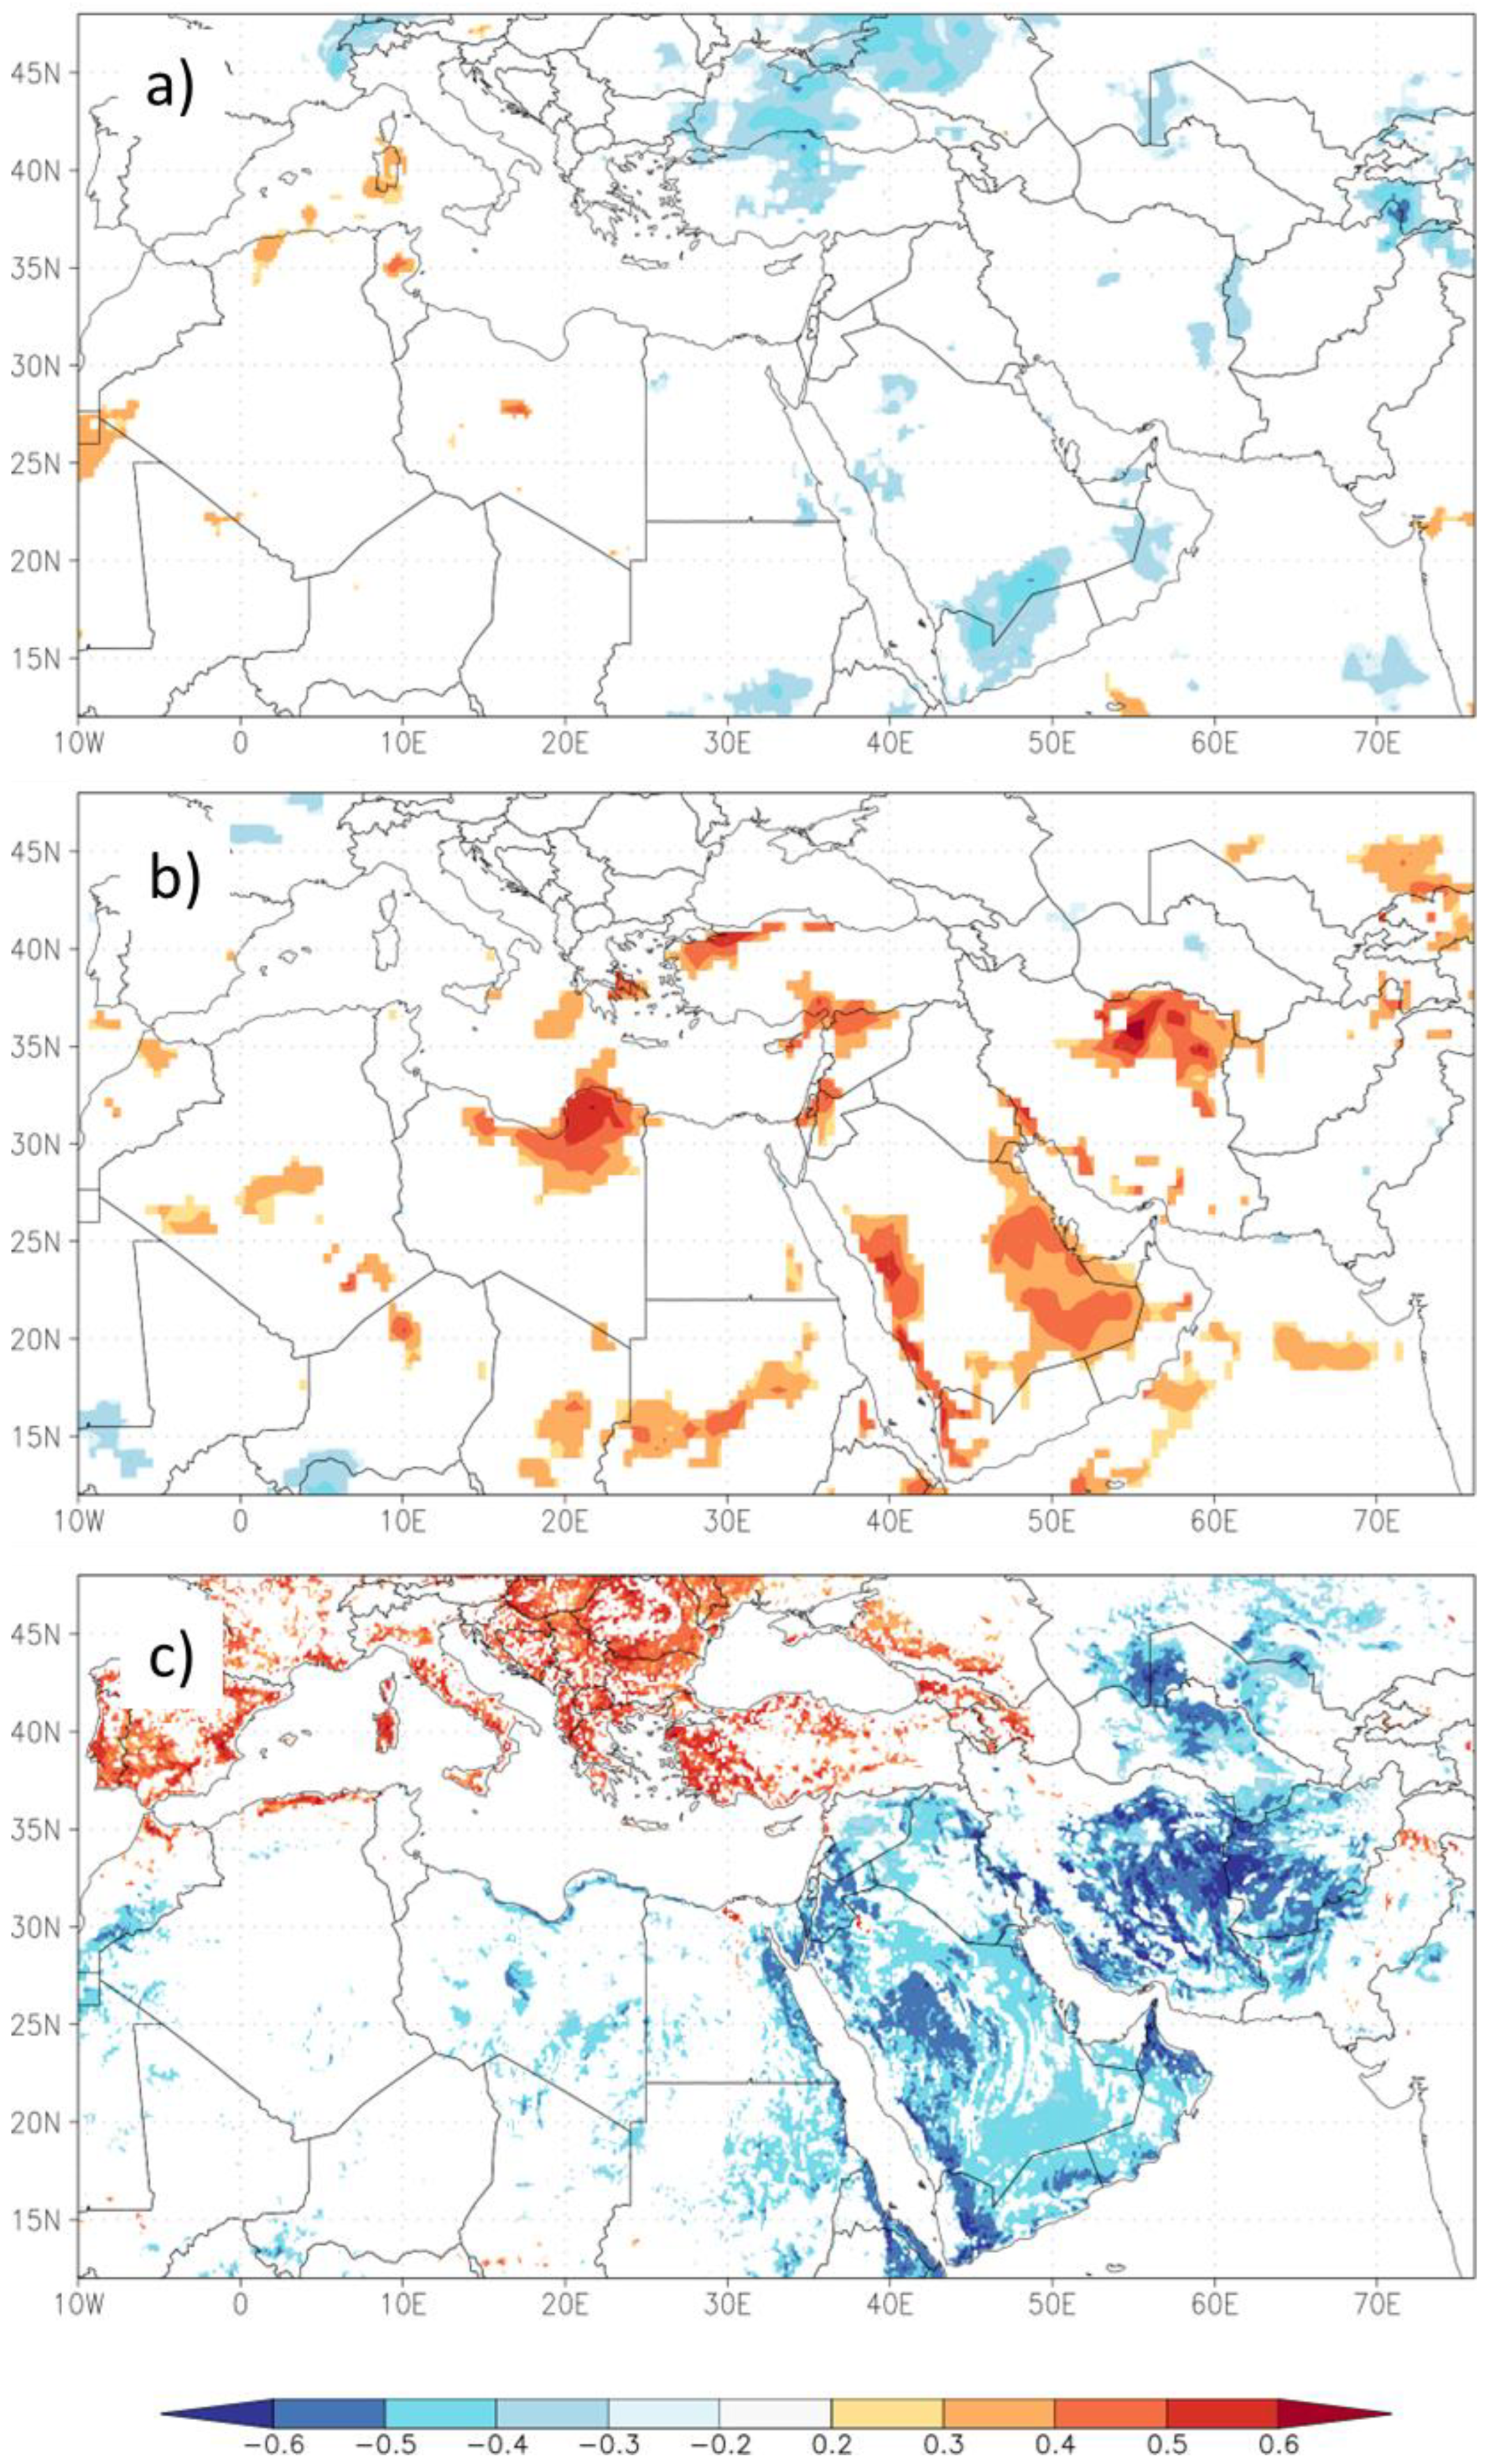
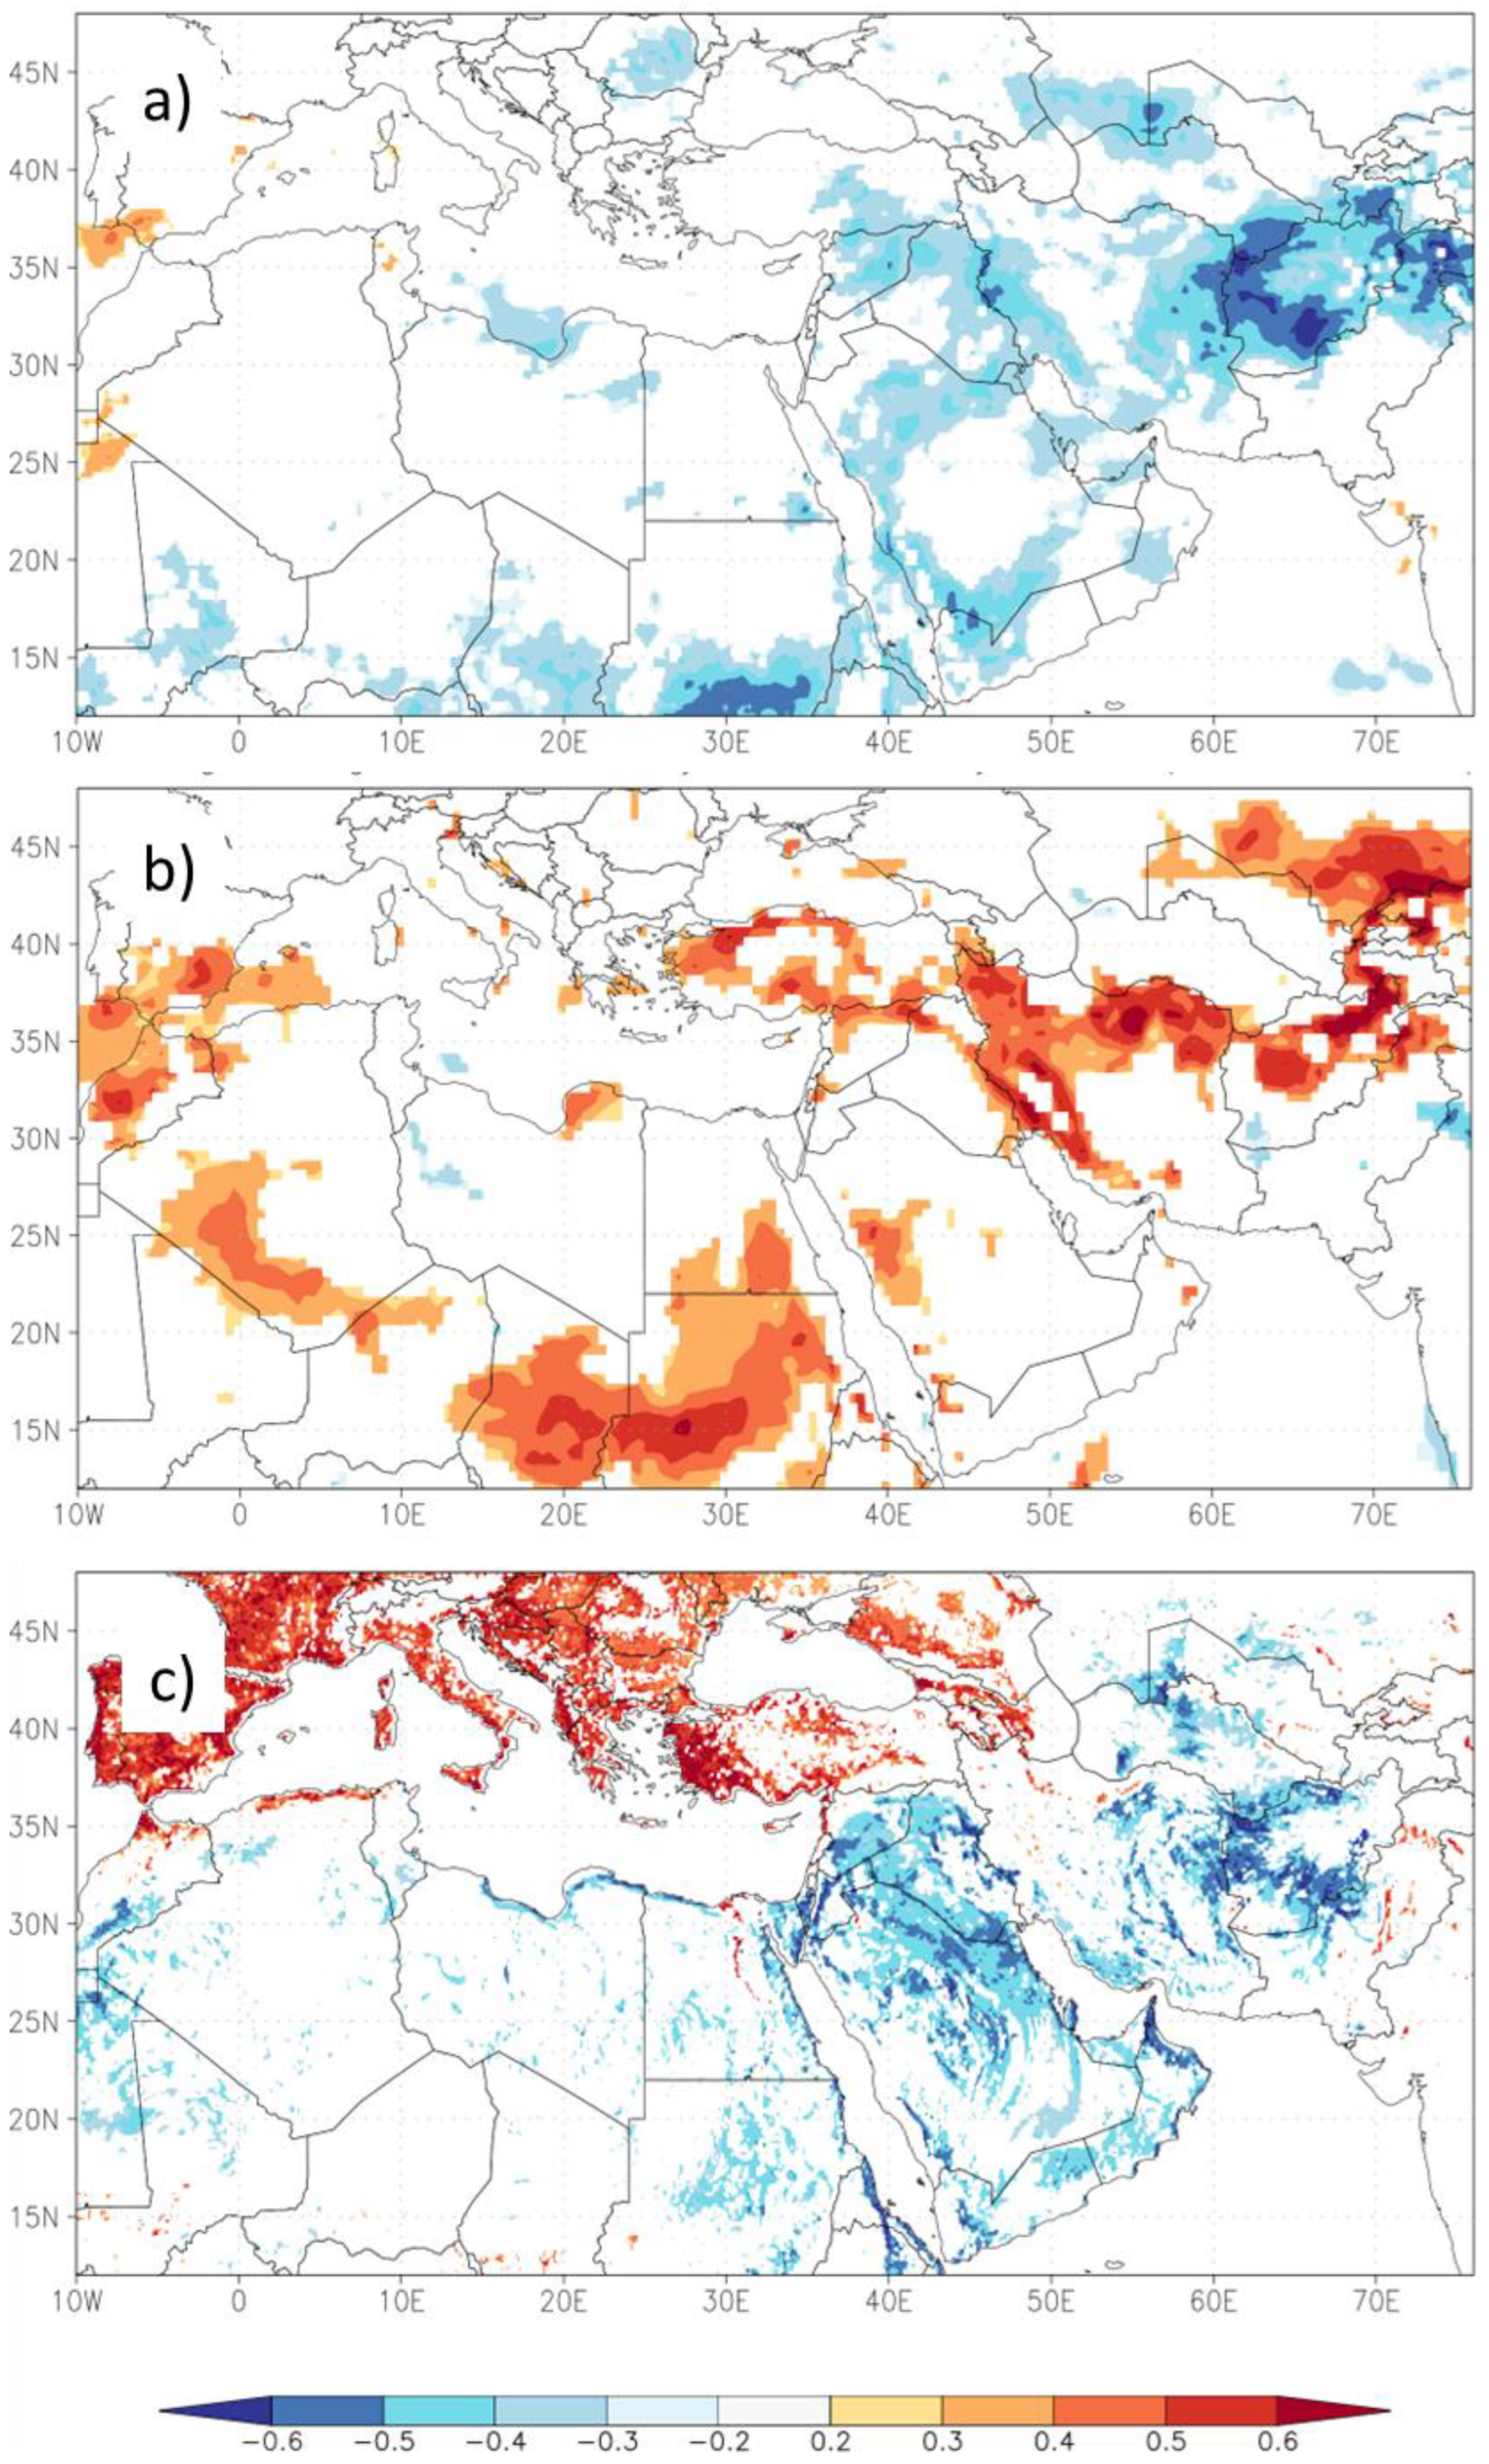
We recognize that the analyses above cannot reveal the influences of the dust aerosols which were transported across the subregional boundaries or the effects of the factors on the dust activity outside a specific subregion. This could also be the reason that ONI_DJF entered the regression models of multiple subregions together with the major factors of dust activity (Table 4). In other words, ENSO may influence the dust activity in a specific subregion by changing the conditions in the surrounding areas. To illustrate this point, here we focus on two subregions where the modulation effects of ENSO (Figure 6) encompassed essentially the entirety of their respective dust seasons (Figure 4 and Table 2): EAP and CAE. Figure 10 shows the spatial patterns of the correlations between the EAP April–August mean dust mass density and the concurrent total precipitation, the mean daily maximum wind speed, and the NDVI. It can be seen that local and regional precipitation during the dust season seemed to have relatively minor influences on the dust activity, while the EAP dust column mass density is strongly connected to the maximum wind speed and the vegetation conditions both within and outside the subregion, probably indicating that there are synchronized conditions over a large region. In other words, improved vegetation conditions for the areas within and surrounding EAP will limit the dust emission and its transport processes and thereby, reduce the dust mass density within the EAP. Likewise, a strong daily maximum wind speed within and surrounding this subregion will enhance the dust mass density. For comparison, the dust mass density of the CAE subregion had a much stronger connection to the amount of local precipitation. However, the connections to all of these factors outside its boundary are also more prominent (Figure 11), showing the potential cross-boundary impacts of the dust activity in the surrounding regions. For example, the CAE dust mass density is strongly correlated to precipitation and the maximum wind speed outside the subregion along a large belt that runs SW–NE, potentially indicating the paths of the dust transport which is driven by persistent wind and/or weather systems during the dust season. Further investigations, probably using regional models, will be needed to examine these complex relationships and the relative contributions that are made by these factors to the dust activity in specific subregions.

5. Conclusions

In this study, we re-examined the relationships between the dust activities, which were represented by the monthly MERRA-2 dust aerosol column mass density data and ENSO in the Key Region of the “dust belt” which was identified in a recent study by Huang et al. [23] by dividing the large region into four subregions: the eastern and western parts of Arabian Peninsula and the eastern and western parts of Central Asia. We also added the Sahara region of North Africa for the purpose of making a comparison. For the large region stretching from the North African Sahara Desert to Central Asia, there is a common dust season from April to July. However, for the different subregions, the 3-month periods of peak dust activities occur at different times of the year, ranging from March–May and April–June in the western and eastern parts of Central Asia, to June–August in the Arabian Peninsula, and May–July in the North African Sahara Desert. Additionally, the modulation effects of the ENSO cycle also appear to be different in these subregions, thereby influencing different factors of the dust activity during different months of the year. For example, the ENSO’s effects on precipitation, humidity, and soil moisture were mostly experienced during the earlier part of the year, thereby causing an increased amount of rainfall and soil moisture during the EN years. Its effects on wind were more complex, increasing the mean maximum daily wind speed in spring in the western part of Central Asia, while reducing the wind speed in the eastern part of the Arabian Peninsula and the eastern part of Central Asia during summer during the EN years. It can be concluded that for ENSO to be an effective factor of the dust activity, it must have modulating effects on the major factors of the dust processes, and also these effects must occur during the respective dust seasons in these subregions.
Using the major factors of dust activity in the region as predictors, such as the amount of precipitation, the daily maximum wind speed, the vegetation condition, and the soil moisture, the regression models explained 25.1% to 58.6% of the variance of the dust column mass density in these subregions. These regression models helped to identify the leading factors in combination with the modulation effects of ENSO. Since the ENSO cycle can be predicted with reasonable accuracy 3–6 months in advance of it [74], and its modulation effects have been examined in these regions, its effects on the dust activity in different regions can also be predicted, which may have significant implications on the long-range forecast of weather conditions and the aerosol processes that are relevant to the air quality and human health. However, there are many existing uncertainties that require further analysis, especially for the regions of smaller sizes where local factors play more important roles in influencing the dust processes. For example, the effects of precipitation on the dust activity can be highly variable spatially and may have different temporal scales, with wet deposition occurring at the moment of precipitation, while the impacts that it has on soil and vegetation probably last for weeks and even months [45]. Similarly, while our results suggest that soil moisture may effectively reduce the dust activities in most regions, this tendency is strongly impacted by the texture of the topsoil, such as the percent of sand content within it [46,47,75], which was not considered in the current study. Additionally, the previous studies have shown that the different types of ENSO (Eastern Pacific or EP and Central Pacific or CP) events [76] may impact the dust aerosol distribution in different regions [23,77,78]. Additionally, the effects of ENSO may combine with other large-scale teleconnections, such as Arctic Oscillation (AO) [79], North Atlantic Oscillation (NAO) [80], and Atlantic Multidecadal Oscillation (AMO) [81], which may impact the dust activities directly or indirectly in our study region. The combined effects of these large-scale atmospheric and oceanographic processes on dust activity should be analyzed with the use of longer data records in the future.
Although our results call for future regional studies on the uniqueness of the interactions between the atmospheric dust aerosol and the influencing factors, including ENSO, we also want to point out the advantage of comprehensively comparing the effects of these processes between different subregions by identifying the similarities and differences. As suggested by many previous studies, dust aerosol and its climatic effects are extremely important, but they are also very complex, and so they require more attention from the scientific community in order to fully understand the impacts that they have on regional climate systems.

Author Contributions

Z.-Y.Y. and X.L. conceived and designed the project; Z.-Y.Y. and A.M. procured data and performed data processing and analysis; Z.-Y.Y., A.M. and X.L. interpreted the analysis results; Z.-Y.Y. and A.M. wrote the first draft manuscript, and X.L. reviewed and edited the manuscript; all authors participated in the review/revision process. All authors have read and agreed to the published version of the manuscript.

Funding

This research received no external funding.

Data Availability Statement

All data used in this study are publicly available. Please refer to the Section 2 for the sources.

Acknowledgments

This research was jointly supported by University of San Diego (FRG #2020-21) and the Strategic Priority Research Program of the Chinese Academy of Sciences (XDB40030100) and the National Natural Science Foundation of China (41991254). The authors would like to thank the two anonymous reviewers whose constructive comments and suggestions significantly improved the manuscript.

Conflicts of Interest

The authors declare no conflict of interest.

References

  1. Lau, K.-M.; Kim, K.-M. Observational relationships between aerosol and Asian monsoon rainfall, and circulation. Geophys. Res. Lett. 2006, 33, L21810. [Google Scholar] [CrossRef]
  2. Liu, X.; Xie, X.; Yin, Z.-Y.; Liu, C.; Gettelman, A. A modeling study of the effects of aerosols on clouds and precipitation over East Asia. Theor. Appl. Climatol. 2011, 106, 343–354. [Google Scholar] [CrossRef]
  3. Li, Z.; Lau, W.K.-M.; Ramanathan, V.; Wu, G.; Ding, Y.; Manoj, M.G.; Liu, J.; Qian, Y.; Li, J.; Zhou, T.; et al. Aerosol and monsoon climate interactions over Asia. Rev. Geophys. 2016, 54, 866–929. [Google Scholar] [CrossRef]
  4. Levin, Z.; Ganor, E.; Gladstein, V. The effects of desert particles coated with sulfate on rain formation in the Eastern Mediterranean. J. Appl. Meteorol. Climatol. 1996, 35, 1511–1523. [Google Scholar] [CrossRef]
  5. Creamean, J.M.; Suski, K.J.; Rosenfeld, D.; Cazorla, A.; DeMott, P.J.; Sullivan, R.C.; White, A.B.; Ralph, F.M.; Minnis, P.; Comstock, J.M.; et al. Dust and biological aerosols from the Sahara and Asia influence precipitation in the western U.S. Science 2013, 339, 1572–1578. [Google Scholar] [CrossRef] [Green Version]
  6. Intergovernmental Panel on Climate Change (IPCC). Sixth Assessment Report: Climate Change 2021: The Physical Science Basis; Chapter 6: Short-Lived Climate Forcers; Working Group 1; IPCC: Geneva, Switzerland, 2021; Available online: https://www.ipcc.ch/report/ar6/wg1/ (accessed on 21 August 2022).
  7. Falkowski, P.G.; Barber, R.T.; Smetacek, V. Biogeochemical controls and feedbacks on ocean primary production. Science 1998, 281, 200–206. [Google Scholar] [CrossRef] [Green Version]
  8. Rizzolo, J.A.; Barbosa, C.G.G.; Borillo, G.C.; Godoi, A.F.L.; Souza, R.A.F.; Andreoli, R.V.; Manzi, A.O.; Sá, M.O.; Alves, E.G.; Pöhlker, C.; et al. Soluble iron nutrients in Saharan dust over the central Amazon rainforest. Atmos. Chem. Phys. 2017, 17, 2673–2687. [Google Scholar] [CrossRef] [Green Version]
  9. Prospero, J.M. Long-term measurements of the transport of African mineral dust to the southeastern United States: Implications for regional air quality. J. Geophys. Res. Atmos. 1999, 104, 15917–15927. [Google Scholar] [CrossRef] [Green Version]
  10. Taylor, D.A. Dust in the wind. Environ. Health Perspect. 2002, 110, 80–87. [Google Scholar] [CrossRef] [PubMed]
  11. Li, X.; Liu, X.; Yin, Z.-Y. The impacts of Taklimakan dust events on Chinese urban air quality in 2015. Atmosphere 2018, 9, 281. [Google Scholar] [CrossRef]
  12. Kotsyfakis, M.; Zarogiannis, S.G.; Patelarou, E. The health impact of Saharan dust exposure. Int. J. Occup. Med. Environ. Health 2019, 32, 749–760. [Google Scholar] [CrossRef] [PubMed]
  13. Prospero, J.M.; Ginoux, P.; Torres, O.; Nicolson, S.E.; Gill, T.E. Environmental characterization of global sources of atmospheric soil dust identified with the Nimbus 7 Total Ozone Mapping Spectrometer (TOMS) absorbing aerosol product. Rev. Geophys. 2002, 40, 2-1–2-31. [Google Scholar] [CrossRef]
  14. Washington, R.; Todd, M.; Middleton, N.J.; Goudie, A.S. Dust-storm source areas determined by the total ozone monitoring spectrometer and surface observations. Ann. Assoc. Am. Geogr. 2003, 93, 297–313. [Google Scholar] [CrossRef]
  15. Trenberth, K.E. The definition of El Niño. Bull. Am. Meteorol. Soc. 1997, 78, 2771–2778. [Google Scholar] [CrossRef]
  16. Alexander, M.A.; Blade, I.; Newman, M.; Lanzante, J.R.; Lau, N.-C.; Scott, J.D. The Atmospheric Bridge: The Influence of ENSO teleconnections on air–sea interaction over the global oceans. J. Clim. 2002, 15, 2205–2231. [Google Scholar] [CrossRef]
  17. Mariotti, A. How ENSO impacts precipitation in southwest central Asia. Geophys. Res. Lett. 2007, 34, L16706. [Google Scholar] [CrossRef]
  18. Babu, C.A.; Jayakrishnan, P.R.; Varikoden, H. Characteristics of precipitation pattern in the Arabian Peninsula and its variability associated with ENSO. Arab. J. Geosci. 2016, 9, 186. [Google Scholar] [CrossRef]
  19. Prospero, J.M.; Nees, R.T. Impact of the North African drought and El Niño on mineral dust in the Barbados trade winds. Nature 1986, 320, 735–738. [Google Scholar] [CrossRef]
  20. Barlow, M.; Cullen, H.; Lyon, B. Drought in central and southwest Asia: La Niña, the warm pool, and Indian Ocean precipitation. J. Clim. 2002, 15, 697–700. [Google Scholar] [CrossRef]
  21. Yin, Z.-Y.; Wang, H.; Liu, X. A comparative study on precipitation climatology and interannual variability in the lower mid-latitude East Asia and Central Asia. J. Clim. 2014, 27, 7830–7848. [Google Scholar] [CrossRef]
  22. Gong, S.L.; Zhang, X.Y.; Zhao, T.L.; Zhang, X.B.; Barrie, L.A.; Mckendry, I.G.; Zhao, C.S. A simulated climatology of Asian dust aerosol and its trans-Pacific transport. Part II: Interannual variability and climate connections. J. Clim. 2006, 19, 104–122. [Google Scholar] [CrossRef]
  23. Huang, Y.; Liu, X.; Yin, Z.-Y.; An, Z. Global impact of ENSO on dust activities with emphasis on the key region from the Arabian Peninsula to Central Asia. J. Geophys. Res. Atmos. 2021, 126, e2020JD034068. [Google Scholar] [CrossRef]
  24. Li, J.; Garshick, E.; Huang, S.; Koutrakis, P. Impacts of El Nino-Southern Oscillation on surface dust levels across the world during 1982–2019. Sci. Total Environ. 2021, 769, 144566. [Google Scholar] [CrossRef] [PubMed]
  25. Rezazadeh, M.; Irannejad, P.; Shao, Y. Climatology of the Middle East dust events. Aeolian Res. 2013, 10, 103–109. [Google Scholar] [CrossRef]
  26. Alizadeh-Choobari, O.; Ghafarian, P.; Owlad, E. Temporal variations in the frequency and concentration of dust events over Iran based on surface observations. Int. J. Climatol. 2016, 36, 2050–2062. [Google Scholar] [CrossRef]
  27. Rashki, A.; Kaskaoutis, D.G.; Sepehr, A. Statistical evaluation of the dust events at selected stations in Southwest Asia: From the Caspian Sea to the Arabian Sea. CATENA 2018, 165, 590–603. [Google Scholar] [CrossRef]
  28. Hamidi, M.; Kavianpour, M.R.; Shao, Y. Synoptic analysis of dust storms in the Middle East. Asia-Pac. J. Atmos. Sci. 2013, 49, 279–286. [Google Scholar] [CrossRef]
  29. Namdari, S.; Karimi, N.; Sorooshian, A.; Mohammadi, G.H.; Sehatkashani, S. Impacts of climate and synoptic fluctuations on dust storm activity over the Middle East. Atmos. Environ. 2018, 173, 265–276. [Google Scholar] [CrossRef]
  30. Yu, Y.; Notaro, M.; Liu, Z.; Wang, F.; Alkolibi, F.; Fadda, E.; Bakhrjy, F. Climatic controls on the interannual to decadal variability in Saudi Arabian dust activity: Toward the development of a seasonal dust prediction model. J. Geophys. Res. Atmos. 2015, 120, 1739–1758. [Google Scholar] [CrossRef]
  31. Zheng, Y.; Zhao, T.; Che, H.; Liu, Y.; Han, Y.; Liu, C.; Xiong, J.; Liu, J.; Zhou, Y. A 20-year simulated climatology of global dust aerosol deposition. Sci. Total Environ. 2016, 557–558, 861–868. [Google Scholar] [CrossRef]
  32. Csavina, J.; Field, J.; Félix, O.; Corral-Avitia, A.Y.; Sáez, A.E.; Betterton, E.A. Effect of wind speed and relative humidity on atmospheric dust concentrations in semi-arid climates. Sci. Total Environ. 2014, 487, 82–90. [Google Scholar] [CrossRef] [PubMed] [Green Version]
  33. Neuman, C.M.; Sanderson, S. Humidity control of particle emissions in aeolian systems. J. Geophys. Res. Earth Sur. 2008, 113, F02S14. [Google Scholar] [CrossRef] [Green Version]
  34. McTainsh, G.H.; Hynch, A.W.; Tews, E.K. Climatic controls upon dust storm occurrence in eastern Australia. J. Arid Environ. 1998, 39, 457–466. [Google Scholar] [CrossRef]
  35. Nielsen, J.W.; Dole, R.M. A Survey of Extratropical Cyclone Characteristics during GALE. Mon. Weather Rev. 1992, 120, 1156–1168. [Google Scholar] [CrossRef]
  36. Littmann, T. Dust storm frequency in Asia: Climatic control and variability. Int. J. Climatol. 1991, 11, 393–412. [Google Scholar] [CrossRef]
  37. Knippertz, P.; Todd, M.C. Mineral dust aerosols over the Sahara: Meteorological controls on emission and transport and implications for modeling. Rev. Geophys. 2012, 50, RG1007. [Google Scholar] [CrossRef]
  38. Labban, A.H.; Butt, M.J. Analysis of sand and dust storm events over Saudi Arabia in relation with meteorological parameters and ENSO. Arab. J. Geosci. 2021, 14, 22. [Google Scholar] [CrossRef]
  39. Rao, P.G.; Hatwar, H.R.; Al-Sulaiti, M.H.; Al-Mulla, A.H. Summer shamals over the Arabian Gulf. Weather 2003, 58, 471–478. [Google Scholar] [CrossRef]
  40. Kaskaoutis, D.G.; Rashki, A.; Houssos, E.E.; Mofidi, A.; Goto, D.; Bartzokas, A.; Francois, P.; Legrand, M. Meteorological aspects associated with dust storms in the Sistan region, southeastern Iran. Clim. Dyn. 2014, 45, 407–424. [Google Scholar] [CrossRef]
  41. Ackerman, S.A.; Cox, S.K. Surface weather observations of atmospheric dust over the southwest summer monsoon region. Meteorol. Atmos. Phys. 1989, 41, 19–34. [Google Scholar] [CrossRef]
  42. Xi, X.; Sokolik, I.N. Dust interannual variability and trend in Central Asia from 2000 to 2014 and their climatic linkages. J. Geophys. Res. Atmos. 2016, 120, 12175–12197. [Google Scholar] [CrossRef] [Green Version]
  43. Hamzeh, N.H.; Karami, S.; Opp, C.; Fattahi, E.; Jean-Francois, V. Spatial and temporal variability in dust storms in the Middle East, 2002–2018: Three case studies in July 2009. Arab. J. Geosci. 2021, 14, 538. [Google Scholar] [CrossRef]
  44. Namdari, S.; Zghair Alnasrawi, A.I.; Ghorbanzadeh, O.; Sorooshian, A.; Kamran, K.V.; Ghamisi, P. Time series of remote sensing data for interaction analysis of the vegetation coverage and dust activity in the Middle East. Remote Sens. 2022, 14, 2963. [Google Scholar] [CrossRef]
  45. Mackinnon, D.J.; Elder, D.F.; Helm, P.J.; Tuesink, M.F.; Nist, C.A. A method of evaluating effects of antecedent precipitation on duststorms and its application to Yuma, Arizona, 1981–1988. Clim. Chang. 1990, 17, 331–360. [Google Scholar] [CrossRef]
  46. Gillette, D.A. Threshold friction velocities for dust production for agricultural soils. J. Geophys. Res. Atmos. 1988, 93, 12645–12662. [Google Scholar] [CrossRef] [Green Version]
  47. Gillette, D.A.; Passi, R. Modeling dust emission caused by wind erosion. J. Geophys. Res. Atmos. 1988, 93, 14233–14242. [Google Scholar] [CrossRef] [Green Version]
  48. Kok, J.F.; Parteli, E.J.R.; Michaels, T.I.; Karam, D.B. The physics of wind-blown sand and dust. Rep. Prog. Phys. 2012, 75, 106901. [Google Scholar] [CrossRef] [Green Version]
  49. Mahowald, M.; Albani, S.; Kok, J.F.; Engelstaeder, S.; Scanza, R.; Ward, D.S.; Flanner, M.G. The size distribution of desert dust aerosols and its impact on the Earth system. Aeolian Res. 2014, 15, 53–71. [Google Scholar] [CrossRef] [Green Version]
  50. Duce, R.A. Sources, distributions, and fluxes of mineral aerosols and their relationship to climate. In Aerosol Forcing of Climate, Report of the Dahlem Workshop on Aerosol Forcing of Climate, Berlin 1994, April 24–29; Charlson, R.J., Heintzenberg, J., Eds.; Wiley: New York, NY, USA, 1995; pp. 43–72. [Google Scholar]
  51. Shao, Y.; Leslie, L.M. Wind erosion prediction over the Australian continent. J. Geophys. Res. Atmos. 1997, 102, 30091–30105. [Google Scholar] [CrossRef] [Green Version]
  52. Wasson, R.J.; Nanninga, P.M. Estimating wind transport of sand on vegetated surfaces. Earth Surf. Proc. Landf. 1986, 11, 505–514. [Google Scholar] [CrossRef]
  53. Wolfe, S.A.; Nickling, W.G. The protective role of sparse vegetation in wind erosion. Prog. Phys. Geog. 1993, 17, 50–68. [Google Scholar] [CrossRef]
  54. Tucker, C.J.; Vanpraet, C.L.; Sharman, M.J.; Van Ittersum, G. Satellite remote sensing of total herbaceous biomass production in the Senegalese Sahel: 1980–1984. Remote Sens. Environ. 1985, 17, 233–249. [Google Scholar] [CrossRef]
  55. Anyamba, A.; Tucker, C.J. Analysis of Sahelian vegetation dynamics using NOAA-AVHRR NDVI data from 1981–2003. J. Arid Environ. 2005, 63, 596–614. [Google Scholar] [CrossRef]
  56. Li, J.; Garshicket, E.; Al-Hemoud, A.; Huang, S.; Koutrakis, P. Impacts of meteorology and vegetation on surface dust concentrations in Middle Eastern countries. Sci. Total Environ. 2020, 712, 136597. [Google Scholar] [CrossRef] [PubMed]
  57. Awad, A.M.; Mashat, A.W.S.; Salem, F.F.A. Diagnostic study of spring dusty days over the southwest region of the Kingdom of Saudi Arabia. Arab. J. Geosci. 2015, 8, 2265–2282. [Google Scholar] [CrossRef]
  58. Justice, C.O.; Townshend, J.R.G.; Holben, B.N.; Tucket, C.J. Analysis of the phenology of global vegetation using meteorological satellite data. Int. J. Remote Sens. 1985, 6, 1271–1318. [Google Scholar] [CrossRef]
  59. Levy, R.C.; Remer, L.A.; Martins, J.V.; Kaufman, Y.J.; Plana-Fattori, A.; Redemann, J.; Wenny, B. Evaluation of the MODIS Aerosol Retrievals over Ocean and Land during CLAMS. J. Atmos. Sci. 2005, 62, 974–992. [Google Scholar] [CrossRef]
  60. Tripathi, S.N.; Dey, S.; Chandel, A.; Srivastava, S.; Singh, R.P.; Holben, B.N. Comparison of MODIS and AERONET derived aerosol optical depth over the Ganga Basin, India. Ann. Geophys. 2005, 23, 1093–1101. [Google Scholar] [CrossRef] [Green Version]
  61. Gelaro, R.; McCarty, W.; Suárez, M.J.; Todling, R.; Molod, A.; Takacs, L.; Randles, C.A.; Darmenov, A.; Bosilovich, M.G.; Reichle, R.; et al. The Modern-Era Retrospective Analysis for Research and Applications, Version 2 (MERRA-2). J. Clim. 2017, 30, 5419–5454. [Google Scholar] [CrossRef]
  62. Yuan, C.; Lau, W.K.M.; Li, Z.; Cribb, M. Relationship between Asian monsoon strength and transport of surface aerosols to the Asian Tropopause Aerosol Layer (ATAL): Interannual variability and decadal changes. Atmos. Chem. Phys. 2017, 19, 1901–1913. [Google Scholar] [CrossRef]
  63. Sun, H.; Liu, X.; Wang, A. Seasonal and interannual variations of atmospheric dust aerosols in mid and low latitudes of Asia—A comparative study. Atmos. Res. 2020, 244, 105036. [Google Scholar] [CrossRef]
  64. Ukhov, A.; Mostamandi, S.; Silva, A.M.D.; Flemming, J.; Stenchikov, G. Assessment of natural and anthropogenic aerosol air pollution in the middle east using MERRA-2, CAMS data assimilation products, and high-resolution WRF-Chem model simulations. Atmos. Chem. Phys. 2020, 20, 9281–9310. [Google Scholar] [CrossRef]
  65. Khan, R.; Kumar, K.R.; Zhao, T.; Ullah, W.; de Leeuw, G. Interdecadal changes in aerosol optical depth over Pakistan based on the MERRA-2 reanalysis data during 1980–2018. Remote Sens. 2021, 13, 822. [Google Scholar] [CrossRef]
  66. Huang, B.; Banzon, V.F.; Freeman, E.; Lawrimore, J.; Liu, W.; Peterson, C.P.; Smith, T.M.; Thorne, P.W.; Woodruff, S.D.; Zhang, H.-M. Extended Reconstructed Sea Surface Temperature Version 4 (ERSST.v4). Part I: Upgrades and Intercomparisons. J. Clim. 2015, 28, 911–930. [Google Scholar] [CrossRef] [Green Version]
  67. Earikson, R.J.; Harlin, J.M. Geographic Measurements and Quantitative Analysis; Macmillan College Publishing Company, Inc.: New York, NY, USA, 1994; 350p. [Google Scholar]
  68. Kramer, C.Y. Extension of multiple range tests to group means with unequal numbers of replications. Biometrics 1956, 12, 307–310. [Google Scholar] [CrossRef]
  69. Gurvich, V.; Naumova, M. Logical contradictions in the One-Way ANOVA and Tukey-Kramer multiple comparisons tests with more than two groups of observations. Symmetry 2021, 13, 1387. [Google Scholar] [CrossRef]
  70. DelSole, T.; Tippett, M. Statistical Methods for Climate Scientists; Cambridge University Press: Cambridge, UK, 2022; 525p. [Google Scholar] [CrossRef]
  71. Griffith, D.A.; Amrhein, C.G. Multivariate Statistical Analysis for Geographers; Prentice Hall, Inc.: Hoboken, NJ, USA, 1997; p. 345. [Google Scholar]
  72. Trouet, V.; Van Oldenborgh, G.J. KNMI Climate Explorer: A web-based research tool for high-resolution paleoclimatology. Tree-Ring Res. 2013, 69, 3–13. [Google Scholar] [CrossRef] [Green Version]
  73. Kim, D.S.; Cho, G.H.; White, B.R. A wind tunnel study of atmospheric boundary layer flow over vegetated surfaces to suppress PM10 emission on Owens (dry) Lake. Boundary Layer Meteorol. 2000, 97, 309–329. [Google Scholar] [CrossRef]
  74. Huang, B.; Shin, C.; Shukla, J.; Marx, L.; Balmaseda, M.A.; Halder, S.; Dirmeyer, P.; Kinter, J.L., III. Reforecasting the ENSO events in the past 57 years (1958–2014). J. Clim. 2017, 30, 7669–7693. [Google Scholar] [CrossRef]
  75. Fryrear, D.W.; Bilbro, J.D.; Saleh, A.; Schomberg, H.; Stout, J.E.; Zobeck, T.M. RWEQ: Improved wind erosion technology. J. Soil Water Conserv. 2000, 55, 183–189. [Google Scholar]
  76. Kao, H.-Y.; Yu, J.-Y. Contrasting eastern-Pacific and central-Pacific types of ENSO. J. Clim. 2009, 22, 615–632. [Google Scholar] [CrossRef]
  77. Jeong, J.I.; Park, R.J.; Yeh, S.-W. Dissimilar effects of two El Niño types on PM2.5 concentrations in East Asia. Environ. Pollut. 2018, 242, 1395–1403. [Google Scholar] [CrossRef] [PubMed]
  78. Yu, X.; Wang, Z.; Zhang, H.; Zhao, S. Impacts of different types and intensities of El Niño events on winter aerosols over China. Sci. Total Environ. 2019, 655, 766–780. [Google Scholar] [CrossRef]
  79. Lee, Y.G.; Kim, J.; Ho, C.-H.; An, S.-I.; Cho, H.-K.; Mao, R.; Tian, B.; Wu, D.; Lee, J.N.; Kalashnikova, O.; et al. The effects of ENSO under negative AO phase on spring dust activity over northern China: An observational investigation. Int. J. Climatol. 2015, 35, 935–947. [Google Scholar] [CrossRef]
  80. Shi, L.; Zhang, J.; Yao, F.; Zhang, D.; Guo, H. Temporal variation of dust emissions in dust sources over Central Asia in recent decades and the climate linkages. Atmos. Environ. 2020, 222, 117176. [Google Scholar] [CrossRef]
  81. Shao, Y.; Klose, M.; Wyrwoll, K.-H. Recent global dust trend and connections to climate forcing. J. Geophys. Res. Atmos. 2013, 118, 11107–11118. [Google Scholar] [CrossRef]
Figure 2. The Key Region (black box) in Huang et al. [23] which has been divided into subregions: Eastern Arabian Peninsula (EAP, 12–27° N, 48–60° E), Western Arabian Peninsula (WAP, 12–32° N, 34–48° E), Central Asia West (CAW, 30–48° N, 26–51° E), and Central Asia East (CAE, 30–48° N, 51–76° E). North Africa—Sahara (NAS, 12–30° N, 10° W–34° E) is included for comparison.
Climate 10 00150 g002
Figure 3. Classification of the ENSO conditions based on the January ONI series, which is noted as ONI_DJF in the following as it is based on the December–February NINO3.4 index values. The dashed lines represent the conditions when ONI_DJF = +1.0 and −1.0, thus, respectively, defining the EN and LN events during 1980–2021.
Climate 10 00150 g003
Figure 4. Mean dust column mass density values (unit: kg m−2) by 3-month periods throughout the year during 1980–2021 for the four subregions and North Africa–Sahara (NAS) for comparison. The error bars represent the standard deviations of individual months of the year.
Climate 10 00150 g004
Figure 5. Mean monthly anomalies during the EN and LN events for the subregions during 1980–2021. The error bars represent the standard error of the mean for each ENSO condition in a subregion. The values during the normal (labeled as N) conditions are also included for comparison.
Climate 10 00150 g005
Figure 6. Spearman’s rank correlation coefficients between the January ONI and MERRA-2 3-month dust column mass density series for the four subregions during 1980–2021, with NAS for comparison. Additionally shown in the figure is the critical correlation coefficient value (rho = −0.3082) corresponding to the 0.05 significance level (N = 41, for series when months of the previous year were used). Note that the Y-axis is displayed in reverse order.
Climate 10 00150 g006
Figure 7. Spearman’s rank correlation between January (DJF) ONI and ERA5 3-month mean precipitation in the subregions during 1950–2021 (a), and ERA5 surface water vapor content (unit: kg m−2) (b). Additionally displayed are the critical values corresponding to the 0.05 significance level (rho = 0.2484 for N = 71).
Climate 10 00150 g007
Figure 8. This is the same as Figure 7, but it demonstrates the mean ERA5 daily maximum wind speed with critical rho = 0.2484 for N = 71.
Climate 10 00150 g008
Figure 9. Same as Figure 7, but for the mean 3-month NDVI values with critical rho = 0.3247 for N = 37 during 1981–2019 (a) and MERRA-2 root-zone wetness with critical rho = 0.3082 for N = 41 during 1980–2021 (b).
Climate 10 00150 g009
Figure 10. Correlation coefficients between the EAP dust mass density and precipitation (a), mean maximum daily wind speed (b), and NDVI (c) during the dust season of April–August. The maps cover the entire study region of 12–48° N, 10° W–76° E; they were produced using the KNMI Climate Explorer web tool (https://climexp.knmi.nl/start.cgi (last accessed on 21 August 2022)).
Climate 10 00150 g010
Figure 11. Same as Figure 10, but for the CAE subregion during the dust season of March to August.
Climate 10 00150 g011
Table 1. Datasets used in this study to represent major factors of dust activity.
FactorVariable NameDataset NameSpatial ResolutionData SourceMetadata
PrecipitationMonthly Precipitation (mm/day)ERA 5 Reanalysis (1950–2021)0.25 × 0.25 Lat./Long.KNMI Climate Explorerhttps://www.ecmwf.int/en/forecasts/datasets/reanalysis-datasets/era5 (accessed on 11 August 2022)
HumidityMonthly Mean Surface Column Water Vapor Content (kg m−2)ERA 5 Reanalysis (1950–2021)0.25 × 0.25 Lat./Long.KNMI Climate ExplorerSame as above
WindDaily-Mean Near-Surface Wind Speed (m/s) Averaged into Monthly SeriesERA 5 Reanalysis (1950–2021)0.5 × 0.5 Lat./Long.KNMI Climate ExplorerSame as above
VegetationMonthly Normalized Difference Vegetation Index NOAA/NCEI CDR NDVI (1981–2019)0.1 × 0.1 Lat./Long.KNMI Climate Explorerhttps://www.ncei.noaa.gov/metadata/geoportal/rest/metadata/item/gov.noaa.ncdc:C01558/html (accessed on 20 September 2022)
Soil MoistureMonthly Root Zone Soil Wetness (Unitless)MERRA-2 (1980–2021)0.5 × 0.625 Lat./Long.NASA
GIOVANNI
https://disc.gsfc.nasa.gov/datasets/M2TMNXLND_5.12.4/summary (accessed on 20 September 2022)
Table 2. Mean percentage of monthly dust mass density relative to the annual totals in the subregions. The color shaded cells represent the respective dust seasons, which are arbitrarily determined as the months when the monthly relative contribution is higher than 8.33% (100% divided by 12 months). Additionally included are the Spearman’s rank correlations between the dust–season mean series and ONI_DJF during 1980–2021.
MonthsEAPWAPCAWCAENAS
14.24.34.54.15.0
25.95.96.86.26.3
37.88.010.49.48.5
48.49.314.312.110.5
59.710.913.612.411.8
614.213.19.711.811.9
717.013.18.911.310.6
813.311.77.69.69.0
97.99.17.07.88.7
104.66.07.16.57.7
113.54.65.65.05.4
123.54.04.43.84.7
Dust SeasonApril–AugustApril–SeptemberMarch–JulyMarch–AugustMarch–September
rho with ONI_DJF−0.323−0.267−0.316−0.431−0.135
Sig. (N = 42)0.0370.0870.0420.0040.395
Table 3. Results of One-Way ANOVA comparing the means of dust column mass density anomalies between the EN (N = 84), LN (N = 84), and normal (N = 336) months during 1980–2021.
SurbregionsANOVAKruskal-WallisTukey’s HSD (p-Values)
FSig.HSig.ENSONEN
EAP9.8500.00016.3410.000LN0.4300.000
EN0.000
WAP8.1150.00015.3860.000LN0.0840.000
EN0.010
CAW5.8110.0039.9280.007LN0.2880.003
EN0.020
CAE17.8400.00024.6410.000LN0.0010.000
EN0.000
NAS0.8440.4301.9450.378LN0.3970.712
EN0.950
Table 4. Multiple linear regression with the 3-month dust column mass density when its correlation with ONI_DJF was highest as the dependent variable and major factors of dust activity and ONI_DJF as the independent variables. For the independent variables, the names contain the acronyms of subregions, factors (p = precipitation, ws = mean maximum daily wind speed, vi = NDVI, and sm = soil moisture (root zone wetness)), and the ranges of the specific 3-month periods or cumulative precipitation from January (e.g., 6–8 = June–August).
ModelIndepend. VariablesUnstand. Coeff.Std. ErrorStand. Coeff.tSig.Collinearity ToleranceVIFR2R2-adjFSig.Total df
EAP_JJA(Constant)−0.00054026.70 × 10−4 −0.8060.426 0.4690.42310.289<0.00138
EAPws6–80.00019098.37 × 10−50.3092.2810.0290.8261.210
EAPvi6–8−0.00281308.96 × 10−4−0.398−3.1400.0030.9441.059
ONI_DJF−0.00002411.04 × 10−5−0.307−2.3200.0260.8681.152
WAP_JAS(Constant)−0.00047976.24 × 10−4 −0.7680.447 0.2510.2096.0330.00538
WAPvi7–9−0.00172047.04 × 10−4−0.361−2.4440.0200.9521.051
WAPws7–90.00019671.05 × 10−40.2771.8720.0690.9521.051
CAW_
FMA
(Constant)−0.00017821.38 × 10−4 −1.2930.205 0.3270.2665.3380.00436
ONI_DJF−0.00001434.53 × 10−6−0.472−3.1600.0030.9131.095
CAWvi2–40.00040692.01 × 10−40.2922.0200.0520.9751.025
CAWsm2–40.00047962.41 × 10−40.3011.9900.0550.8941.119
CAE_AMJ(Constant)−0.00056013.12 × 10−4 −1.7960.081 0.4960.45211.153<0.00137
CAEp1–6−0.00002375.58 × 10−6−0.649−4.2370.0000.6321.581
CAEws4–60.00012434.63 × 10−50.3622.6860.0110.8171.224
CAEsm4–60.00088943.90 × 10−40.3482.2790.0290.6361.573
NAS_ASO(Constant)−0.00005633.49 × 10−4 −0.1610.873 0.5860.54916.031<0.00137
NASws8–100.00024404.91 × 10−50.5574.9660.0000.9671.034
NASsm8–10−0.00281636.96 × 10−4−0.611−4.0470.0000.5351.870
NASp8–100.00011315.09 × 10−50.3332.2200.0330.5411.850
Publisher’s Note: MDPI stays neutral with regard to jurisdictional claims in published maps and institutional affiliations.