
Spatiotemporal Variation of Tourism Climate Index for Türkiye during 1981–2020


Abstract
1. Introduction
2. Data and Methodology
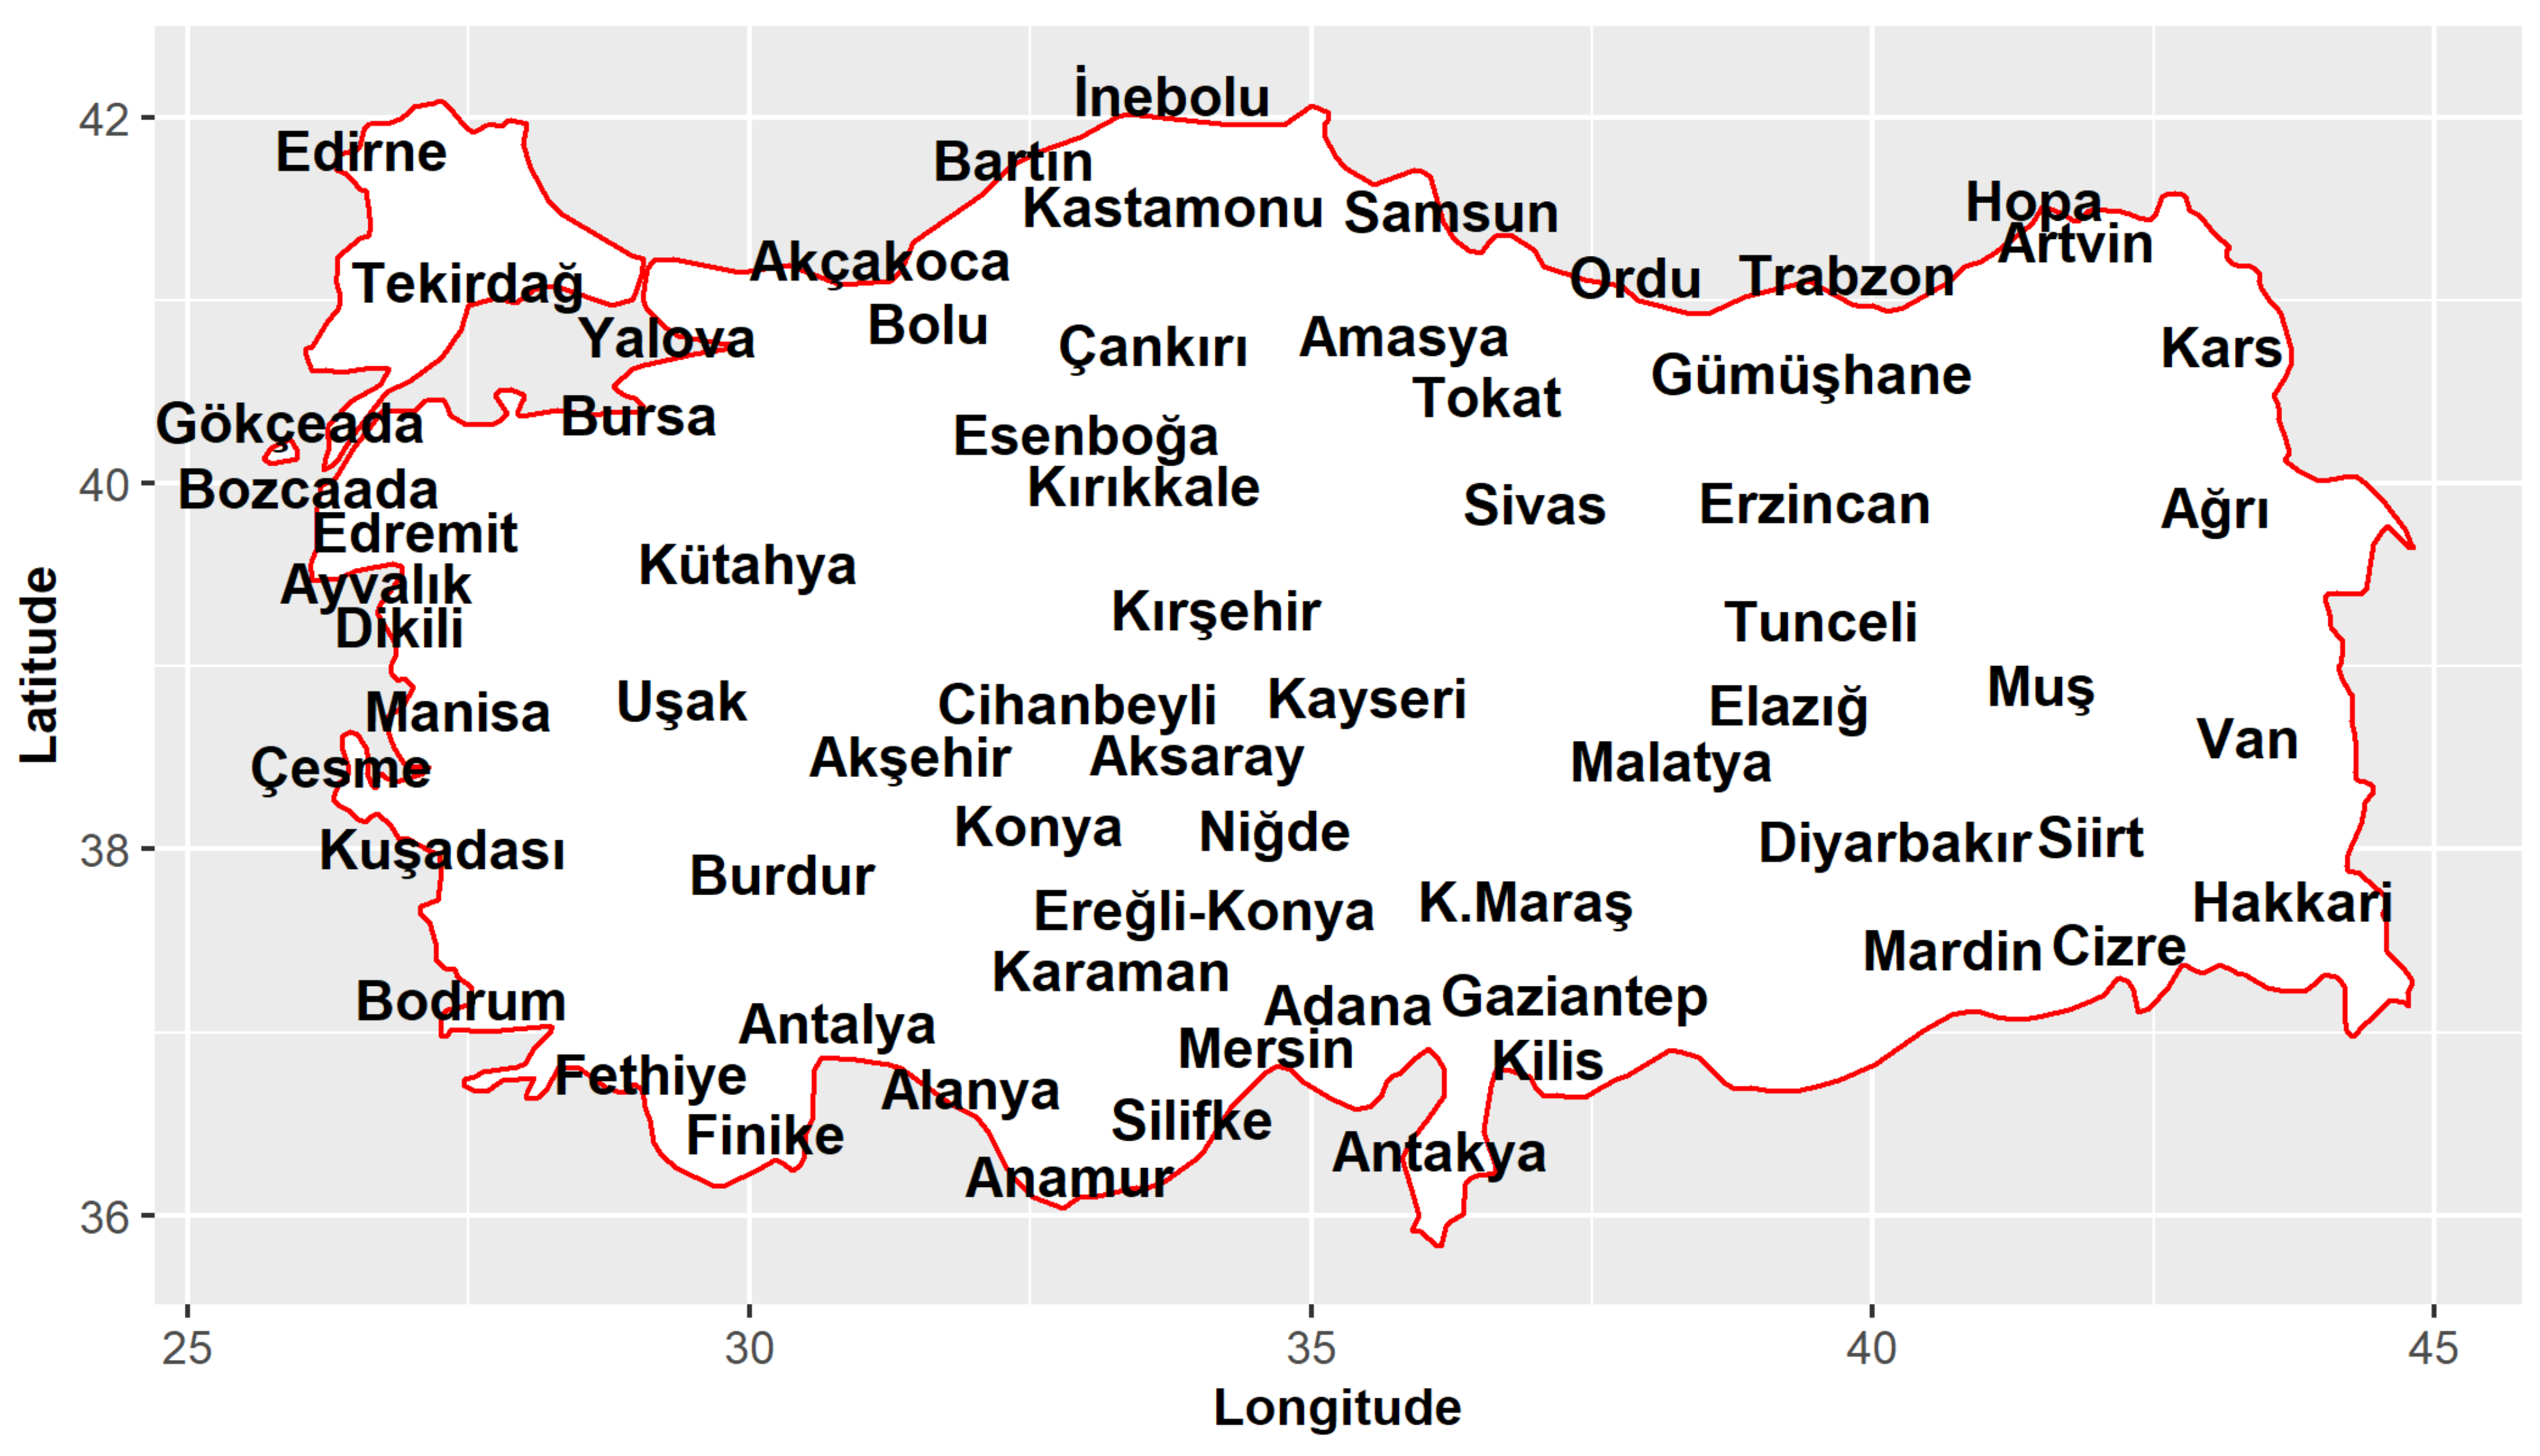
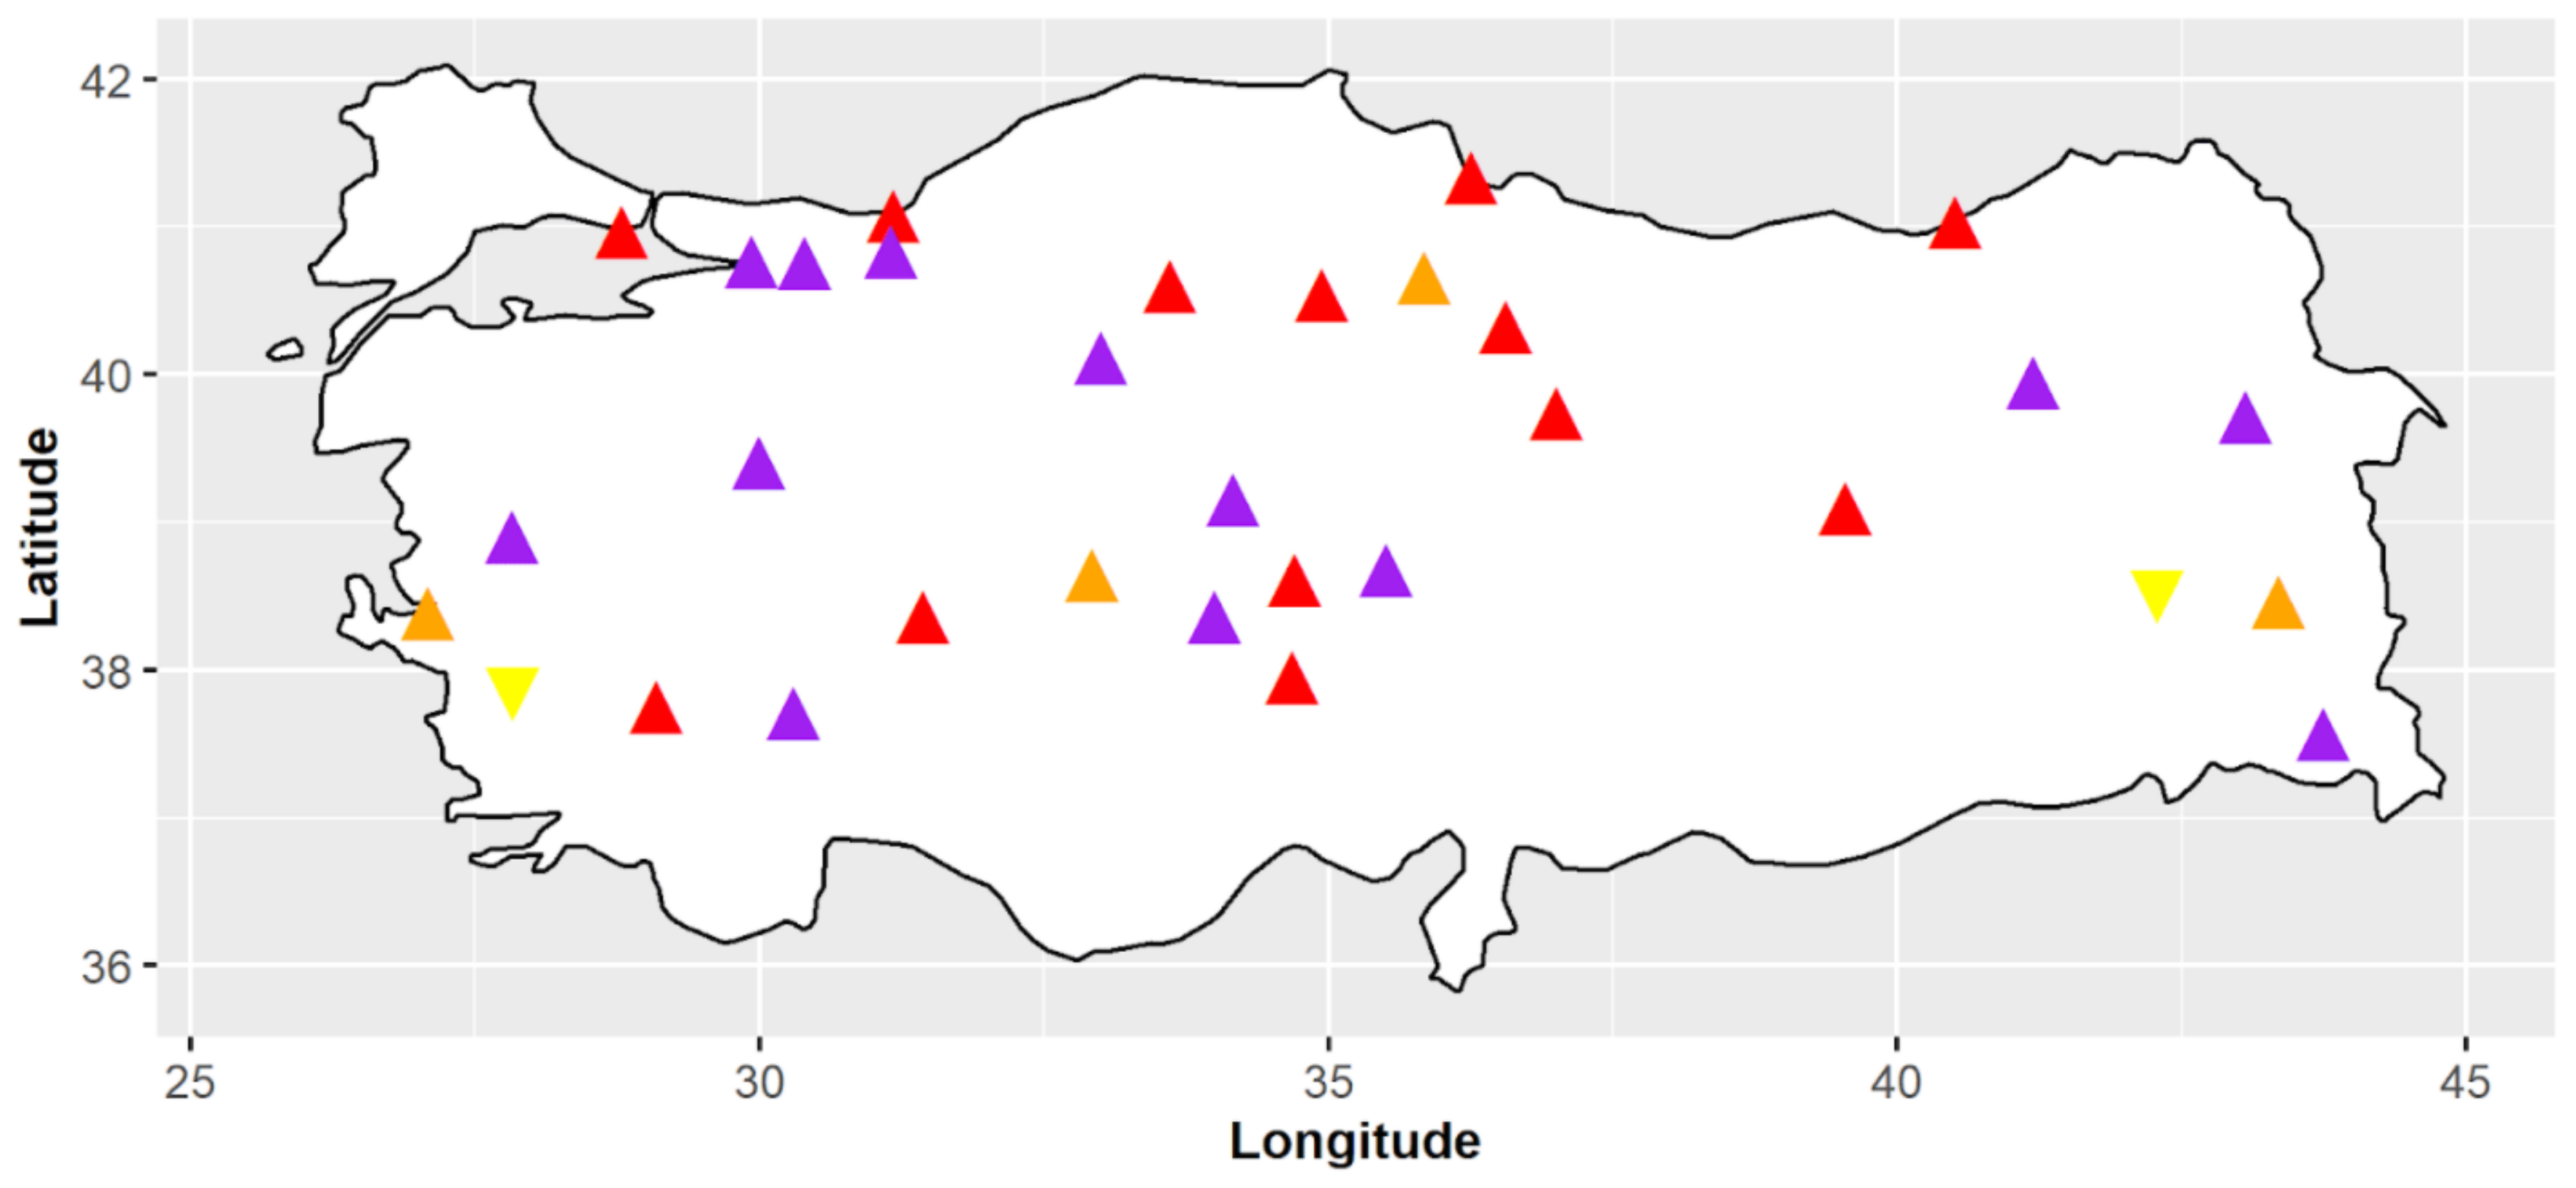
2.1. Study Area
2.2. Tourism Climate Index (TCI)
2.3. Mann-Kendall Trend Test
2.4. Sen Innovative Trend Test
3. Results and Discussion
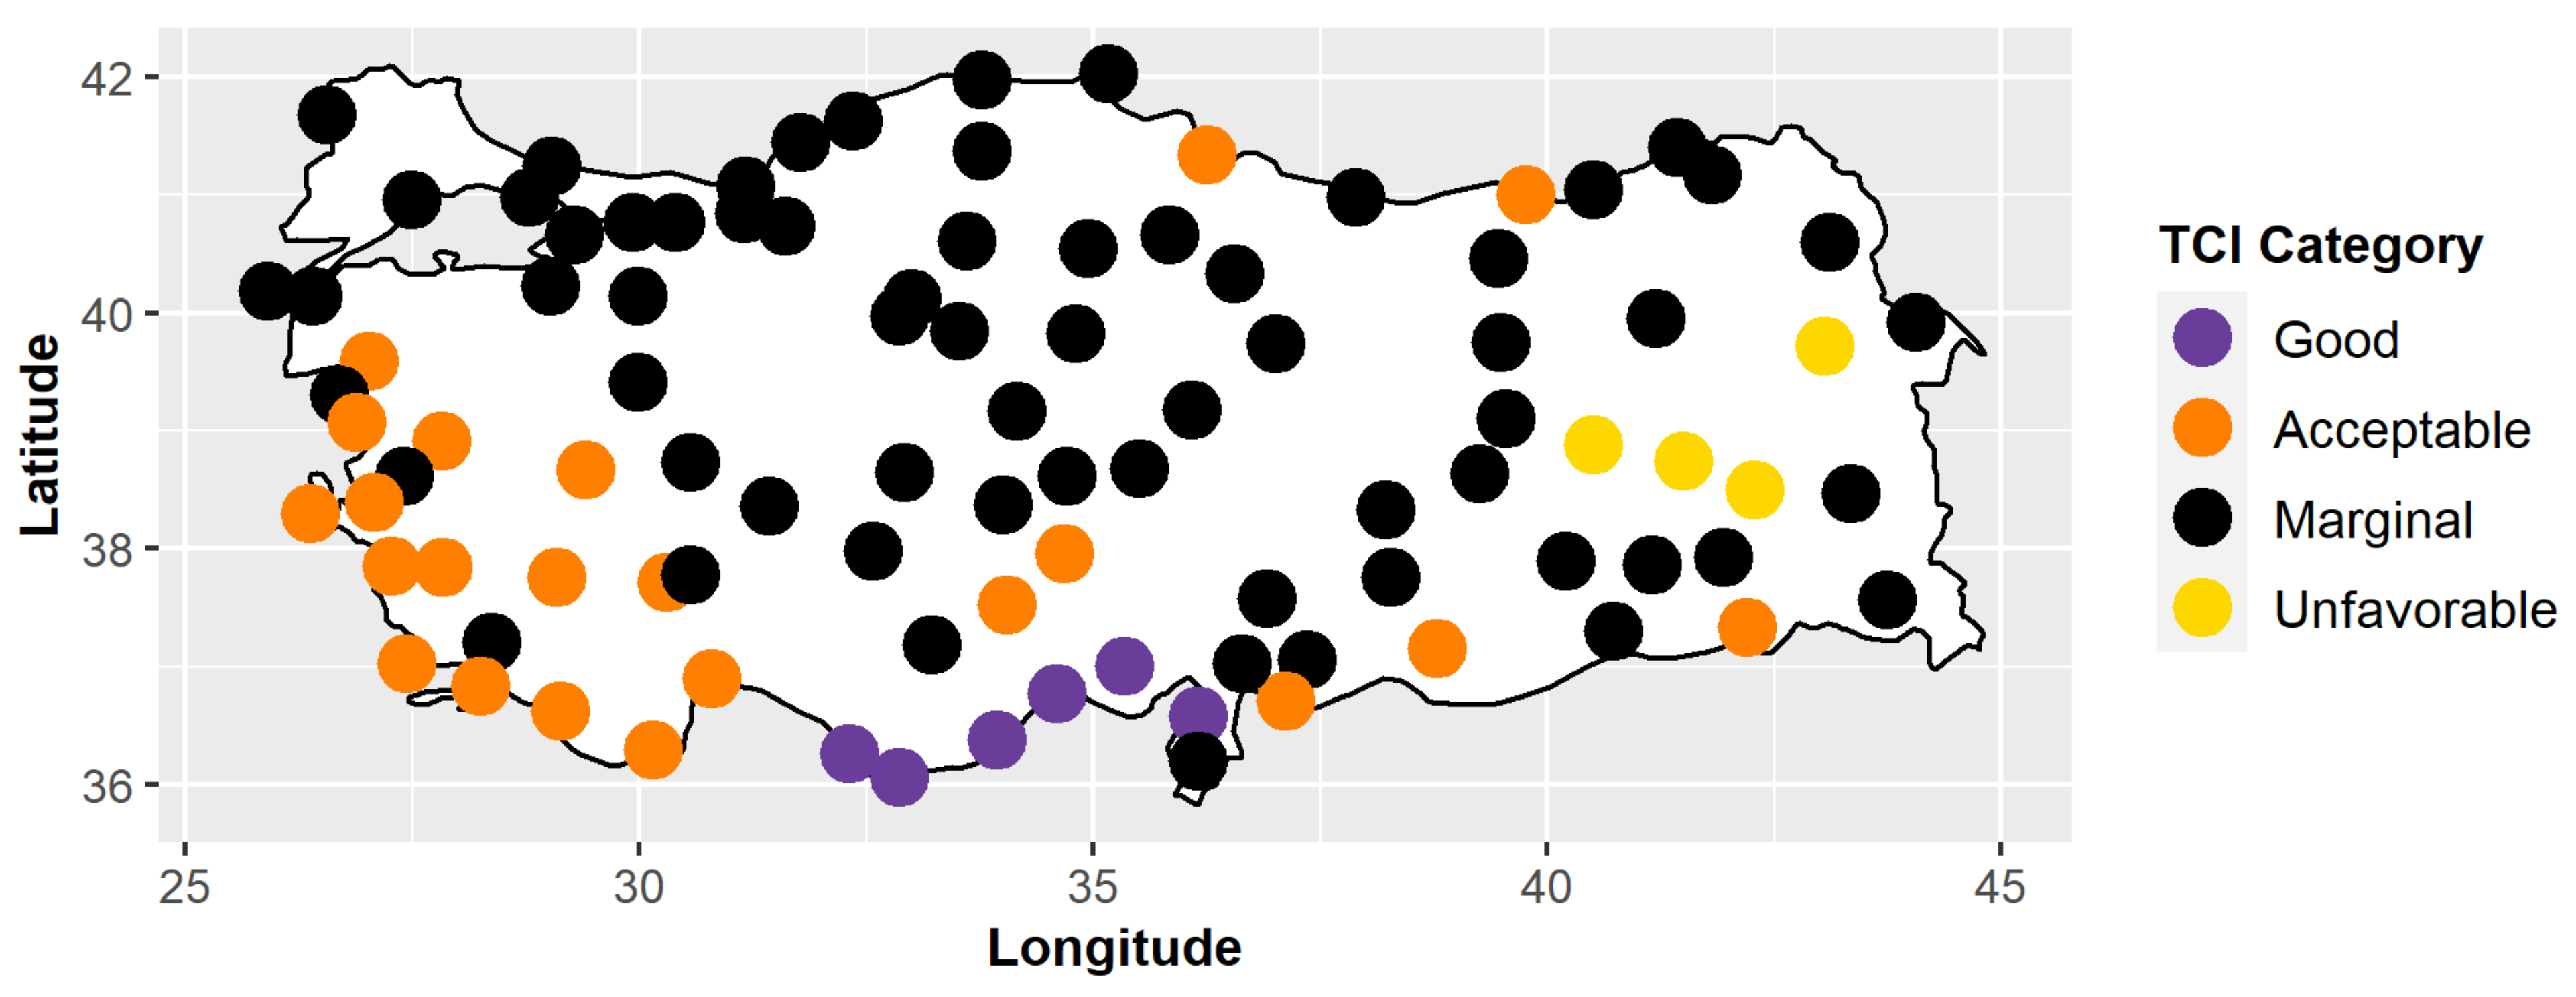
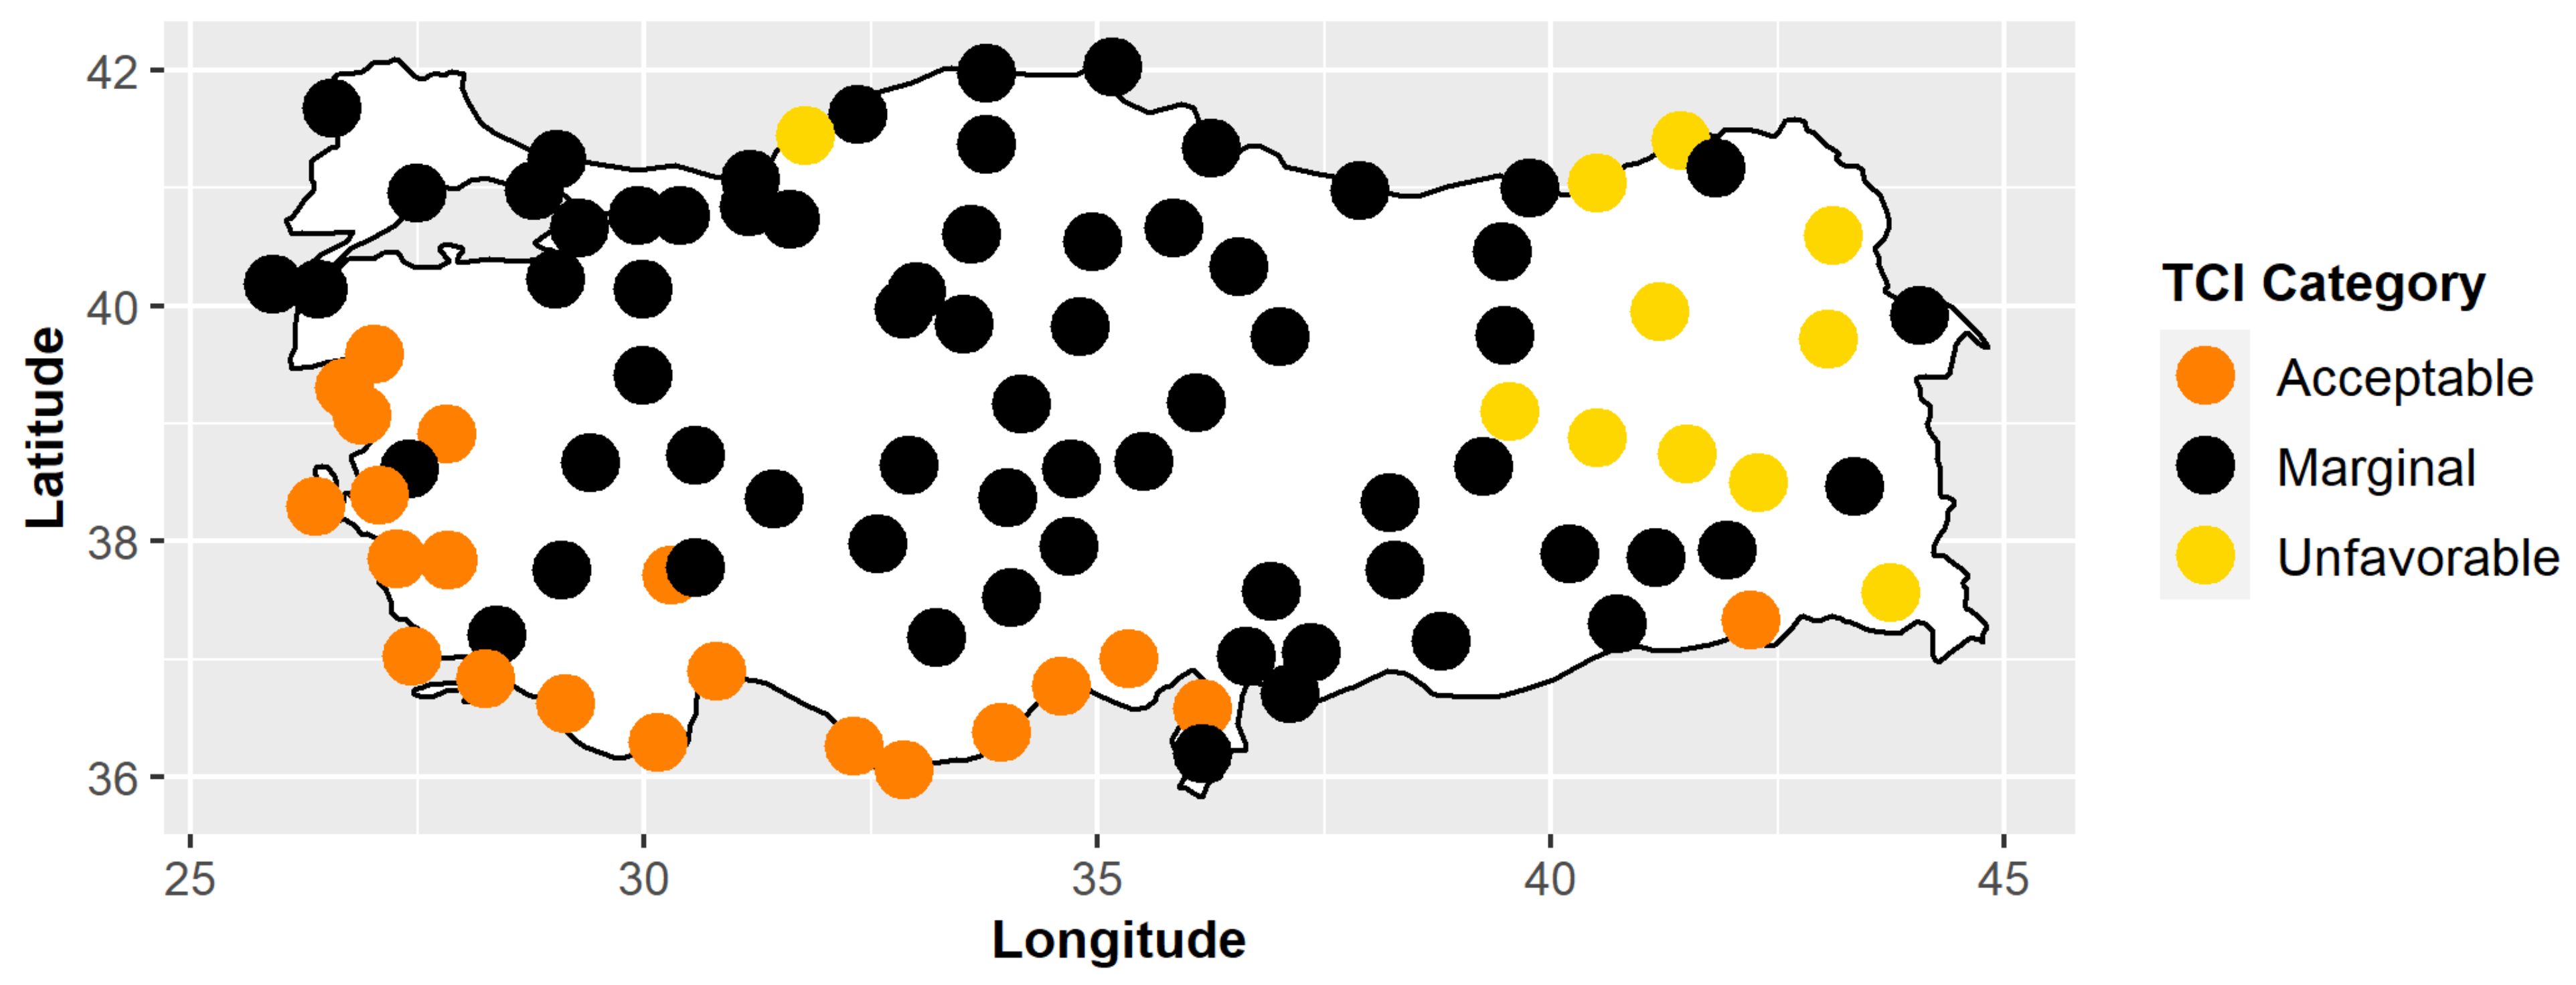
3.1. TCI Conditions
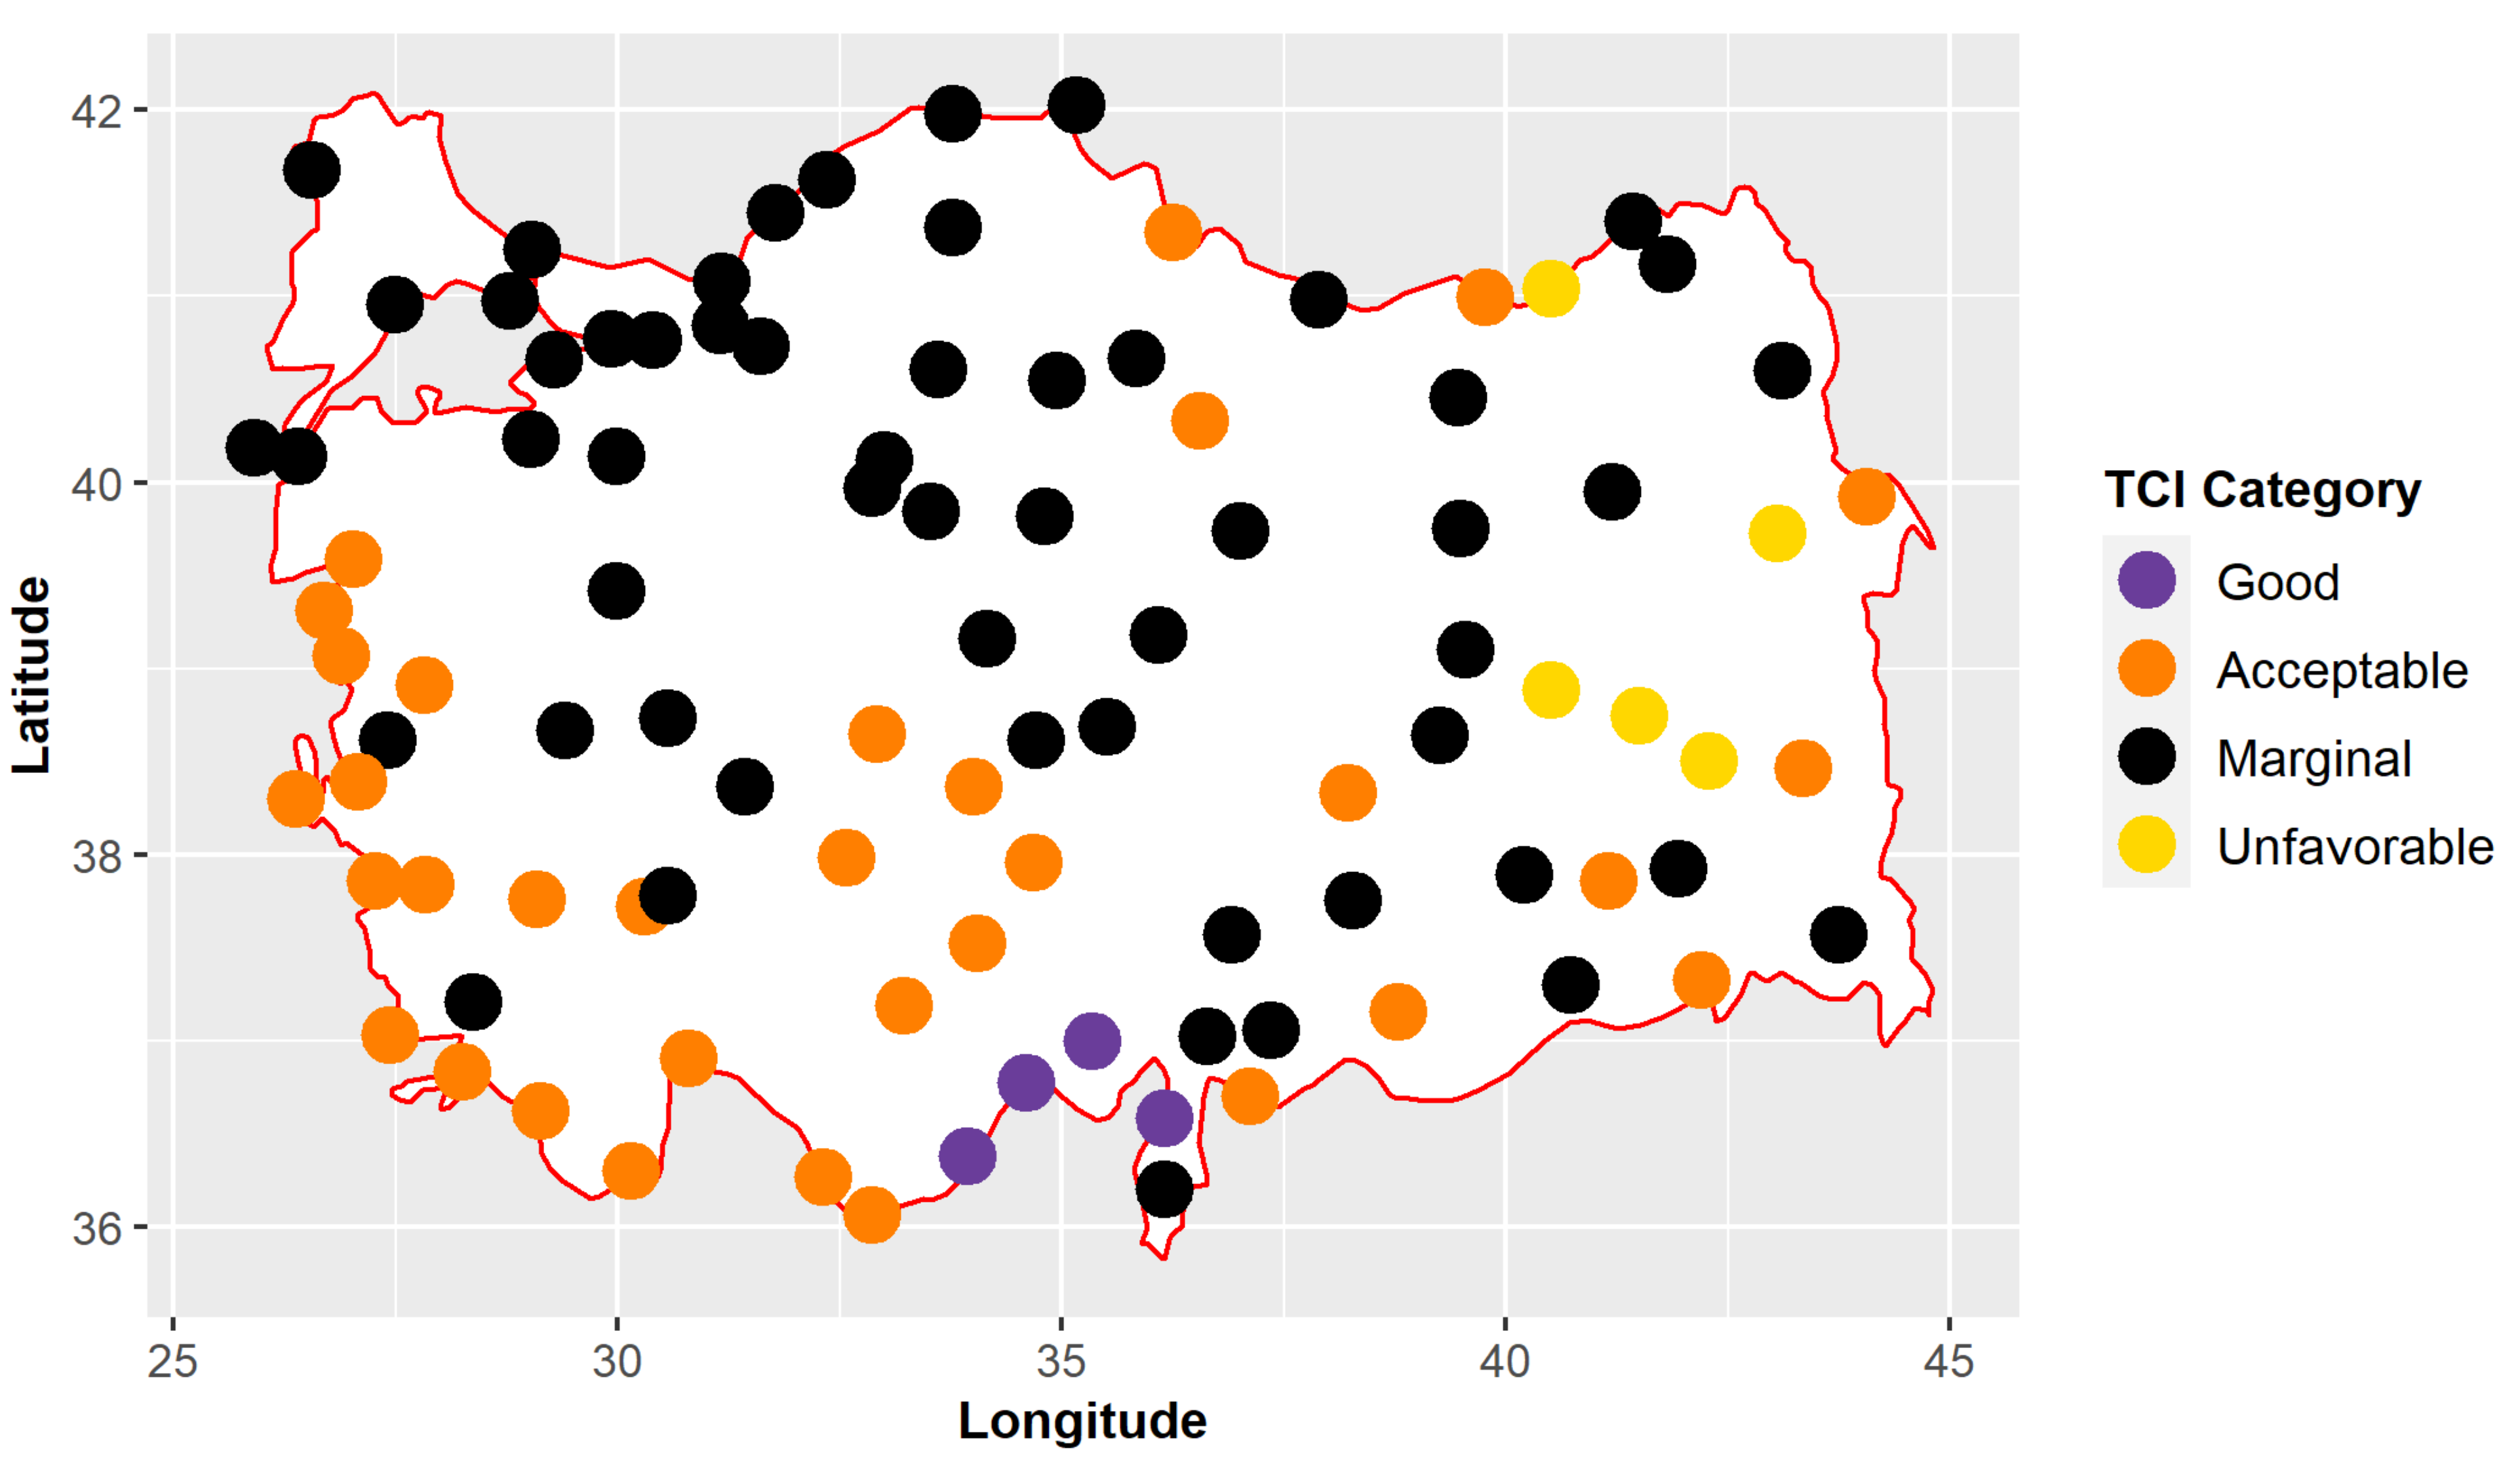
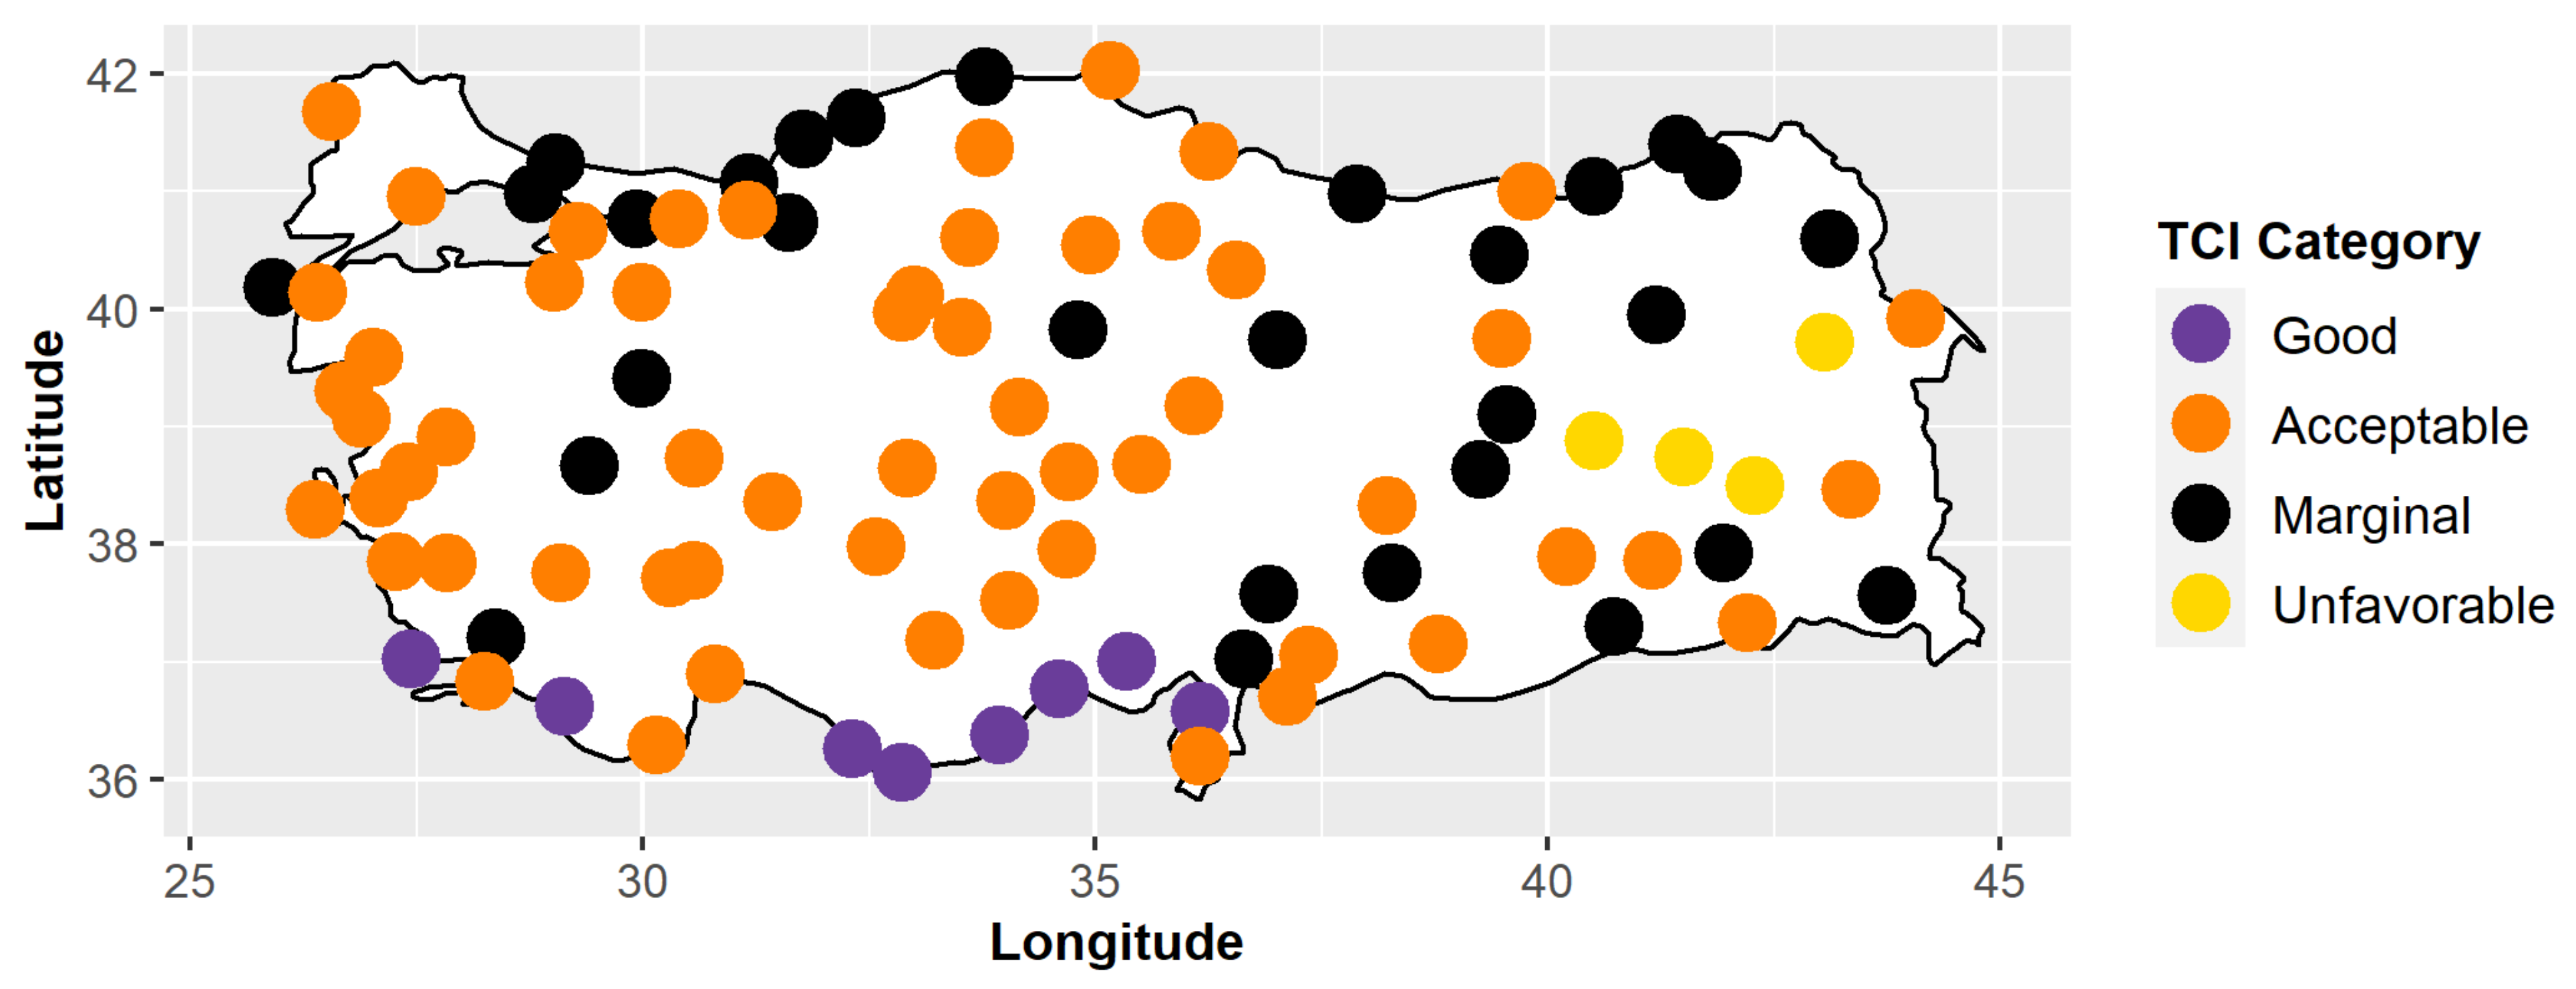
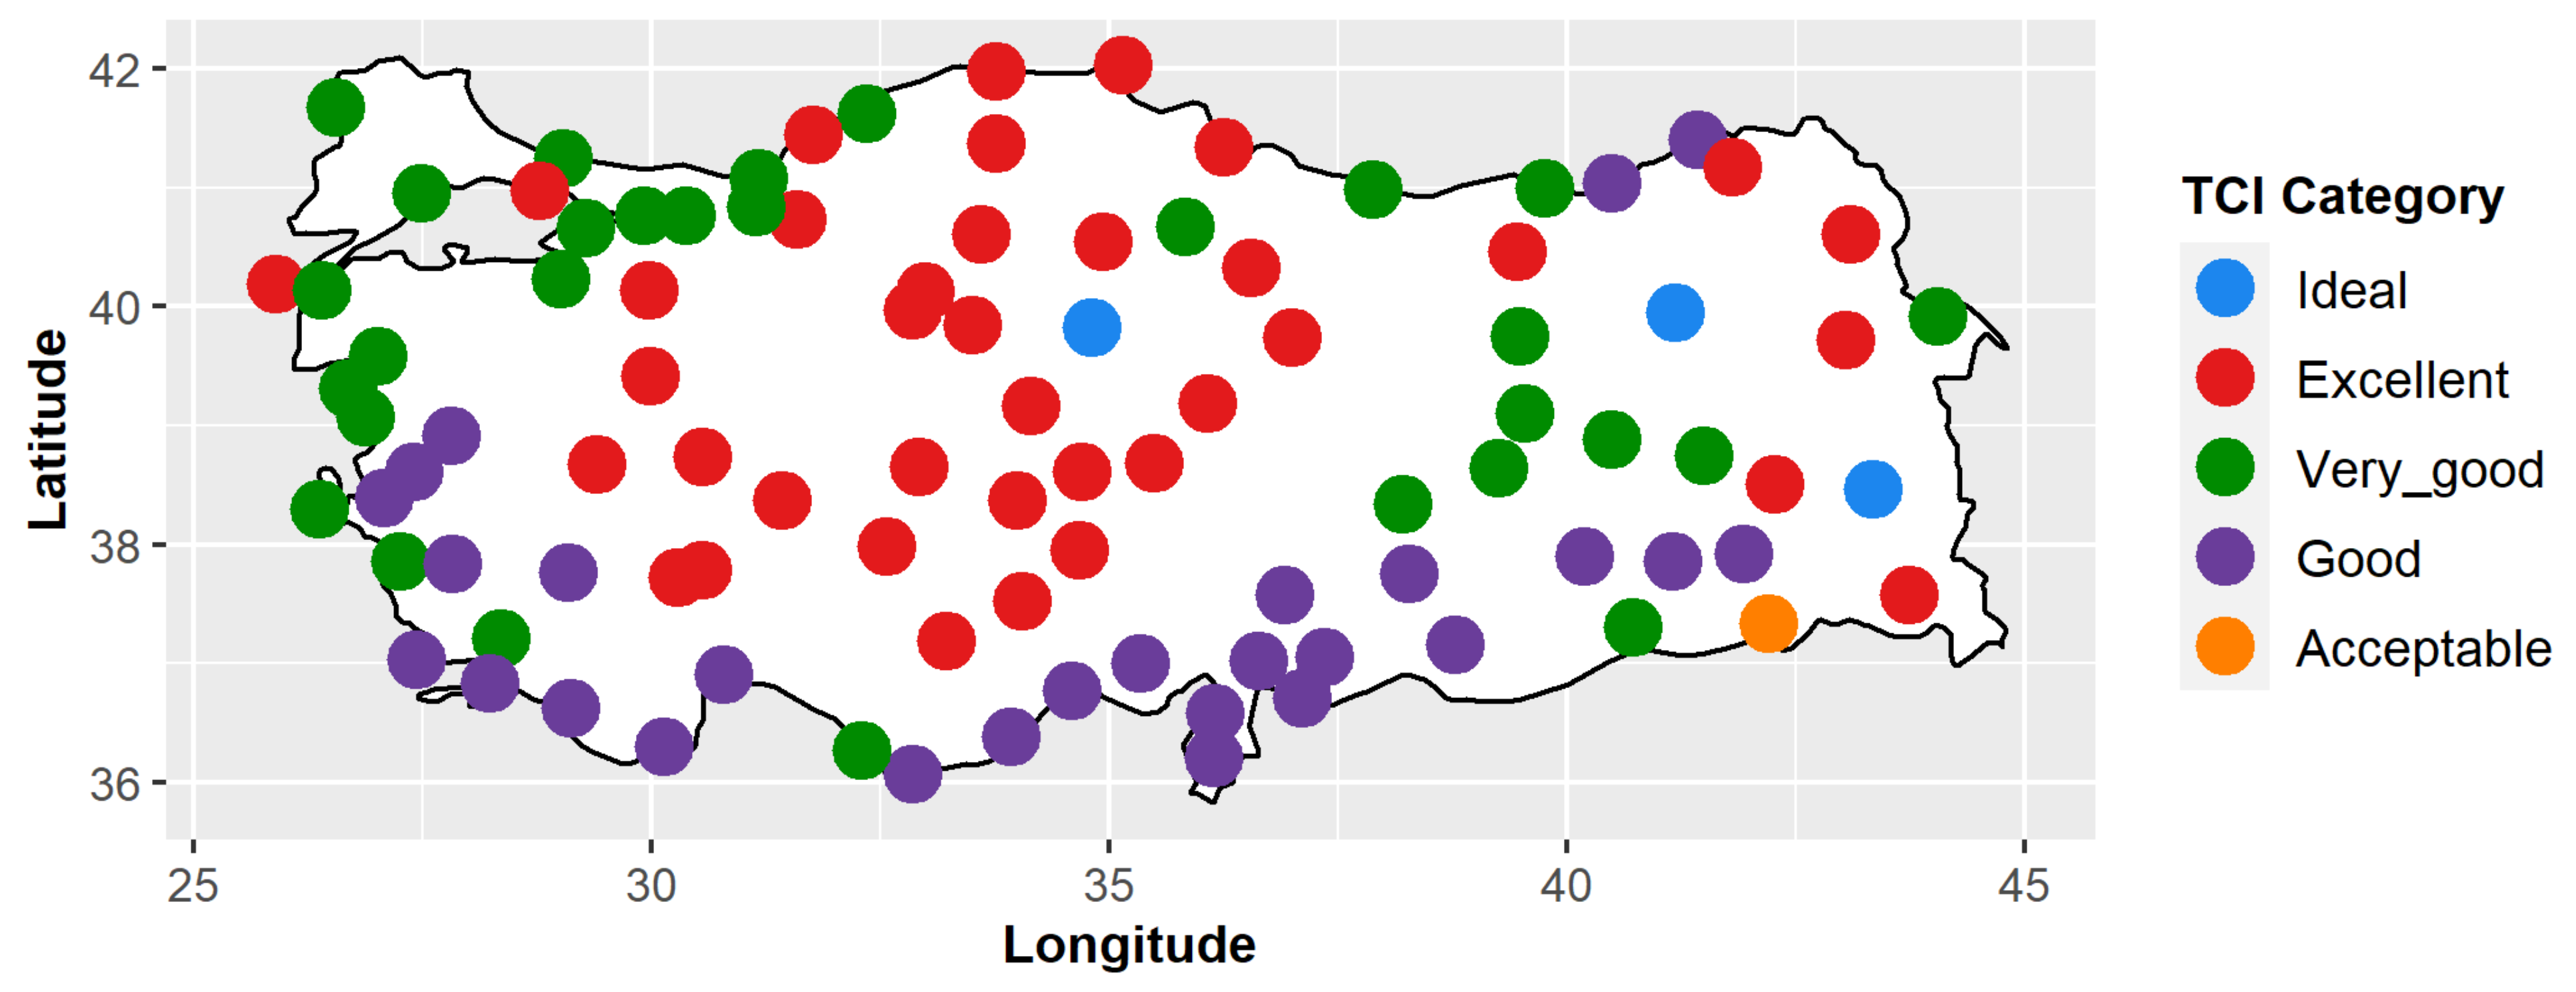
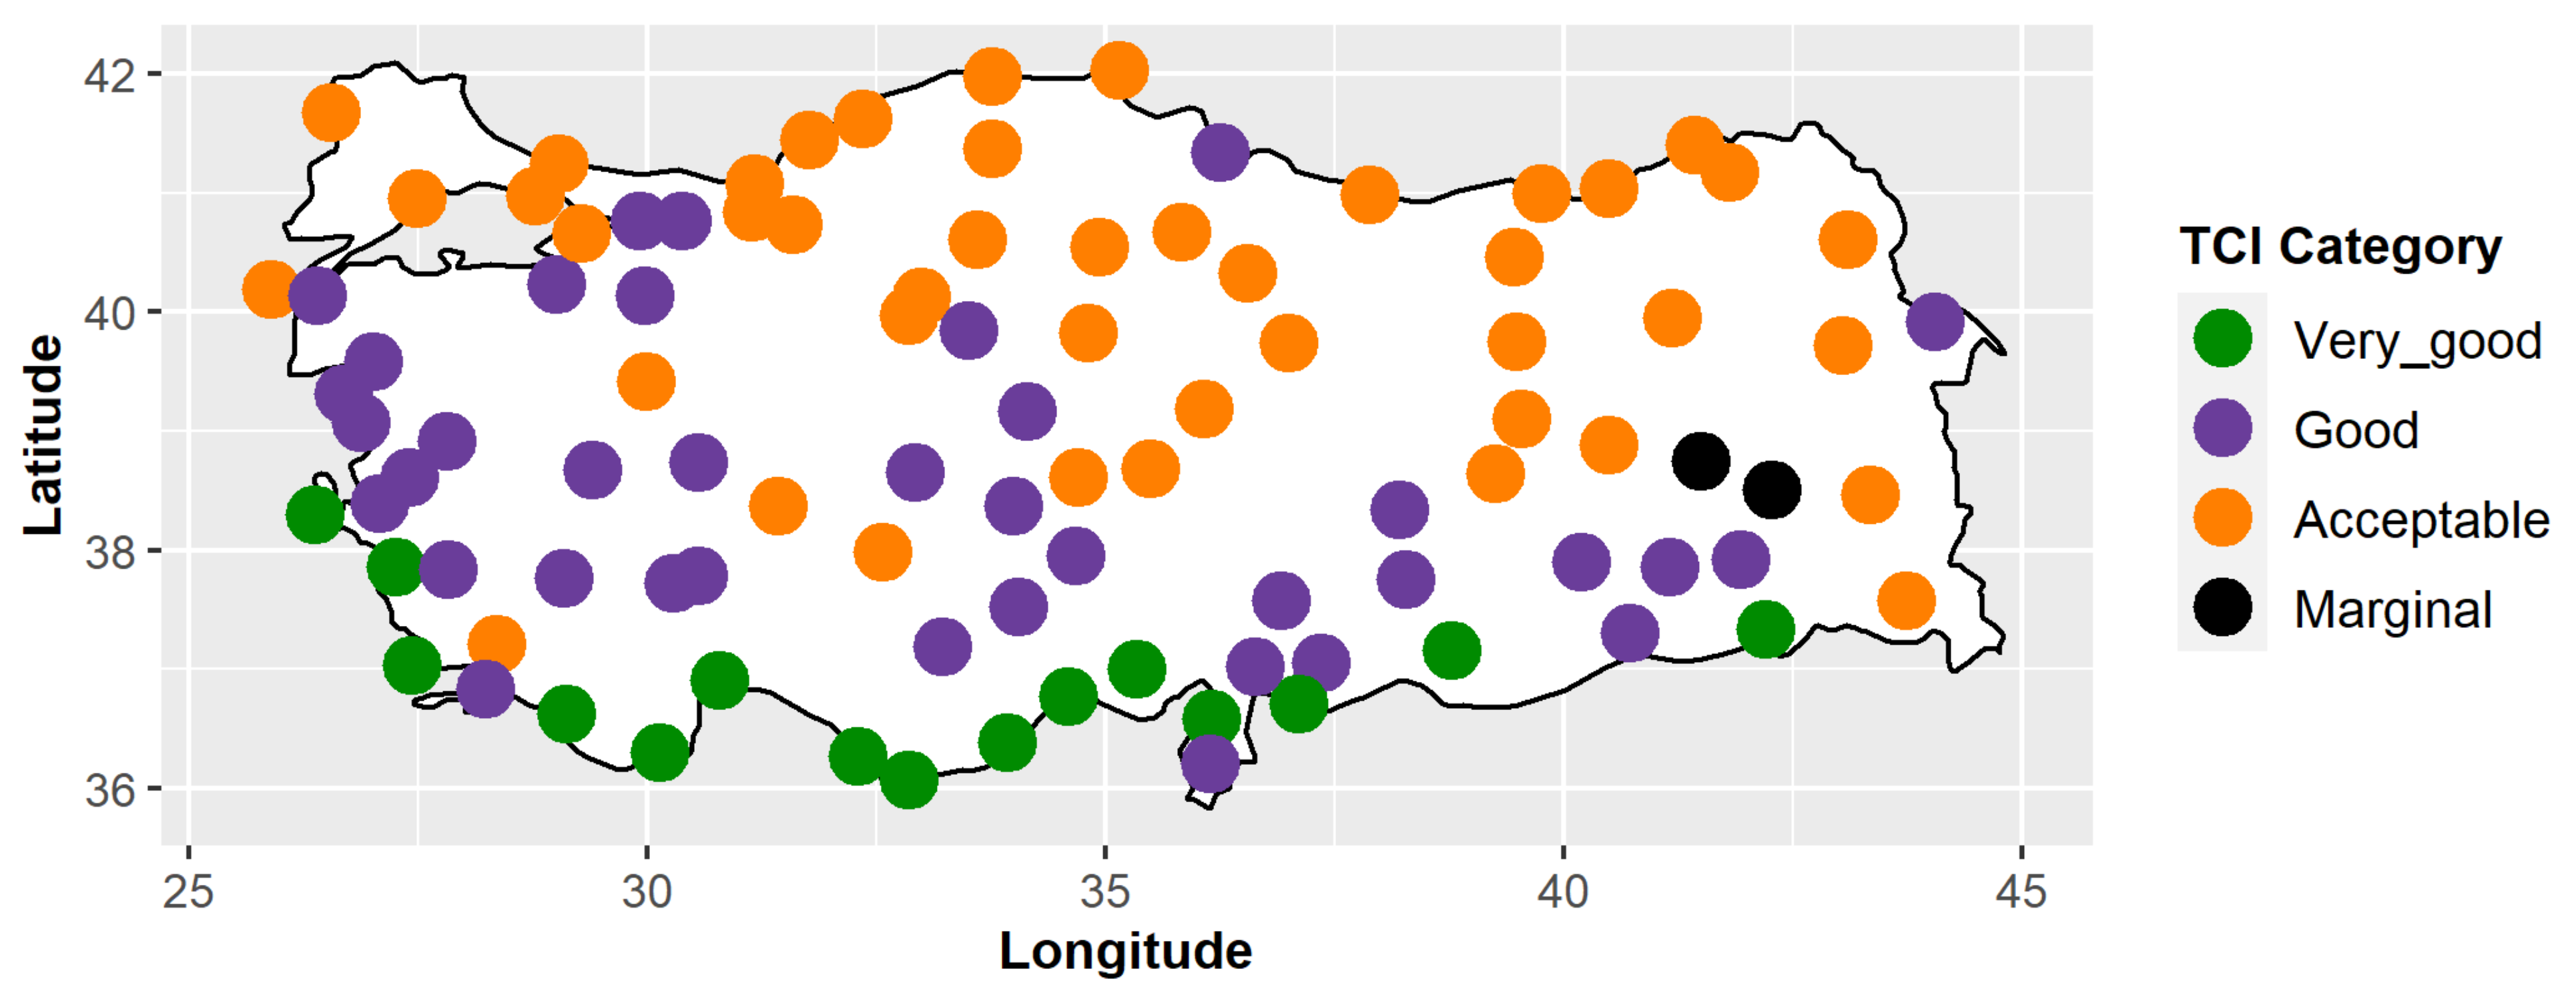
3.1.1. Winter
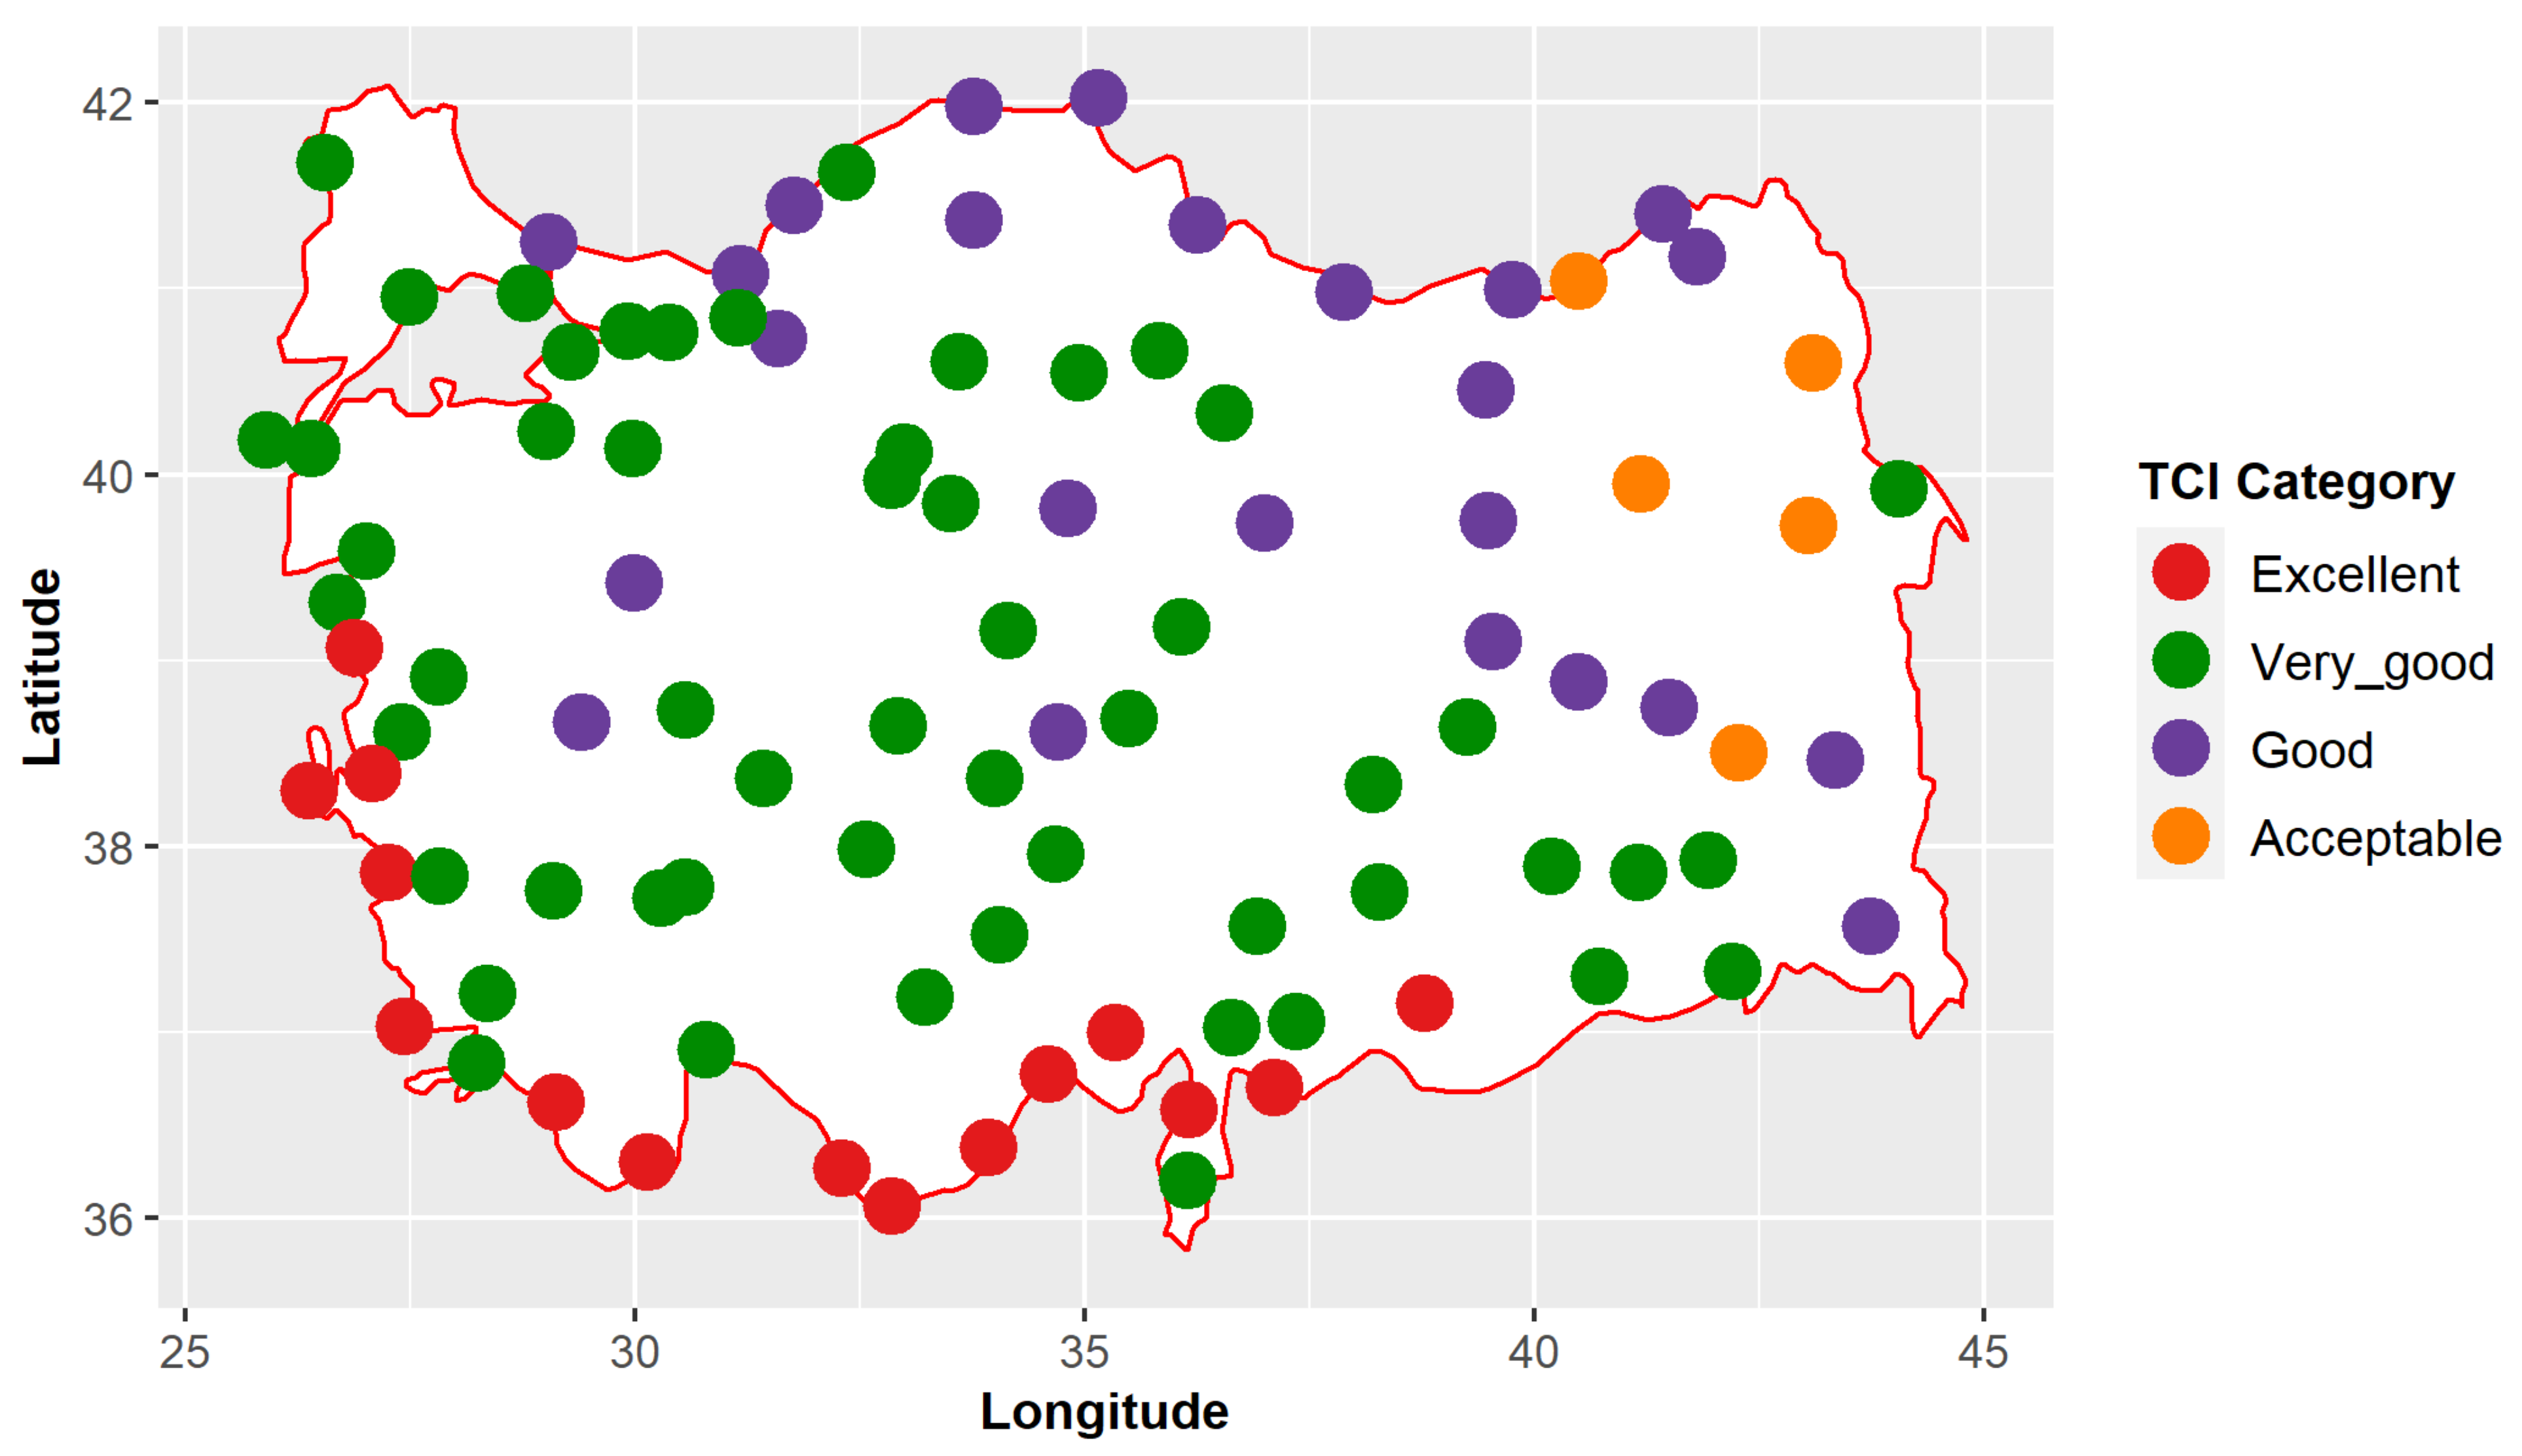
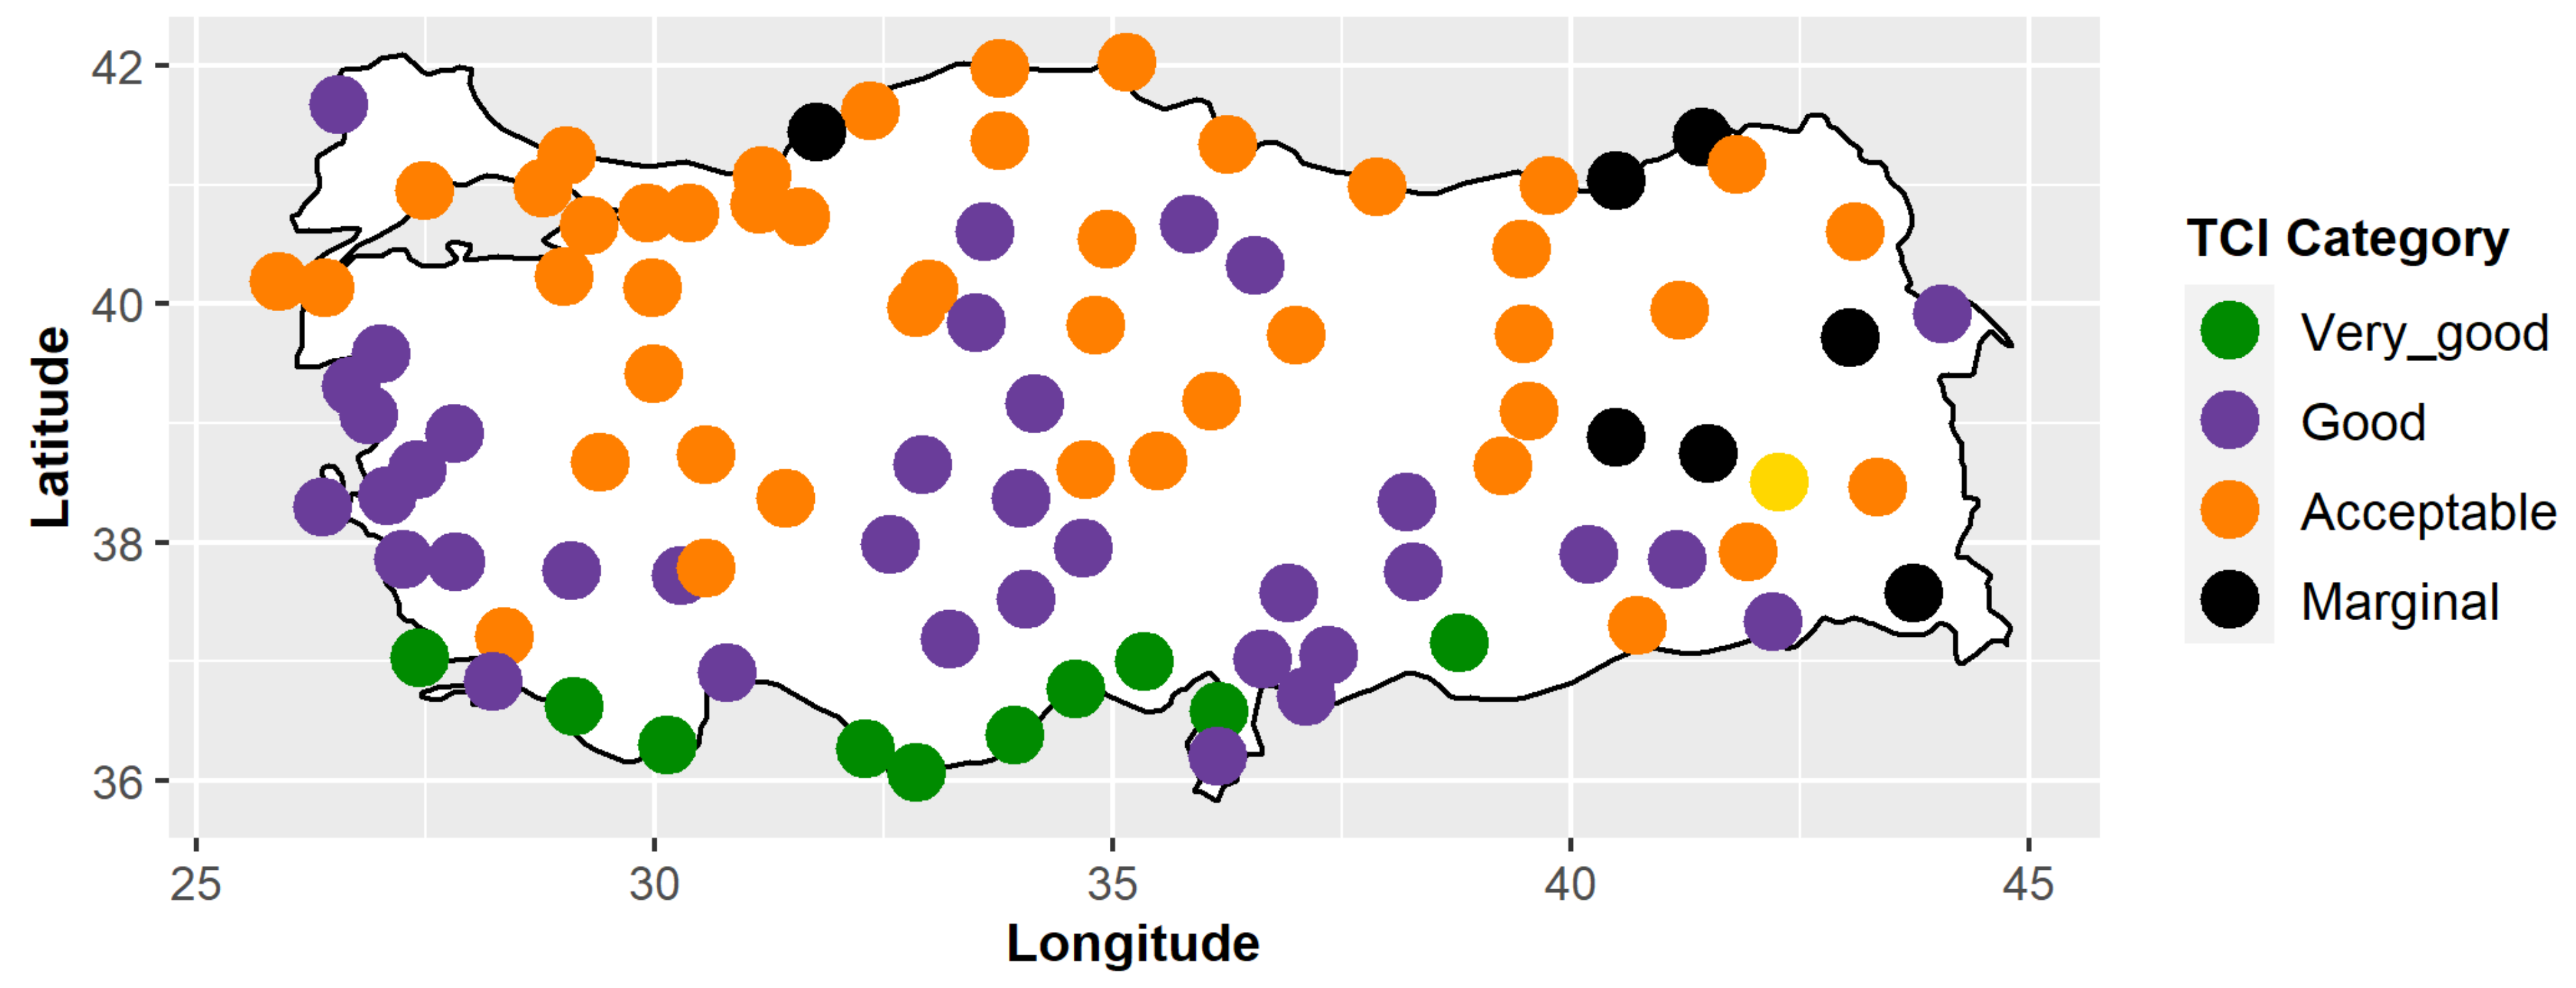
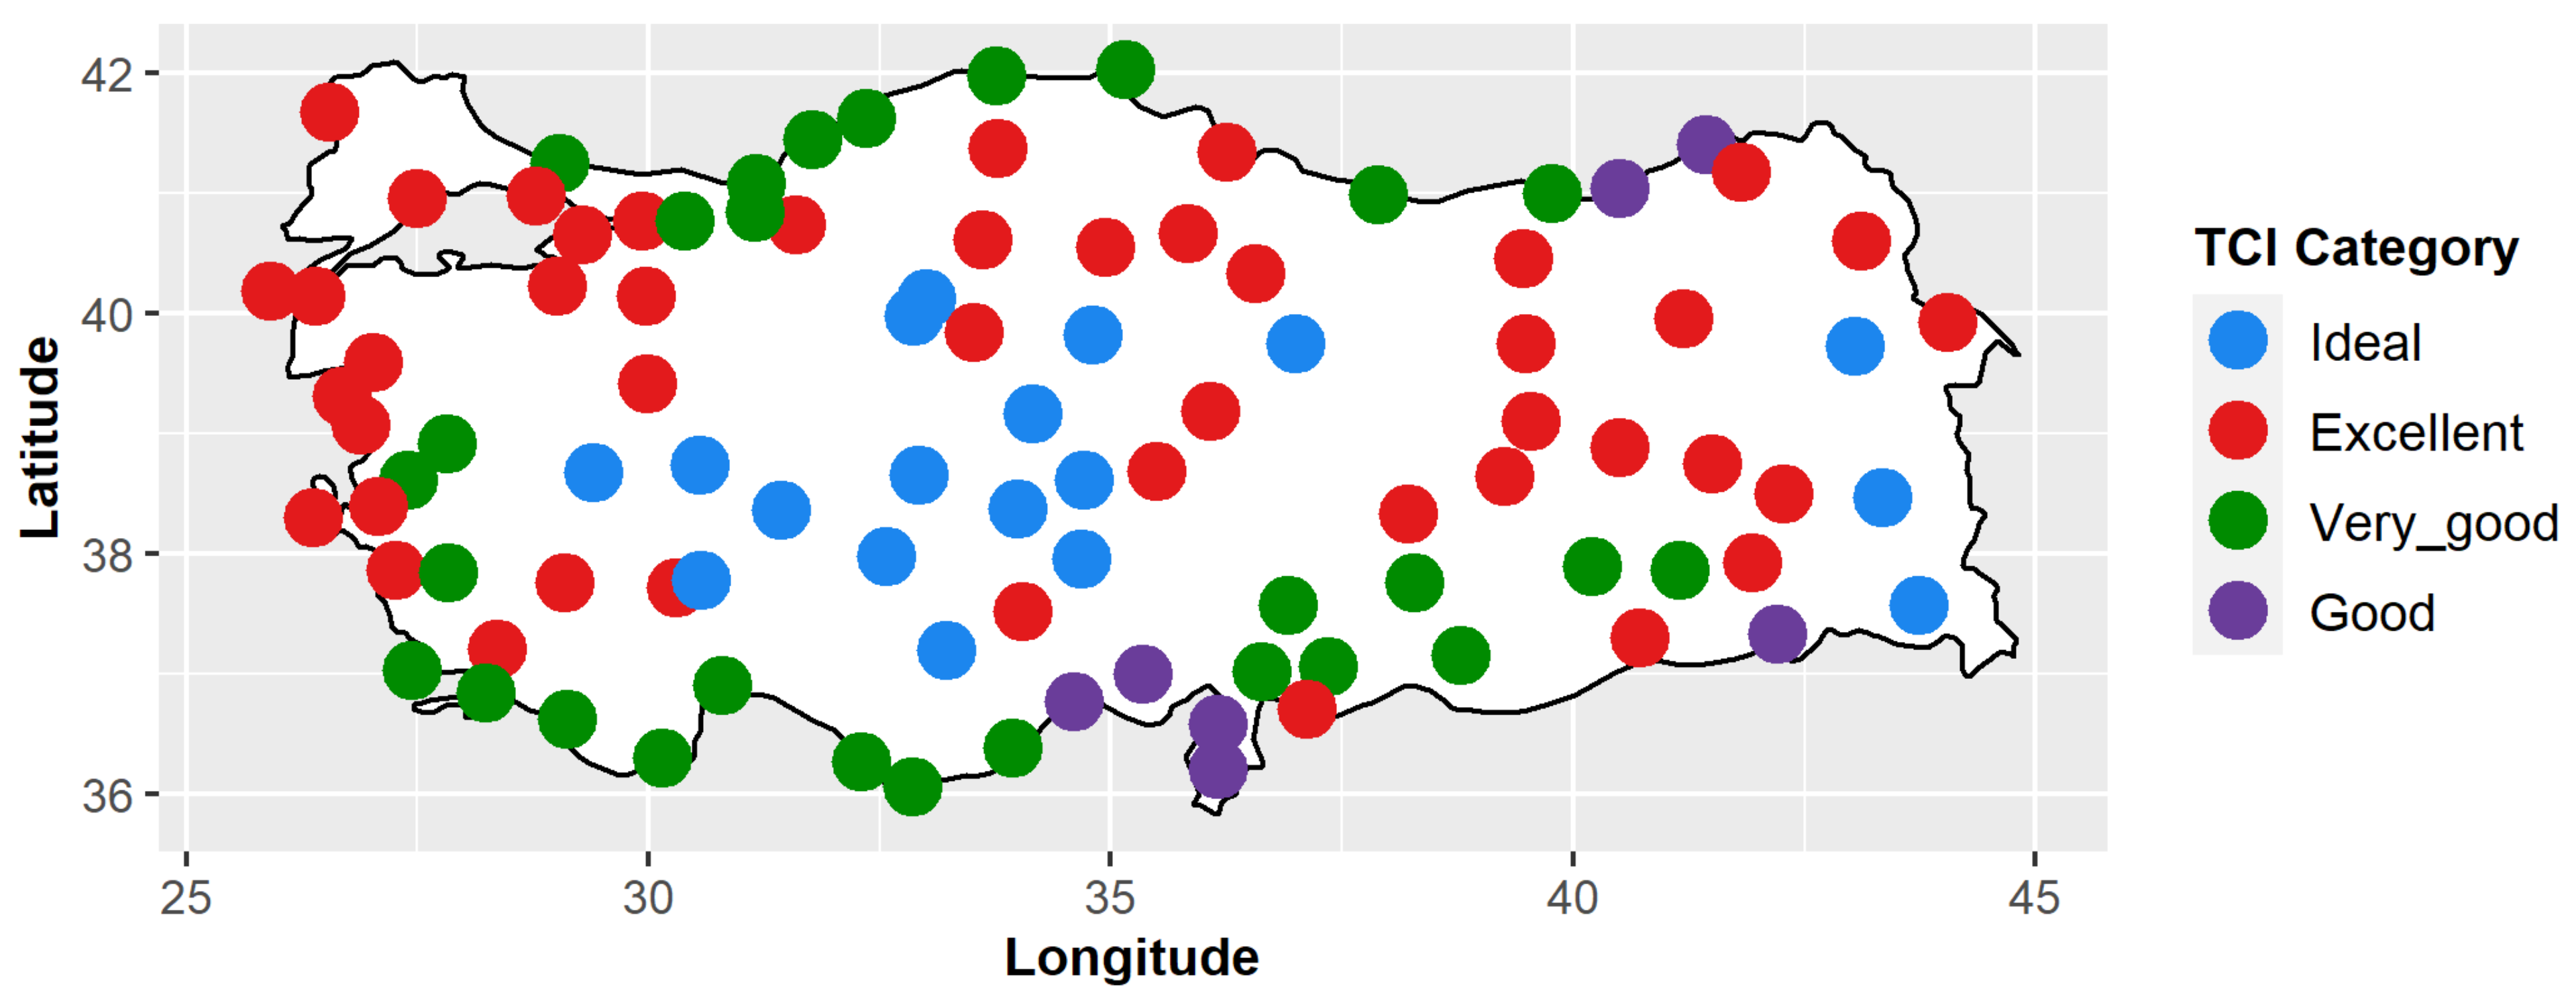
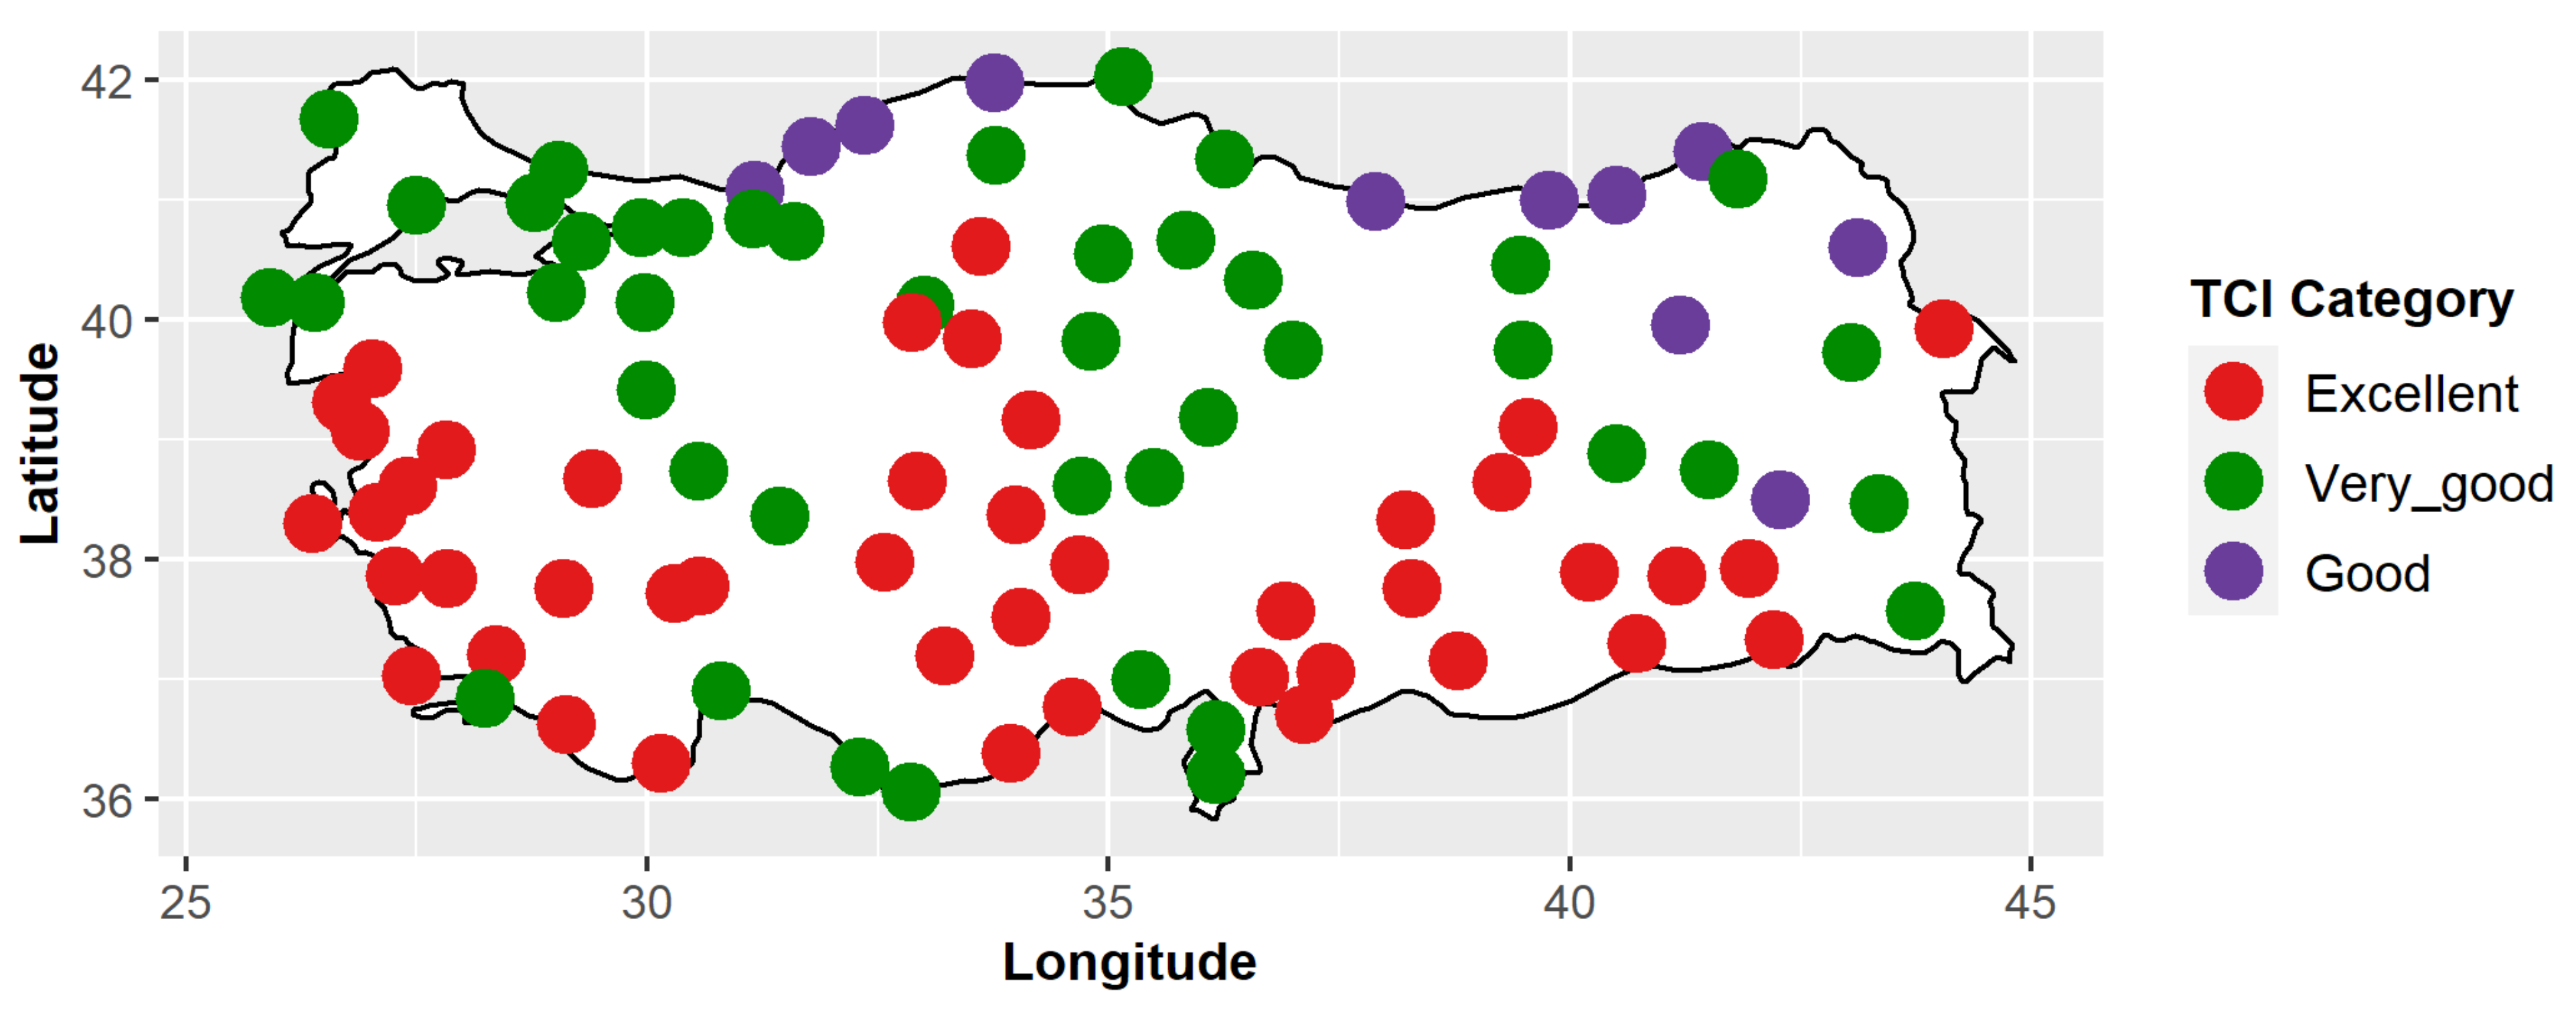
3.1.2. Spring
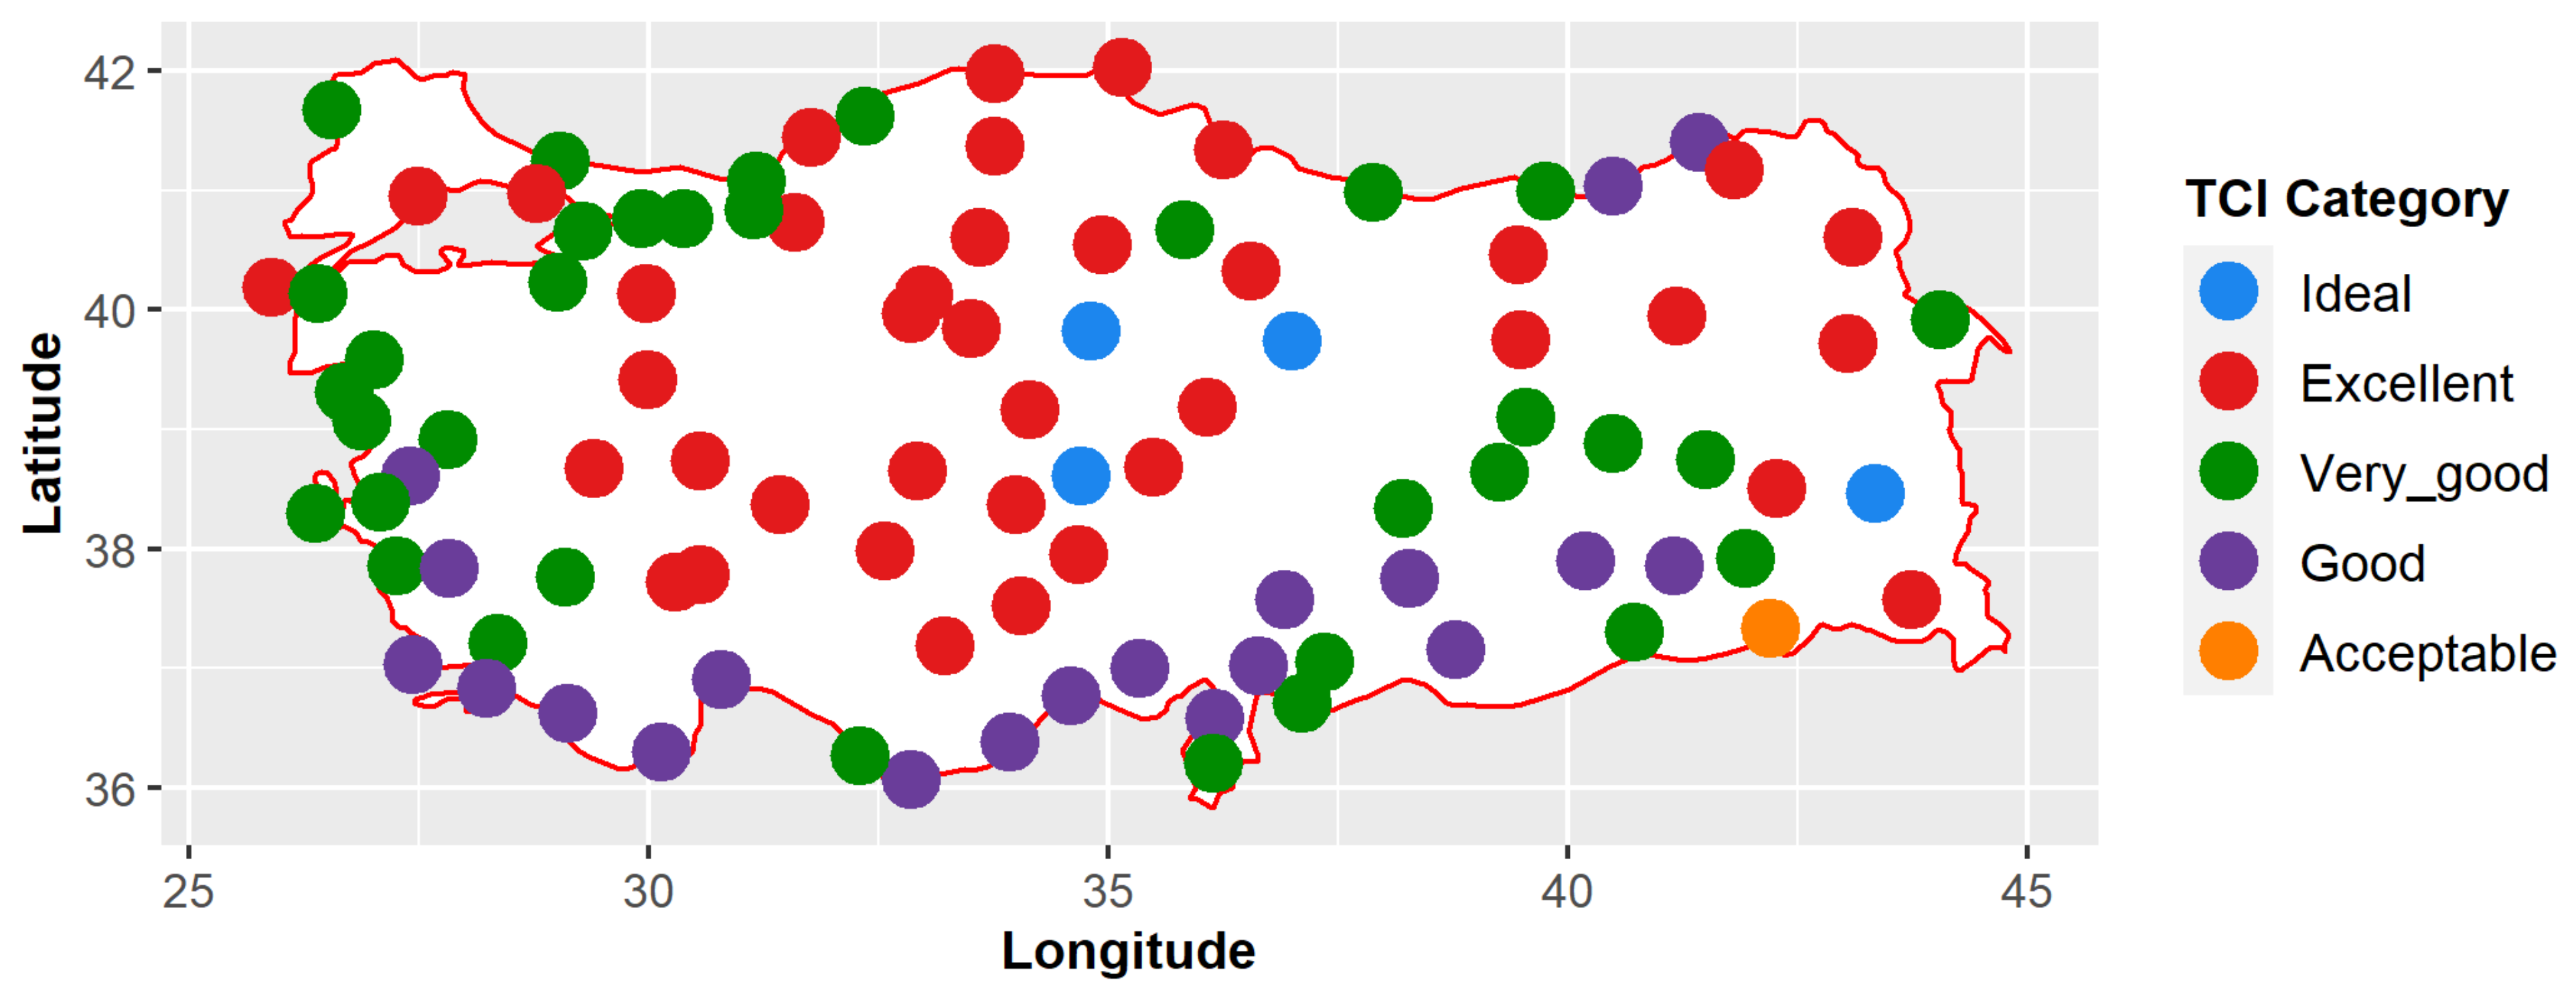
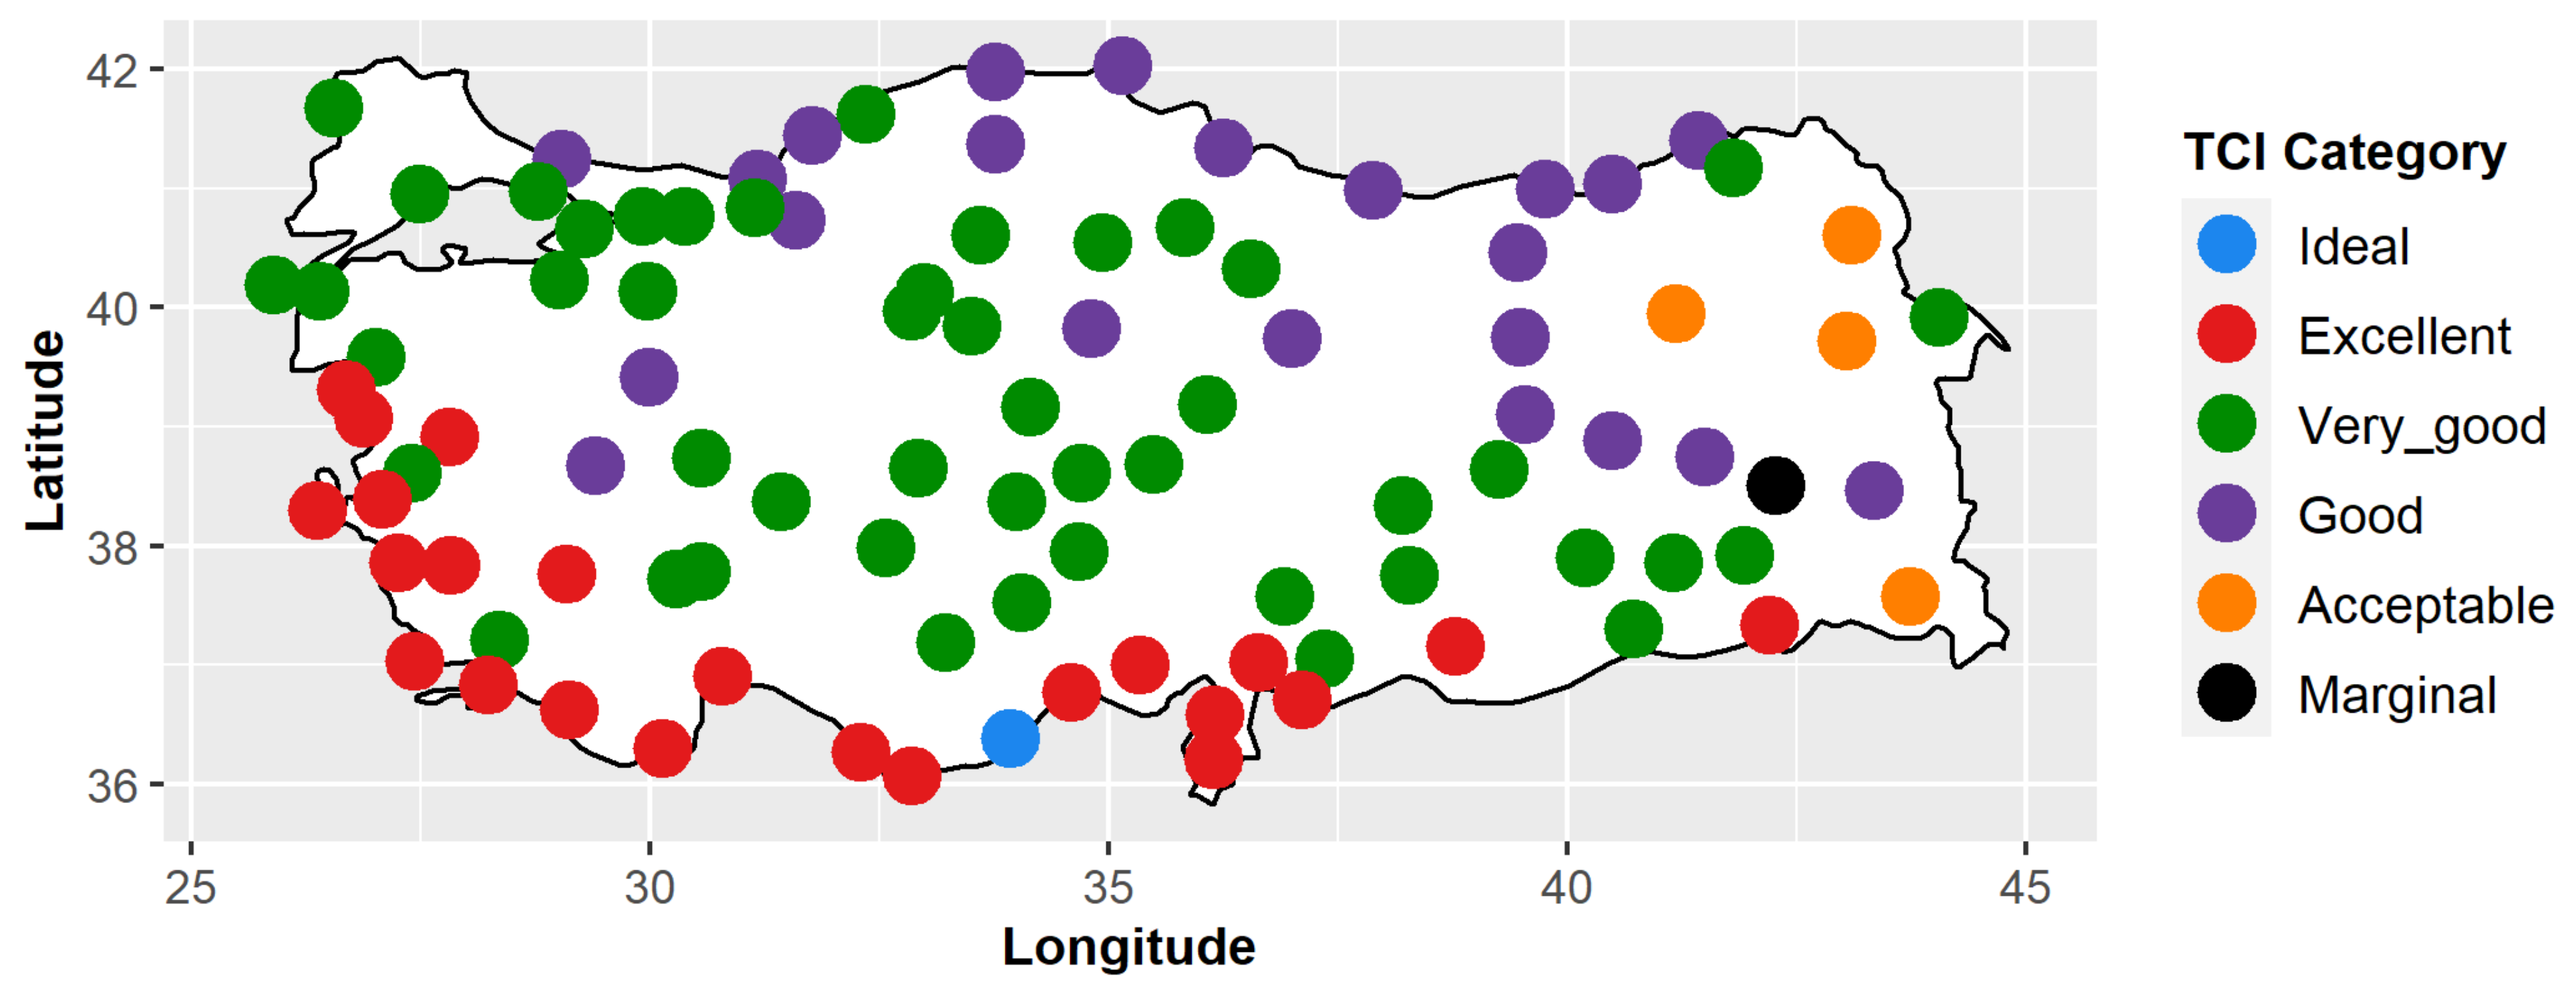
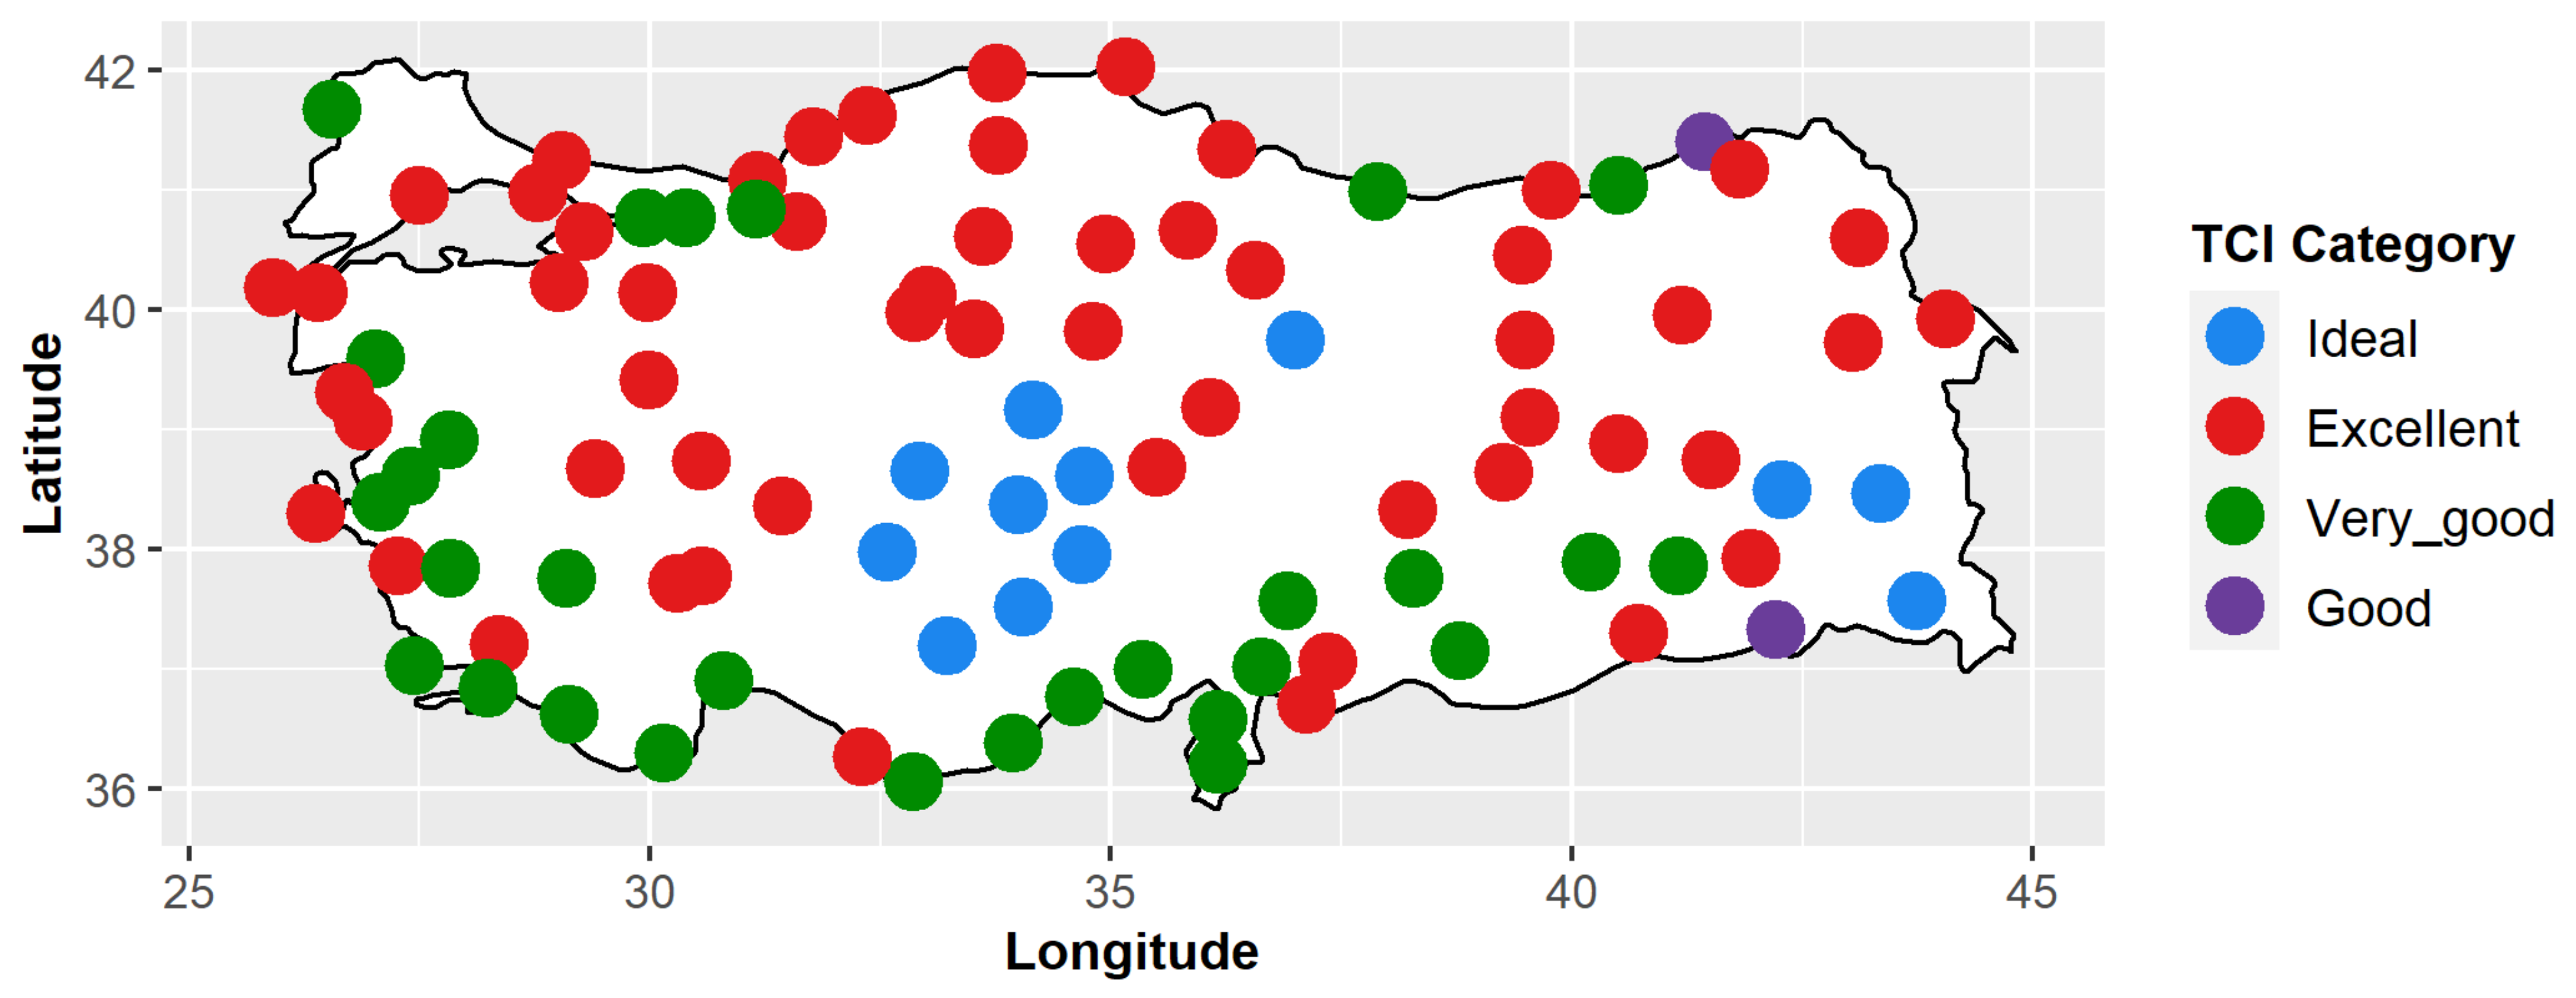
3.1.3. Summer
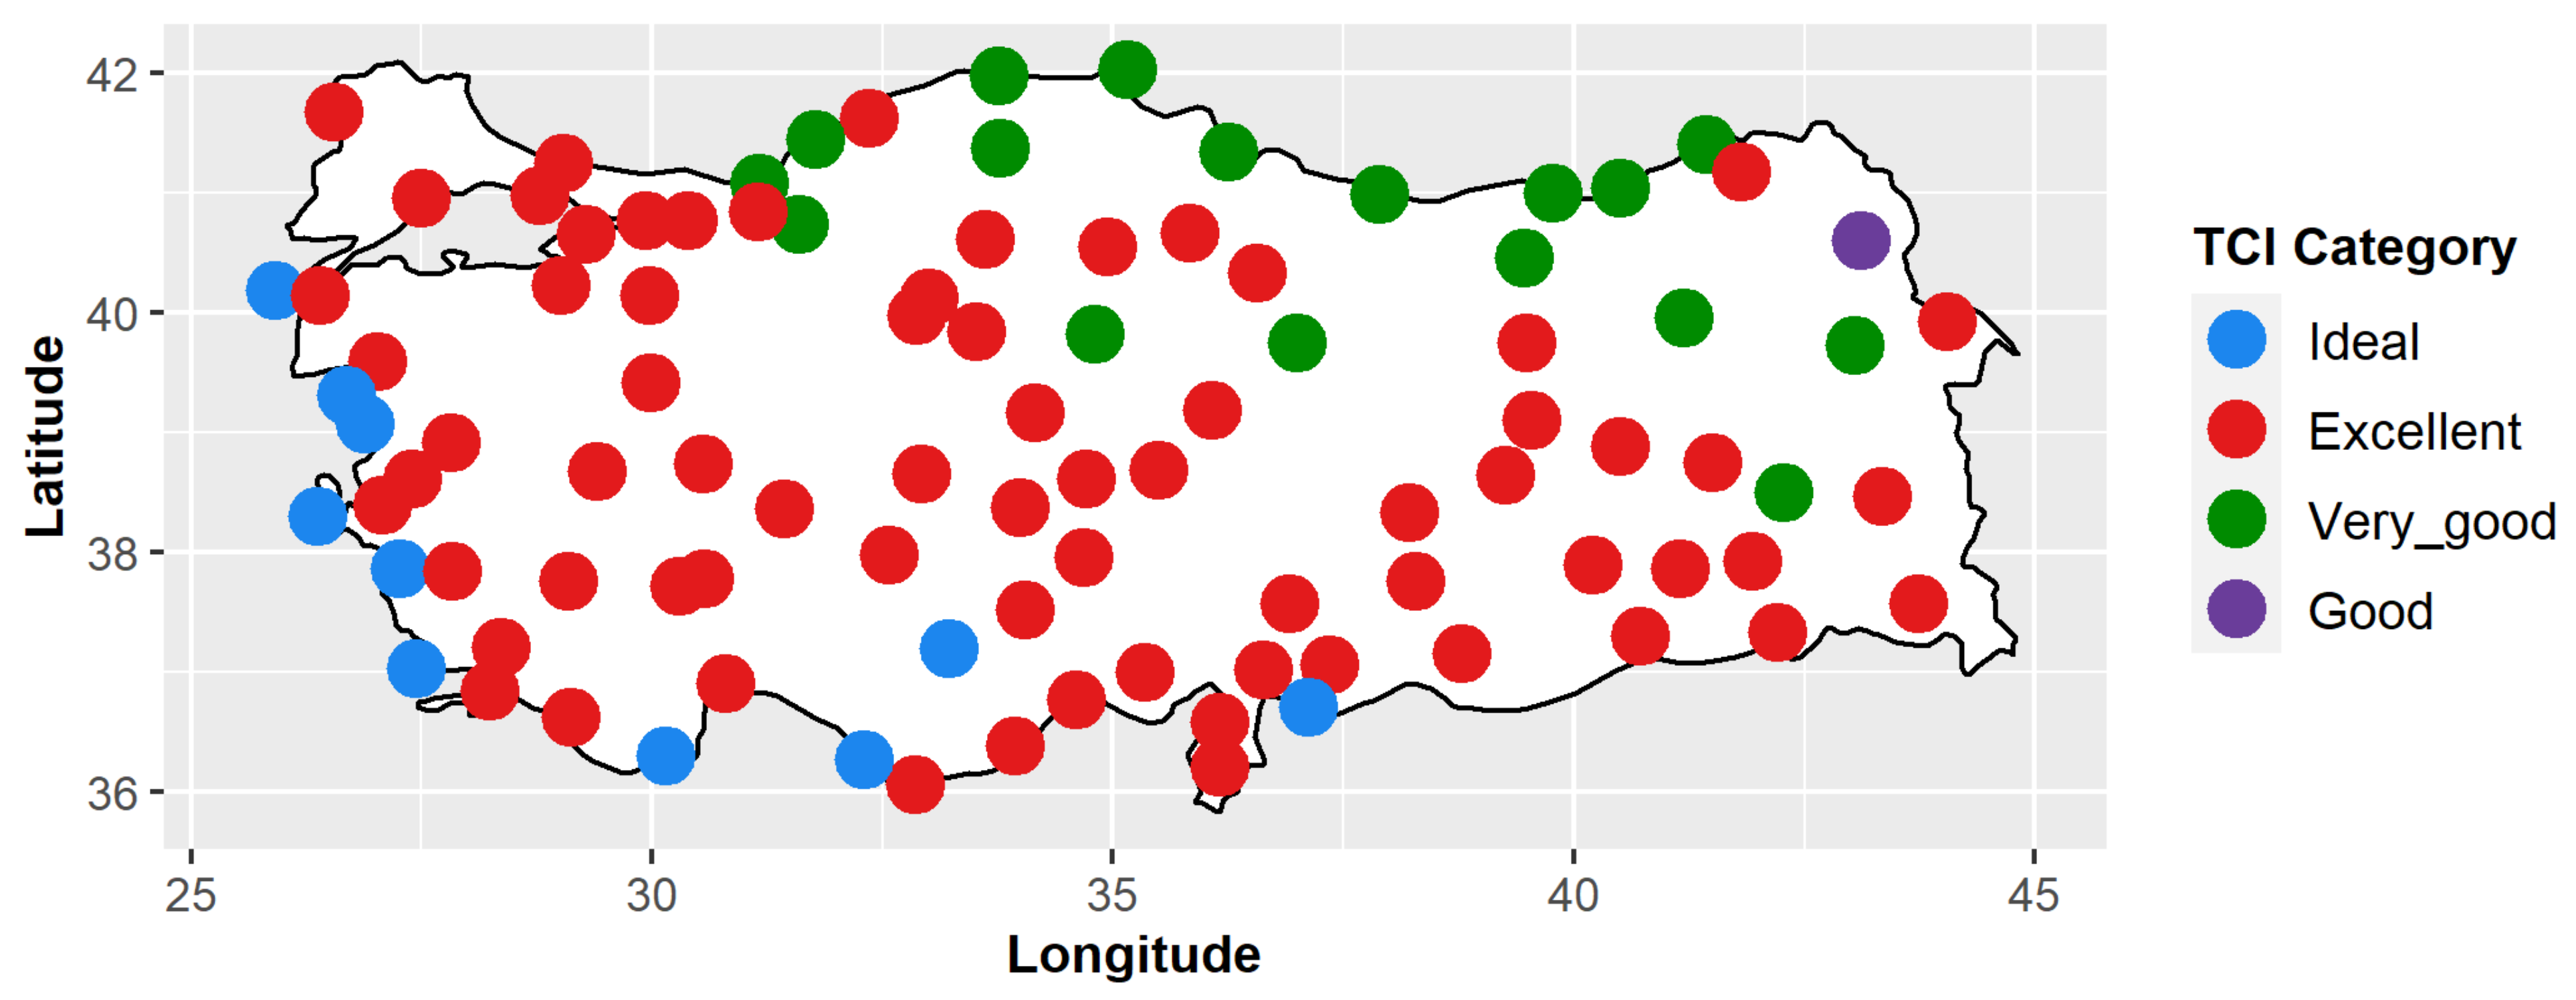
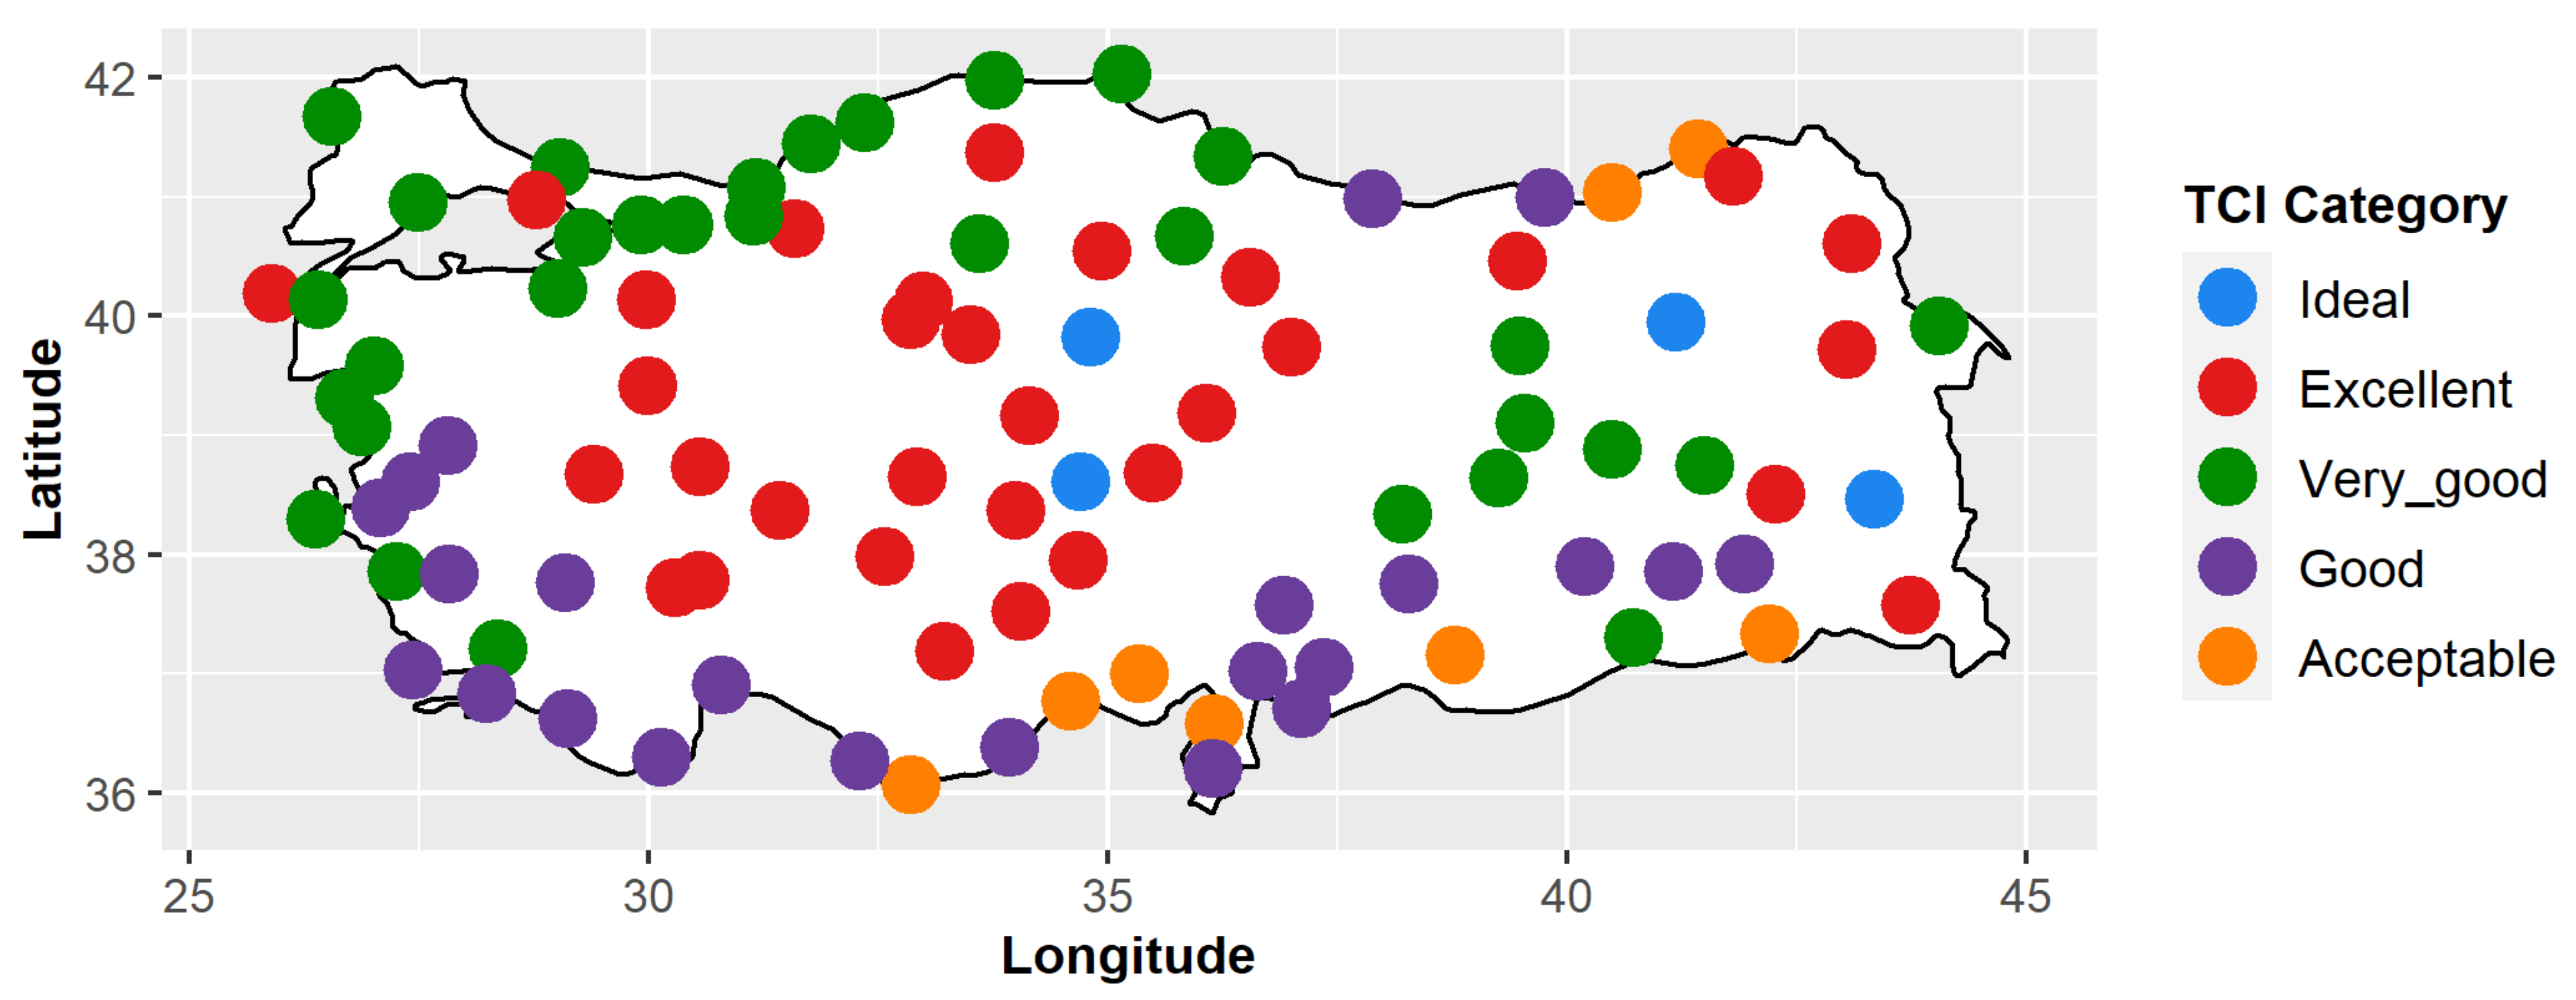
3.1.4. Autumn
3.2. Trend Analysis
3.2.1. Winter
3.2.2. Spring
3.2.3. Summer
3.2.4. Autumn
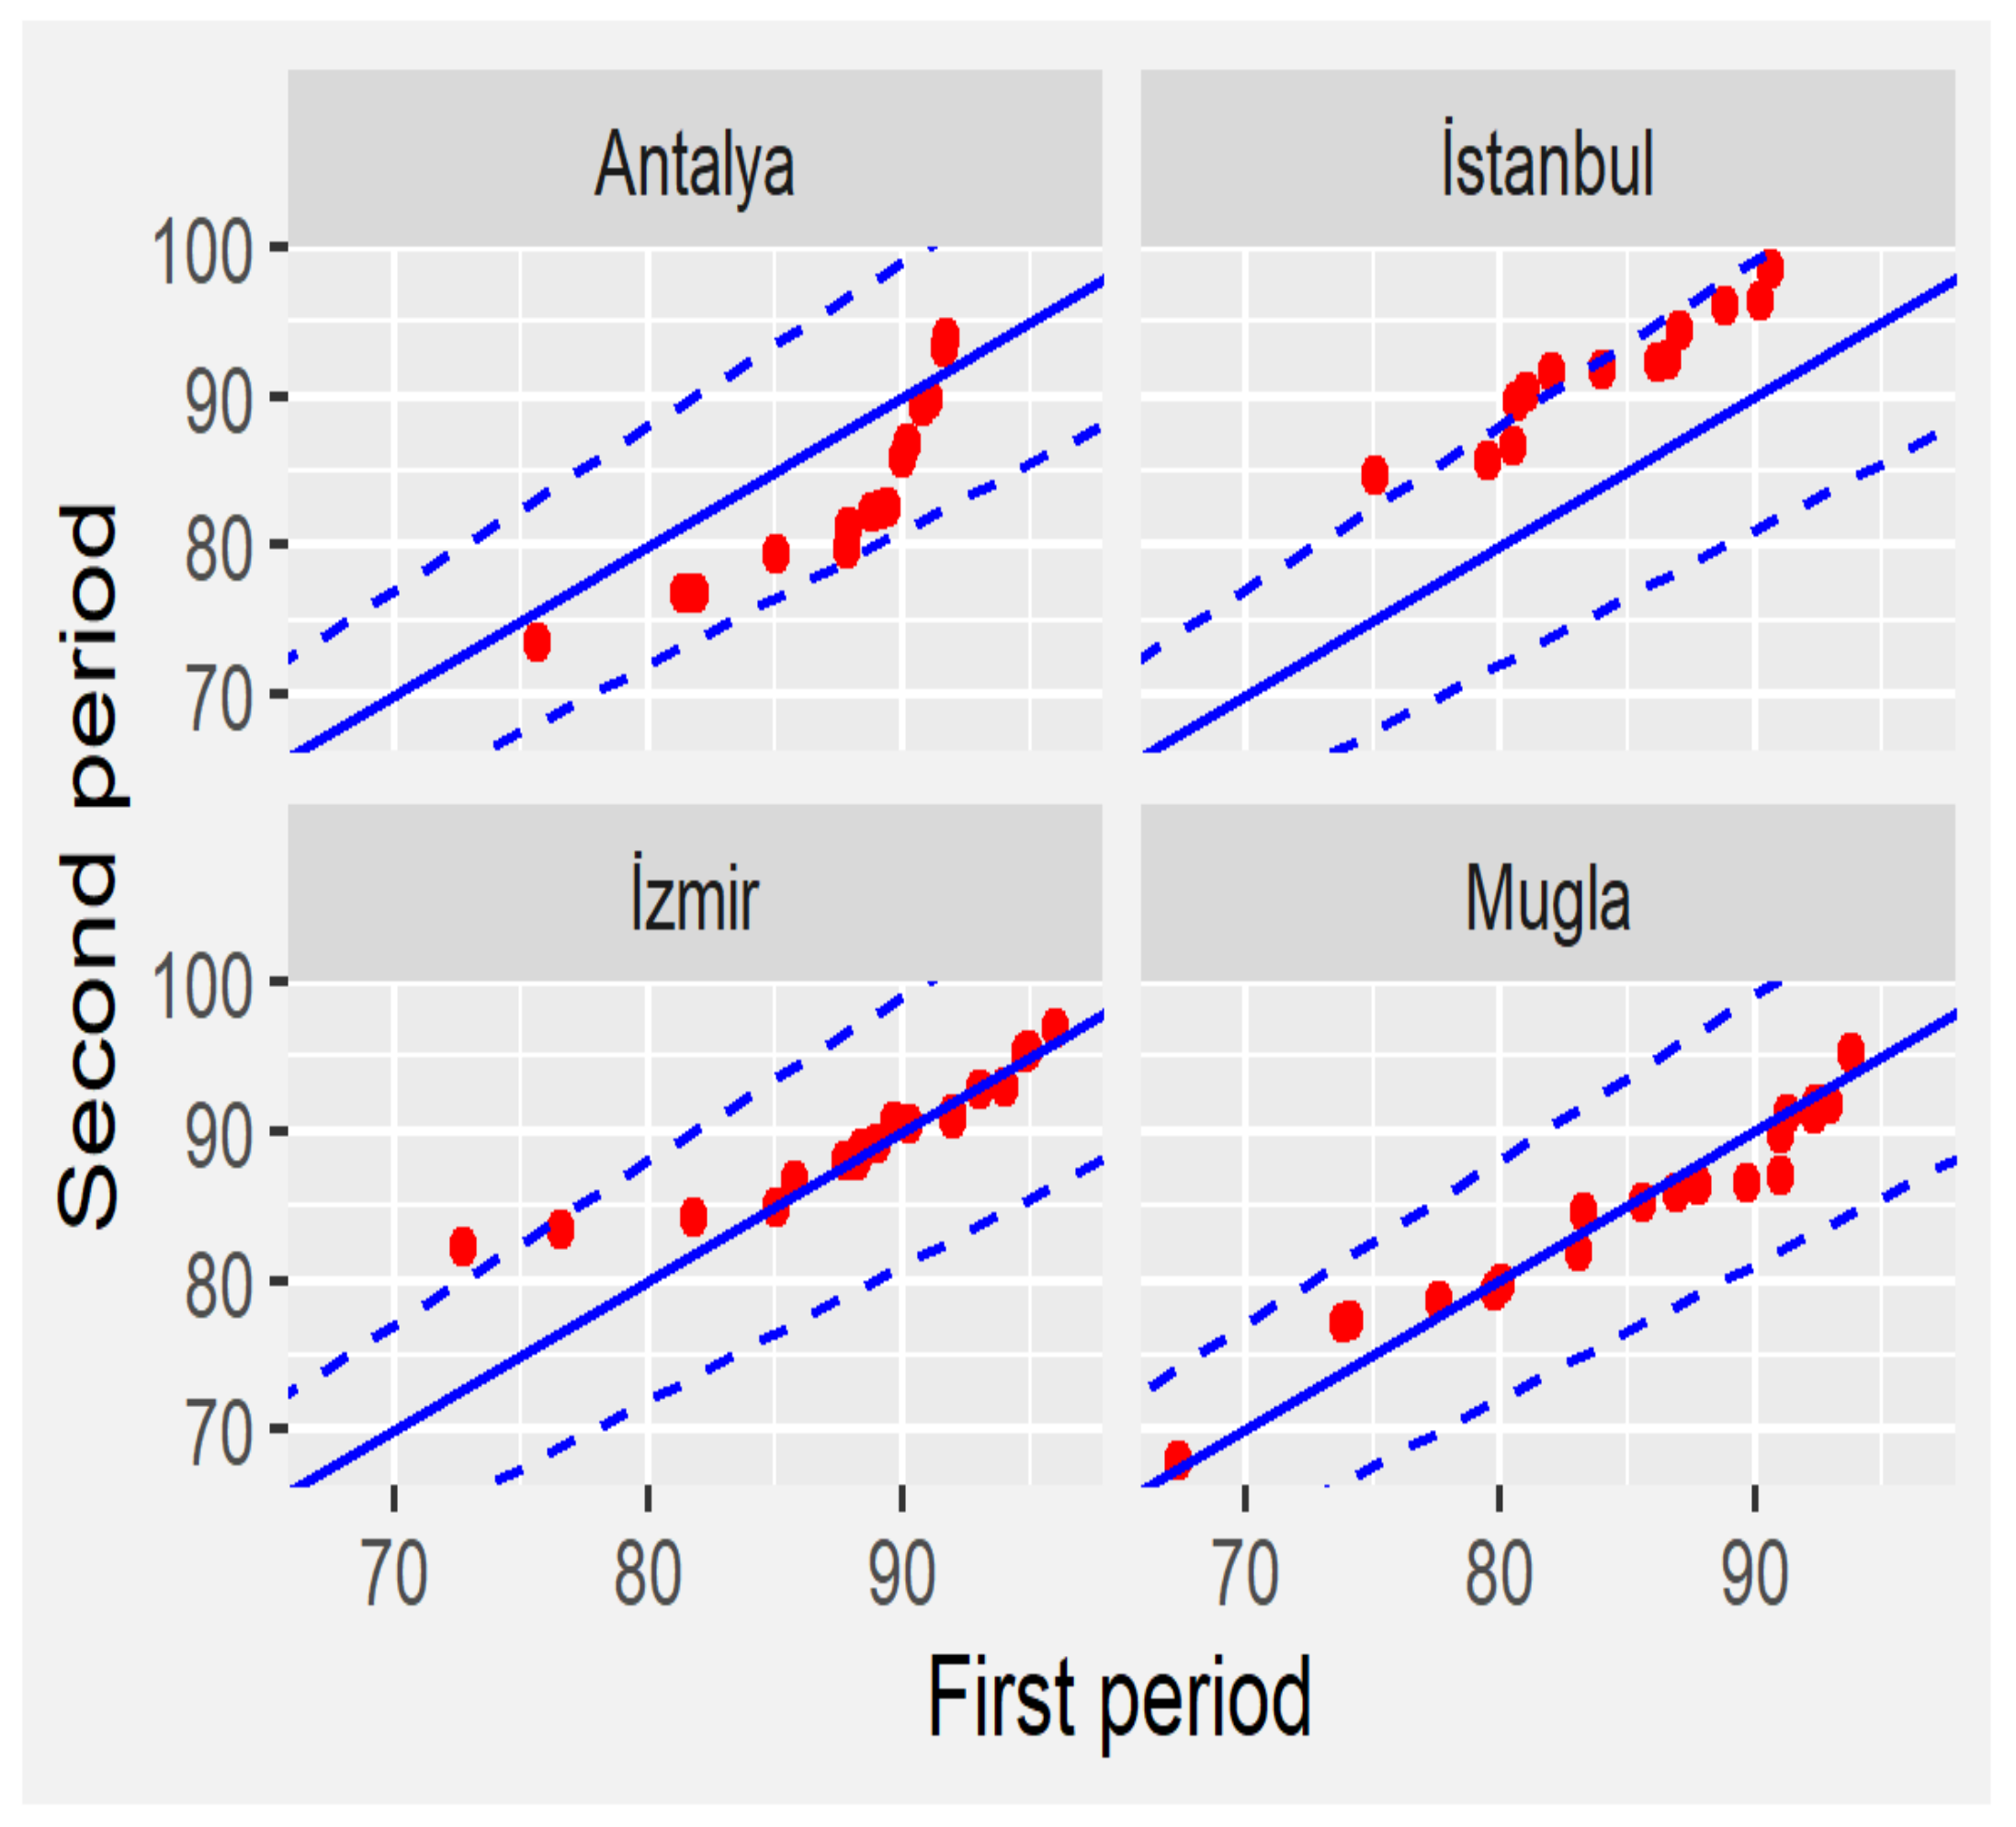
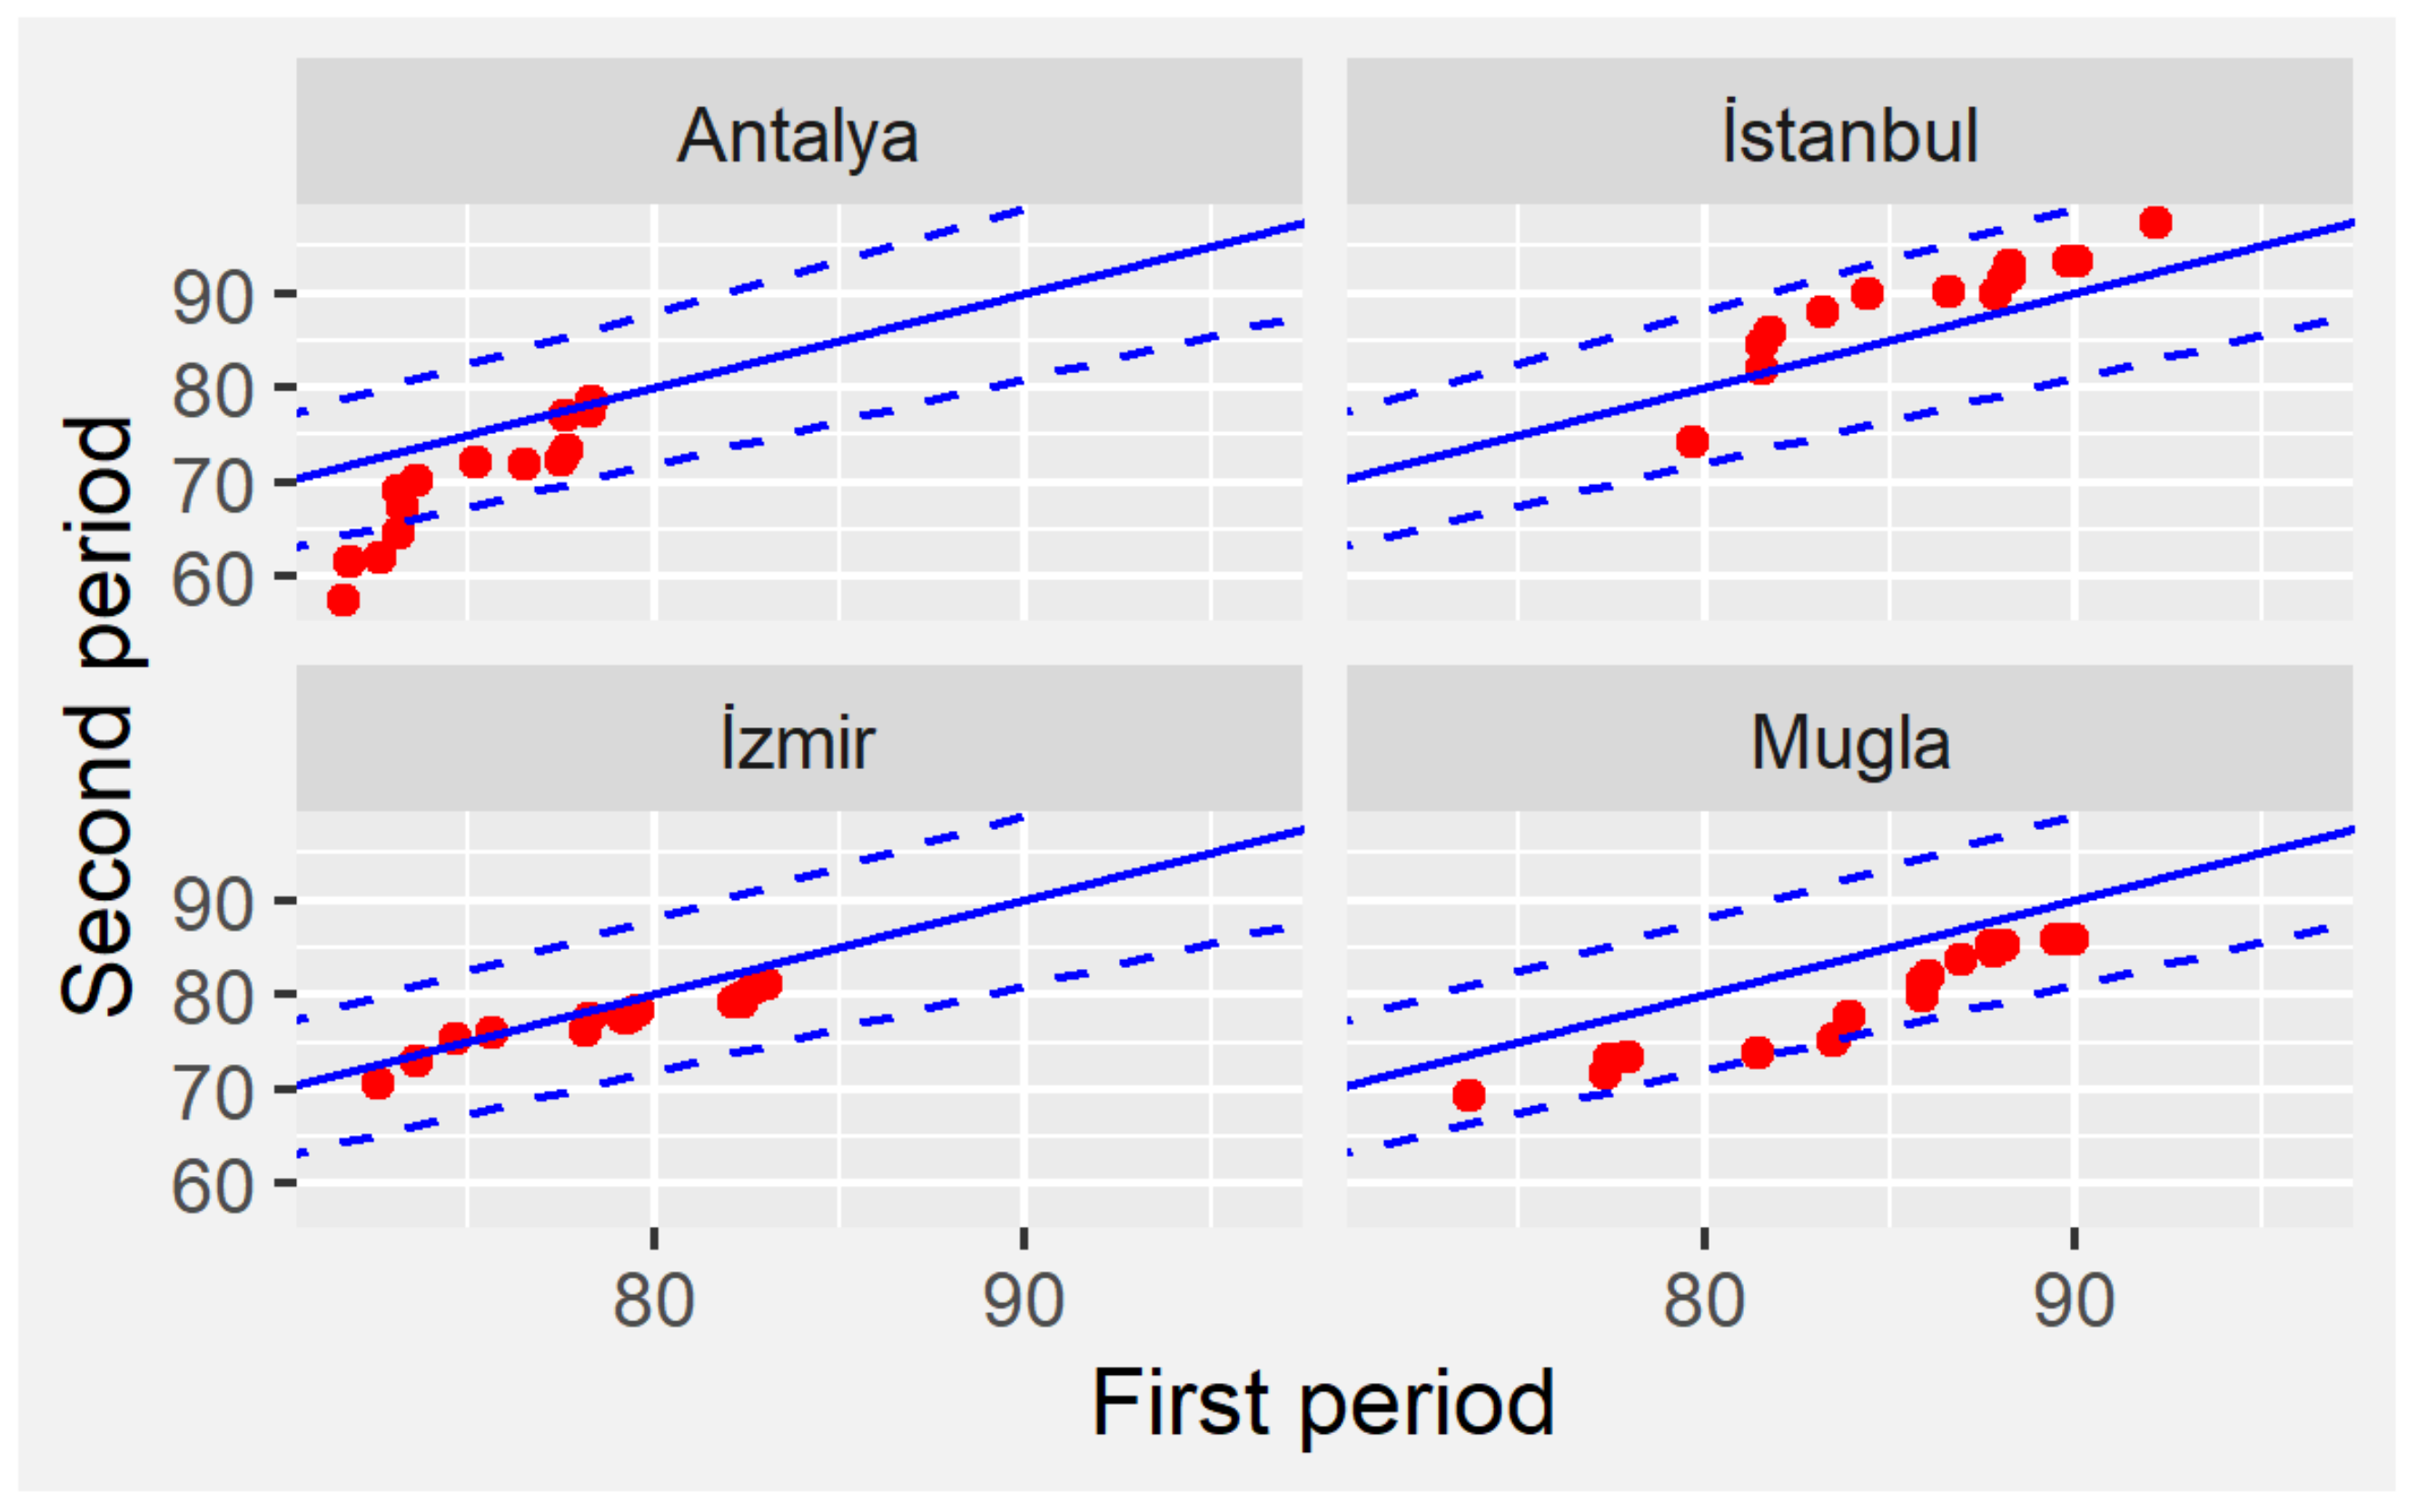
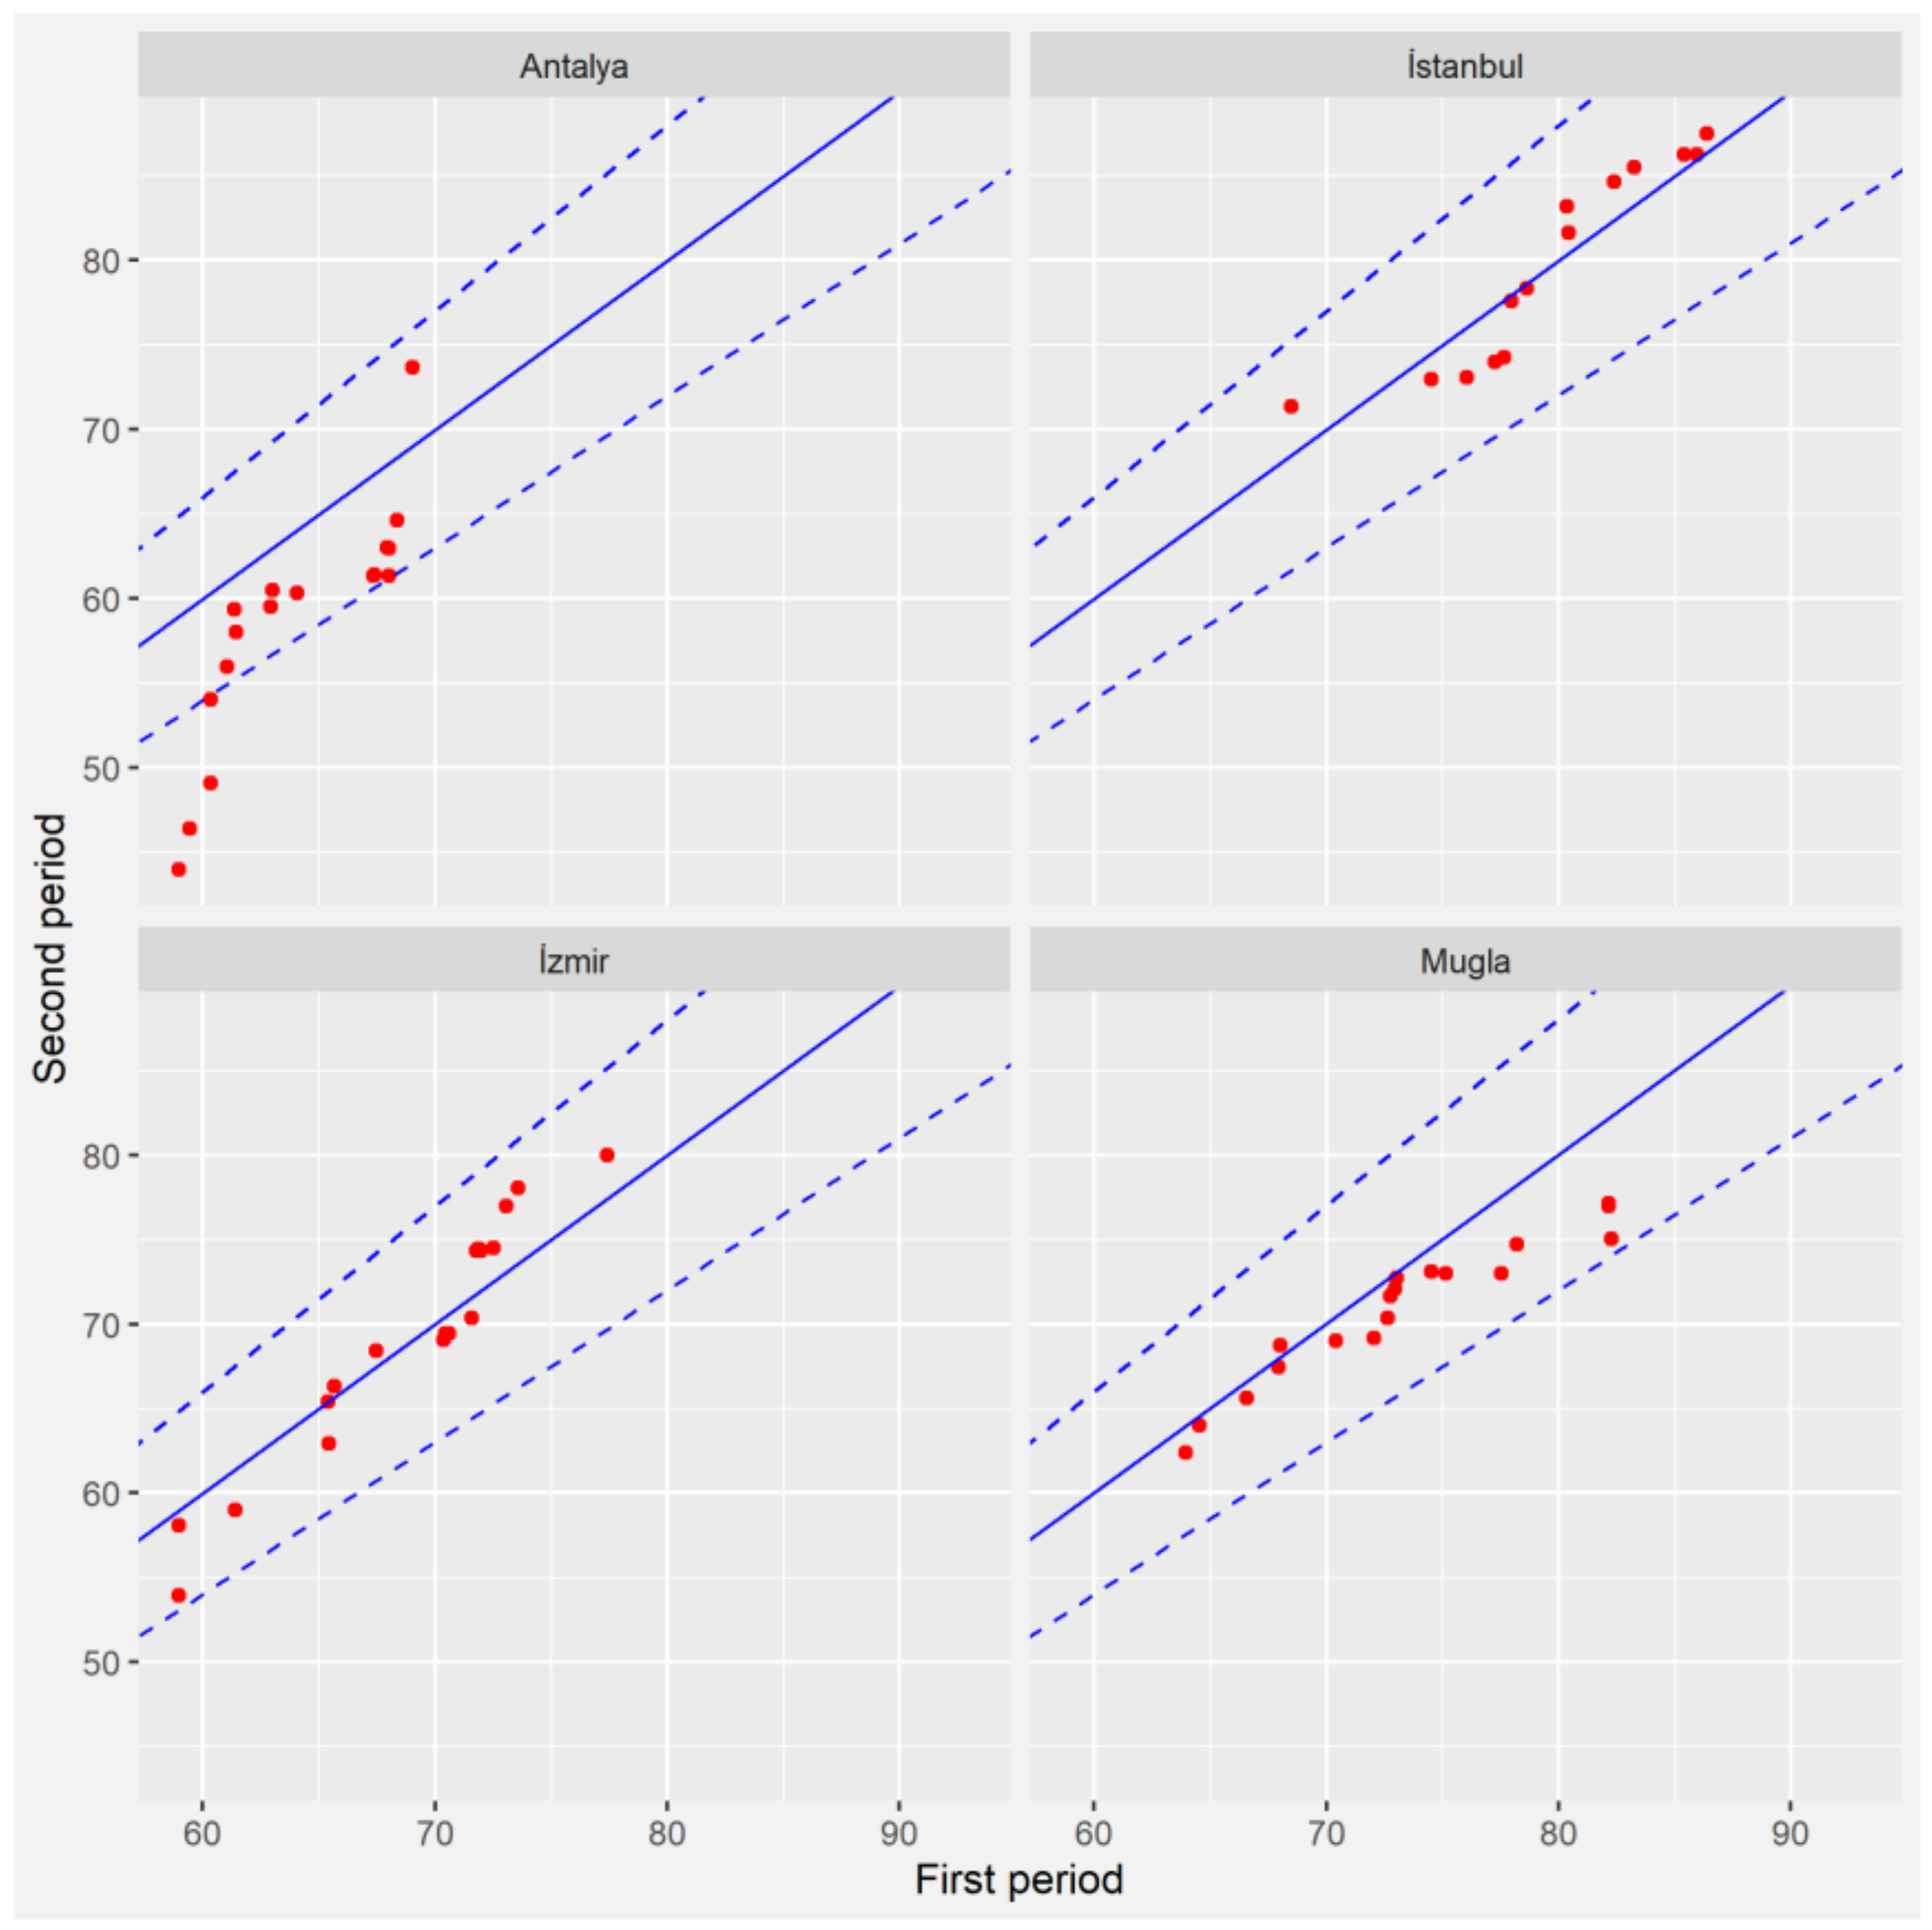
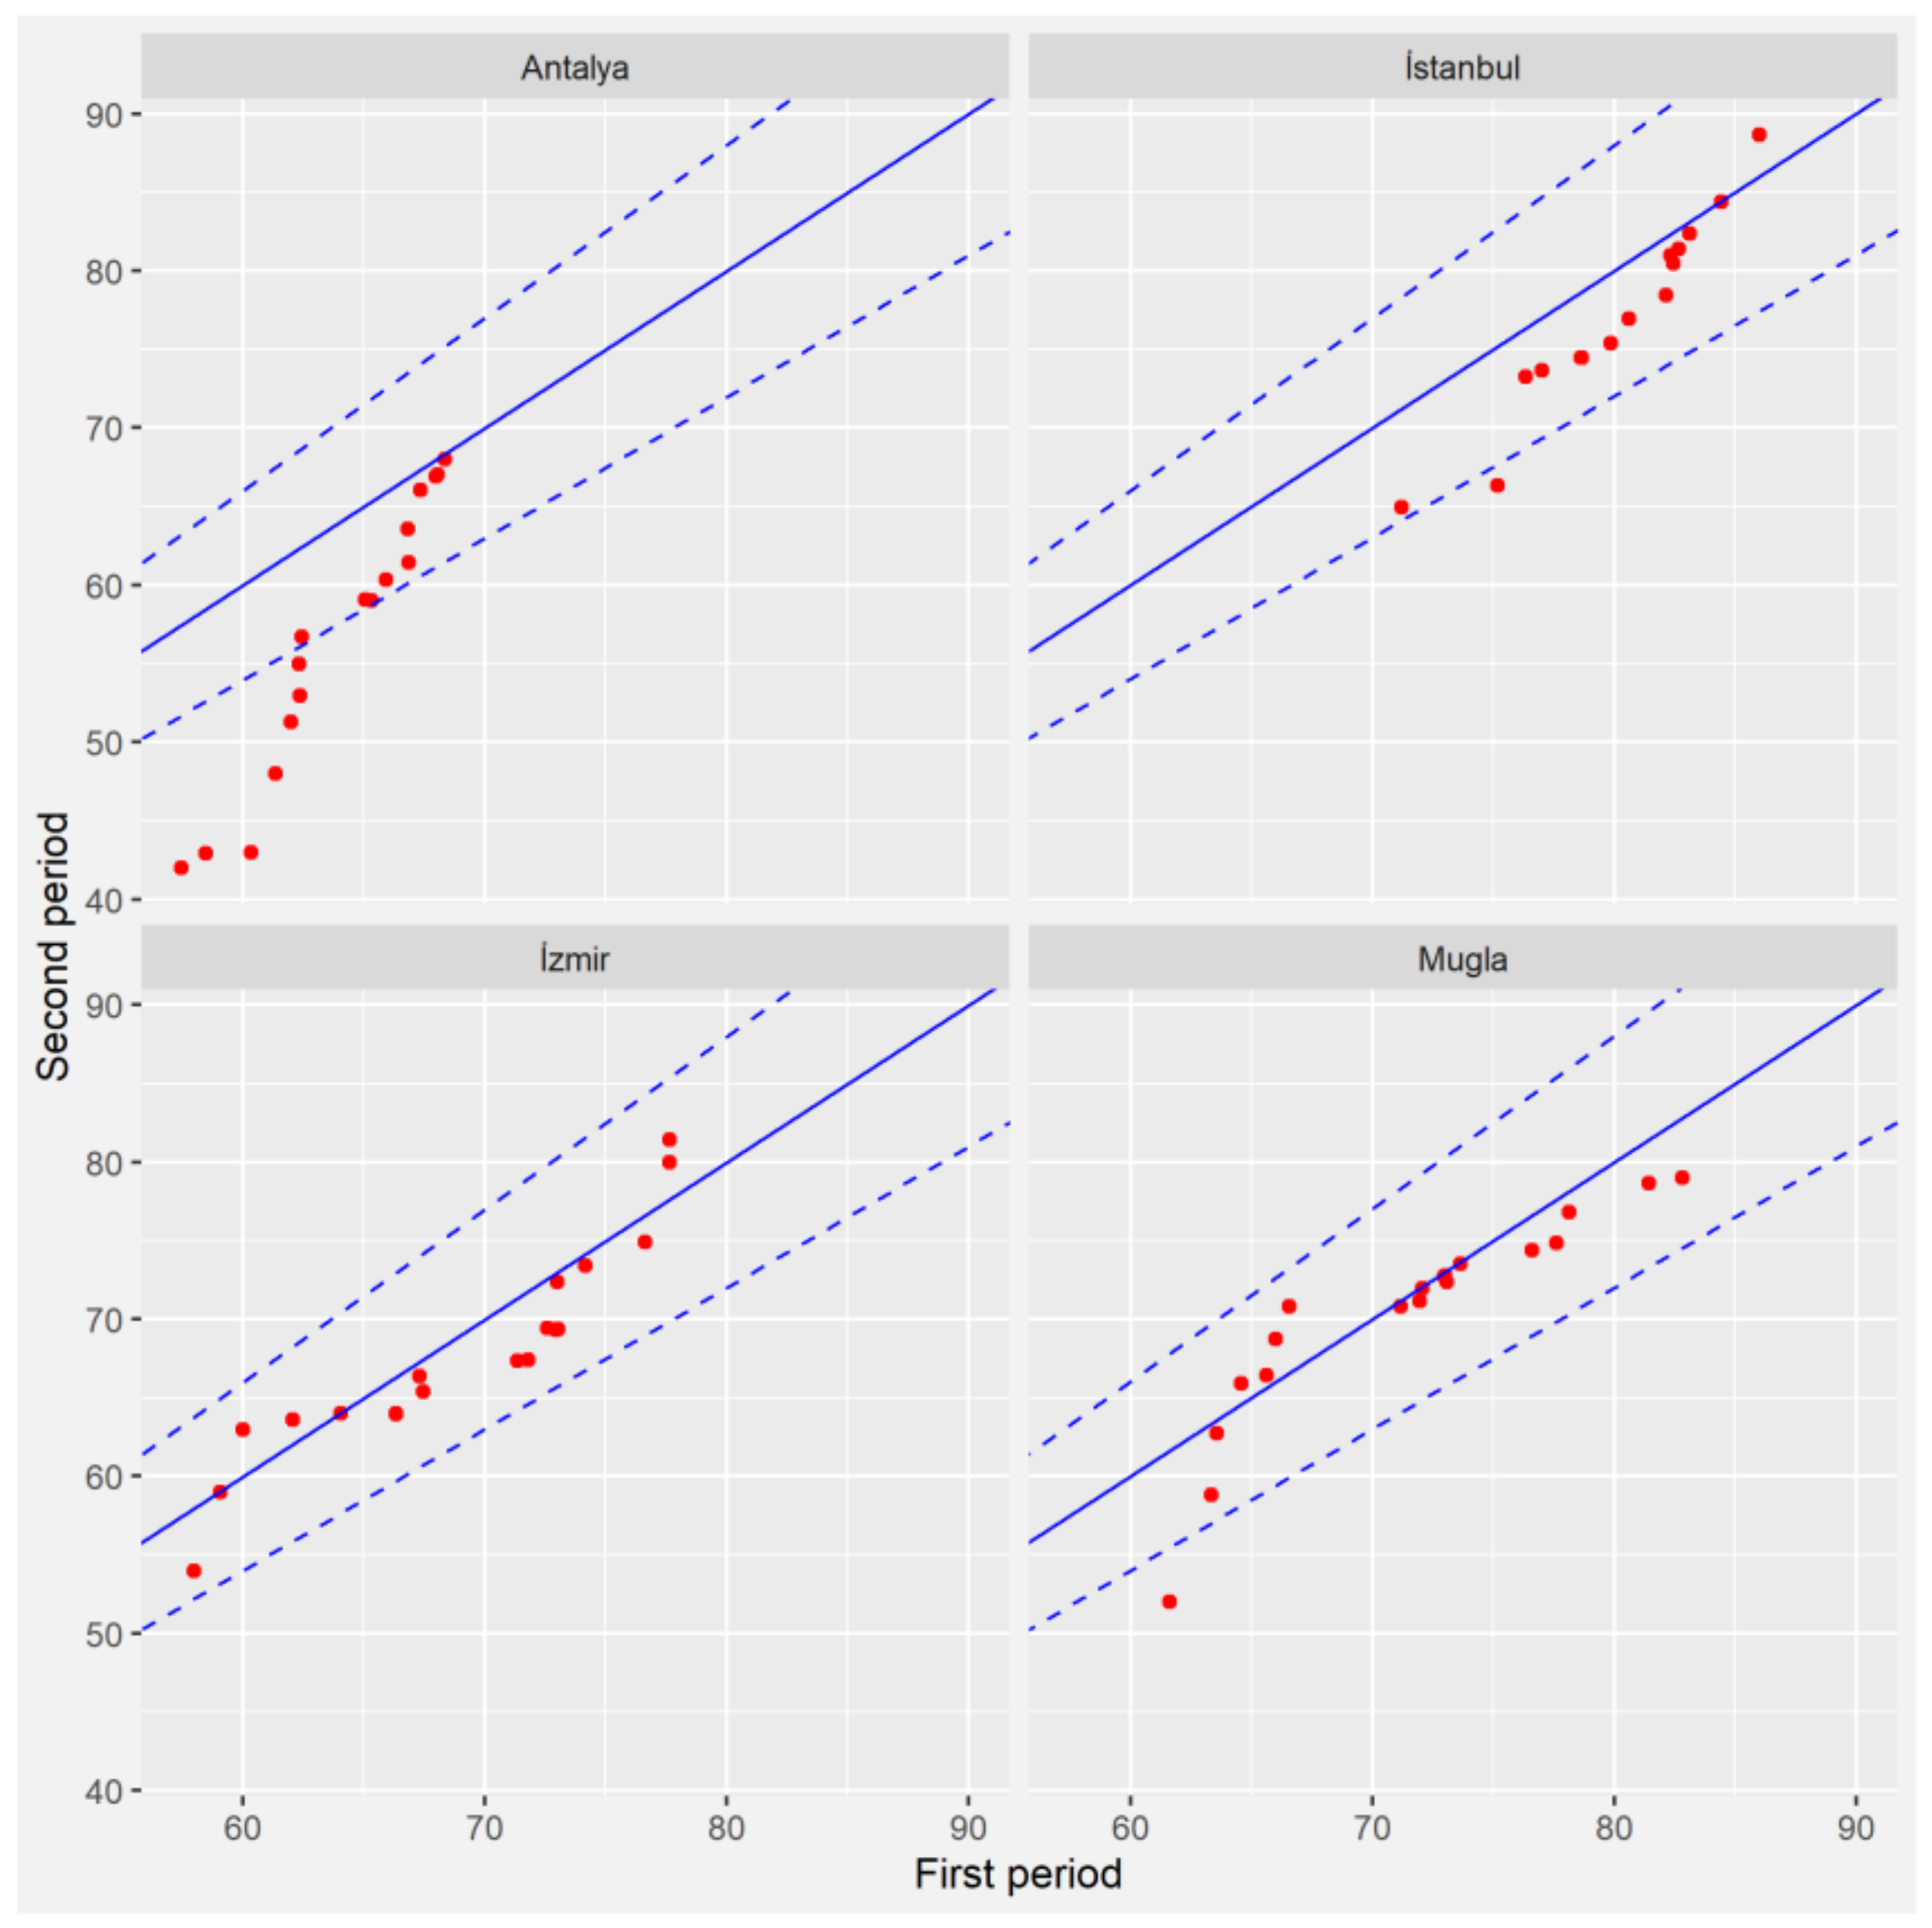
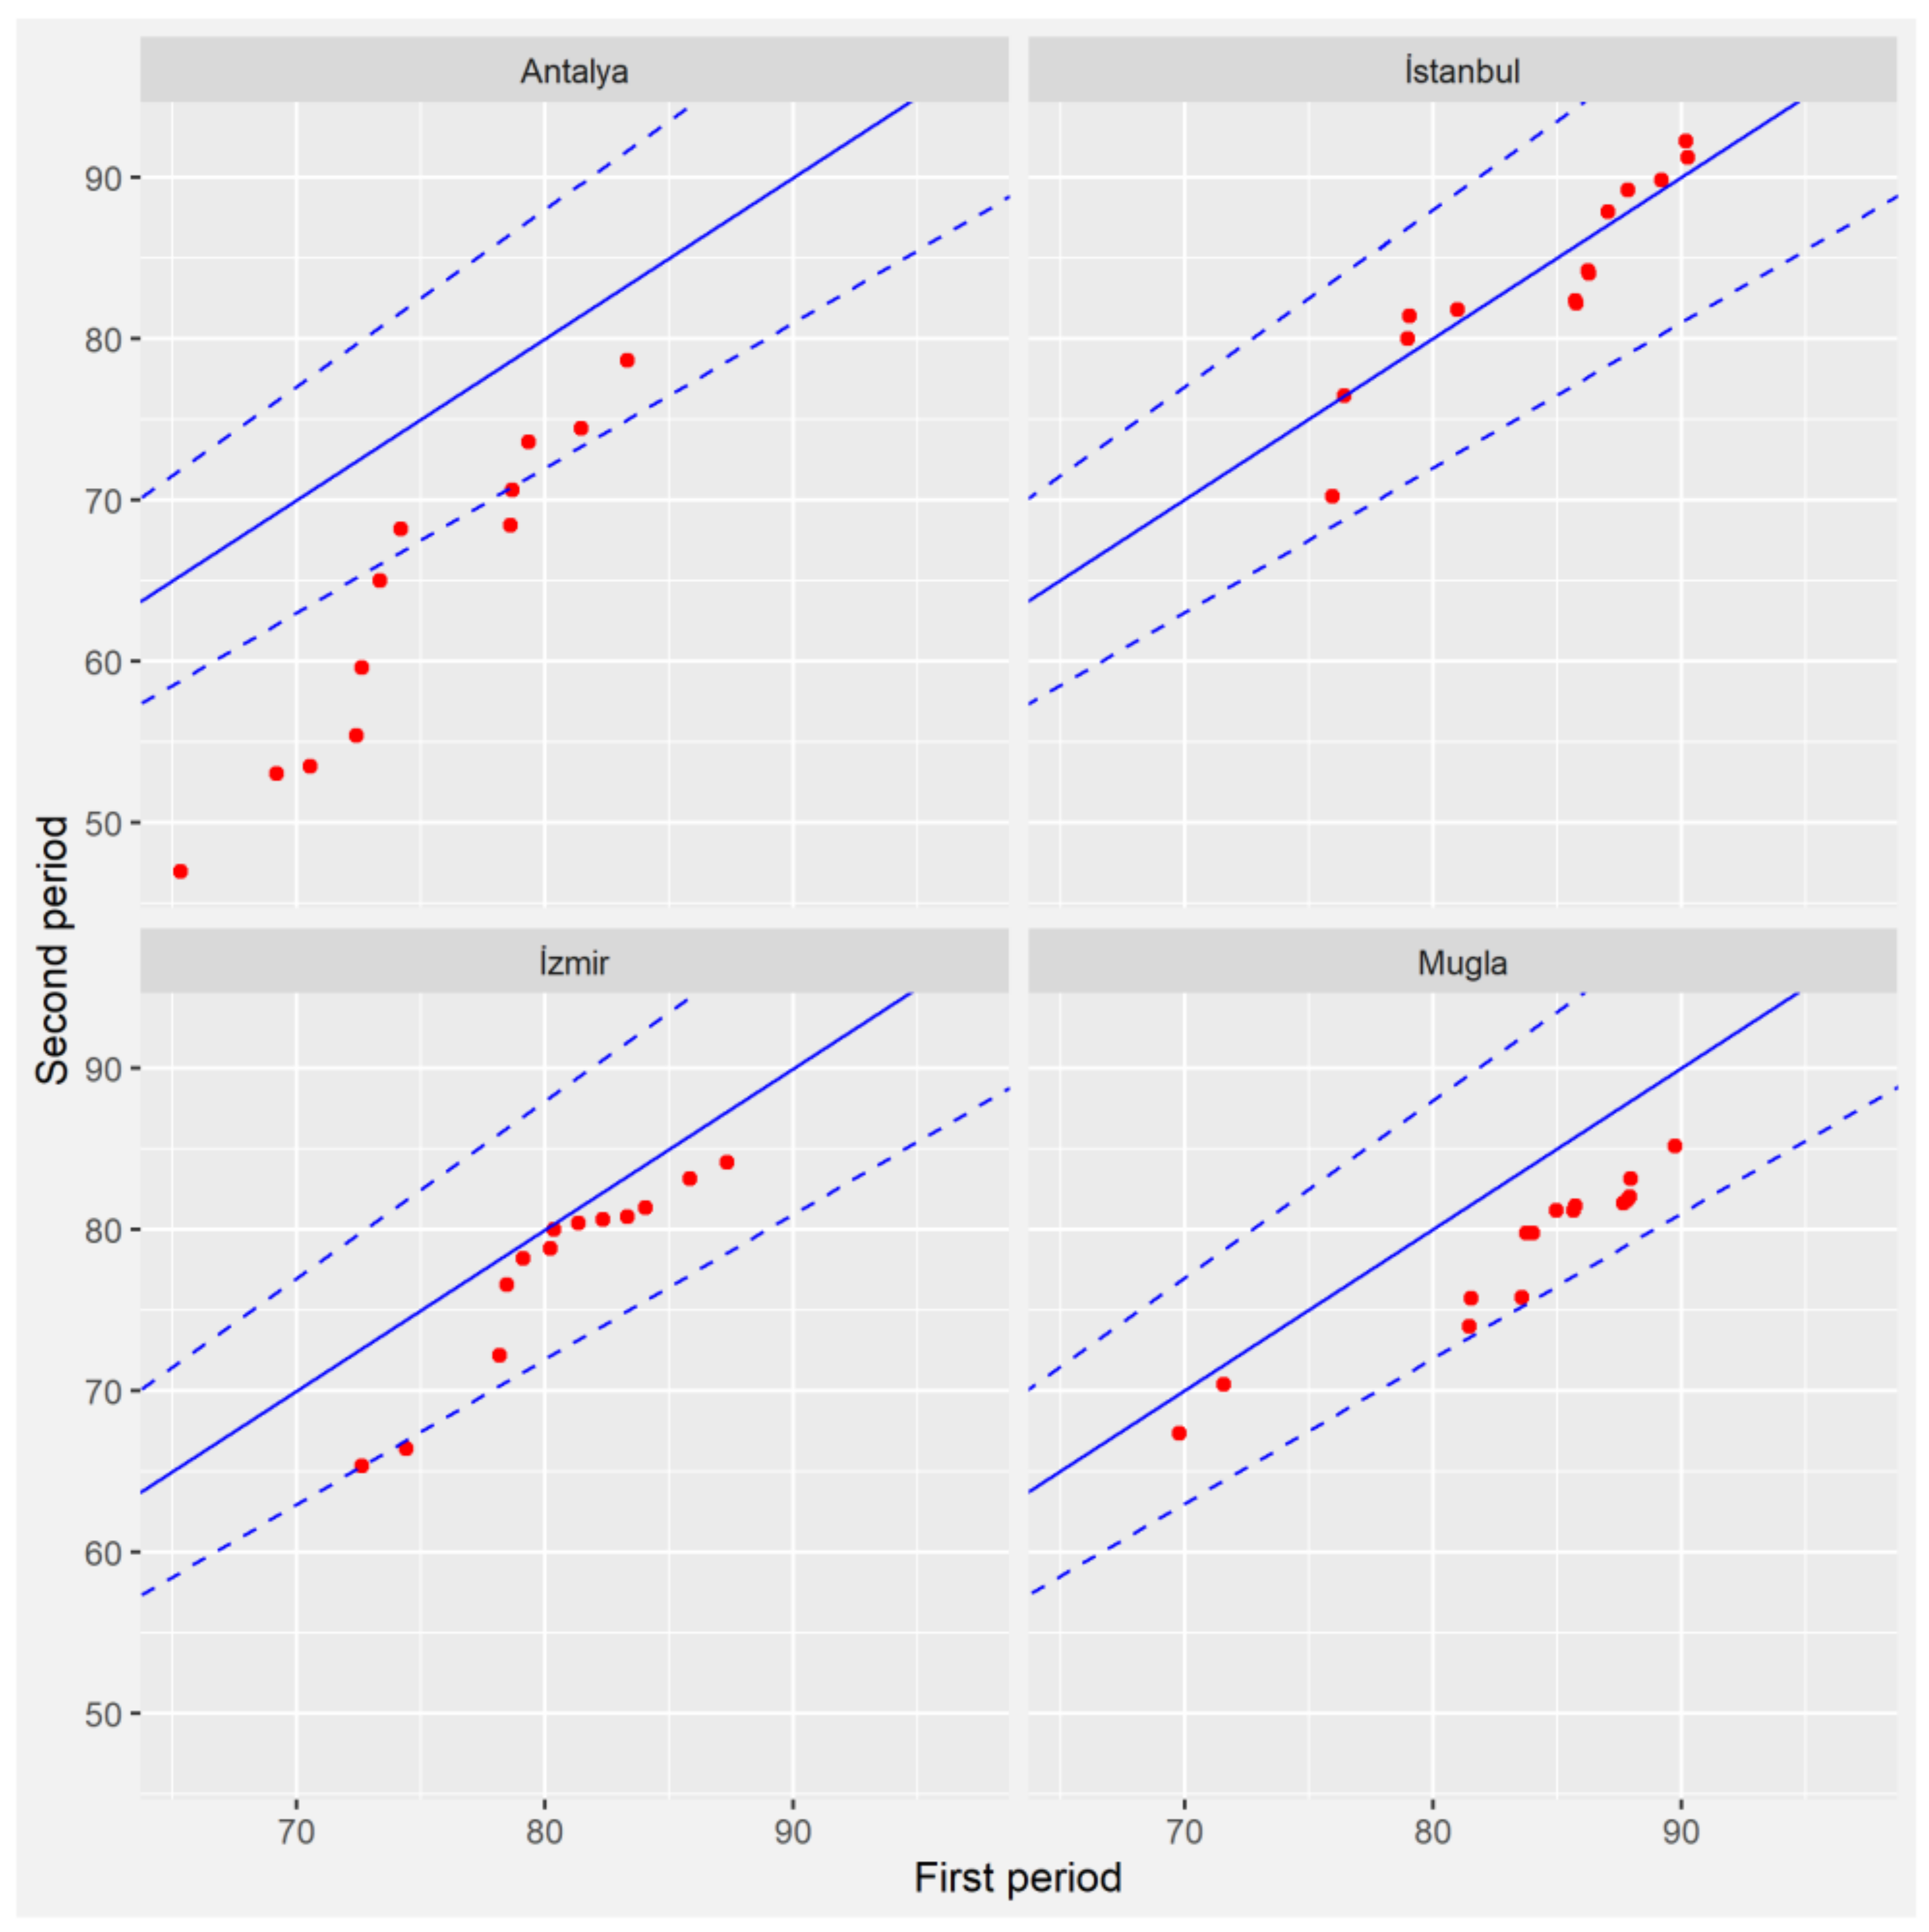
3.3. Sen Test for Four Famous Tourism Destinations
3.3.1. May
3.3.2. June
3.3.3. July
3.3.4. August
3.3.5. September
4. Summary and Conclusions
Author Contributions
Funding
Data Availability Statement
Acknowledgments
Conflicts of Interest
Appendix A


References
- Zhong, L.; Chen, D. Progress and Prospects of Tourism Climate Research in China. Atmosphere 2019, 10, 701. [Google Scholar] [CrossRef]
- UNWTO. Working Together in Europe—A Shared Leadership; UNWTO Report: Madrid, Spain, 2014. [Google Scholar]
- World Tourism Organization. World Tourism Barometer, January. Available online: https://webunwto.s3.eu-west-1.amazonaws.com/s3fs-public/2022-01/220118-Barometersmall.pdf?_PBIQdr4u_qM0w56_l0NpfGPzylGu6Md= (accessed on 17 July 2022).
- Ministry of Development. Eleventh Development Plan. Tourism Specialization Commission Report, Ankara, 140 pages. Available online: http://www.sbb.gov.tr/wp-content/uploads/2020/04/TurizmOzelIhtisasKomisyonuRaporu.pdf (accessed on 12 June 2012).
- Adiguzel, F.; BozdoganSert, E.; Dinc, Y.; Cetin, M.; Gungor, S.; Yuka, P.; Sertkaya Dogan, O.; Kaya, E.; Karakaya, K.; Vural, E. Determining the relationships between climatic elements and thermal comfort and tourism activities using the tourism climate index for urban planning: A case study of Izmir Province. Theor. Appl. Climatol. 2022, 147, 1105–1120. [Google Scholar] [CrossRef]
- Deniz, A. An Examination of the Tourism Climate Index in Turkey. Fresenius Environ. Bull. 2011, 20, 1414–1424. [Google Scholar]
- Gössling, S.; Scott, D.; Hall, C.M.; Ceron, J.P.; Dubois, G. Consumer behaviour and demand response of tourists to climate change. Ann. Tour. Res. 2012, 39, 36–58. [Google Scholar] [CrossRef]
- Roshan, G.; Yousefi, R.; Fitchett, J.M. Long-term trends in tourism climate index scores for 40 stations across Iran: The role of climate change and influence on tourism sustainability. Int. J. Biometeorol. 2016, 60, 33–52. [Google Scholar] [CrossRef]
- Li, H.; Song, H.; Li, L. A dynamic panel data analysis of climate and tourism demand: Additional evidence. J. Travel Res. 2017, 56, 158–171. [Google Scholar] [CrossRef]
- Belén Gómez Martín, M. Weather, climate and tourism a geographical perspective. Ann. Tour. Res. 2005, 32, 571–591. [Google Scholar] [CrossRef]
- Rutty, M.; Scott, D.; Matthews, L.; Burrowes, R.; Trotman, A.; Mahon, R.; Charles, A. An Inter-Comparison of the Holiday Climate Index (HCI:Beach) and the Tourism Climate Index (TCI) to Explain Canadian Tourism Arrivals to the Caribbean. Atmosphere 2020, 11, 412. [Google Scholar] [CrossRef]
- Eurobarometer 334. Attitudes of Europeans towards Tourism. European Commission. Available online: http://ec.europa.eu/public_opinion/archives/flash_arch_344_330_en.htm#334 (accessed on 13 July 2022).
- Martínez-Ibarra, E.; Gómez-Martín, M.B.; Armesto-López, X.A.; Pardo-Martínez, R. Climate Preferences for Tourism: Perceptions Regarding Ideal and Unfavourable Conditions for Hiking in Spain. Atmosphere 2019, 10, 646. [Google Scholar] [CrossRef]
- Scott, D.; Gössling, S.; de Freitas, C.R. Preferred climates for tourism: Case studies from Canada, New Zealand and Sweden. Clim. Res. 2008, 38, 61–73. [Google Scholar] [CrossRef]
- Matzarakis, A. Weather- and climate-related information for tourism. Tour. Hosp. Plan. Dev. 2006, 3, 99–115. [Google Scholar] [CrossRef]
- Mieczkowski, Z. The tourism climatic index: A method of evaluating world climates for tourism. Can. Geogr. 1985, 29, 220–233. [Google Scholar] [CrossRef]
- Amelung, B.; Nicholls, S. Implications of climate change for tourism in Australia. Tour. Manag. 2014, 41, 228–244. [Google Scholar] [CrossRef]
- Clark, D.B.; Mercado, L.M.; Sitch, S.; Jones, C.D.; Gedney, N.; Best, M.J.; Pryor, M.; Rooney, G.G.; Essery, R.L.H.; Blyth, E.; et al. The Joint UK Land Environment Simulator (JULES), Model Description—Part 2: Carbon Fluxes and Vegetation Dynamics. Geosci. Model. Dev. 2011, 4, 701–722. [Google Scholar] [CrossRef]
- Rosselló-Nadal, J. How to evaluate the effects of climate change on tourism. Tour. Manag. 2014, 42, 334–340. [Google Scholar] [CrossRef]
- De Freitas, C.R. Tourism climatology: Evaluating environmental information for decision making and business planning in the recreation and tourism sector. Int. J. Biometeorol. 2003, 48, 45–54. [Google Scholar] [CrossRef]
- Efe, B.; Lupo, A.R.; Deniz, A. The relationship between atmospheric blocking and precipitation changes in Turkey between 1977 and 2016. Theor. Appl. Climatol. 2019, 138, 1573–1590. [Google Scholar] [CrossRef]
- Efe, B.; Sezen, İ.; Lupo, A.R.; Deniz, A. The relationship between atmospheric blocking and temperature anomalies in Turkey between 1977 and 2016. Int. J. Climatol. 2020, 40, 1022–1037. [Google Scholar] [CrossRef]
- Efe, B.; Lupo, A.R.; Deniz, A. Extreme temperatures linked to the atmospheric blocking events in Turkey between 1977 and 2016. Nat. Hazards 2020, 104, 1879–1898. [Google Scholar] [CrossRef]
- Efe, B.; Gözet, E. Trend analysis of tourism climate index values in Samsun. Gümüşhane Univ. J. Sci. Technol. 2020, 11, 1164–1176. [Google Scholar] [CrossRef]
- TURKSTAT. Turkish Tourims Statistics. In Turkish Statistical Institute Database. Available online: https://data.tuik.gov.tr/Bulten/DownloadIstatistikselTablo?p=IWdxTLhd7tM1sNQcZ4erTJJRmlg1fsLpSsyAxjPoiC6kjihKnKY95KqIzlheyKG8 (accessed on 17 July 2022).
- Wang, H.; You, Q.; Liu, G.; Wu, F. Climatology and trend of tourism climate index over China during 1979–2020. Atmos. Res. 2022, 277, 106321. [Google Scholar] [CrossRef]
- Alonso-Pérez, S.; López-Solano, J.; Rodríguez-Mayor, L.; Márquez-Martinón, J.M. Evaluation of the Tourism Climate Index in the Canary Islands. Sustainability 2021, 13, 7042. [Google Scholar] [CrossRef]
- ASHRAE. ASHRAE Handbook of Fundamentals American Society of Heating, Refrigerating and Air Conditioning Engineers; ASHRAE: New York, NY, USA, 1972. [Google Scholar]
- Mann, H.B. Non-Parametric Tests against Trend. Econometrica 1945, 13, 245–259. [Google Scholar] [CrossRef]
- Kendall, M.G. Rank Correlation Methods; Charles Griffin: London, UK, 1975. [Google Scholar]
- Şen, Z. Innovative Trend Analysis Methodology. J. Hydrol. Eng. 2012, 17, 1042–1046. [Google Scholar] [CrossRef]
- Efe, B.; Lupo, A.R. Global Trends in the Occurrence and Characteristics of Blocking Anticyclones using Şen Innovative Trend Analysis. Theor. Appl. Climatol. 2022, 150, 763–776. [Google Scholar] [CrossRef]
- Meng, Q.; Bai, H.; Sarukkalige, R.; Fu, G.; Jia, W.; Zhang, C. Annual and seasonal precipitation trends and their attributions in the Qinling Mountains, a climate transitional zone in China. Theor. Appl. Climatol. 2021, 144, 401–413. [Google Scholar] [CrossRef]
- Dabanlı, İ.; Şen, Z.; Yeleğen, M.Ö.; Sisman, E.; Selek, B.; Güçlü, Y.S. Trend Assessment by the Innovative-Şen Method. Water Resour. Manag. 2016, 30, 5193–5203. [Google Scholar] [CrossRef]
- Pandey, B.K.; Khare, D.; Tiwari, H.; Mishra, K.M. Analysis and visualization of meteorological extremes in humid subtropical regions. Nat. Hazards 2021, 108, 661–687. [Google Scholar] [CrossRef]
- Wickham, H. Ggplot2: Elegant Graphics for Data Analysis; Springer: New York, NY, USA; Available online: http://ggplot2.org (accessed on 17 July 2022).
- R Core Team. R: A Language and Environment for Statistical Computing; R Foundation for Statistical Computing: Vienna, Austria, 2020; Available online: https://www.R-project.org/ (accessed on 10 August 2022).
- Wickham, H.; Francios, R.; Henry, L.; Müller, K.; Dplyr, K.M. A Grammar of Data Manipulation. R package Version 1.0.7. Available online: https://cran.r-project.org/package=dplyr (accessed on 17 July 2022).


| Station | Altitude (Meter) | Latitude (Degree N) | Longitude (Degree E) |
|---|---|---|---|
| Akçakoca | 10 | 41.08 | 31.17 |
| Bartın | 33 | 41.62 | 32.36 |
| Zonguldak | 135 | 41.45 | 31.78 |
| İnebolu | 64 | 41.98 | 33.76 |
| Sinop | 32 | 42.03 | 35.15 |
| Samsun | 4 | 41.34 | 36.26 |
| Ordu | 4 | 40.98 | 37.88 |
| Trabzon | 15 | 40.99 | 39.76 |
| Rize | 9 | 41.04 | 40.50 |
| Hopa | 33 | 41.40 | 41.43 |
| Artvin | 628 | 41.18 | 41.82 |
| Edirne | 51 | 41.68 | 26.55 |
| Tekirdağ | 4 | 40.96 | 27.49 |
| Kumköy | 38 | 41.25 | 29.04 |
| Kocaeli | 76 | 40.77 | 29.93 |
| Sakarya | 30 | 40.76 | 30.39 |
| Bolu | 743 | 40.73 | 31.60 |
| Düzce | 146 | 40.84 | 31.15 |
| Kastamonu | 800 | 41.37 | 33.77 |
| Çankırı | 751 | 40.61 | 33.61 |
| Çorum | 776 | 40.54 | 34.93 |
| Amasya | 412 | 40.67 | 35.84 |
| TokatBölge | 608 | 40.33 | 36.56 |
| Gümüşhane | 1219 | 40.46 | 39.47 |
| Sivas | 1285 | 39.74 | 37.00 |
| Erzincan | 1218 | 39.75 | 39.49 |
| Erzurum | 1758 | 39.95 | 41.19 |
| Kars | 1775 | 40.60 | 43.11 |
| Ağrı | 1632 | 39.72 | 43.05 |
| Igdır | 858 | 39.92 | 44.05 |
| Gökçeada | 79 | 40.19 | 25.91 |
| Çanakkale | 6 | 40.14 | 26.40 |
| Bursa | 100 | 40.23 | 29.01 |
| Yalova | 4 | 40.65 | 29.28 |
| Bilecik | 539 | 40.14 | 29.97 |
| Esenboğa | 959 | 40.12 | 32.99 |
| Ankara | 891 | 39.97 | 32.86 |
| Kırıkkale | 751 | 39.84 | 33.52 |
| Yozgat | 1298 | 39.82 | 34.80 |
| Edremit | 21 | 39.58 | 27.02 |
| Kütahya | 969 | 39.41 | 29.99 |
| Kırşehir | 1007 | 39.16 | 34.16 |
| Gemerek | 1171 | 39.18 | 36.08 |
| Tunceli | 981 | 39.10 | 39.54 |
| Van Bölge | 1671 | 38.46 | 43.35 |
| Ayvalık | 4 | 39.31 | 26.69 |
| Dikili | 3 | 39.07 | 26.89 |
| Akhisar | 92 | 38.91 | 27.82 |
| Manisa | 71 | 38.61 | 27.40 |
| Uşak | 919 | 38.67 | 29.40 |
| A.Karahisar | 1034 | 38.74 | 30.56 |
| Cihanbeyli | 969 | 38.65 | 32.92 |
| Aksaray | 961 | 38.37 | 33.99 |
| Nevşehir | 1260 | 38.61 | 34.70 |
| Kayseri | 1092 | 38.68 | 35.50 |
| Malatya | 948 | 38.34 | 38.22 |
| Elazığ | 990 | 38.64 | 39.26 |
| Bingöl | 1177 | 38.88 | 40.50 |
| Muş | 1323 | 38.75 | 41.50 |
| Tatvan | 1665 | 38.50 | 42.28 |
| Siirt | 896 | 37.92 | 41.93 |
| İzmir | 29 | 38.39 | 27.08 |
| Çesme | 5 | 38.30 | 26.37 |
| Kuşadası | 25 | 37.86 | 27.27 |
| Aydın | 56 | 37.84 | 27.84 |
| Denizli | 425 | 37.76 | 29.09 |
| Burdur | 957 | 37.72 | 30.29 |
| Akşehir | 1002 | 38.37 | 31.43 |
| Isparta | 997 | 37.78 | 30.57 |
| Konya | 1031 | 37.98 | 32.57 |
| Karaman | 1023 | 37.19 | 33.22 |
| Ereğli | 1042 | 37.53 | 34.05 |
| Niğde | 1211 | 37.96 | 34.68 |
| K.Maraş | 572 | 37.58 | 36.92 |
| Gaziantep | 854 | 37.06 | 37.35 |
| Kilis | 640 | 36.71 | 37.11 |
| Adıyaman | 672 | 37.75 | 38.28 |
| Şanlıurfa | 547 | 37.16 | 38.78 |
| Mardin | 1050 | 37.30 | 40.72 |
| Diyarbakır | 674 | 37.90 | 40.20 |
| Batman | 610 | 37.86 | 41.15 |
| Hakkari | 1728 | 37.57 | 43.74 |
| Bodrum | 26 | 37.03 | 27.44 |
| Muğla | 646 | 37.20 | 28.37 |
| Fethiye | 3 | 36.62 | 29.12 |
| Marmaris | 16 | 36.83 | 28.25 |
| Antalya | 64 | 36.90 | 30.80 |
| Anamur | 4 | 36.06 | 32.86 |
| Silifke | 15 | 36.38 | 33.94 |
| Mersin | 3 | 36.77 | 34.60 |
| Adana | 27 | 37.00 | 35.34 |
| İskenderun | 4 | 36.59 | 36.15 |
| Antakya | 104 | 36.20 | 36.15 |
| Finike | 2 | 36.30 | 30.15 |
| Florya | 37 | 40.97 | 28.79 |
| Cizre | 400 | 37.33 | 42.20 |
| İslahiye | 513 | 37.03 | 36.64 |
| Gazipaşa | 21 | 36.27 | 32.30 |
| TCI Score | Descriptive Category | Code |
|---|---|---|
| 90 < TCI < 100 | Ideal | 9 |
| 80 < TCI < 89.9 | Excellent | 8 |
| 70 < TCI < 79.9 | Very good | 7 |
| 60 < TCI < 69.9 | Good | 6 |
| 50 < TCI < 59.9 | Acceptable | 5 |
| 40 < TCI < 49.9 | Marginal | 4 |
| 30 < TCI < 39.9 | Unfavorable | 3 |
| 20 < TCI < 29.9 | Very unfavorable | 2 |
| 10 < TCI< 19.9 | Extremely unfavorable | 1 |
| −20 < TCI < 9.9 | Impossible | 0 |
| Season/Month | Ide. | Exc. | VG | Good | Acc. | Mar. | Unf. | V.Un. | E.U. | Imp. | Minimum | Maximum | Mean |
|---|---|---|---|---|---|---|---|---|---|---|---|---|---|
| Winter | - | - | - | 4 | 33 | 56 | 5 | - | - | - | 32 | 62 | 48 |
| Dec. | - | - | - | 6 | 22 | 66 | 4 | - | - | - | 35 | 64 | 48 |
| Jan. | - | - | - | - | 21 | 66 | 11 | - | - | - | 30 | 59 | 46 |
| Feb. | - | - | - | 8 | 57 | 29 | 4 | - | - | - | 32 | 65 | 51 |
| Spring | - | 15 | 54 | 24 | 5 | - | - | - | - | - | 53 | 85 | 72 |
| Mar. | - | - | 10 | 36 | 44 | 7 | 1 | - | - | - | 39 | 79 | 60 |
| Apr. | 1 | 23 | 47 | 22 | 4 | 1 | - | - | - | - | 49 | 90 | 74 |
| May | 10 | 70 | 17 | 1 | - | - | - | - | - | - | 68 | 93 | 84 |
| Summer | 4 | 39 | 34 | 20 | 1 | - | - | - | - | - | 57 | 93 | 77 |
| Jun. | 12 | 55 | 29 | 2 | - | - | - | - | - | - | 65 | 95 | 83 |
| Jul | 3 | 38 | 29 | 27 | 1 | - | - | - | - | - | 53 | 93 | 75 |
| Aug. | 4 | 32 | 31 | 23 | 8 | - | - | - | - | - | 55 | 92 | 74 |
| Autumn | - | 2 | 82 | 14 | - | - | - | - | - | - | 60 | 80 | 73 |
| Sep. | 18 | 45 | 28 | 7 | - | - | - | - | - | - | 63 | 94 | 82 |
| Oct. | - | 44 | 43 | 11 | - | - | - | - | - | - | 62 | 87 | 78 |
| Nov. | - | - | 15 | 37 | 44 | 2 | - | - | - | - | 43 | 77 | 61 |
| Decreasing | Increasing | |||||
|---|---|---|---|---|---|---|
| Season/Month | p = 0.01 | p = 0.05 | p = 0.1 | p = 0.01 | p = 0.05 | p = 0.1 |
| Winter | - | - | 1 | 3 | 4 | 7 |
| December | - | - | 1 | 1 | 3 | 5 |
| January | 1 | 4 | 8 | - | - | - |
| February | - | - | - | 3 | 9 | 6 |
| Spring | - | 1 | - | 6 | 7 | 7 |
| March | - | - | - | 4 | 8 | 8 |
| April | - | - | - | - | 4 | 6 |
| May | 3 | 10 | 4 | - | - | 3 |
| Summer | 32 | 19 | 3 | 1 | 1 | 2 |
| June | 26 | 13 | 8 | - | - | 1 |
| July | 9 | 8 | 8 | 3 | 1 | 2 |
| August | 23 | 23 | 7 | 1 | 1 | - |
| Autumn | - | - | 2 | 4 | 13 | 13 |
| September | 25 | 16 | 6 | - | 1 | 2 |
| October | 3 | 6 | 3 | - | 4 | - |
| November | 19 | 30 | 16 | |||
Publisher’s Note: MDPI stays neutral with regard to jurisdictional claims in published maps and institutional affiliations. |
© 2022 by the authors. Licensee MDPI, Basel, Switzerland. This article is an open access article distributed under the terms and conditions of the Creative Commons Attribution (CC BY) license (https://creativecommons.org/licenses/by/4.0/).
Share and Cite
Efe, B.; Gözet, E.; Özgür, E.; Lupo, A.R.; Deniz, A. Spatiotemporal Variation of Tourism Climate Index for Türkiye during 1981–2020. Climate 2022, 10, 151. https://doi.org/10.3390/cli10100151
Efe B, Gözet E, Özgür E, Lupo AR, Deniz A. Spatiotemporal Variation of Tourism Climate Index for Türkiye during 1981–2020. Climate. 2022; 10(10):151. https://doi.org/10.3390/cli10100151
Chicago/Turabian StyleEfe, Bahtiyar, Edanur Gözet, Evren Özgür, Anthony R. Lupo, and Ali Deniz. 2022. "Spatiotemporal Variation of Tourism Climate Index for Türkiye during 1981–2020" Climate 10, no. 10: 151. https://doi.org/10.3390/cli10100151
APA StyleEfe, B., Gözet, E., Özgür, E., Lupo, A. R., & Deniz, A. (2022). Spatiotemporal Variation of Tourism Climate Index for Türkiye during 1981–2020. Climate, 10(10), 151. https://doi.org/10.3390/cli10100151