Article

Climate Shocks and Social Networks: Understanding Adaptation among Rural Indian Households

by
Richard Anthony Ramsawak
School of Business and Management, Royal Melbourne Institute of Technology (RMIT)-Vietnam, Ho Chi Min City 700000, Vietnam
Climate 2022, 10(10), 149; https://doi.org/10.3390/cli10100149
Submission received: 12 September 2022 / Revised: 29 September 2022 / Accepted: 4 October 2022 / Published: 12 October 2022
(This article belongs to the Collection Adaptation and Mitigation Practices and Frameworks)

Abstract

:
This paper seeks to uncover the impact of negative rainfall shocks on household social network relationships. I leverage the uncertainty generated from fluctuating long-term rainfall patterns across India, to estimate the impact of heightened climate risks on investments in social network relationships. In so doing, I attempt to disentangle the “direct” and “adaptive” impacts of climate shocks on social network relationships. I found that households that experience higher than average negative rainfall shocks (lower than average rainfall levels over the long term) tend to invest more in family–caste and vertical or linked network relationships. These network relationships were also found to be associated with greater access to financial credit, credit sourced specifically from family members, higher reported collaboration, more diversified businesses, and the use of private irrigation technologies, all of which are key to mitigating the negative impacts of climate shocks. Unlike past research, these results suggest that households’ decisions to invest in social networks may be an adaptive response to higher climate risk. In terms of policy implications, these results highlight the importance of strengthening and supporting family-based and linked networks (such as links to local governmental agencies and extension services) in the face of higher climate risks.

1. Introduction

The Inter-Governmental Panel on Climate Change (IPCC) estimates that, on average, global temperature levels will increase by 1.5 to 4.5 degrees Celsius (with high confidence) relative to pre-industrial levels by the end of the 21st century [1]. The IPCC also suggests that such profound changes in the climatic system during the 21st century will likely be felt hardest by households in developing countries, which strongly depend on agricultural production (IPCC, 2013, 2014). Significant empirical research has been undertaken examining the impact of negative climate shocks on key economic and social outcomes, such as economic growth, productivity, health, crime, and conflict, to name a few (see Dell, Jones [2] and Carleton and Hsiang [3] for detailed reviews). Very few studies have analyzed the impact of climate shocks on social network relationships. This paper, therefore, seeks to bridge this research gap, by assessing the impact of climate shocks on the social networks of households in rural India. Investments in social networks are important for mitigating the negative impacts of climate shocks [4,5,6,7,8,9]. Social capital and social networks have also been found to be positively associated with better environmental and natural resource management [10]. However, to date, no research has been found examining the extent that investments in social networks may be an adaptive response by individuals to heightened climate risk. In general, investments in social networks are particularly useful for people living in rural and marginalized communities, where formal market-based and institutional solutions remain limited. Flora [11], Fafchamps and Minten [12], Bloch et al. [13], and Bloch and Dutta [14] have found a positive association between investments in social networks and information transfers, enforcement of social and contractual obligations, and the provision of social assistance, such as emergency credit, all of which become crucial in times of crisis. Unlike past studies, this paper aims to examine the extent to which climate shocks and other negative climate events may act as a trigger for a person to join social networks, as a risk-mitigation strategy, or to build resilience against future negative climate events. Alternatively, negative climate events can also erode social network relationships, either through forced migration, the destruction of homes and communities, and business failure, or as a result of the increasing prevalence of illness and death among families. It is hoped that this study can deepen our understanding of ways that negative climate events influence human decisions to invest in social network relationships, which, in some regions, become a key source of support in the face of negative climate events. Additionally, given the nature of the survey, I can also differentiate which social networks become most important in the face of heightened climate risks.
One of the challenges in assessing the impact of climate shocks is distinguishing between “direct” and “adaptive” impacts of changing climate patterns [3,15]. “Direct” impacts include instances where harmful climate events, such as droughts and high-temperature levels, result in the loss of assets, livestock, business failure, illness, or even death among households. Such events not only undermine a household’s social standing in a community but also negatively impact social network relationships. On the other hand, indirect or “adaptive” impacts are driven by expectations households develop, either in response to past climate patterns or based on information about future climate events [15]. This distinction is key to understanding climate shock impacts on social network relationships. Indeed, in the case of the former, negative climate shocks can have a “corrosive” impact on social network relationships, while in the case of the latter, the experience of negative climate shocks during prior years can be “consensus building”, as persons work together either to mitigate the impacts of future climate threats or repair damage of past adverse climate events. In the latter case, individuals have an incentive to increase investments in social network relationships, as a means of mitigating the risks associated with possible future negative climate events [12,16].
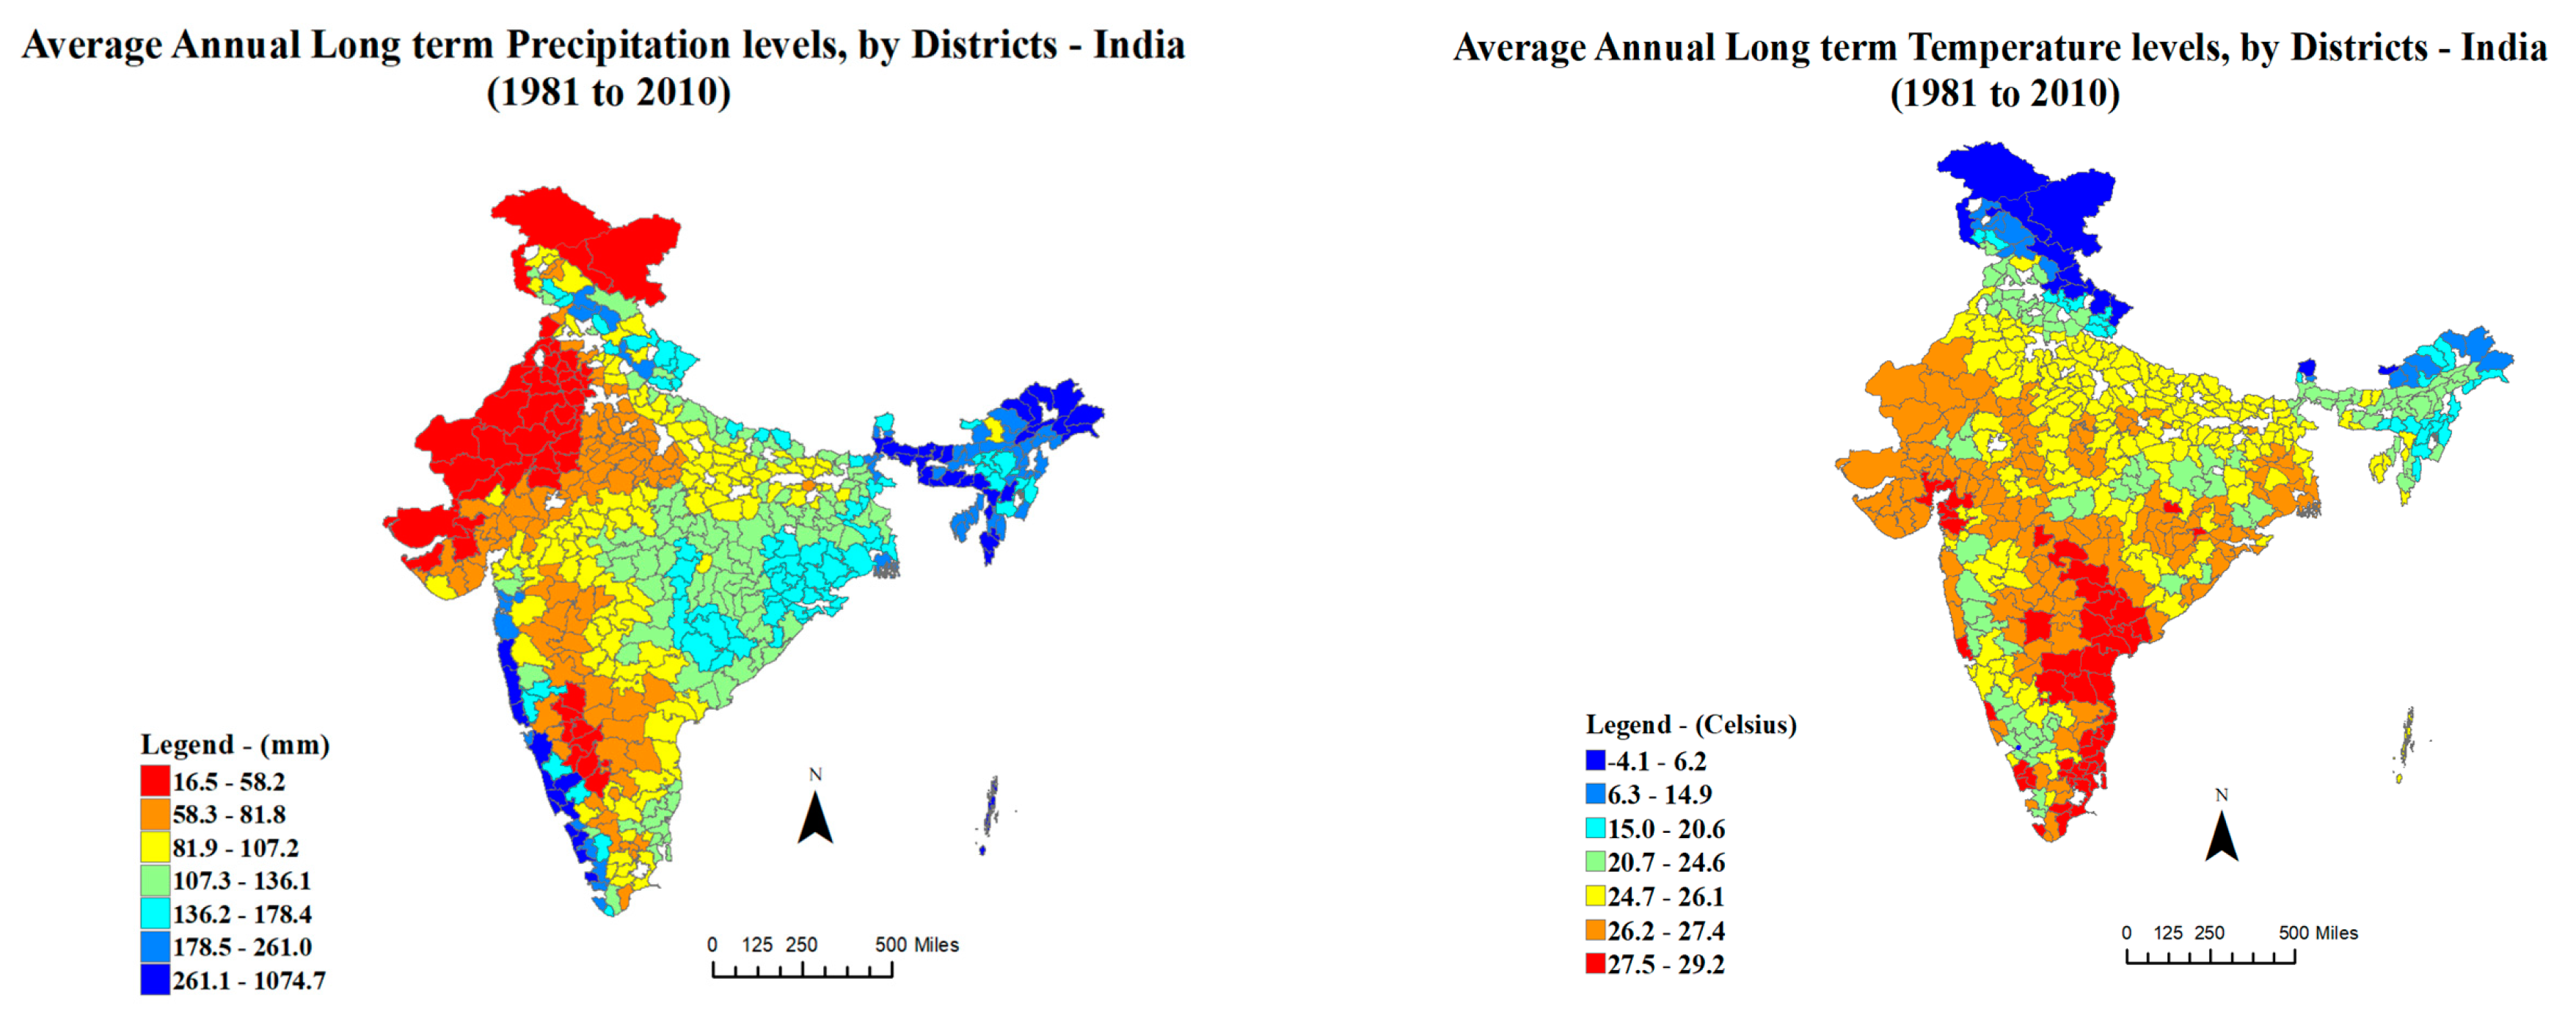
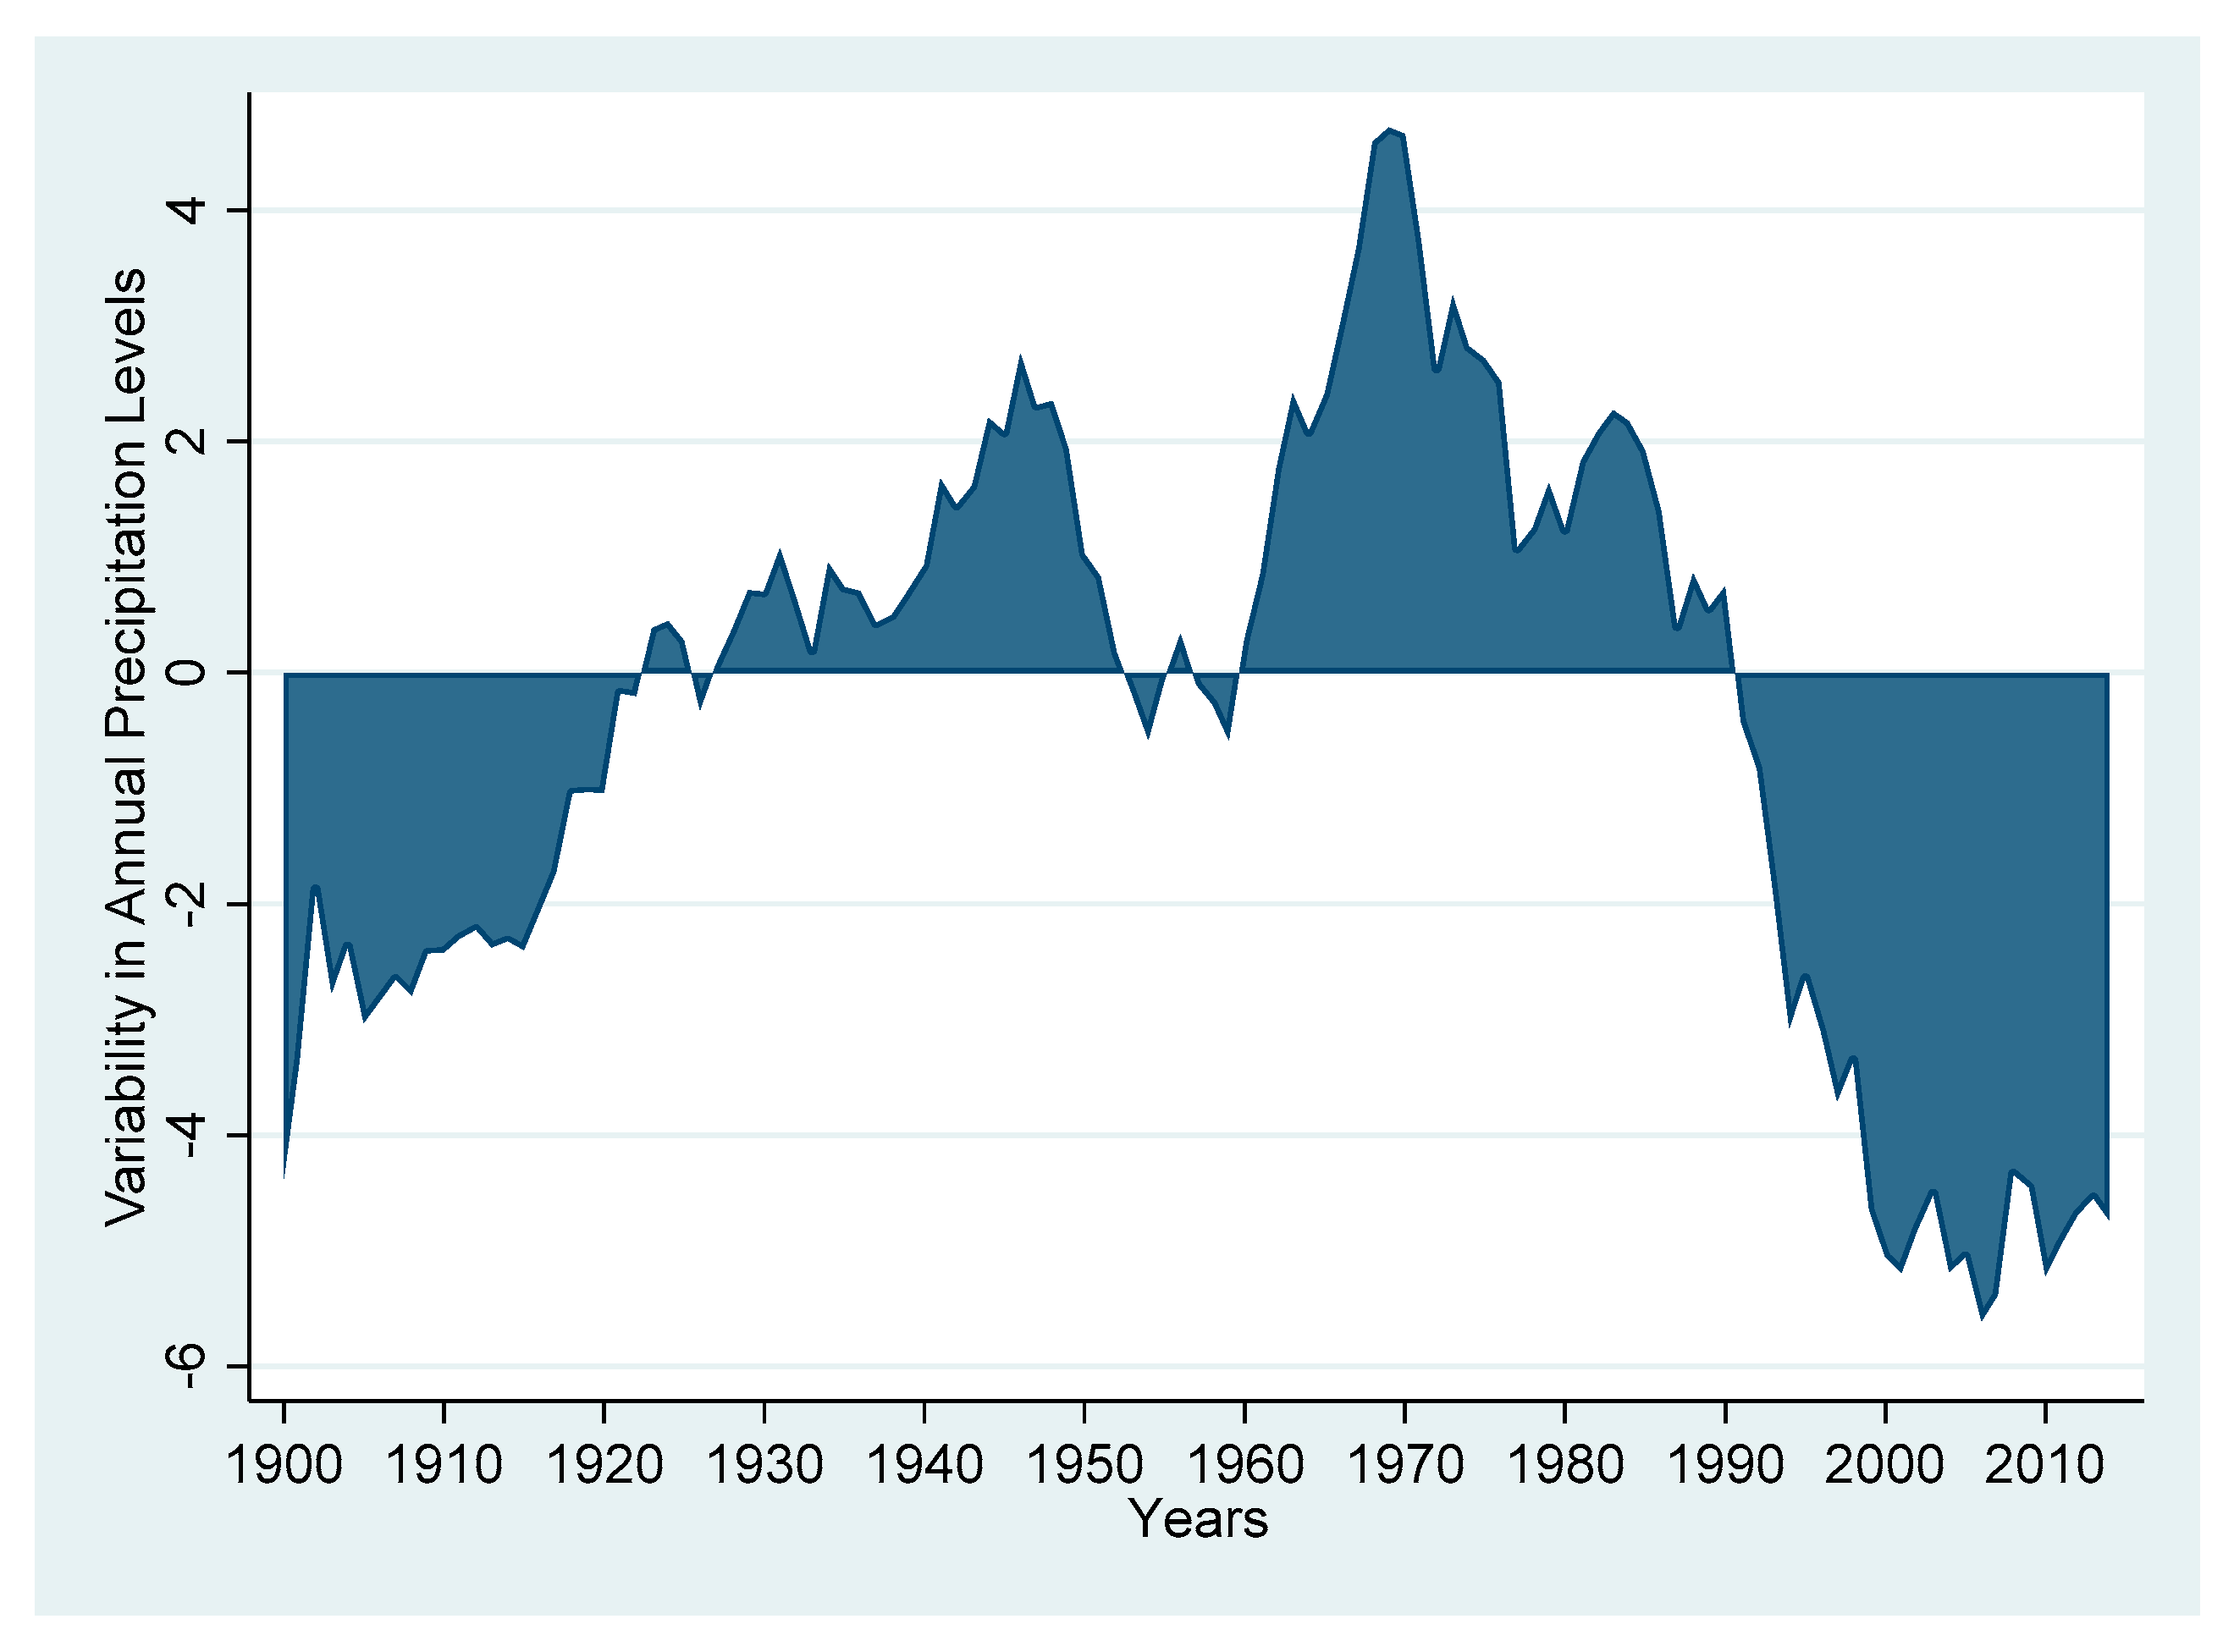
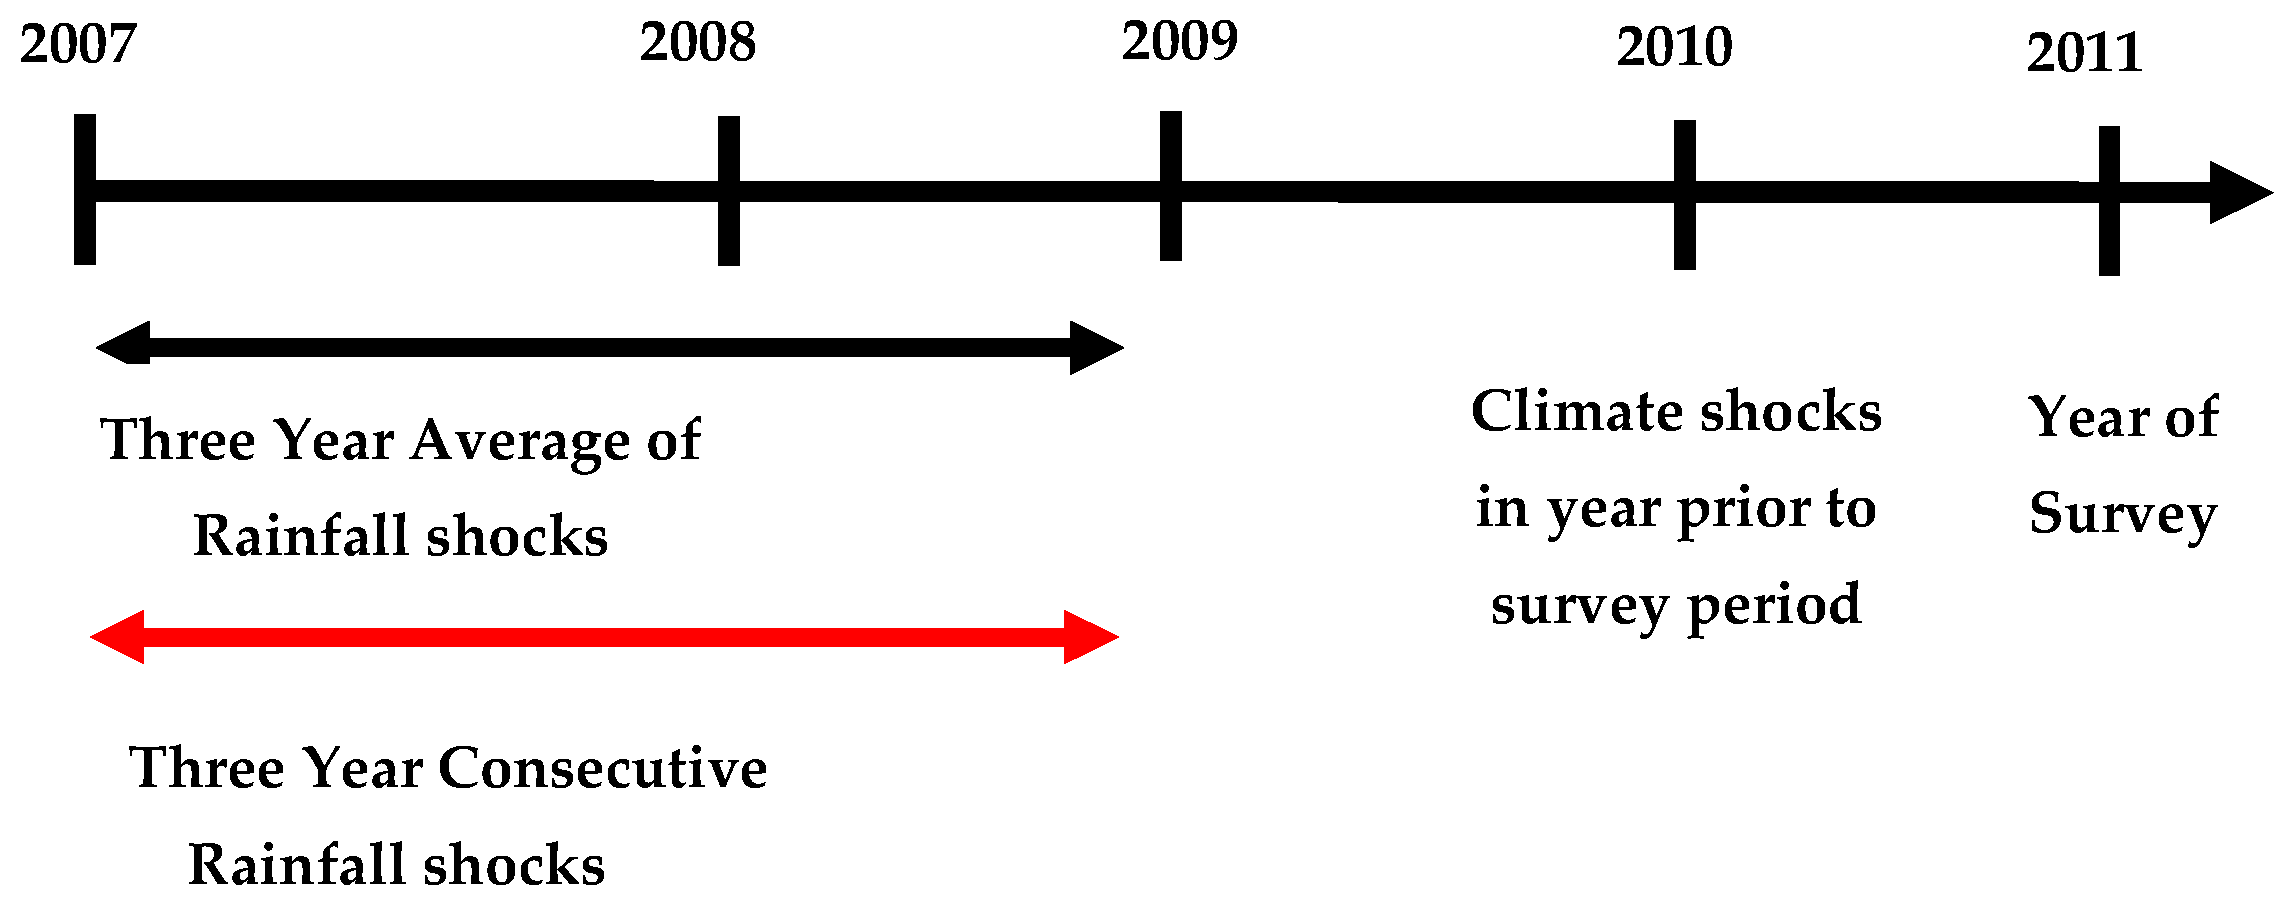
To distinguish between possible “direct” and adaptive impacts on social network relationships, I leverage widely documented, fluctuating long-term rainfall patterns throughout India. Specifically, Parthasarathy et al. [17] and Kripalani and Kulkarni [18] have documented constantly shifting long-term rainfall patterns (movements between periods of heavy rainfall, followed by very dry rainfall patterns) over the last 100 years across the continent of India. In this case, I argue fluctuating long-term rainfall patterns create a degree of uncertainty in climate patterns among decision-makers and households. I hypothesize that past realized rainfall trends are indicative of future rainfall patterns and, as such, can shape a household’s expectations of future weather patterns, which ultimately influence a household’s decision to invest in social network relationships. In this way, this paper is most closely related to Taraz [19], who links past fluctuating weather patterns in India to farmers’ decisions to adopt new irrigation technologies and select more climate-resistant crops. In this case, I examine the extent that which households adapt their portfolio of social network relationships in the face of heightened climate risks. I also assume households make a rational choice in terms of which types of social network relationships can better protect and support long-term consumption or production in the face of possible future negative climate events. I also follow Woolcock [20], Adhikari [21], Hawkins and Maurer [22], and Poortinga [23] by differentiating among three types of social network relationships: (1) family/caste-based (bonding); (2) non-family (bridging); and (3) vertical (linking). Finally, I examine the extent to which social networks are impacted by repeated climate events. This analysis is used to assess the extent to which social network relationships can also be eroded by negative climate events. Both approaches differ from other climate impact studies, which utilize year-to-year changes in climate variables to determine the impact on social and economic outcomes. While year-to-year variations in climate patterns can uncover shorter-term impacts on social and economic outcomes, such as crime and productivity, it overlooks a household’s adaptation and responsiveness to past climate shocks or longer-term climate trends [2,15].
Understanding the impact of climate shocks on social networks can be particularly relevant to poor and vulnerable communities since these communities tend to rely heavily on social network relationships for information, informal support, and collective action. Poorer communities also tend to have less diversified sources of income, own fewer productive assets, and are frequently located in areas that can be particularly vulnerable to sudden climate shocks, such as floods or droughts. This implies that negative climate events can have far-reaching consequences beyond the loss of assets, illness, or death. By impacting both physical and social assets, negative climate shocks have the potential to undermine the long-term resilience of already vulnerable communities, thereby pushing them into a vicious cycle of poverty and underdevelopment. By understanding how these social networks are impacted by negative climate events, it is hoped that policies can be developed to strengthen network relationships, to build greater resilience among climate-affected communities.
This paper is divided into four sections. Section 2 provides details of the data and empirical strategy. The main results and discussions are presented in Section 3, as are the robustness tests and extensions. Finally, concluding remarks and policy recommendations are outlined in Section 4.

2. Data Sources and Methods

2.1. Climate Data for India

Historical weather data were taken from Terrestrial Temperature and Precipitation: 1901 to 2014, Gridded Monthly Time Serie Version 4.01 [24,25]. This dataset provides global (terrestrial) monthly gridded temperature and precipitation estimates. Global grids are spaced at 0.5° latitude and 0.5° longitude width (approximately 56 km × 56 km at the equator). Values are interpolated for each grid node from an average of 20 nearby weather stations, with corrections for elevation based on the spherical version of Shepherds distance-weighting method. I extracted monthly district-level climate estimates by overlaying the climate-gridded datasets onto the 2001 gridded India’s Census district boundaries [26], and estimating the monthly averages of the nearest grid points located within each district.
For each month, longer-term climate averages (precipitation and temperature levels) were generated by the district over the period 1981 to 2010. Figure 1 represents the spatial distribution of long-term rainfall patterns by districts throughout India. It is important to mention that given the size of India, there exists significant spatial variation across the 30 different meteorological subdivisions [19,27].
I followed Dell et al. [28], Iyer and Topalova [29], Blakeslee and Fishman [30], and others by calculating both the annual and monthly climate anomalies or shocks. For a given district, annual deviations from the long-term average were calculated by finding the differences between the annual climate measures and long-term estimates (Both long-term averages and standard deviation in climate measures for each district are based on a 30-year time horizon (1981 to 2010)). Annual deviations can be negative or positive across districts. Figure 2 summarizes the annual positive and negative deviations from the long-term rainfall and temperature averages across all districts, for the years 2004 and 2011. I utilized annual measures to calculate the three- and five-year averages in deviations from the annual rainfall patterns for each district, such that
Average   Rainfall   Deviations = Σ t = 1 T   R a i n f a l l   D e v t T
Secondly, monthly deviations from the long-term climate averages were also calculated and divided by the standard deviation in climate measures for the corresponding month in each district. Climate shocks or anomalies were measured as the total number of months each year the rainfall levels are more than one standard deviation above (positive shock) or below (negative shock) the long-term average [30,31]. Total annual anomalies (positive and negative) were then calculated for each district in a given year. Annual climate shocks were used to generate the three- and five-year average anomalies and lagged values for each district, which were used to represent the information impacts of the climate events. I also estimated the impact of lagged climate events up to the year of the last survey. I found that lags six and seven years before the survey year became small or insignificant in terms of the impacts of social network relationships (Table A1) (This implies that households may not use information on past rainfall patterns as far back as six and years in their decision making today).
In terms of repeated climate events, I identified the districts that have been impacted by successive climate shocks at least two years before the start of the survey period (see Appendix A Figure A1). Specifically, I differentiated between districts that have experienced consecutive shocks over a three- and five-year period. To measure the intensity of the climate shocks, I calculated the total number of climate shocks occurring over a three- and five-year period and used this as an intensive measure of repeated climate events.

2.2. Understanding India’s Fluctuating Interdecadal Rainfall Patterns

Apart from year-to-year fluctuations, researchers have widely documented longer-term regional fluctuations, based on interdecadal rainfall patterns [32,33]. Figure 3 highlights all of India’s interdecadal rainfall patterns over the period 1900 to 2012, which provide evidence of deviations from the long-term historical average in rainfall patterns based on a 31-year moving average. Clear patterns emerge of “dry” spells in rainfall over the periods 1900 to 1920 and 1989 to 2010, where rainfall averages are more than four standard deviations below the long-term average. There are also clear periods of “wet” spells over the periods 1930 to 1950 and 1965 to 1985. I argue this variation in long-term rainfall patterns creates uncertainty among households in terms of which rainfall regime they are experiencing in a given year.
It is also important to note, again, that the rainfall patterns in India vary widely, both spatially and temporally [27]. Indeed, there is also considerable spatial variation in rainfall patterns across the study period (see Figure 4). Regions previously considered as having wetter conditions based on three-year averages in 2000 can be considered as experiencing “drier” conditions based on averages starting in 2005, and the converse is also true for other areas.
I exploit this heterogeneity across regions and long-term variability to determine the extent that locations with wetter (or drier) conditions based on long-term average deviation in rainfall levels may influence a household’s decision to invest in social networks. I assumed households can develop expectations of which rainfall regime they may be facing based on current and past realized rainfall patterns, and this information can be used to make a rational choice in terms of which types of network investments to make to mitigate possible future rainfall risks.

2.3. Measuring Social Capital and Adding Key Control Variables

Measures of social network capital and the key household and village characteristics were obtained from two waves of the Indian Human Development Survey (IHDS) conducted in 2004/2005 and 2011/2012 across communities in India. Specifically, the IHDS is a nationally representative survey, covering all States and Union Territories of India, except for the smaller territories of Andaman Nicobar and Lakshadweep (see Figure 5).
The survey was conducted by the National Council of Applied Research (NCAR) and the University of Maryland and gathered the key socio-economic information on households utilizing a two-stage sampling stratification process (see Desai et al. (2010) for more details on the background of the survey). The first wave of IHDS covered 27,010 rural households drawn from 1503 villages and 13,126 urban households drawn from 971 urban blocks (see Figure 1). For the second wave (2011/2012), there was an 83 percent reinterview rate, with follow-up interviews among split households (if they were located in the same villages). For the purposes of this study, I focused on rural households interviewed during both waves of the survey so that I can track changes in social network patterns and other key household characteristics over time. Following Narayan and Pritchett [34], Narayan [35], and Putnam [36], I measured the social capital and, by extension, investment in social networks primarily in terms of membership in local and regional community-based organizations, as well as based on the composition of a households’ network. I also followed Woolcock and Narayan [37], Szreter and Woolcock [38], and Urwin et al. [39], differentiating among three key forms of social networking capital: bonding (family-based), bridging (non-family-based), and linking (hierarchical-or-power-based). Bridging capital (Bridge) measures the number of non-family-based organizations households report being members of. This includes non-governmental organizations (NGOs), sporting clubs, cooperatives, and self-help groups (see Exhibit A1—Sample Household Questionnaire). To boost the strength of the network measures beyond formal membership-based network relationships, I developed two alternative measures of informal social network relationships: “Linking” capital (Link), which measures the proportion of a household’s network contacts with persons of authority, such as doctors, senior government officials, and school principals or teachers; and “FamilyNet”, or bonding (Bond) capital, which is measured in terms of the percentage of a household network that is made up of the same family or caste. Overall, between both waves, I observed increases in non-family/caste relationships (Bridging), linking networks (Link), and family-based relationships (FamilyNet) between the 2005 and 2012 waves (see Table 1). As a final step, I found the standardized values of all measures to ensure a common interpretation based on the results of the overall sample. I also explored the relationship between social network investments and the potential benefits of network participation, such as household access to credit (number of loans), number of loans coming from family members, the level of reported collaboration, and access to private tubular wells (Table 1). Finally, over the sample period, I found rainfall patterns in the year before the survey period 2012 to be drier than the lagged rainfall patterns in the 2005 survey period. However, in terms of our key determining variables, overall, the average rainfall patterns (three years and five years) in the years leading up to 2012 were found to be much “wetter” relative to the three-year and five-year averages leading up to 2005 (Table 1).

2.4. Empirical Strategy

Testing for Network Adaptation to Climate Shocks
In terms of our empirical strategy, I estimated the household fixed-effects models, which assess the impact of changes in short- and long-term deviations in rainfall patterns at least one year before the survey period on households’ investments in social network relationships. Specifically, in Model 1, I examined the impact of deviations in rainfall and temperature patterns in the year immediately before the survey period on household social network decisions. Additionally, I also tested the impact of longer-term deviations in rainfall patterns measured based on 3- and 5-year average rainfall deviation levels, taken two years before the survey period. In this model, I include village controls, year (t), and month of survey (δi) as fixed effects.
S C i j k t = β 1 R a i n f a l l   S h o c k k t 1 + φ 1 T e m p e r a t u r e   S h o c k k t 1 + β 2 A v e   R a i n f a l l   D e v i a t i o n s k t 2 + γ 1 V i l l a g e   C o n t r o l s j k t + δ i + t + e i j k t
In Model 2, we differentiate between positive and negative deviations in long-term average rainfall patterns.
S C i j k t = β 1 R a i n f a l l   s h o c k k t 1 + φ 1 T e m p e r a t u r e   S h o c k k t 1 + β 2 A v e N e g a t i v e   R a i n f a l l   S h o c k k t 2 + β 3 A v e   P o s i t i v e   R a i n f a l l   S h o c k s k t 2 + γ 1 V i l l a g e   C o n t r o l s j k t + δ i + t + e i j k t
In this case, β2 and β3 capture the adaptative or “information” impact of longer-term climate shocks on a household’s decisions to invest in social network relationships. If current social network decisions are in no way influenced by prior experiences of climate shocks, I expect β2 = β3 = 0. It is also important to mention that the coefficient values can be positive or negative, depending on the extent to which climate shock has a “consensus-building” or “corrosive” impact on social network relationships.
One key advantage of this study is that I can also distinguish among the three main types of social network relationships—family (FamilyNet), non-family (Bridging), and linked (Link)—that households participate in, and, as such, I can determine which network relationships will likely be more important in the face of negative climate events.
To test the impact of repeated climate events on social networks, I estimated Model 3; specifically, after controlling for climate shocks occurring in the year before the survey periods. I identified the districts that have been impacted by successive negative climate anomalies over three years, beginning in 2003 and 2010, respectively (As a robustness test, I also estimated the impact of the average, positive and negative, and repeated climate shocks, over a five-year period) (see Appendix A Figure A1). For these districts, I assigned a value of 1 (and 0 otherwise) to classify these areas as repeated climate-impact districts. I calculated a more intensive measure of repeated climate shocks as the total number of negative precipitation anomalies affecting these repeated-impact districts.
S C i j k t = β 1 R a i n f a l l   S h o c k k t 1 + φ 1 T e m p e r a t u r e   S h o c k k t 1 + β 2 R e p e a t e d   - R a i n f a l l   S h o c k k t 2 + γ 1 V i l l j k t + δ i + θ k + t + e i j k t
I also tested the extent that ethnic or altruistic motives influence network relationships and leveraged caste composition at the village level. Specifically, I differentiated between villages that have greater homogeneity in caste status among village members, focusing on villages that have a concentration of higher and lower caste groups. I assumed villages, where there exists a greater homogeneity in caste status, norms, and values, will likely be more uniform, and altruistic motives will be greater. Additionally, monitoring and enforcement of network obligations in these communities more likely will be effective [40]. I consider this classification important for testing “peer” effects and possible altruistic motives that influence continued investments in social network relationships. I adapted Model 1 by adding a dummy variable taking a value of 1 for households living in villages where more than 50 percent of the village population are reported to be of the same caste status during the base period in 2005. I also differentiated between villages comprising primarily of lower Scheduled Castes and Scheduled Tribes (SCSTs) and villages where Higher Caste (HC) groups predominate (Higher caste groups include Brahims and the High Caste grouping).
Given the granularity in the survey data available, I also tested the importance of “pooled” income on investments in social networks (In the context of this study, pooled income is measured in terms of average village income. I also tested for the importance of individual as opposed to village income in investments in social networks). I measure “pooled” income as average earned income at the village level and differentiate between high- and low-income-earning villages. High-income villages are villages where the average income levels are 75 percent or more than the sample average. Conversely. low-income villages are villages where the average income levels are 50 percent or less than the sample average. Additionally, since households may respond to climate shocks based on where their main source of income are from, I also tested for differences based on the key earning sources of households. Finally, given the spatial resolution of the data, it is important to carefully consider the spatial correlation of the error term. Standard errors are therefore estimated with spatial HAC correction that allows for cross-sectional spatial correlation and location-specific correlation, applying the method developed by Conley [41].

3. Results

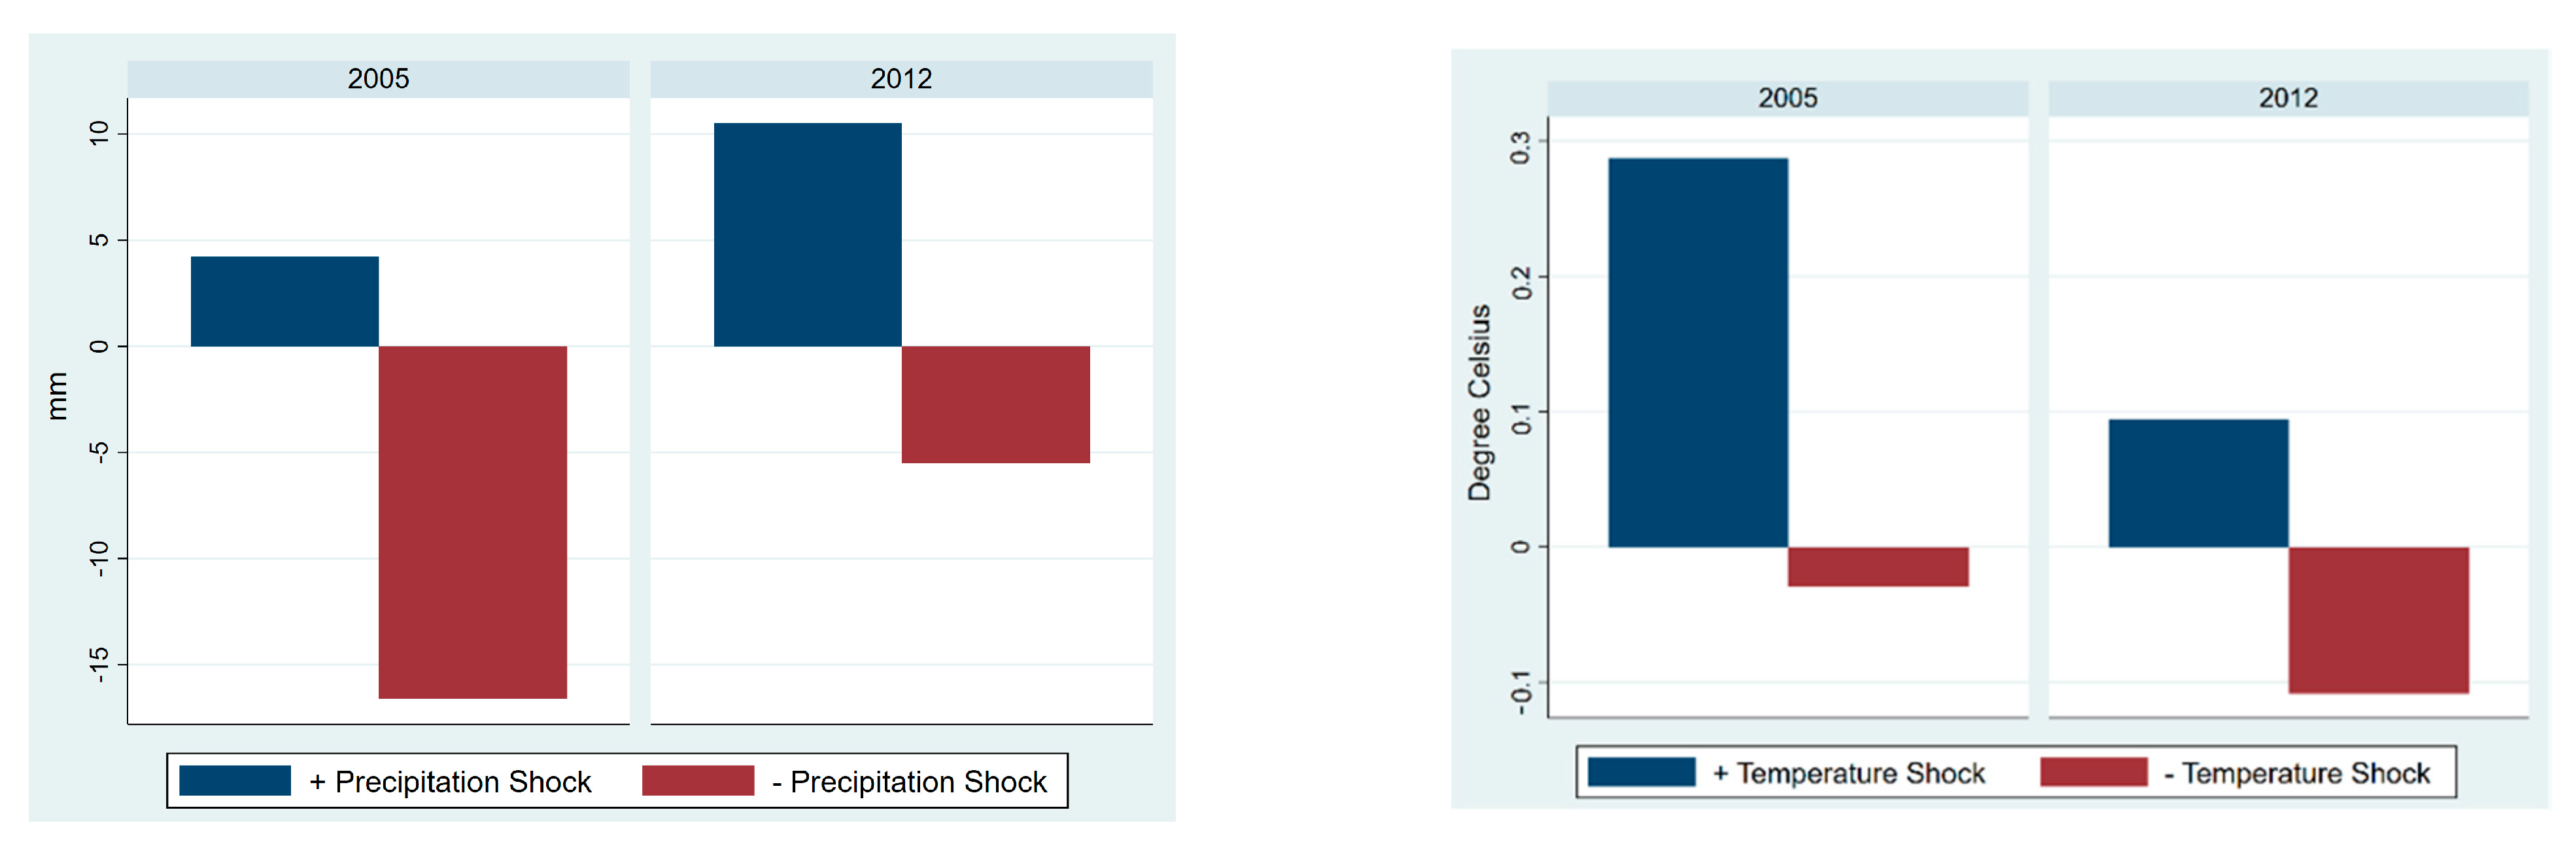
Table 2 outlines the results of household fixed effects (FE) models. Firstly, I found a negative association between the average rainfall deviation patterns on measures of linking social capital (vertical network relationships) and the percentage of informal family-based networks (FamilyNet). Specifically, a one standard deviation increase in the average rainfall levels above the long-term average was associated with lower investments in vertical (power-based) and informal family-based networks by approximately 0.14 and 0.17 standardized points. This suggests that households living in locations that experienced higher than average longer-term rainfall patterns recorded lower investments in vertical and family-based networks. I also found increases in the average rainfall deviations above the long-term average, associated with higher investments in non-family or bridging networks, approximately 0.08 standardized points more than the sample average. I was also able to distinguish the impact of positive and negative rainfall shocks on investments in social network relationships. Not surprisingly, I found a positive association between the average negative rainfall shocks on measures of linking social capital (vertical network relationships) and the percentage of the informal family/caste-based (FamilyNet) networks. Specifically, for each additional month, negative annual rainfall shocks were recorded (based on three-year averages) and investments in vertical (power-based) networks were found to be approximately 0.16 standard deviations higher than the sample average. We also find a one-month increase in the average negative rainfall shocks, associated with higher investments in informal family/caste-based networks, approximately 0.14 standardized points higher than the sample average. Interestingly, the converse is also true; that is, the occurrence of positive rainfall shocks over the long-term is associated with lower levels of investments in linked and family-based networks, as well as increasing investments in non-family (bridging) networks. These results point to greater investments in vertical (linked) and family/caste-based networks among households located in regions that experience negative rainfall shocks much more frequently (I also tested for the impact of long-term temperature shocks but found these shocks to have no significant impact on social network variables. This may be due to the fact that households may find it particularly difficult to adapt to temperature shocks through social network relationships).

3.1. Assessing the Impact of Repeated Climate Shocks

I also tested the impact of repeated negative climate shocks on household social network relationships. Specifically, after controlling for climate shocks in prior periods, I identified the districts that have been impacted by consecutive climate shocks (negative rainfall anomalies) over three years (Table 3). I found investments in (non-family/caste) bridging networks to be lower in regions that have experienced repeated climate events (three years), approximately 0.02 standard deviations below the sample average. However, I continued to find higher investments in linked and family-based networks in regions repeatedly impacted by consecutive negative precipitation shocks. This indicates the continuing resilience of vertical and family-based networks in the face of repeated negative climate events. I found negative precipitation lags (one to three-year) to be positively associated with investments in Linking and FamilyNet.

3.2. Tracing Heterogeneous Impacts

I also examined the possible heterogeneous responses to climate shocks based on differences in community characteristics. Firstly, to explore the extent altruism can influence investments in social network relationships, I explored the impact among households where more than 50 percent of the same village members are of the same caste grouping, as per the Scheduled Castes and Scheduled Tribes (SCSTs) and High Caste (HC) groupings, using the information on village characteristics extracted from the 2005 survey. SCSTs are considered the lowest of the caste groupings in India. I found households located in villages where SCSTs make up more than 50 percent of the village population in 2005 tend to have marginally lower investments in vertical networks in the face of negative climate shocks. Interestingly, I found similar results among villages dominated by High Caste groupings (Appendix A Table A2).
I also find that households residing in rural communities with a higher average village-level income (I defined high-income villages as villages where the average income levels are 75 percent or more than the sample average) will invest approximately 0.206 standardized points more in Linked capital relative to households living in villages with lower levels of income (Appendix A Table A3), suggesting that wealth rather than caste status is a significant determinant of access to vertical-based networks. I also found the converse is true, where for households residing in lower-income villages, investments in linked capital tend to be eroded first in the face of repeated negative rainfall shocks, further reinforcing wealth as a key influence in terms of the household’s access to linked capital (see Appendix A Table A4).

3.3. Extensions and Robustness Tests

Understanding Possible Motives for Investments in Social Networks
An additional step will be to determine the possible motives for investing in social networks. Based on the literature, social networks can be particularly useful for securing emergency credit, social insurance, facilitating technology adoption, social cooperation, and resolving conflicts, all of which become critical in the face of negative climate events. Using survey-based responses, I estimated the impact of investments in key social network relationships on variables such as access and sources of credit, the number of businesses owned and managed by households, reported instances of cooperation among households, and access to private wells (Table 4). Specifically, I found a positive association between investments in linking and bridging capitals and the log number of loans (Ln(#Loans)) received by households. Investments in bridging and linking networks increase the probability of obtaining an additional loan by about 5 and 8 percent, respectively. There is also a positive and significant relationship between investments in linked network capital and loans obtained from family members. Investments in linked capital are also positively related to the number of non-farm business households involved, indicating that vertical relationships are important contributors to having a more diversified portfolio of non-farm businesses. Investments in linking capital are also positively associated with reported collaboration among households. Finally, investments in informal family-based networks are positively associated with increasing access to private tubular wells.
For the robustness tests, I examined the impact of rainfall shocks based on five-year instead of three-year averages. Additionally, given the importance of agriculture to earnings among rural households, I focused on the average rainfall shocks occurring during India’s monsoon season. Once again, in both instances, I continued to find a positive and significant impact of rainfall shocks on increasing investments in family-based networks (see Appendix A Table A5). I also tested the extent to which the baseline results are not driven by shocks occurring in one specific year. Therefore, I estimated the impacts of lagged climate shocks on social network relationships and found the significance of shocks up to seven years before the survey period (Appendix A Table A1). Thirdly, given that I argue a household’s decision to join social networks is considered largely an adaptation strategy to mitigate higher climate risk, one robustness test can include instances where households have more stable income sources, such as salaried households. Indeed, salaried households, such as government workers, administrators, and office employees, may be less likely to be affected by climate shocks relative to other groups such as farmers and business owners. As expected, I found no significant relationship between past climate shocks and investment in social networks among households who earn income from salary-based sources (see Appendix A Table A6).
As a test of the robustness of my channel analysis, I estimated the impacts of investments in social networks and simultaneously tested for the impact of long-term climate shocks on the key socio-economic outcomes (
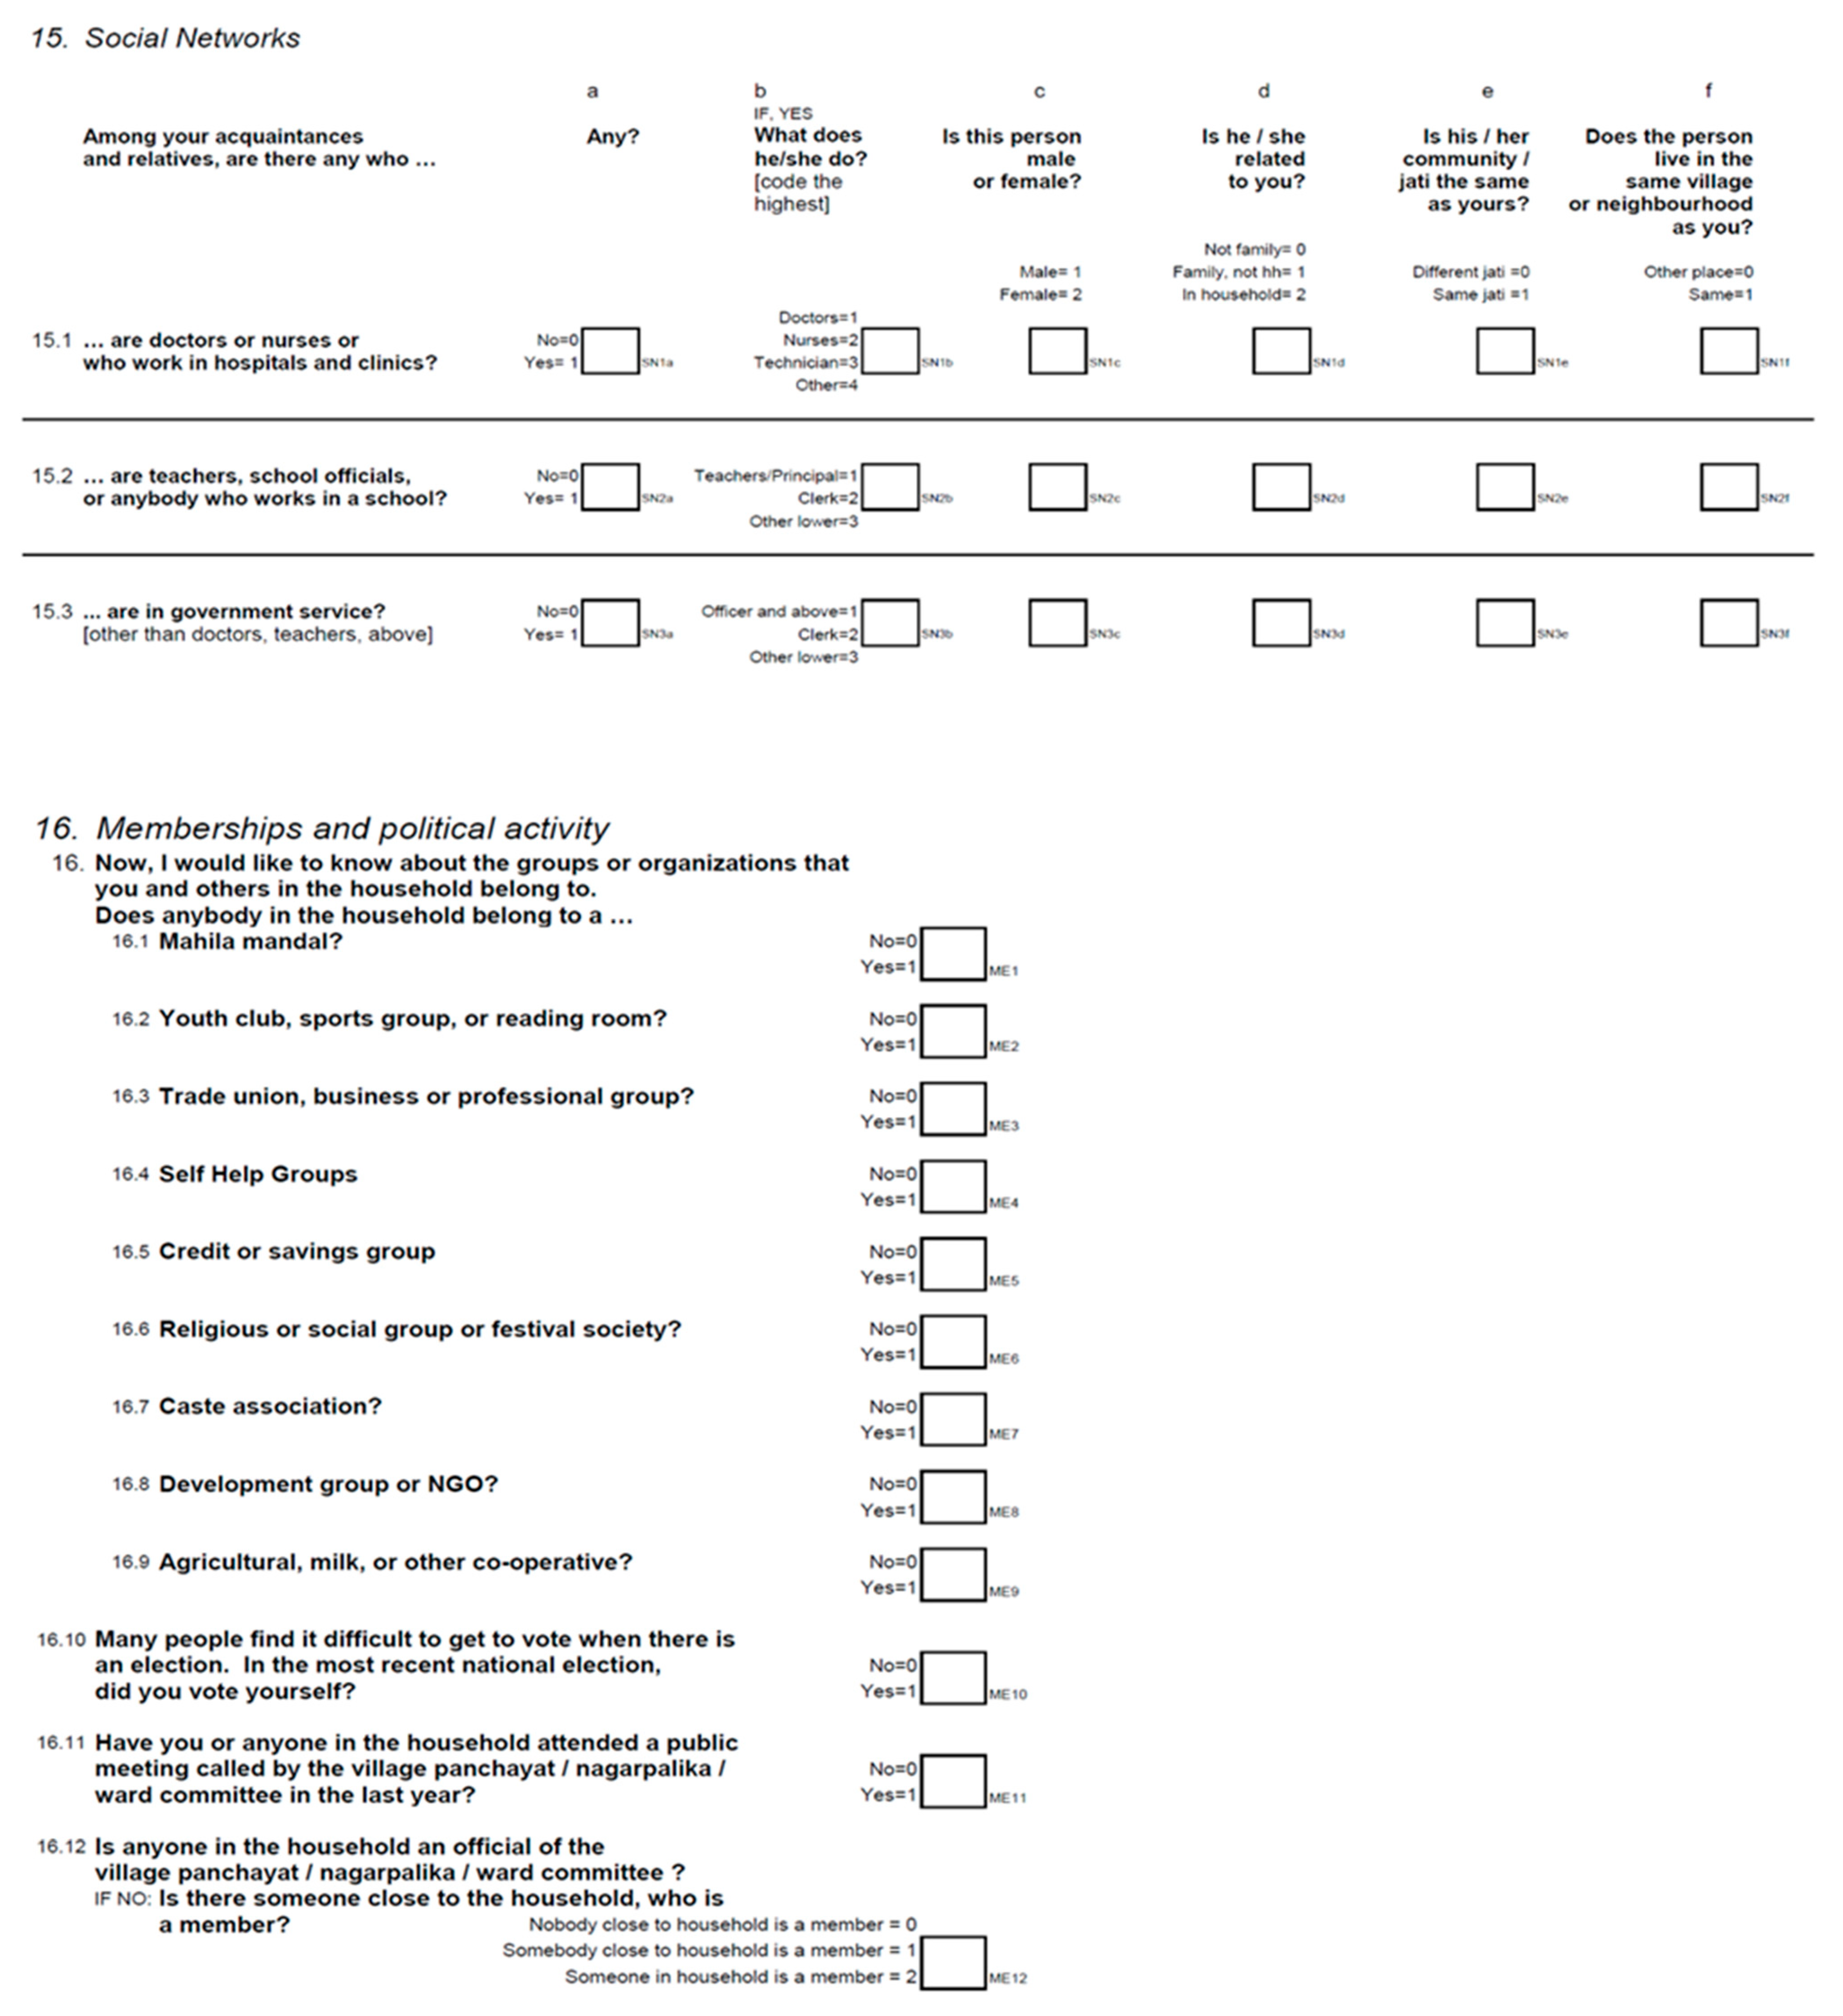
Table A7). I found lagged average climate shocks to have no impact on the key channel outcomes such as access to credit, number of businesses, and access to private tubular wells. This result provides strong support for the directional effect of climate shocks. Climate shocks trigger investments in social network relationships, which bring with them positive socio-economic benefits to support recovery efforts or insulate against future negative climate events. Finally, I tested the robustness of the social capital measures to predict the key social outcomes, such as attendance at public meetings and measures of trust. I found a positive association between investments in Bridging, Linking, and FamilyNet, the probability that households will attend a public meeting, and a positive association between linking the capital and reported confidence/trust in key government institutions.

3.4. Discussion

Collectively, based on these results, I found households tend to be more reliant on family-based networks when faced with higher-than-average rainfall anomalies. I also found non-family (bridging) networks, such as membership in business associations and NGOs, to be eroded in the face of repeated negative climate events. Perhaps an interesting and new result to the literature is the growing importance of linked or power-based networks, such as contacts with local government officials or senior state employees, which tend to increase in the face of higher climate risk. This has significant implications in terms of delivery of support and types of technical support provided by key development organizations, which may have a greater impact and likelihood of success if they are channeled through family or kin-based networks or local government agencies rather than traditional non-profit organizations.
Another interesting finding is the importance of wealth rather than caste status as a key factor associated with greater investment in power-based networks. Households that are located in higher-income villages tend to register higher investments in linked networks, particularly in the face of higher-than-average negative precipitation shocks, giving further credence to the “pooled income” rather than “altruistic” motives for providing support in social networks.
Finally, when exploring the motives for investing in social networks, I found that investments in linked and family-based networks were associated with greater access to credit, also credit from family sources; increases in the number of businesses; increasing access to irrigation wells; and higher reported collaboration. Directional tests confirmed that households do not access these benefits in response to past negative climate events but, rather, increase investments in social networks that are associated with these benefits.

4. Conclusions

Using long-term averages in negative rainfall shocks, as well as lagged climate shocks, I found households that experience higher average negative rainfall shocks tend to have greater investments in vertical and family-caste-based networks. I found investments in linked networks to be marginally lower among villages dominated by SCSTs and also High Caste groups, while households that reside in villages with a high village income tend to have greater investments in linked networks. This result suggests wealth, rather than caste status, increases households’ ability to access linked networks when faced with higher-than-average negative rainfall shocks. Interestingly, I found little or no impact of negative precipitation shocks on investments in social network relationships among households that generate most of their income from salary and wage sources. Finally, I found investments in bridging (non-family networks) to be particularly sensitive to repeated negative precipitation anomalies. Collectively, these results highlight the importance of family/caste and linked network relationships in supporting households impacted by higher than average and repeated negative precipitation shocks. Not surprisingly, I found investments in vertical and family-based networks to be associated with greater access to credit (and sourced from family members), greater diversification into non-farm businesses, higher levels of reported collaboration, and increasing use of private irrigation technology, all of which are key to mitigating the impact of negative climate shocks.
From a policy perspective, these results highlight the importance of supporting family and vertical network arrangements through direct financial support, dissemination of drought-support programs, or improvements in governance structures and accountability frameworks within these communities. Such social support can extend the marginal social benefit of participating in these network relationships, extending spillover benefits to members, and also making these network relationships more resilient to repeated negative climate events. Further research is required to understand possible channels through which social networks are affected by climate shocks. This can be due to factors such as increasing migration, loss of income, and illness or death of household members. It will also be useful to trace possible outcomes of eroded social networks, in terms of increasing crime, higher poverty levels, or more instances of implementation of poor climate mitigation strategies, such as child marriages. Finally, I have also developed a theoretical risk sharing model which captures households’ decision to join social networks as adaptive response to increasing climate risk. The model also predicts household’s behavior in terms of continued network participation in the face of more frequent and intense climate risk. Indeed, while still preliminary, predictions of the theoretical model complement well the empirical results found in this paper (see Supplementary Materials).

Supplementary Materials

Refs. [42,43,44] are cited in the Supplementary Materials. The following supporting information can be downloaded at: https://www.mdpi.com/article/10.3390/cli10100149/s1. A theoretical framework based on a risk-sharing model with infinitely lived households has been developed to model household behavior in the face of persistent negative climate shocks. In general, the models predict that network members will continue to invest in network relationships, once expected future benefits from network participation, exceed the opportunity costs of deviating from the network arrangement. The model also predicts continued network participation in the face of short-term (idiosyncratic) climate shocks. once network members are assured that net future benefits can be gained from network participation. However, once climate shocks become persistent or are expected to be more widespread (systematic), the model predicts network members have a greater incentive to deviate from network-sharing arrangements.

Funding

This research received no external funding.

Data Availability Statement

Not applicable.

Acknowledgments

I wish to thank Magda Tsaneva and Sang Hoo Bae for their insightful comments and suggestions regarding the manuscript and for thinking of new ways of addressing traditional issues of risk sharing and assessing climate impacts on human communities. I also wish to acknowledge the comments and feedback received from seminar participants from the North East University Development Consortium (NEUDC).

Conflicts of Interest

The authors declare no conflict of interest.

Appendix A

Table A1. Assessing the impact of lagged climate shocks (seven-year) on key measures of social capital.
(1)(2)(3)
BridgeStdLinkStdFamilyNetStd
Total Positive Temperature Shocks Lag1−0.0228−0.0741 ***−0.0495 ***
(0.0172)(0.0258)(0.0182)
Total Positive Temperature Shocks Lag20.003200.0530 **0.0369 **
(0.0182)(0.0260)(0.0160)
Total Positive Temperature Shocks Lag3−0.02240.00378−0.0497 **
(0.0216)(0.0350)(0.0203)
Total Positive Temperature Shocks Lag40.0558 ***−0.0457 *−0.00902
(0.0195)(0.0251)(0.0184)
Total Positive Temperature Shocks Lag50.008180.04670.00235
(0.0183)(0.0357)(0.0226)
Total Positive Temperature Shocks Lag60.0421 **−0.008800.00170
(0.0171)(0.0223)(0.0139)
Total Positive Temperature Shocks Lag7−0.0434 **0.04590.0705 ***
(0.0169)(0.0292)(0.0162)
Total Negative Rainfall Shocks Lag10.02180.0932 **0.0477 *
(0.0312)(0.0449)(0.0278)
Total Negative Rainfall Shocks Lag20.0202−0.01780.0589 **
(0.0236)(0.0414)(0.0287)
Total Negative Rainfall Shocks Lag3−0.07320.130 **0.0539
(0.0498)(0.0640)(0.0342)
Total Negative Rainfall Shocks Lag4−0.002470.0445−0.0523 *
(0.0357)(0.0504)(0.0284)
Total Negative Rainfall Shocks Lag5−0.0504 **−0.0669−0.0370
(0.0196)(0.0434)(0.0245)
Total Negative Rainfall Shocks Lag60.01520.0507−0.00871
(0.0320)(0.0543)(0.0327)
Total Negative Rainfall Shocks Lag7−0.00001280.04100.0175
(0.0362)(0.0479)(0.0343)
N40,38440,38440,384
R-sq0.0420.0760.047
adj. R-sq0.0410.0740.046
Notes: Table A1 and Table A2 provide the results of the impacts of seven-year lagged negative rainfall shocks on social networks. Village controls, as well as time and household fixed effects, are included in the model. Errors were calculated based on Conley [42] to adjust for spatial autocorrelation. Standard errors are in parenthesis. * p < 0.10; ** p < 0.05.
Figure A1. Identification strategy—calculating the three-year average (2007 to 2009) climate shocks while controlling for climate shocks in the year before the survey period.
Climate 10 00149 g0a1
Figure A2. Sample Household Questionnaire: Questions 15 and 16 are related to social network measures.
Climate 10 00149 g0a2
Table A2. Results assessing the impacts of the average climate shocks on social networks among high-income villages.
123456
BridgeStdLinkStdFamilyNetStdBridgeStdLinkStdFamilyNetStd
Average Rainfall Deviations−0.0238−0.144 *−0.0749 **−0.0253−0.145 **−0.0755 **
(0.032)(0.074)(0.034)(0.033)(0.073)(0.033)
Average Temperature Deviations0.0455−0.196 ***−0.04150.0443−0.196 ***−0.0418
(0.037)(0.060)(0.032)(0.038)(0.058)(0.032)
Negative Rainfall Shocks−0.03950.200 ***0.161 ***−0.06690.222 ***0.168 ***
(3 Yr Average)(0.045)(0.064)(0.037)(0.055)(0.066)(0.041)
SCST Villages*Positive Rainfall Shocks0.000185−0.156 **−0.0901
(3 Yr Average)(0.059)(0.080)(0.062)
High Caste Villages*Negative Rainfall Shocks 0.0610−0.125 *−0.0603
(3 Yr Average) (0.066)(0.072)(0.067)
N40,41940,41940,41940,41940,41940,419
R-sq0.0100.0410.0180.0100.0410.018
adj. R-sq0.0090.0410.0180.0090.0410.017
Notes: Table A2 reports the results assessing the impacts of average climate shocks on social networks among villages dominated by SCSTs in 2005. In this case, villages where SCST groups represent 50 percent or more of the total village population take a value of 1, or 0 otherwise. Village controls, as well as time and household fixed effects, are included in the model. Errors were generated using spatial HAC correction based on Conley [42]. Standard errors are in parenthesis. * p < 0.10; ** p < 0.05; *** p < 0.01.
Table A3. Results assessing the impacts of average climate shocks on social networks among high-income villages.
123
BridgeStdLinkStdFamilyNetStd
Average Rainfall Deviations−0.0111−0.138 *−0.0861 ***
(0.032)(0.072)(0.031)
Average Temperature Deviations0.0482−0.195 ***−0.0447
(0.037)(0.058)(0.031)
Positive Rainfall Shocks0.0643 **−0.0283−0.0945 **
(3 Yr Average)(0.028)(0.052)(0.038)
Negative Rainfall Shocks−0.02880.113 **0.107 ***
(3 Yr Average)(0.038)(0.054)(0.032)
High Income Villages*Positive Rainfall Shocks0.0353−0.122 ***−0.0142
(3 Yr Average)(0.037)(0.032)(0.029)
High-Income Villages *Negative Rainfall Shocks0.04670.206 ***0.0385
(3 Yr Average)(0.053)(0.058)(0.038)
N40,41940,41940,419
R-sq0.0130.0410.021
adj. R-sq0.0130.0410.020
Notes: Table A3 reports results assessing the impacts of average climate shocks on social networks among high-income villages in 2005. In this case, high-income villages are villages where the average income levels are in the third quartile range (75 percent and above) of all villages included in the sample. Village controls, as well as time and household fixed effects, are included in the model. Errors were generated using spatial HAC correction based on Conley [42]. Standard errors are in parenthesis. * p < 0.10; ** p < 0.05; *** p < 0.01.
Table A4. Results assessing the impacts of repeated negative rainfall shocks on key measures of social capital (low-income villages).
123456
BridgeStdBridgeStdLinkStdLinkStdFamilyNetStdFamilyNetStd
Repeated Negative Rainfall Shocks0.0112 0.0437 ** 0.0198 *
3 Yr (Total)(0.0110) (0.0186) (0.0110)
Repeated Negative Rainfall Shocks −0.00286 0.00673 0.0110
5 Yr (Total) (0.00936) (0.0158) (0.0115)
Low Income*Repeated Negative Rainfall Shocks−0.00503 −0.0390 * −0.0102
3 Yr (Total)(0.0128) (0.0199) (0.0120)
Low Inc*Repeated Negative Rainfall Shocks −0.00230 −0.00303 0.000191
5 Yr (Total) (0.0124) (0.0159) (0.0107)
N40,38440,38440,38440,38440,38440,384
R-sq0.0240.0230.0550.0500.0290.029
adj. R-sq0.0230.0210.0540.0480.0280.028
Table A4 reports result assessing the impacts of repeated negative rainfall shocks on key measures of social network relationships. Repeated negative rainfall shocks are districts in India that have experienced consecutive years of negative precipitation anomalies over a three-year (and five-year) period. Low-income villages are villages where average income levels are 50 percent or lower than the average income of all villages included in the sample. Village controls, as well as time and household fixed effects, are included in the model. Errors were generated using spatial HAC correction based on Conley [42]. Standard errors are in parenthesis. * p < 0.10; ** p < 0.05.
Table A5. Results assessing the impacts of negative rainfall shocks on social networks based on 5-year (averages) and rainfall shocks occurring during India’s monsoon season.
123456
BridgeStdLinkStdFamilyNetStdBridgeStdLinkStdFamilyNetStd
Average Rainfall Deviations−0.0196−0.140 *−0.0842 ***
(0.032)(0.072)(0.030)
Average Temperature Deviations0.0309−0.176 ***0.00175
(0.037)(0.058)(0.028)
Positive Rainfall Shocks0.00358−0.00294−0.0108 ***
(5 Yr Average)(0.003)(0.003)(0.003)
Negative Rainfall Shocks−0.03720.09690.0939 **
(5 Yr Average)(0.052)(0.078)(0.047)
Average Monsoon Temperature Deviations 0.063 ***−0.103 ***0.001
(0.02)(0.03)(0.03)
Average Monsoon Rainfall Deviations −0.030.0870.112 *
(0.05)(0.08)(0.07)
Negative Monsoon Rainfall Shocks −0.186 ***−0.1270.143 **
(3 Yr Averages) (0.06)(0.13)(0.06)
N40,41940,41940,41940,41940,41940,419
R-sq0.0100.0370.0200.0140.0290.015
adj. R-sq0.0100.0360.0200.0140.0290.015
Notes: Table A5 reports results assessing the impacts of average climate shocks based on five-year averages and also the average rainfall shocks occurring during India’s monsoon planting season on social networks. Village controls, as well as time and household fixed effects, are included in the model. Errors were generated using spatial HAC correction based on Conley [42]. Standard errors are in parenthesis. * p < 0.10; ** p < 0.05; *** p < 0.01.
Table A6. Results assessing the impacts of negative rainfall shocks on households earning salary income.
123
BridgeStdLinkStdFamilyNetStd
Average Rainfall Deviations−0.0235−0.146 *−0.0768 **
(0.031)(0.075)(0.033)
Average Temperature Deviations0.0452−0.195 ***−0.0422
(0.037)(0.059)(0.033)
Negative Rainfall Shocks−0.04350.152 ***0.141 ***
(3 Yr Averages)(0.041)(0.055)(0.034)
Salaried Households* Negative Rainfall Shocks0.05990.0751−0.0191
(3 Yr Averages)(0.078)(0.096)(0.059)
N40,41940,41940,419
R-sq0.0090.0370.017
adj. R-sq0.0090.0370.017
Table A6 reports the results assessing the impacts of negative rainfall shocks on households earning salaried income. Village controls, as well as time, month of survey, and household fixed effects, are included in the model. Errors were generated using spatial HAC correction based on Conley [42]. Standard errors are in parenthesis. * p < 0.10; ** p < 0.05; *** p < 0.01.
Table A7. Results assessing the impact of key measures of social capital and climate shocks (three-year averages) on key measures of social outcomes.
12345
Ln(#Loans)LoansNumber of BusinessesReported CollaborationPrivate Wells
From Family members
BridgeStd0.0544 ***−0.0147 **−0.0220.00318−0.000953
(0.016)(0.006)(0.017)(0.011)(0.006)
LinkStd0.0763 ***0.0240 ***0.0365 ***0.0327 ***0.00451
(0.015)(0.006)(0.013)(0.011)(0.005)
FamilyNetStd0.0193−0.00419−0.004340.002950.0109 **
(0.016)(0.007)(0.021)(0.011)(0.005)
Negative Rainfall Shocks (3 Yr Average)0.01150.0280.02450.006790.0112
(0.046)(0.018)(0.021)(0.035)(0.012)
N40,35440,384655340,38440,136
R-sq0.1130.0390.0460.1080.024
adj. R-sq0.1120.0370.0380.1070.023
Notes: Table A7 provides the results of the impacts of key measures of social capital and negative precipitation anomalies (three-year averages) on key social outcomes. Village controls as well as time and household fixed effects are included in the model. Errors were generated using spatial HAC correction based on Conley [42]. Standard errors are in parenthesis. ** p < 0.05; *** p < 0.01.

References

  1. Pachauri, R.K.; Allen, M.R.; Barros, V.R.; Broome, J.; Cramer, W.; Christ, R.; Church, J.A.; Clarke, L.; Dahe, Q.; Dasgupta, P. Climate Change 2014: Synthesis Report. Contribution of Working Groups I, II and III to the Fifth Assessment Report of the Intergovernmental Panel on Climate Change; IPCC: Geneva, Switzerland, 2014; p. 151. [Google Scholar]
  2. Dell, M.; Jones, B.F.; Olken, B.A. What do we learn from the weather? The new climate–economy literature. J. Econ. Lit. 2014, 52, 740–798. [Google Scholar] [CrossRef] [Green Version]
  3. Carleton, T.A.; Hsiang, S.M. Social and economic impacts of climate. Science 2016, 353, aad9837. [Google Scholar] [CrossRef] [PubMed] [Green Version]
  4. Adger, W.N. Social Capital and Climate Change. 2001. Available online: https://citeseerx.ist.psu.edu/viewdoc/download?doi=10.1.1.580.5077&rep=rep1&type=pdf (accessed on 11 September 2017).
  5. Adger, W.N. Social capital, collective action, and adaptation to climate change. In Der Klimawandel; Springer: Berlin/Heidelberg, Germany, 2010; pp. 327–345. [Google Scholar]
  6. Wolf, J.; Adger, W.N.; Lorenzoni, I.; Abrahamson, V.; Raine, R. Social capital, individual responses to heat waves and climate change adaptation: An empirical study of two UK cities. Glob. Environ. Chang. 2010, 20, 44–52. [Google Scholar] [CrossRef]
  7. Chen, H.; Wang, J.; Huang, J. Policy support, social capital, and farmers’ adaptation to drought in China. Glob. Environ. Chang. 2014, 24, 193–202. [Google Scholar] [CrossRef]
  8. Abid, M.; Ngaruiya, G.; Scheffran, J.; Zulfiqar, F. The role of social networks in agricultural adaptation to climate change: Implications for sustainable agriculture in Pakistan. Climate 2017, 5, 85. [Google Scholar] [CrossRef] [Green Version]
  9. Abid, M.; Ali, A.; Raza, M.; Mehdi, M. Ex-ante and ex-post coping strategies for climatic shocks and adaptation determinants in rural Malawi. Clim. Risk Manag. 2020, 27, 100200. [Google Scholar] [CrossRef]
  10. Jones, N.; Clark, J. Social capital and climate change mitigation in coastal areas: A review of current debates and identification of future research directions. Ocean Coast. Manag. 2013, 80, 12–19. [Google Scholar] [CrossRef]
  11. Flora, C.B. Rural Communities: Legacy and Change; Lapping, M.B., Weinberg, M.L., Eds.; Westview Press: Boulder, CO, USA; Oxford, UK, 1992; p. 17. [Google Scholar]
  12. Fafchamps, M.; Minten, B. Returns to Social Network Capital among Traders. Oxf. Econ. Pap. 2002, 54, 173–206. [Google Scholar] [CrossRef]
  13. Bloch, F.; Genicot, G.; Ray, D. Informal insurance in social networks. J. Econ. Theory 2008, 143, 36–58. [Google Scholar] [CrossRef] [Green Version]
  14. Bloch, F.; Dutta, B. Formation of networks and coalitions. Handb. Soc. Econ. 2011, 1, 729–779. [Google Scholar]
  15. Hsiang, S. Climate econometrics. Annu. Rev. Resour. Econ. 2016, 8, 43–75. [Google Scholar] [CrossRef]
  16. Fafchamps, M.; Gubert, F. The formation of risk sharing networks. J. Dev. Econ. 2007, 83, 326–350. [Google Scholar] [CrossRef] [Green Version]
  17. Parthasarathy, B.; Sontakke, N.; Monot, A.; Kothawale, D. Droughts/floods in the summer monsoon season over different meteorological subdivisions of India for the period 1871–1984. J. Climatol. 1987, 7, 57–70. [Google Scholar] [CrossRef]
  18. Kripalani, R.; Kulkarni, A. Climatic impact of El Nino/La Nina on the Indian monsoon: A new perspective. Weather 1997, 52, 39–46. [Google Scholar] [CrossRef]
  19. Taraz, V. Adaptation to climate change: Historical evidence from the Indian monsoon. Environ. Dev. Econ. 2017, 22, 517–545. [Google Scholar] [CrossRef] [Green Version]
  20. Woolcock, M. Social capital and economic development: Toward a theoretical synthesis and policy framework. Theory Soc. 1998, 27, 151–208. [Google Scholar] [CrossRef]
  21. Adhikari, K.P. Bridging, linking, and bonding social capital in collective action. Collect. Action Prop. Rights CAPRi 2008, 1, 23. [Google Scholar]
  22. Hawkins, R.L.; Maurer, K. Bonding, bridging and linking: How social capital operated in New Orleans following Hurricane Katrina. Br. J. Soc. Work 2010, 40, 1777–1793. [Google Scholar] [CrossRef] [Green Version]
  23. Poortinga, W. Community resilience and health: The role of bonding, bridging, and linking aspects of social capital. Health Place 2012, 18, 286–295. [Google Scholar] [CrossRef]
  24. Matsuura, K.; Willmott, C. Terrestrial Air Temperature and Precipitation: 1900–2006 Gridded Monthly Time Series, Version 1.01. University of Delaware. Available online: http://climate.geog.udel.edu/climate (accessed on 11 September 2017).
  25. Da Rocha Júnior, R.L.; Cavalcante Pinto, D.D.; dos Santos Silva, F.D.; Gomes, H.B.; Barros Gomes, H.; Costa, R.L.; Santos Pereira, M.P.; Peña, M.; dos Santos Coelho, C.A.; Herdies, D.L. An Empirical Seasonal Rainfall Forecasting Model for the Northeast Region of Brazil. Water 2021, 13, 1613. [Google Scholar] [CrossRef]
  26. IndiaMap 2001. ML Infomap: [New Delhi]. 2006. Available online: https://guides.library.upenn.edu/IndiaGISdatasets (accessed on 11 September 2017).
  27. Subbaramayya, I.; Naidu, C. Spatial variations and trends in the Indian monsoon rainfall. Int. J. Climatol. 1992, 12, 597–609. [Google Scholar] [CrossRef]
  28. Dell, M.; Jones, B.F.; Olken, B.A. Temperature shocks and economic growth: Evidence from the last half century. Am. Econ. J. Macroecon. 2012, 4, 66–95. [Google Scholar] [CrossRef]
  29. Iyer, L.; Topalova, P.B. Poverty and Crime: Evidence from Rainfall and Trade Shocks in India. Harv. Bus. Sch. Harv. Bus. Sch. Work. Pap. 2014. [Google Scholar] [CrossRef] [Green Version]
  30. Blakeslee, D.S.; Fishman, R. Weather shocks, agriculture, and crime evidence from India. J. Hum. Resour. 2018, 53, 750–782. [Google Scholar] [CrossRef]
  31. Fishman, R.M. Climate change, rainfall variability, and adaptation through irrigation: Evidence from Indian agriculture. In Working Paper; Columbia University: New York, NY, USA, 2012. [Google Scholar]
  32. Singh, N.; Ranade, A. The Wet and Dry Spells across India during 1951–2007. J. Hydrometeorol. 2010, 11, 26–45. [Google Scholar] [CrossRef]
  33. Guhathakurta, P.; Rajeevan, M. Trends in the rainfall pattern over India. Int. J. Climatol. 2008, 28, 1453–1469. [Google Scholar] [CrossRef]
  34. Narayan, D.; Pritchett, L. Cents and Sociability: Household Income and Social Capital in Rural Tanzania. Econ. Dev. Cult. Chang. 1999, 47, 871–897. [Google Scholar] [CrossRef] [Green Version]
  35. Narayan, D. Social Capital and Economic Development: Well-Being in Developing Countries; Chapter 4: Bonds and Bridges: Social Capital and Poverty; Edward Elgar Publishing: Cheltenham, UK, 2002. [Google Scholar]
  36. Putnam, R.D. Democracies in Flux: The Evolution of Social Capital in Contemporary Society; Oxford University Press: Oxford, UK, 2002. [Google Scholar]
  37. Woolcock, M.; Narayan, D. Social Capital: Implications for Development Theory, Research, and Policy. World Bank Res. Obs. 2000, 15, 225–249. [Google Scholar] [CrossRef] [Green Version]
  38. Szreter, S.; Woolcock, M. Health by association? Social capital, social theory, and the political economy of public health. Int. J. Epidemiol. 2004, 33, 650–667. [Google Scholar]
  39. Urwin, P.; Di Pietro, G.; Sturgis, P.; Jack, G. Measuring the Returns to Networking and the Accumulation of Social Capital: Any Evidence of Bonding, Bridging, or Linking? Am. J. Econ. Sociol. 2008, 67, 941–968. [Google Scholar] [CrossRef]
  40. Akerlof, G. The Economics of Caste and of the Rat Race and Other Woeful Tales. Q. J. Econ. 1976, 90, 599–617. [Google Scholar] [CrossRef]
  41. Conley, T.G. GMM estimation with cross sectional dependence. J. Econ. 1999, 92, 1–45. [Google Scholar] [CrossRef]
  42. Coate, S.; Ravallion, M. Reciprocity without commitment: Characterization and performance of informal insurance arrangements. J. Dev. Econ. 1993, 40, 1–24. [Google Scholar] [CrossRef]
  43. De Weerdt, J.; Fafchamps, M. Social identity and the formation of health insurance networks. J. Dev. Stud. 2011, 47, 1152–1177. [Google Scholar] [CrossRef] [Green Version]
  44. De Weerdt, J.; Dercon, S. Risk-sharing networks and insurance against illness. J. Dev. Econ. 2006, 81, 337–356. [Google Scholar] [CrossRef]
Figure 1. Average annual long-term climate patterns, by districts, in India (1981 to 2010). Left: The average annual long-term rainfall levels of all districts in India (1981 to 2010). Right: The average annual long-term temperature levels of all districts in India (1981 to 2010).
Climate 10 00149 g001
Figure 2. Annual deviations from the long-term rainfall patterns, across India, for 2005 and 2012. Left: The annual deviations (positive and negative) from the long-term precipitation patterns, across India, 2005 and 2012. Right: The annual deviations (positive and negative) from the long-term temperature patterns, across India, in 2005 and 2012.
Climate 10 00149 g002
Figure 3. The 31-year moving average of the annual deviation from the long-term precipitation levels across India from 1900 to 2012.
Climate 10 00149 g003
Figure 4. Spatial variation based on differences between the three-year and five-year average rainfall deviation levels for 2000 to 2003 and 2007 to 2010. Left: The spatial variation in differences in three-year rainfall shocks for 2007 to 2010 and 2000 to 2003. Right: The spatial variation in differences in five-year average rainfall shocks for 2010 to 2005 and 2005 to 1998.
Climate 10 00149 g004
Figure 5. Communities surveyed in the Indian Human Development Survey (IHDS) (all districts surveyed during the first wave of the IHDS). Source: Indian Human Development Survey (IHDS).
Climate 10 00149 g005
Table 1. Summary statistics of the key outcome variables and key climate variables.
Outcome20052012%
Key VariablesMean/sdMean/sdChange
Bridge0.060.0842.7%
(0.07)(0.07)
Link3.694.2114.2%
(1.76)(1.46)
Bond3.123.7519.9%
(1.26)(1.39)
Number of loans1.571.9826.1%
(0.39)(0.39)
Percentage of loans from family members12.6318.8249.0%
(0.33)(0.39)
Number of businesses1.091.111.8%
(0.31)(0.34)
Reported collaboration58.3373.5126.0%
(26.46)(18.71)
Reported conflict15.4014.63−5.0%
(9.87)(9.33)
Private tubular wells0.180.2222.2%
(0.39)(0.41)
Climate Shocks
Key Variablesmean/sdmean/sdChange
Average Temperature Deviations−12.385.00−140.4%
(22.05)(20.75)
Average Rainfall Deviations0.26−0.01−105.4%
(0.33)(0.27)
Average Rainfall Deviations (3 Years)0.731.1050.0%
(0.53)(0.57)
Average Positive Rainfall Deviation (3 Years)15.3625.4665.8%
(8.03)(14.36)
Average Negative Rainfall Deviation (3 Years)0.860.77−10.4%
(0.56)(0.64)
N20,94120,941
Source: Estimates were derived from IHDS Survey Waves I and II, while the climate measures were extracted from Terrestrial Temperature and Rainfall: 1901 to 2014; Gridded Monthly Time Series Version 4.01 [24].
Table 2. Results assessing the impacts of climate shocks (3-year averages) on the key measures of social capital.
123456789
BridgeStdLinkStdFamilyNetStdBridgeStdLinkStdFamilyNetStdBridgeStdLinkStdFamilyNetStd
Average Rainfall Deviations−0.026−0.130 *−0.064 **−0.021−0.150 **−0.080 ***−0.024−0.148 **−0.077 **
(0.031)(0.067)(0.031)(0.032)(0.072)(0.031)(0.032)(0.073)(0.033)
Average Temperature Deviations0.039−0.181 ***−0.0260.034−0.186 ***−0.0300.046−0.198 ***−0.043
(0.037)(0.057)(0.029)(0.037)(0.058)(0.031)(0.037)(0.059)(0.032)
Rainfall Deviations (3 Yr Average)0.079 **−0.142 **−0.172 ***
(0.034)(0.056)(0.035)
Positive Rainfall Shocks
(3 Yr Average)
0.005 **−0.005 *−0.005 **
(0.002)(0.003)(0.003)
Negative Rainfall Shocks
(3 Yr Average)
−0.0370.162 ***0.138 ***−0.0390.166 ***0.141 ***
(0.039)(0.061)(0.032)(0.040)(0.063)(0.033)
N40,41940,41940,41940,41940,41940,41940,41940,41940,419
adj. R–sq0.0110.0390.0200.0110.0420.0190.0090.0400.017
Notes: Table 2 reports the results of the impacts of climate shocks on key measures of social network relationships. Lagged climate shocks represent temperature and precipitation anomalies occurring in the year before the survey period. Average climate anomalies represent average positive temperature anomalies and negative precipitation anomalies occurring over the periods 2000 and 2003 and 2007 and 2010. Village controls, as well as time and household fixed effects, are included in the model. Errors were generated using spatial HAC correction based on Conley [42]. Standard errors are in parenthesis. * p < 0.10; ** p < 0.05; *** p < 0.01.
Table 3. Results assessing the impacts of lagged and repeated rainfall shocks on key measures of social capital.
123
BridgeStdLinkStdFamilyNetStd
Average Rainfall Deviations−0.017−0.147 **−0.075 **
(0.031)(0.070)(0.033)
Average Temperature Deviations0.050−0.202 ***−0.045
(0.035)(0.058)(0.032)
Repeated Negative Rainfall Shocks−0.018 ***0.035 ***0.027 ***
(3 Yr)(0.005)(0.009)(0.007)
N40,41940,41940,419
R–sq0.0120.0420.018
adj. R–sq0.0110.0410.018
Notes: Table 3 reports results assessing the impacts of lagged and repeated rainfall shocks on key measures of social network relationships. Repeated rainfall shocks are districts in India that have experienced consecutive years of negative rainfall shocks over 3 years. For these districts, I estimated the total number of anomalies over the period 2000 (1998) and 2003 and 2007 (2005), and 2010. Rainfall and Village controls, as well as time and household fixed effects, are included in the model. Errors were generated using spatial HAC correction based on Conley [42]. Standard errors are in parenthesis. ** p < 0.05; *** p < 0.01.
Table 4. Exploring the motives for investment in social networks.
12345
Ln (# of Loans)Loans from Family MembersNumber of BusinessesCollaborationAccess to Private Wells
BridgeStd0.0510 **−0.0171 **−0.01970.004950.000782
(0.021)(0.008)(0.016)(0.008)(0.005)
LinkStd0.0868 ***0.0250 ***0.0364 ***0.0388 ***0.00629
(0.017)(0.006)(0.012)(0.009)(0.004)
FamilyNetStd0.0130−0.00446−0.002010.0008390.0121 ***
(0.014)(0.006)(0.018)(0.010)(0.004)
N40,35640,386655340,38640,138
R-sq0.0450.0130.0340.0320.010
adj. R-sq0.0440.0120.0290.0320.010
Notes: Table 4 reports the results exploring motives for investing in social networks, based on the survey responses. Village controls, as well as time and household fixed effects, are included in the model. Errors were generated using spatial HAC correction based on Conley [42]. Standard errors are in parenthesis. ** p < 0.05; *** p < 0.01.
Publisher’s Note: MDPI stays neutral with regard to jurisdictional claims in published maps and institutional affiliations.

