


Abstract
The relationship between capital structure and firm market valuation remains a central yet unresolved question in corporate finance, with outcomes shaped critically by industry-specific asset structures and financing environments. This study investigates how capital structure influences market valuations across two structurally divergent sectors in India, the asset-light information technology (IT) industry and the asset-intensive automobile industry, using balanced panel data for 14 firms in each sector over 2005–2024. Fixed effect and random effect panel regression models are employed to isolate the direct effect of leverage on earnings per share (EPS), with model selection determined by the Hausman specification test. Complementing these estimations, the Graphical Lasso is applied to recover a sparse conditional dependence network among key financial variables, an approach particularly suited to this research question, as capital structure, profitability, tangibility, and growth are jointly determined, rendering pairwise correlations insufficient for identifying genuine financial linkages. The findings establish that debt exerts a positive and statistically significant effect on market valuations in both sectors, but through distinct economic channels: moderate leverage amplifies profitable growth signals in IT firms, while tax shield benefits drive valuation in automobile firms, constrained by asset tangibility and debt-servicing thresholds. These results support trade-off theory in the automobile sector and pecking order logic in the IT sector, underscoring that sector-specific financing strategies yield superior valuation outcomes compared to universally applied capital structure prescriptions.
Keywords:
capital structure; market valuations; IT sector; automobile sector; panel data; graphical lasso; India JEL Classification:
C23; G32; D82
1. Introduction
Capital structure decisions continue to be a foundational pillar of corporate finance, drawing keen interest from financial managers, policymakers, regulators, and academics. These decisions significantly affect a firm’s capacity to maximise shareholder wealth by impacting market valuation, profitability, and long-term financial stability. Capital structure, the mix of equity and debt used to fund a firm’s operations (Ayalew, 2021), is vital to strategic financial management. When optimally configured, it reduces the weighted average cost of capital (WACC), enhances competitiveness, and mitigates bankruptcy risk. The critical nature of sound financing strategies was exposed during the 2008 global financial crisis and the COVID-19 pandemic, as over-leveraged firms encountered acute liquidity crises and elevated default risk (Prakash et al., 2023; Vo et al., 2022).
Although theoretical frameworks suggest that firm value is maximised when WACC is minimised, actualising this balance remains a formidable challenge because of sector-specific characteristics, shifting market conditions, and managerial incentives (Ayalew, 2021). While increased leverage may boost returns, it also raises default risk, making managing capital structure a delicate strategic task. Canonical theories diverge in their prescriptions: Modigliani and Miller (1958) argued that under perfect, tax-exempt conditions, capital structure is irrelevant, with firm value dependent solely on asset risk and earnings; their later extension (1963) introduced the benefit of a debt-induced tax shield, recognising how interest deductibility can enhance firm value to an optimal inflexion point. Meanwhile, pecking order theory (Myers & Majluf, 1984) foregrounds information asymmetry between managers and investors, positing that firms prefer internal financing, followed by debt, and resort to equity only when necessary (Rathnasingha & Heiyanthuduwa, 2019; Bhamaa et al., 2015).
A substantial body of empirical work has examined the capital structure–firm value nexus across diverse settings. Early cross-country studies (Frank & Goyal, 2009; De Jong et al., 2008) established that leverage determinants vary significantly across institutional contexts and industries, yet predominantly drew on developed-market data. Subsequent research on emerging economies, including studies on China, Brazil, and India, confirmed that information asymmetry, market development, and regulatory frameworks materially alter the predictions of classical theories (Booth et al., 2001; Chakraborty, 2010). Within India specifically, existing studies either pool all listed firms without distinguishing sectors (Prakash et al., 2023) or examine a single industry in isolation, thereby masking important cross-sectoral heterogeneity. Moreover, the prevailing methodological reliance on standard panel regressions captures only direct linear relationships between leverage and valuation, leaving the conditional interdependencies among multiple financial variables, such as asset tangibility, profitability, interest coverage, and growth, largely unmapped. This study addresses both gaps simultaneously.
Despite decades of empirical inquiry, the capital structure–firm value link remains ambiguous, with variations driven by industry, geographic context, and firm attributes (Frank & Goyal, 2009). Moreover, much of the evidence pertains to developed markets, and sector-level analyses in emerging economies, particularly India, are comparatively scarce. Studies often overlook important heterogeneity in sectoral dimensions like asset base, profitability drivers, and capital intensity. Addressing this lacuna is crucial, particularly within single economies where multiple sectors operate under distinct operational paradigms. India offers an ideal setting for such a nuanced investigation. Its economy comprises asset-light, rapidly growing sectors like IT, which typically lean on equity and maintain low leverage, and asset-heavy sectors like automobiles, which commonly shoulder high debt burdens due to substantial infrastructure requirements. These contrasting dynamics make examining whether established capital structure theories hold across such heterogeneous sectors within the same emerging-market context essential. However, existing studies on India mostly focus either on aggregate listed firms or on single industries, and they predominantly rely on standard panel regressions without modelling the networked interdependencies among key financial variables. As a result, we still know little about how capital structure and market valuation coevolve across contrasting sectors within a single emerging economy, or about how firms’ balance sheet linkages shape these relationships.
In light of this, the present study pursues four interrelated objectives: first, to trace and compare the capital structure trends of Indian IT and automobile firms from 2005 to 2024; second, to assess the relationship between capital structure and market valuation within each sector; third, to evaluate the applicability of Modigliani–Miller and pecking order theories in these contrasting contexts. Fourth, we map the conditional dependence structure among capital structure, profitability, asset tangibility, interest coverage, sales growth, and firm size using a sparse Gaussian graphical model (Graphical Lasso), thereby moving beyond simple correlations. Unlike conventional correlation matrices, which capture only pairwise linear associations, the Graphical Lasso recovers a sparse network of conditional dependencies after controlling for all other variables, allowing us to identify which financial indicators are directly connected to market valuation in each sector rather than merely associated through common factors. This method is particularly well-suited to the economic question at hand: when multiple financial variables are jointly determined, as is typical in corporate financing decisions, standard regression cannot disentangle whether, say, profitability drives valuation independently of leverage, or only through it. The Graphical Lasso resolves this by estimating partial correlations, isolating genuine direct links from spurious indirect ones. In this way, it provides information that complements rather than duplicates the fixed and random effects panel regressions (Friedman et al., 2008).
This study makes three distinct contributions to the existing literature. First, it provides new sector-specific evidence on the capital structure–market valuation nexus for Indian IT and automobile firms over a nearly two-decade horizon (2005–2024), a period spanning two major global shocks that existing Indian studies do not cover with this sectoral granularity. Second, it offers a joint examination of this nexus across an asset-light and an asset-intensive setting within the same institutional environment, thereby controlling for country-level factors while isolating industry-level mechanisms and an identification strategy largely absent in prior work. Third, it makes a methodological contribution by combining fixed/random effects panel models with machine learning-based network analysis, enabling researchers to uncover how financial variables are conditionally connected rather than merely pairwise correlated, a distinction that matters for both theory testing and practical financial decision-making. The practical import of these findings extends beyond India: any economy that hosts both knowledge-intensive and capital-intensive industries faces the same fundamental question: whether a single financing prescription can serve firms with such divergent operational profiles. This study provides an empirically grounded answer.
Furthermore, the study contributes to the literature by providing sector-specific evidence from India, moving beyond aggregate national findings while empirically testing classic theories in contemporaneous settings. Its policy and managerial significance lie in offering guidance on tailoring capital structure strategies to industry characteristics and informing regulators designing sector-adapted financial frameworks. The study is anchored by four research questions: (1) How do capital structure patterns differ between the IT and automobile sectors over 2005–2024? (2) What is the linkage between capital structure and market valuation in each sector? (3) Do canonical capital structure theories explain financing behaviours in these divergent sectors? (4) How are capital structure and market valuation variables embedded in a broader network of firm-level financial characteristics in each sector?
Contemporary research further emphasises the importance of sector-specific and emerging-market dynamics. For instance, a panel data study found that macroeconomic factors like bank rate, GDP growth, inflation, and public debt significantly influence capital structure decisions in the Indian automotive sector. An empirical exploration of IT and automobile capital structure effects on firm performance underscores the role of industry differentiation and regulatory contexts in shaping financing outcomes. Preliminary descriptive analysis confirms that the IT sector has exhibited a steady reduction in debt-to-equity ratios over the period, reflecting reliance on equity and cautious leverage. Meanwhile, the automobile sector has shown persistently higher and more volatile leverage. These patterns illuminate the interplay between operational logic, asset structure, and financing strategy. By examining these dynamics in tandem, this study enriches the understanding of theory–practice alignment across sectors in emerging markets. Taken together, these features clarify how this study advances prior work on capital structure and market valuation in India: it offers a longer horizon, a sharper sectoral lens, and a richer modelling framework that jointly captures causal effects and network structure.
The empirical findings reveal that capital structure has a positive, statistically significant effect on market valuation in both sectors, but through distinct economic mechanisms. In IT firms, moderate debt amplifies the signal of profitable growth opportunities: because these firms generate strong internal cash flows and face low asset tangibility constraints, a judicious increase in leverage credibly signals managerial confidence without materially raising distress costs, thereby boosting Tobin’s Q. In automobile firms, leverage enhances valuation primarily through the tax shield benefit, but this effect is bounded by fixed-asset commitments and debt-servicing capacity beyond a threshold; beyond that threshold, additional debt raises default risk and erodes market value. These patterns broadly support trade-off theory in the automobile sector and pecking order logic in the IT sector, confirming that no single canonical theory dominates across heterogeneous industries. The Graphical Lasso networks further reveal that profitability is the central node connecting leverage to valuation in IT firms, while asset tangibility occupies that bridging role in automobile firms—an insight undetectable through regression alone.
2. Literature Review and Hypothesis Development
Capital structure and its impact on firm performance have been extensively studied in the finance literature. However, the relationship between leverage and market-based performance measures, such as earnings per share (EPS), remains inconclusive and context-dependent. While numerous studies have examined accounting-based indicators like return on assets (ROA) or return on equity (ROE), fewer have analysed market valuation proxies, especially within sector-specific settings in emerging economies. This gap is particularly relevant for India, where industries such as information technology (IT) and automobiles exhibit fundamentally different capital structures due to contrasting operational and asset characteristics. Being asset-light and innovation-driven, the IT sector generally relies on equity financing, whereas the capital-intensive automobile sector often depends heavily on debt financing. Understanding how financial structure interacts with market valuation in these divergent contexts is critical for corporate managers and policymakers. Given this inconsistency in prior findings, this study adopts a sector-specific lens grounded in trade-off, pecking order, and agency theories to derive hypotheses that reflect the distinct financial logic of India’s IT and automobile sectors, rather than assuming a universal direction of effects.
2.1. Capital Structure and Market Valuations
Empirical studies report mixed evidence on the effect of capital structure on market valuation. Several authors find that higher leverage adversely impacts EPS, reflecting the potential costs of financial distress and agency conflicts. Khan et al. (2020) observed a negative relationship between EPS and leverage, while Siddik et al. (2017), examining 22 Bangladeshi banks, found that both short-term debt to total assets (STDTA) and long-term debt to total assets (LTDTA) significantly reduced EPS. Similarly, Ahmed et al. (2023), analysing manufacturing companies on the Tehran Stock Exchange, concluded that capital structure decisions negatively affected EPS. Amin and Cek (2023) further demonstrated that deviations in the debt-to-equity ratio from the “golden ratio” negatively influenced EPS in UK and French firms.
Conversely, some evidence supports a positive association between leverage and market valuation. Olokoyo (2013) reported that all leverage ratios positively correlated with market performance, while Zafar et al. (2016) found a positive link between total debt to total assets (TDTA) and EPS. Vuong et al. (2017) identified a positive but statistically insignificant effect of long-term debt on UK firms’ EPS. These contradictory findings highlight the possibility that industry structure, market maturity, and macroeconomic conditions influence the leverage–valuation nexus. The conflicting evidence across contexts suggests that the direction of the capital structure–EPS relationship is contingent on sector-specific financial characteristics rather than universal. In India’s IT sector, where firms are minimally leveraged and equity-driven, trade-off theory’s tax shield benefit may be less operative, while agency costs of debt are also lower. In contrast, India’s capital-intensive automobile sector operates with substantially higher leverage, where the trade-off between tax benefits and financial distress costs becomes more pronounced. This sector-specific heterogeneity justifies testing the relationship empirically within each sector separately, rather than imposing a directional assumption.
Hypothesis 1.
Capital structure significantly affects market valuations.
2.2. Profitability and Market Valuations
The relationship between profitability and market valuation is often explained through pecking order theory (Myers & Majluf, 1984), which suggests that profitable firms prefer internal financing, thereby reducing reliance on debt. Empirical evidence generally supports a negative leverage–profitability association. Olokoyo (2013) and Shahzad and Azeem (2020) found negative correlations between leverage and ROA. Studies by Salim and Yadav (2012), Vatavu (2015), Vy and Nguyet (2017), and Ebaid (2009) also confirmed that higher debt ratios reduced profitability. Siddik et al. (2017) documented similar results for Bangladeshi banks, while Sharma (2018) reported that ROA was negatively associated with leverage for BSE-listed real estate firms. However, Dalci (2018), in a study of Chinese manufacturing firms, observed a non-linear relationship: profitability initially increased with moderate debt levels but declined beyond a threshold due to financial distress risks. These findings suggest that the leverage–profitability–valuation link may be contingent on sectoral and financial conditions. While the above evidence focuses on the leverage–profitability channel, the direct effect of profitability on market valuation is theoretically grounded in signalling theory: higher ROA signals superior management efficiency and earnings generation capacity to investors, which is likely to translate into higher EPS (Ross, 1977). In India’s IT sector, where firms generally exhibit stronger profitability and higher margins, this signal is expected to be particularly salient, whereas in the automobile sector, profitability’s contribution to market valuation may be moderated by higher debt-servicing costs. This dual-sector context supports examining the profitability–valuation nexus as a key hypothesis.
Hypothesis 2.
Profitability significantly affects market valuations.
2.3. Asset Tangibility and Market Valuations
Asset tangibility—the ratio of net property, plant, and equipment to total assets—affects firms’ borrowing capacity and financing costs. Trade-off theory posits that tangible assets provide collateral, reducing lender risk and supporting higher leverage (Harris & Raviv, 1991). M’ng et al. (2017) found a positive and significant link between asset tangibility and leverage in Malaysia and Singapore. Al-Najjar and Taylor (2008) reported a positive association for UK firms. However, contrary evidence exists. Alipour et al. (2015) and Psillaki and Daskalakis (2009) documented negative correlations between asset structure and debt ratios in Iranian and Southern European firms, respectively. Such divergence may reflect differences in asset liquidity, legal enforcement, and industry-specific financing norms. The divergence in prior findings is particularly informative for the present study, as asset tangibility differs fundamentally across the two sectors under examination. IT firms in India are predominantly asset-light, with tangible assets that have limited collateral value and may not directly drive EPS. Conversely, automobile firms carry substantially higher tangibility, reflecting heavy investment in plant and machinery. Within the trade-off framework, higher tangibility in the automobile sector facilitates debt capacity, which could enhance EPS through tax shields but may simultaneously constrain valuation if asset intensity reduces flexibility. This context-specific ambiguity motivates an empirical test of asset tangibility’s effect on market valuation across both sectors.
Hypothesis 3.
Asset tangibility significantly affects market valuations.
2.4. The Relationship Between the Interest Coverage Ratio and Market Valuations
A study by Nasimi (2016) empirically analysed the effect of capital structure on the performance of 30 companies listed on the FTSE-100, London Stock Exchange, United Kingdom. The findings indicated a negative correlation between the debt-to-equity ratio and the interest coverage ratio. Similarly, a study of 129 Greek companies listed on the Athens Stock Exchange from 1997 to 2001 examined how firm characteristics affected capital structure. The interest coverage ratio was expressed as net income before taxes divided by interest payments. It showed an inverse relationship with the debt ratio (defined as the total debt divided by total assets) (Eriotis et al., 2007). From a theoretical standpoint, the interest coverage ratio (ICR) signals a firm’s debt-servicing capacity and financial resilience to investors and creditors. A higher ICR implies that operating earnings comfortably cover interest obligations, reducing perceived default risk and supporting favourable market valuations. In the context of this study, there are marked differences in leverage structures and earnings stability between the IT and automobile sectors, suggesting that while both may show a positive ICR–EPS relationship, its magnitude and significance are likely to differ. This sector-level heterogeneity provides a theoretical basis for testing the ICR as a determinant of market valuation in this study.
Hypothesis 4.
Interest coverage ratio significantly affects market valuations.
2.5. Sales Growth and Market Valuations
Sales growth is an important determinant of firms’ financing strategies and their valuation in the market. High-growth firms generally require more external financing, which may affect their capital structure and, consequently, their market performance. Ahmed et al. (2023), analysing 156 manufacturing companies listed on the Tehran Stock Exchange between 2011 and 2019, found that annual sales growth (ASG), measured as the year-on-year percentage increase in sales, was positively associated with EPS. Similarly, Khan et al. (2020) suggested that growth in sales, defined as the ratio of change in current year sales to the previous year’s sales, was positively correlated with EPS, thereby indicating that growth opportunities enhance shareholder returns. However, the evidence is not uniformly consistent. Chakrabarti and Chakrabarti (2019), using panel data from 141 Indian energy firms, reported that sales growth had an insignificant effect on leverage, suggesting that growth opportunities may not directly influence financing patterns in all industries. Likewise, Vuong et al. (2017) examined UK firms from 2006 to 2015 and found that asset growth, a proxy for expansion, did not significantly affect EPS. These mixed results suggest that the impact of growth on market valuation is highly context-dependent, influenced by industry structure, capital intensity, and macroeconomic conditions. The inconsistency in prior findings across economies and sectors suggests that the growth valuation link is mediated by financing. In asset-light IT firms, sales growth is more likely to translate directly into higher EPS because incremental revenue requires relatively little additional fixed capital investment. In contrast, growth in the automobile sector typically demands debt-funded capacity expansion, which may dilute EPS in the short term even as revenues rise. This sector-contingent logic, grounded in pecking order and trade-off theory, provides the basis for including sales growth as a control variable and for testing its effect on market valuation across sectors.
Hypothesis 5.
Sales growth significantly affects market valuations.
2.6. The Relationship Between Firm Size and Market Valuations
Firm size is a key determinant of financing strategy and market valuation. Larger firms generally enjoy easier access to capital markets, lower financing costs due to reduced risk perception, and greater capacity to diversify investments. M’ng et al. (2017), in their comparative study of publicly listed firms across Malaysia, Singapore, and Thailand, found that firm size (measured as the natural logarithm of net sales) had a significant positive influence on leverage. Extending this, Khan et al. (2020) showed that firm size, measured as the natural logarithm of total assets, positively correlated with EPS, suggesting that size confers valuation advantages. Al-Najjar and Taylor (2008) also confirmed a strong positive association between firm size and leverage in Jordanian non-financial firms, while Siddik et al. (2017) found that firm size significantly improved EPS in Bangladeshi banks. Unlike the other determinants, the evidence on firm size is relatively consistent in direction, supporting a positive size–EPS relationship. This is theoretically coherent with agency theory: larger firms face lower information asymmetry, attract greater analyst coverage, and can leverage economies of scale to generate higher per-share earnings (Jensen & Meckling, 1976). In the Indian context, where there is substantial dispersion in firm size within both sectors, controlling for size is empirically important to isolate the independent effect of capital structure on market valuation.
Hypothesis 6.
Firm size significantly affects market valuations.
This contrasts with earlier research that primarily focuses on analysing the effect of capital structure on profitability metrics, such as return on assets (ROA) and return on equity (ROE). This study fills a significant gap in understanding the association between capital structure and market valuation. In contrast, this research employs a different approach, EPS, as a proxy for market capitalisation and considers it a dependent variable. The main goal is to explore how capital structure affects the market value of companies. This analysis includes how EPS connects with various financial metrics, including the debt-to-equity ratio, ROA, asset tangibility, interest coverage ratio, sales growth, and firm size. Sales growth and firm size majorly impact performance and are considered control variables. By filling this gap, this research provides a more comprehensive understanding of the factors influencing EPS, thereby contributing to the broader discourse on corporate financial performance and its impact on the market. This study focuses on examining the direct effect of capital structure on EPS. It adds to the previously existing evidence regarding the impact of capital structure on market-based performance measures. The study uses annual data from 2005 to 2024, and this research unveils differences in capital structure decisions across the IT and automobile sectors. This undoubtedly contributes to the existing literature regarding a more extensive dataset. With its asset-light, intellectual property-driven business models, the IT sector generally relies on equity financing to finance its growth activity. The highly capital-intensive automobile industry requires significant investment for physical infrastructure that depends on debt financing. This contrast illustrates how industry-specific dynamics influence financial strategies, offering valuable insights for stakeholders to optimise capital structures in diverse economic landscapes.
3. Data and Methodology
3.1. Sample and Data Collection
This study investigates the relationship between capital structure and market valuations in India’s information technology (IT) and automobile sectors. The sample comprises 14 IT and 14 automobile companies, all listed on the Nifty 500 Index. The choice of Nifty 500 constituents ensures that the analysis focuses on relatively large, actively traded firms with reliable and consistently disclosed financial information, which is essential for constructing a balanced panel over a long horizon. Within the IT and automobile sectors of the Nifty 500, firms were selected using the following screening criteria: (i) continuous listing and availability of annual financial data for the entire sample period, (ii) non-financial nature of the business, and (iii) absence of prolonged trading suspensions or extreme data gaps that would compromise the integrity of the panel. Firms that did not meet these criteria were excluded, resulting in a final balanced sample of 14 IT and 14 automobile firms. The excluded firms mainly comprise companies that were delisted, merged, or experienced substantial data discontinuities during 2005–2024; as such, the final panel effectively reflects a “survivor” cohort of large, continuously listed firms. To gauge the impact of potential survivorship bias, we additionally estimated unbalanced panel specifications that included firms with shorter but uninterrupted data histories within the same sectors and found that the signs and statistical significance of the key coefficients (DTE, ROA, and Size) remained qualitatively unchanged. Although this sample does not cover every listed firm in either sector, it captures a substantial share of sectoral assets and market capitalisation among India’s large, exchange-listed companies and is thus reasonably representative of the core segment of both industries. The focus on IT and automobile sectors is deliberate: they represent, respectively, a prototypical asset-light, innovation-driven industry and a prototypical asset-intensive, manufacturing-based industry within the same institutional environment. This contrast allows us to examine how the capital structure–market valuation nexus behaves under markedly different asset structures and financing needs, thereby helping to clarify the ambiguous evidence reported in prior studies that often pool heterogeneous industries. The time horizon for this study covers 2005 to 2024. This period is chosen to span multiple phases of India’s economic and financial development, including the pre-global financial crisis years, the 2008–2009 crisis, the subsequent recovery, and the COVID-19 shock, thereby allowing us to observe capital structure and valuation dynamics across different macro-financial regimes rather than in a single, narrow cycle. It also reflects the maximum period for which consistent firm-level data are available for the screened sample in the CMIE Prowess database. Financial data were obtained from multiple secondary sources, primarily the Centre for Monitoring Indian Economy (CMIE) Prowess Database, which is widely recognised for its reliability in corporate financial research. Additional firm-level data were collected from companies’ official websites, and annual reports were published to cross-verify information and ensure accuracy.
3.2. Variables and Measurements
Drawing on the established literature, this study identifies a set of explanatory and control variables to capture the multidimensional relationship between capital structure and market valuation. The dependent variable is market valuation, proxied by earnings per share (EPS), which reflects shareholder returns and serves as a market-based performance measure. EPS is widely used in empirical studies examining the leverage–performance nexus because it directly captures per-share earnings available to equity holders and is readily observable for all listed firms over long periods (Khan et al., 2020; Ahmed et al., 2023). Although alternative valuation metrics such as Tobin’s Q or the price-to-book ratio also reflect market assessments, their construction typically requires detailed market and replacement cost data that are not consistently available for all sample firms over 2005–2024, especially during periods of regulatory change and index reconstitution. Moreover, Tobin’s Q can be highly sensitive to short-term price swings and speculative episodes, whereas EPS provides a more stable, earnings-based view of market valuation. In light of these data and comparability considerations, we adopt EPS as the primary proxy for market valuation and later assess the robustness of our findings using alternative market-based indicators in additional checks. The key independent variables include capital structure ratios (e.g., debt-to-equity), profitability (ROA), asset tangibility, interest coverage ratio (ICR), sales growth, and firm size. Sales growth and firm size are also treated as control variables due to their established influence on financial performance (Ahmed et al., 2023; M’ng et al., 2017). Table 1 presents the variables, their symbols, proxies, and measurement definitions.
Table 1.
Overview of variables used in this study.
3.3. Econometric Models
The study employs panel data econometric techniques to examine the causal relationship between capital structure and market valuations. Both a fixed effects model (FEM) and random effects model (REM) are estimated to account for unobserved firm-level heterogeneity across the sample.
- The fixed effects model (FEM) controls for time-invariant firm-specific characteristics, isolating the effect of explanatory variables on market valuation.
- The random effects model (REM) assumes variation across firms is random and uncorrelated with independent variables, allowing for greater efficiency if the assumption holds.
To determine the more appropriate specification, the Hausman test is conducted. A significant test statistic favours the FEM, while a non-significant outcome supports the REM (Hausman, 1978). This triangulated approach is consistent with prior research on capital structure and performance (Siddik et al., 2017; Vuong et al., 2017).
To mitigate potential endogeneity and omitted variable bias, several design choices are adopted. First, the key explanatory variables are included in lagged form in additional specifications (not reported here for brevity but available upon request), so that capital structure and related firm characteristics are measured prior to EPS, mitigating reverse-causality concerns. Second, firm fixed effects (in the FEM specification) absorb all time-invariant unobserved heterogeneity, such as business model and governance culture, while year dummies (included in all models) capture common macroeconomic and regulatory shocks, reducing omitted variable bias from time-varying aggregate factors. Third, all baseline estimates are complemented with heteroscedasticity- and cluster-robust standard errors at the firm level to address remaining concerns about non-constant variance and within-firm error correlation. These steps do not fully eliminate endogeneity but enhance the robustness and credibility of the empirical associations documented in the subsequent analysis.
3.4. Rationale for Methodological Choice
Panel data methodology is particularly suitable for this study for three reasons. First, it combines cross-sectional and time-series dimensions, enhancing the robustness of the estimates. Second, controlling for unobservable firm-specific factors helps mitigate multicollinearity problems and omitted variable bias. Third, the 20-year span across two distinct industries enables analysis of both sectoral patterns and dynamic changes in financing behaviour. However, fixed and random effects panel regressions alone do not reveal how the explanatory variables are interrelated once common variation is partialled out. For this reason, we complement the FEM/REM estimations with the Graphical Lasso, which estimates a sparse Gaussian graphical model and recovers the pattern of conditional dependencies among EPS, capital structure, profitability, tangibility, interest coverage, growth, and firm size (Friedman et al., 2008). Unlike simple correlation matrices that capture only pairwise associations, the Graphical Lasso identifies which links remain when all other variables are held constant, thereby providing a network-based perspective that is genuinely complementary to the regression results rather than a duplication of them.
Equation of panel data fixed effects regression model for the automobile and IT sectors:
Yit = αi + β0X1it + β1X2it + µit
Yit: The dependent variable for firm i at time t.
αi: The firm-specific fixed effect, capturing unobservable factors that vary across firms but remain constant over time.
X1it: The independent variable 1 for firm i at time t.
X2it: The independent variable 2 for firm i at time t.
β0, β1: Coefficients representing the effect of X1it and X2it on Yit.
μit: The error term for firm i at time t, capturing the variation unexplained by the model.
EPSit = αi + β0(DTEit) + β1(ROAit) + β2(TANGit) + β3(ICRit) + β4(SGit) + β5(Sizeit) + µit
i = 14; T = 2005–2024 (IT sector).
i = 14; T = 2005–2024 (automobile sector).
Equation of the random effects regression model for the Automobile and IT sectors:
Yit = αi + β0X1it + β1X2it + µit + ɛit
Yit: The dependent variable for firm i at time t.
αi: The global constant, representing the baseline value of Yit across all entities and periods.
X1it: The independent variable 1 for firm i at time t.
X2it: The independent variable 2 for firm i at time t.
β0, β1: Coefficients representing the effect of X1it and X2it on Yit.
μit: Captures unobserved heterogeneity across firms (i), assuming these effects are random and unrelated to the independent variable (X1it).
ɛit: This error term varies across both firms (i) and time periods (t).
EPSit = αi + β0(DTEit) + β1(ROAit) + β2(TANGit) + β3(ICRit) + β4(SGit) + β5(Sizeit) + µit + ɛit
i = 14; T = 2005–2024 (IT sector).
i = 14; T = 2005–2024 (automobile sector).
4. Empirical Results
This section presents the empirical findings on the relationship between capital structure and market valuations in India’s IT and automobile sectors. The analysis uses panel data techniques and is structured sequentially: descriptive statistics, correlation analysis, multicollinearity checks, heteroscedasticity testing, and the Hausman specification test to select the appropriate panel model (fixed effects vs. random effects).
4.1. Descriptive Statistics
Table 2a shows the descriptive statistics for IT firms. The mean EPS is 41.546, while the median is 29.480, suggesting that a few high-performing firms may drive the average upward. The mean debt-to-equity ratio (DTE) is only 0.065, with a median of 0.002, highlighting the sector’s limited reliance on long-term debt financing. Return on assets (ROA) has a mean of 22.98%, suggesting efficient asset utilisation. Asset tangibility (TANG) averages 0.189, confirming that IT firms are asset-light, with relatively low fixed capital investment. Sales growth (SG) shows considerable variability (mean = 19.428; SD = 30.784), reflecting heterogeneity in growth patterns across IT companies. Firm size, measured by total assets, has a large dispersion (mean = 12,218; median = 2350), again highlighting significant differences between large and small firms.
Table 2.
(a) Descriptive statistics for IT sector. (b) Descriptive statistics for automobile sector.
Table 2b presents the descriptive statistics for automobile firms. EPS has a mean of 35.912, lower than in the IT sector, and reflects shocks from crises such as the global financial downturn and the COVID-19 pandemic. The average DTE is 0.751, significantly higher than IT, suggesting firm reliance on debt financing. ROA (mean = 13.19%) is notably lower than in IT, indicating relatively less efficient use of assets. Tangibility (mean = 0.518) confirms the capital-intensive nature of the automobile sector. ICR (mean = 73.99) shows high variability, indicating differences in debt-servicing ability across firms. SG also displays extreme kurtosis and skewness, suggesting outlier firms with rapid expansions or contractions. Firm size (mean = 8706) indicates substantial diversity across automobile companies.
4.2. Correlation Analysis
The correlation heatmaps (Figure 1a,b) summarise bivariate associations and broadly align with sectoral intuition. In IT, EPS negatively correlates with DTE and TANG, indicating that added leverage and higher fixed-asset intensity tend to be penalised by equity markets in an asset-light, knowledge-based setting. EPS correlates positively with ROA, ICR, SG, and Size, suggesting that profitability, debt-servicing capacity, growth, and scale support higher market valuations. In automobiles, EPS correlates positively with ROA, ICR, and Size, but negatively with DTE, TANG, and SG. The negative EPS–DTE association in this capital-intensive sector points to the market’s sensitivity to over-leverage when asset bases are heavy and shocks propagate through operating leverage; the negative link with SG likely reflects the fact that sales expansions in autos often require debt-funded capacity with long gestation, diluting contemporaneous earnings per share.
Figure 1.
(a): Correlation matrix heatmap for the IT sector. (b): Correlation matrix heatmap for the automobile sector.
Furthermore, none of the independent variables are significantly correlated, as their coefficients are below 0.09. Their results are evidenced by the VIF (variance inflation factor), which indicates low multicollinearity among the independent variables. All VIF values are below 10, Hair et al. (2013), as represented in Table 3.
Table 3.
Variance inflation factor.
4.3. Heteroscedasticity Test
The Breusch–Pagan–Godfrey statistics (Table 4) yield p-values of 0.1270 (IT) and 0.0908 (automobiles), leading to non-rejection of homoscedasticity at the 5% level in both panels. While this supports conventional variance estimators, two cautions are worth noting. First, the automobile p-value is close to 0.10; given the heavy-tailed distributions documented above, reporting heteroscedasticity-robust (e.g., White) or cluster-robust (by firm) standard errors alongside conventional ones is good practice. Second, panel settings with sector-wide shocks can exhibit cross-sectional dependence; although not tested here, complementary diagnostics (e.g., Pesaran CD) and, if needed, Driscoll–Kraay standard errors provide additional assurance. These enhancements do not change point estimates but improve the reliability of statistical inference.
Table 4.
Breusch–Pagan–Godfrey test results.
4.4. Cross-Sectional Dependence Test
The cross-sectional dependence (CD) test analyses whether cross-sectional dependency exists in the given panel data for both sectors. Table 5 presents the results of the cross-sectional dependence test for the IT sector. The null hypothesis for the LM tests is that there is no cross-sectional dependency. The outcomes from two tests—the Breusch-Pagan LM test and the Pesaran scaled LM test—indicate the presence of cross-sectional dependence, as both reported p-values are less than 0.005. However, the Pesaran CD test suggests that there is no cross-sectional dependency. Due to the cross-sectional dependency tests, we reject the null hypothesis, so there is cross-sectional dependency among the financial variables. Overall, these findings suggest that the IT panel data have a presence of cross-sectional dependency. Table 6 displays the findings of the cross-sectional dependence test for the automobile sector. All three tests confirm that cross-sectional dependence is present in the automobile data. Their p-values are less than 0.005, so cross-sectional dependence exists in the data. Therefore, using a second-generation panel unit root test for stationarity is appropriate due to the identified issue of cross-sectional dependency.
Table 5.
Cross-sectional dependence test for IT sector.
Table 6.
Cross-sectional dependence test for automobile sector.
4.5. Second-Generation Panel Unit Root Test
The Bai and Ng panel analysis of non-stationarity in idiosyncratic and common components (PANIC) test is a second-generation unit root test for panel data. This test examines unit roots within a panel dataset by differentiating between the idiosyncratic and common components of the analysed variables. The proposed second-generation panel unit root test by Bai and Ng (2004) indicates that the null hypothesis states that the series contains a unit root. In contrast, the alternative hypothesis states that the series is stationary. Table 7 presents the results for the IT sector, and Table 8 shows the results for the automobile sector, where all variables indicate integration of order zero, I(0), suggesting stationarity at levels. The T-statistics for EPS, debt-to-equity (DTE), return on assets (ROA), asset tangibility (TANG), interest coverage ratio (ICR), sales growth (SG), and Size do not exhibit strong evidence of unit roots, as their corresponding p-values are greater than 0.05 in both sectors. This means that all variables are stationary at their level.
Table 7.
Bai and Ng (panel analysis of non-stationarity in idiosyncratic and common) test for IT sector.
Table 8.
Bai and Ng (panel analysis of non-stationarity in idiosyncratic and common) test for automobile sector.
4.6. Panel Cointegration Test
The Pedroni test for cointegration is used to evaluate the long-run relationships among the variables in the IT and automobile sectors, taking into account cross-sectional dependencies. The test includes panel and group statistics, evaluating cointegration from within and between dimensions. Table 9 and Table 10 provide a summary of the Pedroni test results. Since all p-values are more significant than 0.05, the results show that none of the test statistics, including rho-, v-, ADF-, and PP-values, are significant at conventional levels. This suggests the failure to reject the null hypothesis of no cointegration, implying that the variables do not exhibit a stable long-run equilibrium relationship.
Table 9.
Pedroni test for cointegration for IT sector.
Table 10.
Pedroni test for cointegration for automobile sector.
4.7. Empirical Results Using the Hausman Test and Regression Analysis
The Hausman test results are shown in Table 11. To examine whether the fixed effect model (FEM) or the random effect model (REM) is more appropriate for the data, the test’s null hypothesis is that the random effect model is accepted, whereas the alternative hypothesis posits that the fixed effect model is more appropriate. For the IT sector, the results indicate a p-value of less than 0.05. We accept the alternate hypothesis, meaning the fixed effects model (FEM) is more appropriate. In contrast, the automobile sector states that we accept the null hypothesis as the p-value exceeds 0.05. Thus, the random effect model (REM) is more appropriate for this sector.
Table 11.
Hausman test results.
The results from the Hausman test (Hausman, 1978), which yielded a value of 0.0245 (p < 0.05), support the alternative hypothesis. Table 11 indicates that the fixed effect model (FEM) is more suitable for analysing the relationship between market valuations and capital structure in the IT sector. Therefore, we will focus entirely on the results of the fixed effect model and discuss them in detail by using Equation (1).
Table 12 presents the results of the fixed effect model for the IT sector. The variables DTE (debt to equity), ROA (return on assets), TANG (asset tangibility), ICR (interest coverage ratio) and Size have all been found to have a significant and positive impact on EPS (earnings per share) at the 5% significance level. Based on the results, Hypotheses (1), (2), (3), (4), and (6) are verified. It means that all these variables significantly affect EPS in the IT sector. However, the SG (sales growth) variable does not significantly affect EPS at the 5% level. The R2 value indicates that 83% of the variations in market capitalisation can be explained by the independent variables included in the model. Furthermore, the F-statistic indicates the model is an overall fit, statistically significant at the 1% level.
Table 12.
Results of fixed effect model for IT sector.
The results of the Hausman test, which yielded a value of 0.1440 (p > 0.05), lead us to accept the null hypothesis. As shown in Table 11, the random effect model (REM) is more suitable for analysing the relationship between market valuations and capital structure in the automobile sector. Therefore, we will focus entirely on the results of the random effect model and discuss them in detail by using Equation (2). Table 13 presents the findings from the random effect model for the automobile sector. The variables DTE (debt to equity), ROA (return on assets) and Size have all been found to have a significant and positive impact on EPS (earnings per share) at the 5% significance level. In contrast, TANG (asset tangibility), ICR (interest coverage ratio) and SG (sales growth) show a negative and insignificant relationship with EPS. Based on the results, Hypotheses (1), (2), and (6) are verified. This indicates that all these variables significantly affect EPS in the automobile sector.
Table 13.
Results of random effect model for automobile sector.
The R2 value indicates that the model’s independent variables explain 84% of the market capitalisation variations. Additionally, the F-statistic demonstrates that the model’s overall fit is statistically significant at the 1% level.
4.8. Sparse Gaussian Graphical Model for the It Sector Using Graphical Lasso
The Graphical Lasso (Glasso) network for the IT sector is a sparse representation of conditional dependencies between important financial variables of the IT sector. The basis of this network is the sparse Gaussian graphical model (Sparse GGM), which is developed using the Graphical Lasso method. L1 regularisation is applied in this method. It helps to adjust the precision matrix and gives a clearer perspective of complicated financial interactions. An interpretable structure has been created, representing financial independence by removing weak and indirect associations. It helps to identify strong direct linkages. In contrast to the correlation heatmap, which reflects only pairwise associations, the Glasso network highlights links that remain after conditioning on all other variables, so that each edge can be interpreted as a direct dependence rather than a relationship driven by common factors. This makes the network a complementary tool to the FEM/REM regressions by revealing which variables are structurally connected to EPS and to each other in the multivariate system. Figure 2a presents the IT sector’s network. Each node in the network corresponds to a financial indicator for the IT-related enterprises, including the earnings per share (EPS), debt-to-equity ratio (DTE), return on assets (ROA), asset tangibility (TANG), interest coverage ratio (ICR), sales growth (SG), and firm size (Size). EPS is a central node, indicating its strong conditional relationship with various financial variables. It is closely linked to the debt-to-equity ratio, interest coverage ratio, and size, emphasising the significant influence of capital structure and firm size on EPS within the IT sector. The strong connection with the debt-to-equity ratio indicates that leverage may influence profitability. A negative connection between debt-to-equity and firm size signifies that major companies may be less dependent on debt financing. The debt-to-equity ratio is associated with ROA, meaning financing decisions may impact firm profitability. The link between ROA and asset tangibility suggests that an increase in fixed assets may exhibit different profit figures. Sales growth and ROA are connected, which suggests that companies with higher returns on assets tend to perform better in sales. Size and ROA are associated with asset tangibility, meaning asset holding and firm size change affect profitability. The relationship between EPS and the debt-to-equity ratio implies that companies with increased physical assets could affect profitability and capital structure. Sales growth is only connected to ROA, which indicates that it does not directly impact other financial variables in the IT sector.
Figure 2.
(a): Graphical Lasso network for the IT sector. (b): Graphical Lasso network for the automobile sector.
4.9. Sparse Gaussian Graphical Model for Automobile Sector Using Graphical Lasso
This graphical visualisation presents the conditional dependency structure between financial variables in the automobile sector. The Graphical Lasso (Glasso) method designs a sparse Gaussian graphical model (sparse GGM). As in the IT case, the automobile sector network captures conditional rather than simple pairwise relationships, so edges indicate direct connections that remain after controlling for all other variables in the system. This allows us to see whether the pattern of financial linkages surrounding EPS, leverage, and profitability differs structurally from that in the IT sector, over and above the differences already captured by the panel regressions. Figure 2b represents the network of various financial variables, such as earnings per share (EPS), debt-to-equity ratio (DTE), return on assets (ROA), asset tangibility (TANG), interest coverage ratio (ICR), sales growth (SG) and firm size (Size). The firm’s profitability is directly impacted by leverage decisions, as shown through the relationship between ROA and the debt-to-equity ratio. Understanding the link between firm size and asset tangibility, as well as ROA and debt-to-equity, helps signify its role in capital structure and operational efficiency. Large-scale companies have easier access to financing, influence the mix of debt-to-equity proportions and can generate more profits. There is a direct link between debt-to-equity and asset tangibility, which implies that higher use of physical assets in the automobile sector means more debt financing, and it serves as collateral. Asset tangibility and ROA are connected, which implies that firms with more tangible assets may experience fluctuations in profitability due to capital intensity. Similarly, sales growth and ROA are connected, so more incredible sales growth tends to result in more asset returns. It highlights the importance of revenue-driven profitability strategies. EPS, debt-to-equity and asset tangibility are connected with an interest coverage ratio. A higher interest coverage ratio of firms implies more reliable earnings and a sustainable debt burden.
4.10. Robustness Checks and Endogeneity Considerations
To mitigate potential endogeneity and the robustness of the findings, several additional checks were implemented. First, the baseline models for both sectors were re-estimated using lagged values of the key explanatory variables (DTE, ROA, TANG, ICR, SG, and Size) to ensure that capital structure and firm characteristics are measured prior to EPS, thereby mitigating potential reverse causality from market valuations to financing decisions (Frank & Goyal, 2009). Second, all panel regressions were re-estimated with heteroscedasticity- and cluster-robust standard errors at the firm level. The statistical significance and signs of the main coefficients remained qualitatively unchanged, indicating that the results are not driven by heteroscedasticity or within-firm error correlation (De Jong et al., 2008). Third, as an additional specification check, we estimated models excluding one control variable at a time and confirmed that the coefficients of the core variables of interest (DTE, ROA and Size) remained stable in both sectors. Fourth, to examine the impact of potential survivorship bias arising from the balanced panel requirement, we estimated supplementary unbalanced panel regressions that included firms with shorter but uninterrupted data histories within each sector. The signs and significance of the main coefficients in these unbalanced specifications were consistent with those reported for the balanced sample, suggesting that our conclusions are not unduly driven by the survivor cohort of firms. Taken together, these robustness exercises suggest that, although endogeneity cannot be completely ruled out in an observational setting, the documented relationships between capital structure, firm characteristics and EPS are reasonably stable across alternative specifications.
5. Discussion
The findings of this study offer nuanced insights into the dynamics of capital structure and its influence on market valuations across India’s IT and automobile industries. The descriptive analysis highlights sharp sectoral distinctions: IT firms operate with very low leverage, reflecting their reliance on equity-based financing, while automobile firms show significantly higher dependence on debt, consistent with the capital-intensive nature of their operations. This structural divergence underscores that capital structure decisions are not uniform across industries but are shaped by sector-specific resource requirements, risk profiles, and growth models.
Correlation analysis reveals a negative relationship between both sectors’ leverage (DTE) and market valuations (EPS). However, the regression results contradict this observation, showing that leverage has a positive, statistically significant effect on valuations after controlling for firm-level heterogeneity. This divergence between simple correlations and panel regressions underscores the importance of rigorous econometric modelling in capturing causal relationships. In this sense, the panel estimates support the view that Indian equity markets reward debt-financed growth when leverage is aligned with firms’ profitability and scale, even if raw correlations suggest that high leverage is risky. This reconciles mixed evidence reported in earlier studies on leverage and performance in emerging markets (e.g., Khan et al., 2020; Siddik et al., 2017; Ahmed et al., 2023). In the IT sector, debt complements profitability, firm size, and asset efficiency, enhancing investor perceptions when used judiciously. The underlying mechanism is rooted in signalling theory: because IT firms generate strong internal cash flows and carry minimal physical collateral, a deliberate increase in leverage credibly signals to investors that management is confident in sustaining future earnings, thereby reducing perceived information asymmetry and translating into higher earnings per share. In practical terms, this means IT firms can strategically use moderate debt not merely as a financing tool but as a value creation signal, a lever that CFOs in asset-light, high-growth industries can deploy to enhance market standing without materially elevating distress risk. In the automobile sector, although leverage supports valuations, the market penalises excessive asset tangibility and reduced debt-servicing flexibility, reflecting concerns about financial rigidity in capital-intensive industries. The economic intuition here follows trade-off theory: automobile firms benefit from the interest tax shield on debt, which directly boosts after-tax earnings and thus EPS, but this benefit is bounded by the weight of fixed-asset commitments and mandatory debt-servicing obligations. When tangible assets are predominantly illiquid, and leverage pushes interest burdens beyond the firm’s earnings buffer, marginal debt destroys rather than creates value, which explains why asset tangibility carries a negative coefficient in the automobile regressions. For industry practitioners, this implies that automobile firms must actively manage a leverage ceiling calibrated to their asset structure: debt beyond this threshold shifts investor perception from value-accretive to distress-prone.
The application of the Glasso (Graphical Lasso) method provides a deeper perspective by highlighting the interconnectedness among variables beyond traditional regression. This sparse Gaussian graphical model reveals latent financial linkages, reinforcing the robustness of findings and offering a methodological innovation rarely applied in Indian sectoral finance studies. Specifically, the Graphical Lasso networks show that EPS is centrally embedded in a web of conditional relationships with leverage, profitability, and firm size in both sectors, while tangibility, interest coverage, and sales growth play more peripheral but still non-trivial roles. The economic significance of this network structure is substantial: in IT firms, profitability sits at the central node, connecting leverage to EPS, meaning that debt’s positive effect on valuation is not direct but is mediated through the firm’s earnings capacity. Leverage works only when profitability is present to absorb it. In automobile firms, asset tangibility plays this mediating role, meaning that the leverage valuation relationship is gated by the firm’s physical asset base; debt enhances value only when sufficient collateral exists to backstop it. These conditional pathways, invisible to standard regression, clarify why the same level of leverage can enhance value in one sector and damage it in another, providing unambiguous mechanistic evidence that the capital structure–valuation nexus is fundamentally industry-contingent. This confirms that capital structure is not an isolated determinant but operates within a broader system of firm-level characteristics, thereby justifying the integrated econometric network approach adopted in this study. Such insights demonstrate that capital structure is not an isolated determinant but rather interacts closely with firm fundamentals, including profitability, operational efficiency, and growth trajectories.
From a theoretical standpoint, these results align with both trade-off theory and pecking order theory. The IT sector’s equity-dominant financing aligns with the pecking order of financing, where retained earnings and equity precede debt. Conversely, the automobile sector reflects trade-off theory, where firms balance the tax advantages of debt with the risks of financial distress. At the same time, the sector-specific patterns observed in both the regression coefficients and the network structures support the view that the capital structure–valuation nexus is contingent on industry characteristics and institutional context rather than universal, in line with cross-country evidence on capital structure determinants (De Jong et al., 2008). Importantly, the positive effect of leverage on valuations across both sectors suggests that Indian markets reward debt-financed growth when it aligns with profitability and scale, even though investor perceptions may differ at the descriptive level. These findings carry several actionable implications. For corporate managers and CFOs, the results advocate for industry-calibrated financing strategies: IT firms should treat moderate leverage as a strategic signalling instrument rather than a last resort, while automobile firms should define and monitor a sector-specific debt ceiling beyond which leverage becomes value-destructive rather than value-enhancing. For investors and equity analysts, the findings suggest that interpreting leverage ratios in isolation, without accounting for sectoral asset structure and profitability profile, can be fundamentally misleading: a debt-to-equity ratio that signals strength in an asset-intensive firm may signal overextension in an asset-light one. For policymakers and regulators in India and other emerging economies, the evidence supports designing sector-differentiated financial disclosure and prudential frameworks rather than applying uniform leverage norms across heterogeneous industries. More broadly, these insights extend beyond India to any emerging economy hosting both knowledge-intensive and capital-intensive sectors, offering a replicable analytical framework for diagnosing how financing strategies interact with industry structure to shape market valuations.
6. Conclusions
This study examined the relationship between capital structure—measured by the debt-to-equity ratio—and the market valuations of selected IT and automobile companies listed on the Nifty 500. Using annual data from the CMIE Prowess database and company websites for 2005–2024, the analysis employed panel data estimation techniques, supported by diagnostic tests and complementary graphical modelling, to ensure the robustness of the findings. The study incorporated key explanatory variables, including debt-to-equity ratio (DTE), return on assets (ROA), asset tangibility (TANG), interest coverage ratio (ICR), and control variables such as firm size and sales growth.
The descriptive statistics reveal sharp contrasts between the IT and automobile sectors. IT firms exhibit extremely low leverage (mean DTE of 0.06) and asset-light balance sheets, reflecting their reliance on equity financing and intangible assets. By contrast, automobile firms show significantly higher leverage (mean DTE of 0.75) and greater asset tangibility, indicative of the industry’s capital-intensive nature. Correlation analysis indicates that market valuations, measured by earnings per share (EPS), are inversely related to leverage in both sectors. However, panel regressions using the fixed effects model (supported by the Hausman test) indicate a positive, statistically significant relationship between debt-to-equity ratios and market valuations. For IT firms, a one percent increase in leverage is associated with a 1.1% rise in EPS, while in automobile firms, the corresponding increase is 0.49%. Beyond leverage, sector-specific patterns emerge. In the IT sector, ROA, asset tangibility, ICR, and firm size positively and significantly influence market valuations. This highlights that profitability, operational efficiency, and scale advantages can amplify the value effects of moderate leverage in knowledge-based industries. Conversely, in the automobile sector, the market valuations improve with higher ROA and firm size but decline with greater asset tangibility and ICR, suggesting that the market penalises excessive dependence on fixed assets and weaker debt-servicing flexibility in capital-intensive industries (Harris & Raviv, 1991).
The study also applied the Graphical Lasso (Glasso) approach to design a sparse Gaussian graphical model (sparse GGM), extending the analysis beyond traditional correlations. This method provided deeper insights into the structural interconnections among financial variables, thereby enhancing the robustness of the results. Specifically, the network structures reveal that in IT firms, profitability acts as the central conduit through which leverage affects market valuation. Debt enhances EPS only when earnings capacity is present to sustain it. In automobile firms, asset tangibility occupies this mediating role, meaning leverage creates value only when sufficient physical collateral backstops the borrowing. These conditional pathways provide unambiguous mechanistic evidence that the same level of debt can be value-enhancing in one industry and value-destructive in another, depending on the firm’s underlying financial architecture.
Overall, the findings carry important implications for corporate finance practice in India. The evidence suggests that while IT and automotive firms can enhance market valuations through prudent leverage, the effectiveness of capital structure decisions depends critically on sectoral characteristics (Ayalew, 2021). For IT firms, moderate debt complements profitability and growth in an equity-dominated environment (Myers & Majluf, 1984). In practical terms, IT CFOs should treat moderate leverage as a deliberate signalling instrument, a credible commitment device that communicates earnings confidence to investors, rather than as a financing measure of last resort. In contrast, higher leverage can support valuations in the automobile sector but must be balanced against the risks associated with heavy fixed-asset commitments (Modigliani & Miller, 1963). For automobile managers, this translates into a clear operational directive: define and actively monitor a sector-specific leverage ceiling calibrated to the firm’s tangible asset base and interest coverage buffer beyond which incremental debt shifts from value-accretive to value-destructive.
For equity investors and financial analysts, the findings highlight a critical interpretive caution: leverage ratios cannot be benchmarked uniformly across sectors. A debt-to-equity ratio that signals financial strength and disciplined capital allocation in an asset-intensive automobile firm may signal overextension and heightened distress risk in an asset-light IT firm. Sector-adjusted leverage benchmarks should therefore form part of standard equity valuation frameworks. Beyond India, the findings offer broader lessons for other emerging economies with similar sectoral heterogeneity. Many developing countries in Asia, Africa, and Latin America host both knowledge-based service industries and capital-intensive manufacturing industries operating under the same institutional and regulatory environment (De Jong et al., 2008). The core finding of this study, that the capital structure–market valuation nexus is sector-contingent rather than universal, suggests that policymakers and regulators in these economies should resist designing one-size-fits-all leverage norms or financing incentives (Frank & Goyal, 2009; Ayalew, 2021). Instead, sector-adapted financial frameworks that account for differences in asset structure, profitability drivers, and debt-servicing capacity are likely to be more effective. For instance, economies with rapidly growing IT or technology sectors may find that equity market development and support for intangible asset financing are more relevant policy levers than generic debt reduction targets (Myers & Majluf, 1984). Conversely, economies dominated by capital-intensive manufacturing may need to focus on managing financial distress risk and improving collateral frameworks to ensure that leverage translates into valuation gains rather than penalties (Harris & Raviv, 1991). These insights are particularly relevant for BRICS and other emerging market economies where capital structure research is still evolving, and sector-specific evidence remains scarce (Prakash et al., 2023; Vo et al., 2022).
7. Limitation
The study is not without limitations. First, the sample is confined to large, Nifty 500-listed firms that remain continuously listed over 2005–2024, so the evidence primarily reflects a survivor cohort and may not be representative of smaller, newly listed, or delisted companies in either sector. Second, EPS is used as the main proxy for market valuation; although it is a widely employed earnings-based measure, it does not fully capture forward-looking market expectations as price-based indicators such as Tobin’s Q or price-to-book ratios might. Third, the analysis does not explicitly incorporate time-varying macroeconomic factors such as interest rate cycles, inflation, or regulatory policy changes, which may independently influence capital structure and market valuations (Prakash et al., 2023; Vo et al., 2022). Future research could address these gaps by using broader unbalanced samples including non-surviving firms, experimenting with alternative valuation metrics (e.g., Tobin’s Q, market capitalisation, or price-to-book ratios), incorporating macroeconomic controls, testing for structural breaks (e.g., post-crisis and post-COVID periods), and conducting cross-country comparative studies to examine whether the sector-specific capital structure–valuation patterns documented here hold across different institutional environments in emerging markets.
Author Contributions
Conceptualisation, methodology, formal analysis, and writing—original draft preparation: P.G.; data curation, software, validation, and writing—review and editing, supervision and project administration: A.N.S. All authors have read and agreed to the published version of the manuscript.
Funding
This research received no external funding.
Institutional Review Board Statement
Not applicable.
Informed Consent Statement
Not applicable.
Data Availability Statement
The firm-level financial data used in this study were obtained from the CMIE Prowess database and from publicly available company annual reports and websites. Access to CMIE Prowess is subject to subscription; derived datasets and codes are available from the corresponding author on reasonable request.
Conflicts of Interest
The authors declare no conflicts of interest.
References
- Ahmed, A. M., Sharif, N. A., Ali, M. N., & Hagen, I. (2023). Effect of firm size on the association between capital structure and profitability. Sustaintability, 15(14), 11196. [Google Scholar] [CrossRef] [Scilit]
- Alipour, M., Mohammadi, M. F., & Derakhshan, H. (2015). Determinants of capital structure: An empirical study of firms in Iran. International Journal of Law and Management, 57(1), 53–83. [Google Scholar] [CrossRef] [Scilit]
- Al-Najjar, B., & Taylor, P. (2008). The relationship between capital structure and ownership structure: New evidence from Jordanian panel data. Managerial Finance, 34(12), 919–933. [Google Scholar] [CrossRef] [Scilit]
- Amin, H. I., & Cek, K. (2023). The effect of golden ratio-based capital structure on firm’s financial performance. Sustainability, 15(9), 7424. [Google Scholar] [CrossRef] [Scilit]
- Ayalew, Z. A. (2021). Capital structure and profitability: Panel data evidence of private banks in Ethiopia. Cogent Economics and Finance, 9(1), 1953736. [Google Scholar] [CrossRef] [Scilit]
- Bai, J., & Ng, S. (2004). A PANIC attack on unit roots and cointegration. Journal of the Econometric Society, 72(4), 1127–1177. [Google Scholar] [CrossRef] [Scilit]
- Bhamaa, V., Jain, P., & Yadava, S. S. (2015). Does firms’ pecking order vary during large deficits and surpluses? An empirical study on emerging economies. Procedia Economics and Finance, 30, 155–163. [Google Scholar] [CrossRef] [Scilit]
- Booth, L., Aivazian, V., Demirguc-Kunt, A., & Maksimovic, V. (2001). Capital structures in developing countries. The Journal of Finance, 56(1), 87–130. [Google Scholar] [CrossRef] [Scilit]
- Chadha, S., & Sharma, A. K. (2015). Capital structure and firm performance: Empirical evidence from India. Vision: The Journal of Business Perspective, 19(4), 295–302. [Google Scholar] [CrossRef] [Scilit]
- Chakrabarti, A., & Chakrabarti, A. (2019). The capital structure puzzle—Evidence from Indian energy sector. International Journal of Energy Sector Management, 13(1), 2–23. [Google Scholar] [CrossRef] [Scilit]
- Chakraborty, I. (2010). Capital structure in an emerging stock market: The case of India. Research in International Business and Finance, 24(3), 295–314. [Google Scholar] [CrossRef] [Scilit]
- Dalci, I. (2018). Impact of financial leverage on profitability listed manufacturing firms in China. Pacific Accounting Review, 30(4), 410–432. [Google Scholar] [CrossRef] [Scilit]
- De Jong, A., Kabir, R., & Nguyen, T. T. (2008). Capital structure around the world: The roles of firm- and country-specific determinants. Journal of Banking & Finance, 32(9), 1954–1969. [Google Scholar] [CrossRef] [Scilit]
- Ebaid, I. E.-S. (2009). The impact of capital-structure choice on firm performance: Empirical evidence from Egypt. Journal of Risk Finance, 10(5), 477–487. [Google Scholar] [CrossRef] [Scilit]
- Eriotis, N., Vasiliou, D., & Neokosmidi, Z. V. (2007). How firm characteristics affect capital structure: An empirical study. Managerial Finance, 33(5), 321–331. [Google Scholar] [CrossRef] [Scilit]
- Frank, M. Z., & Goyal, V. K. (2009). Capital structure decisions: Which factors are reliably important? Financial Management, 38(1), 1–37. [Google Scholar] [CrossRef] [Scilit]
- Friedman, J., Hastie, T., & Tibshirani, R. (2008). Sparse inverse covariance estimation with the graphical lasso. Biostatistics, 9(3), 432–441. [Google Scholar] [PubMed]
- Hair, J. F., Black, W. C., Babin, B. J., & Anderson, R. E. (2013). Multivariate data analysis. Pearson Higher Ed. [Google Scholar]
- Harris, M., & Raviv, A. (1991). The theory of capital structure. Journal of Finance, 46(1), 297–355. [Google Scholar] [CrossRef]
- Hausman, J. A. (1978). Specification tests in econometrics. Journal of the Econometric Society, 46(6), 1251–1271. [Google Scholar] [CrossRef] [Scilit]
- Jensen, M. C., & Meckling, W. H. (1976). Theory of the firm: Managerial behavior, agency costs and ownership structure. Journal of Financial Economics, 3(4), 305–360. [Google Scholar] [CrossRef] [Scilit]
- Khan, H. u., Khidmat, W. B., Hares, O. A., Muhammad, N., & Saleem, K. (2020). Corporate governance quality, ownership structure, agency costs and firm performance. Evidence from an emerging economy. Journal of Risk and Financial Management, 13(7), 154. [Google Scholar] [CrossRef] [Scilit]
- M’ng, J. C., Rahman, M., & Sannacy, S. (2017). The determinants of capital structure: Evidence from public listed companies in Malaysia, Singapore and Thailand. Cogent Economics and Finance, 5(1), 1418609. [Google Scholar] [CrossRef] [Scilit]
- Modigliani, F., & Miller, M. H. (1958). The cost of capital, corporation finance and the theory of investment. The American Economic Review, 48(3), 261–297. [Google Scholar]
- Modigliani, F., & Miller, M. H. (1963). Corporate income taxes and the cost of capital: A correction. The American Economic Review, 53(3), 433–443. [Google Scholar]
- Myers, S. C., & Majluf, N. S. (1984). Corporate financing and investment decisions when firms have information that investors do not have. Journal of Financial Economics, 13(2), 187–221. [Google Scholar] [CrossRef] [Scilit]
- Nasimi, A. N. (2016). Effect of capital structure on firm profitability (an empirical evidence from London, UK). Journal of Management and Business Research, 16(4), 1–13. [Google Scholar]
- Nguyen, T. H. (2024). The impact of capital structure on the performance of state-invested enterprises in Vietnam. Cogent Economics & Finance, 12(1), 2399955. [Google Scholar] [CrossRef] [Scilit]
- Olokoyo, F. O. (2013). Capital structure and corporate performance of Nigerian quoted firms: A panel data approach. African Development Review, 25(3), 358–369. [Google Scholar] [CrossRef] [Scilit]
- Prakash, N., Maheshwari, A., & Hawaldar, A. (2023). The impact of COVID-19 on the capital structure in emerging economies: Evidence from India. Asian Journal of Accounting Research, 8(3), 236–249. [Google Scholar] [CrossRef] [Scilit]
- Psillaki, M., & Daskalakis, N. (2009). Are the determinants of capital structure country or firm specific? Small Business Economics, 33(3), 319–333. [Google Scholar]
- Rathnasingha, D. L., & Heiyanthuduwa, C. P. (2019). Revisiting external pecking order hypothesis: Evidence from Sri Lankan companies capital structure. Journal of Financial Risk and Management, 8(4), 200–223. [Google Scholar] [CrossRef]
- Ross, S. A. (1977). The determination of financial structure: The incentive-signalling approach. The Bell Journal of Economics, 8(1), 23–40. [Google Scholar] [CrossRef] [Scilit]
- Salim, M., & Yadav, D. (2012). Capital structure and firm performance: Evidence from Malaysian listed companies. Procedia Social and Behavioral Sciences, 65, 156–166. [Google Scholar] [CrossRef] [Scilit]
- Shahzad, A., & Azeem, M. (2020). The determinants of capital structure: Evidence from SAARC countries. International Journal of Finance & Economics, 26(4), 6471–6487. [Google Scholar] [CrossRef] [Scilit]
- Sharma, R. K. (2018). Factors affecting financial leveraging for BSE listed real estate development companies in India. Journal of Financial Management of Property and Construction, 23(3), 274–294. [Google Scholar] [CrossRef] [Scilit]
- Siddik, M. N., Kabiraj, S., & Joghee, S. (2017). Impacts of capital structure on performance of banks in a developing economy: Evidence from Bangladesh. International Journal of Financial Studies, 5(2), 13. [Google Scholar] [CrossRef] [Scilit]
- Vatavu, S. (2015). The impact of capital structure on financial performance in Romanian listed companies. Procedia Economics and Finance, 32, 1314–1322. [Google Scholar] [CrossRef] [Scilit]
- Vo, T. A., Mazur, M., & Thai, A. (2022). The impact of COVID-19 economic crisis on the speed of adjustment toward target leverage ratio: An international analysis. Finance Research Letters, 45, 102157. [Google Scholar] [CrossRef] [Scilit] [PubMed]
- Vuong, N. B., Vu, T. Q., & Mitra, P. (2017). Impact of capital structure on firm’s financial performance: Evidence from United Kingdom. Journal of Finance & Economics Research, 2(1), 18–31. [Google Scholar] [CrossRef] [Scilit]
- Vy, L. T., & Nguyet, P. T. (2017). Capital structure and firm performance: Empirical evidence from a small transition country. Research in International Business and Finance, 42, 710–726. [Google Scholar] [CrossRef] [Scilit]
- Wassie, F. A. (2020). Impacts of capital structure: Profitability of construction companies in Ethiopia. Journal of Financial Management of Property and Construction, 25(3), 371–386. [Google Scholar] [CrossRef] [Scilit]
- Zafar, M. R., Zeeshan, F., & Ahmed, R. (2016). Impact of capital structure on banking profitability. International Journal of Scientific and Research Publication, 6(3), 186–193. [Google Scholar]
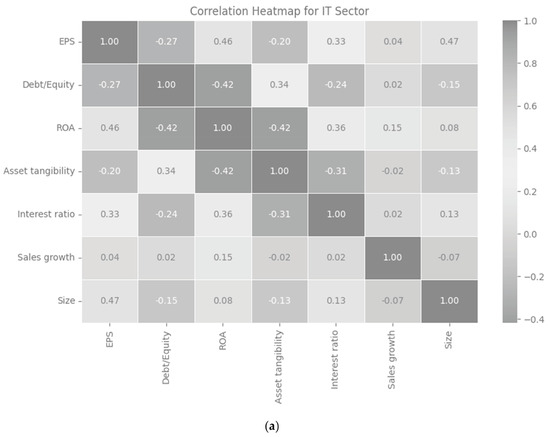
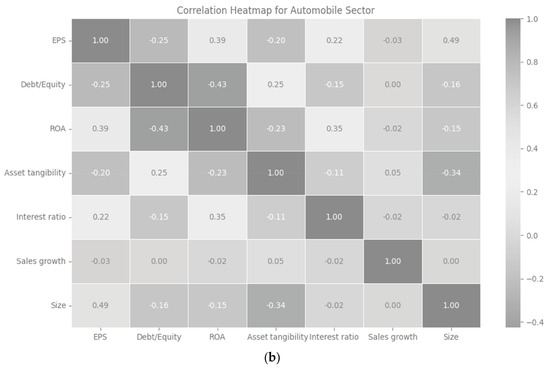
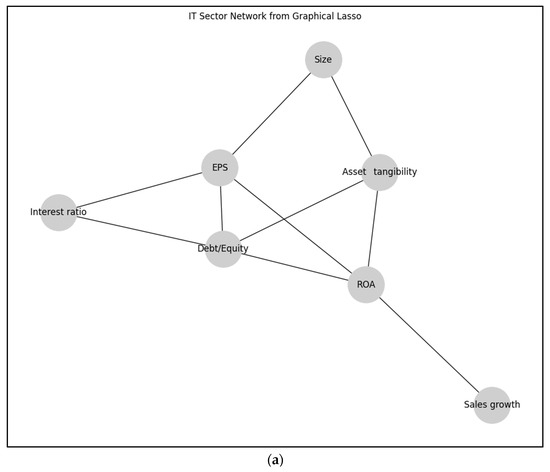
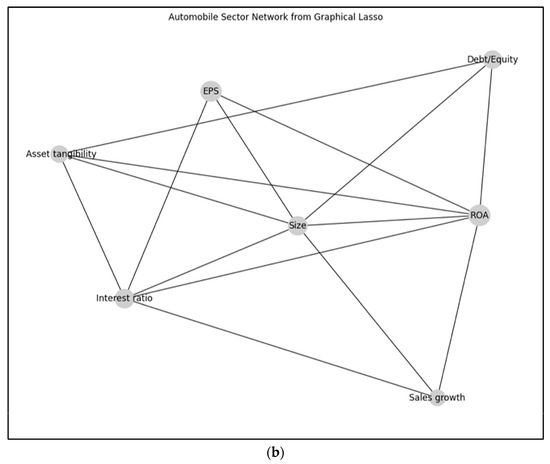
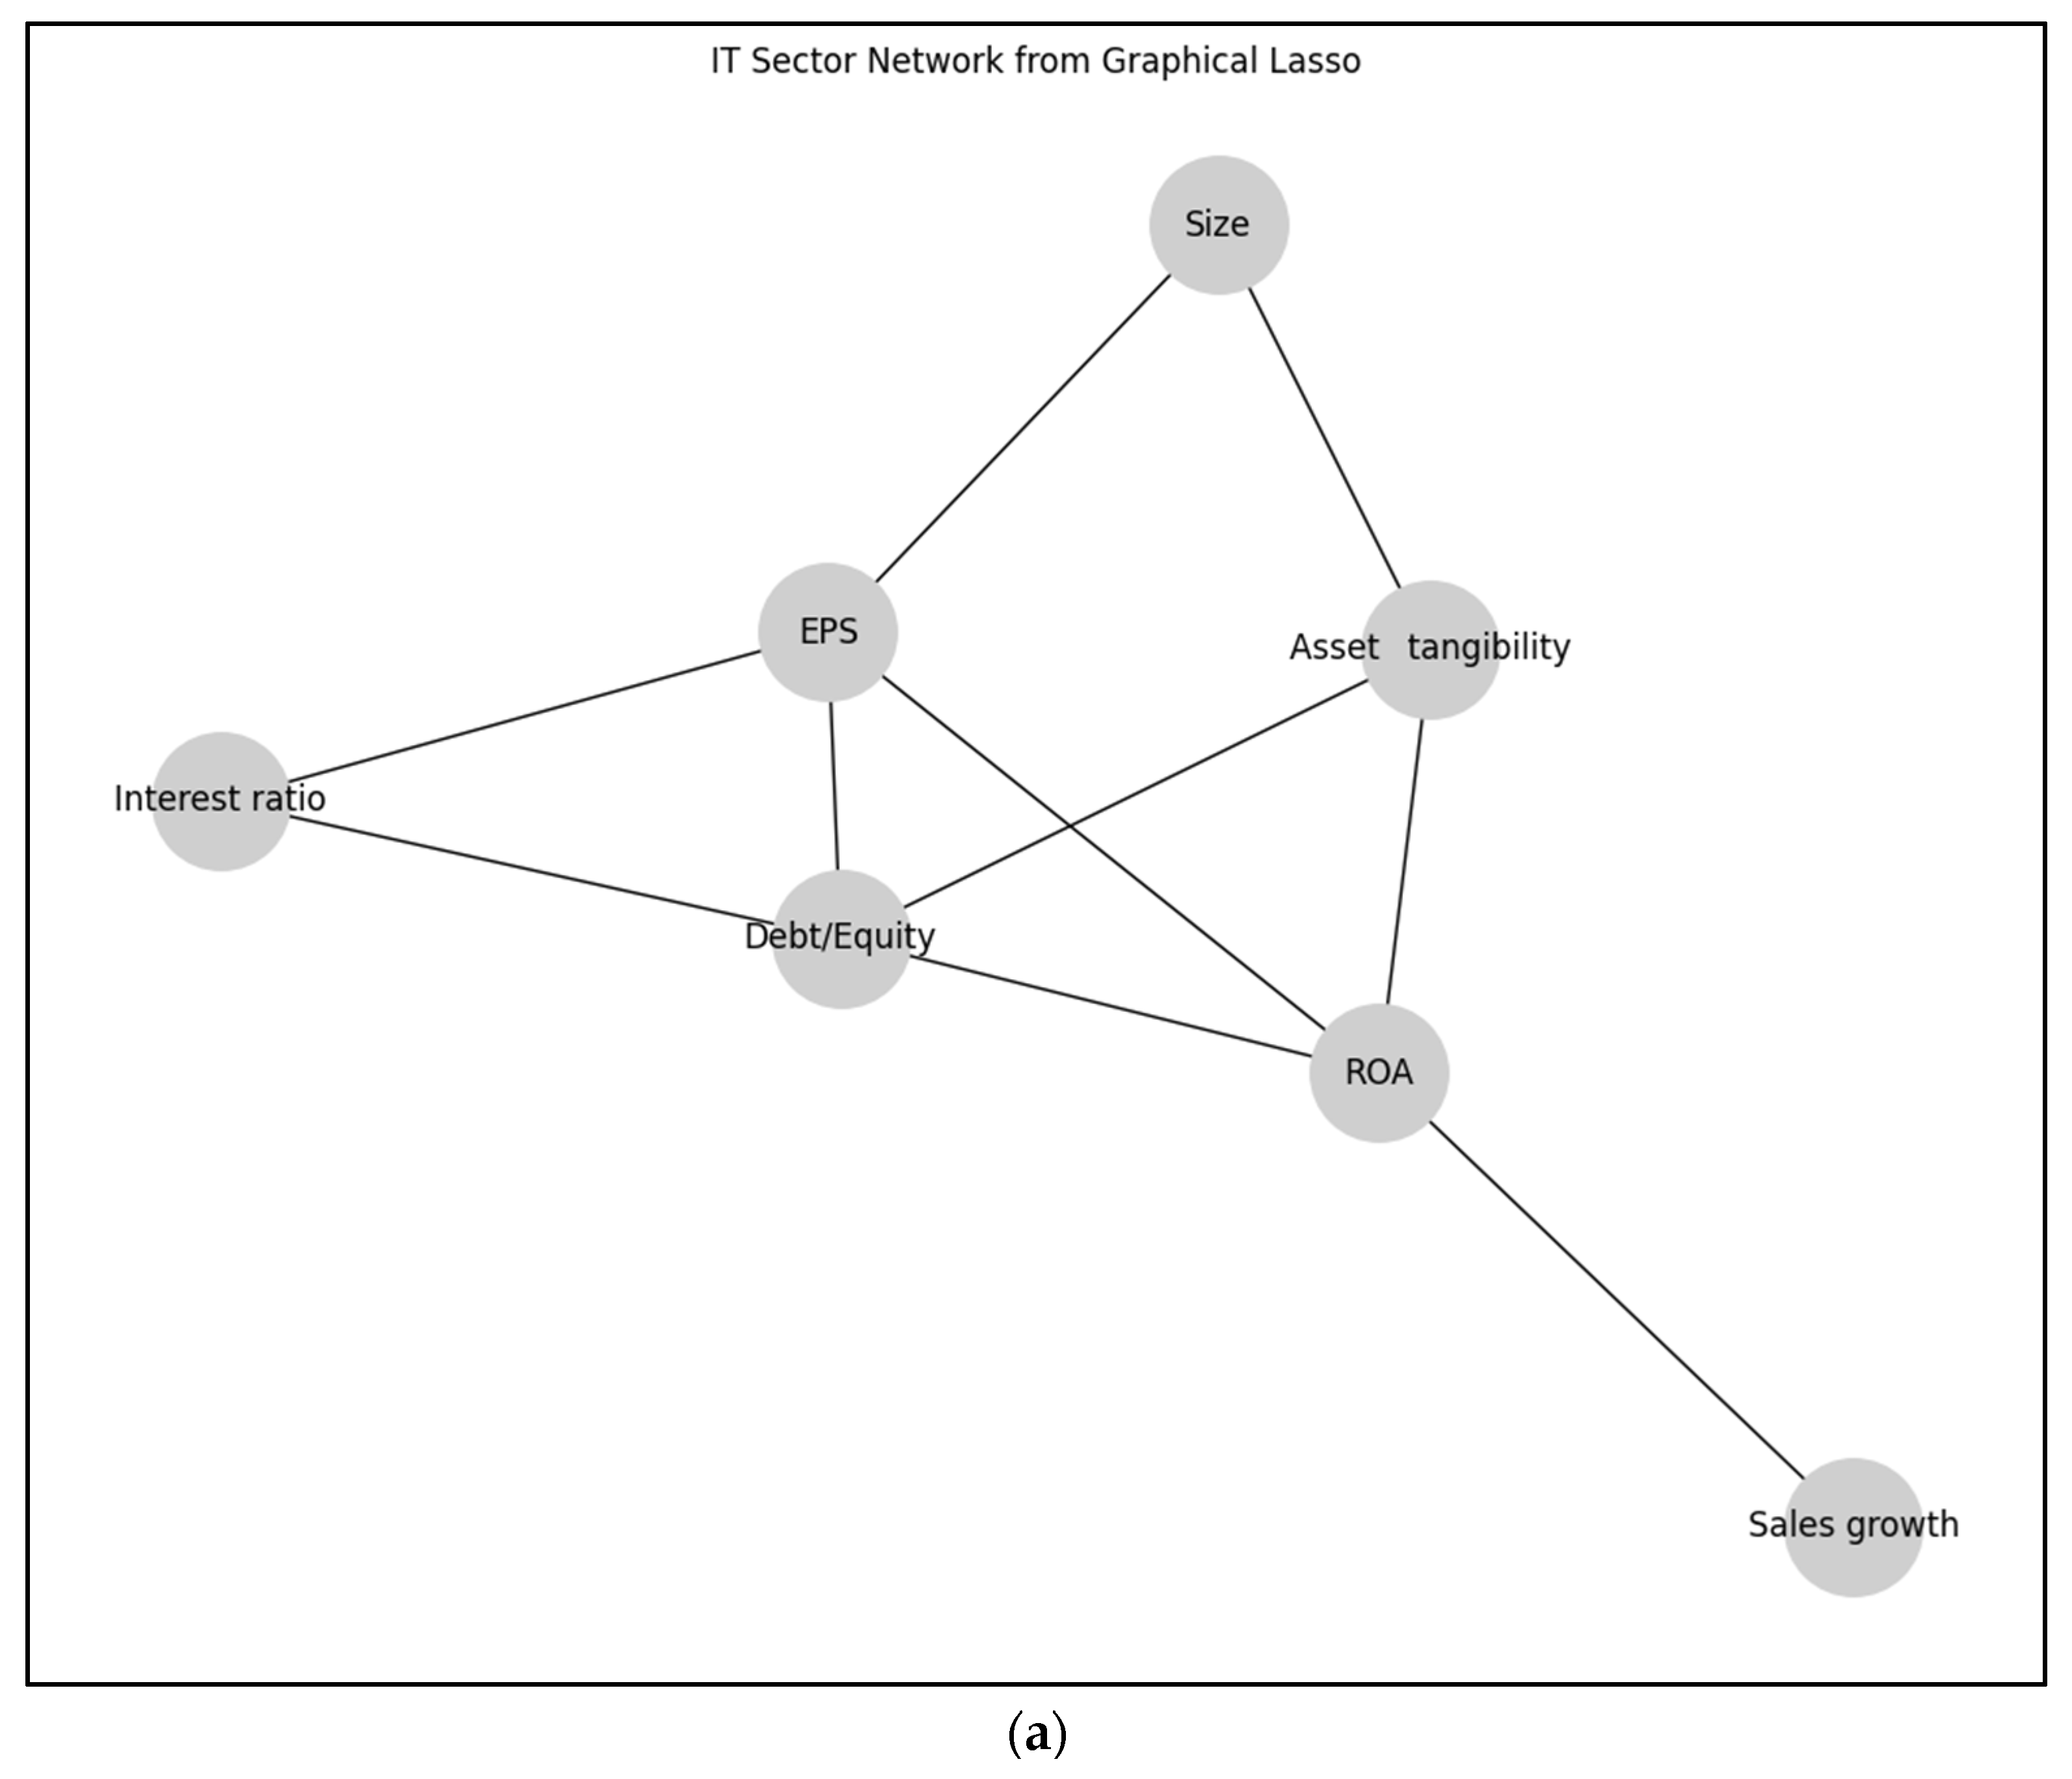
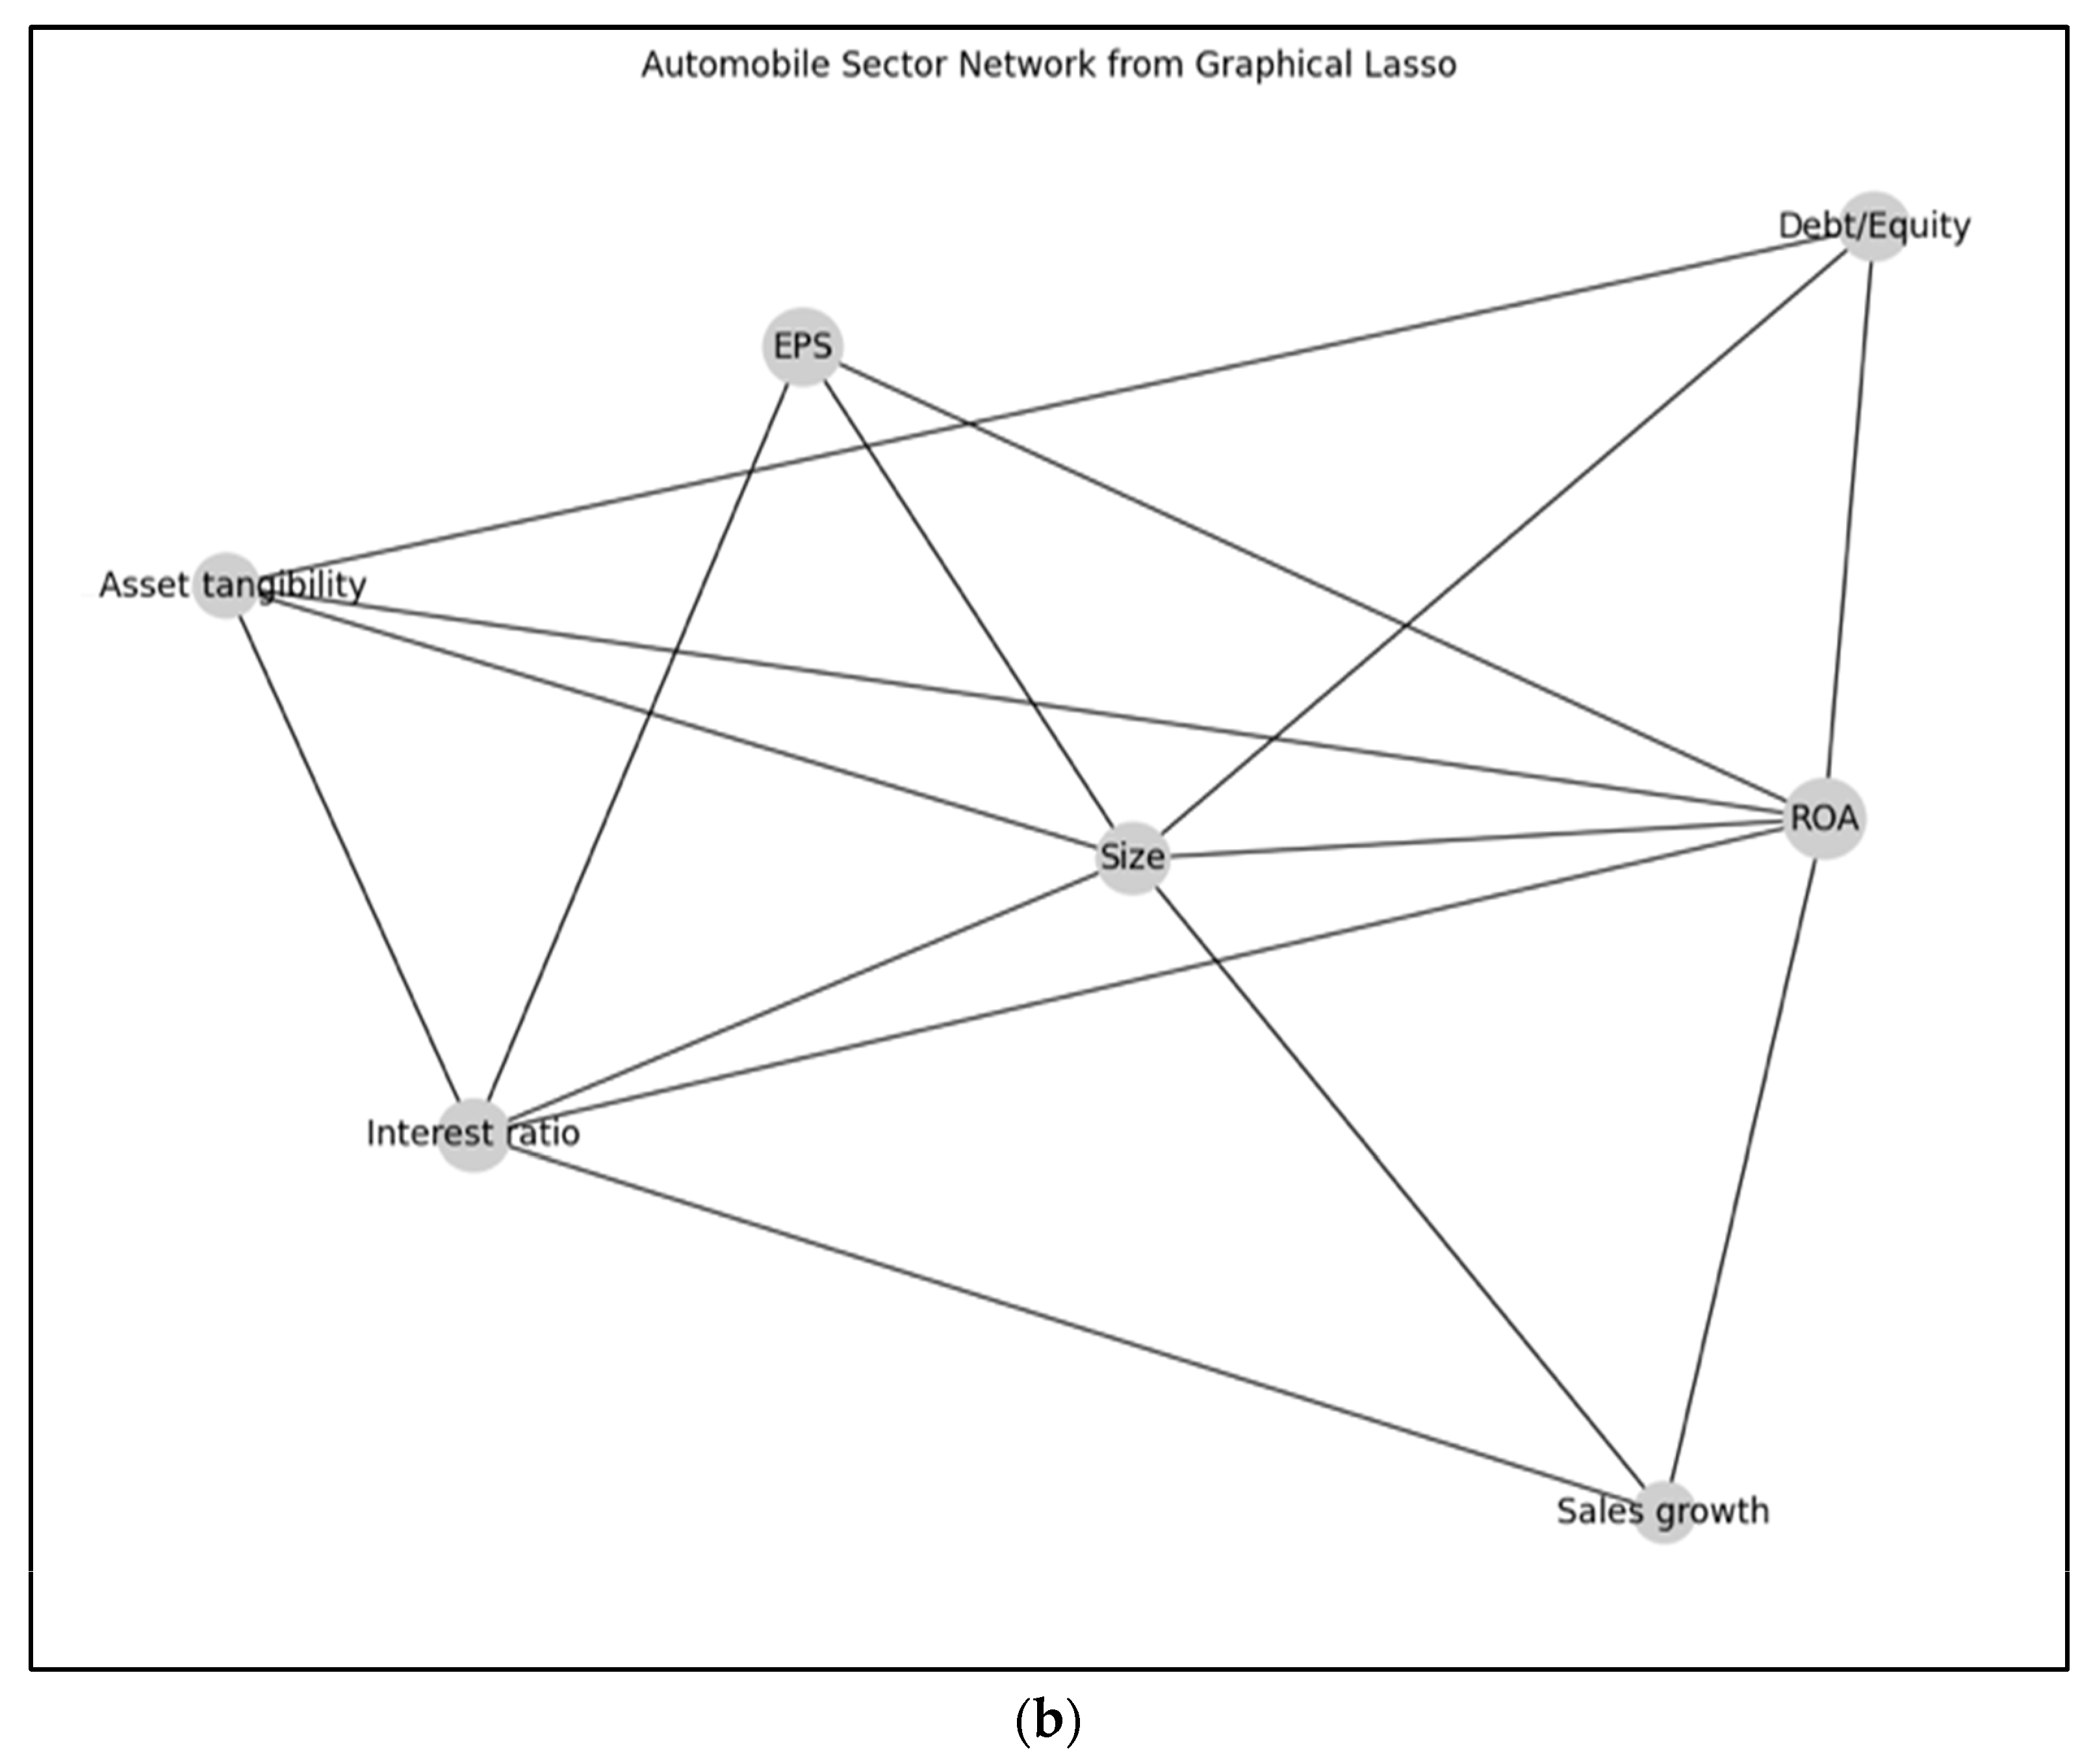

Disclaimer/Publisher’s Note: The statements, opinions and data contained in all publications are solely those of the individual author(s) and contributor(s) and not of MDPI and/or the editor(s). MDPI and/or the editor(s) disclaim responsibility for any injury to people or property resulting from any ideas, methods, instructions or products referred to in the content. |
© 2026 by the authors. Licensee MDPI, Basel, Switzerland. This article is an open access article distributed under the terms and conditions of the Creative Commons Attribution (CC BY) license.