Article

A Low-Cost Monitoring System and Operating Database for Quality Control in Small Food Processing Industry

DICCA–Department of Civil, Chemical and Environmental Engineering, Università di Genova, Via Opera Pia 5, I-16145 Genova, Italy
*
Author to whom correspondence should be addressed.
Present address: Università di Padova, Via del Pescarotto 8, Padova, Italy
J. Sens. Actuator Netw. 2019, 8(4), 52; https://doi.org/10.3390/jsan8040052
Submission received: 27 August 2019 / Revised: 16 October 2019 / Accepted: 17 October 2019 / Published: 20 October 2019

Abstract

:
The use of completely automated systems for collecting sensor data with the aim of monitoring and controlling the quality of small-scale food processes is not widespread. Small and micro-enterprises usually do not carry out their own precompetitive research or prototype development as regards to automation technologies. This study proposes a web-based, low-cost monitoring and supervisory control and data acquisition (SCADA) system whose kernel is available for free, as a possible solution that could be adopted by these food producers. It is mainly based on open SW/HW so as its configuration is adaptable to the application and type of plant. It presents a modular architecture and its main functionalities encompass the acquisition, management, aggregation and visualization of process data, providing an operating database. It also provides food tracking and process quality control: The time series are browsable due to QR-Code generation and different early warning detection strategies are implemented. A tool for solving migration problems based on Fick’s equation is offered as a packaging decision support system.

Graphical Abstract

1. Introduction

The competitiveness of small production companies in the food sector (beer, olive oil, milk, fruit juices, wine, cheese, natural supplements), farm and agricultural businesses and in the production of natural cosmetics is mainly based on the quality of the product and on the elimination of potential health risks. Micro-plants or very small-scale plants in these areas still use, to date and for reasons of cost limitation, partially distributed systems for the automation of the production process and rarely foresee the presence of supervision, control or the creation of operational databases.
On the other hand, the supervisory control and data acquisition (SCADA) systems or the distributed control system (DCS) make up, on the medium-sized and large plants of the same areas, the key tool that reduces costs, as well as limits the risk of accidents and the health risk, by optimizing production and ensuring the desired quality during continuous operation [1,2].
In the last ten years, the gap between the level of automation technology used in medium/large potential food industries and the one adopted by micro/very small industries has increased rather than bridged. However, if the micro/very small ones decide to invest in automation, this is probably directed to packaging operations [3].
The sector of supervision, control and data acquisition systems for industrial plants has matured since the 1980s. The SCADA systems for small/medium industries have been available since the mid-1990s and since then, the technological innovation concerning these systems has followed the technological innovation concerning HW (electronic components, acquisition cards, interfaces, data transmission protocols, vulnerability management, safety instrumented systems). An example is provided by [4] for the automation of the olive oil industry, even if some low-cost configurations have been proposed for quality control in the same food sector [5]. An overview of the topic of SCADA systems in the food processing sector, comprehensive of applications can be found in [6]. The low-cost configurations for micro/very small industries include the installation of sensors and systems for data acquisition and the automatic regulation of the main process parameters, the use of mini SCADA services, the use of software for self-realization of SCADA mini-systems, but with data that are difficult to be managed after the event and at a still high cost, compared to the plant installation costs. Moreover, as regards the methods for visualizing and processing data in small SCADA systems, the introduction of technological innovation has been limited. In recent years, however, the use of new low-cost HW technologies in supervision systems dedicated mainly to home-automation has rapidly increased. The part dedicated to the management and interpretation of data has remained, even for such applications, poorly developed. Therefore, while the technological innovation regarding HW components has been well received and used by the market of applications for the single user (and often for recreational purposes), for industrial applications it is still preferred to offer well tested and mature HW. Nevertheless, as exemplified by the continuously-growing array of smartphone applications that nowadays frequently uses machine learning techniques and exploits the plethora of equipped sensors, it is possible to develop innovative and effective tools without being limited to more conventional systems, as demonstrated for example by [7].
The availability of open-source projects in the field of single board computers, e.g., Arduino, prompted a transition from PLC-driven solutions towards architectures of sensors and actuators regulated through high-level programming languages, such as Python. One of the main advantages of such an approach, used for the prototype discussed in this paper, is that it is suitable for the implementation of solutions that move in the direction of the Internet of Things (IoT) [8]. This latter is a growing trend in research for application in the agricultural and food industries [9] and was applied to different supply chains, such as dairy, arable farming, fruit, vegetables and meat supply chains [10]. Another interesting application of IoT devices in the field of crop monitoring and irrigation can be found in [11], where a wireless sensor network (WSN) was used.
The area of activity in which the prototype system described in this paper is primarily intended is that of industries that adopt processes for the production of food from low quantities of high-quality raw materials or the processing and production of food at a very small scale. The sector, in its widest and most varied facets, is still today an Italian typical sector for which there are margins of development as regards the inclusion of technological innovation in the management of production processes. These latter are in fact similar to those of the chemical industry, but are conducted in micro and very small plants and operate in less extreme process conditions of the operating parameters as temperatures, pressures, etc.
Despite the theoretical possibility of adopting systems for monitoring, supervision and control, if compared to those of the chemical process industry, technological innovation in these sectors with regard to automation has, however, so far been scarce. Our proposal is therefore to introduce such systems at very reduced costs and exploit, for this purpose, the availability of open HW/SW on the market.
This study presents an on-line monitoring and low-cost early-warning system. It is an open-source open-hardware web-based smart-SCADA system ad-hoc developed to acquire, manage, aggregate, historicize and show real-time process data from the food processing industry at a small scale. It can monitor the main operating conditions of the units in their different sections and to manage alarms. The system was developed with the aim of closing the gap between micro/very small and medium industry in the food processing field, especially when different transformation processes are coupled in the same plant. It is tailored for fermentation, drying, filtration, separation, homogenization, ultra-high temperature (UHT), high-temperature short time (HTST) and all the main primary and secondary food processing unit operations. The sensors for pH, temperature, conductivity, pressure, humidity, dissolved oxygen and dissolved carbon dioxide, as well as optical ones, were adopted due to their low cost. Moreover, other parameters, such as nitrates, ammonia, turbidity and concentration can be measured, even if the sensors or on-line instrumentation costs for these last measurements are higher. The data from gas chromatography-mass spectrometry (GC-MS), high-performance liquid chromatography (HPLC) and ultraviolet-visible (UV-VIS) spectrophotometric analysis that cannot be adopted as on-line measures of plant performance, can be instead used for calibration during a period of tuning the system.
The architecture and the main features of this monitoring, operational database and web-based smart-SCADA system, called MEMO-HQ, are described in this paper. The system allows the accessibility, and at low-cost, of some features usually implemented only in plants with greater potential, such as:
  • a tool that uses different approaches for a posteriori analysis of process data, the extraction of information useful for optimizing conduction and/or improving product quality (HQ-Pro);
  • a tool for the complete traceability of process conditions in the production of different lots (HQ-Track);
  • a tool for analyzing the migration of pollutants from packaging to food (HQ-Pack).
The main technological innovations included in this prototype are the methods of visualization and consultation of data in real-time; the implementation of some particular algorithms for the management of alarms and early warning detection [12,13]; the identification of correlations between process variables through the use of black-box models [14]. Regarding the materials used for packaging, HQ-Pack allows a first assessment of the risk of migration by calculating the diffusion of migrants in the food and the comparison of the values obtained with those present in a database [15].
MEMO-HQ would join, practically at only the open-HW costs, the market segment that actually sees as main exponent products commercialized by NI-Labview, which, outside the research and development environment, has proposed the CompactRIO platform. This platform provides versions of Labview that can be run under different operating systems (OSs) and offers the possibility of a web interface (costs for applications are approximately 25,000 euros). Aside from NI Labview, which is the market leader, other products of the considered niche are mini-SCADAs (e.g., Genesis64 by ICONICS Inc., Foxborough, MA, USA; Monarch by Open Systems International Inc., Medina, MN, USA) and micro-SCADAs (e.g., GPM SCADA by GPM Service Ltd., Barcelona, Spain; InduSoft by Omron Corporation Co., Austin, TX, USA) which, on the other hand, rarely allow a customization according to the company’s needs, are not accessible via the web, do not allow the construction of an operating database (but only data backups on file) and are normally only executable on selected operating systems (the cost of such systems varies from 8000 to 20,000 euros). Among the tools for self-realization of SCADA mini-systems, notably are SYNCHRO by AFFA Technology Inc., Quebec, QC, Canada; Winlog PRO by SIELCO SISTEMI s.r.l., Guanzate (CO), Italy; and PROMOTIC by MICROSYS spol. S.r.o., Vítkovice, Czechia. It is further noted that, in the latter analysis, all the SCADA or DCS products used on medium-large size food processing plants are excluded as they are aimed at customers who are not considered interested in the MEMO-HQ potential users.
The paper is organized as follows. In Section 2, after briefly describing the overall architecture of the system, a more in-depth discussion of the HW and SW components, complete with the explanation of adopted computation criteria and logics, is presented. An explanation of the adopted testing framework is provided as well. The results of such tests, as well as a presentation of the strengths and weaknesses of the considered system, are presented and discussed in Section 3 where a market analysis can also be found. The conclusions are drawn in Section 4.

2. Materials and Methods

2.1. System Architecture

MEMO-HQ’s goal is to monitor the continuous pilot, micro and mini-scale food processing plants at a low cost. In order to perform this task, it was necessary to use hardware capable of acquiring, in real-time, the variables and process parameters that regulate the process and to develop some software able to historicize the monitored values, to identify anomalies present in the process and to quickly and efficiently view the current and previous status of the system under observation. Furthermore, in order to facilitate the monitoring of the process by the plant staff, it was decided to develop part of the software as a web tool, in order to view the monitored variables and parameters outside the plant by using credentials. Regarding the control strategies, they can be implemented either using the same MEMO system or with distributed and dedicated controllers. The data extracted from the operating database can be sent to the different HQ tools that can be connected to MEMO-HQ.

2.2. Hardware

The system configuration can be designed depending on the type of plant and application.
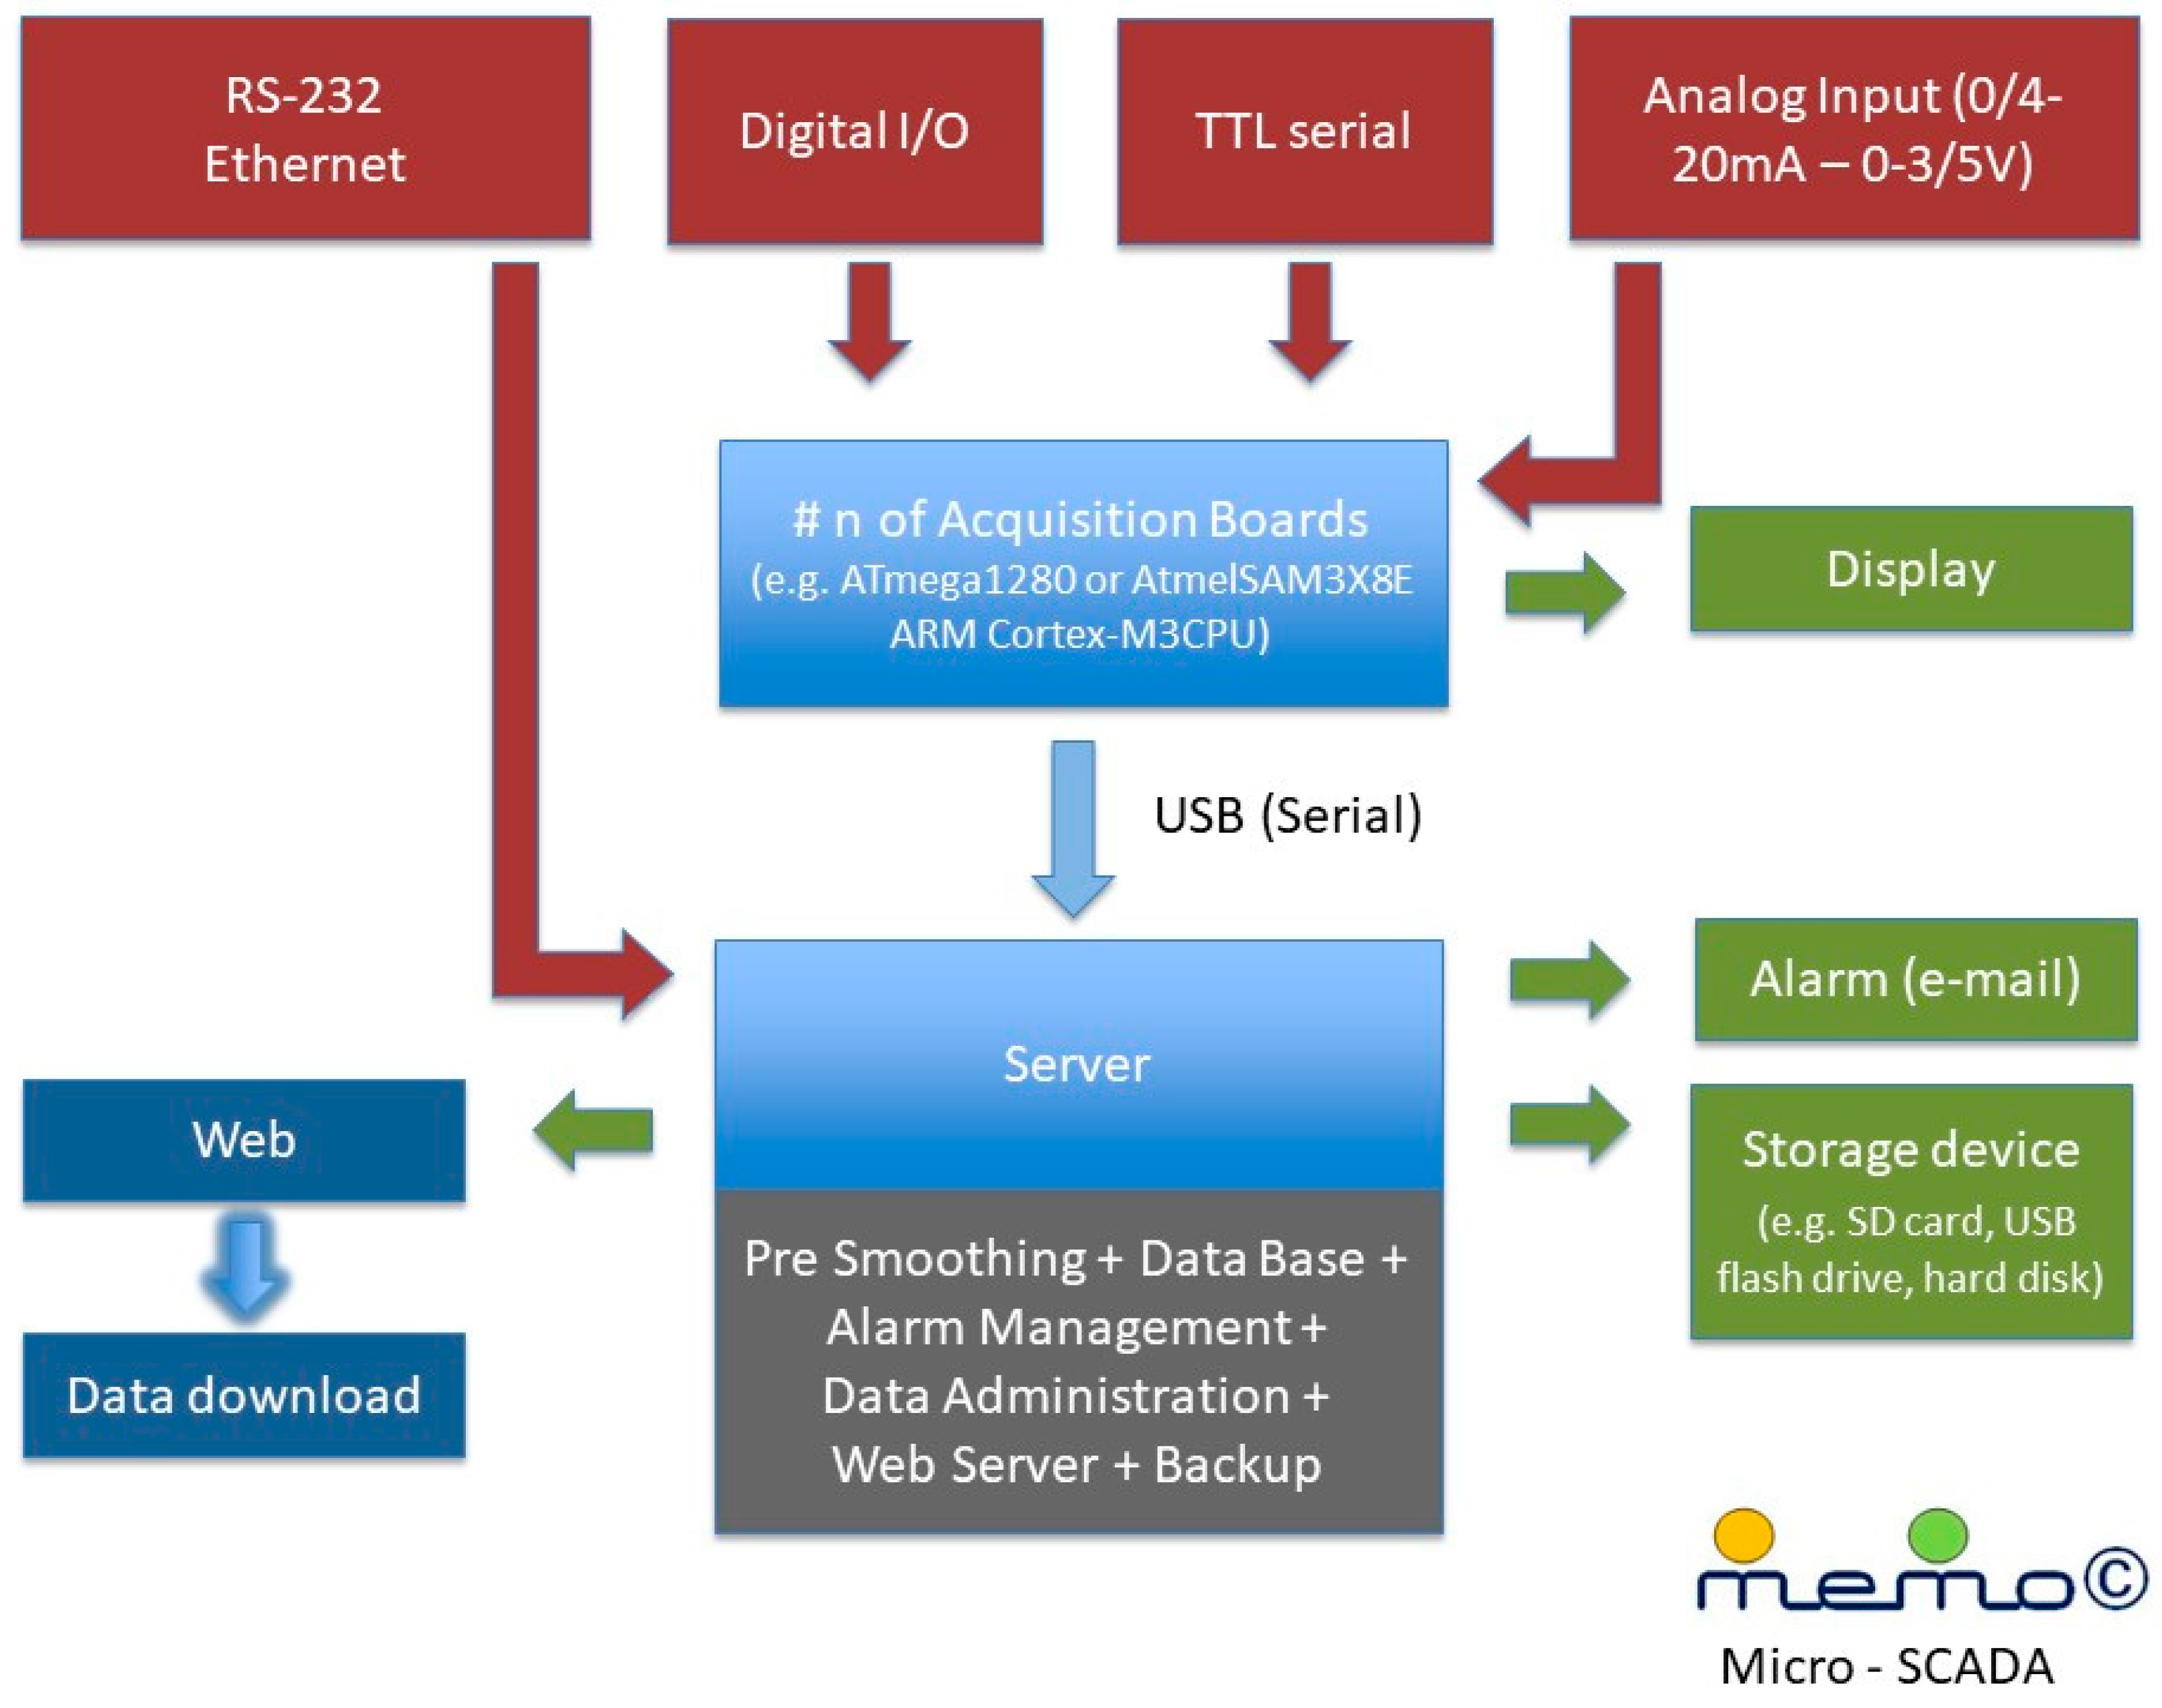
In Figure 1, the general architecture of the system is shown. This configuration was used during the experimental campaign at a pilot scale on discontinuous stirred tank reactors (DSTRs), continuous stirred tank reactors (CSTRs) and tubular reactors in the Environmental Chemical Processes Lab of the University of Genoa.
Arduino Uno shields were used as acquisition boards while a Raspberry PI was chosen as a low-cost motherboard. Both the Arduino shields and the Raspberry PI were placed on the plant and a PC placed in an external office was used to run the web-server. Communication was assured by Ethernet.
The system configuration shown in Figure 2 can be proposed for an industrial plant where the acquisition board connects directly to a server that communicates by an internal virtual private network (VPN), providing private data security (a good free solution is the use of FreeS/WAN). The certification of MEMO-HQ is not actually present as it also depends on the chosen HW.

2.3. Software Schema

MEMO-HQ runs under Unix OSs (tested on Debian, Ubuntu, RedHat, and macOS). It was developed using open source libraries and provides a graphical interface through the web browser. It is able to acquire, manage, aggregate, archive and visualize real-time measurements of the variables and process parameters. It is organized with a modular structure in order to improve flexibility and to allow multiple software components to be developed independently. This software design technique provides the added benefit of avoiding a strong coupling with a single programming language. The user, therefore, remains free to select the best tools and libraries on a task-by-task basis.
MEMO-HQ is composed of two main parts: A software developed to run on an Arduino board (in our prototype, Arduino Uno) and a second one running on a more traditional server (including a low-cost system, such as the Raspberry PI).
The Arduino’s software was written in the C++ language and it was developed, tested and uploaded on the board using the Arduino IDE integrated development environment (IDE). Its main tasks consist of the acquisition of multiple probe measurements, their aggregation and dispatch to the main server via a serial/USB connection. These measurements represent the output values of the probes, expressed as an electric potential difference. They must be converted to the appropriate units of the monitored physical parameters.
This is the role of the second component of MEMO-HQ, which additionally post-processes the time series to reduce noise, manages alarms and save all the acquired values in a database for long term storage. The software also runs a web server to expose a web-based graphical interface to browse the time series: The user can observe in real-time the latest acquired values or can explore aggregate values from historical archives. The web interface was designed in order to facilitate the transition of MEMO-HQ to a complete supervision of the process from a remote location. Lastly, the interface provides the option to download a full-textual dump of all historical series for backup purposes.
The web tool was implemented as a collection of modules developed in the Python language. Their roles correspond to the following tasks: connection to the Arduino, acquisition of measurements, post-processing, management and archiving of time series.
The first time the server starts, it establishes communication with the Arduino board through the serial or USB port. It then immediately switches to the continuous acquisition and storage of sensor measurements.
Specifically, each signal is converted from a value of potential difference to the appropriate physical quantity by means of a specific calibration curve for each monitored parameter. As the maximum acquisition frequency of the Arduino is 10 kHz, the measurements can be faithfully sampled and safely managed (from the acquisition of signal to communication) at 100 Hz. They are subsequently averaged to obtain one measure per second. The values are finally stored into a database for later processing, including visualization and alarm management.
MySQL was selected as the underlying relational storage for the MEMO-HQ system. This system is an open-source project that allows easy storage of multiple users’ data into a single location. Our scheme is organized using multiple tables for the purpose of archiving measurements at different time scales. Each table includes numeric fields to store the actual sensor measurements, one column for the identification code of the monitored sample and one column representing a timestamp. To improve performances, an index was created on such timestamp field.
When MEMO-HQ is first initialized, a single database table is created. It collects stored measures received from the Arduino shields to the frequency of reading (10 Hz by default). As new measurements accumulate, additional tables are created to represent the data at lower frequencies (for example, one timepoint every 2 s). The creation into the database of such a pyramidal structure is managed transparently by the MEMO-HQ server. This design decision was made in order to:
  • work with long-time monitoring processes;
  • accelerate the visualization of the time series on the web page devoted to this service.
In addition, a dedicated module for managing data backup was implemented in order to save data collected during process operation to an external storage system. By default, Memo creates a compressed backup file once a day. The actual interval can be changed by the user via configuration files.
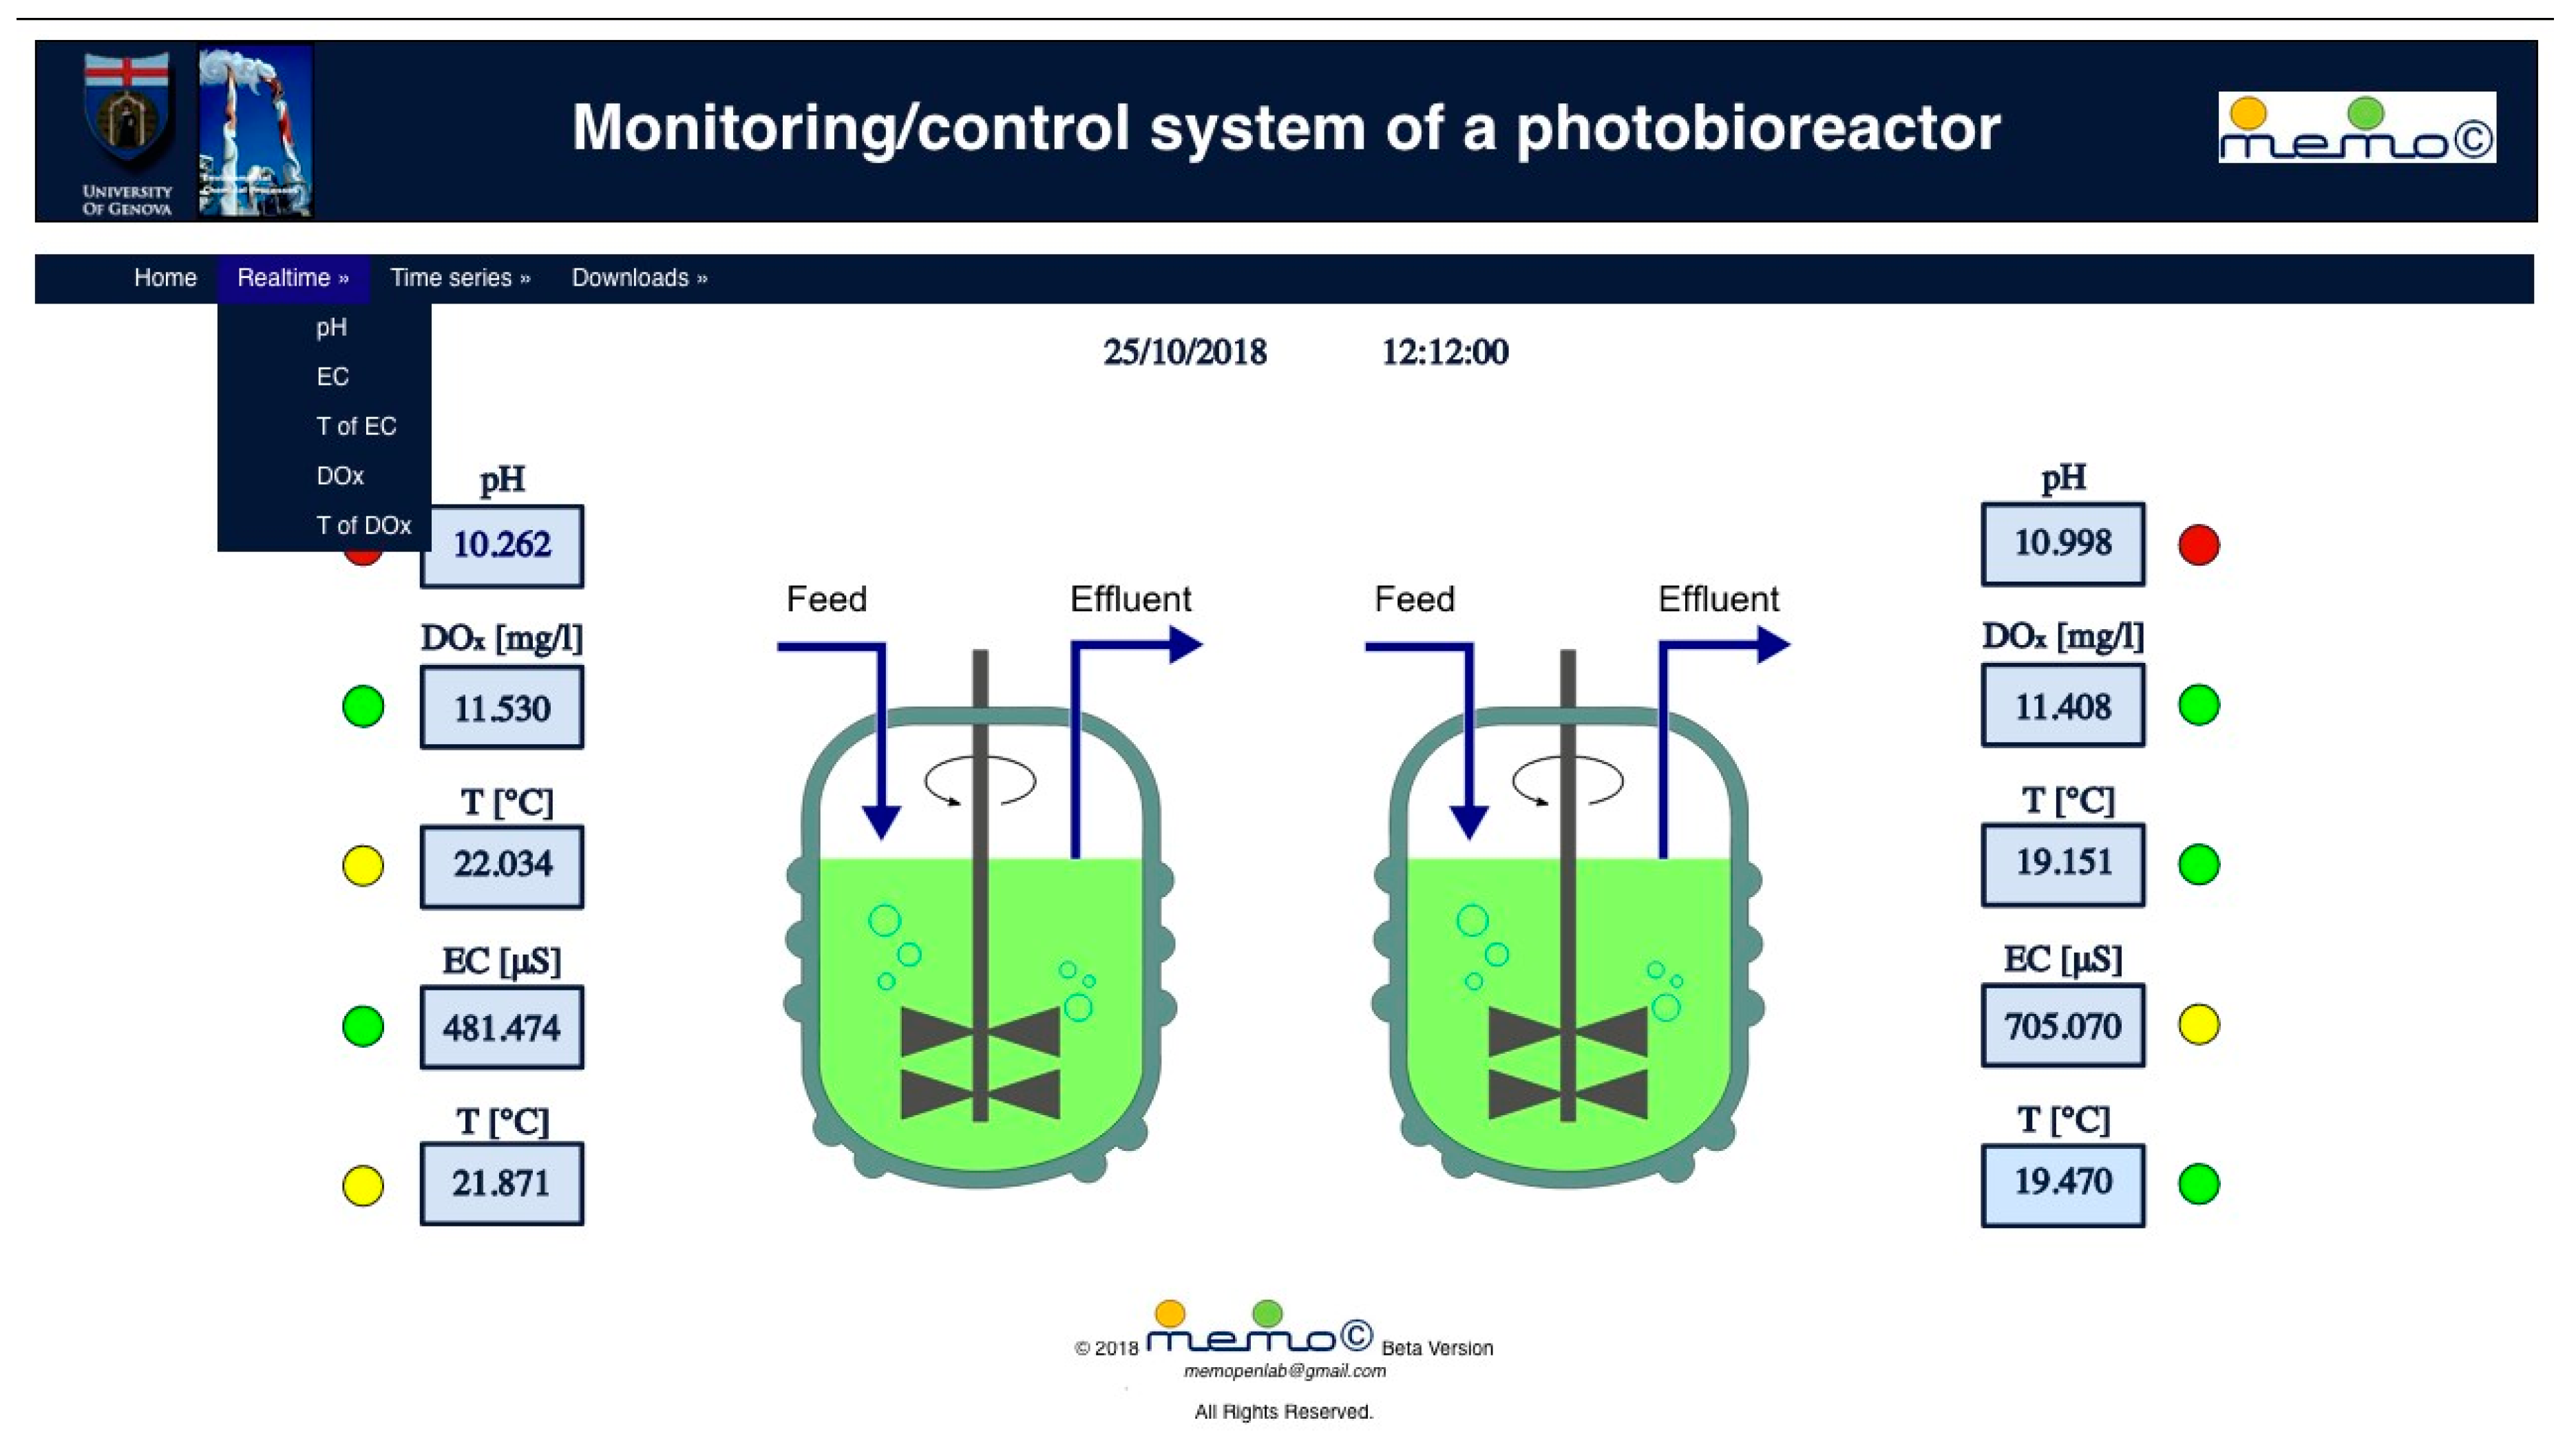
In order to facilitate the real-time display of the monitored parameters and their trend, as well as the possibility of monitoring different processes, a web interface with clear panels for each monitored physical parameter was developed. After identification by personal credentials, the users have access to the MEMO-HQ’s Home page where all captured measurements are updated in real-time. To make the interface more intuitive, a schematic representation of the process has been included (see Figure 3).
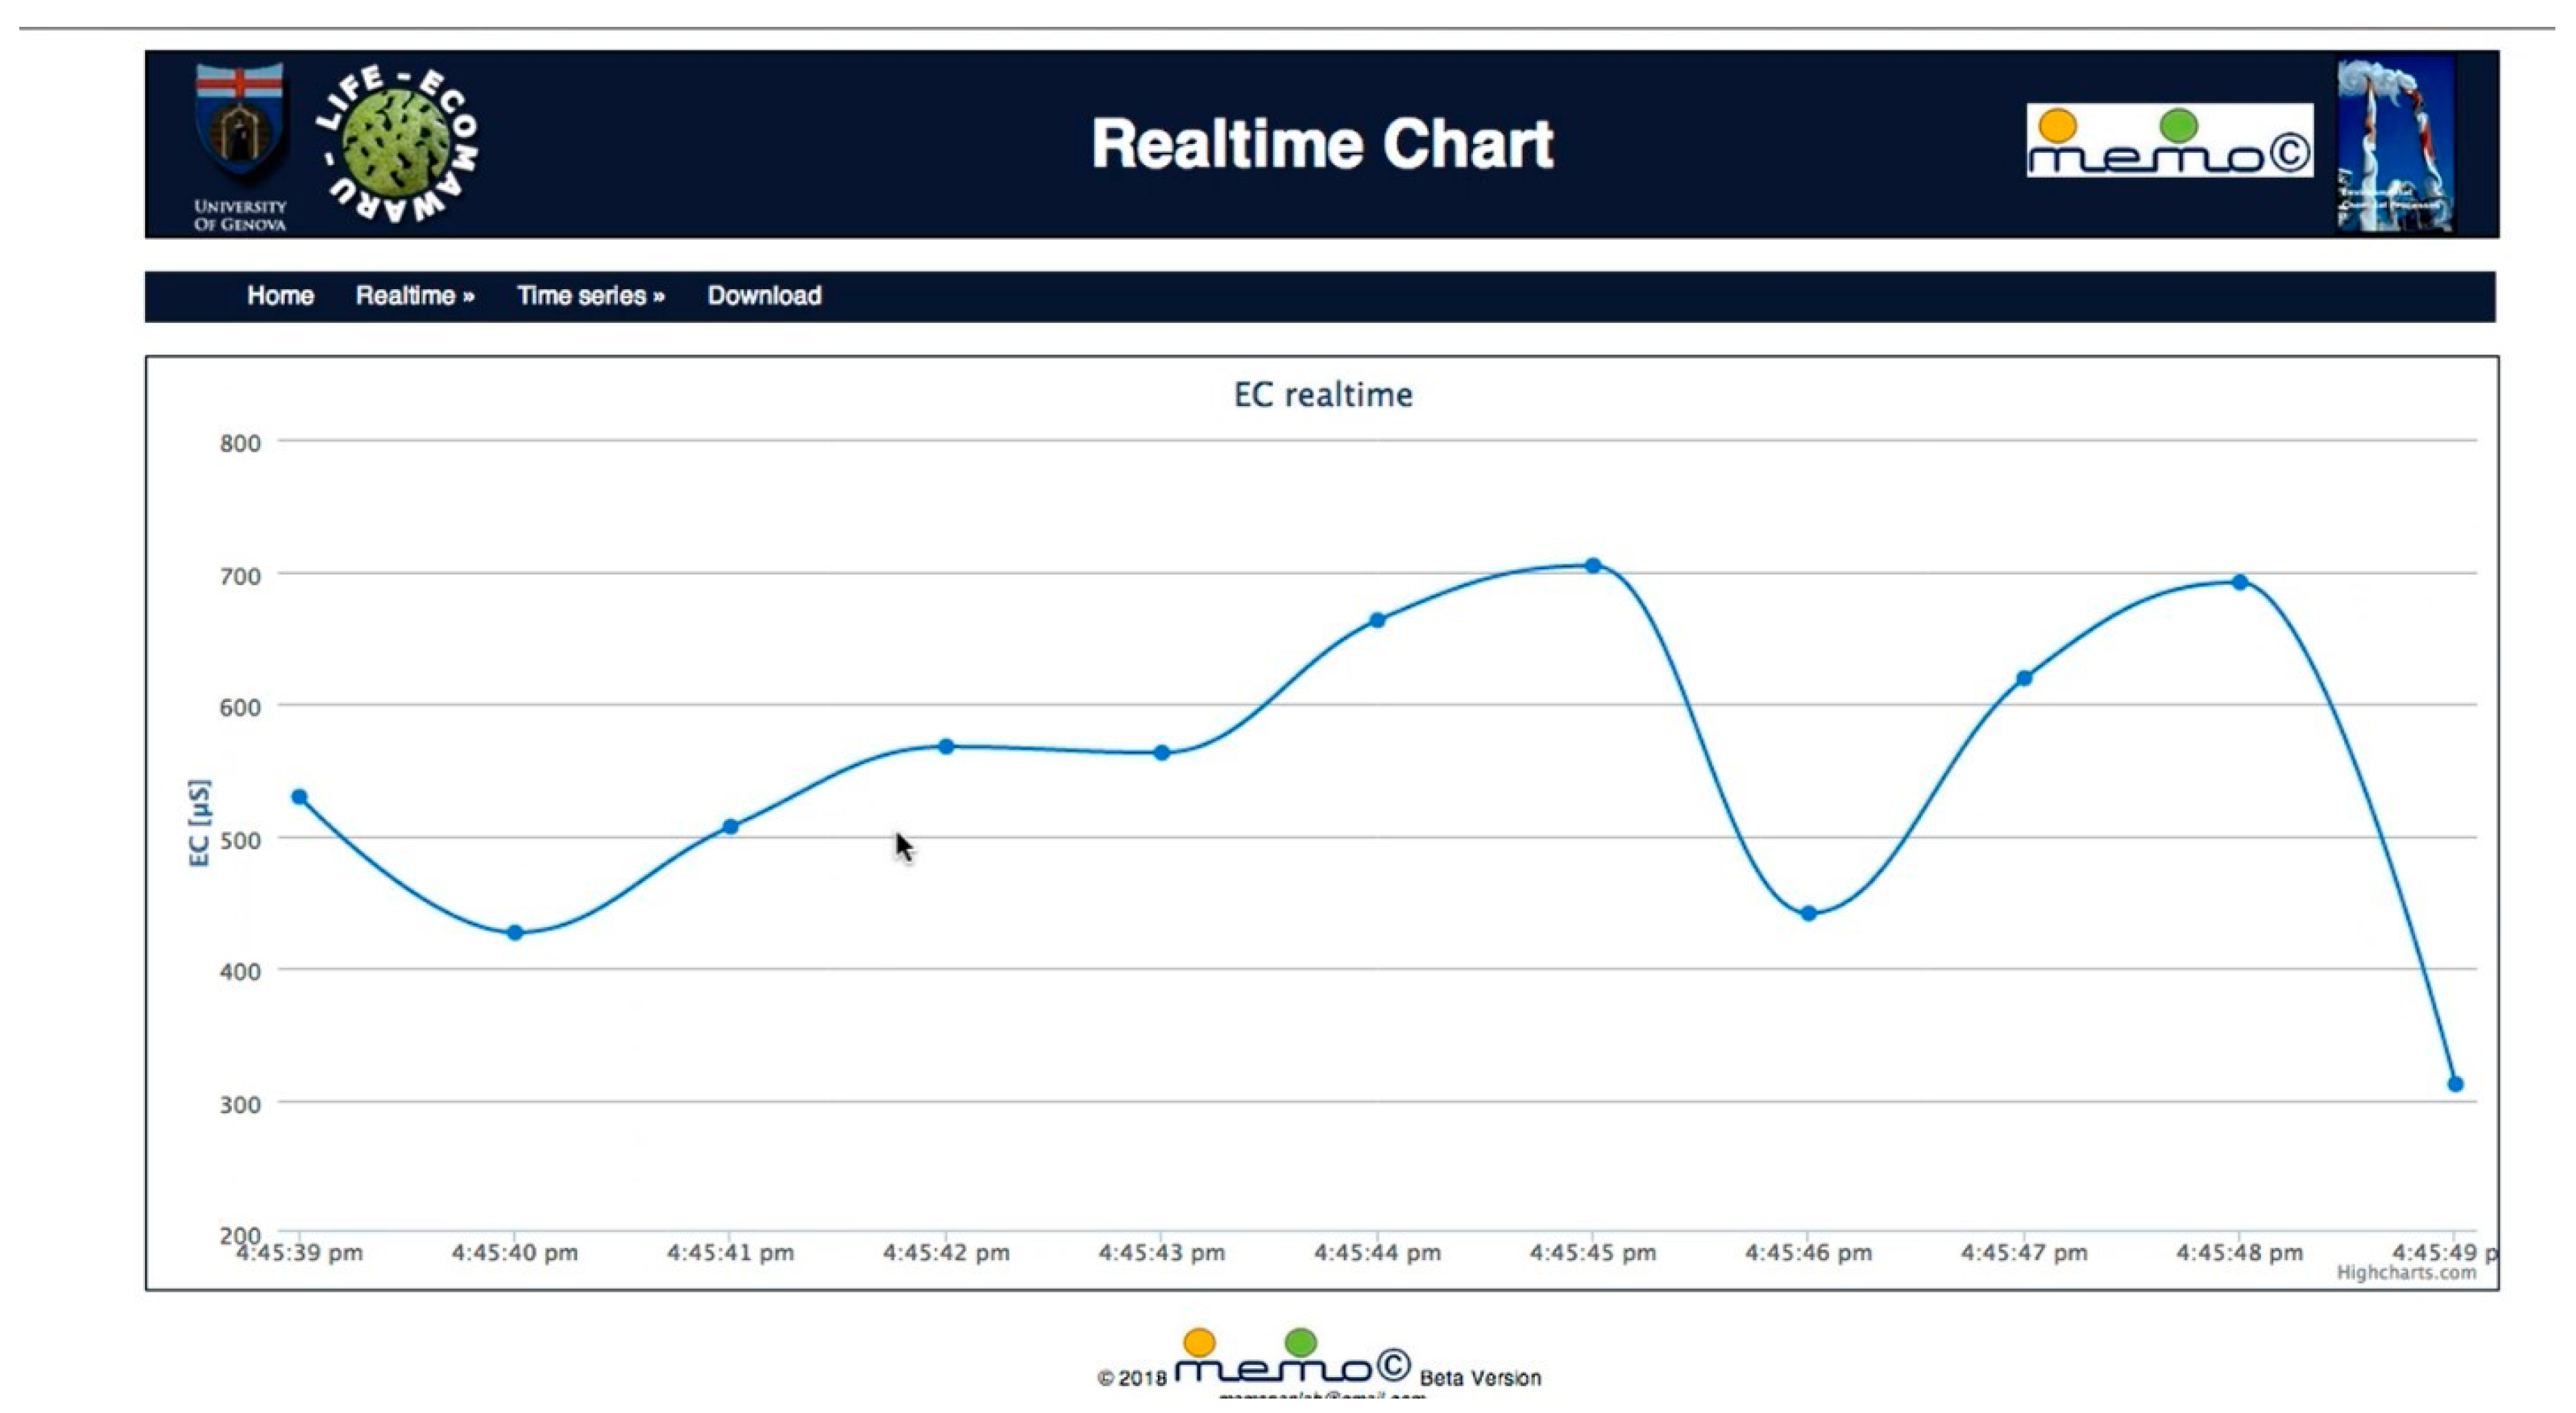
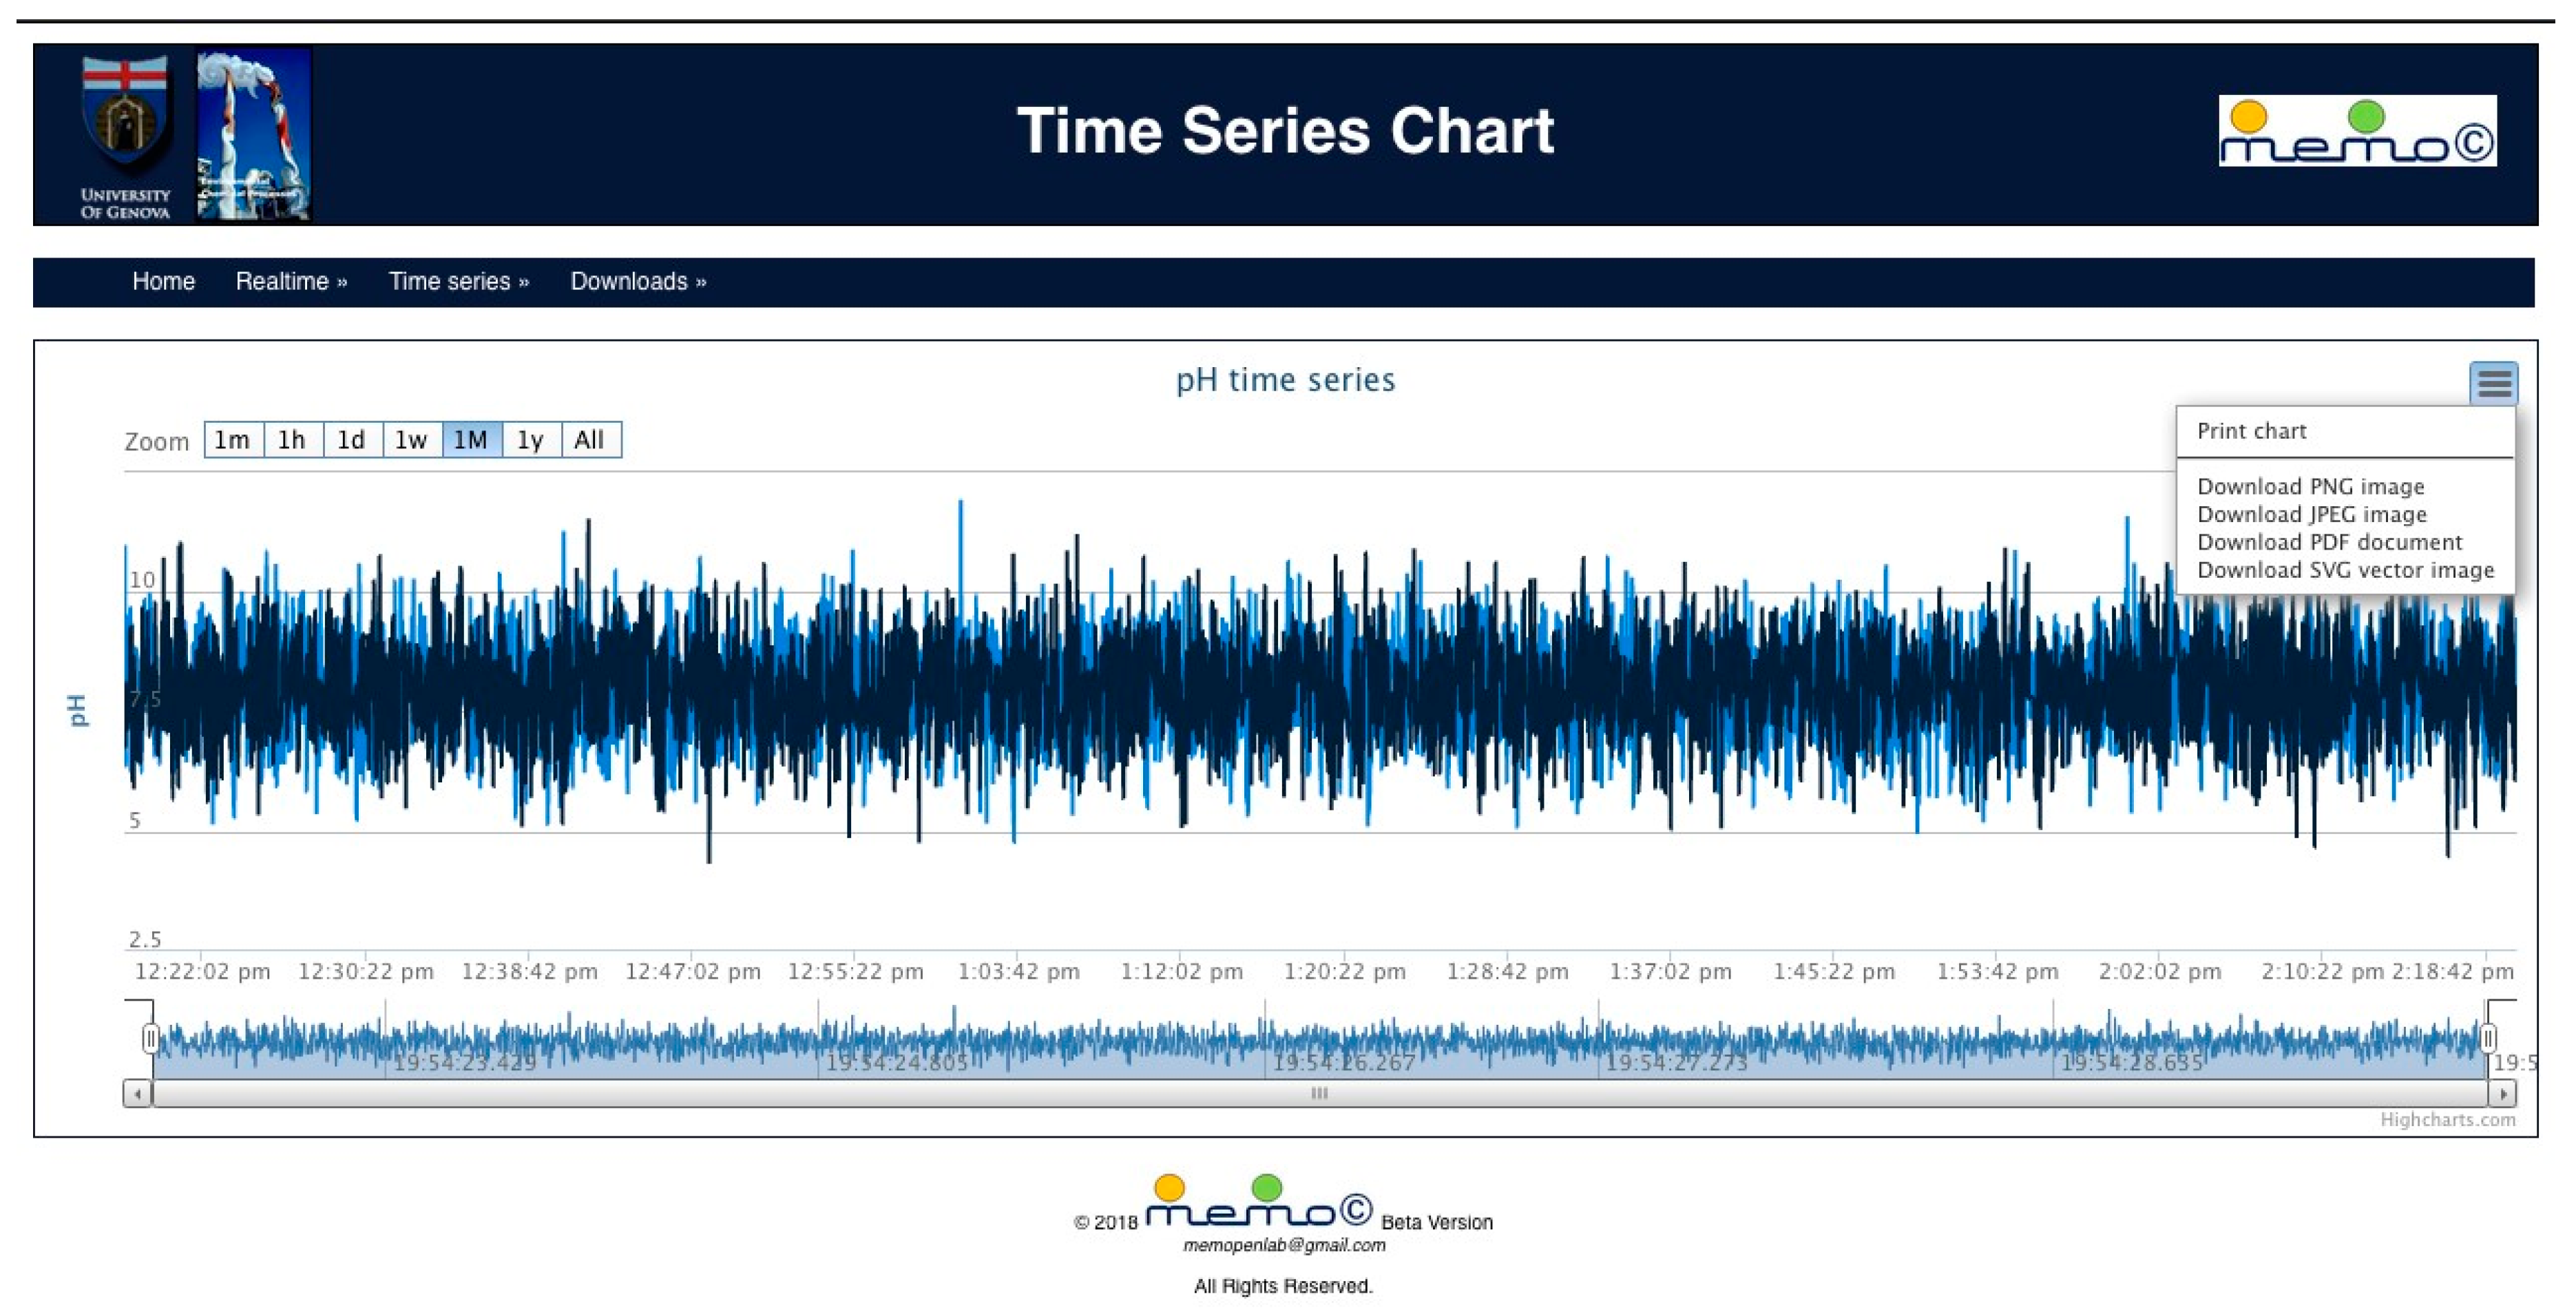
The navigation menu in the top bar gives access to more pages devoted to the visualization of single physical parameters either in real-time or as historical time series (see Figure 4 and Figure 5). It is thus possible to have a complete vision of the trends in the monitored parameters across an entire lot processing. Using the scroll bars, the dialog boxes and the buttons appearing in the upper and lower sides of the graphs, the users can select a single period of interest and limit the display of the time series. By clicking on the icon in the top right corner of the plot, it is possible to save and print the graph currently displayed. The web interface was developed using a number of open-source libraries, including jQuery, Handlebars, highcharts and Canvas.
More information about the scripts (paths) necessary for the correct operation of the MEMO can be found in Appendix A.

2.3.1. HQ-Pro

This tool manages alarms and extracts information from the time-series by applying different strategies.
As regards to alarms detection, in parallel to the classical comparison of the actual filtered values of the measured variables with the operating ranges set by the user, HQ-Pro uses some algorithms properly developed to perform Early warning detection based on the following criteria:
  • The calculation of the first and the second derivative of the monitored variable. As an example, if the temperature is the process variable whose dynamics requires particular attention, early warning is sent when:
    d 2 T R d t 2 0
    d ( T R T C ) d t 0
    where T R and T C are respectively the reactor temperature and the coolant temperature.
  • The practical application of the Lyapunov exponents criterion. The Lyapunov exponents of a dynamic system at a point P give the measure of how significantly the orbits of the system are dependent on the initial data (sensitivity on input data) and are therefore indicators of the presence of the complex and not predictable dynamics. They measure the average velocity of departing of the orbits of the points near the point P from the orbit of P , for sufficiently long times. In a dynamic system with a m dimensions phase space, it is possible to monitor the evolution of a m -sphere of infinitesimal dimensions (around point P ) that will become an ellipsoid over time. The j -th Lyapunov exponent is defined in terms of the length of the j -th axis of the ellipsoid at time t as:
    λ j = lim t 1 t log 2 P j ( t ) P j ( 0 )
The following theorem can be adopted:
If x ˜ is an equilibrium point for a system described by x ˙ = f ( x ) , a sufficient condition for x ˜ to be stable in the future is that a Lyapunov function W ( x ) C 1 exists such that in U 0 of x ˜ simultaneously satisfies:
W ( x ) > W ( x ˜ ) x U 0   ( x x ˜ )
L f W ( x ) 0 x U 0
where L f is a proper derivative function (Lie’s derivative).
If the dynamic equations describing the process under study are (or can be reduced to) a state-space representation, where a set of input, state and output variables are related by first-order differential equations in the state variables and by algebraic equations in the output variables, their deterministic continuous formulation can be written as:
d x d t = G ( x ( t ) , u ( t ) )
y ( t ) = H ( x ( t ) , u ( t ) )
where x ( t ) = ( x 1 ,   x 2 ,   ,   x n ) is the vector of the state variables and u ( t ) and y ( t ) are respectively the input and the output variables.
Then, a practical criterion to send an early warning is to choose as L f W ( x ) the divergence of G , so, according to Equations (4) and (5), an alert is sent when:
tr ( J ) = div ( G ( x 1 ,   x 2 ,   ,   x n ) ) > 0 .
div ( G ) can be calculated without knowing the equations of the system only by measurements of one of the variables in the phase space [13,16]. The practical developments of this method applied to nonlinear complex dynamic behavior of chemical reactors can be found for DSTRs in [17,18] and for CSTRs in [19].
With reference to data post-processing, in order to detect recursive patterns or correlations between the process parameters and organoleptic characteristics of the food product, HQ-Pro can be interfaced with external SW as Matlab Systems Identification Tool in order to use the acquired data for the identification of black-box models of the process. The models’ identification can be also performed by using Python libraries as scipy opt and/or machine learning-based clustering and optimization tools [20,21] or neural networks tools [22,23,24].
Among the possible models, linear black-box structures are proposed. They are summarized by the general family [25]:
A ( z ) y ( t ) = B ( z ) F ( z ) u ( t n ) + C ( z ) D ( z ) e ( t )
where z is the shift operator, so A ( z ) is a polynomial in z 1 .
When both F ( z ) = 1 and D ( z ) = 1 this general family reduces to the linear autoregressive moving-average with eXogeneous term ARMAX model written as:
A ( z ) y ( t ) = B ( z ) u ( t n ) + C ( z ) e ( t )
With their special cases known as the ARX model when C ( z ) = 1 , the ARMA model when B ( z ) = 1 , the AR model when both B ( z ) = 1 and C ( z ) = 1 and the FIR model if both A ( z ) = 1 and C ( z ) = 1 . They can represent most of the dynamic correlations between the variables of food production processes.
Since ARMAX and derived linear black-box models cannot describe the multiplicity of steady-states, the NARX (polynomial nonlinear ARX) model that uses y t 1 and u t 1 is proposed in case of particular complex behavior of some semi-continuous or continuous chemical reactors. This black-box model, being nonlinear in the variables, can describe complex dynamics, but since it is linear in the parameters, its identification procedure (parameters estimation) can be carried out only by a least square algorithm [26].

2.3.2. HQ-Track

Since the operating database of MEMO-HQ is organized as a pyramidal structure, the time series can be browsed and the user can explore aggregate values from historical archives. HQ-Track generates one QR-Code for each lot of products that, if this option is allowed by the company, can be used by the consumer to access some data about the lot to which the product belongs. A twin copy of the database, with the detail established by the manufacturer, is generated when HQ-Track is on. The database is resident on dedicated servers and it is deleted ten days after the food shelf life.

2.3.3. HQ-Pack

This tool has been designed in order to help the micro/very small-sized food processing industries in the choice of packaging by solving some simple migration problems. Second Fick’s equation of pure diffusion is used for both migrations into the packaging material and into the food. The values of the diffusion coefficients D A , P and D A , F , respectively for each possible contaminant A into each packaging material P and into each different food simulators F , are requested. The boundary condition between packaging and food can be formulated in different ways, but in general, it can be expressed in terms of K P , F defined as the partitioning coefficient of the component A between packaging material P and food F :
K P , F = C A , P ( t = ) / C A , F ( t = )
HQ-Pack contains:
  • a database with the following data:
    • Commission Regulation (EU) No 10/2011 of 14 January, 2011 on plastic materials and articles intended to come into contact with food and related Annexes [15];
    • List of substances (migrants) of Annex 1 [15];
    • Specific Migration Limits of Annex 1 on Group restrictions [15];
    • Food simulants of Annex 2 [15];
    • Contact time Annex V and the contact temperature Annex V [15];
    • The values of the diffusion coefficients of the main migrants into the most used plastic materials (polyethylene (PE), polypropylene (PP), polyvinyl chloride (PVC), high-density polyethylene (HDPE), low-density polyethylene (LDPE), polystyrene (PS), polyethylene terephthalate (PET));
    • Partitioning coefficients of the main migrants from the most used plastic materials to the food simulants of Annex 2.
  • The analytical solutions, if they are available, of some diffusion problems under different initial and boundary conditions, that can be used to model the migration process.
    The two solutions under the hypothesis of migration controlled by diffusion in the packaging material, valid respectively for the limit condition K p < 1 and K p 1 [27,28] and the solution under the hypothesis of migration with diffusion in the packaging material and boundary layer resistance in the food simulant (valid for high Biot number), are currently implemented [29,30,31].
  • The possibility to exploit an external link in order to obtain numerical solutions for the migration problem in case of migration with diffusion in both the packaging material and the food simulant, migration with the interaction between the packaging material and the food simulant, complex geometry and multilayered packaging.

2.4. Testing

It was possible to apply and test the technologies developed in MEMO-HQ on pilot-scale reactors and lab-scale plants and compare the developed system with different commercial systems such as National Instruments + Labview and B&C Electronics series 7685 Microcontrollers and related probes. The laboratory instrumentation, such as UV-VIS spectrophotometer Hach DR-6000, WTW multi-parameter portable system 340i and related probes SenTix 41, TetraCon 325, CellOx 325, multi-parameter probe YSI 6600/6920 V2 (with simultaneous measurement of temperature, conductivity, pH/ORP, dissolved oxygen, turbidity, chlorophyll, nitrates and ammonia) were used to assess the reliability of the measurements performed on-line and to estimate any errors (transmission and conversion A/D) with the adopted open technology HW.

3. Results and Discussion

The MEMO-HQ prototype was validated by two continuous tests lasting respectively three months and one month on a pilot-scale plant with semi-continuous stirred tank reactors, airlift and tubular reactors for the cultivation and use of microalgae for the purification of civil waste and CO2 capture. It was also tested on a fermentation process. Further, since in continuous mode, some operations must be managed discontinuously, the process dynamic is highly rich to verify MEMO-HQ response and its ability to capture complex dynamic behavior. At this time, MEMO has not yet been tested on a plant producing food at an industrial scale. HQ-Pro was tested in the alarm managing configuration on the microalgae pilot-plant, while HQ-Track was tested with simulated runs. HQ-Pack was finally tested with different packaging configurations, even with multiple layer materials with in-series configuration.

3.1. MEMO-HQ

The scheme of MEMO-HQ tests carried out during Chlorella Vulgaris cultivation at a lab- and pilot scale is summarized in Table 1.
Some panels from the web interface are shown in the following for the stirred tank reactors. In Figure 3, the home page with the schematic representation of the microalgae cultivation process in semi-CSTRs is reported. HQ-Pro is on-line with the alarms set by the user. The green light represents that the monitored variables are within the optimal operating ranges and the yellow and the red lights represent respectively, attention ranges and alarm ranges of the monitored variables. In the situation depicted in Figure 3, an alarm by email is sent to the selected email address for pH in both the reactors.
Figure 4 is the real-time panel showing conductivity values at each second (median of ten values measured every 100 ms).
In Figure 5, the panel for navigation into the time series of pH measures is shown. The user can move the bar under the chart to select particular time intervals. When the intervals are selected, MEMO-HQ generates the new chart with the values taken from the pyramidal structure of the database.
A demo of MEMO-HQ and its options during operation is shown in Video S1, which can be found in the Supplementary Materials. The simulated data are used in order to test post-processing tools and alarms detection.
Unlike commercial products available on the market, MEMO-HQ has demonstrated the following peculiar characteristics, which can be considered strong points:
  • It is developed according to the needs of the food industry;
  • The human-machine interface (HMI) can be consulted via the web and from any machine or smart device;
  • The user can choose the system version (data reside on proprietary machines) or the service version (data are sent to servers owned by external providers);
  • It uses public domain algorithms as far as possible, in order to keep low costs;
  • The connection to the sensors is both via open HW or commercial/proprietary HW;
  • The acquisition of signals from programmable logic controllers (PLCs) or microcontrollers, if already existing on the plant, is envisaged;
  • The data can be received from the sensors via general packet radio service (GPRS) if the network is not available (for example, fish farming in marine tanks);
  • It uses the methods for identifying patterns and for early warning detection coming from innovative research results.
The possibility to have a low-cost system, with good reliability to the micro/small food processing industry has been feasible for the following reasons:
  • The processes do not involve the transformation of substances that can lead to high risk of pollution in the event of uncontrolled emissions (the reagents and the products are food or chemical substances suitable for treating food);
  • The processes are mostly carried out in a liquid phase and the sensor costs necessary for the measurement of process variables such as temperature, pH, conductivity, dissolved gases, nitrates, ammonia, redox potential, etc. have considerably decreased in recent years;
  • The problems related to information security (data secrecy) are not critical for high-quality micro/very small companies (they usually do not use patented additives, preservatives, etc.);
  • The transients of the process variables are relatively slow and in all the process situations of the target industrial types the acquisition frequencies can be in the order of seconds (the smart-SCADA can easily manage acquisitions at 10 ms using open HW at low cost);
  • In recent years, fast algorithms have been made available for data analysis and representation of data.
The weaknesses of the system are mainly related to its simplicity, due to very low relative cost, which, if MEMO-HQ is used also as a control system, as well as monitoring the quality of the product, are:
  • It does not provide safe shut-down operations and therefore is not applicable to high-risk plants;
  • If it operates as a control system in plants at high pressure, the transients may be at risk;
  • It does not permit the implementation of high-level data protection procedures;
  • It cannot be certified because it uses open HW/SW.

3.2. HQ-Pack

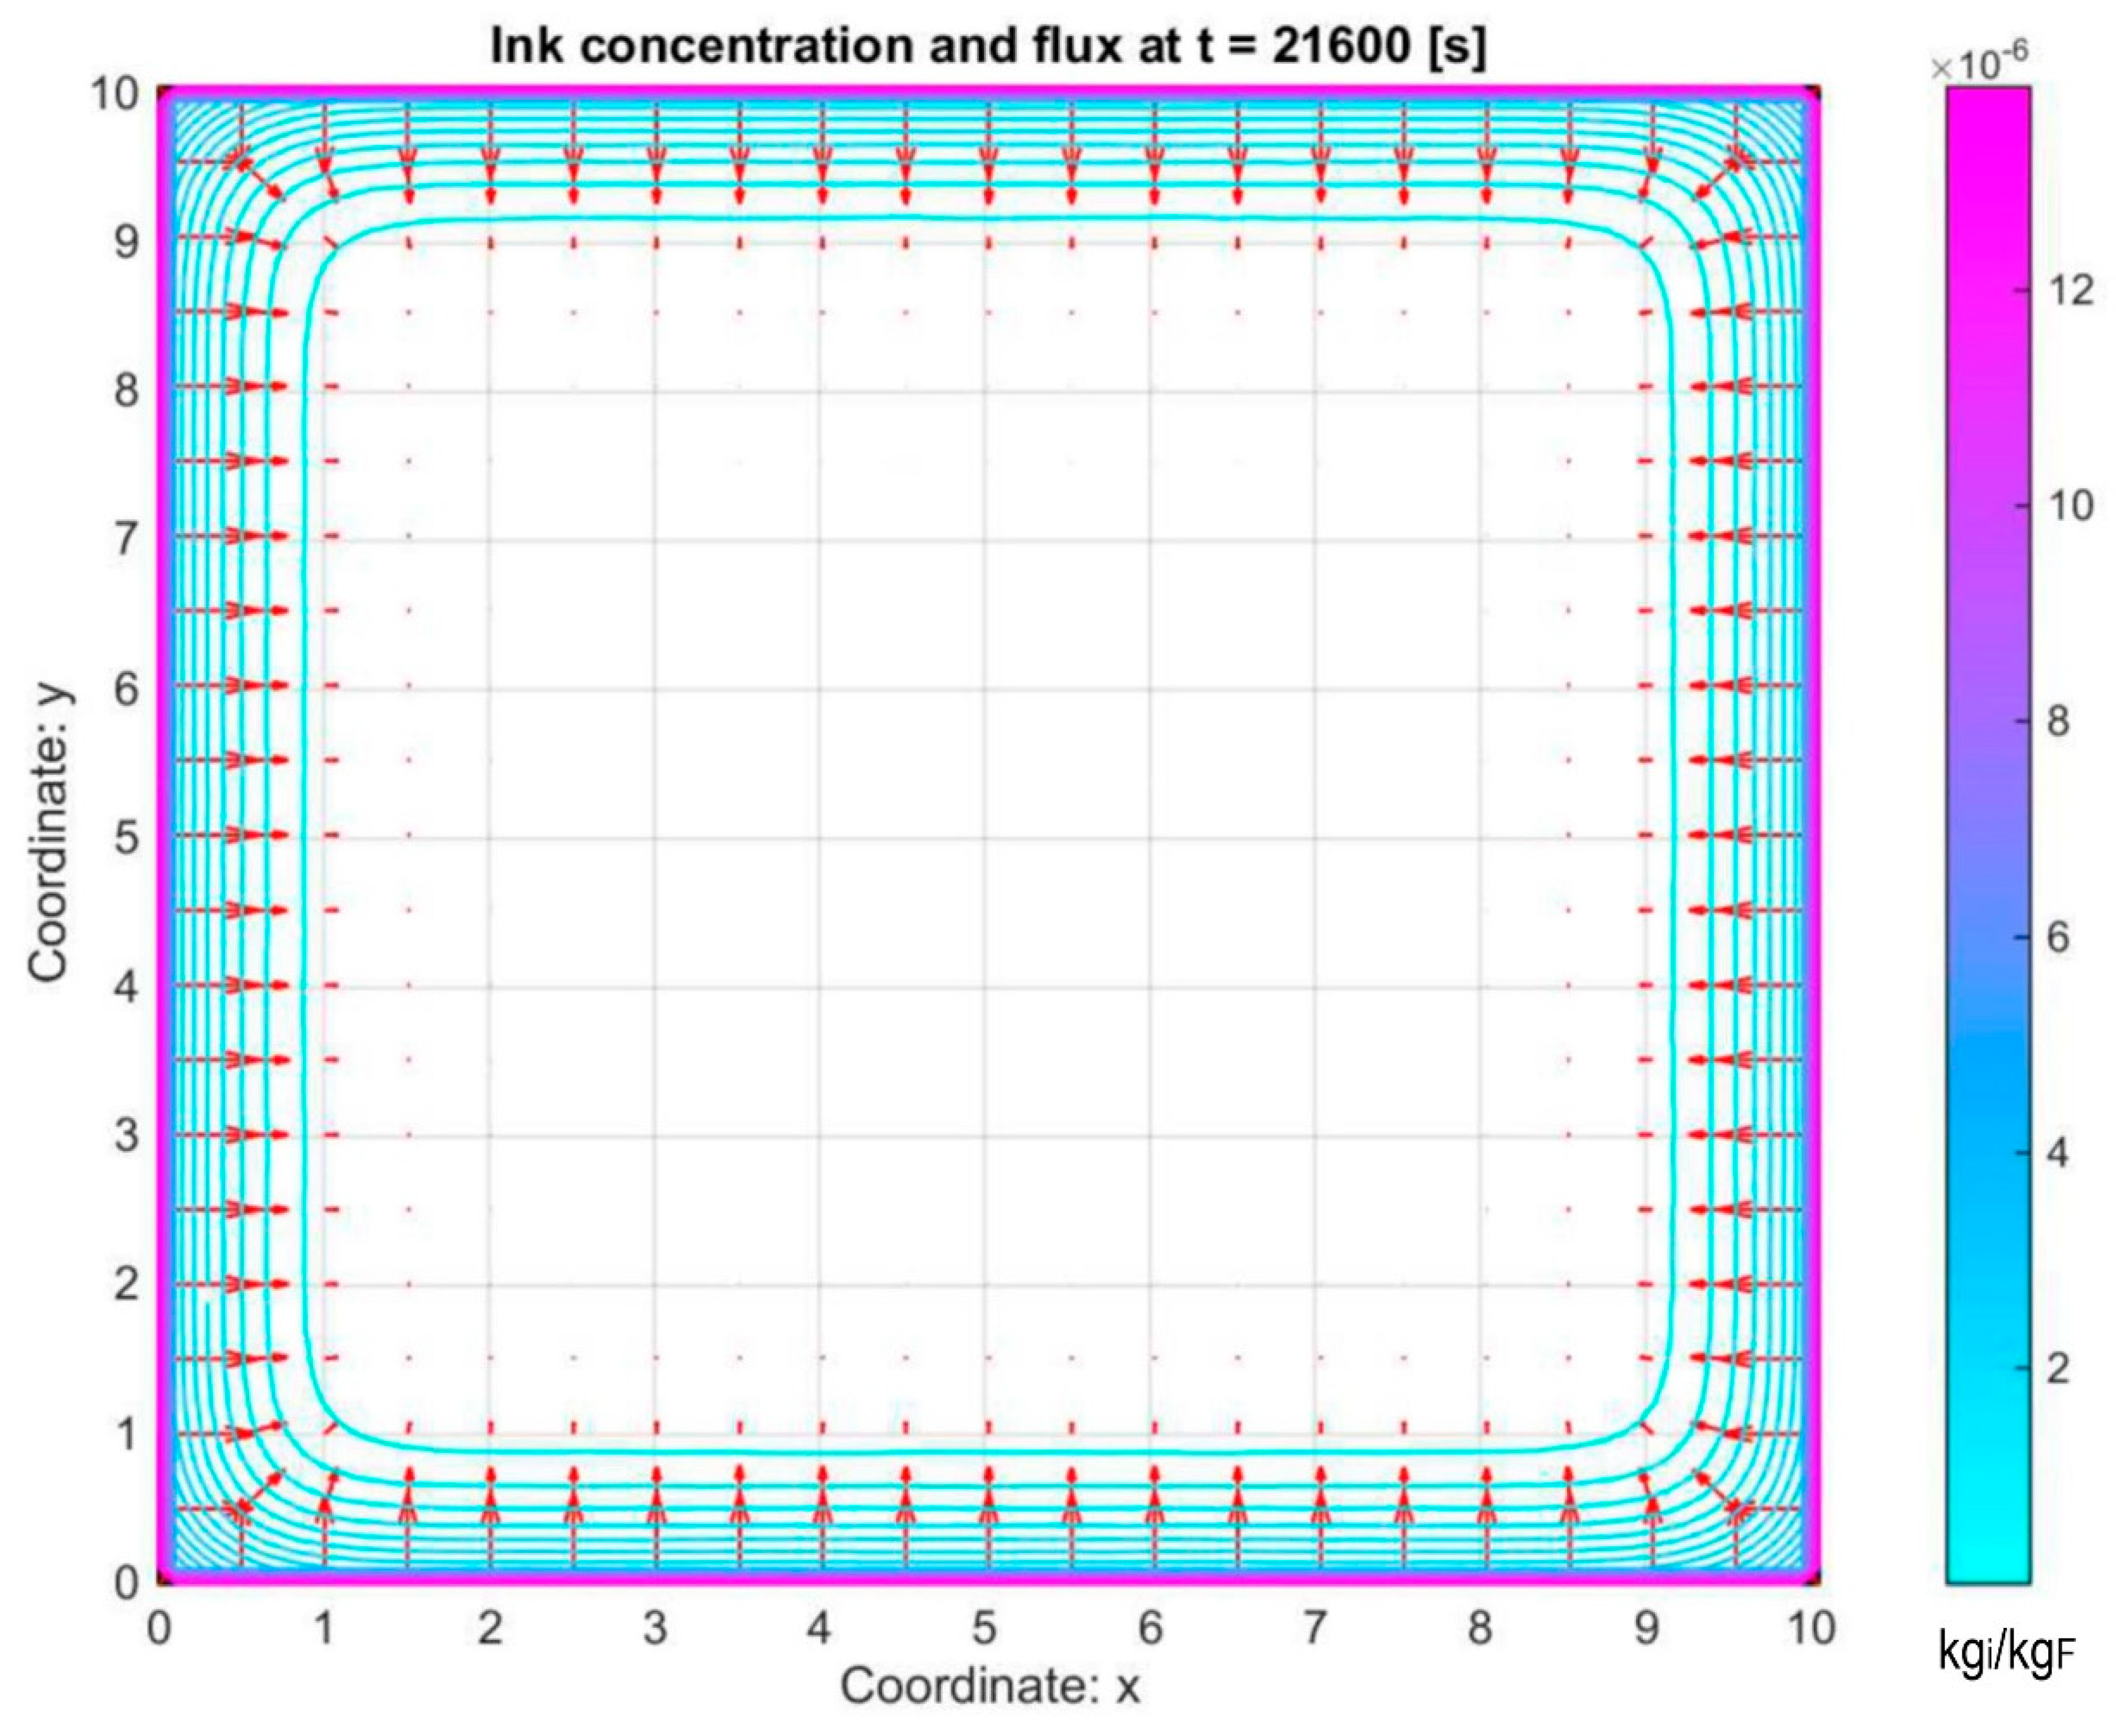
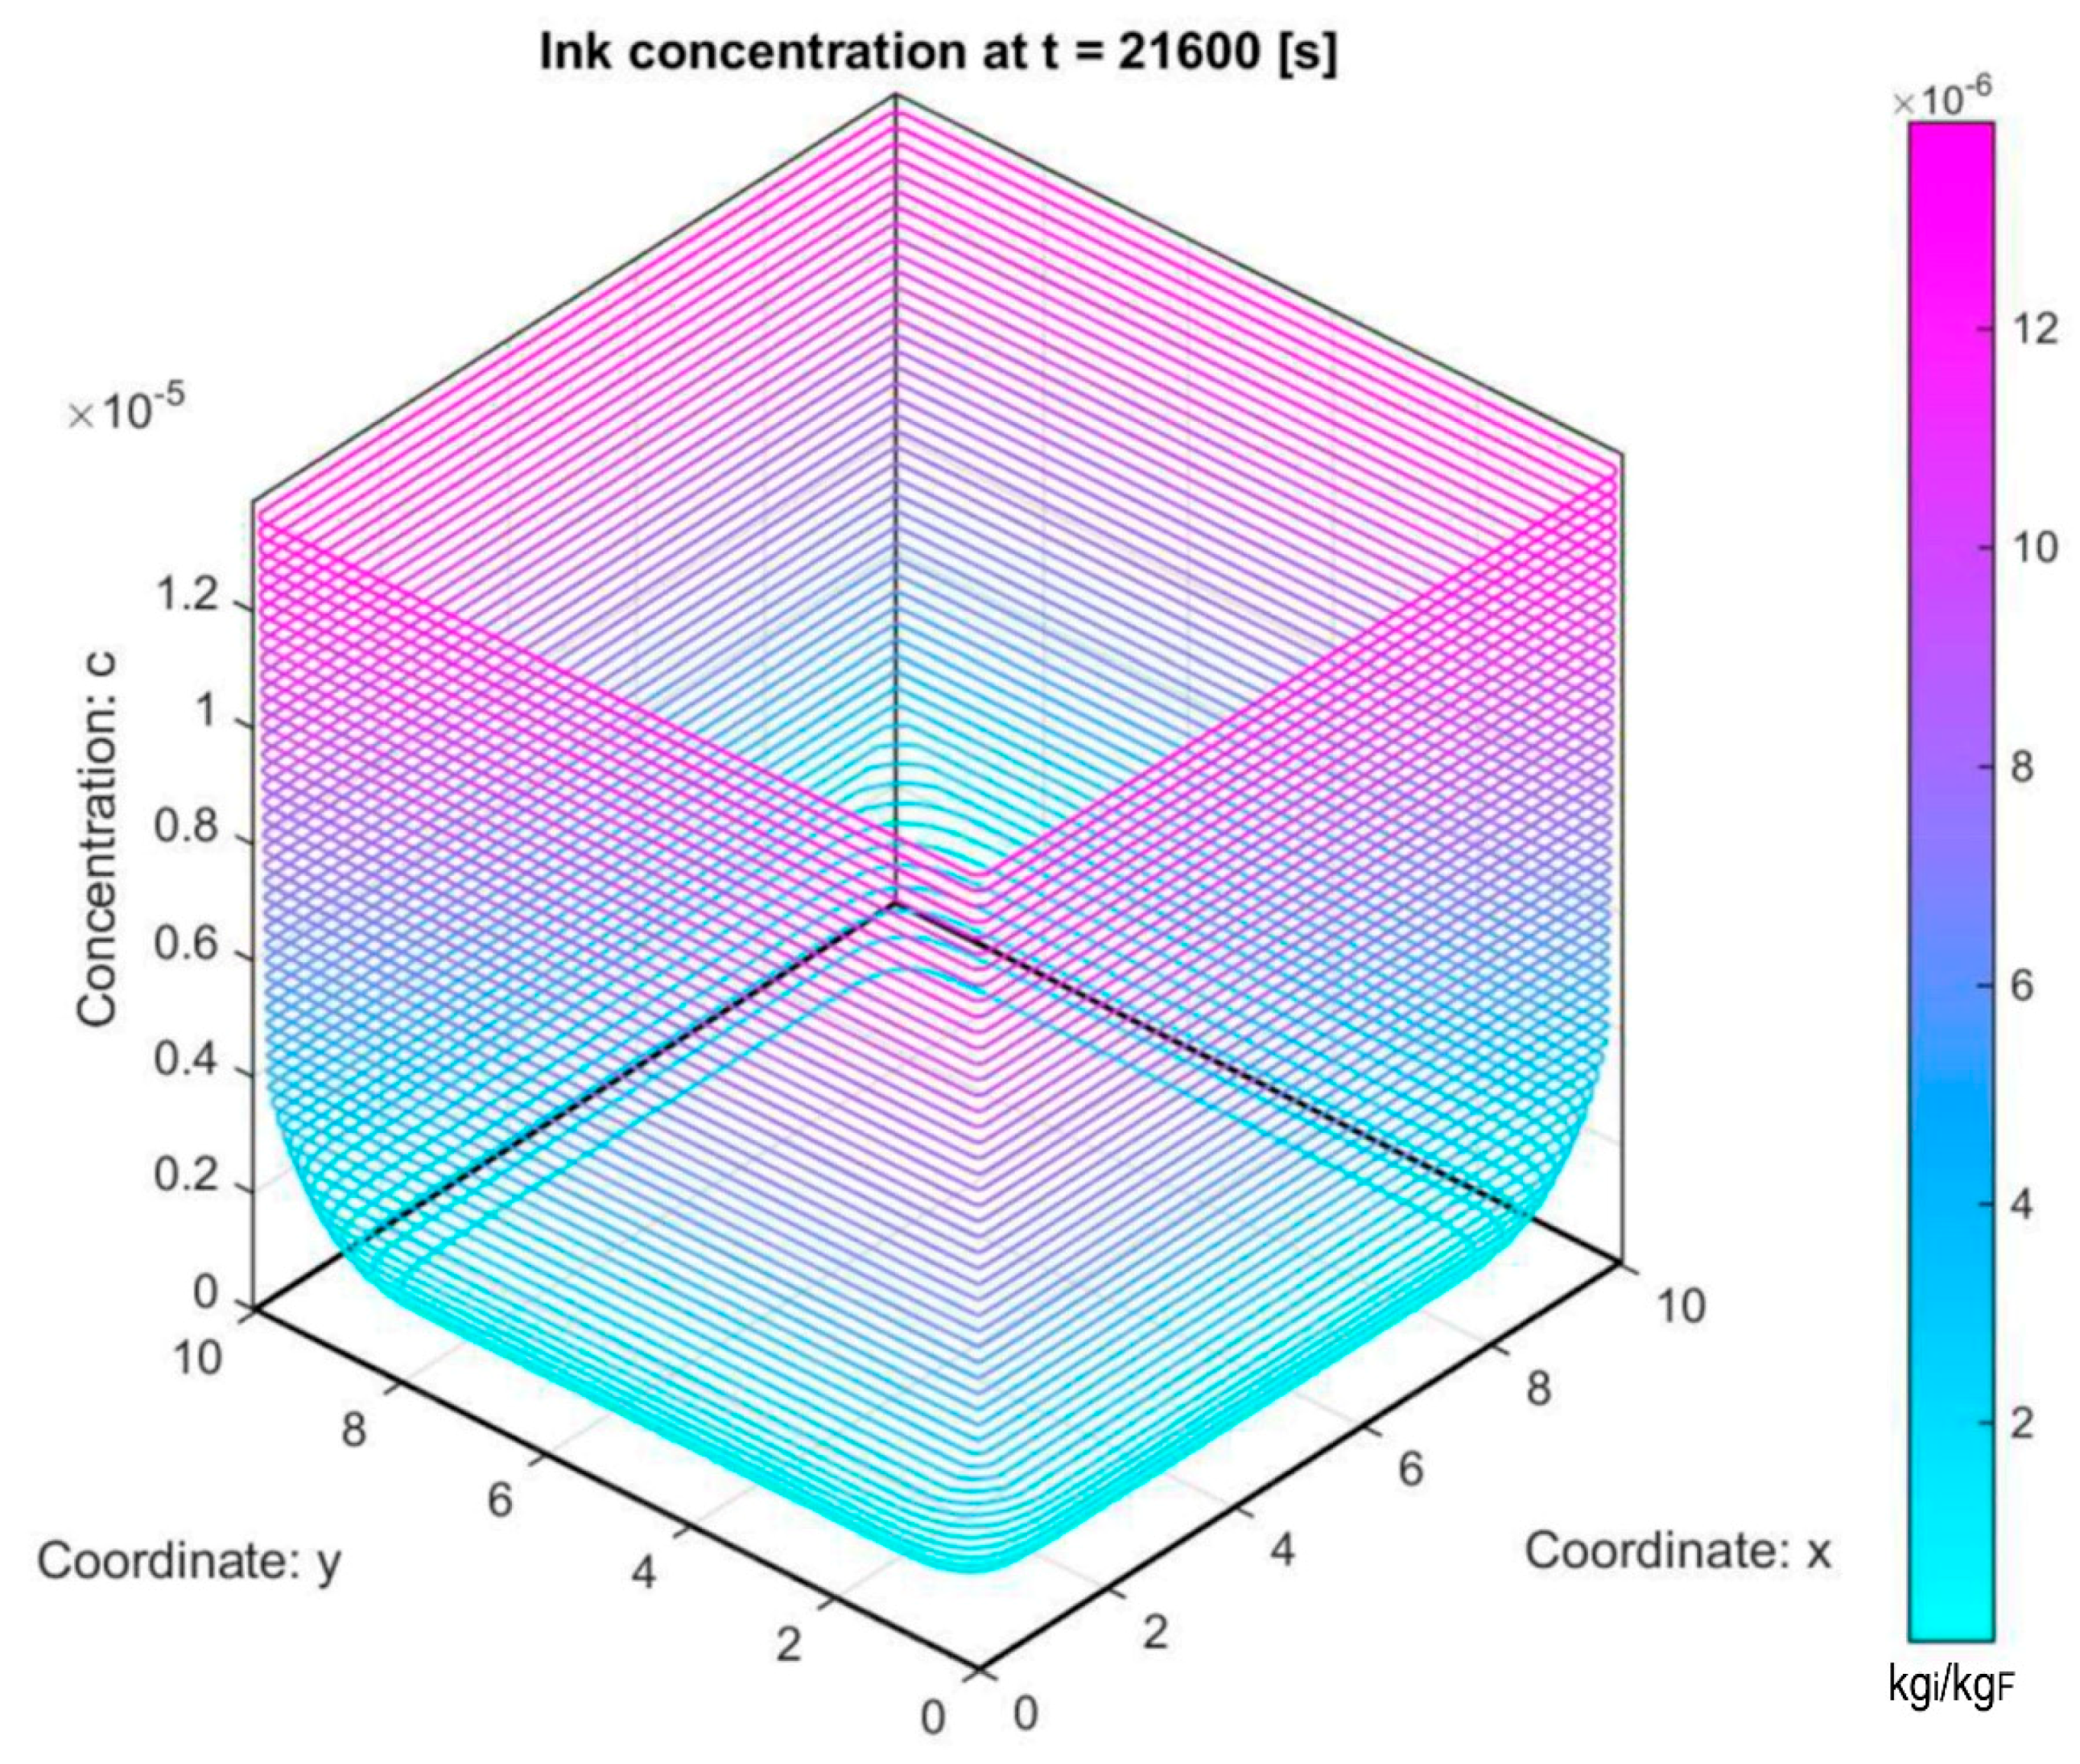
This tool was tested for a simulated case of milk contamination by photoinitiator isopropylthioxanthone (ITX). Three different packaging materials (PP, PE, PVC) with different thicknesses were considered, plus a multilayered material made by PVC + PP. The time-dependent concentration of the contaminant into the milk was calculated with the different models, using the mono-dimensional solutions of the pure diffusion problem implemented in HQ-Track.
Moreover, a parallelepiped shaped container was simulated using the numerical solution of the 2D and 3D diffusion equation (see Figure 6 and Figure 7).

3.3. Market Analysis

Several applications of the MEMO-HQ system can be provided. For the time being, this study decided to focus on the next phase of the development of applications to the Italian food industry.
The reasons for a possible success regarding the introduction of MEMO-HQ in this industrial typology are to be found in the philosophy at the basis of Italian food business, as observed in the studies conducted by the Italian Society of Food Science and Technology [32], whose results are summarized in a few words: The Italian food industry is the second-largest manufacturing sector in the country, with a turnover of more than 100 billion euros. The sector is characterized by approximately 30,000 individual companies, approximately 30,000 transformation micro-enterprises, 6500 small businesses, 200 medium-sized companies and a dozen large companies. The interest of consumers seems to reward food products characterized by process or product innovation (traditional advanced or new product), however, approximately 25% of Italian food companies have not introduced any innovation in recent years and approximately 42% have introduced marginal innovation. The low propensity to invest and the lack of corporate structure do not allow small and micro-enterprises to carry out their own precompetitive research or prototype development. A common mistake made by these companies is to consider a long research period necessary, with certain often critical procedures and times, before being able to create an innovative product or process. In reality, it has been demonstrated that the innovation of process and product in the food field is often based not on the results of research conducted ad hoc, but on the transfer of technological innovation already available at the laboratory scale.
Some of the topics discussed in the report which are priorities for the Italian agro-food industries include, among others:
  • Product certification through the identification of process and product markers;
  • Food safety of products with regard to biological and microbiological, chemical and physical contaminants;
  • The interest in innovative products or traditional evolved ones (less thermal treatments, innovative conservation processes).
All three points are well combined with the use of the MEMO-HQ system as, when it is integrated with additional tools that use the monitored data, it can contribute to the improvement of the phases of optimization of food processing processes, the definition of process markers and to develop innovative products and processes (additional HQ-Pro and HQ-Track tools), and to improve food safety in the choice of packaging (HQ-Pack tool).
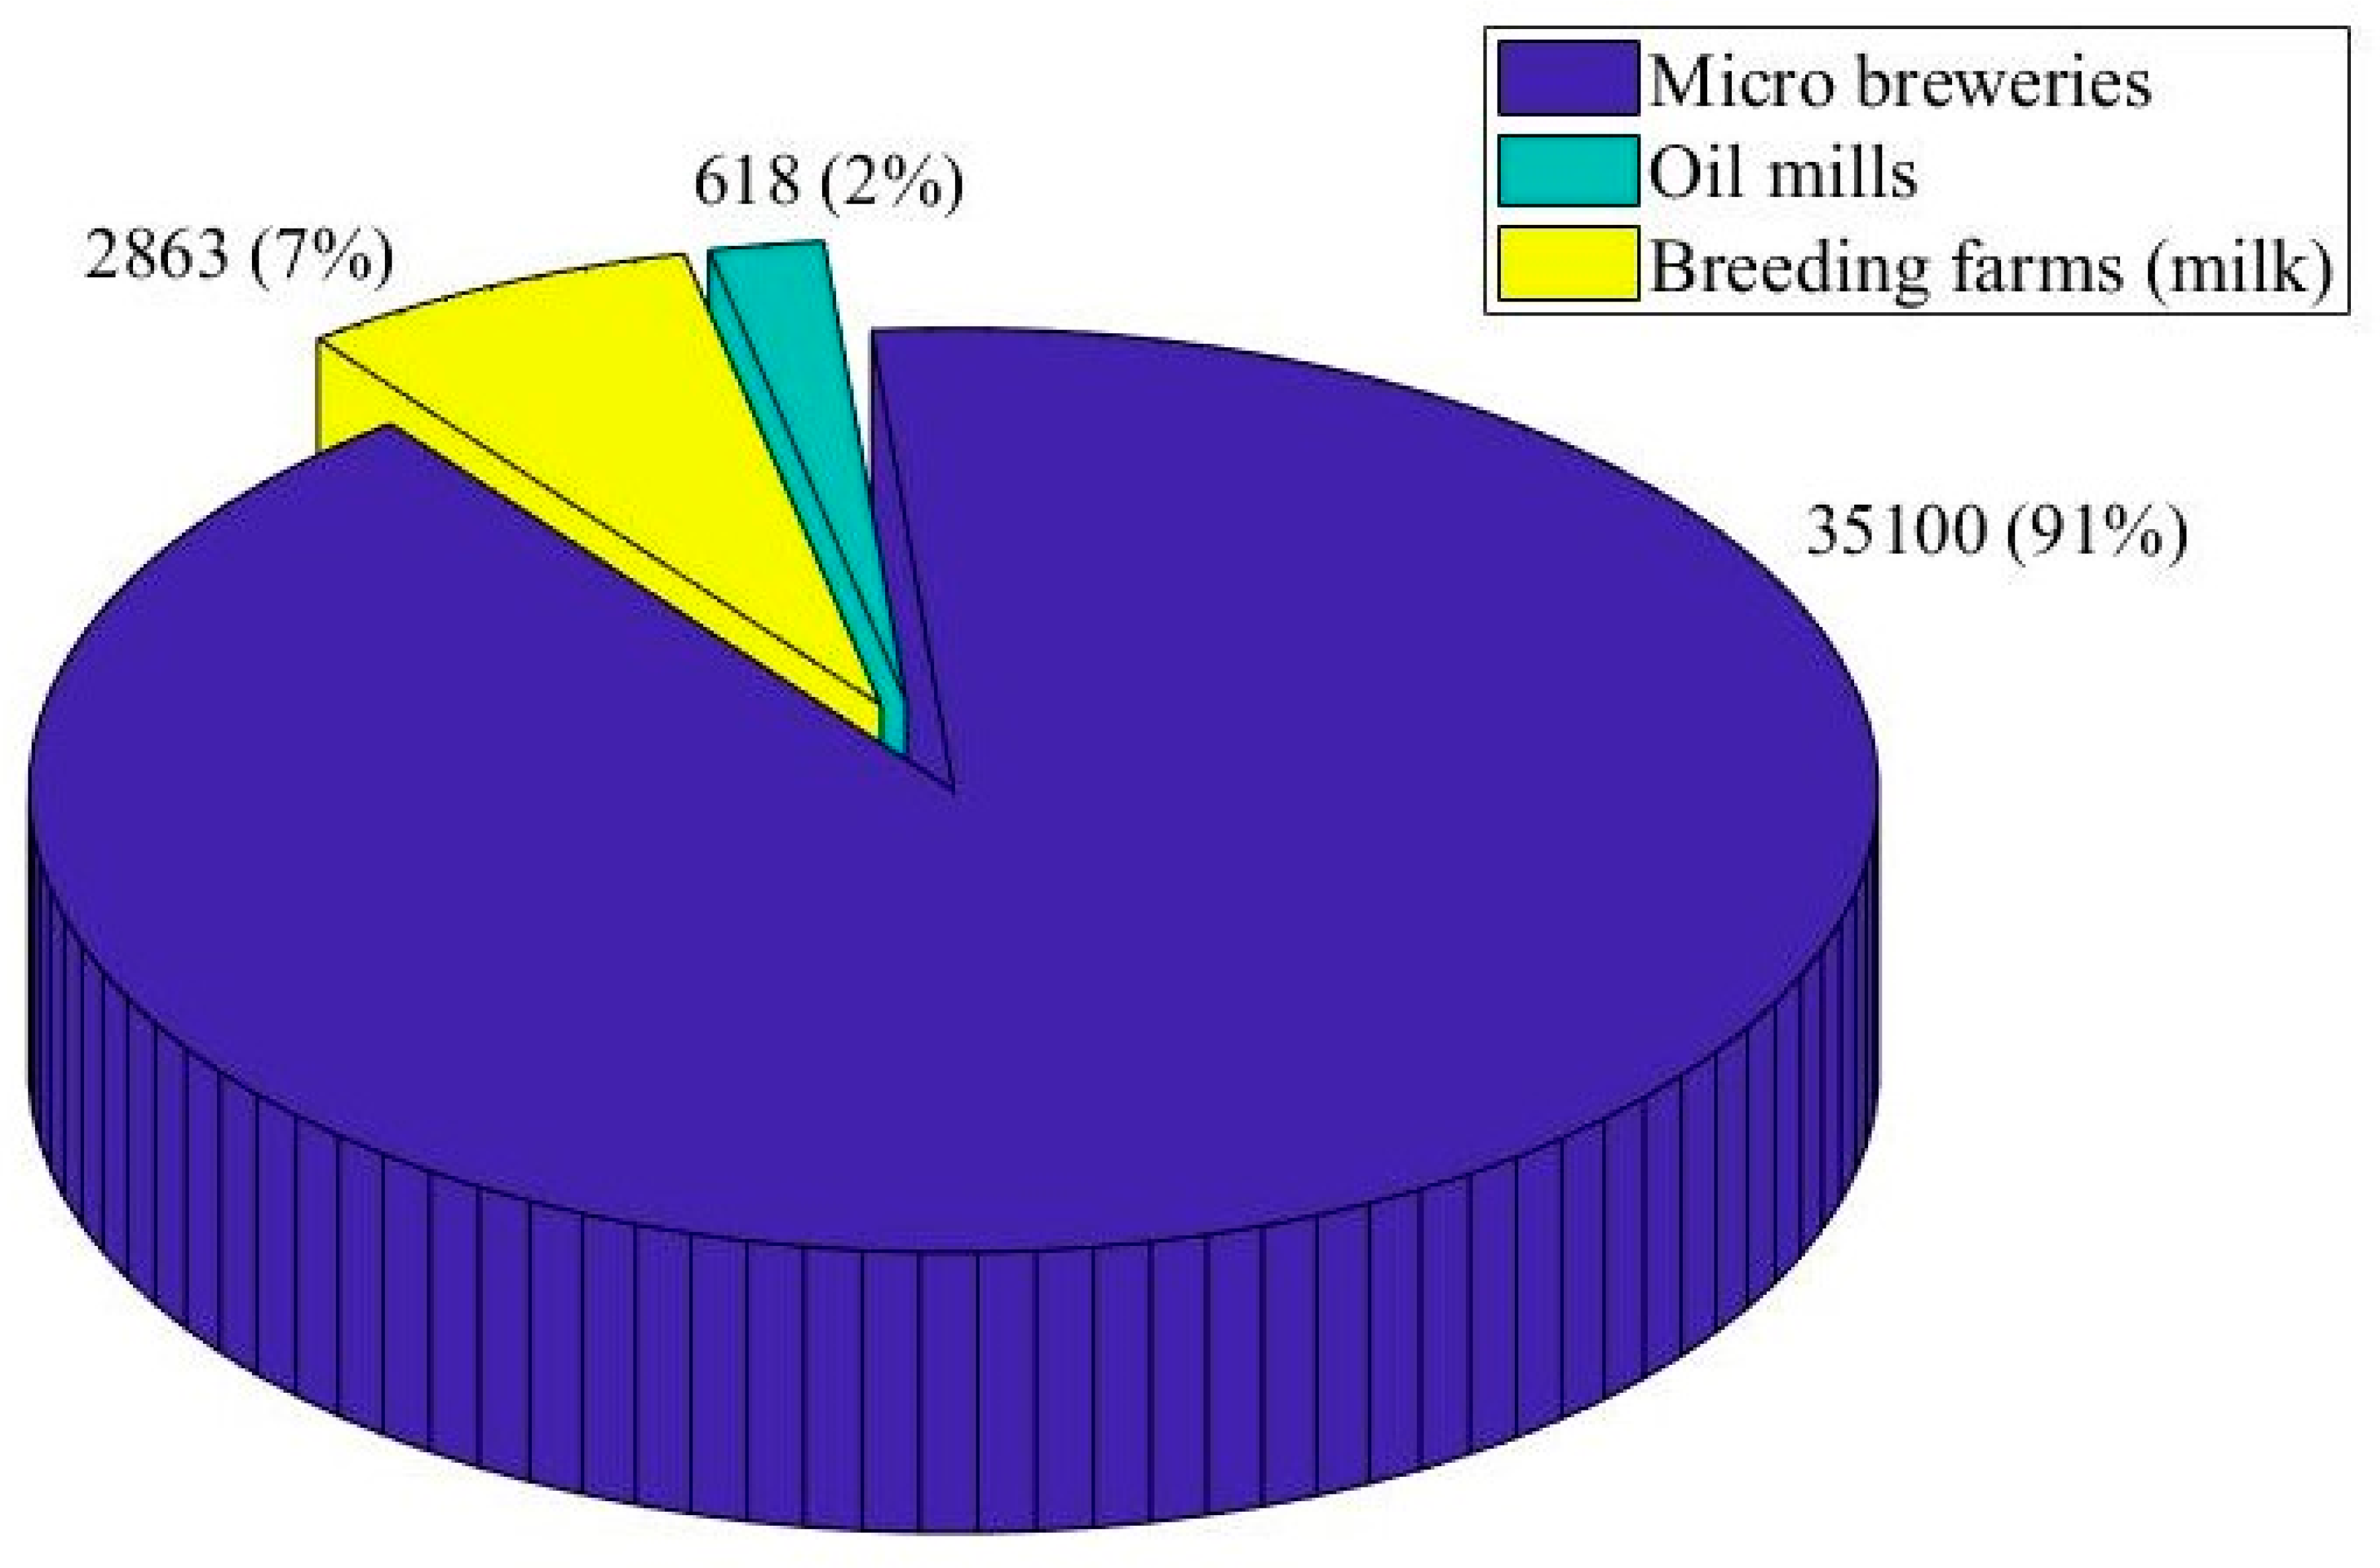
By limiting the market to the Italian territory and only to micro-brewery plants, micro/very small plants for the production of olive oil and cow’s milk that do not have their own SCADA. A minimum number of approximately 38,000 potentials is estimated (Figure 8), of which approximately 3700 are predicted to be interested in testing the prototype version of MEMO-HQ.

4. Conclusions

The shortage of the use of SCADA and DCS systems in the automation of production processes in the food and agricultural sectors, especially for micro/small-scale industries, opens the door to solutions that also implement operational databases and act in the direction of supervision and control, so as to mitigate health risks, optimize production and guarantee the quality of the products sought after. The web-based, open-source and low-cost prototype SCADA system called MEMO-HQ follows this perspective, by making available tools for optimizing operations and improving product quality through post-processing of acquired process data, analyzing the possible contamination of food from packaging through both numerical and analytical solution of migration models and thoroughly tracing the process conditions. In order to validate it, tests were carried out on both lab-scale plants and different types (tubular reactors and semi-CSTRs) of pilot-scale reactors aimed at microalgal culture and on a fermentation process. The HQ tools (Pro, Track and Pack) capabilities were showcased as well, resorting to specific cases.
The system presented in this paper offers various innovations, related to early warning detection and management of alarms, to individuating correlations between process variables by means of black-box models, as well as to data visualization and access.
Overall, MEMO-HQ can provide functionalities usually typical of systems used in plants with greater potential and, consequently, capable of coping with more substantial investments. As it is mainly based on open SW and open HW, it can be tailored to the specific process.
Our future plan is to invite small food industries to test MEMO and receive feedback from them, then eventually proceed together with a fine-tuning and/or establish a list of enhancements according to the gathered needs.

Supplementary Materials

The following are available online at https://www.mdpi.com/2224-2708/8/4/52/s1, Video S1: video MEMO. Moreover, the codes can be asked for by writing to [email protected].

Author Contributions

O.P. defined the system specifications, designed the application and wrote the draft of the paper. F.F. designed and programmed the system kernel, M.N. developed some mathematical models. O.P. and M.N. developed additional tools. All the authors contributed to writing and revising the final paper.

Funding

This research received no external funding.

Conflicts of Interest

The authors declare no conflicts of interest.

Appendix A. MEMO Demo Version

Note: to ask codes please write to [email protected].
Here the scripts (paths) necessary for the correct operation of the MEMO application with a description of them are listed. The order in which the various programs are described reflects that of their use in the application.
1 “./labScale/memo/ARDUINO/readAnalogOutput.ino”
C language code that reads the bytes in output from the analog pins of the Arduino board to which the analog outputs of sensors are connected and which sends them outwards writing them on the serial port at a time interval of 100 ms (default).
The bytes received, that the Arduino shield writes on serials, are voltage values that will then be converted into measures.
This program must be compiled and then uploaded to the Arduino processor. All this is done via IDE of the Arduino downloadable at the address:
2. “/labScale/memo/database/createDb.sql”
The script for the creation of the basic structure of the MySQL database in which the parameters monitored by the probes will be stored.
The ‘memoDB’ database is initially created using only the ‘sec1′ table, which can be accessed by two users: Arduino and web.
The first user calls to the data entry database.
The second user is used for the data reading calls from the db, hence it is able to publish them on the web pages.
The ‘sec1′ table is divided into 2 + n fields: id, date, sens 1, sens2, …, sensn, where the measurements acquired by the probes (sens) at the “desired by the user” storage interval (default = 1 s) will be saved.
With the tag ‘id’, this study refers to the number of plant-unit to which the measurements belong. This study opted to use a TINYINT as the type of the ‘id’ field for memory reasons but nothing prevents the use of a string.
In the date column, the time acquisition of each measure is found in timestamp format.
In addition, an index is created on the date field to speed up the calls.
3. “/labScale/memo/database/createTableDB.py”
Python script for the creation of additional tables for storing measurements on time intervals higher than the “defined by the user” in ‘memoDB’.
The basic idea is to create a database with a pyramidal structure, so as to be able to quickly visualize the time course of the monitored parameters and in as much detail as possible. This is fundamental since the authors want to publish the progress of measurements (process monitoring) on web pages.
4. “/labScale/memo/serial/log.py”
Python class for managing the saving on text files of the measurements acquired by the sensor network at the defined by the user speed.
This class manages the opening and closing of files, as well as files rotation. This type of backup has a defined duration by default equal to 1 day but that can be changed as desired by setting the rotation interval. At each rotation interval, a file is created that contains the measurements acquired at the desired storage time interval (default = 1 s). With the name “current”, the file currently in writing is identified, whereas with the date expressed in the format “Y-M-D-h: m: s:” those files already concluded.
5. “/labScale/memo/serial/readFromSerial.py”
In this python script, the data sent by the Arduino are read from the serial line.
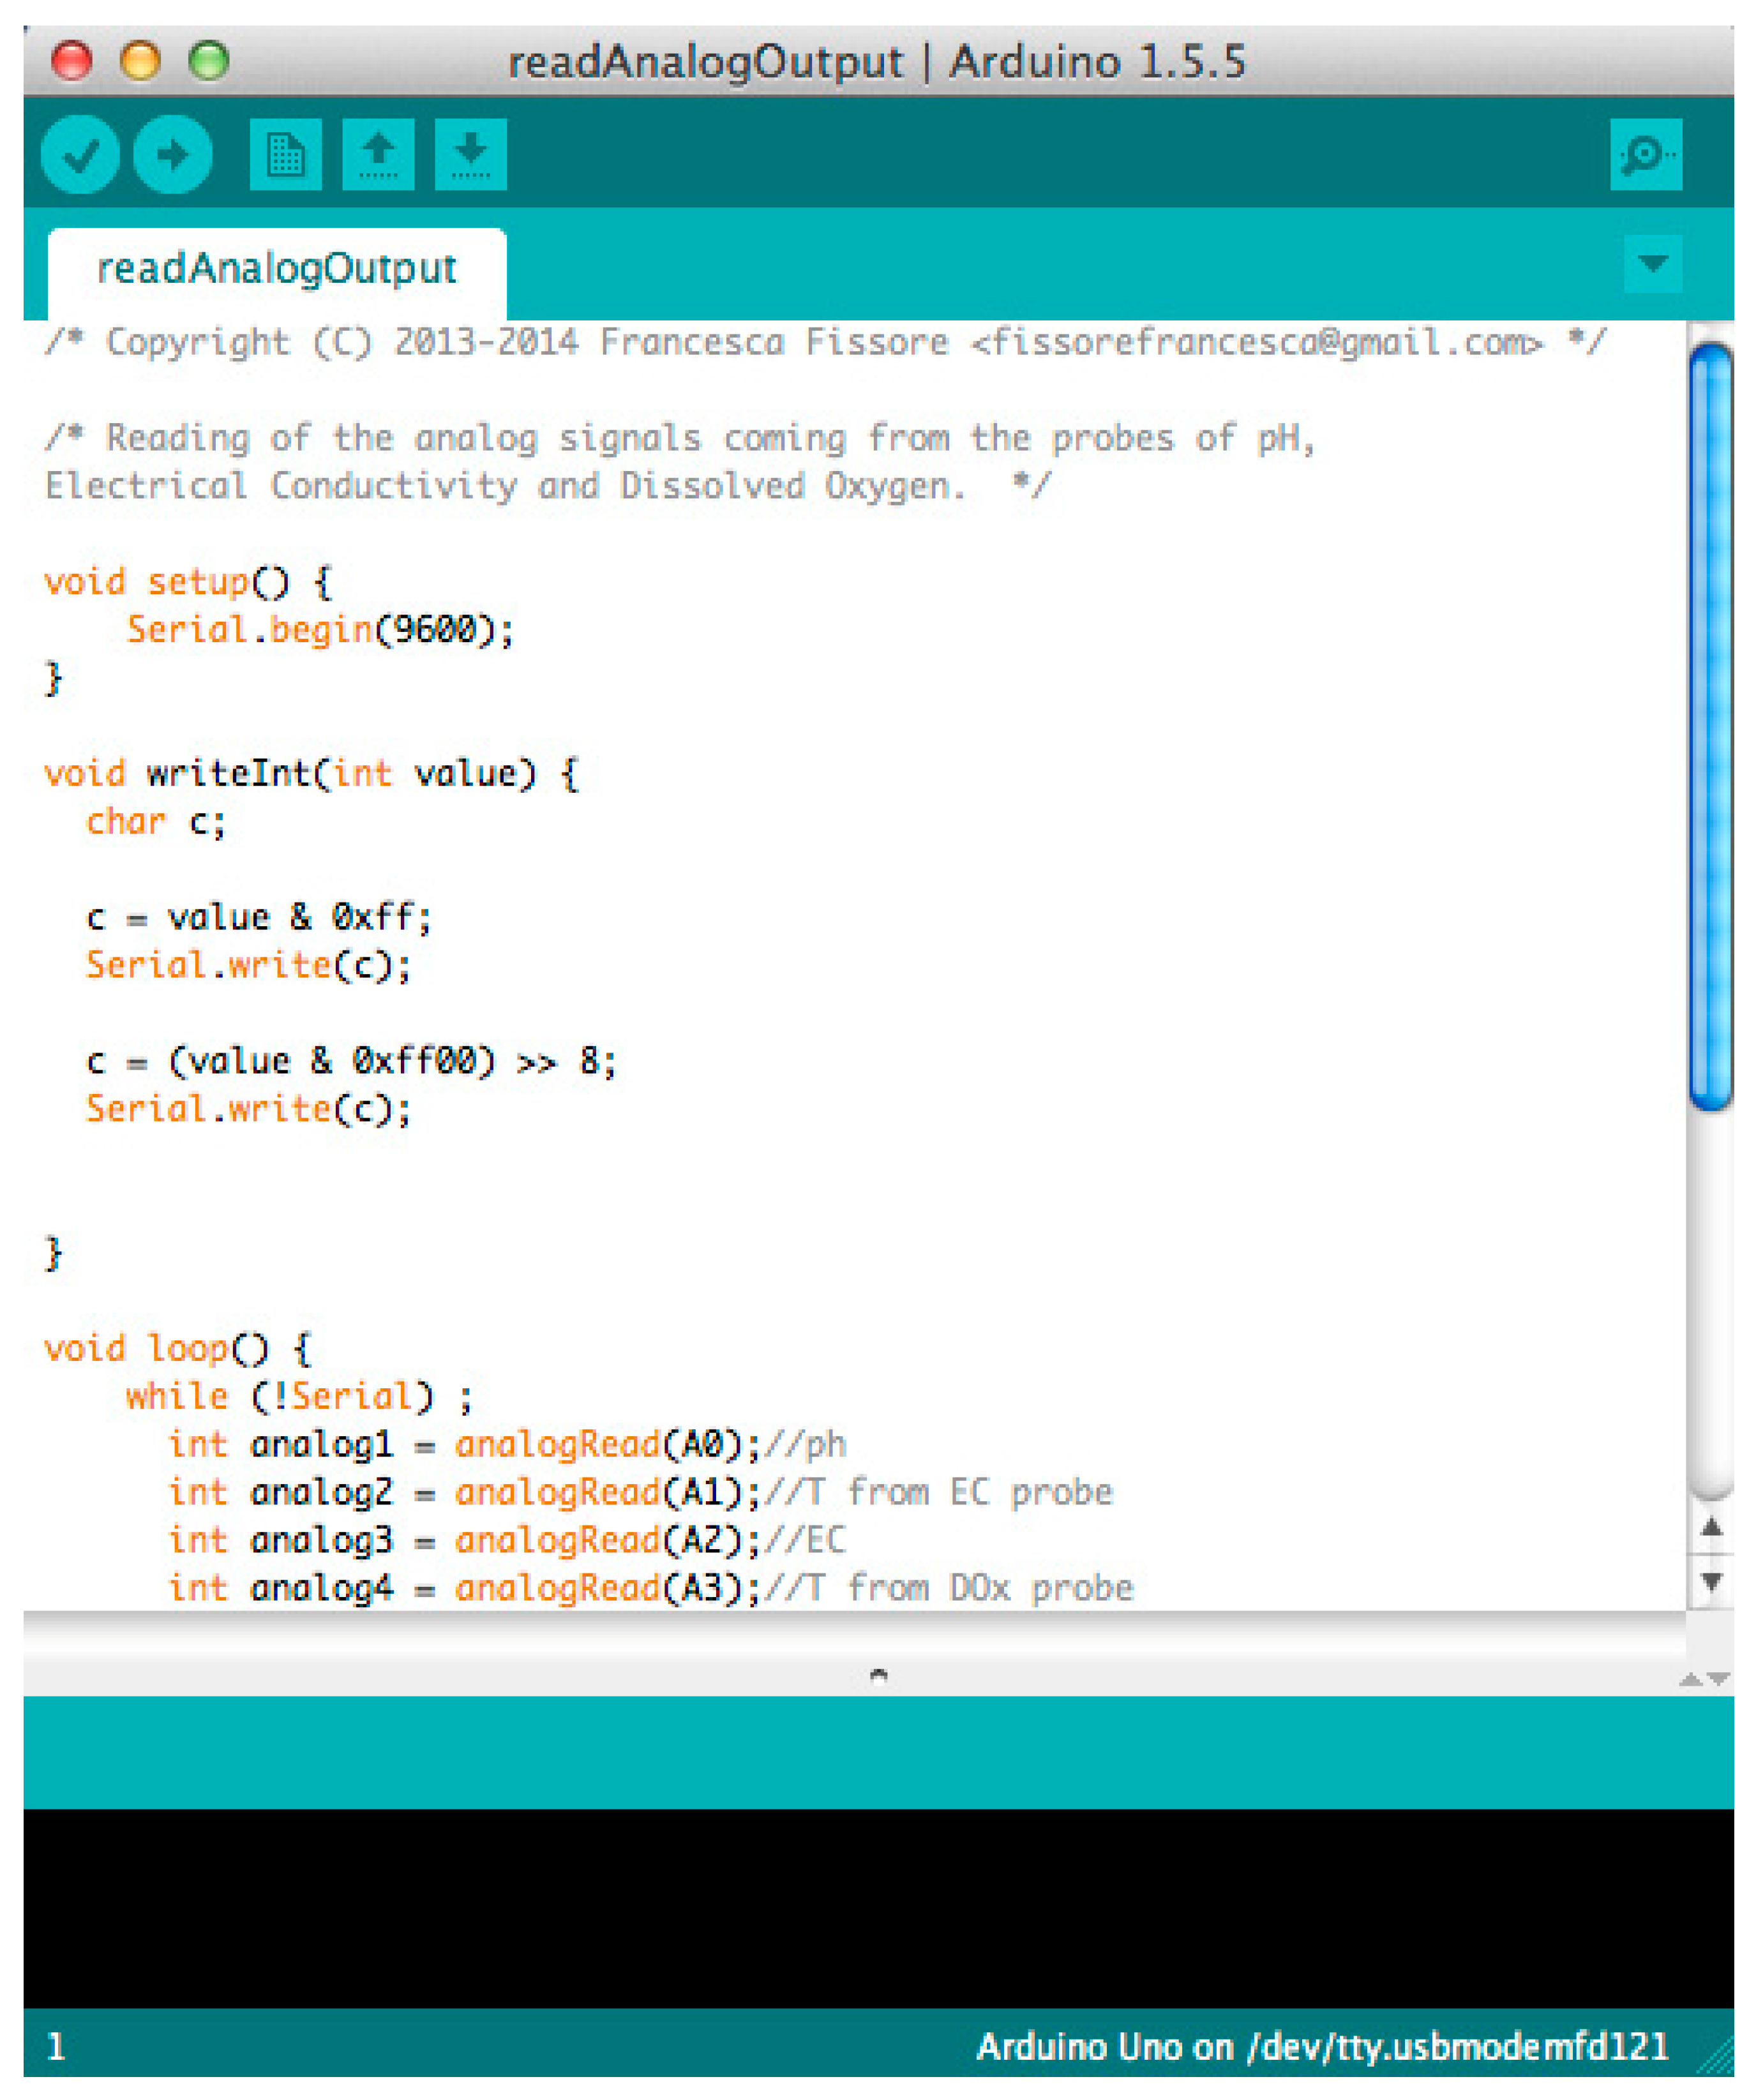
To do this it is essential to understand the serial on which packets are written and that the Arduino sends every 100 ms. The address of the serial should be provided by the Arduino IDE as shown in Figure A1:
Figure A1. Read analog output.
Jsan 08 00052 g0a1
This serial will be attributed to the ‘port’ variable in this script.
Once the bytes are read from the serial line, these are converted into real measures. Since the interval of acquisition of 100 ms is excessive for the analyzed case of food processing, the median of the data acquired by each sensor is estimates on a set of 10 data, so as to obtain a measurement per second for each of the process variables.
Finally, the data obtained at 1-s intervals are stored in the table ‘sec1′ of the memoDB database. Furthermore, the data obtained at the interval of 1 s are written in a text file following the format that was set in the ‘log.py’ module and with rotation chosen by the user (in this case 1 day).
6. “/labScale/memo/serial/demoReadFromSerial.py”
This python script was created with the aim of simulating data acquired by sens1, sens2, …, sensn, in order to test MEMO configuration and data management before starting real-time acquisition on the plant.
The actual measurements are generated from random numbers with a time interval of 1 s. These are subsequently stored in the table “sec1” of the memoDB database and written to text files with rotation set per minute.
7. “/labScale/memo/src”
All the files for the creation of the webserver (server.py) and the web tool are here contained. The web tool consists of static and non-static HTML pages found in the static and template folders.
In the static folder, there are also all the javascript programs (folder/static/js) that allow the real-time display of the process variables, and their related historical time series.
8. “labScale/memo/setup.py”
The source code used to create the MEMO package. By running it, all the python libraries are installed, which are essential for the correct operation of the MEMO application.
To install it, follow this procedure:
  • Create Virtual Environment
    In this way, the virtual environment is created and activated.
  • Install the MEMO application
    • From the console type:
      • pip install–e memo
    In this way, all the Python libraries that are needed for MEMO operation are installed.

References

  1. Ilyukhin, S.V.; Haley, T.A.; Singh, R.K. A survey of automation practices in the food industry. Food Control 2001, 12, 285–296. [Google Scholar] [CrossRef]
  2. Mahalik, N.P.; Yen, M. Extending fieldbus standards to food processing and packaging industry: A review. Comput. Stand. Interfaces 2009, 31, 586–598. [Google Scholar] [CrossRef]
  3. Mahalik, N.P. Processing and packaging automation systems: A review. Sens. Instrum. Food Qual. Saf. 2009, 3, 12–25. [Google Scholar] [CrossRef]
  4. Arjona, R.; Ollero, P.; Vidal, B.F. Automation of an olive waste industrial rotary dryer. J. Food Eng. 2005, 68, 239–247. [Google Scholar] [CrossRef]
  5. Muzzio, C.R.; Díaz, R.J.; Dini, N.G. In-line measurement of sunflower oil color in the Lovibond scale using a low-cost robust device. J. Food Eng. 2014, 120, 88–93. [Google Scholar] [CrossRef]
  6. Holmes, J.F.; Russell, G.; Allen, J.K. 6 - Supervisory Control and Data Acquisition (SCADA) and related systems for automated process control in the food industry: An introduction. In Robotics and Automation in the Food Industry; Caldwell, D.G., Ed.; Woodhead Publishing Series in Food Science, Technology and Nutrition; Woodhead Publishing: Cambridge, UK, 2013; pp. 130–142. ISBN 978-1-84569-801-0. [Google Scholar]
  7. Hosseinpour, S.; Ilkhchi, A.H.; Aghbashlo, M. An intelligent machine vision-based smartphone app for beef quality evaluation. J. Food Eng. 2019, 248, 9–22. [Google Scholar] [CrossRef]
  8. Cristani, M.; Demrozi, F.; Tomazzoli, C. ONTO-PLC: An ontology-driven methodology for converting PLC industrial plants to IoT. Procedia Comput. Sci. 2018, 126, 527–536. [Google Scholar] [CrossRef]
  9. Talavera, J.M.; Tobón, L.E.; Gómez, J.A.; Culman, M.A.; Aranda, J.M.; Parra, D.T.; Quiroz, L.A.; Hoyos, A.; Garreta, L.E. Review of IoT applications in agro-industrial and environmental fields. Comput. Electron. Agric. 2017, 142, 283–297. [Google Scholar] [CrossRef]
  10. Verdouw, C.; Sundmaeker, H.; Tekinerdogan, B.; Conzon, D.; Montanaro, T. Architecture framework of IoT-based food and farm systems: A multiple case study. Comput. Electron. Agric. 2019, 165, 104939. [Google Scholar] [CrossRef]
  11. García, L.; Parra, L.; Jimenez, J.M.; Lloret, J.; Lorenz, P. Practical Design of a WSN to Monitor the Crop and its Irrigation System. Netw. Protoc. Algorithms 2019, 10, 35–52. [Google Scholar] [CrossRef] [Green Version]
  12. Strozzi, F.; Zaldívar, J.M.; Kronberg, A.E.; Westerterp, K.R. On-Line runaway detection in batch reactors using chaos theory techniques. AIChE J. 1999, 45, 2429–2443. [Google Scholar] [CrossRef]
  13. Zbilut, J.P.; Zaldivar-Comenges, J.-M.; Strozzi, F. Recurrence quantification based Liapunov exponents for monitoring divergence in experimental data. Phys. Lett. A 2002, 297, 173–181. [Google Scholar] [CrossRef]
  14. Sjöberg, J.; Zhang, Q.; Ljung, L.; Benveniste, A.; Delyon, B.; Glorennec, P.-Y.; Hjalmarsson, H.; Juditsky, A. Nonlinear black-box modeling in system identification: A unified overview. Automatica 1995, 31, 1691–1724. [Google Scholar] [CrossRef]
  15. EU Commission Regulation EU Commission Regulation No 10/2011 of 14 January 2011 on Plastic Materials and Articles Intended to Come into Contact with Food Text with EEA Relevance. Available online: https://eur-lex.europa.eu/eli/reg/2011/10/oj (accessed on 6 January 2018).
  16. Zaldívar, J.M.; Cano, J.; Alós, M.A.; Sempere, J.; Nomen, R.; Lister, D.; Maschio, G.; Obertopp, T.; Gilles, E.D.; Bosch, J.; et al. A general criterion to define runaway limits in chemical reactors. J. Loss Prev. Process Ind. 2003, 16, 187–200. [Google Scholar] [CrossRef]
  17. Bosch, J.; Strozzi, F.; Lister, D.G.; Maschio, G.; Zaldívar, J.M. Sensitivity Analysis in Polymerization Reactions Using the Divergence Criterion. Process Saf. Environ. Prot. 2004, 82, 18–25. [Google Scholar] [CrossRef]
  18. Bosch, J.; Strozzi, F.; Zbilut, J.P.; Zaldívar, J.M. On-line runaway detection in isoperibolic batch and semibatch reactors using the divergence criterion. Comput. Chem. Eng. 2004, 28, 527–544. [Google Scholar] [CrossRef]
  19. Ratto, M.; Paladino, O. Controllability of start-ups in CSTRs under PI control. Chem. Eng. Sci. 2001, 56, 1477–1484. [Google Scholar] [CrossRef]
  20. Scikit-Learn: Machine Learning in Python—scikit-Learn 0.21.3 Documentation. Available online: https://scikit-learn.org/stable/ (accessed on 19 August 2019).
  21. mlpy–Machine Learning Python. Available online: http://mlpy.sourceforge.net/ (accessed on 19 August 2019).
  22. PyBrain. Available online: http://pybrain.org/ (accessed on 19 August 2019).
  23. Welcome to NeuroLab’s documentation!—NeuroLab 0.3.5 documentation. Available online: https://pythonhosted.org/neurolab/ (accessed on 19 August 2019).
  24. PyNeurGen. Available online: http://pyneurgen.sourceforge.net/ (accessed on 19 August 2019).
  25. Paladino, O.; Hodaifa, G.; Neviani, M.; Seyedsalehi, M.; Malvis, A. Chapter 11—Modeling in environmental interfaces. In Interface Science and Technology; Kyzas, G.Z., Mitropoulos, A.C., Eds.; Advanced Low-Cost Separation Techniques in Interface Science; Elsevier: Amsterdam, The Nertherland, 2019; Volume 30, pp. 241–282. [Google Scholar]
  26. Chen, S.-C.; Billings, S.A.; Luo, W. Orthogonal least squares methods and their application to non-linear system identification. Int. J. Control 1989, 50, 1873–1896. [Google Scholar] [CrossRef]
  27. Baner, A.; Brandsch, J.; Franz, R.; Piringer, O. The application of a predictive migration model for evaluating the compliance of plastic materials with European food regulations. Food Addit. Contam. 1996, 13, 587–601. [Google Scholar] [CrossRef]
  28. Begley, T.; Castle, L.; Feigenbaum, A.; Franz, R.; Hinrichs, K.; Lickly, T.; Mercea, P.; Milana, M.; O’Brien, A.; Rebre, S.; et al. Evaluation of migration models that might be used in support of regulations for food-contact plastics. Food Addit. Contam. 2005, 22, 73–90. [Google Scholar] [CrossRef] [Green Version]
  29. Chung, D.; Papadakis, S.E.; Yam, K.L. Simple models for assessing migration from food-packaging films. Food Addit. Contam. 2002, 19, 611–617. [Google Scholar] [CrossRef] [PubMed]
  30. Poças, M.F.; Oliveira, J.C.; Brandsch, R.; Hogg, T. Analysis of Mathematical Models to Describe the Migration of Additives from Packaging Plastics to Foods. J. Food Process Eng. 2012, 35, 657–676. [Google Scholar] [CrossRef]
  31. Poças, M.F.; Oliveira, J.C.; Oliveira, F.A.R.; Hogg, T. A Critical Survey of Predictive Mathematical Models for Migration from Packaging. Crit. Rev. Food Sci. Nutr. 2008, 48, 913–928. [Google Scholar] [CrossRef] [PubMed]
  32. Moresi, M.; Masi, P.; Massini, R. Industria Alimentare Italiana: Quali Prospettive di Ricerca e Sviluppo? Società Italiana di Scienze e Tecnologie Alimentari (SISTAL) c/o Dipartimento di Scienze e Tecnologie Agroalimentari (DISTA), Università degli Studi della Tuscia: Viterbo, Italy, 2008; pp. 1–30. [Google Scholar]
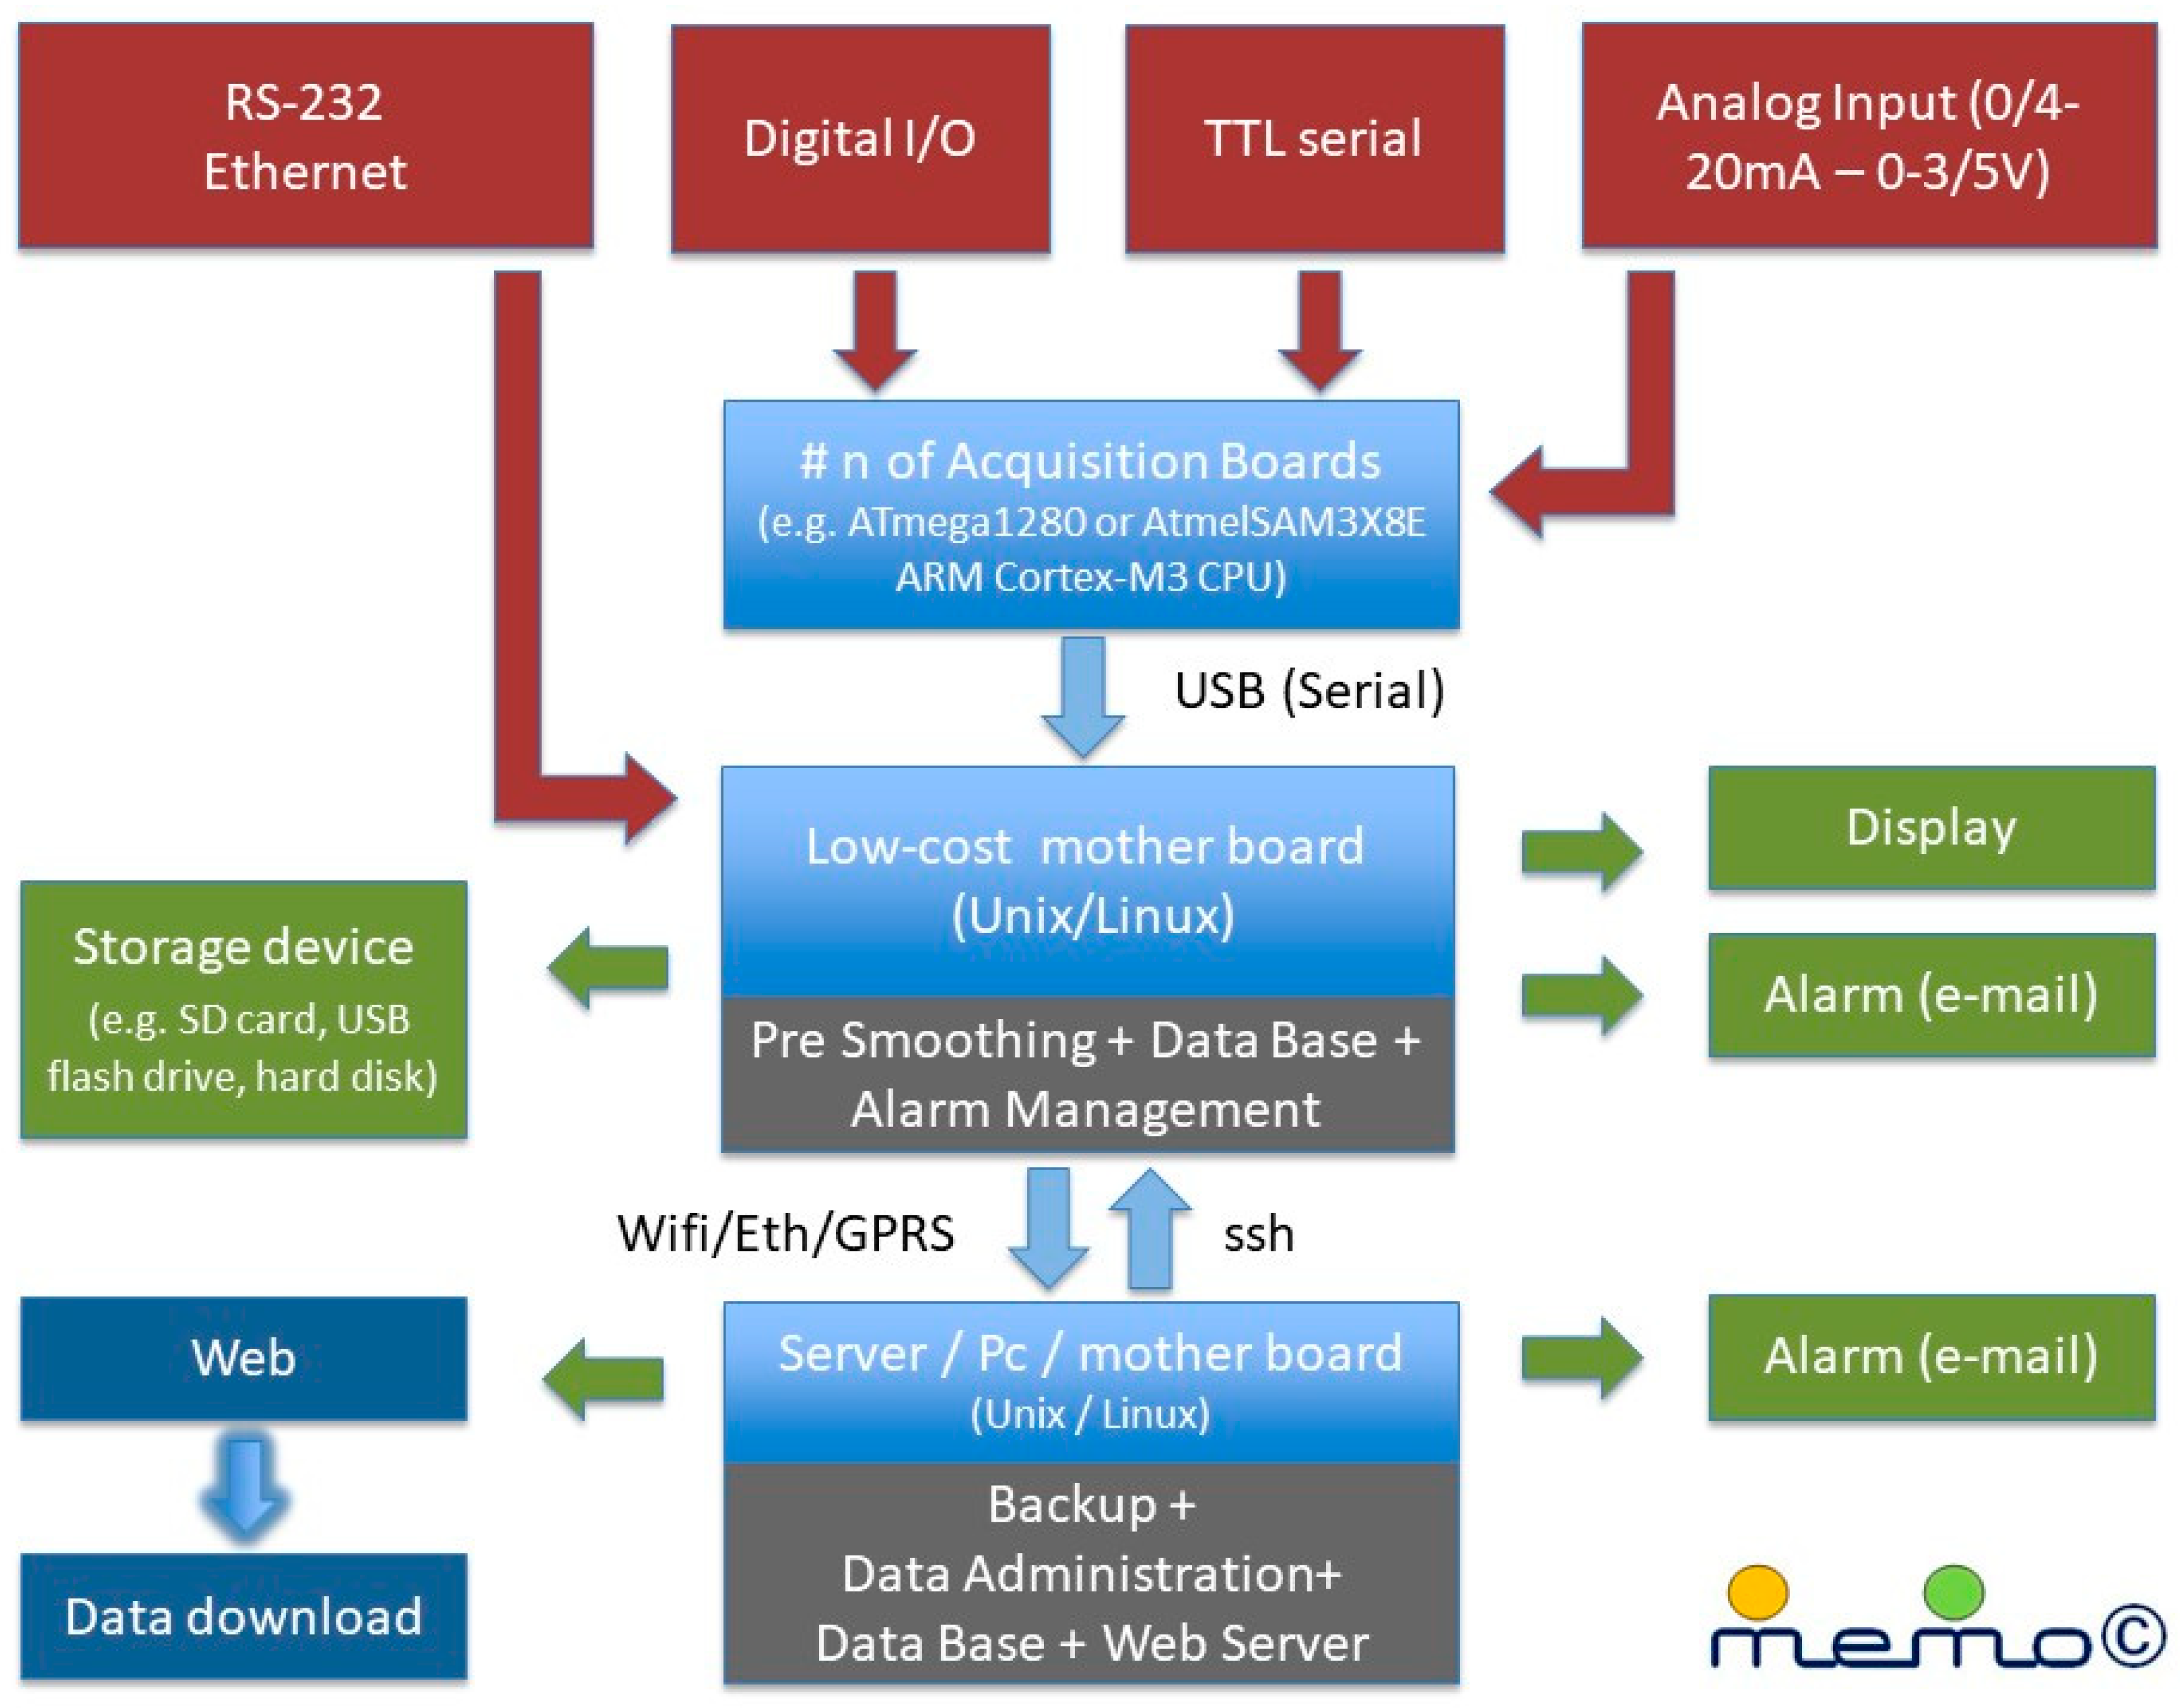
Figure 1. MEMO general architecture.
Jsan 08 00052 g001
Figure 2. MEMO micro- supervisory control and data acquisition (SCADA).
Jsan 08 00052 g002
Figure 3. MEMO home page—microalgae cultivation in semi-continuous stirred tank reactors (CSTRs) at a pilot-scale.
Jsan 08 00052 g003
Figure 4. An example of real-time visualization.
Jsan 08 00052 g004
Figure 5. An example of historical time series visualization.
Jsan 08 00052 g005
Figure 6. Migration of isopropylthioxanthone through polyethylene (PE) packaging–isoconcentration profiles in milk with 2D model.
Jsan 08 00052 g006
Figure 7. Migration of isopropylthioxanthone through PE packaging–isoconcentration profiles in milk with 3D model.
Jsan 08 00052 g007
Figure 8. Potential markets by type.
Jsan 08 00052 g008
Table 1. Scheme of MEMO-HQ test at different scales for a biological process.
Test123
Plant scaleLab-scalePilot-scalePilot-scale
OperationSemi-continuousQuasi-continuousContinuous
ReactorsStirred tanksAirliftsTubular
Duration3 months3 months1 month
Measured VariablesT1, T2, pH, C, DOx (single probes inside the reactor); concentration (by UV-VIS)T1, T2, pH, C, DOx (single probes inserted into the bottom collector); concentration (by UV-VIS)T, pH/ORP, C, DOx, turbidity, chlorophyll, nitrates and ammonia (multi-parametric inserted probe into the recirculating tank)
Acquisition Interval100 ms100 ms1 s
Data pre-TreatmentMedian each 10 values + mean each 60 values (by MEMO)Median each 10 values + mean each 60 values (by MEMO)Median each 10 values + mean each 6 values (by MEMO)
Controlled VariablespH, DOx, microalgae concentrationpH, DOx, microalgae concentration, pressure (without MEMO)pH, DOx, chlorophyll, nitrates, ammonia
Manipulated VariablesFeeding intervals;
Feeding flowrate 1 (liquid medium with nutrients);
Feeding flowrate 2 (air + CO2);
Brought to volume
Feeding intervals;
Feeding flowrate 1 (wastewater);
Feeding flowrate 2 (air + CO2);
Extracting intervals (extr. flowrate is fixed);
Acid flowrate
Extracting flowrate (water + microalgae);
Nutrients flowrate;
Acid flowrate;
(feeding flowrate is kept fixed since in exit from a WW treatment plant)
Manipulated PumpsGilson Minipuls 3Welko WP1100Welko WP1100;
Industrial pneumatic
(not manipulated by MEMO).
Probes/SensorsAtlas scientificB&C Electronics 7685YSI 6600/6920 V2
ActuatorsArduino 1 +self-constructed (0–5 V)Arduino + dedicated shield (0–5 V and 0–20 mA)Arduino + dedicated shield (0–20 mA)
Mean Cost of Probes/Sensors + Actuators500 euros5000 euros25,000 euros