


Intrusion Detection System Using Feature Extraction with Machine Learning Algorithms in IoT


Abstract
1. Introduction
- Devices are probably the principal mechanism from which attacks could be launched, such as memory, firmware, physical interface, web interface, or network services. In addition, weak settings, out-of-date components, and insufficient update procedures are critical parts of any device attackers could utilize.
- Communication channels could also be points of attack in IoT systems. Usually, protocols contain security failings that impact the whole system, such as denial of service (DoS) attacks and spoofing.
- Applications and software, generally, could be hacked due to a shortcoming in web applications or software systems. This approach is usually utilized to steal user passwords or spread malware files or programs.
Significance of the Study and Contributions
- 1-
- A comprehensive review of literature on the applications of machine learning and deep learning models in intrusion detection using numerical and image-based datasets.
- 2-
- Dataset preprocessing and balancing with SMOTE technique.
- 3-
- Feature extraction using various approaches with stacked machine learning models such as kNN, sequential minimal optimization (SMO), and random forest to distinguish between malicious and normal network traffic patterns.
- 4-
- Experiment for the validation of the proposed models.
2. Related Work
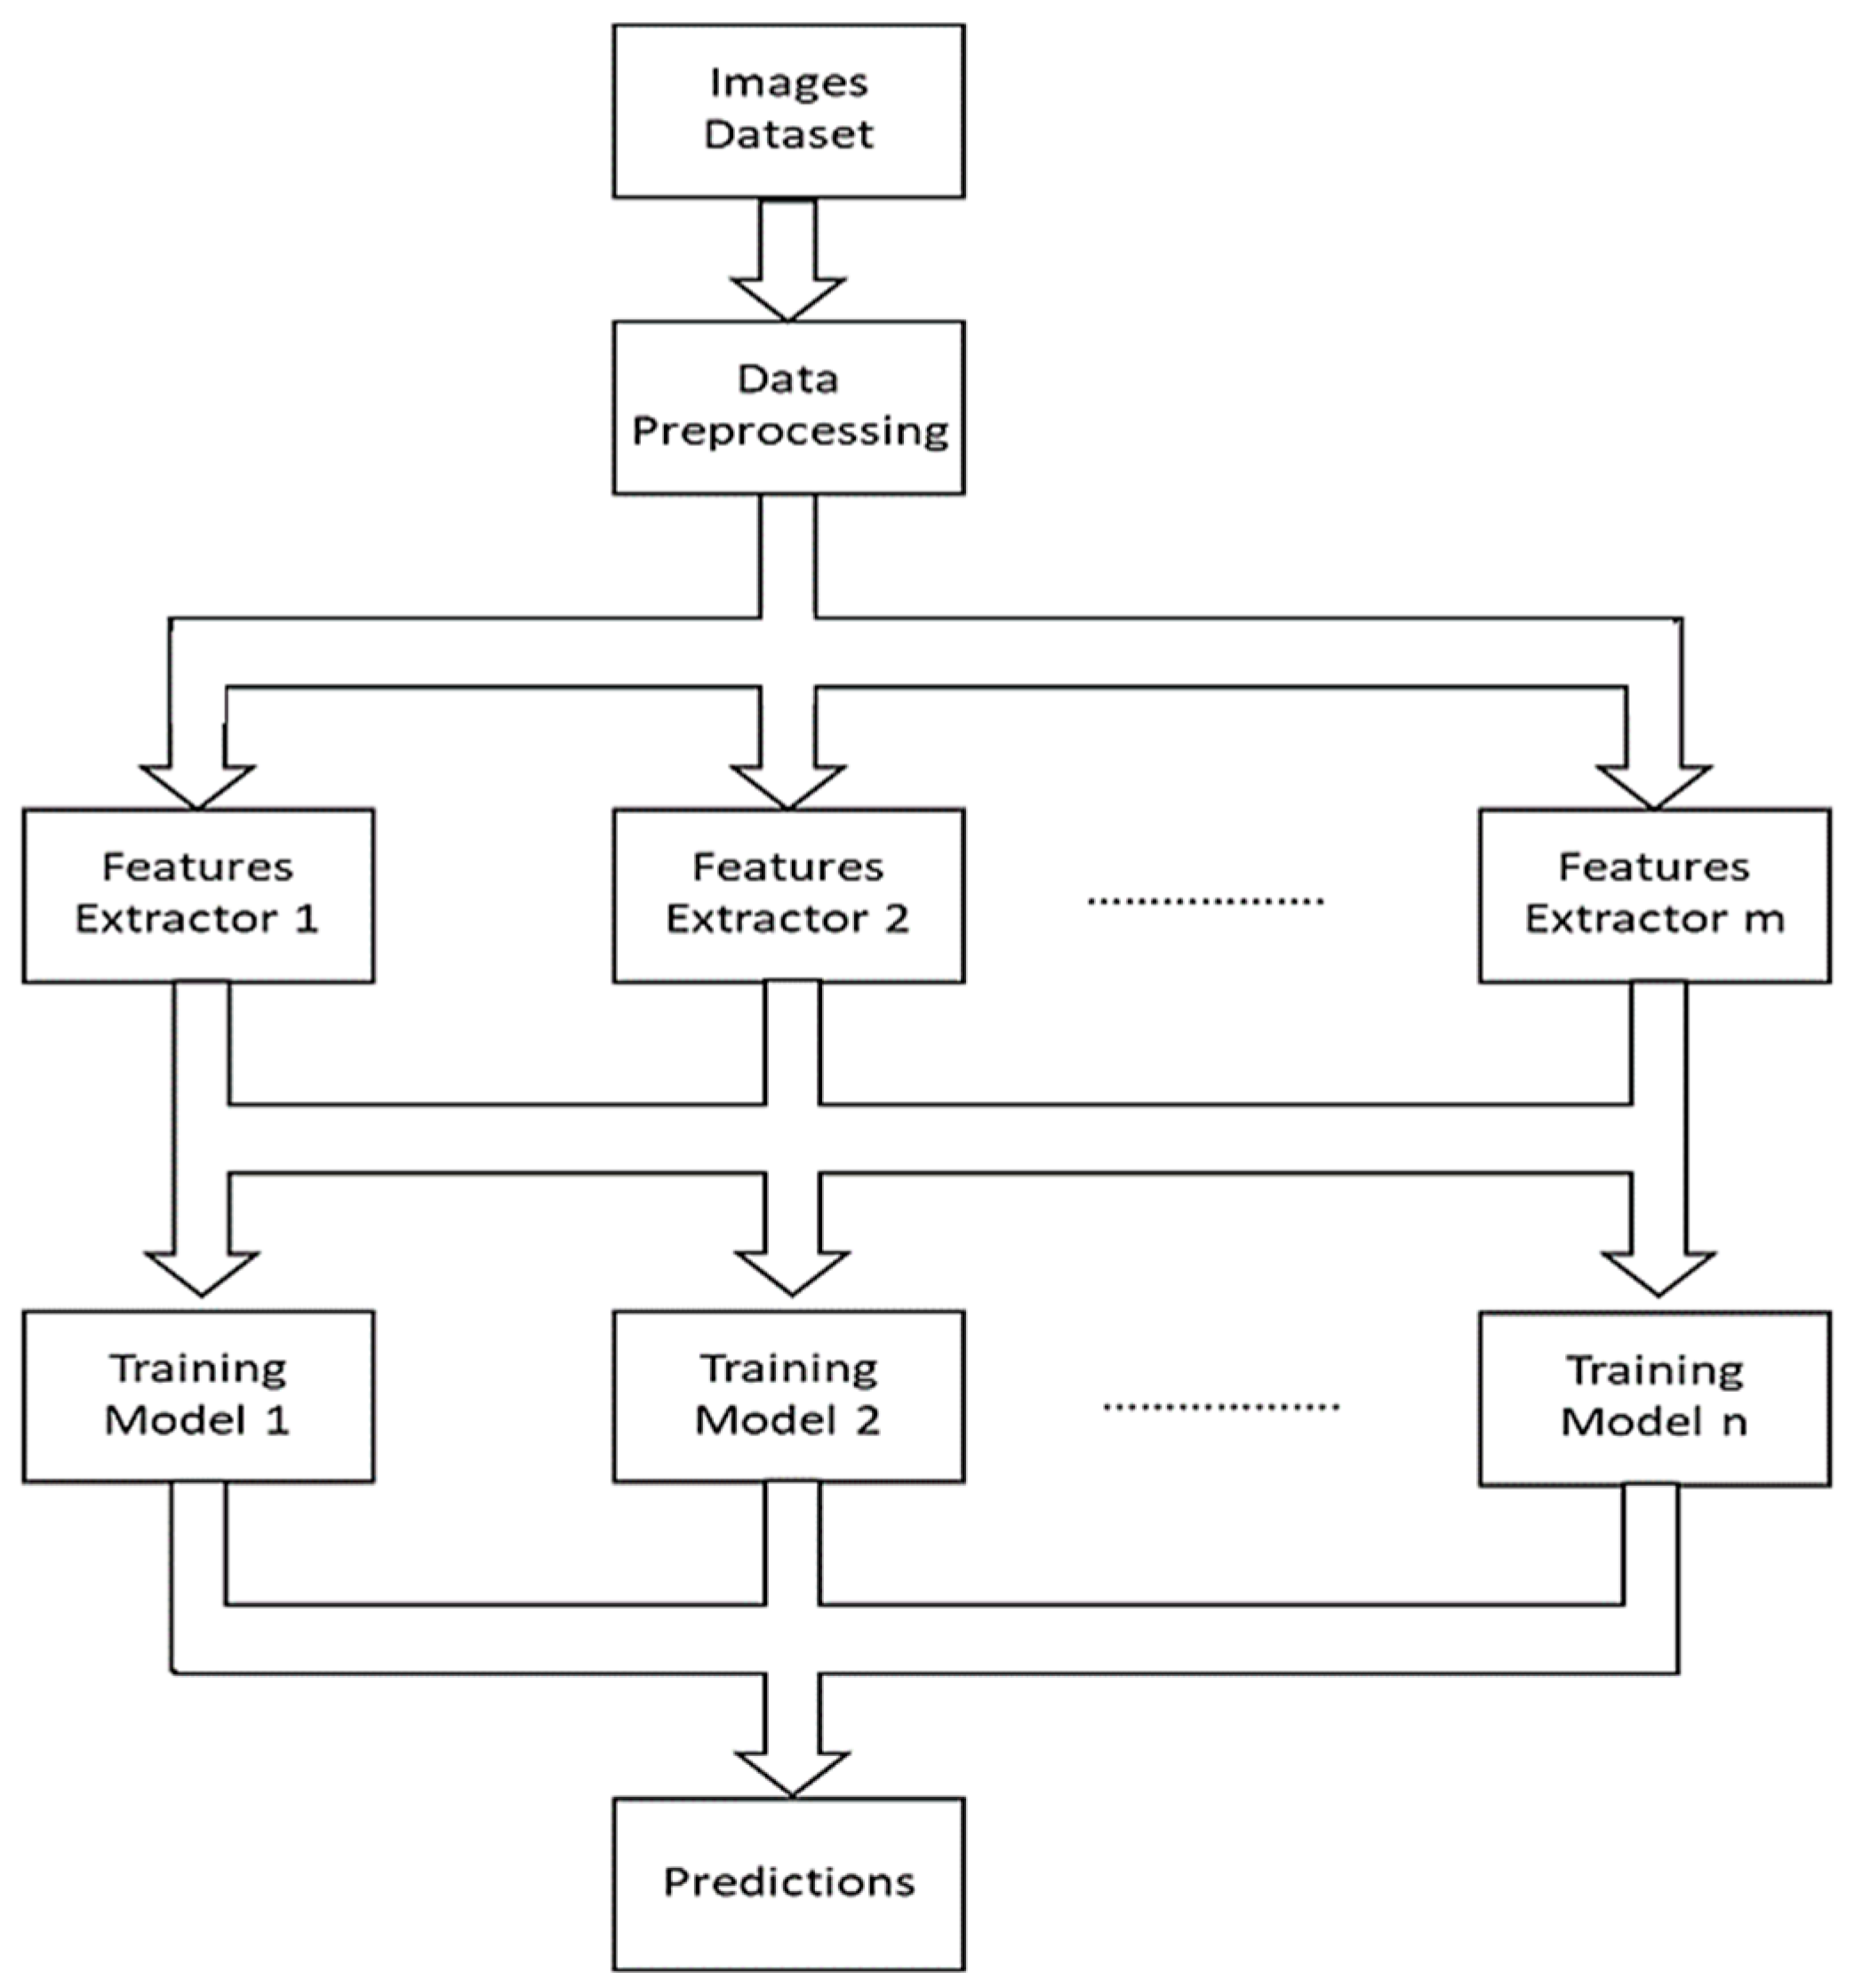
3. Methodology
3.1. Dataset Description
3.2. Data Preprocessing
3.2.1. Synthetic Minority Oversampling Technique Filter
- For each sample, find the k-nearest neighbors.
- Then, select a random sample from the k-nearest neighbor.
- Then define the new samples as original samples plus the difference between the nearest neighbor multiplied by a random number between 0 and 1 (new sample = original samples + difference × random (0–1)).
- Add the newly generated samples to the minority.
3.2.2. Feature Extraction
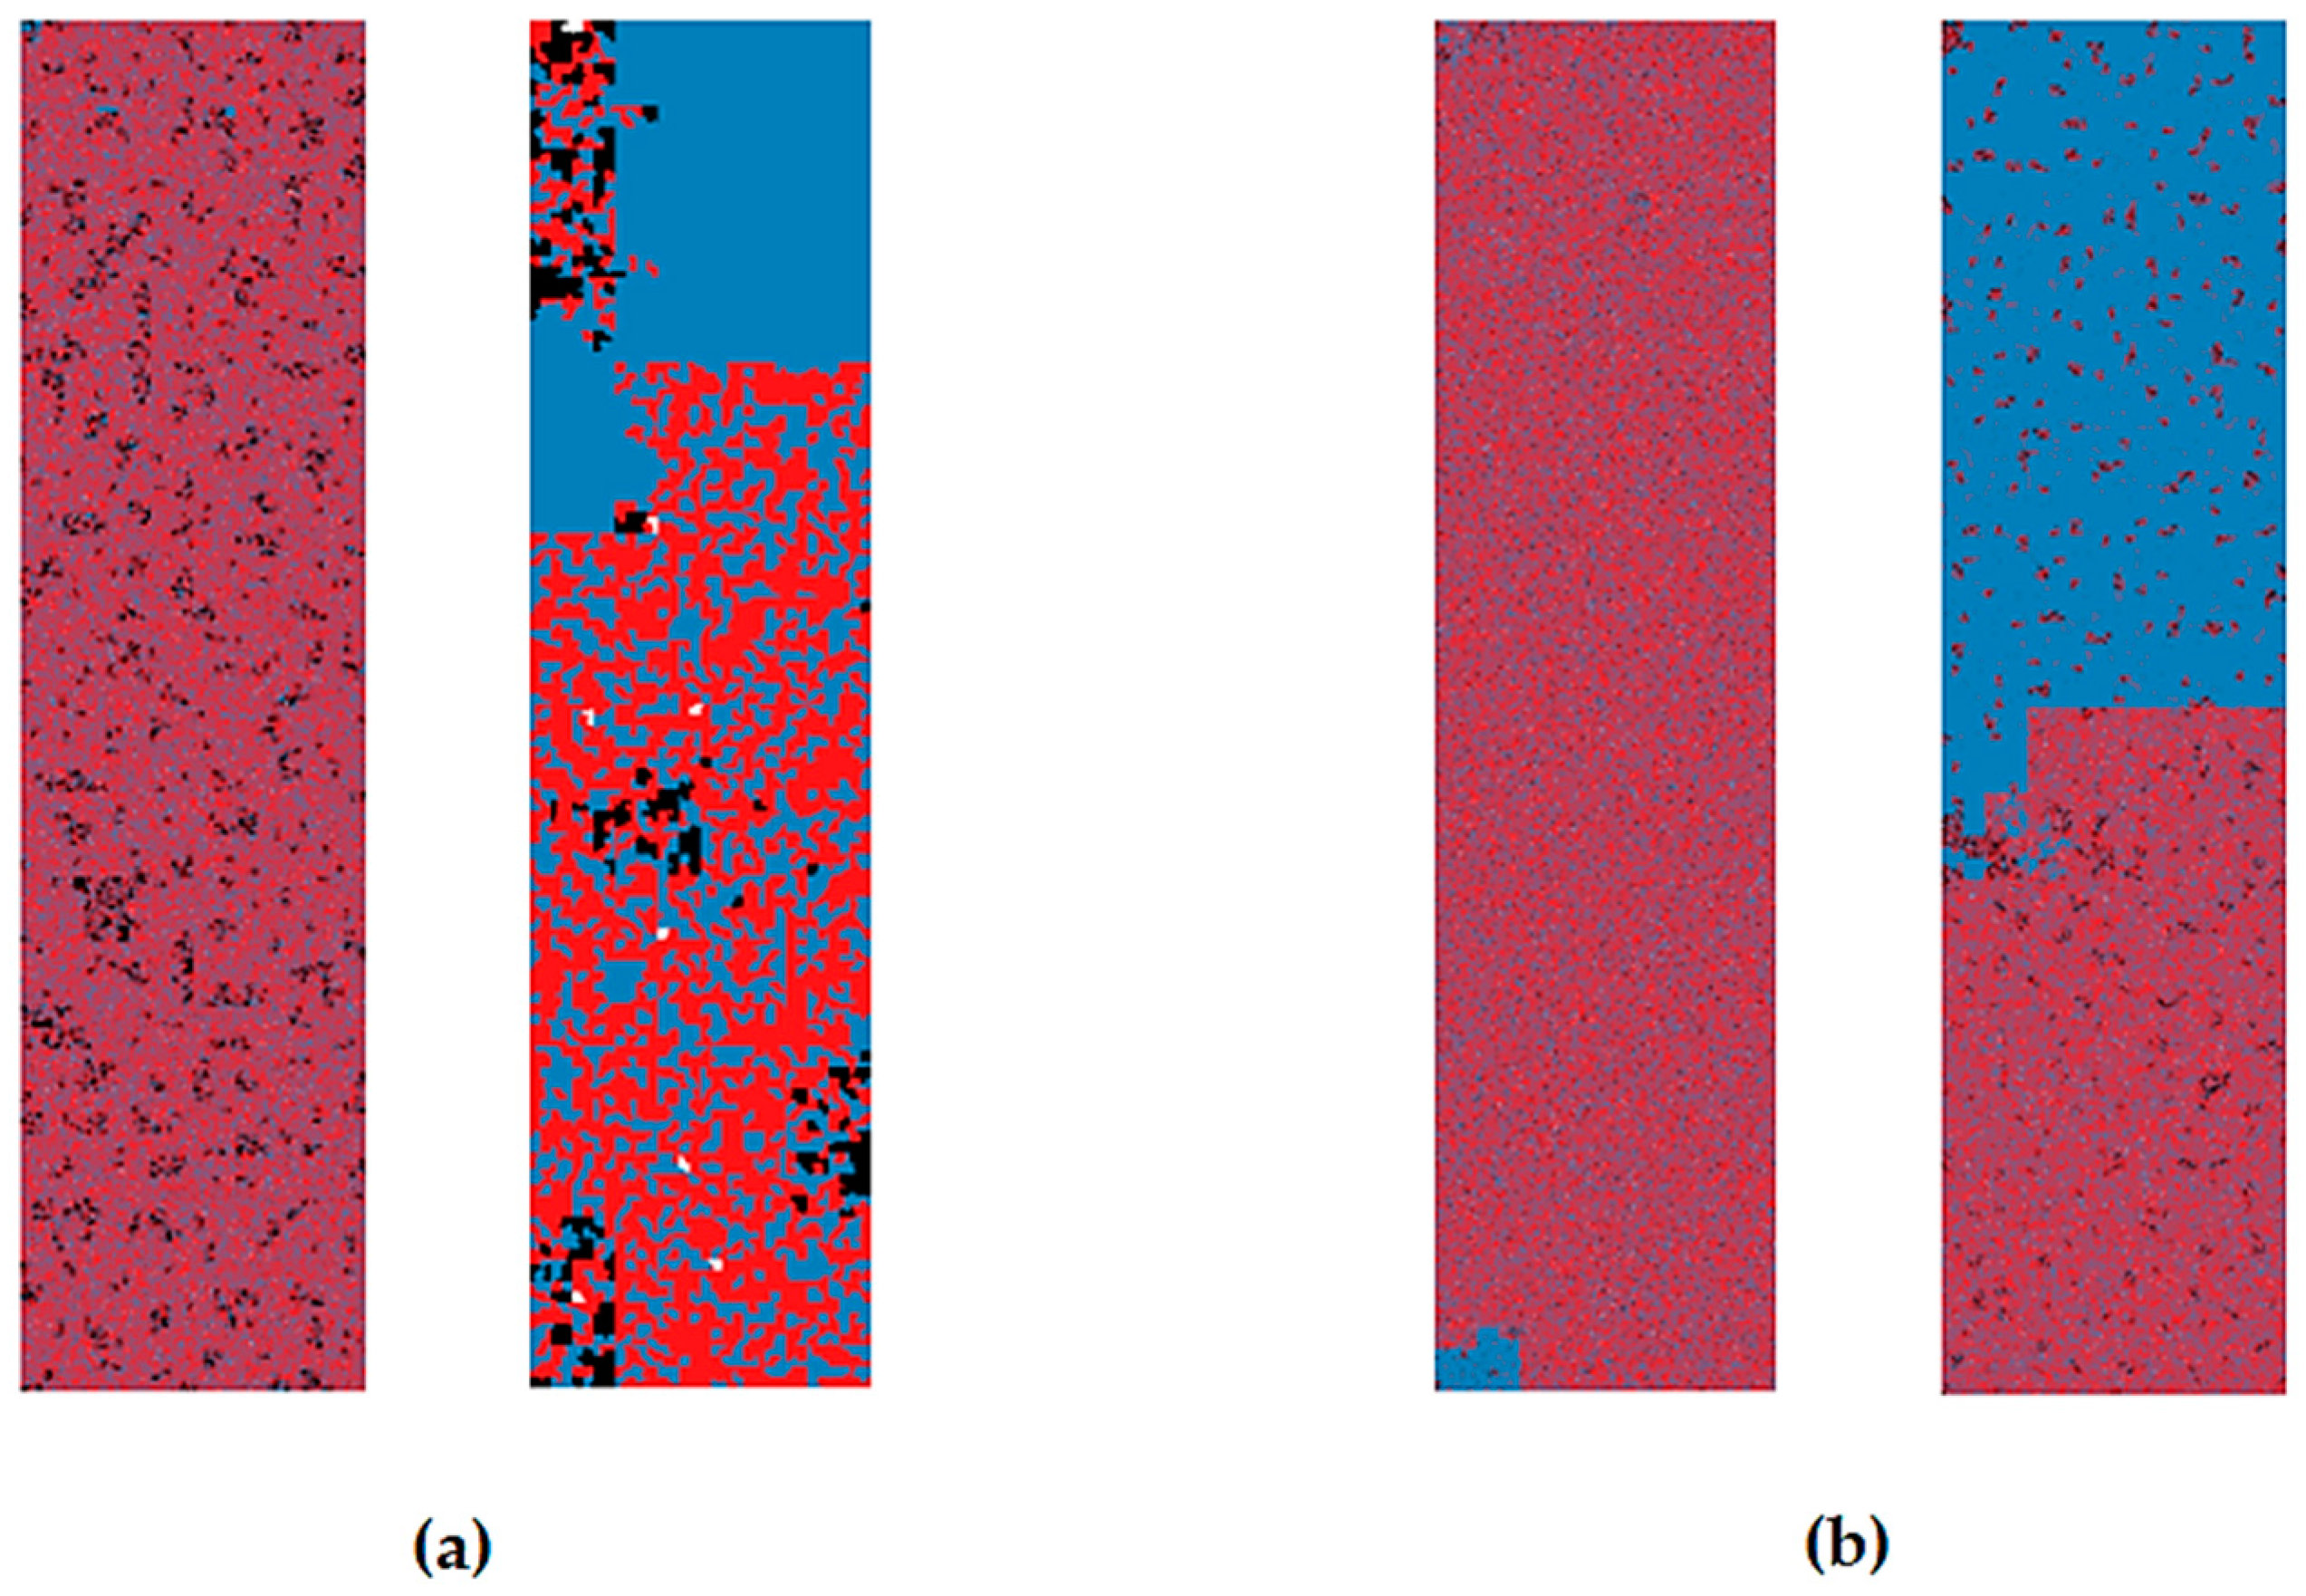
3.2.3. Image Filter
4. Experimental Results
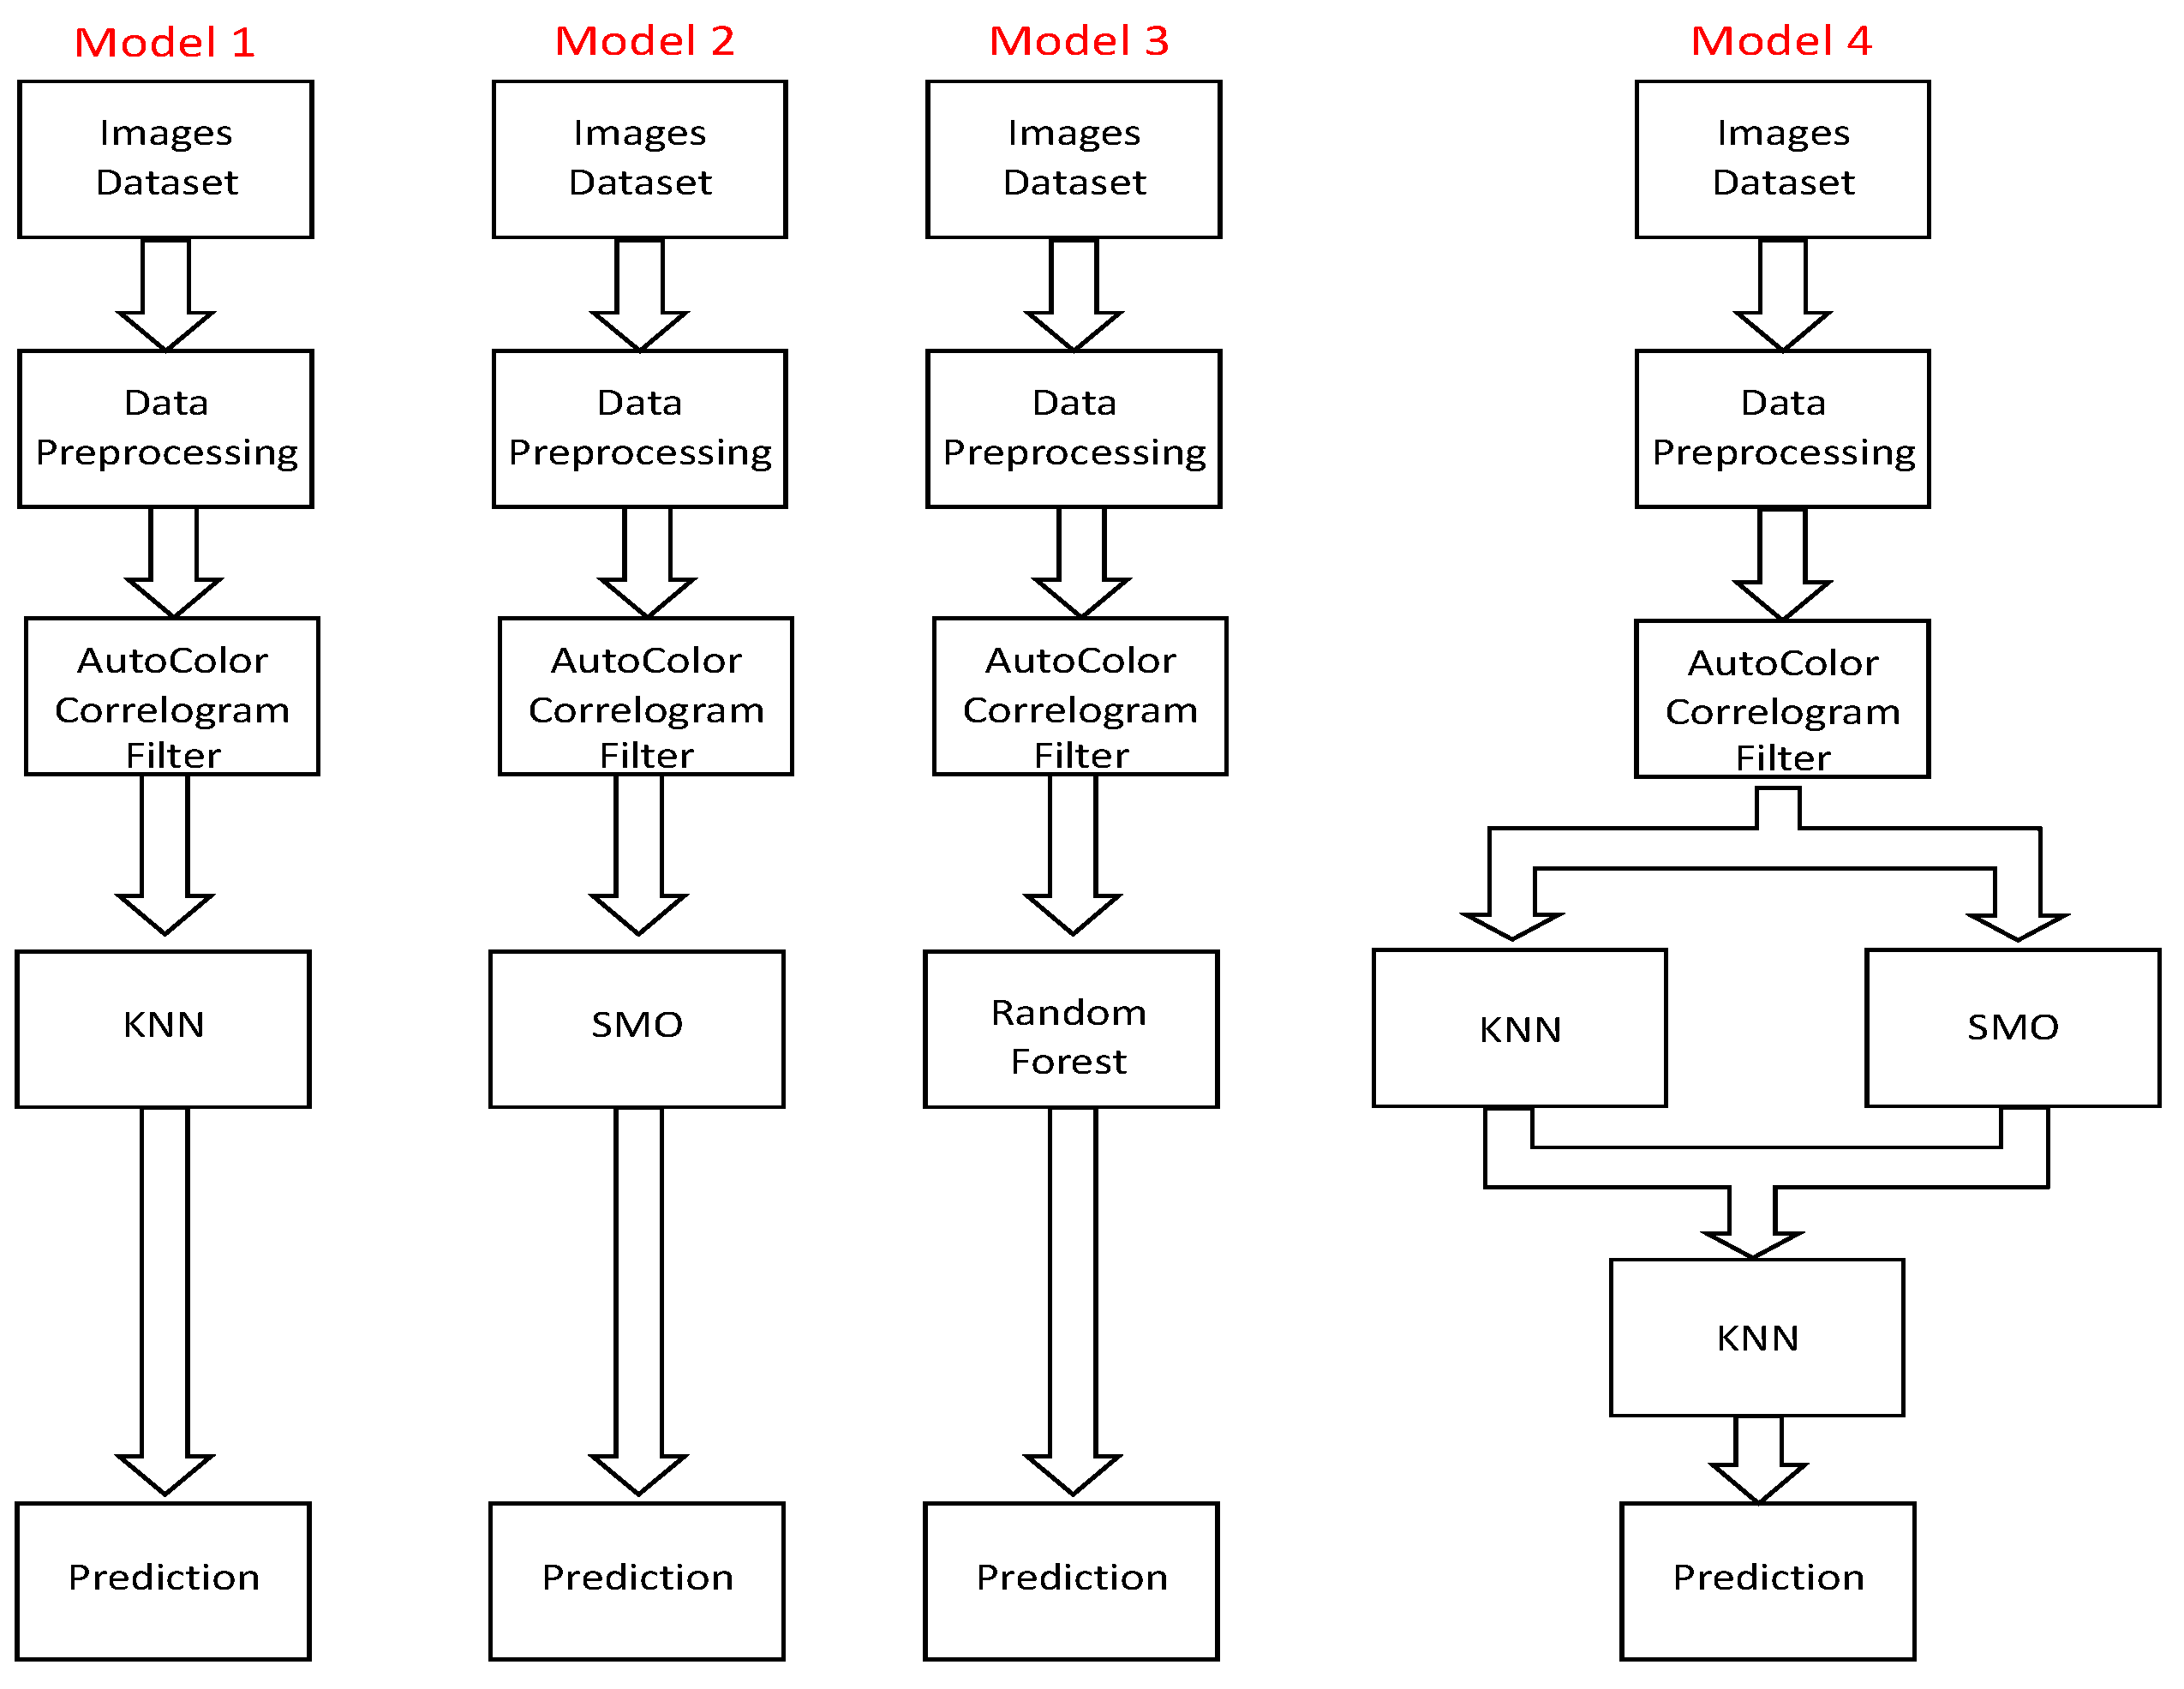
4.1. Auto-Color Correlogram Filters
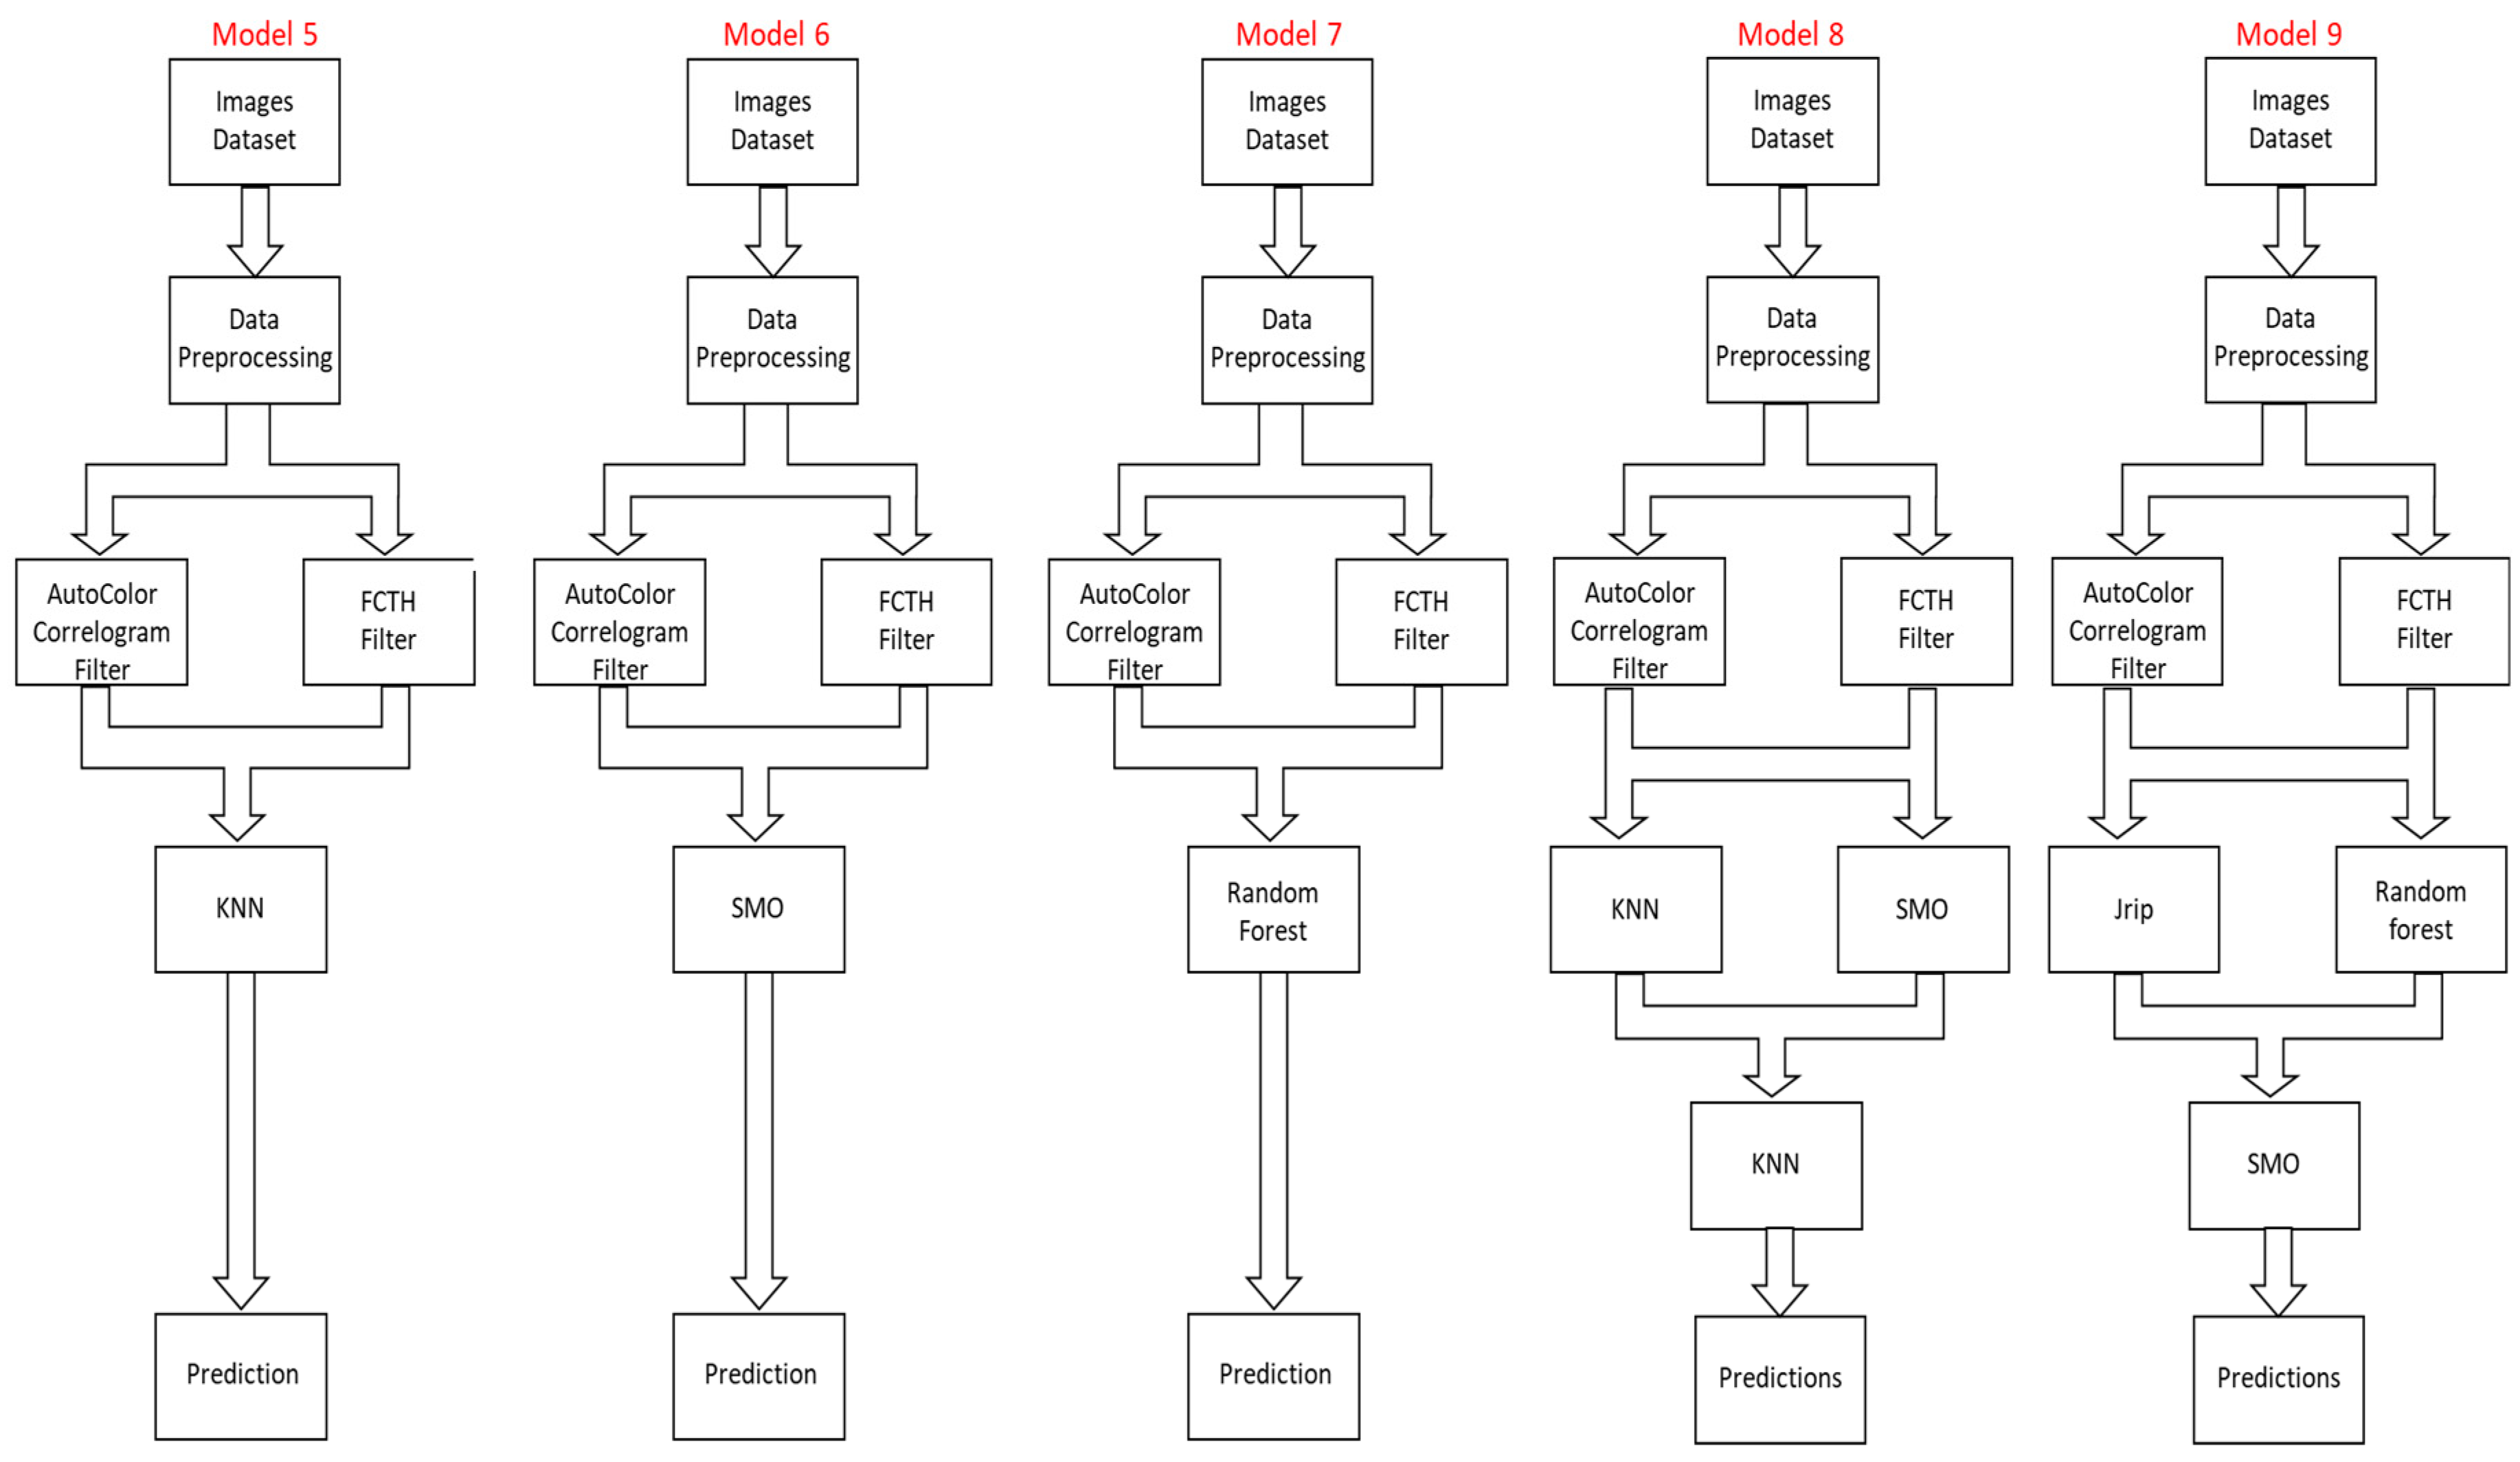
4.2. Auto-Color Correlogram and FcTH Filters
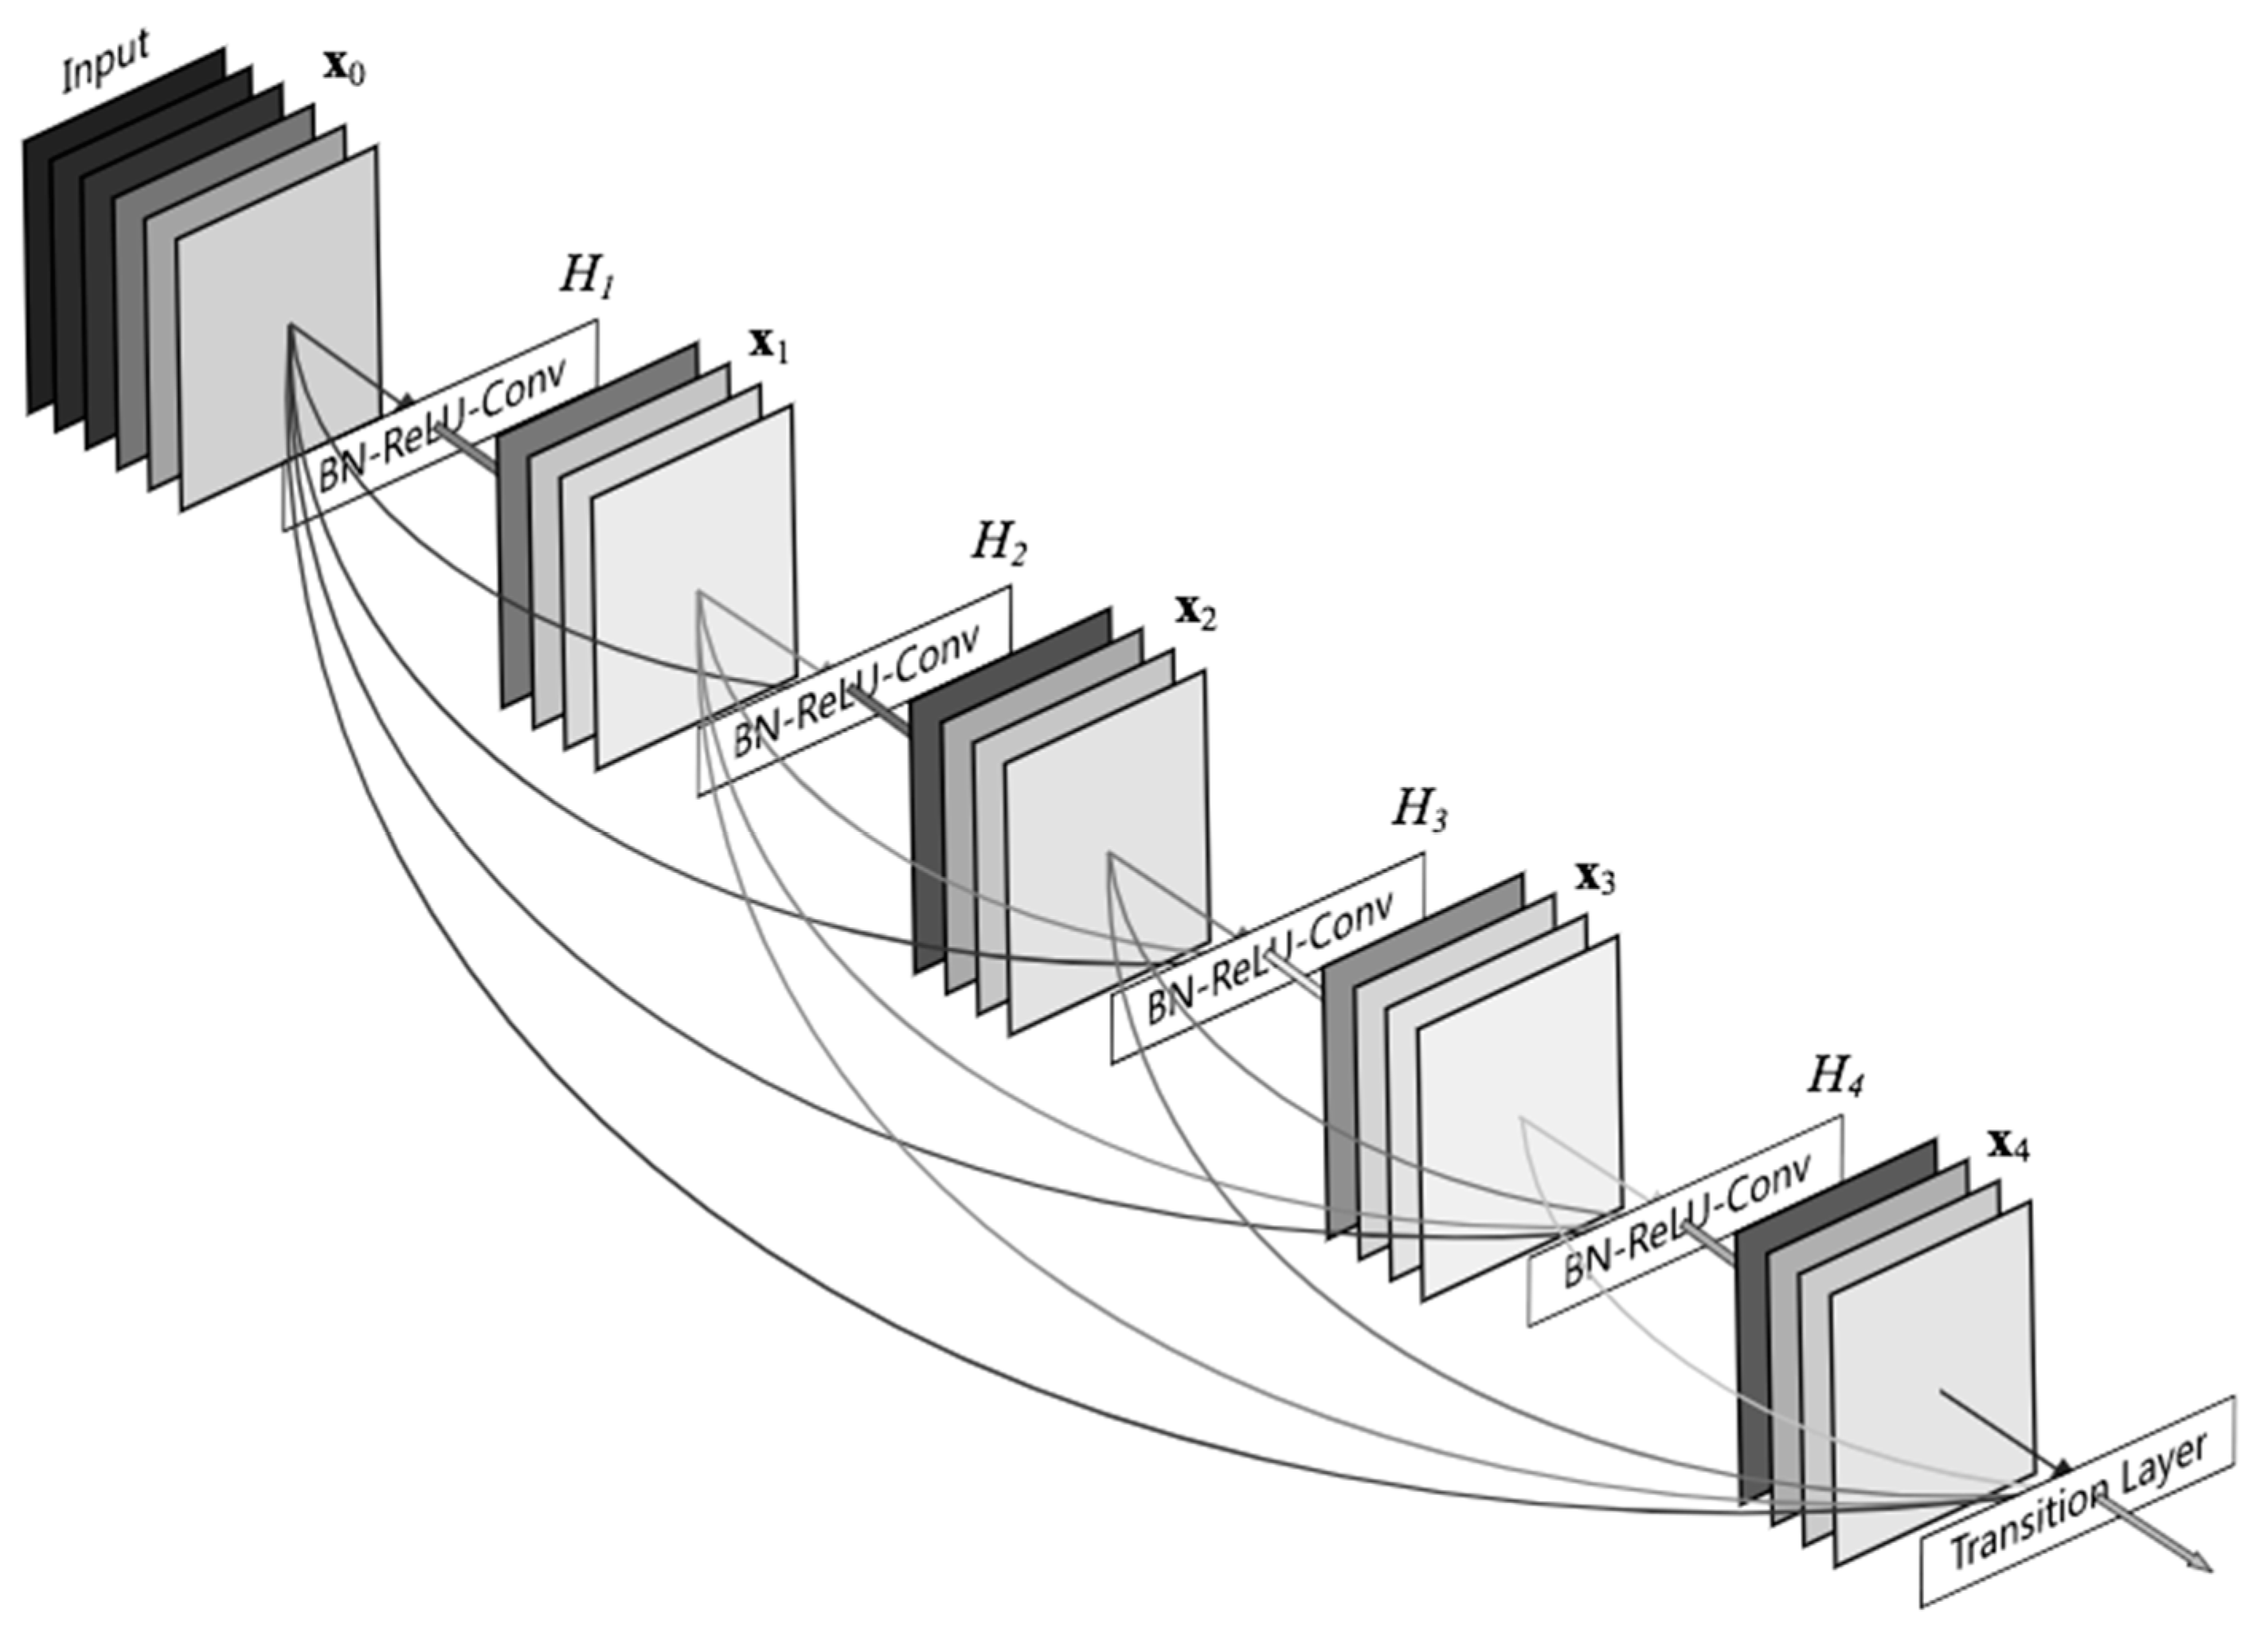
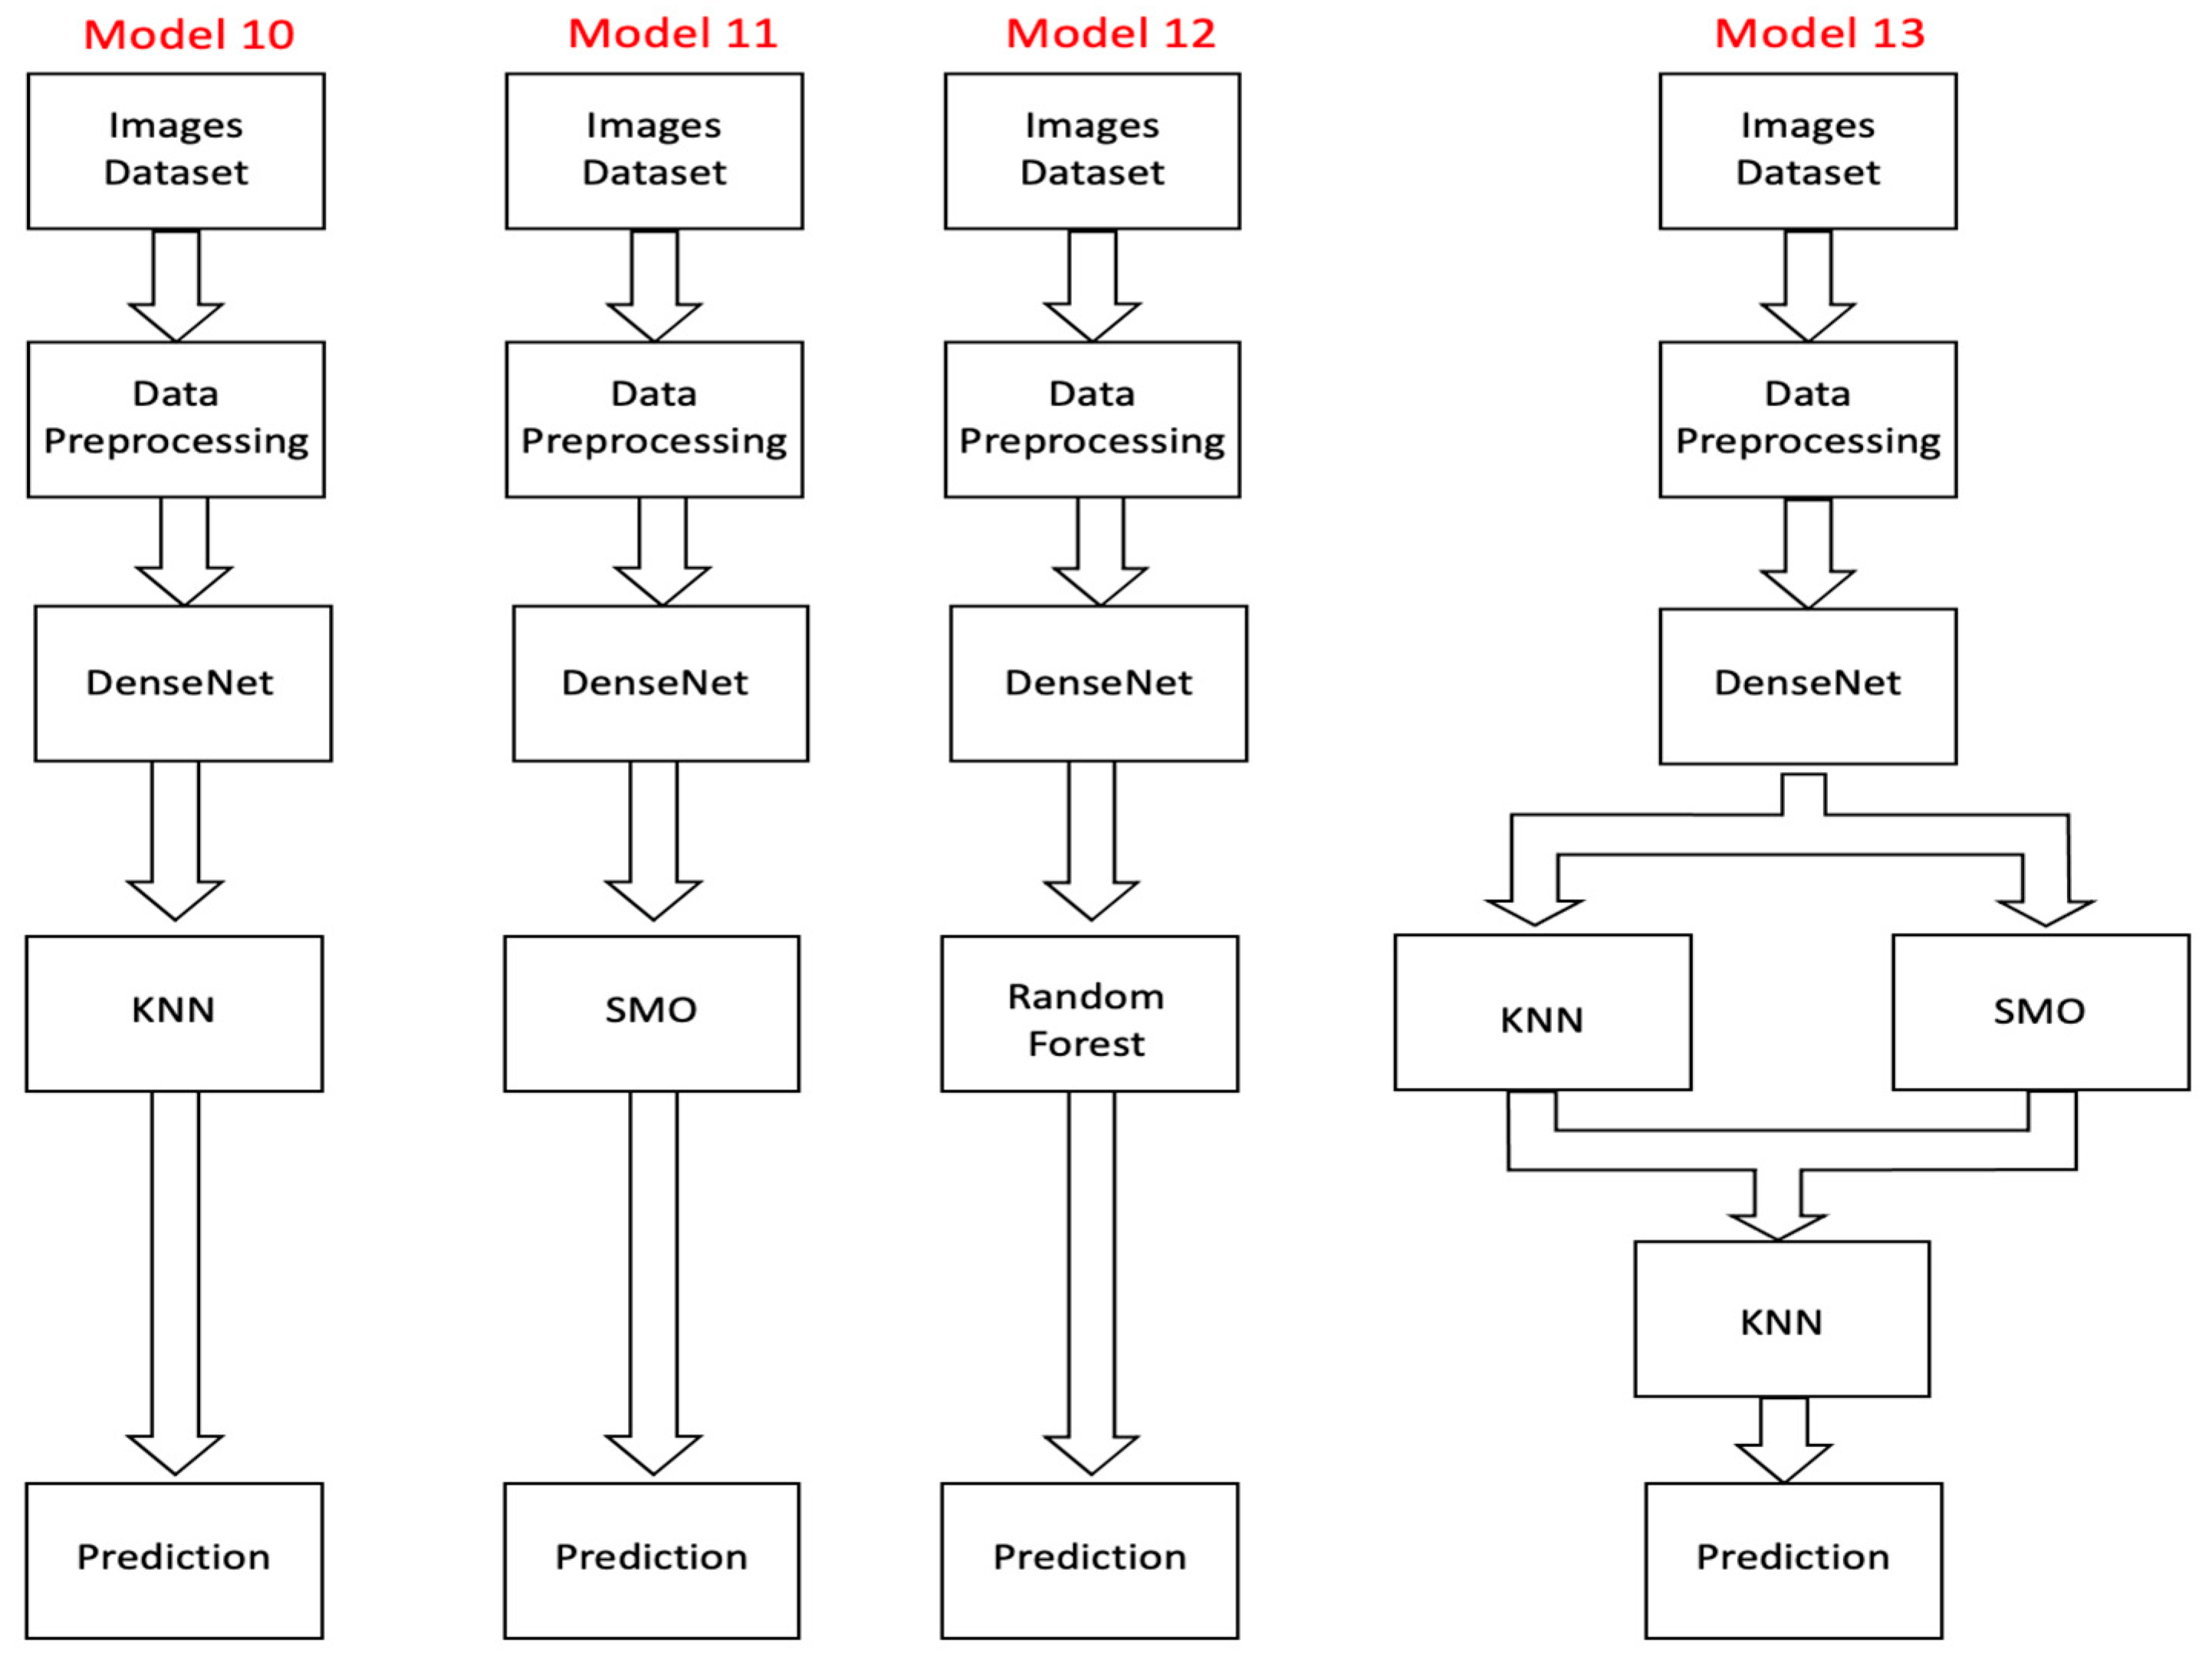
4.3. DenseNet Transfer Model
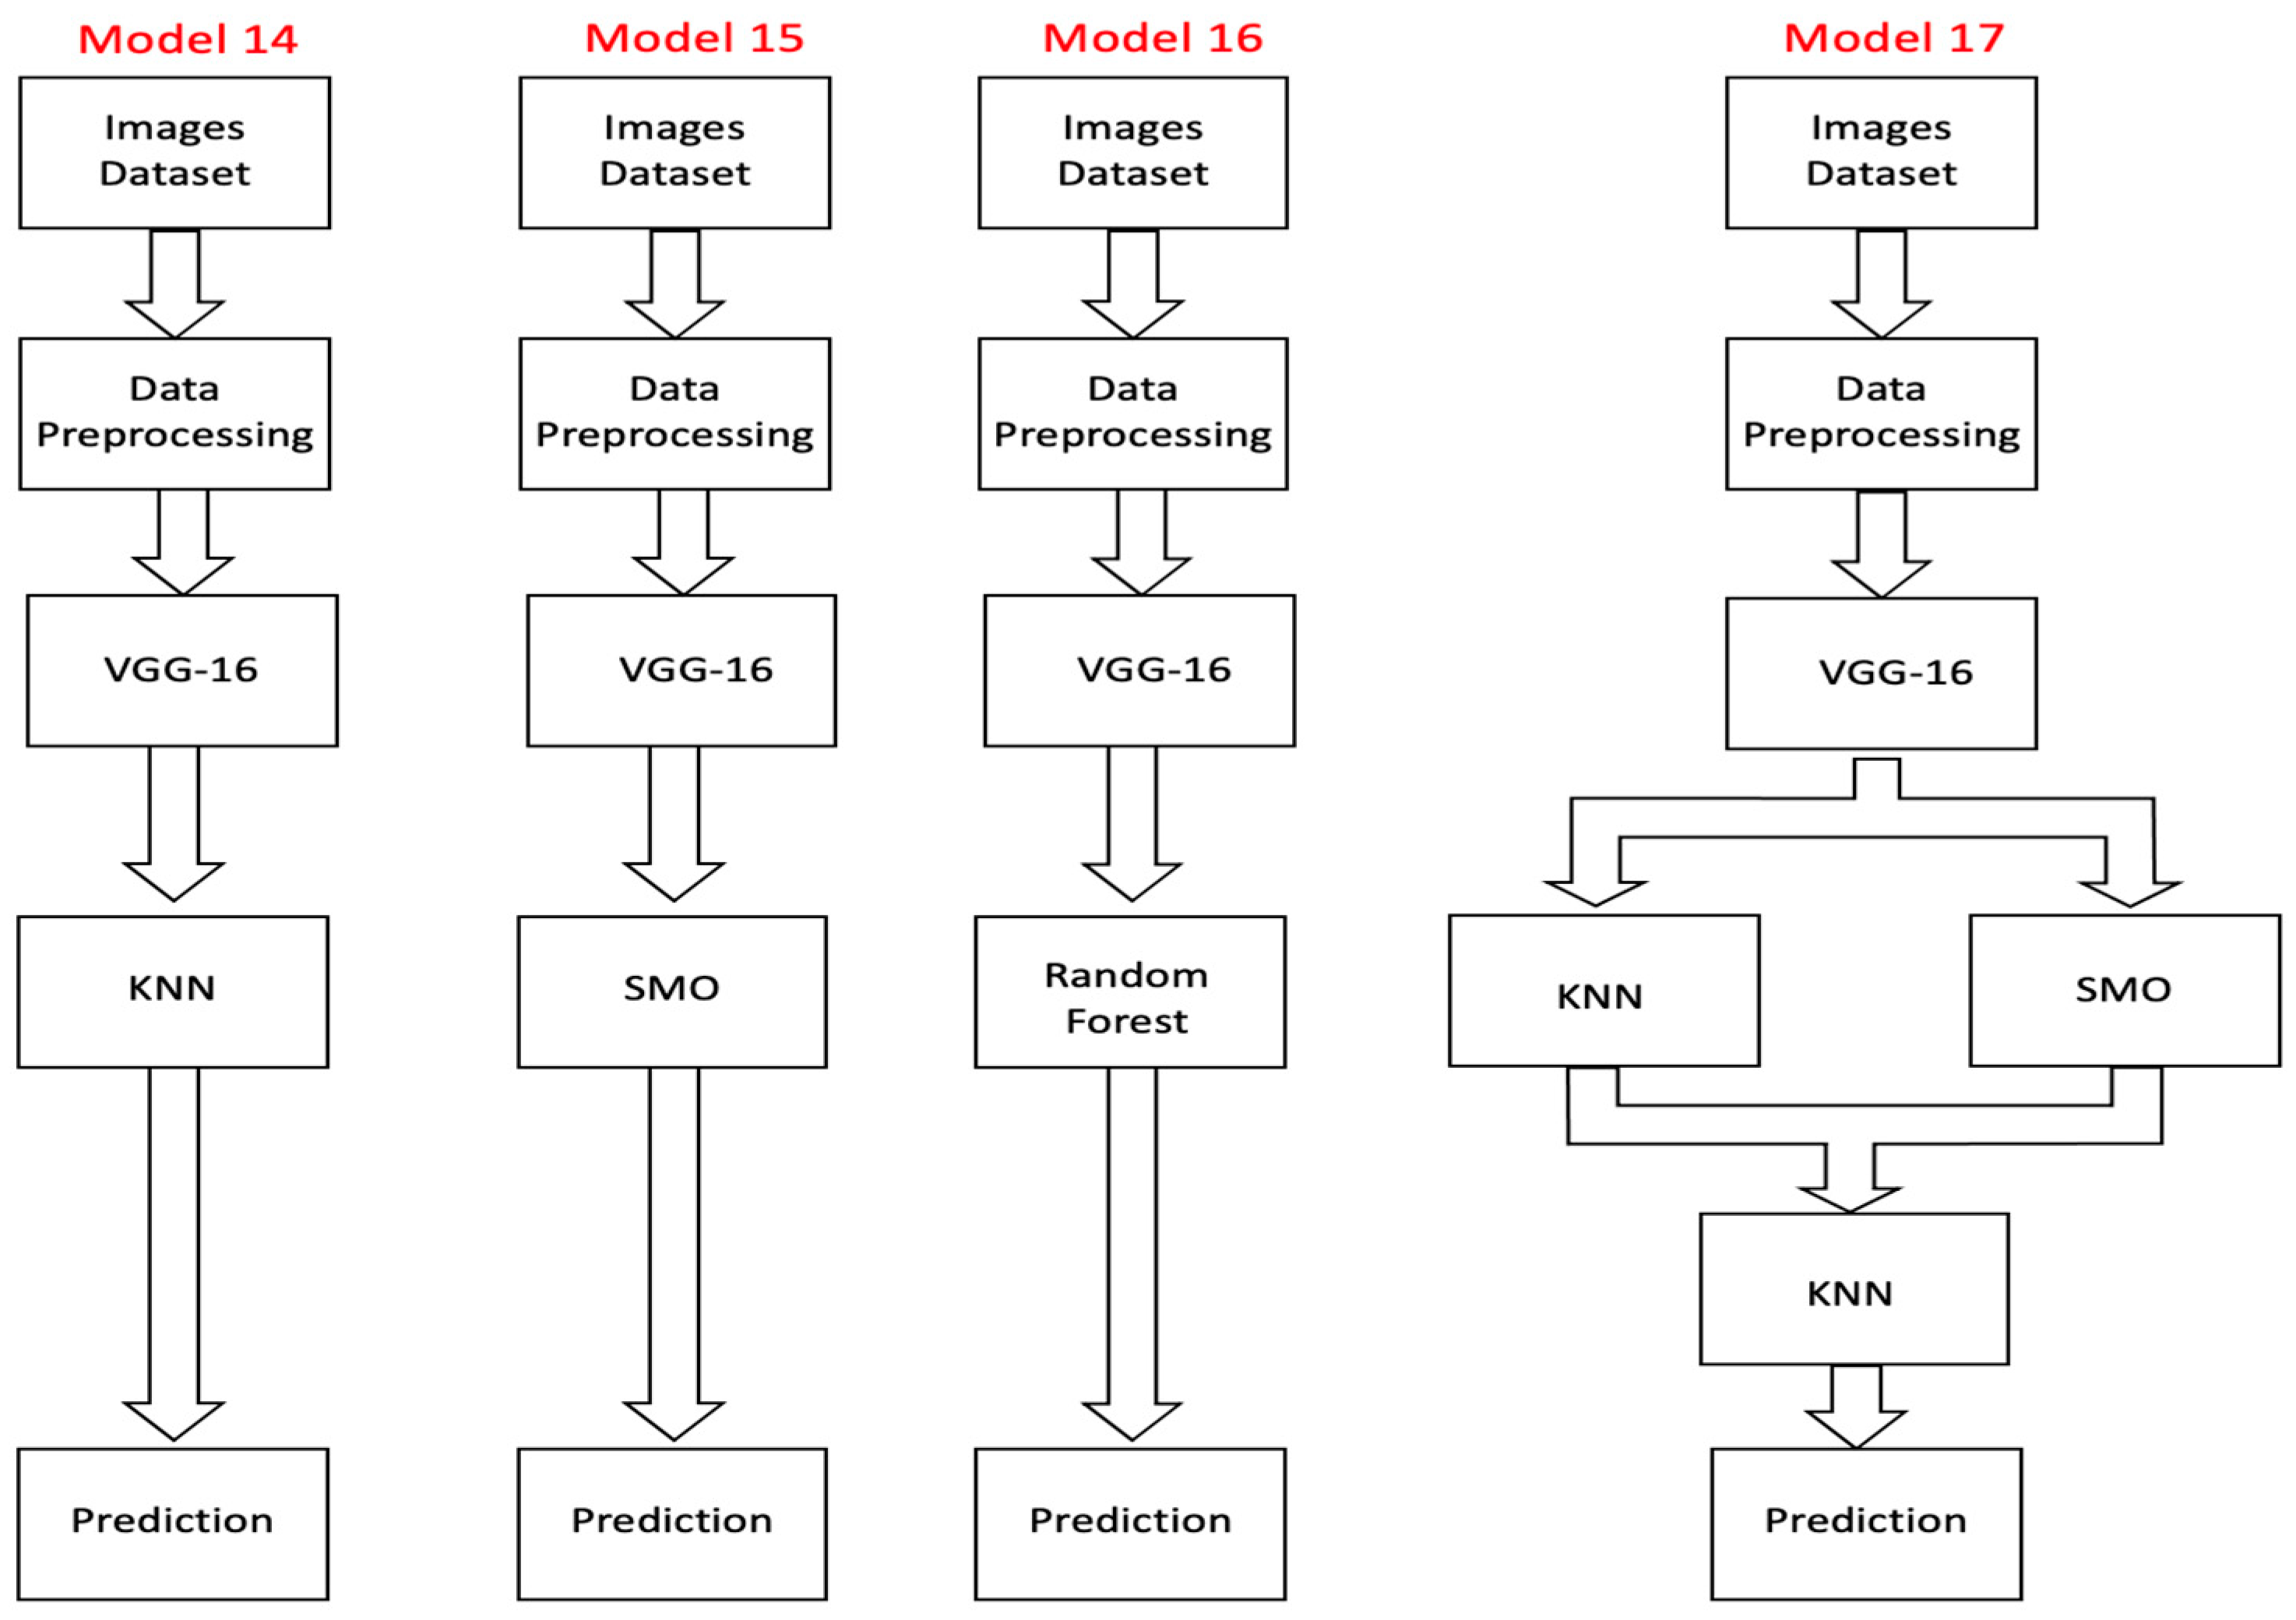
4.4. VGG16 Transfer Model
4.5. Comparison of Different Feature Extractors
4.6. Analysis of the Results
5. Conclusions
Author Contributions
Funding
Data Availability Statement
Conflicts of Interest
References
- Dramé-Maigné, S.; Laurent, M.; Castillo, L.; Ganem, H. Centralized, Distributed, and Everything in between: Reviewing Access Control Solutions for the IoT. ACM Comput. Surv. 2022, 54, 1–34. [Google Scholar] [CrossRef]
- Granjal, J.; Monteiro, E.; Silva, J.S. Security for the internet of things: A Survey of existing protocols and open research issues. J. Fac. Eng. Archit. Gazi Univ. 2018, 33, 1247–1272. [Google Scholar] [CrossRef]
- Drame-Maigne, S. Blockchain and Access Control: Towards a More Secure Internet of Things. Networking and Internet Architecture [cs.NI]. Ph.D. Thesis, Université Paris Saclay (COmUE), Yvette, France, 2019. [Google Scholar]
- Gibson, A.; Thamilarasu, G. Protect Your Pacemaker: Blockchain based Authentication and Consented Authorization for Implanted Medical Devices. Procedia Comput. Sci. 2019, 171, 847–856. [Google Scholar] [CrossRef]
- ICANN. The General Data Protection Regulation 2020 Review. May 2020. Available online: https://itp.cdn.icann.org/en/files/government-engagement-ge/ge-003-07may20-en.pdf (accessed on 5 March 2023).
- Antonakakis, M.; April, T.; Bailey, M.; Bernhard, M.; Bursztein, E.; Cochran, J.; Zhou, Y. Understanding the Mirai Botnet. In Proceedings of the 26th USENIX Security Symposium, Vancouver, BC, Canada, 16–18 August 2017. [Google Scholar]
- O’Sullivan, W.; Choo, K.-K.R.; Le-Khac, N.-A. Defending IoT Devices from Malware; Springer: Berlin/Heidelberg, Germany, 2022; pp. 5–29. [Google Scholar] [CrossRef]
- Wu, H.; Han, H.; Wang, X.; Sun, S. Research on Artificial Intelligence Enhancing Internet of Things Security: A Survey. IEEE Access 2020, 8, 153826–153848. [Google Scholar] [CrossRef]
- Ferrag, M.A.; Maglaras, L. DeepCoin: A Novel Deep Learning and Blockchain-Based Energy Exchange Framework for Smart Grids. IEEE Trans. Eng. Manag. 2020, 67, 1285–1297. [Google Scholar] [CrossRef]
- Alkadi, O.; Moustafa, N.; Turnbull, B.; Choo, K.K.R. A Deep Blockchain Framework-Enabled Collaborative Intrusion Detection for Protecting IoT and Cloud Networks. IEEE Internet Things J. 2021, 8, 9463–9472. [Google Scholar] [CrossRef]
- HaddadPajouh, H.; Dehghantanha, A.; Khayami, R. A Deep Recurrent Neural Network Based Approach for Internet of Things Malware Threat Hunting. Future Gener. Comput. Syst. 2018, 85, 88–96. [Google Scholar] [CrossRef]
- Belavagi, M.C.; Muniyal, B. Performance evaluation of supervised machine learning algorithms for intrusion detection. Procedia Comput. Sci. 2016, 89, 117–123. [Google Scholar] [CrossRef]
- Ahmad, I.; Haq, Q.E.U.; Imran, M.; Alassafi, M.O.; AlGhamdi, R.A. An Efficient Network Intrusion Detection and Classification System. Mathematics 2022, 10, 530. [Google Scholar] [CrossRef]
- Thapa, N.; Liu, Z.; Kc, D.B.; Gokaraju, B.; Roy, K. Comparison of machine learning and deep learning models for network intrusion detection systems. Future Internet 2020, 12, 167. [Google Scholar] [CrossRef]
- Das, V.; Pathak, V.; Sharma, S.; Srikanth, M.; Kumar, T.G. Network intrusion detection system based on machine learning algorithms. AIRCC’s Int. J. Comput. Sci. Inf. Technol. 2010, 2, 138–151. [Google Scholar] [CrossRef]
- Rahman, A.; Mahmud, M.; Iqbal, T.; Saraireh, L.; Kholidy, H.; Gollapalli, M.; Musleh, D.; Alhaidari, F.; Almoqbil, D.; Ahmed, M.I.B. Network anomaly detection in 5G networks. Math. Model. Eng. Probl. 2022, 9, 397–404. [Google Scholar] [CrossRef]
- Rose, J.R.; Swann, M.; Bendiab, G.; Shiaeles, S.; Kolokotronis, N. Intrusion Detection using Network Traffic Profiling and Machine Learning for IoT. In Proceedings of the 2021 IEEE Conference on Network Softwarization: Accelerating Network Softwarization in the Cognitive Age, NetSoft 2021, Tokyo, Japan, 28 June–2 July 2021; pp. 409–415. [Google Scholar] [CrossRef]
- Ali, Z.; Hussain, F.; Ghazanfar, S.; Husnain, M.; Zahid, S.; Shah, G.A. A Generic Machine Learning Approach for IoT Device Identification. In Proceedings of the 2021 International Conference on Cyber Warfare and Security (ICCWS), Islamabad, Pakistan, 23–25 November 2021; pp. 118–123. [Google Scholar] [CrossRef]
- El-Sayed, R.; El-Ghamry, A.; Gaber, T.; Hassanien, A.E. Zero-Day Malware Classification Using Deep Features with Support Vector Machines. In Proceedings of the 2021 Tenth International Conference on Intelligent Computing and Information Systems (ICICIS), Cairo, Egypt, 5–7 December 2021; pp. 311–317. [Google Scholar] [CrossRef]
- Le, K.-H.; Nguyen, M.-H.; Tran, T.-D.; Tran, N.-D. IMIDS: An Intelligent Intrusion Detection System against Cyber Threats in IoT. Electronics 2022, 11, 524. [Google Scholar] [CrossRef]
- Joo, H.; Choi, H.; Yun, C.; Cheon, M. Efficient Network Traffic Classification and Visualizing Abnormal Part Via Hybrid Deep Learning Approach: Xception + Bidirectional GRU. Glob. J. Comput. Sci. Technol. 2022, 21, 1–10. [Google Scholar] [CrossRef]
- Bendiab, G.; Shiaeles, S.; Alruban, A.; Kolokotronis, N. IoT malware network traffic classification using visual representation and deep learning. In Proceedings of the 2020 IEEE Conference on Network Softwarization: Bridging the Gap Between AI and Network Softwarization, NetSoft 2020, Virtual, 29 June–3 July 2020; pp. 444–449. [Google Scholar] [CrossRef]
- Hindy, H.; Bayne, E.; Bures, M.; Atkinson, R.; Tachtatzis, C.; Bellekens, X. Machine Learning Based IoT Intrusion Detection System: An MQTT Case Study (MQTT-IoT-IDS2020 Dataset). Lect. Notes Netw. Syst. 2021, 180, 73–84. [Google Scholar] [CrossRef]
- Sapre, S.; Ahmadi, P.; Islam, K. A Robust Comparison of the KDDCup99 and NSL-KDD IoT Network Intrusion Detection Datasets Through Various Machine Learning Algorithms. arXiv 2019, arXiv:1912.13204. [Google Scholar]
- Liu, J.; Kantarci, B.; Adams, C. Machine learning-driven intrusion detection for Contiki-NG-based IoT networks exposed to NSL-KDD dataset. In Proceedings of the WiseML 2020—2nd ACM Workshop on Wireless Security and Machine Learning, Abu Dhabi, United Arab Emirates, 28 June–2 July 2020; pp. 25–30. [Google Scholar] [CrossRef]
- Amouri, A.; Alaparthy, V.T.; Morgera, S.D. A machine learning based intrusion detection system for mobile internet of things. Sensors 2020, 20, 461. [Google Scholar] [CrossRef] [PubMed]
- Fenanir, S.; Semchedine, F.; Baadache, A. A machine learning-based lightweight intrusion detection system for the internet of things. Rev. D’Intell. Artif. 2019, 33, 203–211. [Google Scholar] [CrossRef]
- Islam, N.; Farhin, F.; Sultana, I.; Kaiser, M.S.; Rahman, M.S.; Mahmud, M.; Cho, G.H. Towards Machine Learning Based Intrusion Detection in IoT Networks. Comput. Mater. Contin. 2021, 69, 1801–1821. [Google Scholar] [CrossRef]
- Ahmad, M.; Riaz, Q.; Zeeshan, M.; Tahir, H.; Haider, S.A.; Khan, M.S. Intrusion detection in internet of things using supervised machine learning based on application and transport layer features using UNSW-NB15 data-set. Eurasip J. Wirel. Commun. Netw. 2021, 2021, 1–23. [Google Scholar] [CrossRef]
- Saba, T.; Sadad, T.; Rehman, A.; Mehmood, Z.; Javaid, Q. Intrusion detection system through advance machine learning for the internet of things networks. IT Prof. 2021, 23, 58–64. [Google Scholar] [CrossRef]
- Smys, S.; Basar, A.; Wang, H. Hybrid Intrusion Detection System for Internet of Things (IoT). J. ISMAC 2020, 2, 190–199. [Google Scholar] [CrossRef]
- Papafotikas, S.; Kakarountas, A. A machine-learning clustering approach for intrusion detection to IoT devices. In Proceedings of the 2019 4th South-East Europe Design Automation, Computer Engineering, Computer Networks and Social Media Conference, SEEDA-CECNSM 2019, Piraeus, Greece, 20–22 September 2019; pp. 1–6. [Google Scholar] [CrossRef]
- Farooq, M.S.; Abbas, S.; Rahman, A.U.; Sultan, K.; Khan, M.A.; Mosavi, A. A fused machine learning approach for intrusion detection system. Comput. Mater. Contin. 2023, 74, 2607–2623. [Google Scholar]
- Liu, H.; Lang, B. Machine Learning and Deep Learning Methods for Intrusion Detection Systems: A Survey. Appl. Sci. 2019, 9, 4396. [Google Scholar] [CrossRef]
- Verma, A.; Ranga, V. Machine Learning Based Intrusion Detection Systems for IoT Applications. Wirel. Pers. Commun. 2020, 111, 2287–2310. [Google Scholar] [CrossRef]
- Kocher, G.; Kumar, G. Machine learning and deep learning methods for intrusion detection systems: Recent developments and challenges. Soft Comput. 2021, 25, 9731–9763. [Google Scholar] [CrossRef]
- Aversano, L.; Bernardi, M.L.; Cimitile, M.; Pecori, R. A systematic review on Deep Learning approaches for IoT security. Comput. Sci. Rev. 2021, 40, 100389. [Google Scholar] [CrossRef]
- Alhaidari, F.; Rahman, A.; Zagrouba, R. Cloud of Things: Architecture, applications and challenges. J. Ambient. Intell. Human Comput. 2020. [CrossRef]
- Rose, J. 913 Malicious Network Traffic PCAPs and Binary Visualisation Images Dataset, IEEE Dataport. 2021. Available online: https://ieee-dataport.org/open-access/913-malicious-network-traffic-pcaps-and-binary-visualisation-images-dataset (accessed on 7 May 2022).
- Obaid, H.S.; Dheyab, S.A.; Sabry, S.S. The impact of data pre-processing techniques and dimensionality reduction on the accuracy of machine learning. In Proceedings of the 2019 9th Annual Information Technology, Electromechanical Engineering and Microelectronics Conference (IEMECON), Jaipur, India, 13–15 March 2019; pp. 279–283. [Google Scholar]
- Hussein, A.S.; Li, T.; Yohannese, C.W.; Bashir, K. A-SMOTE: A new preprocessing approach for highly imbalanced datasets by improving SMOTE. Int. J. Comput. Intell. Syst. 2019, 12, 1412. [Google Scholar] [CrossRef]
- Li, J.; Lo, W.L.; Fu, H.; Chung, H.S.H. A transfer learning method for meteorological visibility estimation based on feature fusion method. Appl. Sci. 2021, 11, 997. [Google Scholar] [CrossRef]
- Desai, C. Image Classification Using Transfer Learning and Deep Learning. Int. J. Eng. Comput. Sci. 2021, 10, 25394–25398. [Google Scholar] [CrossRef]
- Chauhan, T.; Palivela, H.; Tiwari, S. Optimization and Fine-Tuning of DenseNet model for classification of Covid-19 cases in Medical Imaging. Int. J. Inf. Manag. Data Insights 2021, 1, 100020. [Google Scholar] [CrossRef]
- Huang, J.; Kumar, S.R.; Mitra, M.; Zhu, W.-J.; Zabih, R. Image indexing using color correlograms. In Proceedings of the IEEE Computer Society Conference on Computer Vision and Pattern Recognition, San Juan, Puerto Rico, 17–19 June 1997; pp. 762–768. [Google Scholar]
- Chatzichristofis, S.A.; Boutalis, Y.S. FCTH: Fuzzy color and texture histogram-a low level feature for accurate image retrieval. In Proceedings of the 2008 Ninth International Workshop on Image Analysis for Multimedia Interactive Services, Klagenfurt, Austria, 7–9 May 2008; pp. 191–196. [Google Scholar]
- Jankovic, R. Classifying cultural heritage images by using decision tree classifiers in WEKA. In Proceedings of the 1st International Workshop on Visual Pattern Extraction and Recognition for Cultural Heritage Understanding Co-Located with 15th Italian Research Conference on Digital Libraries (IRCDL 2019), Pisa, Italy, 30 January 2019; pp. 119–127. [Google Scholar]
- Alhaidari, F.; Abu-Shaib, N.; Alsafi, M.; Alharbi, H.; Alawami, M.; Aljindan, R.; Rahman, A.-U.; Zagrouba, R. ZeVigilante: Detecting Zero-Day Malware Using Machine Learning and Sandboxing Analysis Techniques. Comput. Intell. Neurosci. 2022, 2022, 1615528. [Google Scholar] [CrossRef] [PubMed]
- Alqarni, A.; Rahman, A. Arabic Tweets-Based Sentiment Analysis to Investigate the Impact of COVID-19 in KSA: A Deep Learning Approach. Big Data Cogn. Comput. 2023, 7, 16. [Google Scholar] [CrossRef]
- Alotaibi, A.; Rahman, A.; Alhaza, R.; Alkhalifa, W.; Alhajjaj, N.; Alharthi, A.; Abushoumi, D.; Alqahtani, M.; Alkhulaifi, D. Spam and sentiment detection in Arabic tweets using MARBERT model. Math. Model. Eng. Probl. 2022, 9, 1574–1582. [Google Scholar] [CrossRef]
- Basheer Ahmed, M.I.; Zaghdoud, R.; Ahmed, M.S.; Sendi, R.; Alsharif, S.; Alabdulkarim, J.; Albin Saad, B.A.; Alsabt, R.; Rahman, A.; Krishnasamy, G. A Real-Time Computer Vision Based Approach to Detection and Classification of Traffic Incidents. Big Data Cogn. Comput. 2023, 7, 22. [Google Scholar] [CrossRef]
- Alghamdi, A.S.; Rahman, A. Data Mining Approach to Predict Success of Secondary School Students: A Saudi Arabian Case Study. Educ. Sci. 2023, 13, 293. [Google Scholar] [CrossRef]


| Ref. | Year | Dataset Type | Algorithms | Key Results | Advantages | Disadvantages |
|---|---|---|---|---|---|---|
| [17] | 2021 | Image dataset | A novel IDS in the ML framework | 98.35% | A new approach to detect malware and intrusion using image processing for IoT | Need resources and computing time to achieve results and to understand what each image means |
| [18] | 2021 | Numerical dataset | Random forest and naïve Bayes algorithms in the ML model | 99% | Using different types of machine learning to understand the problem | Too expensive in terms of resources and computing time, and the authors did not propose any base model for the future |
| [19] | 2021 | Image dataset | Two-layer CNN, four-layer CNN, VGG16, CNN classifiers, SVM, and K-NN in the ML model | 94% | Using a hybrid technique to extract the best features from the images using VGG and CNN | Too heavy classification network and no improvement in key results |
| [20] | 2021 | Numerical dataset | Novel convolutional neural network in ML model | 97.22% | A faster IDS | Despite the fast performance, the model is light with the heavy traffic amount |
| [21] | 2021 | Image dataset | Convolutional neural network (CNN) | 95.6% | Connected layers and faster learning | The model uses heavy resources and without achieving higher accuracy |
| [22] | 2021 | Image dataset | Residual Neural Network (ResNet50) | 94.50% | The model used a hybrid approach to detect intrusions | The authors used a small amount of the data to achieve the findings without testing on the larger networks |
| [23] | 2020 | Numerical dataset | LR, NB, k-NN, SVM, DT, and RF | 99.04% | Using different ML algorithms | The model was focused on flow-based detection, not packet-based detection |
| [24] | 2019 | Numerical dataset | ANN, SVM, NBC, and random forest | 91.5% | The authors used different dataset types | The model was trained separately on the dataset, and without finding a model that is trained on different intrusion features |
| [25] | 2020 | Numerical dataset | Tree-based XGBoost, MCC, AUC, ME, and naïve Bayes classifier | 97% | The model used an XGBoost algorithm | The model was applied to a couple of scenarios without generating a model that could handle several scenarios |
| [26] | 2020 | Numerical dataset | Tree-based; among the supervised algorithms, XGBoost ranks first, followed by Matthew’s correlation coefficient (MCC), area under the curve (AUC), expectation-maximization (EM) algorithm, naïve Bayes classifier | 90% | The model used different approaches to tackle the IDS problems | The model was focused on DDOS and DOS attacks. |
| [27] | 2019 | Numerical dataset | LR, NB, DT, RF, KNN, SVM, and MLP | 98% | Applied different machine learning algorithms | More feature selection processes are needed to achieve better findings |
| [28] | 2021 | Numerical dataset | DT, RF, SVM, (DNN), deep belief network (DBN), long short-term memory (LSTM), stacked LSTM, bidirectional LSTM (Bi-LSTM)) | 98.2% | Applied different machine learning algorithms using different datasets | The proposed model did not recommend specific datasets or algorithms to be used as a base model |
| [29] | 2021 | Numerical dataset | RF, SVM, and ANN | 96.96% | Applied different machine learning algorithms | More feature selection processes are needed to achieve better findings |
| [30] | 2021 | Numerical dataset | GA, SVM, ensemble classifier, and DT | 99.8% | Applied hyperparameter and K-fold | The model proposed a multiclass without presenting the features or the class features |
| [31] | 2020 | Numerical dataset | Different ML algorithms in hybrid convolutional neural network module | 98% | The model takes advantage of deep learning feature extraction | The model was applied to a couple of scenarios without generating a model that could handle several scenarios |
| [32] | 2019 | Numerical dataset | K-means algorithms | - | Using clustering to tackle the problem | The model still needs to be trained from supervised algorithms to achieve findings |
| [33] | 2023 | Numerical dataset | Fused machine learning | 95.18% | Used machine learning fusion with three datasets (KDD, CUP-99, NetML-2020) | Accuracy can be further fine-tuned |
| Data Split | Metric | KNN Neighbors (K) | Random Forest | SMO | Stacking (KNN + SMO), Meta (KNN) with Neighbors (K) | ||
|---|---|---|---|---|---|---|---|
| Cross-validation 10 | Accuracy | K = 1 | 93.0% | 93.3% | 84.8% | K = 1 | 91.5% |
| Precision | 91.4% | 92.0% | 76.6% | 89.1% | |||
| Recall | 92.5% | 92.7% | 93.6% | 91.7% | |||
| F1-Score | 0.92 | 0.92 | 0.84 | 0.90 | |||
| 70:30 | Accuracy | K = 1 | 92.0% | 92.2% | 82.7% | K = 1 | 89.1% |
| Precision | 92.9% | 94.0% | 75.4% | 94.2% | |||
| Recall | 88.8% | 88.2% | 91.3% | 80.7% | |||
| F1-Score | 0.91 | 0.91 | 0.83 | 0.87 | |||
| 90:10 | Accuracy | K = 1 | 97.5% | 96.6% | 84.9% | K = 1 | 95.0% |
| Precision | 98.0% | 94.4% | 75.0% | 91.1% | |||
| Recall | 96.2% | 98.1% | 98.1% | 98.1% | |||
| F1-Score | 0.97 | 0.96 | 0.85 | 0.94 | |||
| Data Split | Metric | KNN Neighbors (K) | Random Forest | SMO | Stacking (KNN + SMO), Meta (KNN) with Neighbors (K) | Stacking (Jrip, RF), Meta (SMO) | ||
|---|---|---|---|---|---|---|---|---|
| cross-validation 10 | Accuracy | K = 1 | 94.6% | 94.7% | 92.0 | K = 1 | 93.7% | 95.0% |
| Precision | 94.0% | 93.5% | 86.9% | 93.7% | 93.9% | |||
| Recall | 93.6% | 94.4% | 96.1% | 91.7% | 94.6% | |||
| F1-Score | 0.94 | 0.94 | 0.91 | 0.93 | 0.90 | |||
| 70:30 | Accuracy | K = 1 | 94.0% | 95.0% | 90.8% | K = 1 | 93.6% | 94.4% |
| Precision | 92.6% | 93.3% | 85.2% | 93.7% | 94.3% | |||
| Recall | 93.4% | 96.0% | 96.3% | 91.9% | 93.2% | |||
| F1-Score | 0.93 | 0.95 | 0.90 | 0.93 | 0.94 | |||
| 90:10 | Accuracy | K = 1 | 96.6% | 97.5% | 92.4% | K = 1 | 96.0% | 97.5% |
| Precision | 96.2% | 94.5% | 87.7% | 96.1% | 96.2% | |||
| Recall | 96.2% | 100 | 96.2% | 94.2% | 98.1% | |||
| F1-Score | 0.96 | 0.98 | 0.92 | 0.95 | 0.97 | |||
| Data Split | Metric | KNN Neighbors (K) | Random Forest | SMO | Stacking (KNN + SMO), Meta (KNN) with Neighbors (K) | ||
|---|---|---|---|---|---|---|---|
| cross-validation 10 | Accuracy | K = 3 | 94.6% | 94.1% | 94.1% | K = 3 | 94.2% |
| Precision | 91.7% | 91.0% | 92.1% | 92.1% | |||
| Recall | 96.1% | 95.9% | 94.4% | 94.8% | |||
| F1-Score | 0.94 | 0.93 | 0.93 | 0.93 | |||
| 70:30 | Accuracy | K = 5 | 94.4% | 93.6% | 93.9% | K = 5 | 93.9% |
| Precision | 91.7% | 91.1% | 93.7% | 91.6% | |||
| Recall | 96.3% | 95.0% | 92.5% | 95.0% | |||
| F1-Score | 0.94 | 0.93 | 0.93 | 0.933 | |||
| 90:10 | Accuracy | K = 5 | 95.0% | 96.6% | 93.3% | K = 5 | 92.4% |
| Precision | 89.7% | 92.9% | 92.3% | 89.1% | |||
| Recall | 100 | 100 | 92.3% | 94.2% | |||
| F1-Score | 0.95 | 0.96 | 0.92 | 0.92 | |||
| Data Split | Metric | KNN Neighbors (K) | Random Forest | SMO | Stacking (KNN + SMO), Meta (KNN) with Neighbors (K) | ||
|---|---|---|---|---|---|---|---|
| cross-validation 10 | Accuracy | K = 3 | 94.2% | 94.1% | 93.1% | K = 3 | 93.7% |
| Precision | 91.3% | 91.0% | 90.8% | 92.4% | |||
| Recall | 95.8% | 95.8% | 93.6% | 93.2% | |||
| F1-Score | 0.94 | 0.93 | 0.92 | 0.93 | |||
| 70:30 | Accuracy | K = 5 | 95.8% | 94.4% | 94.7% | K = 5 | 94.7% |
| Precision | 95.1% | 92.7% | 92.8% | 93.3% | |||
| Recall | 95.7% | 95.0% | 95.7% | 95.0% | |||
| F1-Score | 0.95 | 0.94 | 0.94 | 0.94 | |||
| 90:10 | Accuracy | K = 5 | 97.5% | 97.5% | 94.7% | K = 5 | 98.3% |
| Precision | 94.5% | 94.5% | 94.5% | 96.3% | |||
| Recall | 100% | 100% | 100% | 100% | |||
| F1-Score | 97.2% | 0.97 | 0.97 | 0.98 | |||
| Data Split | Metric | KNN Neighbors (K) | Random Forest | SMO | Stacking (KNN + SMO), Meta (KNN) with Neighbors (K) | Stacking (Jrip, RF), Meta (SMO) | ||
|---|---|---|---|---|---|---|---|---|
| Auto-Color Correlogram Filter | Accuracy | K = 1 | 93.0% | 93.3% | 84.8% | K = 1 | 91.5% | Not appliable (NA) |
| Precision | 91.4% | 92.0% | 76.6% | 89.1% | NA | |||
| Recall | 92.5% | 92.7% | 93.6% | 91.7% | NA | |||
| F1-Score | 0.92 | 0.92 | 0.84 | 0.90 | NA | |||
| Auto-Color and FcTH | Accuracy | K = 1 | 94.6% | 94.7% | 92.0 | K = 1 | 93.7% | 95.0% |
| Precision | 94.0% | 93.5% | 86.9% | 93.7% | 93.9% | |||
| Recall | 93.6% | 94.4% | 96.1% | 91.7% | 94.6% | |||
| F1-Score | 0.94 | 0.94 | 0.91 | 0.93 | 0.90 | |||
| DenseNet | Accuracy | K = 3 | 94.6% | 94.1% | 94.1% | K = 3 | 94.2% | NA |
| Precision | 91.7% | 91.0% | 92.1% | 92.1% | NA | |||
| Recall | 96.1% | 95.9% | 94.4% | 94.8% | NA | |||
| F1-Score | 0.94 | 0.93 | 0.93 | 0.93 | NA | |||
| VGG-16 | Accuracy | K = 3 | 94.2% | 94.1% | 93.1% | K = 5 | 93.7% | NA |
| Precision | 91.3% | 91.0% | 90.8% | 92.4% | NA | |||
| Recall | 95.8% | 95.8% | 93.6% | 93.2% | NA | |||
| F1-Score | 0.94 | 0.93 | 0.92 | 0.93 | NA | |||
| Data Split | Metric | KNN Neighbors (K) | Random Forest | SMO | Stacking (KNN + SMO), Meta (KNN) with Neighbors | Stacking (Jrip, RF), Meta (SMO) | ||
|---|---|---|---|---|---|---|---|---|
| Auto-Color Correlogram Filter | Accuracy | K = 1 | 92.0% | 92.2% | 82.7% | K = 1 | 89.1% | NA |
| Precision | 92.9% | 94.0% | 75.4% | 94.2% | NA | |||
| Recall | 88.8% | 88.2% | 91.3% | 80.7% | NA | |||
| F1-Score | 0.91 | 0.91 | 0.83 | 0.87 | NA | |||
| Auto-Color and FcTH | Accuracy | K = 1 | 94.0% | 95.0% | 90.8% | K = 1 | 93.6% | 94.4% |
| Precision | 92.6% | 93.3% | 85.2% | 93.7% | 94.3% | |||
| Recall | 93.4% | 96.0% | 96.3% | 91.9% | 93.2% | |||
| F1-Score | 0.93 | 0.95 | 0.90 | 0.93 | 0.94 | |||
| DenseNet | Accuracy | K = 3 | 94.4% | 93.6% | 93.9% | K = 3 | 93.9% | NA |
| Precision | 91.7% | 91.1% | 93.7% | 91.6% | NA | |||
| Recall | 96.3% | 95.0% | 92.5% | 95.0% | NA | |||
| F1-Score | 0.94 | 0.93 | 0.93 | 0.93 | NA | |||
| VGG-16 | Accuracy | K = 3 | 95.8% | 94.4% | 94.7% | K = 5 | 94.7% | NA |
| Precision | 95.1% | 92.7% | 92.8% | 93.3% | NA | |||
| Recall | 95.7% | 95.0% | 95.7% | 95.0% | NA | |||
| F1-Score | 0.95 | 0.94 | 0.94 | 0.94 | NA | |||
| Data Split | Metric | KNN Neighbors (K) | Random Forest | SMO | Stacking (KNN + SMO), Meta (KNN) with Neighbors (K) | Stacking (Jrip, RF), Meta (SMO) | ||
|---|---|---|---|---|---|---|---|---|
| Auto-Color Correlogram Filter | Accuracy | K = 1 | 97.5% | 96.6% | 84.9% | K = 1 | 95.0% | NA |
| Precision | 98.0% | 94.4% | 75.0% | 91.1% | NA | |||
| Recall | 96.2% | 98.1% | 98.1% | 98.1% | NA | |||
| F1-Score | 0.97 | 0.96 | 0.85 | 0.94 | NA | |||
| Auto-Color and FcTH | Accuracy | K = 1 | 96.6% | 97.5% | 92.4% | K = 1 | 96.0% | 97.5% |
| Precision | 96.2% | 94.5% | 87.7% | 96.1% | 96.2% | |||
| Recall | 96.2% | 100 | 96.2% | 94.2% | 98.1% | |||
| F1-Score | 0.96 | 0.98 | 0.92 | 0.95 | 0.97 | |||
| DenseNet | Accuracy | K = 3 | 95.0% | 96.6% | 93.3% | K = 3 | 92.4% | NA |
| Precision | 89.7% | 92.9% | 92.3% | 89.1% | NA | |||
| Recall | 100% | 100% | 92.3% | 94.2% | NA | |||
| F1-Score | 0.95 | 0.96 | 0.92 | 0.92 | NA | |||
| VGG-16 | Accuracy | K = 3 | 97.5% | 97.5% | 94.7% | K = 5 | 98.3% | NA |
| Precision | 94.5% | 94.5% | 94.5% | 96.3% | NA | |||
| Recall | 100% | 100% | 100% | 100 | NA | |||
| F1-Score | 0.97 | 0.97 | 0.97 | 0.98 | NA | |||
Disclaimer/Publisher’s Note: The statements, opinions and data contained in all publications are solely those of the individual author(s) and contributor(s) and not of MDPI and/or the editor(s). MDPI and/or the editor(s) disclaim responsibility for any injury to people or property resulting from any ideas, methods, instructions or products referred to in the content. |
© 2023 by the authors. Licensee MDPI, Basel, Switzerland. This article is an open access article distributed under the terms and conditions of the Creative Commons Attribution (CC BY) license (https://creativecommons.org/licenses/by/4.0/).
Share and Cite
Musleh, D.; Alotaibi, M.; Alhaidari, F.; Rahman, A.; Mohammad, R.M. Intrusion Detection System Using Feature Extraction with Machine Learning Algorithms in IoT. J. Sens. Actuator Netw. 2023, 12, 29. https://doi.org/10.3390/jsan12020029
Musleh D, Alotaibi M, Alhaidari F, Rahman A, Mohammad RM. Intrusion Detection System Using Feature Extraction with Machine Learning Algorithms in IoT. Journal of Sensor and Actuator Networks. 2023; 12(2):29. https://doi.org/10.3390/jsan12020029
Chicago/Turabian StyleMusleh, Dhiaa, Meera Alotaibi, Fahd Alhaidari, Atta Rahman, and Rami M. Mohammad. 2023. "Intrusion Detection System Using Feature Extraction with Machine Learning Algorithms in IoT" Journal of Sensor and Actuator Networks 12, no. 2: 29. https://doi.org/10.3390/jsan12020029
APA StyleMusleh, D., Alotaibi, M., Alhaidari, F., Rahman, A., & Mohammad, R. M. (2023). Intrusion Detection System Using Feature Extraction with Machine Learning Algorithms in IoT. Journal of Sensor and Actuator Networks, 12(2), 29. https://doi.org/10.3390/jsan12020029