Abstract
Blueberries have seen an ascending production line boosted by World Health Organization (WHO) approvals for their contributions to a healthy diet and the evidence that they act against different diseases. This increase resulted in significant amounts of discarded leaves, which could be a valuable source of bioactive compounds. In the present study, ultrasound-assisted extraction technology was used to determine and compare the chemical and biological profiles of leaves from six commercial blueberry (Vaccinium corymbosum L.) varieties. Feruloylquinic acid was the major compound identified, ranging from 19.23 ± 0.18 mg/g (at the lowest level, registered in the Spartan variety) to 49.62 ± 0.41 mg/g (at the highest level, registered in the Nelson variety). Rutin was the second major compound identified, for which Toro, Nelson, and Elliot leaves registered the highest values, with 35.77 ± 0.19 mg/g, 32.50 ± 0.20 mg/g, and 31.53 ± 0.1 mg/g, respectively. Even though analogous polyphenols were detected in the six cultivars, their concentrations and amounts were different. The leaf extracts of the cultivars Toro, Elliot, and Nelson appear to be good sources of antioxidants, registering high percentage inhibitions of DPPH radicals, of 70.41%, 68.42%, and 58.69%, respectively. The blueberry leaf extracts had a strong antibacterial activity and a low antifungal capacity, and a low-to-moderate antimutagenic capacity towards Salmonella typhimurium TA98 and TA100 strains, with Toro leaf being the best candidate. All of these biological activities indicate health-related benefits, recommending them as suitable candidates for medical and pharmaceutical applications. The present paper adds significant knowledge to the field of blueberry leaves via chemical and biological profiles, supporting the ultrasound-assisted extraction technique as a useful and green method to provide alternative sources of bioactive compounds.
1. Introduction
Current evidence has underlined the fact that the overproduction of reactive oxygen species (ROS) and free radicals may be responsible for several pathological reactions that could contribute to the occurrence of specific diseases such as cancer, atherosclerosis, diabetes, and rheumatoid arthritis [,,]. Moreover, more bacteria have become resistant to well-established antibiotics, underlying the emergent need for novel/natural anti-microbial molecules [,,,,]. The plant kingdom is a rich complex of bioactive compounds [,,,,]. In this context, plant-based antioxidant compounds have received increased attention due to their ability to protect the human body against free radicals without—or with fewer—side effects [,]. Several species of the Vaccinium genus represent extensively used tools in traditional medicines for the treatment of diabetic symptoms [,]. The Vaccinium corymbosum (V. corymbosum) plant, also known as blueberry, has been reported as a complex of antioxidant and antimicrobial molecules—more precisely, polyphenol compounds—with a wide range of anthocyanins [,,,]. The Blueberry, Vaccinium spp., is a perennial shrub which is well-known worldwide, whereas the northern highbush blueberry (V. corymbosum L.) is the most popular [,,].
Numerous reports have detailed the V. corymbosum L. (blueberry) fruit’s benefits for human health [,]. It has been demonstrated to protect against cancer [,] stroke [] and urinary tract disease []. Furthermore, another study has shown that a blueberry-abundant diet can improve short-term memory loss and re-establish the loss of balance and coordination in aging rats []. A more recent paper has concluded that blueberry may have a positive effect in preventing cancer development and heart diseases by decreasing the cancer cell proliferation, considering existing studies, both in vitro and in vivo []. Such evidence has placed blueberries (V. corymbosum) in the top rank of the most popular berries [] and, considering the worldwide recommendations for fruits and vegetable intakes [], boosted their production and consumption. Therefore, significant quantities of Vaccinium leaves are also generated.
Blueberries (V. corymbosum L.) are a rich source of flavonoids and phenolic acids, which are known for their biological activities, e.g., antimicrobial activities [,,] and high radical scavenging capacity [,,]. The formation and accumulation of bioactive compounds in the fruits are influenced by several factors, such as genotype, environmental conditions, ripeness, and storage [,,,]. Moreover, phenolic compounds are particularly sensitive to environmental stress, and their content changes rapidly under the influence of stress []. Furthermore, recent studies have shown that the levels of anthocyanins, chlorogenic acid, and quercetin were influenced by the blueberry cultivar, as well [,]. The berries (and leaves) of Vaccinium L. (Ericaceae family) represent a significant source of food and pharmaceutical ingredients [,], whereas numerous products made from Vaccinium leaf and fruit extracts, commercialized as dietary supplements in the world market, have also been reported [].
While the Vaccinium corymbosum (V. corymbosum L.) fruits (blueberries) are well characterized, the information available about the chemical and biological profiles of their leaves is limited [,,]. There is a lack of knowledge on the antimutagenic, antibacterial, and antioxidant activities of hydroalcoholic leaf extracts from commercial V. corymbosum L. varieties. These may provide an alternative and cheap bioactive source that can be used as references in analytical research, and as a top source of health-related compounds for medical and pharmaceutical applications [].
Blueberry (V. corymbosum L.) leaves are the aerial parts of the plant, which have been characterized by their medicinal uses for centuries []. The leaves have varying phenolic compositions during different seasons; this fact is illustrated in the changing of their color from green to red in the autumn. The existing literature has demonstrated that the leaf extract of Vaccinium angustifolium (V. angustifolium) is rich in chlorogenic acid, several flavonols, and glycosides, as well as catechin and epicatechin [,]. Therefore, blueberry leaves can be described as an abundant and readily available source of 5-caffeoylquinic acid []. A recent study reported that leaf-derived proanthocyanidin from a particular blueberry cultivar (V. virgatum Aiton) proved to have strong suppressive effects towards Hepatitis C virus subgenome expression in a replicon cell system [].
Considering the above, in the present study, the phenolics, anthocyanins, and flavonoids contents were extracted via the ultrasound-assisted extraction technique, and were determined for the leaves of six commercial blueberry varieties, all of which had the same geographical origin (North-West of Romania, same producer) and were kept under several controlled environmental factors (soil, irrigation). The comparisons among the cultivars aimed to evaluate the differences between the polyphenolic compositions of the leaves, and to analyze their biological profile—such as their antioxidant, antimicrobial, and antimutagenic activities—thus adding valuable novelty to the present paper. Such research should be of use in the investigation of biological and chemical profiles to enhance the use of leaves (from the most commercialized blueberry varieties) in medical and pharmaceutical applications.
2. Materials and Methods
2.1. Plant Materials
Six Romanian blueberry cultivar varieties with the same provenience—namely Orăștie city, a northwestern location in Romania (45°51′ N, 23°12′ E)—and similar cultivations (controlled drip irrigation system, acid brown soil) were used in the present study: Elliot, Toro, Duke, Bluecrop, Spartan, Nelson. The blueberry leaves of these varieties were collected in September 2017, followed by drying (7–10 days, room temperature) and being ground to obtain a fine powder, and dark storage until the analyses.
2.2. Chemicals
Reference compounds—namely the catechin, chlorogenic acid, quercetin, cyanidin chloride, and gallic acid—were used for the HPLC-DAD-MS (Sigma-Aldrich, Steinheim, Germany). The chemical reagents for the analytical methods involved (Folin-Ciocalteu, total flavonoids content, HPLC, DPPH antioxidant activity) were also obtained from the same supplier. The specific culture media for the antimicrobial testing were bought from BioMerieux (Craponne, France) and Sigma-Aldrich (Steinheim, Germany).
2.3. Biomolecules Extraction Assisted by Ultrasounds
The ultrasound-assisted extraction (Elmasonic E15H, Elma, Singen, Germany) of the leaf powder (0.25 g) used 7 mL 40% v/v ethanol/water for 30 min at 20 °C, at an ultrasonic frequency of 37 kHz, followed by their centrifugation (5000 rpm, 10 min at 24 °C), filtration, the collection of the supernatant, and storage (−18 °C) prior chemical and biological analysis.
2.4. Evaluation of Phenolic Profile and Content
2.4.1. HPLC-DAD-ESI-MS Chemical Profile
All the leaf extracts belonging to the selected six blueberry cultivars were subjected to HPLC-DAD-ESI-MS analysis to identify and quantify their phenolic compounds. A system composed of an Agilent 1200 HPLC with a DAD detector and an MS-detector single-quadrupole Agilent 6110 was used. The following XDB C18 Eclipse column (4.6 × 150 mm, particle size 5 µm) (Agilent Technologies, USA) was selected for the phenolic separation at 25 °C. Two gradients composed of 0.1% acetic acid in distilled water (v/v) (solvent A) and 0.1% acetic acid in acetonitrile (v/v) (solvent B) were used at a flow rate of 0.5 mL/min, following the elution program detailed by Dulf et al. []. A scanning range of 100–1200 m/z in the ESI (+) mode was applied for the MS fragmentation, as well as setting the capillary voltage at 3000 V, 350 °C, and the nitrogen flow at 8 L/min. DAD was used to monitored the eluent, while the spectra of absorbance (200–600 nm) were registered during each run. Agilent ChemStation Software (Rev B.04.02 SP1, Palo Alto, CA, USA) was used to analyze the data. A comparison between the retention times, the visible UV, and the mass spectra of the peaks with 4 reference standards was performed for the accurate and correct identification of each phenolic compound, as follows: the anthocyanins were determined via the cyanidin calibration curve (concentration ranges 10–100 µg/mL), which were reported as cyaniding equivalents (mg cyanidin/g plant material) (r2 = 0.9951); the chlorogenic acid calibration curve (10–50 µg/mL concentrations) was used to quantify the hydroxycinnamic acid compounds (mg chlorogenic acid/g plant material) (r2 = 0.9937); the compounds from the flavonol group were reported as quercetin equivalents (mg quercetin/g plant material) (r2 = 0.9951) using the quercetin calibration curve (10–200 µg/mL concentrations); the compounds of the flavanol subclass were reported as equivalents of catechin (mg catechin/g plant material) (r2 = 0.9985) using the catechin standard for the calibration curve (10–200 µg/mL concentrations).
2.4.2. The Total Content of Phenolics
The total phenolic content (TPC) was determined based on the well-known spectrophotometric Folin–Ciocalteu method [,]. As such, 125 µL Folin–Ciocalteu reagent (0.2 N) was added to 25 µL of leaf extract and mixed with 100 µL sodium carbonate solution (Na2CO3, 7.5% w/v). The obtained mixture was placed in the dark for 2 h at room temperature (25 °C), followed by the absorbance measurement at 760 nm, with ethanol as a blank. To express the TPC of the leaf extracts, a gallic acid calibration curve (0.01–1 mg/mL) was performed, and the results were reported as gallic acid equivalents (GAE) (mg GAE/100 g plant material).
2.4.3. The Total Content of Flavonoids
The spectrophotometric method was used to calculate the total flavonoid content (TFC), following a previously described protocol [], considering the aluminum chloride colorimetric assay and using quercetin as a reference standard. An exact volume of 1 mL leaf extract was added to 0.3 mL NaNO2 (5%) solution, and after 5 min, the addition of 0.3 mL AlCl3 (10%) was performed. In the end, 2 mL NaOH (1M) and water—to a total volume of 10 mL—were added, followed by an immediate absorbance measurement at 510 nm. The results were reported as quercetin equivalents (QE) (mg QE/100 g plant material).
2.4.4. The Total Content of Anthocyanins
The previously described spectrophotometric method [] was used to calculate the total anthocyanin content (TAC). The UV-VIS spectra (Jasco V-530 double beam UV-Visible Spectrophotometer, Tokyo, Japan) were registered for each hydroethanolic extract, at 530 nm. Cyanidin-3-glucoside was used to quantify the anthocyanin content with a molar absorptivity coefficient of 26,900, which was expressed as milligrams per 100 g of plant material [].
2.5. DPPH Antioxidant Capacity
The spectrophotometric method detailed by Ebrahimabadi et al. [] was performed (with a few modifications) to determine the DPPH free-radical–scavenging activity. Therefore, 1750 µL DPPH solution (0.1 mM in 40% ethanol) was mixed with 250 µL hydroethanolic leaf extract, followed by storage in dark and static conditions for 30 min. Afterward, the spectra were registered at 517 nm (Biotek) using 40% ethanol in water as a blank. The percentage inhibition (I%) was determined according to the formula: I% = [(AB − AA)/AB] × 100, where AB = the absorbance of the blank, and AA = the absorbance of the leaf extract.
2.6. Antimicrobial Activity
2.6.1. Microorganisms
The microorganisms used for the antimicrobial testing were received from the Food Biotechnology Laboratory (UASVM Cluj-Napoca, Romania), as follows: Staphylococcus aureus (ATCC 49444), Enterococcus faecalis (ATCC 29212), Rhodococcus equi (ATCC 6939), Pseudomonas aeruginosa (P.A) (ATCC 27853), Klebsiella pneumonia (K.P) (DSMZ 2026), Escherichia coli enterotoxigen (ETEC) (ATCC 25922).
2.6.2. Microdilution Technique
The determination of the antimicrobial capacity followed a slightly adapted version of the guidelines of the Clinical Laboratory Standards Institute (CLSI) []. In brief, Mueller–Hinton agar was used for the bacterial culture, and then stored (4 °C) and subcultured monthly. Before the antibacterial determination, the strains were inoculated on agar plates, followed by their incubation at 37 °C for 24 h. The inoculums (density of 0.5 in the McFarland scale) were adjusted in a 0.9% NaCl sterile solution. Afterward, the bacteria were suspended in the broth (Mueller–Hinton), to reach the targeted density of 2 × 10⁵ CFU/mL, then stored at 4 °C. The minimum inhibitory concentration (MIC) determination was performed via the serial dilution technique (two-fold dilutions) using 96-well plates. Into each well of the 96 well microplate was added 100 µL Mueller-Hinton broth. Samples of 100 µL of every extract (0.1 g/mL concentration) were added and a two-fold dilution was applied. The addition of 10 µL cell suspension was added to every well. The 40% ethanol was used as a control, to report the antimicrobial effect of the sample (phenolics) without the effect provided by the solvent. The microplates’ incubation was performed for 24–48 h at 37 °C. After the incubation, the resazurin solution (20 μL) was added to each well, and then incubated (2 h, 37 °C). When the swift colour change from blue to pink appears—signalling the resazurin reduction—bacterial growth results. The minimum extract concentration that inhibited bacterial growth was defined as MIC [], which obviated the changing of the color. The minimum bactericidal concentration (MBCs) determination were achieved via the serial subcultivation of 2 μL into 96-well plates filled with 100 μL of Mueller-Hinton broth per well, followed by their incubation at 37 °C for 48 h. The lowest extract concentration killed 99.9% of the bacteria; thus, no visible growth was described as MBC []. The positive control used for the bacterial growth was Streptomycin (Sigma P 7794, Santa Clara, CA, USA) (0.05–3 mg/mL), whereas the negative control was water.
2.6.3. Antifungal Test
The antifungal guidelines of the Clinical Laboratory Standards Institute (CLSI) [] were used, but slightly adapted. Three types of fungi were tested: Candida albicans (ATCC 10231), Candida zeylanoides (ATCC 20367), and Candida parapsilosis (ATCC 22019). These strains were received from the Food Biotechnology Laboratory, UASVM Cluj-Napoca, Romania. The fungi were maintained on malt agar at 4 °C and subcultured monthly. The Candida spp. had an initial density of around 2 × 10⁶ CFU/mL. NaCl sterile solution (0.9%) was used to adjust the inoculums to a density of 0.5 on the McFarland scale. Afterward, the studied strains were suspended in broth malt medium, to reach the targeted density of 1.5 × 10⁵ CFU/mL. The microdilution method was applied to determine the minimum inhibitory concentration, by preparing successive dilutions (two-fold dilutions) in 96-well plates. In total, 100 µL medium was placed in every well of the 96-well microplates. Samples of 100 µL of every extract, diluted in 0.85% saline (concentration of 0.1 g/mL), were placed into the first rows of the microplates, followed by two-fold serial dilutions. The 40% ethanol was used as a control, to report the antimicrobial effect of the sample (phenolics) without the effect provided by the solvent. Next, 10 µL of the bacteria suspension was placed in each well, followed by incubation at 28 °C for 72 h, with continuous shaking. The addition of resazurin (20 μL, 0.02%) to each well, and their incubation for 2 h, was performed before the minimum inhibitory concentration (MIC) determination. The MIC definition gives the lowest concentration needed to inhibit the growth of the microorganism. The minimum fungicidal concentration (MFCs) determination was performed via the serial subcultivation of 2 μL of the extracts, following their homogenization into the medium, and inoculation for 72 h into microtiter plates filled with 100 μL of broth/well and additional incubation for 72 h at 28 °C. The MFC was described as the lowest concentration with no visible growth, signifying that 99.9% of the original inoculum was killed. Fungicide fluconazole (1–3500 µg/mL) (Sigma F 8929, Santa Clara, CA, USA) was the positive control, while water was the negative one. All of the tests, in duplicate, were repeated three times.
2.7. Antimutagenic Activity
To test the antimutagenic capacity of the leaf extract, the plate incorporation method [] was used; this method was described in further detail by Sarac and Sen []. The antimutagenic assay involved testing against Salmonella typhimurium TA98 and Salmonella typhimurium TA100. Positive controls were used for each type of strain: in the case of TA98, 4-nitro-ophenylenediamine (4-NPD, 3 mg/plate) was established, and in the case of TA100, sodium azide (NaN3, 8 mg/plate) was used. The ethanol:water (1:1, v/v) was the negative control for both strains. The leaf extract’s concentration was 5 mg/plate. In agreement with the equation presented by Ong et al. [], there is the following antimutagenicity equation for establishing the inhibition percentage: %Inhibition = [1 − T/M] × 100, where T represents the number of revertants per plate when the mutagen and the leaf extract are present, and M represents the number of revertants per plate with no leaf extract (positive control).
In the absence of the leaf extracts, the antimutagenicity of the reference mutagens was reported as 0% inhibition, whereas in the presence of the extracts, the antimutagenicity was expressed accordingly: strong for 40% or more inhibition; moderate for 25–40% inhibition; low/none for 25% or less inhibition []. The assay was performed in duplicate with three subsamples each, and the data is reported as the mean ± standard deviation (SD).
2.8. Statistical Interpretations of Results
The data were registered as the means ± standard deviation (SD), after performing the analysis in triplicate. A one-way ANOVA via Tukey multiple comparison tests (software GraphPad Prism Version 8.0.1, Graph Pad Software Inc., San Diego, CA, USA) was applied to estimate the statistical differences between the leaf extracts of the six cultivars. Statistically significant differences between the means were reported at the 5% level.
3. Results and Discussion
3.1. Phenolic Profile of the Leaf Extracts from the Six Blueberry Varieties
In the leaves of the six Romanian blueberry cultivars were identified 19 phenolic compounds belonging to four phenolic classes: hydroxycinnamic acids, flavonols, flavanols, and anthocyanins (Table 1). The 4 hydroxycinnamic acids identified were: chlorogenic acid (5-caffeoylquinic acid), caffeic acid, feruloylquinic acid, and dicaffeoylquinic acid. Among the flavanols group, six compounds were detected: gallocatechin, catechin, epicatechin, procyanidin dimer I, procyanidin dimer II, procyanidin trimer. Furthermore, in the flavonols group, six compounds were detected, namely: quercetin-rutinoside (Rutin), quercetin-glucoside, quercetin-acetyl-rhamnoside, quercetin-arabinoside, quercetin-diglucoside, and quercetin. The anthocyanins subclass was represented by three compounds: cyanidin-glucoside, cyanidin-arabinoside, and cyanidin-acetyl-glucoside. These results are similar to the findings of Wang et al. [], wherein 104 blueberry cultivars were studied. The HPLC-DAD-ESI-MS analysis of the methanolic extracts reported anthocyanins, flavonols, hydroxycinnamic acids, and proanthocyanidin; these findings are in accordance with the results of Riihinen et al. [].

Table 1.
Identification of the phenolic compounds from the flavonoid class (flavanols, flavonols, and anthocyanins) and hydroxycinnamic acids class in the leaf extracts of the blueberry varieties.
The best-represented subclasses in terms of the number of phenolic compounds were flavanols and flavonols, while the most abundant group in terms of the highest levels, for all six varieties, were hydroxycinnamic acids. The second most abundant class was flavanols, followed closely by flavonols. In Table 2, below, are identified and quantified all of the individual phenolic compounds in the leaf extracts of all of the six blueberry varieties.
Table 2.
The content of individual phenolic compounds in the leaf extracts of the six blueberry varieties, using HPLC-MS and expressed as mg/g.
Among all of the phenolic compounds identified, the feruloylquinic acid from the hydroxycinnamic group had the highest amount, ranging from 19.23 ± 0.18 mg/g (as the lowest level, registred for the Spartan variety) and 49.62 ± 0.41 mg/g (as highest level, registered for the Nelson variety). The Toro variety was placed second, with a concentration of feruloylquinic acid of 44.43 ± 0.37 mg/g. Chlorogenic acid was the minor compound identified within this group, among all the six varieties, with values of <1.5 mg/g. Interestingly, in the study of Wang et al. [], the chlorogenic acids were the most abundant phenolic compounds in the leaves of different blueberry cultivars. Possible explanations could be found in the varieties studied (104 cultivars), extraction method, time of harvesting, or geographical area.
In the case of dicaffeoylquinic acid, again, the Nelson variety had the highest level (10.18 ± 0.11 mg/g), followed by the Elliot and Toro varieties. For caffeic acid, Elliot and Nelson registered similar amounts of >5 mg/g, these being he highest concentrations found.
Regarding the flavonols group, also called quercetin derivates, the major phenolic compound identified was rutin (quercetin-rutinoside), whereas the highest values were registered by Toro, Nelson, and Elliot leaves, with 35.77 ± 0.19 mg/g, 32.50 ± 0.20 mg/g, and 31.53 ± 0.1 mg/g, respectively. The lowest value was again reported for the Spartan variety, being found in half the amount of the highest level. The second major compound identified among the flavonols was quercetin–glucoside, being 10-fold lower than rutin. However, the Toro variety registered the highest value, at precisely 6.70 ± 0.08 mg/g. The rest of the varieties’ reported values ranged between 2–3.5 mg/g. Quercetin-arabinoside was found to be specific for Spartan leaves—and was missing in the other varieties studied—but in a small amount. Traces of quercetin-diglucoside were found in Elliot and Toro leaves. The highest quercetin amounts were identified in Spartan, Toro, and Nelson leaves, with 3.69 ± 0.04 mg/g, 3.68 ± 0.04 mg/g, and 3.56 ± 0.02 mg/g, respectively. In the study of Riihinen et al. [], the red leaves of the Northblue blueberry (V. corymbosum) contained similar flavonols and hydroxycinnamic acids.
In the flavanols group, the procyanidin dimer II and procyanidin trimer were found in remarkable amounts for all the six varieties’ leaves. Compared to the other two phenolic groups discussed above, Nelson variety leaves presented the lowest amount of procyanidin dimer II (3.92 ± 0.03 mg/g), whereas the Spartan leaves registered the highest value (17.15 ± 0.15 mg/g), followed by Toro and Elliot. Regarding the procyanidin trimer compound, Toro leaves were top-leveled, with an amount of 15.99 ± 0.22 mg/g. The other varieties’ leaves contained half this amount less, except the Nelson variety, which registered 12.27 ± 0.15 mg/g. The epicatechin and procyanidin dimer I were identified only in the leaves of the Elliot variety in significant amounts, precisely 4.19 ± 0.03 mg/g and 3.69 ± 0.04 mg/g, respectively. Concerning gallocatechin and catechin compounds, the highest value was identified in Toro leaves, followed by Elliot and Spartan leaves. In the study of Wang et al. [] were reported four proanthocyanidins, but in low concentrations, in V. corymbosum leaves (0.36–8.38 mg rutin equivalents/g dry weight). The leaves of V. corymbosum from Drama [] presented the following phenolic profile: quinic and caffeic acid, proanthocyanidin B1/B2, myricetin glycosides, kaempferol rutinoside, and quercetin glycosides and quercetin aglycone, whereas rutin was among the principal flavonoids (12.09 mg/g, 4.60 mg/g). The absence of anthocyanins from the extract was reported. Another study [] reported prodelphinidins and procyanidins in the same quantity in the red and green leaves of V. corymbosum (0.468–0.485 mg/g frozen sample).
The anthocyanins group, represented by the three cyanidin derivates, were present only in small amounts, precisely <1 mg/g, for only three varieties: Toro, Elliot, and Spartan. The order is representative of the descending amounts. These compounds are reported to be responsible for the red colour of the leaves. These results follow the findings of Wang et al. [], who also identified three anthocyanins (cyanidin 3-O-glucoside, cyanidin 3-O-glucuronide, cyanidin 3-O- arabinoside) in the blueberry leaf methanolic extracts. The blueberry study of Riihinen et al. [] investigated both green and red, wherein the anthocyanins were present only in red leaves—precisely, cyanidin-glycosides (62 µg/g frozen sample)—and were absent in the green ones. In the study of Li et al. [], 13 anthocyanins were identified and quantified in six blueberry varieties, including Duke, Bluecrop, and Spartan, suggesting that blueberry fruits are richer in anthocyanins than their counterpart leaves.
According to Riihinen et al. [], leaf tissue maturation is a determining factor in the blueberry’s phytochemical composition. In his study, the red leaves of V. corymbosum were reported to have increased levels of flavonols and hydroxycinnamic acids (quercetin, kaempferol, p-coumaric, caffeic and ferulic acids) compared to the green ones, concluding the possible role of solar radiation in photoprotection [].
Knowledge of the pharmacologically active phenolics inside the plant, including leaves, and the understanding of their mechanism of action will support the development of genetically enhanced cancer-fighting plants.
3.2. Total Phenolic and Total Flavonoid Contents
The TPCs of the six blueberry varieties’ leaves are illustrated in Figure 1A. The Nelson and Toro cultivars registered the highest TPC, precisely 13,555 mg GAE/100 g leaf material and 13,292 mg GAE/100 g leaf material). Among Elliot, Duke and Spartan, there were no significant differences for TPC. As observed from the HPLC analysis, the Toro and Nelson leaf varieties registered with the highest levels for almost all of the individual phenolic compounds. The study of Routray and Orsat [] investigated the influence of harvest time (May, July, September, and October) on the phytochemical composition of North American highbush blueberry leaves (Nelson and Elliot varieties). The phenolic content started increasing in September and October, reaching in September 105.204 ± 3.826 mg GAE/g dry matter (Nelson) and 120.962 ± 1.420 mg GAE/g dry matter (Elliot). However, the highest quantity of phenolic compounds was observed in October, with similar amounts for both varieties (152.356 ± 3.369 mg GAE/g dry matter for Nelson and 155.830 ± 2.103 mg GAE/g dry matter for Elliot). These results are opposite to our findings, considering that Nelson leaves had a higher amount of TPC than Elliot, but on the same range considering the amounts. The explanation could be supported by the differences in the geographical areas; precisely, the different habitat of these varieties. When compared to blueberry fruits, the leaves possess 10-fold higher levels of TPC, according to the range of values reported by Li et al. [] for different blueberries cultivars, namely 154.7 ± 1.01 mg 100 GAE g‒1 FW (Northland) and 398.0 ± 5.8 mg GAE 100 g‒1 FW (Puru).
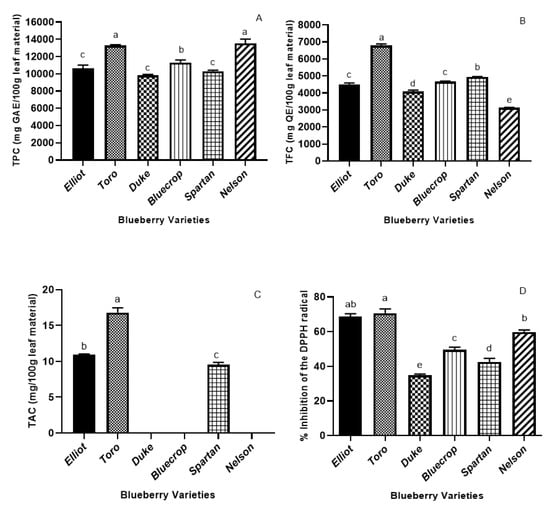
Figure 1.
Total phenolic content (Folin–Ciocalteu method) (A), total flavonoid content (B), total anthocyanin content (C), and DPPH antioxidant activity (D) of the leaf extracts from the six commercial blueberry varieties. The total phenolic content of the extract is expressed as gallic acid equivalents (GAE) in mg/100 g leaf material. The total flavonoid content is expressed as quercetin equivalents (QE) in mg/100 g leaf material. Values (means ± SD, n = 3) followed by different letters (a–e) indicate significant differences (p < 0.05) between the six varieties (One-way ANOVA-Tukey multiple range tests).
The TFCs of the leaf extracts of all the six varieties are presented in Figure 1B. Toro leaves registered the highest level, precisely 6788 mg QE/100 g leaf material, followed by the Spartan variety, with a 1.5-fold lower level. The Nelson variety registered the lowest level of TFC (3136 mg QE/100 g leaf material), whereas Bluecrop and Elliot leaves presented no significant differences between their TFC. According to the recent study of Li et al. [], where 13 cultivars of half-bush and highbush blueberries were investigated, the total flavonoid content ranged from 161.7 ± 3.2 mg QE 100 g‒1 FW in Puru to 512.3 ± 4.3 mg QE 100 g‒1 FW in Bluecrop. Therefore, we can conclude that the leaves of the blueberry are richer in flavonoids than their counterpart fruits.
In many blueberries studies, the TFC was significantly higher when compared to the TPC. A possible explanation may be derived from the TPC assay used, as an overestimation of TPC may arise due to other substances’ interference, such as the existence of the nonphenolic components in the extract [].
The TPC and TFC results were correlated with the ones of the DPPH assay so that a correlation can be achieved between the antioxidants and the antioxidant capacity. As illustrated in Figure 1A,B,D, the Toro, Elliot, and Nelson varieties registered the highest TPC and TFC values—a fact which is reflected in their highest DPPH activity (D). The positive correlations between the DPPH antioxidant assay and the phenolics content suggest that the phenolic compounds present in ultrasound-assisted ethanolic extractions have a strong contribution to the antioxidant activity.
3.3. Total Anthocyanins Content
The total anthocyanin content is displayed in Figure 1C. Following the HPLC analysis, only the Toro, Elliot, and Spartan leaf varieties have shown any anthocyanin content. There were significant differences among the cultivars; Toro leaves had the highest TAC (16.81 mg/100 g leaf material), and the Spartan variety the lowest (9.55 mg/100 g leaf material). Wang et al. [] reported that the TAC of blueberry fruits was ten times higher than that of the leaves, (0.09–4.4 mg cyanidin 3-O-glucoside equivalents/g dry weight). However, some cultivars had no anthocyanin content, which is in line with our findings. In the study of Routray and Orsat [], the TPC pattern was also similar for the TAC and antioxidant activity for two cultivars (Nelson and Elliot)—precisely, a higher content in September and October, with Elliot coming first. These findings match ours, considering that the Toro variety registered the highest TPC, TAC and DPPH activity. In another piece of research [], the geographical variation of anthocyanins in some blueberries varieties—including Duke, Bluecrop, and Spartan—was investigated, wherein the cultivar and climatic factors were reported to have a significant influence in the proportions of each anthocyanin.
3.4. DPPH Radical Scavenging Activity
One of the needed features of an antioxidant is its capacity to counteract radical-induced oxidative stress. The antioxidant molecule should react against the radical and result in antioxidant radicals. To evaluate the radical scavenging of the leaves from the six Romanian blueberry varieties, reactions of DPPH radicals with the extracts were performed. The results of the DPPH antioxidant activity analysis are shown in Figure 1D. The Toro and Elliot cultivars registered the highest percentage inhibition of DPPH radicals (70.41% and 68.42%, respectively), followed by Nelson leaves (58.69%). There were significant differences between the antioxidant capacities among all of the cultivars, with Duke leaves as the poorest source of antioxidants. Overall, the cultivars Toro, Elliot, and Nelson appear to be good sources of antioxidants.
In the existing literature, the antioxidant capacity was statistically correlated with TPC, TFC, and TAC, indicating that the polyphenols have a significant role in the antioxidant activity [,,,]. Therefore, the Toro, Elliot, and Nelson varieties, with their higher polyphenolic content, may deliver a greater range of antioxidants, being valuable cultivars for production, research, and health benefits.
The rich phenolics composition in blueberry leaves was correlated to their antioxidant activities []. In line with these results, Ferlemi et al. [] demonstrated the strong antioxidant potential of the V. corymbosum leaf. The study of Wang et al. [] investigated the polyphenolic composition and antioxidant activities in the leaves of blueberry cultivars. The DPPH, ABTS+, and FRAP results demonstrated that the antioxidant activities of most rabbiteye blueberry cultivars were generally higher than those of highbush varieties.
Numerous plant-derived antioxidant compounds have been used in medical and pharmaceutical products for replacing artificial antioxidants, as the latest research has underlined their potential negative role in carcinogenesis [].
3.5. Evaluation of the Antimicrobial Activity
All of the blueberry leaf varieties have been tested for their antibacterial and antifungal capacity against several strains, selected based on their relevance in the health and food sectors. Table 3 presents the results of MIC, and Table 4 the results of MBC/MFC. Significant antimicrobial effects were registered in all six cultivars’ leaf extracts, depending on the tested strain: Gram-positive, Gram-negative, or fungi.
Table 3.
Minimum inhibitory concentration (MIC) of leaf extracts from the six Romanian blueberry varieties, expressed as mg/mL.
Table 4.
Minimum bactericidal concentration (MBC/MFC) of the leaf extracts from the six Romanian blueberry varieties, expressed as mg/mL.
Regarding the Gram-positive bacteria, the highest sensitivity was registered by Rhodococcus equi, whereas all the six cultivars’ leaves had the same—precisely, the highest inhibitory effect (MIC = 0.06 and MBC = 0.12 mg/mL). The Staphylococcus aureus and Enterococcus faecalis strains were not as sensitive as Rhodococcus equi. Towards Staphylococcus aureus, Toro and Spartan varieties registered the highest antibacterial potential (MIC = 0.06 and MBC = 0.12 mg/mL), followed by Elliot, Nelson, and Bluecrop (MIC = 0.12 and MBC = 0.24 mg/mL). The Enterococcus faecalis strain was the most resistant to all six cultivars’ extracts, whereas, Toro, Elliot, Spartan, and Nelson inhibited the most (MIC = 0.12 and MBC = 0.24) when compared to the control and the other varieties. These findings may be explained by the highest amount in TPC, TFC, and TAC of Toro variety, the same TPC level for Nelson variety, and the high TFC and TAC values for the Elliot and Spartan varieties, considering the evidences on polyphenols’ roles in the antimicrobial activity of natural extracts—precisely, certain interactions between polyphenols and bacterial cell surfaces, and the derived antimicrobial effect [].
In the case of the Gram-negative strains, the highest sensitivity was reported for Klebsiella pneumonia, whereas all of the varieties, except Bluecrop, had the highest inhibitory capacity (MIC = 0.12 and MBC = 0.24 mg/mL). The Pseudomonas aeruginosa strain was the most resistant towards the extracts’ inhibitory effects, whereas the minimum inhibitory concentration registered was 0.24 (mg/mL) for three cultivars—precisely Elliot, Nelson, and Bluecrop—while Toro and Spartan leaf extracts registered the lowest antibacterial effect (MIC = 1.92 and MBC = 3.84 mg/mL). Towards the Gram-negative bacterium Escherichia coli enterotoxigen, all of the six varieties’ extracts had the same inhibition capacity (MIC = 0.48 and MBC = 0.96 mg/mL). Overall, the Toro leaves, probably due to their higher phenolic content and higher antioxidant activity, exhibited the highest inhibitory results towards all the strains, except Pseudomonas aeruginosa, closely followed by Elliot and Nelson varieties. Our results also suggest that the Gram-negative bacteria are more resistant to the leaf extracts than Gram-negative bacteria. Based on the literature, the strongly-manifested antimicrobial mechanism of phenolics is considered to rely on the cytoplasmic membrane, and the existence of an extra lipidic membrane for the Gram-negative bacteria may give rise to a stronger protection mechanism [], and therefore higher resistance.
According to the existing literature, highbush blueberry leaf extracts proved to have a good antimicrobial capacity, mostly towards Salmonella typhymurium and Enterococcus faecalis []. The antimicrobial capacity of the blueberry extracts was reported towards a range of strains. Silva et al. [] reported that the blueberry leaf extract had antimicrobial effects on Staphylococcus aureus, Salmonella enteritidis, Enterococcus faecium, Listeria innocua, and Bacillus cereus. The assay implied the determination of the MIC and MBC. In the same study, the antimicrobial capacity of blueberry leaves was compared to those of the fruits, and it was reported that the leaf extracts had the highest activity [].
Furthermore, the hydroalcoholic blueberry leaf extracts were tested for their antimicrobial capacity [], whereas the disk diffusion method was applied towards Gram-negative bacteria—precisely, Escherichia coli, Pseudomonas aeruginosa, Salmonella typhimurium, Acetobacter baumannii, and Klebsiella pneumoniae—and Gram-positive bacteria, such as Staphylococcus aureus and Enterococcus faecalis. The findings showed an antimicrobial inhibition of all of the tested bacteria by the blueberry leaf extracts. More precisely, a 5 mg/disc of the extract showed an inhibition zone with a diameter ranging between 8.37, for Escherichia coli, and 16.67, for Salmonella typhimurium. The 10 mg/disc of the extract increased the range of the diameters for the inhibition zone to between 14.08, for Enterococcus faecalis, and 23.18 for Salmonella typhimurium [].
Regarding the antifungal capacity, all of the cultivars had no effect against Candida albicans (MIC = 125 and MFC = 250 mg/mL), in comparison with the control Fluconazole (MIC = 15.62 and MFC = 31.25 mg/mL), Candida parapsilosis (MIC = 31.25 and MFC = 62.5) was the most sensitive. Towards Candida zeylanoides, the highest antifungal activity was reported for the Bluecrop variety (MIC = 31.25 and MFC = 62.5 mg/mL), whereas all of the other five varieties showed the same antifungal effect (MIC = 62.5 and MFC = 125 mg/mL). Comparing the three fungi, Candida parapsilosis was the most sensitive; therefore, it could be stated that the six Romanian varieties have a fungi-dependent antifungal effect.
3.6. Evaluation of the Antimutagenic Capacity of Romanian Blueberry Cultivars
The plant’s antimutagenic properties are of major interest in pharmaceutical and medical applications, as the latest research has underlined the key role of mutation in carcinogenesis []. The leaf extracts belonging to the six Romanian blueberry varieties were tested for their antimutagenic capacity, starting from the findings reported in our recent review concerning their valuable antioxidant potential []. The results are presented in Table 5 below.
Table 5.
Antimutagenic activity.
Regarding the Salmonella typhimurium TA98, the leaf extracts of half of the tested cultivars significantly inhibited the TA98 strain. Moderate inhibition (25–40%) was registered by the Toro, Spartan, and Bluecrop varieties; the Toro leaves showed the highest inhibition percentage (32.98%). These findings might be explained by the highest scavenging capacity registered by Toro, considering that the literature reported a strong correlation between antioxidant capacity and the antimutagenic activity of plant extracts []. Moreover, the Spartan variety registered the second-highest TFC, and was among the three varieties (including Toro) with TAC values, aspects that might contribute to their antimutagenic effect. According to the method, a value below 25% is considered low/no inhibition; therefore, we can state that Elliot (19.07%), Duke (21.64%), and Nelson (22.16%) had no antimutagenic activity towards TA98.
Concerning TA100, all of the leaf extracts from the six varieties showed a high antimutagenic inhibition, indicating that Salmonella typhimurium TA100 was not as resistant to blueberry leaf extracts as TA98. According to Table 5, all of the leaf cultivars registered a moderate inhibitory capacity (25–40%), whereas the highest inhibition percentage was exhibited by Toro leaf (38.68%) extract, closely followed by Duke (36.67%) and Bluecrop (35.81%) extracts. The lowest inhibition percentage (27.22%) was exhibited by the Nelson variety.
In the case of both strains, the antimutagenic effects could be linked to a high content of flavanols and flavonols, considering the evidence on flavonoids and decreased mutagenic activity of the standard mutagens. Based on our knowledge, the antimutagenic evaluation of leaves from commercial blueberry cultivars has never been the subject of a research paper; therefore, this has valuable novelty for the current knowledge in the field. Besides this, the literature is poor in studies evaluating this specific features of blueberry fruits or/and leaves. In the study of Smith et al. [], the antimutagenic capacity of several berries was evaluated, including the rabbiteye blueberry, the Tifblue cultivar, and the Premier cultivar. The reported antimutagenic inhibition was 24% for the Premier cultivar in ethanol anthocyanin-rich extract, and 34% in methanol extract, while for the Tifblue cultivar, it was 43% in ethanol anthocyanin-rich extract. Considering the recent review paper on flavonoids’ bioactivity [], the plant flavonoids contribute significantly to the antimutagenic capacity.
Based on our findings, the leaf extracts of the six Romanian cultivars do have a significant content of phenolic compounds, with a possible role in the biological profile of the tested hydroethanolic extracts. Moreover, they also contain procyanidins, which are well-known for their good antioxidant capacity, with direct impact in both in vitro and in vivo antibacterial and antimutagenic capacities []. These findings underline these leaves’ potential as a safe and useful alternative for the prevention of mutations, and as a promising source of antimutagenic compounds.
The first step in cancer formation is damage occurring to the genome of a somatic cell, resulting in a mutation in an oncogene or a tumor-suppressor gene. Therefore, the ability to inhibit the production of mutations by different direct-acting mutagens is an important step in the use of plant extracts in medical applications, such as cancer prevention []. Moreover, as flavonoids can support apoptosis in different cancer cells, in particular, quercetin represents an important anticancer compound against prostate and breast cancers [,].
4. Conclusions
In summary, the overall results suggest that blueberry leaf extracts are a rich source of potent phenolic antioxidants. Our findings have demonstrated that, whilst they are detrimental to several controlled environmental factors (soil, irrigation) and have only one growing season, cultivars significantly influence the phenolic composition and content, and the antioxidant and antimutagenic capacities of V. corymbosum L. leaves, whereas the antimicrobial activity was mostly strain-dependent. However, other stress factors, such as temperature and solar exposition, had their particular influence in the polyphenolic synthesis, but were not investigated in the present paper. The findings regarding the phenolic compounds indicated that even whilst they are similar for all of the six cultivars, the concentrations and proportions differ, whereas anthocyanins were found only in half of the examined varieties leaves. The best-represented subclasses in terms of the number of phenolic compounds were flavanols and flavonols, with rutin as the major compound, while the most abundant group in terms of the highest levels, for all six varieties, was represented by hydroxycinnamic with feruloylquinic acid as the major compound. Toro, Elliot, and Nelson had higher antioxidant capacities than the other three cultivars. Blueberry leaf extracts had high antibacterial activity and less antifungal capacity, and significant antimutagenic capacity towards Salmonella typhimurium TA98 and TA100 strains, with Toro leaf as the best candidate. This study contributes to the current knowledge in the field of the blueberry leaf’s chemical and biological profile, exploring the most commercialized varieties, offering alternative sources of health-related compounds for the medical and pharmaceutical sectors.
Author Contributions
Conceptualization, B.-E.Ș., and G.C.; methodology, F.R., F.F., and B.-E.Ș.; software, L.F.C.; validation, G.C., A.M., and D.C.V.; investigation, B.-E.Ș.; resources, D.C.V.; writing—original draft preparation, B.-E.Ș., and L.F.C.; writing—review and editing, G.C., A.M., D.C.V.; supervision, G.C.; project administration, D.C.V.; funding acquisition, D.C.V. All authors have read and agreed to the published version of the manuscript.
Funding
This research was funded by MCI-UEFISCDI, grant number 2 PCCDI, Project PN-III-P1-1.2-PCCDI-2017-0056, and the publication was funded by 37 PFE.
Conflicts of Interest
The authors declare no conflict of interest.
References
- Circu, M.L.; Aw, T.Y. Reactive oxygen species, cellular redox systems, and apoptosis. Free Radic. Biol. Med. 2010, 48, 749–762. [Google Scholar] [CrossRef] [PubMed]
- Jeong, E.-M.; Liu, M.; Sturdy, M.; Gao, G.; Varghese, S.T.; Sovari, A.A.; Dudley, S.C. Metabolic stress, reactive oxygen species, and arrhythmia. J. Mol. Cell. Cardiol. 2012, 52, 454–463. [Google Scholar] [CrossRef] [PubMed]
- Călinoiu, L.F.; Cătoi, A.-F.; Vodnar, D.C. Solid-State Yeast Fermented Wheat and Oat Bran as A Route for Delivery of Antioxidants. Antioxidants 2019, 8, 372. [Google Scholar] [CrossRef]
- Theuretzbacher, U. Resistance drives antibacterial drug development. Curr. Opin. Pharmacol. 2011, 11, 433–438. [Google Scholar] [CrossRef] [PubMed]
- Carocho, M.; Morales, P.; Ferreira, I.C.F.R. Natural food additives: Quo vadis? Trends Food Sci. Technol. 2015, 45, 284–295. [Google Scholar] [CrossRef]
- Popescu, R.A.; Magyari, K.; Vulpoi, A.; Trandafir, D.L.; Licarete, E.; Todea, M.; Ştefan, R.; Voica, C.; Vodnar, D.C.; Simon, S.; et al. Bioactive and biocompatible copper containing glass-ceramics with remarkable antibacterial properties and high cell viability designed for future in vivo trials. Biomater. Sci. 2016, 4, 1252–1265. [Google Scholar] [CrossRef]
- Dulf, F.V.; Vodnar, D.C.; Dulf, E.-H.; Diaconeasa, Z.; Socaciu, C. Liberation and recovery of phenolic antioxidants and lipids in chokeberry (Aronia melanocarpa) pomace by solid-state bioprocessing using Aspergillus niger and Rhizopus oligosporus strains. LWT Food Sci. Technol. 2018, 87, 241–249. [Google Scholar] [CrossRef]
- Szabo, K.; Teleky, B.-E.; Mitrea, L.; Călinoiu, L.-F.; Martău, G.-A.; Simon, E.; Varvara, R.-A.; Vodnar, D.C. Active Packaging—Poly(Vinyl Alcohol) Films Enriched with Tomato By-Products Extract. Coatings 2020, 10, 141. [Google Scholar] [CrossRef]
- Calinoiu, L.F.; Farcas, A.; Socaci, S.; Vodnar, D.C. Innovative Sources; Galanakis, C.M., Ed.; Academic Press Ltd-Elsevier Science Ltd.: London, UK, 2019; pp. 235–265. ISBN 978-0-12-817516-3. [Google Scholar]
- Calinoiu, L.-F.; Mitrea, L.; Precup, G.; Bindea, M.; Rusu, B.; Dulf, F.-V.; Stefanescu, B.-E.; Vodnar, D.-C. Characterization of Grape and Apple Peel Wastes’ Bioactive Compounds and Their Increased Bioavailability After Exposure to Thermal Process. Bull. Univ. Agric. Sci. Vet. Med. Cluj Napoca Food Sci. Technol. 2017, 74, 80–89. [Google Scholar] [CrossRef][Green Version]
- Călinoiu, L.F.; Vodnar, D.C. Whole Grains and Phenolic Acids: A Review on Bioactivity, Functionality, Health Benefits and Bioavailability. Nutrients 2018, 10, 1615. [Google Scholar] [CrossRef]
- Vodnar, D.C.; Venus, J.; Schneider, R.; Socaciu, C. Lactic Acid Production by Lactobacillus paracasei 168 in Discontinuous Fermentation Using Lucerne Green juice as Nutrient Substitute. Chem. Eng. Technol. 2010, 33, 468–474. [Google Scholar] [CrossRef]
- Vodnar, D.C.; Socaciu, C.; Rotar, A.M.; Stãnilã, A. Morphology, FTIR fingerprint and survivability of encapsulated lactic bacteria (Streptococcus thermophilus and Lactobacillus delbrueckii subsp. bulgaricus) in simulated gastric juice and intestinal juice. Int. J. Food Sci. Technol. 2010, 45, 2345–2351. [Google Scholar] [CrossRef]
- Oyedemi, S.O.; Afolayan, A.J. Antibacterial and antioxidant activities of hydroalcoholic stem bark extract of Schotia latifolia Jacq. Asian Pac. J. Trop. Med. 2011, 4, 952–958. [Google Scholar] [CrossRef]
- Călinoiu, L.F.; Vodnar, D.C. Thermal Processing for the Release of Phenolic Compounds from Wheat and Oat Bran. Biomolecules 2020, 10, 21. [Google Scholar] [CrossRef] [PubMed]
- Jellin, J.M.; Batz, F.; Hitchens, K. Natural Medicines Comprehensive Database, 5th ed.; Therapeutic Research Faculty: Stockton, CA, USA, 2003. [Google Scholar]
- Haddad, P.S.; Depot, M.; Settaf, A.; Chabli, A.; Cherrah, Y. Comparative Study on the Medicinal Plants Most Recommended by Traditional Practitioners in Morocco and Canada. J. Herbs Spices Med. Plants 2003, 10, 25–45. [Google Scholar] [CrossRef]
- Barnes, J.S.; Nguyen, H.P.; Shen, S.; Schug, K.A. General method for extraction of blueberry anthocyanins and identification using high performance liquid chromatography-electrospray ionization-ion trap-time of flight-mass spectrometry. J. Chromatogr. A 2009, 1216, 4728–4735. [Google Scholar] [CrossRef]
- Giovanelli, G.; Brambilla, A.; Rizzolo, A.; Sinelli, N. Effects of blanching pre-treatment and sugar composition of the osmotic solution on physico-chemical, morphological and antioxidant characteristics of osmodehydrated blueberries (Vaccinium corymbosum L.). Food Res. Int. 2012, 49, 263–271. [Google Scholar] [CrossRef]
- Sinelli, N.; Spinardi, A.; Di Egidio, V.; Mignani, I.; Casiraghi, E. Evaluation of quality and nutraceutical content of blueberries (Vaccinium corymbosum L.) by near and mid-infrared spectroscopy. Postharvest Biol. Technol. 2008, 50, 31–36. [Google Scholar] [CrossRef]
- Lohachoompol, V.; Mulholland, M.; Srzednicki, G.; Craske, J. Determination of anthocyanins in various cultivars of highbush and rabbiteye blueberries. Food Chem. 2008, 111, 249–254. [Google Scholar] [CrossRef]
- Ștefănescu, B.E.; Szabo, K.; Mocan, A.; Crişan, G. Phenolic Compounds from Five Ericaceae Species Leaves and Their Related Bioavailability and Health Benefits. Molecules 2019, 24, 2046. [Google Scholar] [CrossRef]
- Gavrilova, V.; Kajdžanoska, M.; Gjamovski, V.; Stefova, M. Separation, Characterization and Quantification of Phenolic Compounds in Blueberries and Red and Black Currants by HPLC−DAD−ESI-MSn. J. Agric. Food Chem. 2011, 59, 4009–4018. [Google Scholar] [CrossRef] [PubMed]
- Li, D.; Li, B.; Ma, Y.; Sun, X.; Lin, Y.; Meng, X. Polyphenols, anthocyanins, and flavonoids contents and the antioxidant capacity of various cultivars of highbush and half-high blueberries. J. Food Compos. Anal. 2017, 62, 84–93. [Google Scholar] [CrossRef]
- Wang, H.; Guo, X.; Hu, X.; Li, T.; Fu, X.; Liu, R.H. Comparison of phytochemical profiles, antioxidant and cellular antioxidant activities of different varieties of blueberry (Vaccinium spp.). Food Chem. 2017, 217, 773–781. [Google Scholar] [CrossRef]
- Hope Smith, S.; Tate, P.L.; Huang, G.; Magee, J.B.; Meepagala, K.M.; Wedge, D.E.; Larcom, L.L. Antimutagenic activity of berry extracts. J. Med. Food 2004, 7, 450–455. [Google Scholar] [CrossRef]
- Mazur, W.M.; Uehara, M.; Wähälä, K.; Adlercreutz, H. Phyto-oestrogen content of berries, and plasma concentrations and urinary excretion of enterolactone after a single strawberry-meal in human subjects. Br. J. Nutr. 2000, 83, 381–387. [Google Scholar] [PubMed]
- Wang, Y.; Chang, C.-F.; Chou, J.; Chen, H.-L.; Deng, X.; Harvey, B.K.; Cadet, J.L.; Bickford, P.C. Dietary supplementation with blueberries, spinach, or spirulina reduces ischemic brain damage. Exp. Neurol. 2005, 193, 75–84. [Google Scholar] [CrossRef]
- Ofek, I.; Goldhar, J.; Sharon, N. Anti-Escherichia coli adhesin activity of cranberry and blueberry juices. Adv. Exp. Med. Biol. 1996, 408, 179–183. [Google Scholar] [CrossRef]
- Joseph, J.A.; Shukitt-Hale, B.; Denisova, N.A.; Bielinski, D.; Martin, A.; McEwen, J.J.; Bickford, P.C. Reversals of age-related declines in neuronal signal transduction, cognitive, and motor behavioral deficits with blueberry, spinach, or strawberry dietary supplementation. J. Neurosci. Off. J. Soc. Neurosci. 1999, 19, 8114–8121. [Google Scholar] [CrossRef]
- Diaconeasa, Z.; Leopold, L.; Rugină, D.; Ayvaz, H.; Socaciu, C. Antiproliferative and Antioxidant Properties of Anthocyanin Rich Extracts from Blueberry and Blackcurrant Juice. Int. J. Mol. Sci. 2015, 16, 2352–2365. [Google Scholar] [CrossRef]
- Kraujalytė, V.; Venskutonis, P.R.; Pukalskas, A.; Česonienė, L.; Daubaras, R. Antioxidant properties, phenolic composition and potentiometric sensor array evaluation of commercial and new blueberry (Vaccinium corymbosum) and bog blueberry (Vaccinium uliginosum) genotypes. Food Chem. 2015, 188, 583–590. [Google Scholar] [CrossRef]
- WHO. Promoting Fruit and Vegetable Consumption around the World. Available online: https://www.who.int/dietphysicalactivity/fruit/en/ (accessed on 24 April 2020).
- Brambilla, A.; Lo Scalzo, R.; Bertolo, G.; Torreggiani, D. Steam-Blanched Highbush Blueberry (Vaccinium corymbosum L.) Juice: Phenolic Profile and Antioxidant Capacity in Relation to Cultivar Selection. J. Agric. Food Chem. 2008, 56, 2643–2648. [Google Scholar] [CrossRef]
- Piljac-Žegarac, J.; Belščak, A.; Piljac, A. Antioxidant Capacity and Polyphenolic Content of Blueberry (Vaccinium corymbosum L.) Leaf Infusions. J. Med. Food 2009, 12, 608–614. [Google Scholar] [CrossRef] [PubMed]
- Riihinen, K.; Jaakola, L.; Kärenlampi, S.; Hohtola, A. Organ-specific distribution of phenolic compounds in bilberry (Vaccinium myrtillus) and ‘northblue’ blueberry (Vaccinium corymbosum x V. angustifolium). Food Chem. 2008, 110, 156–160. [Google Scholar] [CrossRef] [PubMed]
- Wang, S.Y.; Chen, C.-T.; Sciarappa, W.; Wang, C.Y.; Camp, M.J. Fruit quality, antioxidant capacity, and flavonoid content of organically and conventionally grown blueberries. J. Agric. Food Chem. 2008, 56, 5788–5794. [Google Scholar] [CrossRef] [PubMed]
- Giovanelli, G.; Buratti, S. Comparison of polyphenolic composition and antioxidant activity of wild Italian blueberries and some cultivated varieties. Food Chem. 2009, 112, 903–908. [Google Scholar] [CrossRef]
- Bunea, A.; Rugina, O.D.; Pintea, A.M.; Sconţa, Z.; Bunea, C.I.; Socaciu, C. Comparative Polyphenolic Content and Antioxidant Activities of Some Wild and Cultivated Blueberries from Romania. Not. Bot. Horti Agrobot. Cluj Napoca 2011, 39, 70–76. [Google Scholar] [CrossRef]
- Castrejón, A.D.R.; Eichholz, I.; Rohn, S.; Kroh, L.W.; Huyskens-Keil, S. Phenolic profile and antioxidant activity of highbush blueberry (Vaccinium corymbosum L.) during fruit maturation and ripening. Food Chem. 2008, 109, 564–572. [Google Scholar] [CrossRef]
- Häkkinen, S.H.; Törrönen, A.R. Content of flavonols and selected phenolic acids in strawberries and Vaccinium species: Influence of cultivar, cultivation site and technique. Food Res. Int. 2000, 33, 517–524. [Google Scholar] [CrossRef]
- Scalzo, J.; Politi, A.; Pellegrini, N.; Mezzetti, B.; Battino, M. Plant genotype affects total antioxidant capacity and phenolic contents in fruit. Nutrition 2005, 21, 207–213. [Google Scholar] [CrossRef]
- Ștefănescu, B.-E.; Călinoiu, L.F.; Ranga, F.; Fetea, F.; Mocan, A.; Vodnar, D.C.; Crișan, G. Chemical Composition and Biological Activities of the Nord-West Romanian Wild Bilberry (Vaccinium myrtillus L.) and Lingonberry (Vaccinium vitis-idaea L.) Leaves. Antioxidants 2020, 9, 495. [Google Scholar] [CrossRef]
- Scalzo, J.; Stevenson, D.; Hedderley, D. Blueberry estimated harvest from seven new cultivars: Fruit and anthocyanins. Food Chem. 2013, 139, 44–50. [Google Scholar] [CrossRef] [PubMed]
- Yi, W.; Fischer, J.; Krewer, G.; Akoh, C.C. Phenolic compounds from blueberries can inhibit colon cancer cell proliferation and induce apoptosis. J. Agric. Food Chem. 2005, 53, 7320–7329. [Google Scholar] [CrossRef] [PubMed]
- Sellappan, S.; Akoh, C.C.; Krewer, G. Phenolic compounds and antioxidant capacity of Georgia-grown blueberries and blackberries. J. Agric. Food Chem. 2002, 50, 2432–2438. [Google Scholar] [CrossRef] [PubMed]
- Yuan, W.; Zhou, L.; Deng, G.; Wang, P.; Creech, D.; Li, S. Anthocyanins, Phenolics, and Antioxidant Capacity of Vaccinium L. in Texas, USA. Pharm. Crops 2011, 2, 11–23. [Google Scholar] [CrossRef]
- Silva, S.; Costa, E.M.; Pereira, M.F.; Costa, M.R.; Pintado, M.E. Evaluation of the antimicrobial activity of aqueous extracts from dry Vaccinium corymbosum extracts upon food microorganism. Food Control 2013, 34, 645–650. [Google Scholar] [CrossRef]
- Ehlenfeldt, M.K.; Prior, R.L. Oxygen radical absorbance capacity (ORAC) and phenolic and anthocyanin concentrations in fruit and leaf tissues of highbush blueberry. J. Agric. Food Chem. 2001, 49, 2222–2227. [Google Scholar] [CrossRef]
- Routray, W.; Orsat, V. MAE of phenolic compounds from blueberry leaves and comparison with other extraction methods. Ind. Crops Prod. 2014, 58, 36–45. [Google Scholar] [CrossRef]
- Kim, S.-M.; Shang, Y.F.; Um, B.-H. Preparative separation of chlorogenic acid by centrifugal partition chromatography from highbush blueberry leaves (Vaccinium corymbosum L.). Phytochem. Anal. PCA 2010, 21, 457–462. [Google Scholar] [CrossRef]
- Martineau, L.C.; Couture, A.; Spoor, D.; Benhaddou-Andaloussi, A.; Harris, C.; Meddah, B.; Leduc, C.; Burt, A.; Vuong, T.; Mai Le, P.; et al. Anti-diabetic properties of the Canadian lowbush blueberry Vaccinium angustifolium Ait. Phytomedicine Int. J. Phytother. Phytopharm. 2006, 13, 612–623. [Google Scholar] [CrossRef]
- Harris, C.S.; Burt, A.J.; Saleem, A.; Le, P.M.; Martineau, L.C.; Haddad, P.S.; Bennett, S.A.L.; Arnason, J.T. A single HPLC-PAD-APCI/MS method for the quantitative comparison of phenolic compounds found in leaf, stem, root and fruit extracts of Vaccinium angustifolium. Phytochem. Anal. PCA 2007, 18, 161–169. [Google Scholar] [CrossRef]
- Takeshita, M.; Ishida, Y.-I.; Akamatsu, E.; Ohmori, Y.; Sudoh, M.; Uto, H.; Tsubouchi, H.; Kataoka, H. Proanthocyanidin from blueberry leaves suppresses expression of subgenomic hepatitis C virus RNA. J. Biol. Chem. 2009, 284, 21165–21176. [Google Scholar] [CrossRef]
- Dulf, F.V.; Vodnar, D.C.; Dulf, E.H.; Toşa, M.I. Total Phenolic Contents, Antioxidant Activities, and Lipid Fractions from Berry Pomaces Obtained by Solid-State Fermentation of Two Sambucus Species with Aspergillus niger. J. Agric. Food Chem. 2015, 63, 3489–3500. [Google Scholar] [CrossRef] [PubMed]
- Dulf, F.V.; Vodnar, D.C.; Socaciu, C. Effects of solid-state fermentation with two filamentous fungi on the total phenolic contents, flavonoids, antioxidant activities and lipid fractions of plum fruit (Prunus domestica L.) by-products. Food Chem. 2016, 209, 27–36. [Google Scholar] [CrossRef] [PubMed]
- Zhishen, J.; Mengcheng, T.; Jianming, W. The determination of flavonoid contents in mulberry and their scavenging effects on superoxide radicals. Food Chem. 1999, 64, 555–559. [Google Scholar] [CrossRef]
- Giusti, M.M.; Wrolstad, R.E. Characterization and Measurement of Anthocyanins by UV-Visible Spectroscopy. Curr. Protoc. Food Anal. Chem. 2001, 1, F1.2.1–F1.2.13. [Google Scholar] [CrossRef]
- Ebrahimabadi, A.H.; Mazoochi, A.; Kashi, F.J.; Djafari-Bidgoli, Z.; Batooli, H. Essential oil composition and antioxidant and antimicrobial properties of the aerial parts of Salvia eremophila Boiss. from Iran. Food Chem. Toxicol. Int. J. Publ. Br. Ind. Biol. Res. Assoc. 2010, 48, 1371–1376. [Google Scholar] [CrossRef]
- Clinical and Laboratory Standards Institute; Weinstein, M.P. Methods for Dilution Antimicrobial Susceptibility Tests for Bacteria that Grow Aerobically; Clinical and Laboratory Standards Institute: Wayne, PA, USA, 2018; ISBN 978-1-56238-836-2. [Google Scholar]
- Schwalbe, R.; Steele-Moore, L.; Goodwin, A.C. Antimicrobial Susceptibility Testing Protocols; CRC Press: Boca Raton, FL, USA, 2007; ISBN 978-1-4200-1449-5. [Google Scholar]
- Alexander, B.D. Clinical and Laboratory Standards Institute. Reference Method for Broth Dilution Antifungal Susceptibility Testing of Yeasts; Clinical and Laboratory Standards Institute: Wayne, PA, USA, 2017; ISBN 978-1-56238-826-3. [Google Scholar]
- Maron, D.M.; Ames, B.N. Revised methods for the Salmonella mutagenicity test. Mutat. Res. Mutagen. Relat. Subj. 1983, 113, 173–215. [Google Scholar] [CrossRef]
- Saraç, N.; Şen, B. Antioxidant, mutagenic, antimutagenic activities, and phenolic compounds of Liquidambar orientalis Mill. var. orientalis. Ind. Crops Prod. 2014, 53, 60–64. [Google Scholar] [CrossRef]
- Ong, T.M.; Whong, W.Z.; Stewart, J.; Brockman, H.E. Chlorophyllin: A potent antimutagen against environmental and dietary complex mixtures. Mutat. Res. Lett. 1986, 173, 111–115. [Google Scholar] [CrossRef]
- Evandri, M.G.; Battinelli, L.; Daniele, C.; Mastrangelo, S.; Bolle, P.; Mazzanti, G. The antimutagenic activity of Lavandula angustifolia (lavender) essential oil in the bacterial reverse mutation assay. Food Chem. Toxicol. 2005, 43, 1381–1387. [Google Scholar] [CrossRef]
- Wang, L.-J.; Wu, J.; Wang, H.-X.; Li, S.-S.; Zheng, X.-C.; Du, H.; Xu, Y.-J.; Wang, L.-S. Composition of phenolic compounds and antioxidant activity in the leaves of blueberry cultivars. J. Funct. Foods 2015, 16, 295–304. [Google Scholar] [CrossRef]
- Ferlemi, A.-V.; Mermigki, P.G.; Makri, O.E.; Anagnostopoulos, D.; Koulakiotis, N.S.; Margarity, M.; Tsarbopoulos, A.; Georgakopoulos, C.D.; Lamari, F.N. Cerebral Area Differential Redox Response of Neonatal Rats to Selenite-Induced Oxidative Stress and to Concurrent Administration of Highbush Blueberry Leaf Polyphenols. Neurochem. Res. 2015, 40, 2280–2292. [Google Scholar] [CrossRef] [PubMed]
- Li, D.; Meng, X.; Li, B. Profiling of anthocyanins from blueberries produced in China using HPLC-DAD-MS and exploratory analysis by principal component analysis. J. Food Compos. Anal. 2016, 47, 1–7. [Google Scholar] [CrossRef]
- Jaakola, L.; Määttä-Riihinen, K.; Kärenlampi, S.; Hohtola, A. Activation of flavonoid biosynthesis by solar radiation in bilberry (Vaccinium myrtillus L.) leaves. Planta 2004, 218, 721–728. [Google Scholar] [CrossRef] [PubMed]
- Routray, W.; Orsat, V. Variation of phenolic profile and antioxidant activity of North American highbush blueberry leaves with variation of time of harvest and cultivar. Ind. Crops Prod. 2014, 62, 147–155. [Google Scholar] [CrossRef]
- Tabart, J.; Kevers, C.; Pincemail, J.; Defraigne, J.-O.; Dommes, J. Comparative antioxidant capacities of phenolic compounds measured by various tests. Food Chem. 2009, 113, 1226–1233. [Google Scholar] [CrossRef]
- Bunea, A.; Rugină, D.; Sconţa, Z.; Pop, R.M.; Pintea, A.; Socaciu, C.; Tăbăran, F.; Grootaert, C.; Struijs, K.; VanCamp, J. Anthocyanin determination in blueberry extracts from various cultivars and their antiproliferative and apoptotic properties in B16-F10 metastatic murine melanoma cells. Phytochemistry 2013, 95, 436–444. [Google Scholar] [CrossRef]
- Kalt, W.; Lawand, C.; Ryan, D.A.J.; McDonald, J.E.; Donner, H.; Forney, C.F. Oxygen Radical Absorbing Capacity, Anthocyanin and Phenolic Content of Highbush Blueberries (Vaccinium corymbosum L.) during Ripening and Storage. J. Am. Soc. Hortic. Sci. 2003, 128, 917–923. [Google Scholar] [CrossRef]
- Carocho, M.; Barreiro, M.F.; Morales, P.; Ferreira, I.C.F.R. Adding Molecules to Food, Pros and Cons: A Review on Synthetic and Natural Food Additives. Compr. Rev. Food Sci. Food Saf. 2014, 13, 377–399. [Google Scholar] [CrossRef]
- Bouarab-Chibane, L.; Forquet, V.; Lantéri, P.; Clément, Y.; Léonard-Akkari, L.; Oulahal, N.; Degraeve, P.; Bordes, C. Antibacterial Properties of Polyphenols: Characterization and QSAR (Quantitative Structure–Activity Relationship) Models. Front. Microbiol. 2019, 10. [Google Scholar] [CrossRef]
- Stanoeva, J.P.; Stefova, M.; Andonovska, K.B.; Vankova, A.; Stafilov, T. Phenolics and mineral content in bilberry and bog bilberry from Macedonia. Int. J. Food Prop. 2017, 20, S863–S883. [Google Scholar] [CrossRef]
- Pervin, M.; Hasnat, M.A.; Lim, B.O. Antibacterial and antioxidant activities of Vaccinium corymbosum L. leaf extract. Asian Pac. J. Trop. Dis. 2013, 3, 444–453. [Google Scholar] [CrossRef]
- Zahin, M.; Aqil, F.; Ahmad, I. Broad spectrum antimutagenic activity of antioxidant active fraction of punica granatum L. peel extracts. Mutat. Res. 2010, 703, 99–107. [Google Scholar] [CrossRef] [PubMed]
- Brindzová, L.; Zalibera, M.; Jakubík, T.; Mikulášová, M.; Takácsová, M.; Mošovská, S.; Rapta, P. Antimutagenic and Radical Scavenging Activity of Wheat Bran. Cereal Res. Commun. 2009, 37, 45–55. [Google Scholar] [CrossRef]
- Panche, A.N.; Diwan, A.D.; Chandra, S.R. Flavonoids: An overview. J. Nutr. Sci. 2016, 5, e47. [Google Scholar] [CrossRef]
- Brusselmans, K.; Vrolix, R.; Verhoeven, G.; Swinnen, J.V. Induction of Cancer Cell Apoptosis by Flavonoids Is Associated with Their Ability to Inhibit Fatty Acid Synthase Activity. J. Biol. Chem. 2005, 280, 5636–5645. [Google Scholar] [CrossRef]
- Kumar, S.; Pandey, A.K. Chemistry and Biological Activities of Flavonoids: An Overview. Available online: https://www.hindawi.com/journals/tswj/2013/162750/ (accessed on 4 September 2020).
© 2020 by the authors. Licensee MDPI, Basel, Switzerland. This article is an open access article distributed under the terms and conditions of the Creative Commons Attribution (CC BY) license (http://creativecommons.org/licenses/by/4.0/).