Temporal Variation of Phenolic and Mineral Composition in Olive Leaves Is Cultivar Dependent

 , , , , , , and
Abstract
:1. Introduction
2. Results
3. Discussion
4. Conclusions
5. Materials and Methods
5.1. Olive Leaves Sampling
5.2. Chemicals
5.3. Measurement of the Total Antioxidant Capacity
5.4. High Performance Liquid Chromatography
5.5. Elemental Analysis
5.6. Soil and Cultivar Characterization
5.7. Statistical Analysis
Supplementary Materials
Author Contributions
Funding
Acknowledgments
Conflicts of Interest
References
- Zohary, D.; Hopf, M.; Weiss, E. Domestication of Plants in the Old World: The Origin and Spread of Domesticated Plants in Southwest Asia, Europe, and the Mediterranean Basin, 4th ed.; Oxford University Press: Oxfrod, UK, 2012; pp. 116–121. [Google Scholar]
- Ranalli, A.; Contento, S.; Lucera, L.; di Febo, M.; Marchegiani, D.; di Fonzo, V. Factors affecting the contents of iridoid oleuropein in olive leaves (Olea europaea L.). J. Agric. Food Chem. 2006, 54, 434–440. [Google Scholar] [CrossRef] [PubMed]
- Cavaca, L.A.; López-Coca, I.M.; Silvero, G.; Afonso, C.A. The olive-tree leaves as a source of high-added value molecules: Oleuropein. In Studies in Natural Products Chemistry: Bioactive Natural Products; Atta-Ur-Rahman, Ed.; Elsevier: Amsterdam, The Netherlands, 2020; Volume 64, pp. 131–180. [Google Scholar]
- Talhaoui, N.; Taamalli, A.; Gomez-Caravaca, A.M.; Fernandez-Gutierrez, A.; Segura-Carretero, A. Phenolic compounds in olive leaves: Analytical determination, biotic and abiotic influence, and health benefits. Food Res. Int. 2015, 77, 92–108. [Google Scholar] [CrossRef]
- Pereira, A.P.; Ferreira, I.; Marcelino, F.; Valentao, P.; Andrade, P.B.; Seabra, R.; Estevinho, L.; Bento, A.; Pereira, J.A. Phenolic compounds and antimicrobial activity of olive (Olea europaea L. cv. Cobrancosa) leaves. Molecules 2007, 12, 1153–1162. [Google Scholar] [CrossRef] [PubMed]
- Benavente-Garcia, O.; Castillo, J.; Lorente, J.; Ortuno, A.; del Rio, J.A. Antioxidant activity of phenolics extracted from Olea europaea L. leaves. Food Chem. 2000, 68, 457–462. [Google Scholar] [CrossRef]
- Visioli, F.; Galli, C. Biological properties of olive oil phytochemicals. Crit. Rev. Food Sci. Nutr. 2002, 42, 209–221. [Google Scholar] [CrossRef] [PubMed]
- Tekaya, M.; El-Gharbi, S.; Mechri, B.; Chehab, H.; Bchir, A.; Chraief, I.; Ayachi, M.; Boujnah, D.; Attia, F.; Hammami, M. Improving performance of olive trees by the enhancement of key physiological parameters of olive leaves in response to foliar fertilization. Acta Physiol. Plant. 2016, 38, 101. [Google Scholar] [CrossRef]
- Treutter, D. Managing Phenol Contents in Crop Plants by Phytochemical Farming and Breeding-Visions and Constraints. Int. J. Mol. Sci. 2010, 11, 807–857. [Google Scholar] [CrossRef] [Green Version]
- Fernandez-Escobar, R.; Moreno, R.; Garcia-Creus, M. Seasonal changes of mineral nutrients in olive leaves during the alternate-bearing cycle. Sci. Hortic. 1999, 82, 25–45. [Google Scholar] [CrossRef]
- Pasković, I.; Perica, S.; Pecina, M.; Hančević, K.; Polić Pasković, M.; Herak Ćustić, M. Leaf mineral concentration of five olive cultivars grown on calcareous soil. J. Cent. Eur. Agric. 2013, 14, 1471–1478. [Google Scholar] [CrossRef] [Green Version]
- Lukić, I.; Horvat, I.; Godena, S.; Krapac, M.; Lukić, M.; Vrhovsek, U.; Brkić Bubola, K. Towards understanding the varietal typicity of virgin olive oil by correlating sensory and compositional analysis data: A case study. Food Res. Int. 2018, 112, 78–89. [Google Scholar] [CrossRef]
- Lukić, I.; Carlin, S.; Horvat, I.; Vrhovsek, U. Combined targeted and untargeted profiling of volatile aroma compounds with comprehensive two-dimensional gas chromatography for differentiation of virgin olive oils according to variety and geographical origin. Food Chem. 2019, 270, 403–414. [Google Scholar] [CrossRef] [PubMed]
- Vuletin Selak, G.; Perica, S.; Goreta Ban, S.; Radunić, M.; Poljak, M. Reproductive Success after Self-pollination and Cross-pollination of Olive Cultivars in Croatia. Hortscience 2011, 46, 186–191. [Google Scholar] [CrossRef] [Green Version]
- Talhaoui, N. Analytical, Agronomic, and Biological Evaluation of Phenolic Compounds in Olea Europaea Products and By-Products; University of Granada, Faculty of Sciences, Department of Analytical Chemistry: Granada, Spain, 2016. [Google Scholar]
- Chatzistathis, T.; Therios, I.; Alifragis, D. Differential Uptake, Distribution within Tissues, and Use Efficiency of Manganese, Iron, and Zinc by Olive Cultivars Kothreiki and Koroneiki. Hortscience 2009, 44, 1994–1999. [Google Scholar] [CrossRef] [Green Version]
- Pasković, I.; Herak Ćustić, M.; Pecina, M.; Bronić, J.; Ban, D.; Radić, T.; Poščić, F.; Špika, M.J.; Soldo, B.; Palčić, I.; et al. Manganese soil and foliar fertilization of olive plantlets: The effect on leaf mineral and phenolic content and root mycorrhizal colonization. J. Sci. Food Agric. 2019, 99, 360–367. [Google Scholar] [CrossRef] [Green Version]
- Pasković, I.; Soldo, B.; Talhaoui, N.; Palcic, I.; Brkljača, M.; Koprivnjak, O.; Majetić Germek, V.; Ban, D.; Klanjac, J.; Franić, M.; et al. Boron foliar application enhances oleuropein level and modulates volatile compound composition in olive leaves. Sci. Hortic. 2019, 257, 108688. [Google Scholar] [CrossRef]
- Ortega-Garcia, F.; Peragon, J. The response of phenylalanine ammonia-lyase, polyphenol oxidase and phenols to cold stress in the olive tree (Olea europaea L. cv. Picual). J. Sci. Food Agric. 2009, 89, 1565–1573. [Google Scholar] [CrossRef]
- Connor, D.J.; Fereres, E. The physiology of adaptation and yield expression in olive. Hortic. Rev. 2005, 31, 155–229. [Google Scholar]
- Strikić, F.; Klepo, T.; Rošin, J.; Radunić, M. Udomaćene Sorte Maslina u Republici Hrvatskoj; Institut za jadranske kulture i melioraciju krša: Split, Croatia, 2010; p. 82. [Google Scholar]
- Biško, A.; Prlić, M.; Barbarić, M.; Leko, M. Olive growing in Herzegovina. Pomol. Croat. Glas. Hrvat. Agron Društva 2018, 22, 137–146. [Google Scholar] [CrossRef] [Green Version]
- Barranco, D.; Cimato, A.; Fiorino, P.; Rallo, L.; Touzani, A.; Castañeda, C.; Serafin, F.; Trujillo, I. World Catalogue of Olive Varieties; International Olive Oil Council: Madrid, Spain, 2000; pp. 51–216. [Google Scholar]
- Škarica, B.; Žužić, I.; Bonifačić, M. Maslina i Maslinovo Ulje Visoke Kakvoće u Hrvatskoj; Tipograf d.d.: Rijeka, Croatia, 1996; p. 315. [Google Scholar]
- Tomić Maksan, M.; Brečić, R. Organic olive oil in Croatia. In Sustainability of European Food Quality Schemes: Multi-Performance, Structure, and Governance of PDO, PGI, and Organic Agri-Food Systems; Arfini, F., Bellassen, V., Eds.; Springer International: Cham, Switzerland, 2019; p. 136. [Google Scholar]
- Gubanova, T.B.; Paliy, A.E. Physiological and Biochemical Aspects of Frost Resistance in Olea europaea L. Russ. J. Plant. Physiol. 2020, 67, 671–679. [Google Scholar] [CrossRef]
- Wang, M.; Zheng, Q.S.; Shen, Q.R.; Guo, S.W. The Critical Role of Potassium in Plant Stress Response. Int. J. Mol. Sci. 2013, 14, 7370–7390. [Google Scholar] [CrossRef] [Green Version]
- Nguyen, P.M.; Kwee, E.M.; Niemeyer, E.D. Potassium rate alters the antioxidant capacity and phenolic concentration of basil (Ocimum basilicum L.) leaves. Food Chem. 2010, 123, 1235–1241. [Google Scholar] [CrossRef]
- Hafsi, C.; Falleh, H.; Saada, M.; Rabhi, M.; Mkadmini, K.; Ksouri, R.; Abdelly, C.; Smaoui, A. Effects of potassium supply on growth, gas exchange, phenolic composition, and related antioxidant properties in the forage legume Sulla Carnosa. Flora 2016, 223, 38–45. [Google Scholar] [CrossRef]
- Sun, R.; Sun, L.; Wang, K.F. Partial Least Squares Analysis of the Relationship between Chemical Composition and Phenolic Compounds in Blueberry Cultivars. Food Anal. Methods 2017, 10, 1024–1033. [Google Scholar] [CrossRef]
- Therios, I.N. Olives; CAB International: Oxfordshire, UK, 2009; pp. 179–211. [Google Scholar]
- Rouphael, Y.; Cardarelli, M.; Lucini, L.; Rea, E.; Colla, G. Nutrient Solution Concentration Affects Growth, Mineral Composition, Phenolic Acids, and Flavonoids in Leaves of Artichoke and Cardoon. Hortscience 2012, 47, 1424–1429. [Google Scholar] [CrossRef] [Green Version]
- Ben Abdeljelil, Z.; Tekaya, M.; Elmsellem, H.; Mechri, B.; Hammami, M. Impact of season and foliar fertilisers on phenolics of leaves of Chemlali olive cultivar. Moroc. J. Chem. 2017, 5, 96–104. [Google Scholar]
- Toplu, C.; Uygur, V.; Yildiz, E. Leaf Mineral Composition of Olive Varieties and Their Relation to Yield and Adaptation Ability. J. Plant. Nutr. 2009, 32, 1560–1573. [Google Scholar] [CrossRef]
- Ryan, D.; Antolovich, M.; Herlt, T.; Prenzler, P.D.; Lavee, S.; Robards, K. Identification of phenolic compounds in tissues of the novel olive cultivar Hardy’s mammoth. J. Agric. Food Chem. 2002, 50, 6716–6724. [Google Scholar] [CrossRef]
- Obied, H.K.; Prenzler, P.D.; Ryan, D.; Servili, M.; Taticchi, A.; Esposto, S.; Robards, K. Biosynthesis and biotransformations of phenol-conjugated oleosidic secoiridoids from Olea europaea L. Nat. Prod. Rep. 2008, 25, 1167–1179. [Google Scholar] [CrossRef]
- Karioti, A.; Chatzopoulou, A.; Bilia, A.R.; Liakopoulos, G.; Stavrianakou, S.; Skaltsa, H. Novel secoiridoid glucosides in Olea europaea leaves suffering from boron deficiency. Biosci. Biotechnol. Biochem. 2006, 70, 1898–1903. [Google Scholar] [CrossRef] [Green Version]
- Liakopoulos, G.; Karabourniotis, G. Boron deficiency and concentrations and composition of phenolic compounds in Olea europaea leaves: A combined growth chamber and field study. Tree Physiol. 2005, 25, 307–315. [Google Scholar] [CrossRef] [Green Version]
- Bogunović, M.; Husnjak, S.; Šimunić, I. Pedološke značajke otoka Krka. Agron. Glas. Glas. Hrvat. Agron. Društva 1999, 61, 3–22. [Google Scholar]
- Šegota, T.; Filipčić, A. Köppen’s classification of climates and the problem of corresponding Croatian terminology. Geoadria 2003, 8, 17–37. [Google Scholar] [CrossRef] [Green Version]
- Lasram, M.; Tnani, M.T. Olive. In IFA World Fertilizer Use Manual; Halliday, D.J., Trenkel, M.E., Wichmann, W., Eds.; International Fertilizer Industry Association: Paris, France, 1999; pp. 229–233. [Google Scholar]
- Brand-Williams, W.; Cuvelier, M.E.; Berset, C. Use of a free-radical method to evaluate antioxidant activity. Food Sci. Technol. -Lebensm. Wiss. Technol. 1995, 28, 25–30. [Google Scholar] [CrossRef]
- Benzie, I.F.F.; Strain, J.J. The ferric reducing ability of plasma (FRAP) as a measure of ‘‘antioxidant power’’: The FRAP assay. Anal. Biochem. 1996, 239, 70–76. [Google Scholar] [CrossRef] [PubMed] [Green Version]
- Marinova, D.; Ribarova, F.; Atanassova, M. Total phenolics and total flavonoids in Bulgarian fruits and vegetables. J. Univ. Chem. Technol. Metall. 2005, 40, 255–260. [Google Scholar]
- Stateras, D.C.; Moustakas, N.K. Seasonal changes of macro- and micro-nutrients concentration in olive leaves. J. Plant. Nutr. 2018, 41, 186–196. [Google Scholar] [CrossRef]
- Miller, C.H. Diurnal temperature cycling influences flowering and node numbers of broccoli. Hortscience 1988, 23, 873–875. [Google Scholar]
- Pasković, I.; Pecina, M.; Bronić, J.; Perica, S.; Ban, D.; Goreta Ban, S.; Poščić, F.; Palčić, I.; Herak Ćustić, M. Synthetic Zeolite A as Zinc and Manganese Fertilizer in Calcareous Soil. Commun. Soil Sci. Plant Anal. 2018, 49, 1072–1082. [Google Scholar] [CrossRef]
- Brkljača, M.; Rumora, J.; Marcelić, Š.; Juranov, A. Morphological and pomological characterization of two Olea europaea cultivars,’Karbuncela’ and ‘Drobnica’, grown on the island of Dugi otok, Croatia. In VIII International Olive Symposium; Perica, S., Vuletin Selak, G., Klepo, T., Ferguson, L., Sebastiani, L., Eds.; ISHS Acta Horticulturae: Split, Croatia, 2018; pp. 41–46. [Google Scholar] [CrossRef]
- Mandal, U.K.; Warrington, D.N.; Bhardwaj, A.K.; Bar-Tal, A.; Kautsky, L.; Minz, D.; Levy, G.J. Evaluating impact of irrigation water quality on a calcareous clay soil using principal component analysis. Geoderma 2008, 144, 189–197. [Google Scholar] [CrossRef]
- Xia, J.G.; Sinelnikov, I.V.; Han, B.; Wishart, D.S. MetaboAnalyst 3.0-making metabolomics more meaningful. Nucleic Acids Res. 2015, 43, W251–W257. [Google Scholar] [CrossRef] [Green Version]


| Source of Variation | Antioxidant Activity | Simple Phenols | Phenolic Acids | Secoiridoids | ||
|---|---|---|---|---|---|---|
| DPPH | FRAP | Hydroxytyrosol | Tyrosol | Verbascoside | Oleuropein | |
| (mM/g DW TEQ) | (mM/g DW Fe2+EQ) | (mg/100 g DW) | (mg/100 g DW) | (mg/100 g DW) | ||
| Cultivar (Cv.) | ||||||
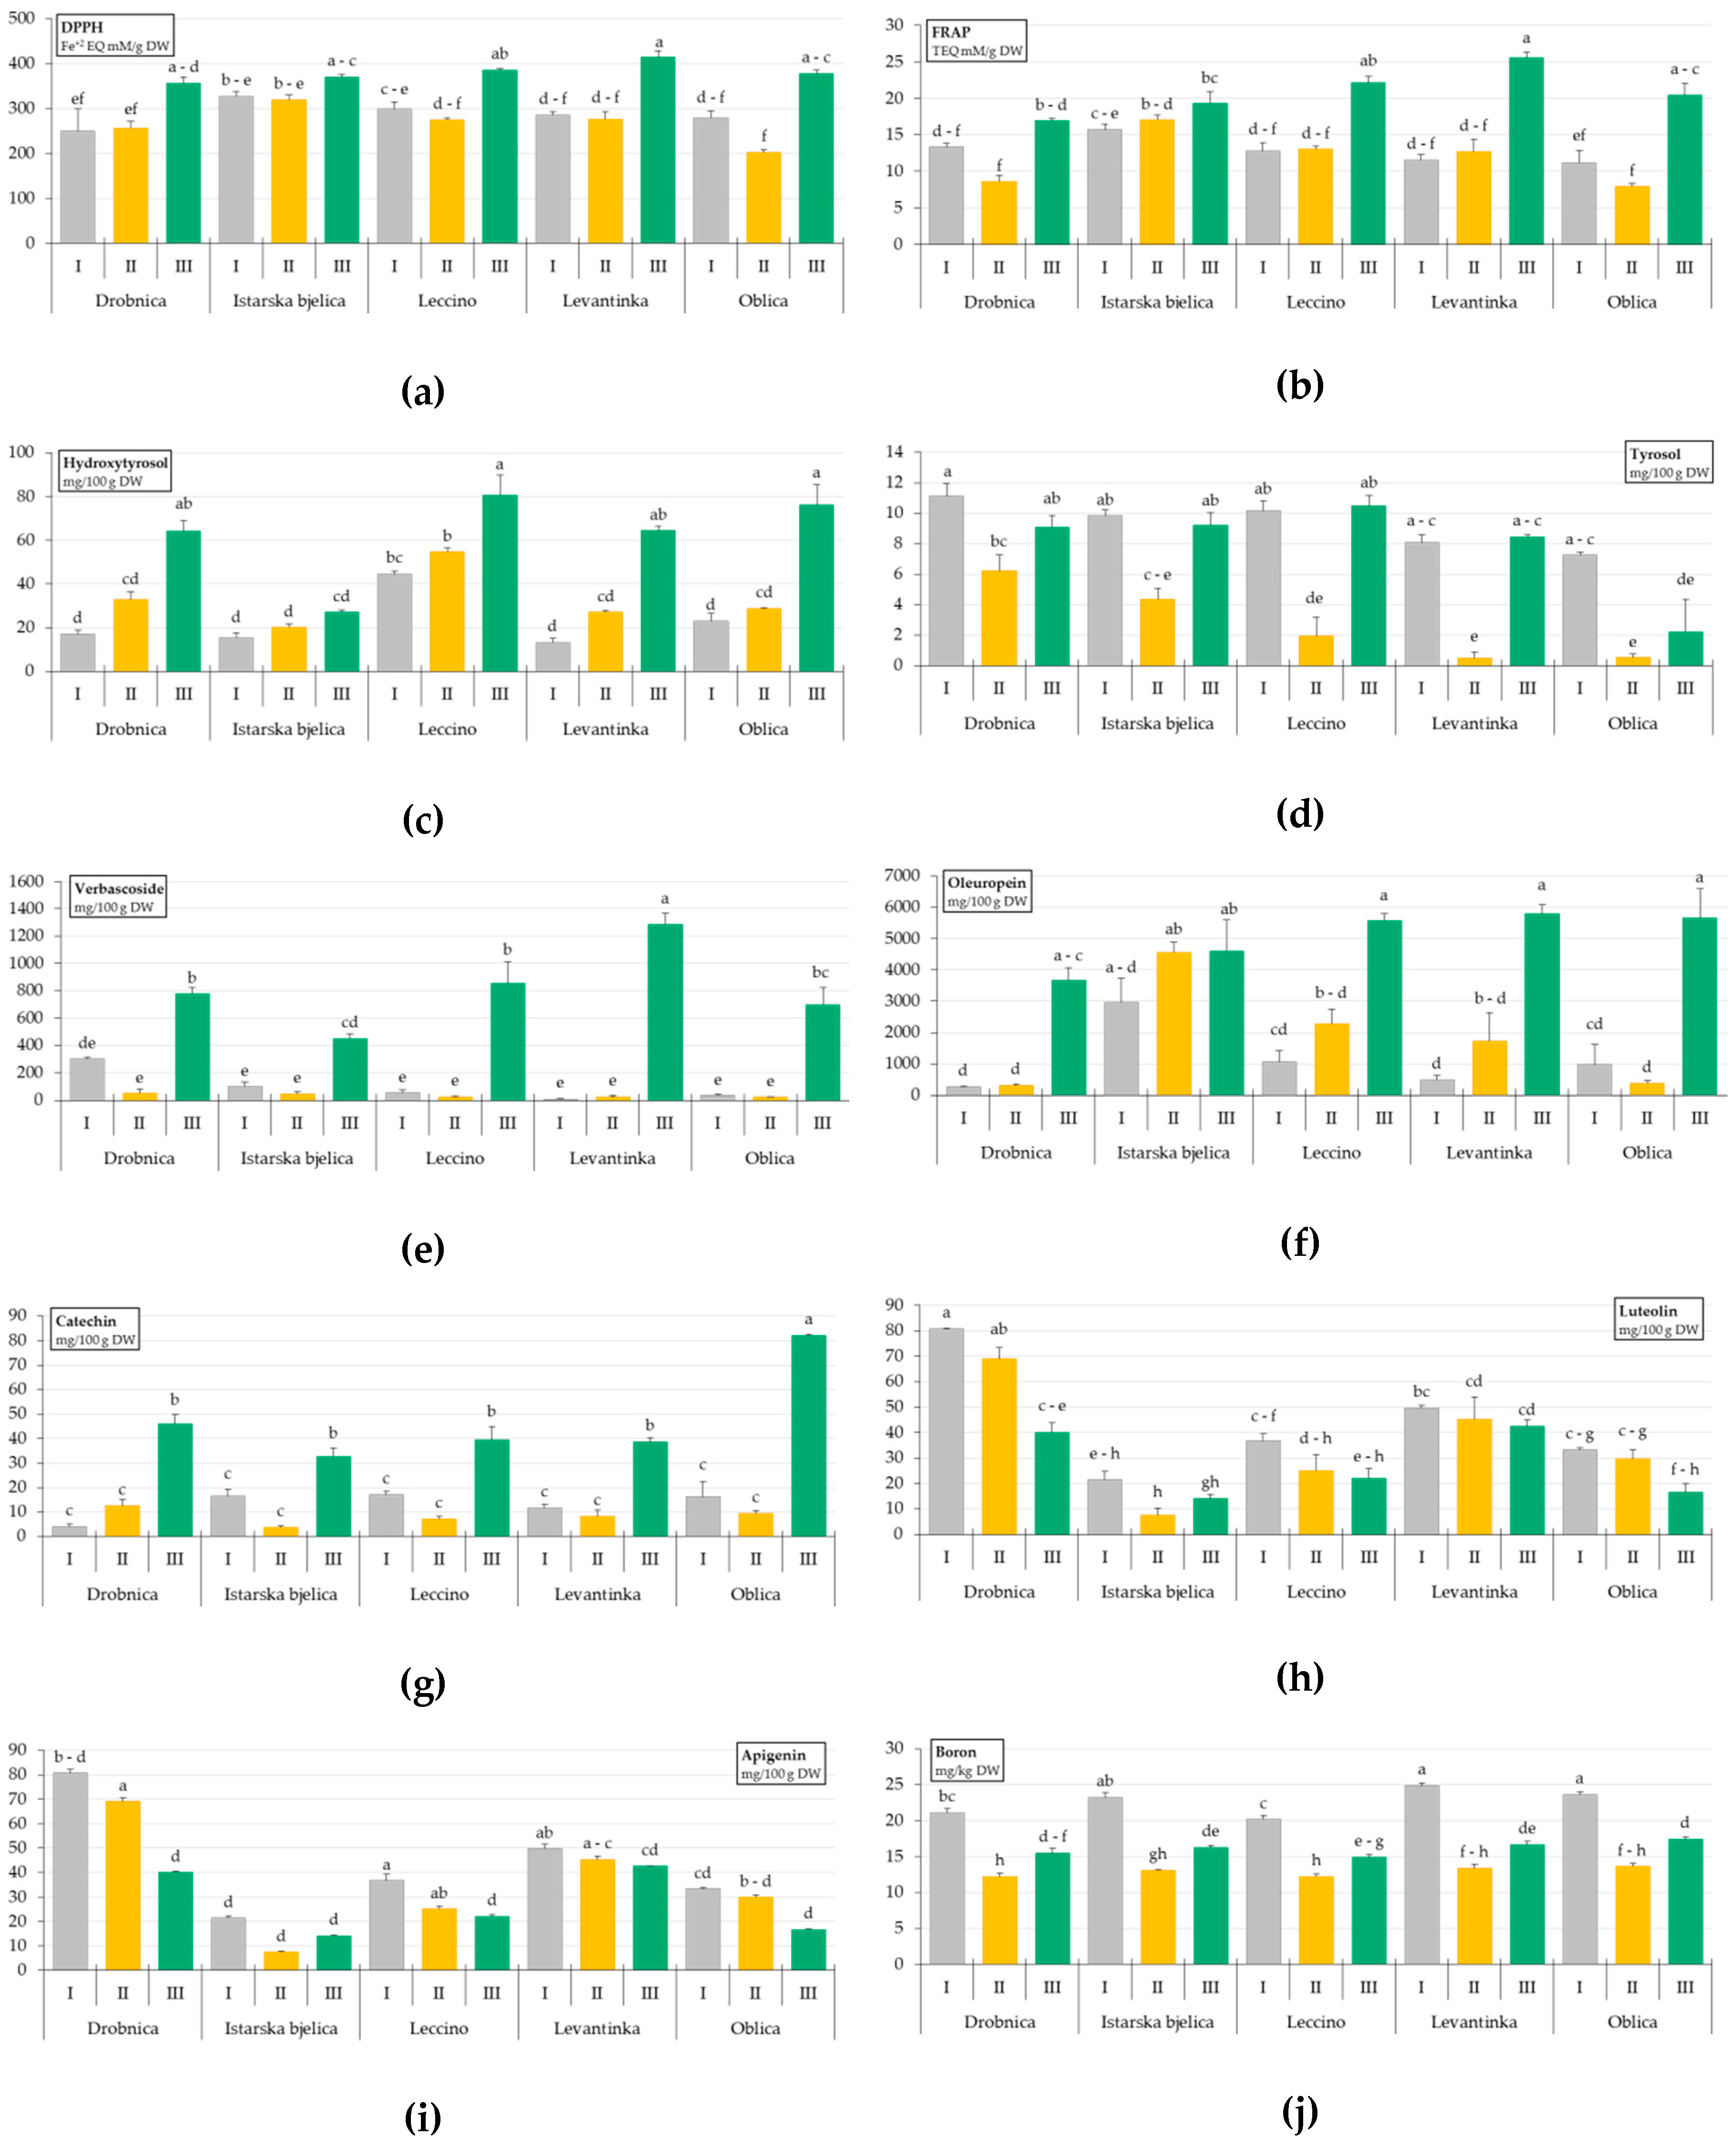
| Drobnica | 288.06 ± 23.00 b,c | 12.93 ± 1.24 b | 38.05 ± 7.15 b | 8.81 ± 0.84 a | 376.53 ± 108.24 a,b | 1411.77 ± 576.63 c |
| Istarska bjelica | 339.77 ± 8.99 a | 17.32 ± 0.75 a | 20.92 ± 1.89 c | 7.80 ± 0.93 a | 198.22 ± 64.96 c | 4041.88 ± 460.74 a |
| Leccino | 320.47 ± 17.48 a,b,c | 15.97 ± 1.60 a | 59.99 ± 6.01 a | 7.51 ± 1.47 a,b | 311.73 ± 143.32 a,b,c | 2976.18 ± 698.44 a,b |
| Levantinka | 325.66 ± 23.44 a,b | 16.59 ± 2.31 a | 34.91 ± 7.67 b | 5.67 ± 1.31 b | 440.23 ± 212.24 a | 2672.34 ± 846.91 b,c |
| Oblica | 286.93 ± 25.85 c | 13.17 ± 1.99 b | 42.76 ± 8.88 b | 3.33 ± 1.19 c | 252.09 ± 117.87 b,c | 2334.52 ± 899.47 b,c |
| Sampling time (ST) | ||||||
| I | 288.84 ± 11.51 b | 12.90 ± 0.58 b | 22.71 ± 3.17 c | 9.29 ± 0.43 a | 99.68 ± 29.12 b | 1152.94 ± 313.54 b |
| II | 266.24 ± 11.03 b | 11.85 ± 0.95 b | 32.71 ± 3.21 b | 2.71 ± 0.68 c | 34.01 ± 6.73 b | 1847.85 ± 453.58 b |
| III | 381.45 ± 6.38 a | 20.84 ± 0.89 a | 62.56 ± 5.55 a | 7.88 ± 0.89 b | 813.60 ± 81.85 a | 5061.22 ± 330.98 a |
| Cv. | *** | *** | *** | *** | *** | *** |
| ST | *** | *** | *** | *** | *** | *** |
| Cv. × ST | * | *** | *** | *** | *** | ** |
| Source of Variation | Flavonoids | |||||
|---|---|---|---|---|---|---|
| Catechin | Rutin | Luteolin-7-O-Glucoside | Apigenin-7-O-Glucoside | Luteolin | Apigenin | |
| (mg/100 g DW) | ||||||
| Cultivar (Cv.) | ||||||
| Drobnica | 21.01 ± 6.56 b | 66.61 ± 5.07 b | 346.66 ± 30.10 b,c | 34.64 ± 4.89 c | 63.29 ± 6.27 a | 6.76 ± 1.80 a,b |
| Istarska bjelica | 17.67 ± 4.36 b | 97.78 ± 6.56 a | 294.58 ± 15.20 c | 39.83 ± 3.13 c | 14.31 ± 2.44 d | 2.33 ± 0.28 c |
| Leccino | 21.24 ± 5.07 b | 70.68 ± 6.38 b | 401.33 ± 27.68 a,b | 85.47 ± 8.36 a | 27.95 ± 3.22 c | 9.38 ± 1.84 a |
| Levantinka | 19.57 ± 4.89 b | 44.43 ± 4.01 c | 445.36 ± 30.56 a | 60.22 ± 6.67 b | 45.89 ± 2.80 b | 8.48 ± 1.33 a |
| Oblica | 35.95 ± 11.74 a | 34.96 ± 2.86 c | 356.48 ± 30.63 b,c | 28.49 ± 2.33 c | 26.58 ± 2.85 c | 4.03 ± 0.83 b,c |
| Sampling time (ST) | ||||||
| I | 13.19 ± 1.79 b | 65.17 ± 8.11 | 319.89 ± 16.51 b | 52.97 ± 6.65 a | 44.37 ± 5.48 a | 7.47 ± 1.24 a |
| II | 8.24 ± 1.04 c | 57.54 ± 5.98 | 354.28 ± 25.10 b | 37.60 ± 5.49 b | 35.32 ± 5.93 b | 8.83 ± 1.15 a |
| III | 47.83 ± 4.89 a | 65.97 ± 6.68 | 432.48 ± 21.83 a | 58.62 ± 7.35 a | 27.12 ± 3.40 c | 2.28 ± 0.30 b |
| Cv. | *** | *** | *** | *** | *** | *** |
| ST | *** | n.s. | *** | *** | *** | *** |
| Cv. × ST | *** | n.s. | n.s. | n.s. | ** | *** |
| Macronutrients (g/kg DW) | Micronutrients (mg/kg DW) | ||||||||
|---|---|---|---|---|---|---|---|---|---|
| Source of Variation | P | K | Ca | Mg | Fe | Zn | Mn | Cu | B |
| Cultivar (Cv.) | |||||||||
| Drobnica | 1.51 ± 0.09 a,b | 6.74 ± 0.49 b | 25.07 ± 1.55 a | 8.00 ± 0.43 b | 68.24 ± 3.54 c | 23.37 ± 0.68 a,b | 57.69 ± 4.46 a,b | 12.94 ± 2.31 a,b | 16.28 ± 1.33 b |
| Istarska bjelica | 1.36 ± 0.05 b | 5.28 ± 0.30 c | 19.59 ± 1.70 b | 10.14 ± 0.30 a | 83.15 ± 4.15 a,b | 23.09 ± 1.13 a,b | 50.31 ± 3.54 b | 16.19 ± 2.18 a | 17.52 ± 1.51 a |
| Leccino | 1.55 ± 0.05 a,b | 5.91 ± 0.32 b,c | 22.19 ± 1.05 a,b | 9.06 ± 0.19 a,b | 88.95 ± 5.28 a,b | 22.17 ± 0.64 b,c | 67.68 ± 6.25 a | 11.09 ± 1.73 b | 15.78 ± 1.18 b |
| Levantinka | 1.45 ± 0.04 a,b | 6.04 ± 0.36 b,c | 17.50 ± 1.15 b,c | 9.48 ± 0.54 a,b | 70.24 ± 5.20 c | 22.27 ± 1.21 b,c | 51.71 ± 2.63 b | 14.66 ± 1.55 a,b | 18.28 ± 1.72 a |
| Oblica | 1.67 ± 0.03 a | 7.85 ± 0.42 a | 11.45 ± 0.62 c | 9.45 ± 0.22 a,b | 74.63 ± 2.40 b,c | 25.85 ± 0.66 a | 46.74 ± 3.00 b | 13.39 ± 1.35 a,b | 18.20 ± 1.47 a |
| Sampling time (ST) | |||||||||
| I | 1.43 ± 0.06 b | 7.46 ± 0.33 a | 20.23 ± 1.96 | 8.53 ± 0.33 b | 85.87 ± 4.17 a | 22.09 ± 0.72 b | 63.75 ± 3.80 a | 19.94 ± 1.16 a | 22.58 ± 0.49 a |
| II | 1.61 ± 0.04 a | 6.36 ± 0.29 b | 19.29 ± 1.48 | 9.59 ± 0.31 a | 78.82 ± 3.11 a | 23.34 ± 0.85 a,b | 43.39 ± 2.06 b | 10.38 ± 0.71 b | 12.91 ± 0.22 c |
| III | 1.48 ± 0.04 a,b | 5.27 ± 0.23 c | 17.97 ± 1.07 | 9.56 ± 0.32 a,b | 66.43 ± 1.83 b | 24.62 ± 0.55 a | 57.34 ± 2.70 a | 10.64 ± 0.68 b | 16.14 ± 0.29 b |
| Cv. | ** | *** | *** | ** | *** | * | *** | * | *** |
| ST | * | *** | n.s. | * | *** | * | *** | *** | *** |
| Cv. × ST | n.s. | n.s. | n.s. | n.s. | n.s. | n.s. | n.s. | n.s. | * |
| Statistic | PC1 | PC2 | PC3 |
|---|---|---|---|
| Eigenvalue | 5.54 | 1.82 | 1.17 |
| % variance | 55.42 | 18.21 | 11.65 |
| Cumulative % | 55.42 | 73.63 | 85.29 |
| Factor loading/eigenvector | |||
| Variables | |||
| DPPH | −0.945 | 0.170 | 0.024 |
| FRAP | −0.945 | 0.118 | 0.004 |
| Hydroxytyrosol | −0.747 | −0.284 | −0.471 |
| Tyrosol | −0.222 | 0.881 | −0.088 |
| Catechin | −0.825 | −0.037 | −0.143 |
| Verbascoside | −0.883 | 0.153 | −0.355 |
| Oleuropein | −0.956 | −0.151 | 0.155 |
| Luteolin | 0.492 | 0.403 | −0.695 |
| Apigenin | 0.716 | −0.135 | −0.454 |
| B | 0.137 | 0.832 | 0.277 |
| Cases | |||
| Drobnica × ST I | 2.055 | 2.198 | −0.932 |
| Drobnica × ST II | 2.612 | −0.543 | −1.767 |
| Drobnica × ST III | −2.143 | 0.305 | −0.750 |
| Istarska bjelica × ST I | 0.064 | 1.469 | 1.742 |
| Istarska bjelica × ST II | −0.286 | −1.235 | 1.908 |
| Istarska bjelica × ST III | −1.789 | 0.319 | 1.193 |
| Leccino × ST I | 1.282 | 0.803 | −0.542 |
| Leccino × ST II | 1.173 | −2.113 | −0.418 |
| Leccino × ST III | −3.448 | 0.094 | −0.567 |
| Levantinka × ST I | 2.281 | 1.592 | 0.134 |
| Levantinka × I ST II | 1.769 | −1.574 | −0.286 |
| Levantinka × ST III | −3.743 | 0.645 | −1.193 |
| Oblica × ST I | 1.360 | 1.061 | 1.095 |
| Oblica × ST II | 2.477 | −1.871 | 0.385 |
| Oblica × ST III | −3.665 | −1.150 | −0.004 |
© 2020 by the authors. Licensee MDPI, Basel, Switzerland. This article is an open access article distributed under the terms and conditions of the Creative Commons Attribution (CC BY) license (http://creativecommons.org/licenses/by/4.0/).
Share and Cite
Pasković, I.; Lukić, I.; Žurga, P.; Majetić Germek, V.; Brkljača, M.; Koprivnjak, O.; Major, N.; Grozić, K.; Franić, M.; Ban, D.; et al. Temporal Variation of Phenolic and Mineral Composition in Olive Leaves Is Cultivar Dependent. Plants 2020, 9, 1099. https://doi.org/10.3390/plants9091099
Pasković I, Lukić I, Žurga P, Majetić Germek V, Brkljača M, Koprivnjak O, Major N, Grozić K, Franić M, Ban D, et al. Temporal Variation of Phenolic and Mineral Composition in Olive Leaves Is Cultivar Dependent. Plants. 2020; 9(9):1099. https://doi.org/10.3390/plants9091099
Chicago/Turabian StylePasković, Igor, Igor Lukić, Paula Žurga, Valerija Majetić Germek, Mia Brkljača, Olivera Koprivnjak, Nikola Major, Kristina Grozić, Mario Franić, Dean Ban, and et al. 2020. "Temporal Variation of Phenolic and Mineral Composition in Olive Leaves Is Cultivar Dependent" Plants 9, no. 9: 1099. https://doi.org/10.3390/plants9091099