Article

The East Asian Winter Monsoon Acts as a Major Selective Factor in the Intraspecific Differentiation of Drought-Tolerant Nitraria tangutorum in Northwest China

1
State Key Laboratory of Plateau Ecology and Agriculture, Qinghai University, Xining 810016, China
2
College of Ecological Environment and Resources, Qinghai Nationalities University, Xining 810007, China
3
Key Laboratory of Plant Resources Conservation and Sustainable Utilization, South China Botanical Garden, Chinese Academy of Sciences, Guangzhou 510650, China
4
Key Laboratory of Stress Physiology and Ecology in Cold and Arid Regions, Gansu Province, Department of Ecology and Agriculture Research, Cold and Arid Regions Environmental and Engineering Research Institute, Chinese Academy of Sciences, Lanzhou 730000, China
5
The Key Laboratory of Restoration Ecology in Cold Region of Qinghai Province, Northwest Institute of Plateau Biology, Chinese Academy of Science, Xining 810008, China
6
Department of Life Sciences, Qinghai Normal University, Xining 810008, China
7
Institute of Research and Development, Duy Tan University, 03 Quang Trung, Da Nang 550000, Vietnam
8
Stress Adaptation Research Unit, RIKEN Center for Sustainable Resource Science, 1-7-19 22, Suehiro-cho, Tsurumi, Yokohama 230-0045, Japan
9
College of Eco-Environmental Engineering, Qinghai University, Xining 810016, China
*
Authors to whom correspondence should be addressed.
These authors contributed equally to this work.
Plants 2020, 9(9), 1100; https://doi.org/10.3390/plants9091100
Submission received: 15 July 2020 / Revised: 24 August 2020 / Accepted: 25 August 2020 / Published: 27 August 2020
(This article belongs to the Special Issue Plant Molecular Phylogenetics and Evolutionary Genomics)

Abstract

:
The influence of Quaternary climate fluctuation on the geographical structure and genetic diversity of species distributed in the regions of the Qinghai–Tibet Plateau (QTP) has been well established. However, the underlying role of the East Asian monsoon system (EAMS) in shaping the genetic structure of the population and the demography of plants located in the arid northwest of China has not been explored. In the present study, Nitraria tangutorum, a drought-tolerant desert shrub that is distributed in the EAMS zone and has substantial ecological and economic value, was profiled to better understand the influence of EAMS evolution on its biogeographical patterns and demographic history. Thus, the phylogeographical structure and historical dynamics of this plant species were elucidated using its five chloroplast DNA (cpDNA) fragments. Hierarchical structure analysis revealed three distinct, divergent lineages: West, East-A, and East-B. The molecular dating was carried out using a Bayesian approach to estimate the time of intraspecies divergence. Notably, the eastern region, which included East-A and East-B lineages, was revealed to be the original center of distribution and was characterized by a high level of genetic diversity, with the intraspecific divergence time dated to be around 2.53 million years ago (Ma). These findings, combined with the data obtained by ecological niche modeling analysis, indicated that the East lineages have undergone population expansion and differentiation, which were closely correlated with the development of the EAMS, especially the East Asian winter monsoon (EAWM). The West lineage appears to have originated from the migration of N. tangutorum across the Hexi corridor at around 1.85 Ma, and subsequent colonization of the western region. These results suggest that the EAWM accelerated the population expansion of N. tangutorum and subsequent intraspecific differentiation. These findings collectively provide new information on the impact of the evolution of the EAMS on intraspecific diversification and population demography of drought-tolerant plant species in northwest China.

1. Introduction

Geological events and climate fluctuations play a major role in shaping the distribution of plant species and their genetic diversity worldwide [1,2]. A more comprehensive understanding of species distribution patterns and population dynamics within those patterns in responses to geological and climate events can provide critical information on climate evolution and the relationship between plant species and the environment. Several studies have attempted to elucidate the influence of the Qinghai-Tibet Plateau (QTP) uplift on diversification of species located in or near the northern edge of the QTP [3,4,5,6]. Some phylogeographical studies have indicated that increased levels of aridification and desert expansion triggered by the QTP uplift are prominent factors driving the speciation and diversification of desert plants [2,3,7,8]. The northwestern part of China, which includes the regions of QTP positioned in the arid regions of the central Asia, has experienced complicate orogenesis that is widely recognized to be closely related with genetic diversification, accelerated variation, and speciation [8,9,10,11].
The impact of climate oscillations, especially climate fluctuations during the Pleistocene, on species distribution patterns has attracted increasing research interest due to the predominant effects of climatic factors on plant adaptation to local habitats [12,13]. Furthermore, the glaciation cycles with arid/cold glacial and humid/warm inter-glacial episodes, might act as more predominant drivers for changes of phylogeographic patterns of the regional vegetation located in northwest China, which has been exemplified in recent studies [14,15,16,17]. This influence is partially plausible in a small time-scale, because multifaceted lines of evidence suggested that the QTP appeared to be barely uplifted since the mid-Eocene and has partly reached over 4000 m above the sea level [18]. In addition, Quaternary glaciation alternations might induce the habitat fragmentation and finally lead to the inter- or intra-specific diversification [14,16]. Thus, under extreme weather conditions during the glaciation periods, distributional ranges of most species in high mountainous or plateau regions were contracted when they migrated into the so-called glacial refugia, and experienced expansion again in postglacial time, thereby leading to the species differentiation or secondary contact evolution [2,10,17,19]. Some investigations have suggested that the locations of glacial refugia for plants were determined mainly by the adaptability of species to the external environment, especially the climatic factors [20,21,22].
As a main component of climatic factors, the monsoon system, especially the East Asian monsoon system (EAMS), which consists of the East Asian summer monsoon (EASM) and the East Asian winter monsoon (EAWM) with humid/warm and dry/cold characters, respectively [22,23], may play crucial roles in affecting the genetic structure of plant species in northwest China. More specifically, the drier and colder EAWM may more dominantly function than EASM in the responsive process due to obstructed EASM by complex topography in the regions of the QTP, such as the uplift of the QTP and many mountains. The EAMS is believed to have had a tremendous influence during the Pleistocene on the genetic diversification and speciation of plants in the regions of the QTP [23,24,25,26,27]. For example, intraspecific divergence, population growth, and gene flow in two species of desert plants, Reaumuria soongarica and Agriophyllum squarrosum, appear to have been driven by the onset and stabilization of the EAMS [23,28]. Notably, the origin of Prinsepia species was suggested to have occurred prior to the establishment of EAMS based on a phylogenetic analysis of the Rosaceae [26]. Ma et al. reported that the divergence of Prinsepia species was potentially induced by the EASM, which produced a zone of humid forest vegetation during the late Oligocene [26]. This result provided an indirect evidence for the onset of a paleoclimatic event. A substantial body of data on phylogeographic patterns have provided evidence on the influence of paleoclimate events on the geographical distribution and genetic diversity of many plant species in China [7,8,29]. However, the specific impact of EAWM oscillations on population divergence and genetic diversity of species endemic to the arid northwest China has not been examined.
Nitraria tangutorum Bobr., a member of the Zygophyllaceae (Figure 1), is endemic to and widely distributed in the arid region of northwest China. It is well-adapted to extremely arid environments and has substantial ecological and economic value [30]. Nitraria tangutorum is used to conserve soil and water, preventing desertification; a feature that plays an essential role in maintaining the ecology and climate in the regions of the QTP [31,32]. It is also a rich source of berries that possess an array of beneficial medicinal effects. Thus, N. tangutorum has also been used as an economic resource [30,33,34]. Notably, the geographical distribution range of N. tangutorum includes the EAMS fluctuation zone, which includes Kumtag, Hexi corridor, Badain Jaran, and the Tengger desert regions. Therefore, N. tangutorum has been proposed to be an ideal model for a better understanding of the population dynamics of arid-adapted species responding to local monsoonal climate oscillations. Therefore, in the current study, we investigated the phylogeographic pattern of N. tangutorum in response to EAMS using five chloroplast DNA (cpDNA) molecular markers (maternally inherited) [35]. A total of 161 individuals in 21 different populations were sampled from the East Asian monsoonal sensitive zone. The objectives of the study were: (i) to determine whether the history of regional populations of N. tangutorum was dynamically impacted by local monsoonal fluctuation, and ii) to identify the factors that influenced the occurrence and evolution of the phylogeographic structure of N. tangutorum. The results of the present study will further expand our understanding of the demographic history of drought-tolerant species (and pleiotropic benefits) in responses to the local fluctuations in monsoonal climate.

2. Results

2.1. Phylogenetic Analysis and Geographical Distribution of Haplotypes

A total of 161 N. tangutorum individuals, plus one sample of N. roborowskii as an outgroup, were collected from 21 natural localities in arid regions of northwest China (Supplementary Table S1). Five cpDNA fragments were amplified and sequenced in all the sampled individuals using the primer pairs listed in Supplementary Table S2.
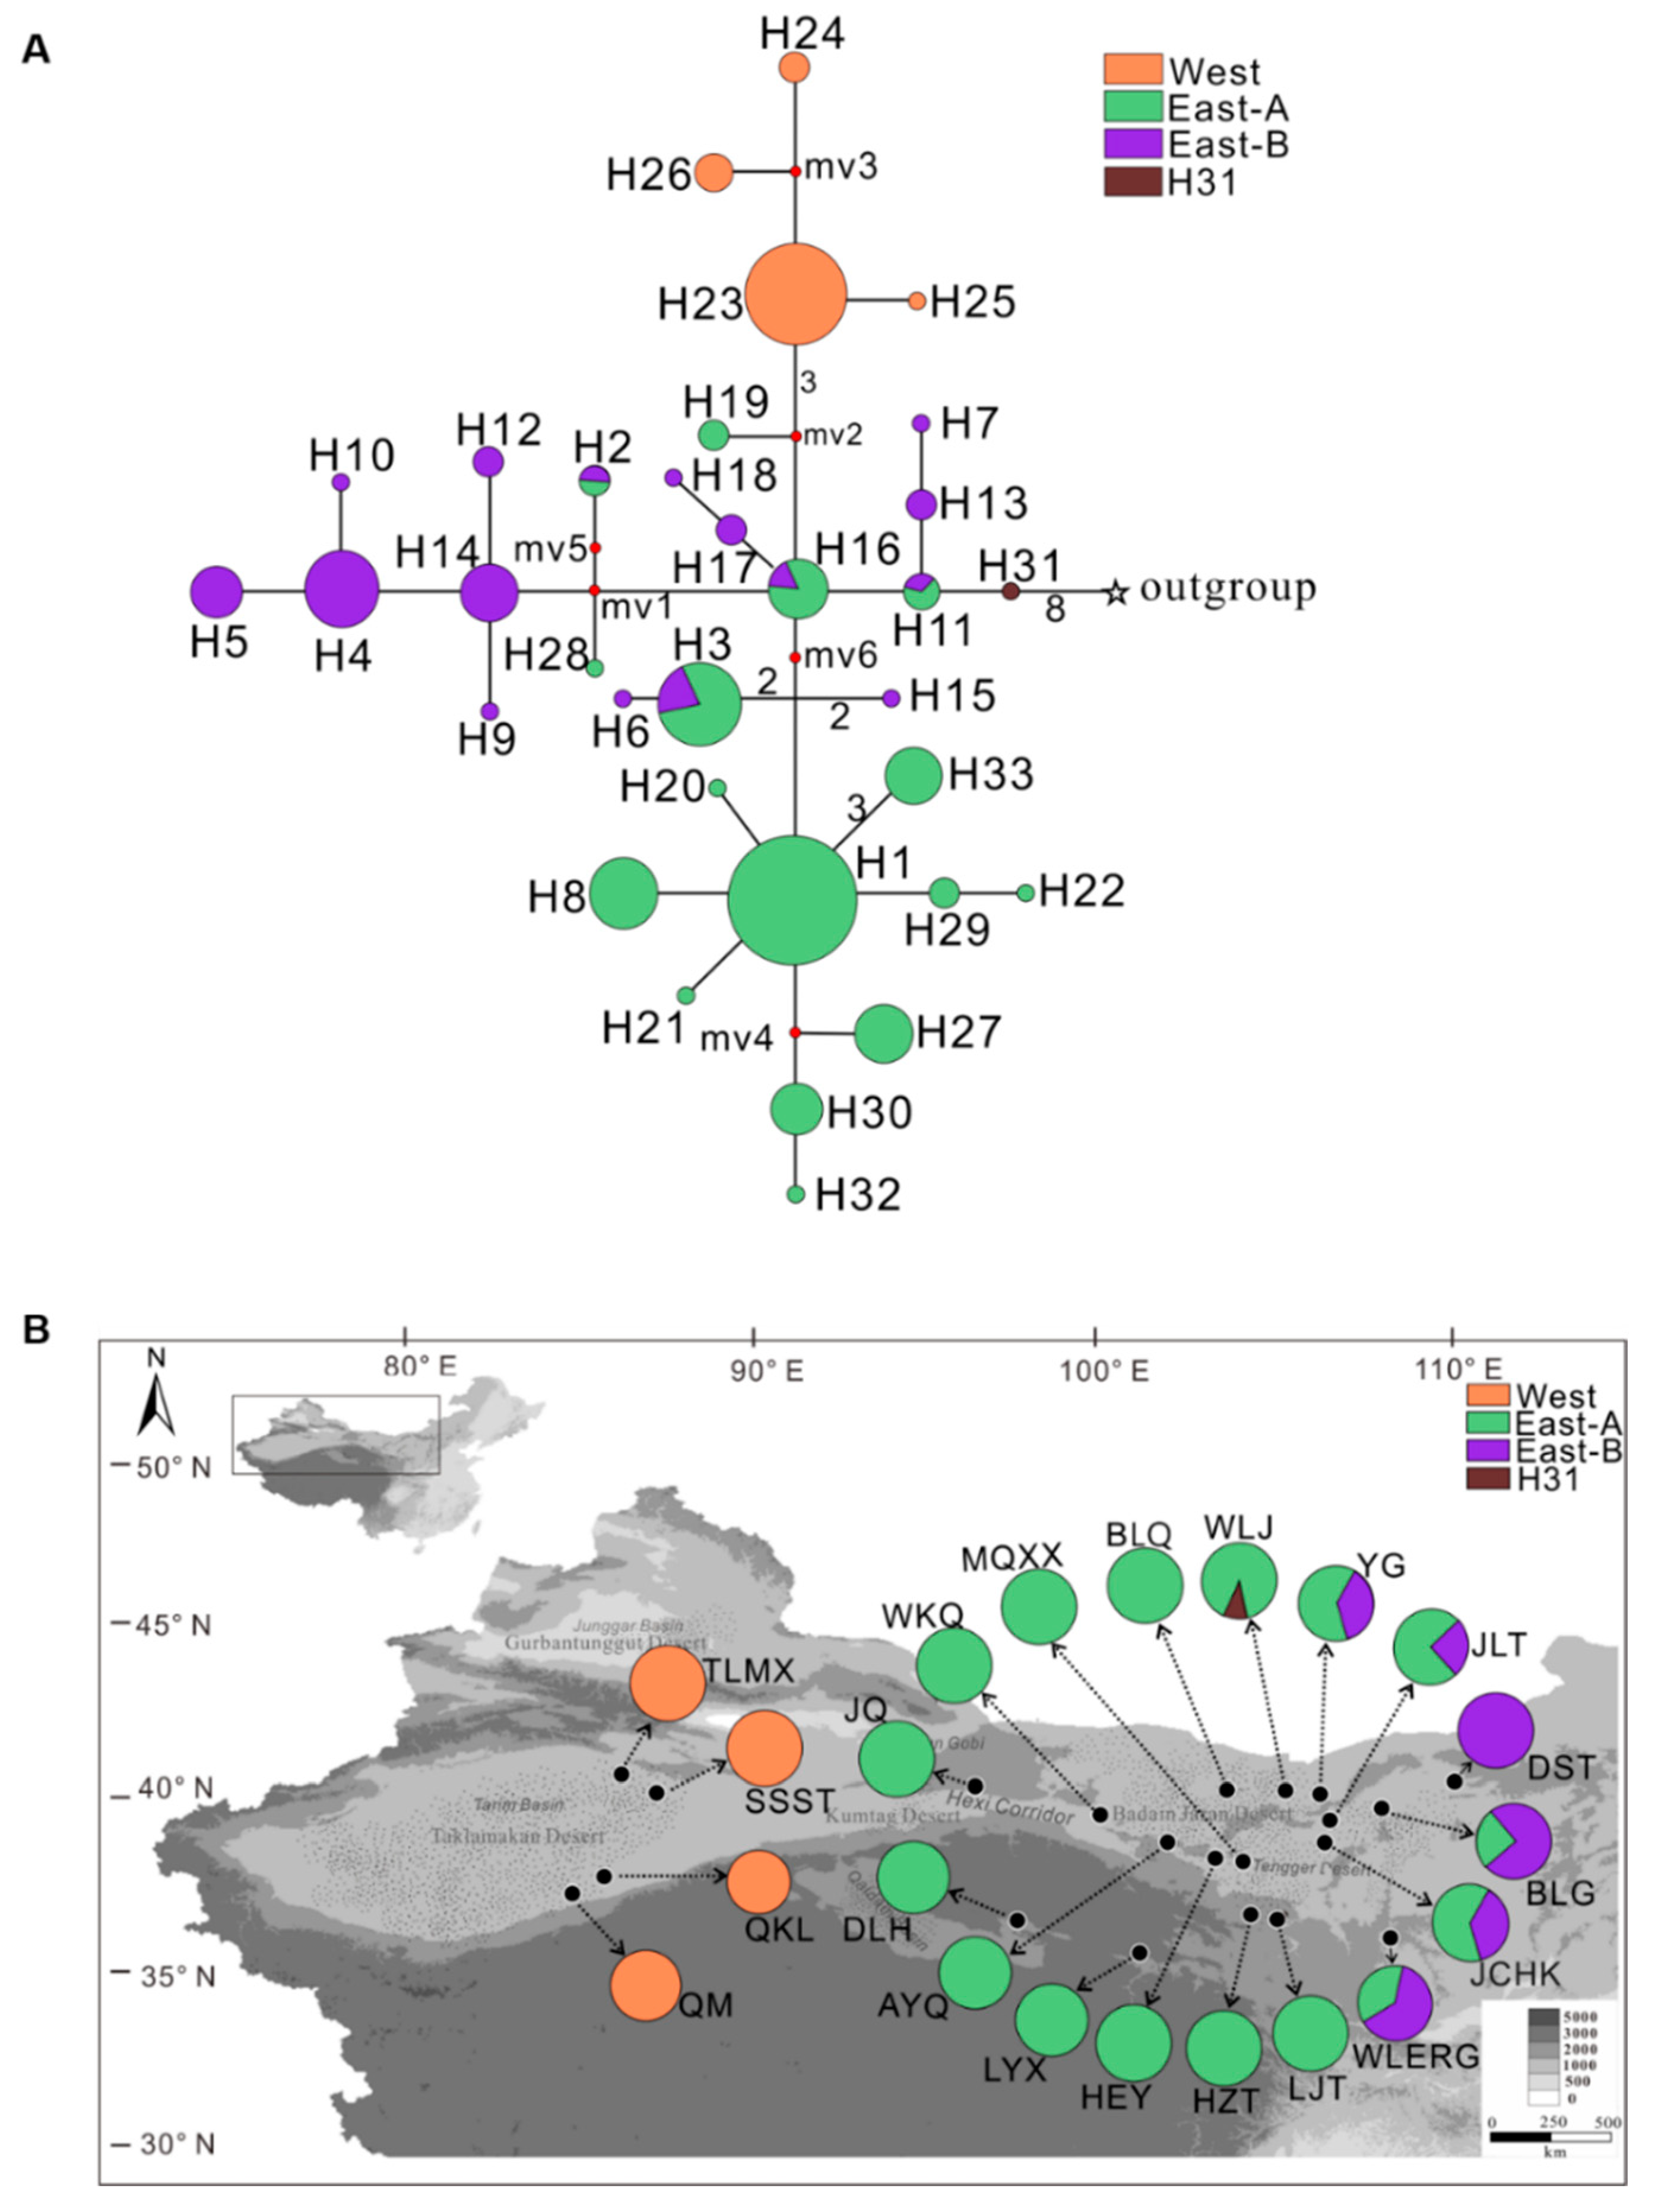
After joining the five cpDNA fragments, a 4,495-bp length of total sequence was obtained, and 33 haplotypes with 26 nucleotide substitutions were identified (Supplementary Table S3). These haplotypes clustered into three lineages based on the use of the N. roborowskii as an outgroup according to their phylogenetic topology (Figure 2A). The three distinct lineages were designated as West, East-A, and East-B, based on the frequency distribution of the 33 haplotypes in the population localities (Figure 2B). Among the three clades, East-A and East-B were predominantly included in the eastern area of northwest China, while the West lineage was located in the western region of China.
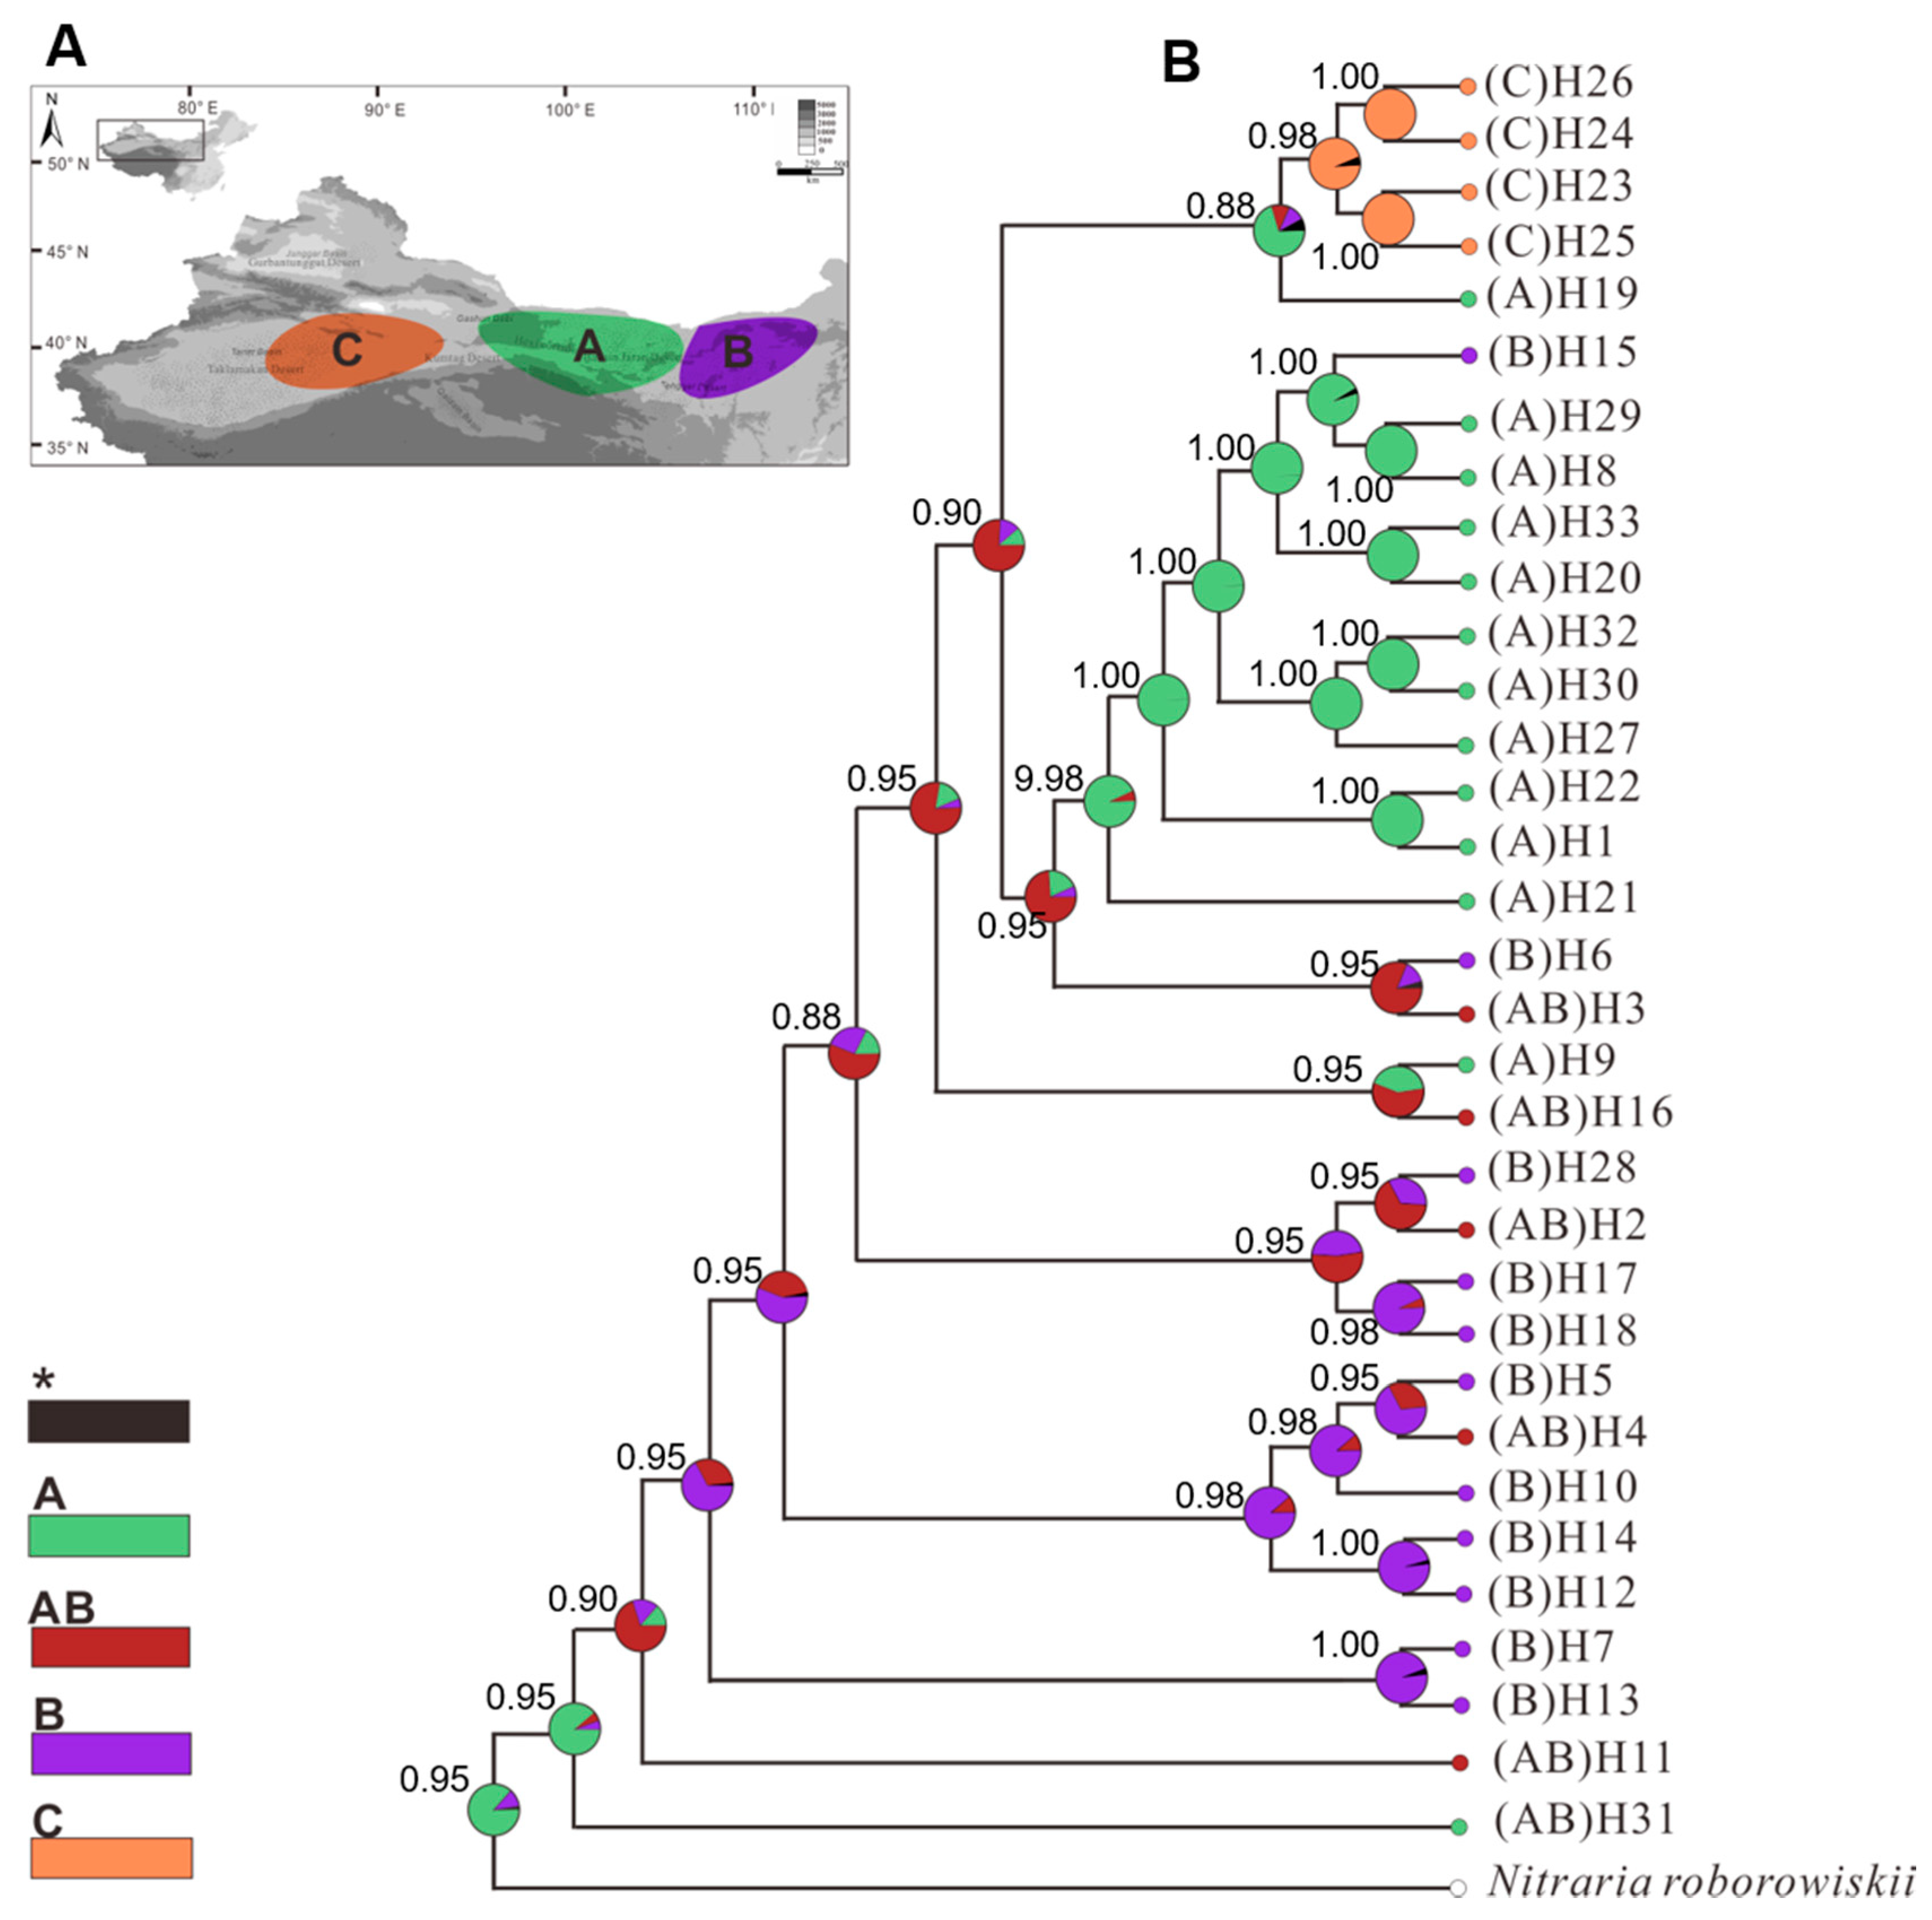
Notably, the WLJ population in the East-A group contained the ancestral H31 haplotype, while the H11 haplotype, present in both the East-A and East-B lineages, was derived from the H31 haplotype (Figure 2A). These data indicate that the WLJ population may be the original center of origin of N. tangutorum. The phylogenetic relationship between haplotypes obtained from the reconstruct ancestral state in phylogenies (RASP) analysis supports the phylogenetic patterns obtained for N. tangutorum (Figure 3).

2.2. Population and Phylogeographical Analysis

A high degree of population divergence across the entire range of the species was revealed. The total genetic diversity, HT (0.922, p = 0.034), across all populations was significantly higher than average within-population diversity, HS (0.47, p = 0.081) (Table 2). Furthermore, a higher level of number of substitution types (NST, 0.647, p = 0.041) than interpopulation differentiation (GST, 0.490, p = 0.046), as determined by the PERMUT analysis of plastid data, indicated a significant phylogeographical structure across the species’ range (Table 2).
The analysis of molecular variance (AMOVA) indicated that the molecular variation among the three groups (51.96%) was notably higher than the variation within the populations (17.45%) (Table 3), supporting the premise that a high level of genetic differentiation exists among the three groups [FCT = 0.520, p < 0.05; ΦST (West versus East-A) = 0.538, p < 0.05; ΦST (West versus East-B) = 0.553, p < 0.01; ΦST (East-A versus East-B) = 0.388, p < 0.05] (Table 3 and Table 4).
In addition, the molecular variation among populations in the East-A group (47.77%) was estimated to be slightly higher than what was present within both the East-B (43.50%) and West (33.07%) groups, suggesting that a higher degree of genetic differentiation exists in the Eastern populations compared with the West populations.

2.3. Estimation of the Divergence and Separation of the West and East Lineages

The phylogenetic relationship constructed with all the 33 haplotypes revealed that the East-B lineage was first diverged from the ancestral haplotype H31, followed by the divergence of East-A lineage from the East-B lineage. The West lineage (4 haplotypes) was monophyletic and separated from the Eastern lineages, because it was derived the haplotype H19 that exists in the JQ population located in the eastern regions (Figure 4).
Based on the previously calculated calibrated root age as the divergence time of the outgroup species, N. roborowskii [36], the time of divergence between N. tangutorum and N. roborowskii could be dated to 5.34 Ma, while N. tangutorum became subsequently divided into East-A and East-B at 2.53 Ma as determined by the BEAST analyses (Figure 4). The time of divergence of the West lineage (0.62 Ma) from the East-A lineage was significantly posterior to divergence of the two lineages located in the eastern areas, which also suggests that the center of species origin for N. tangutorum was located in the eastern region of northwest China.

2.4. Regional Population Demography of N. tangutorum

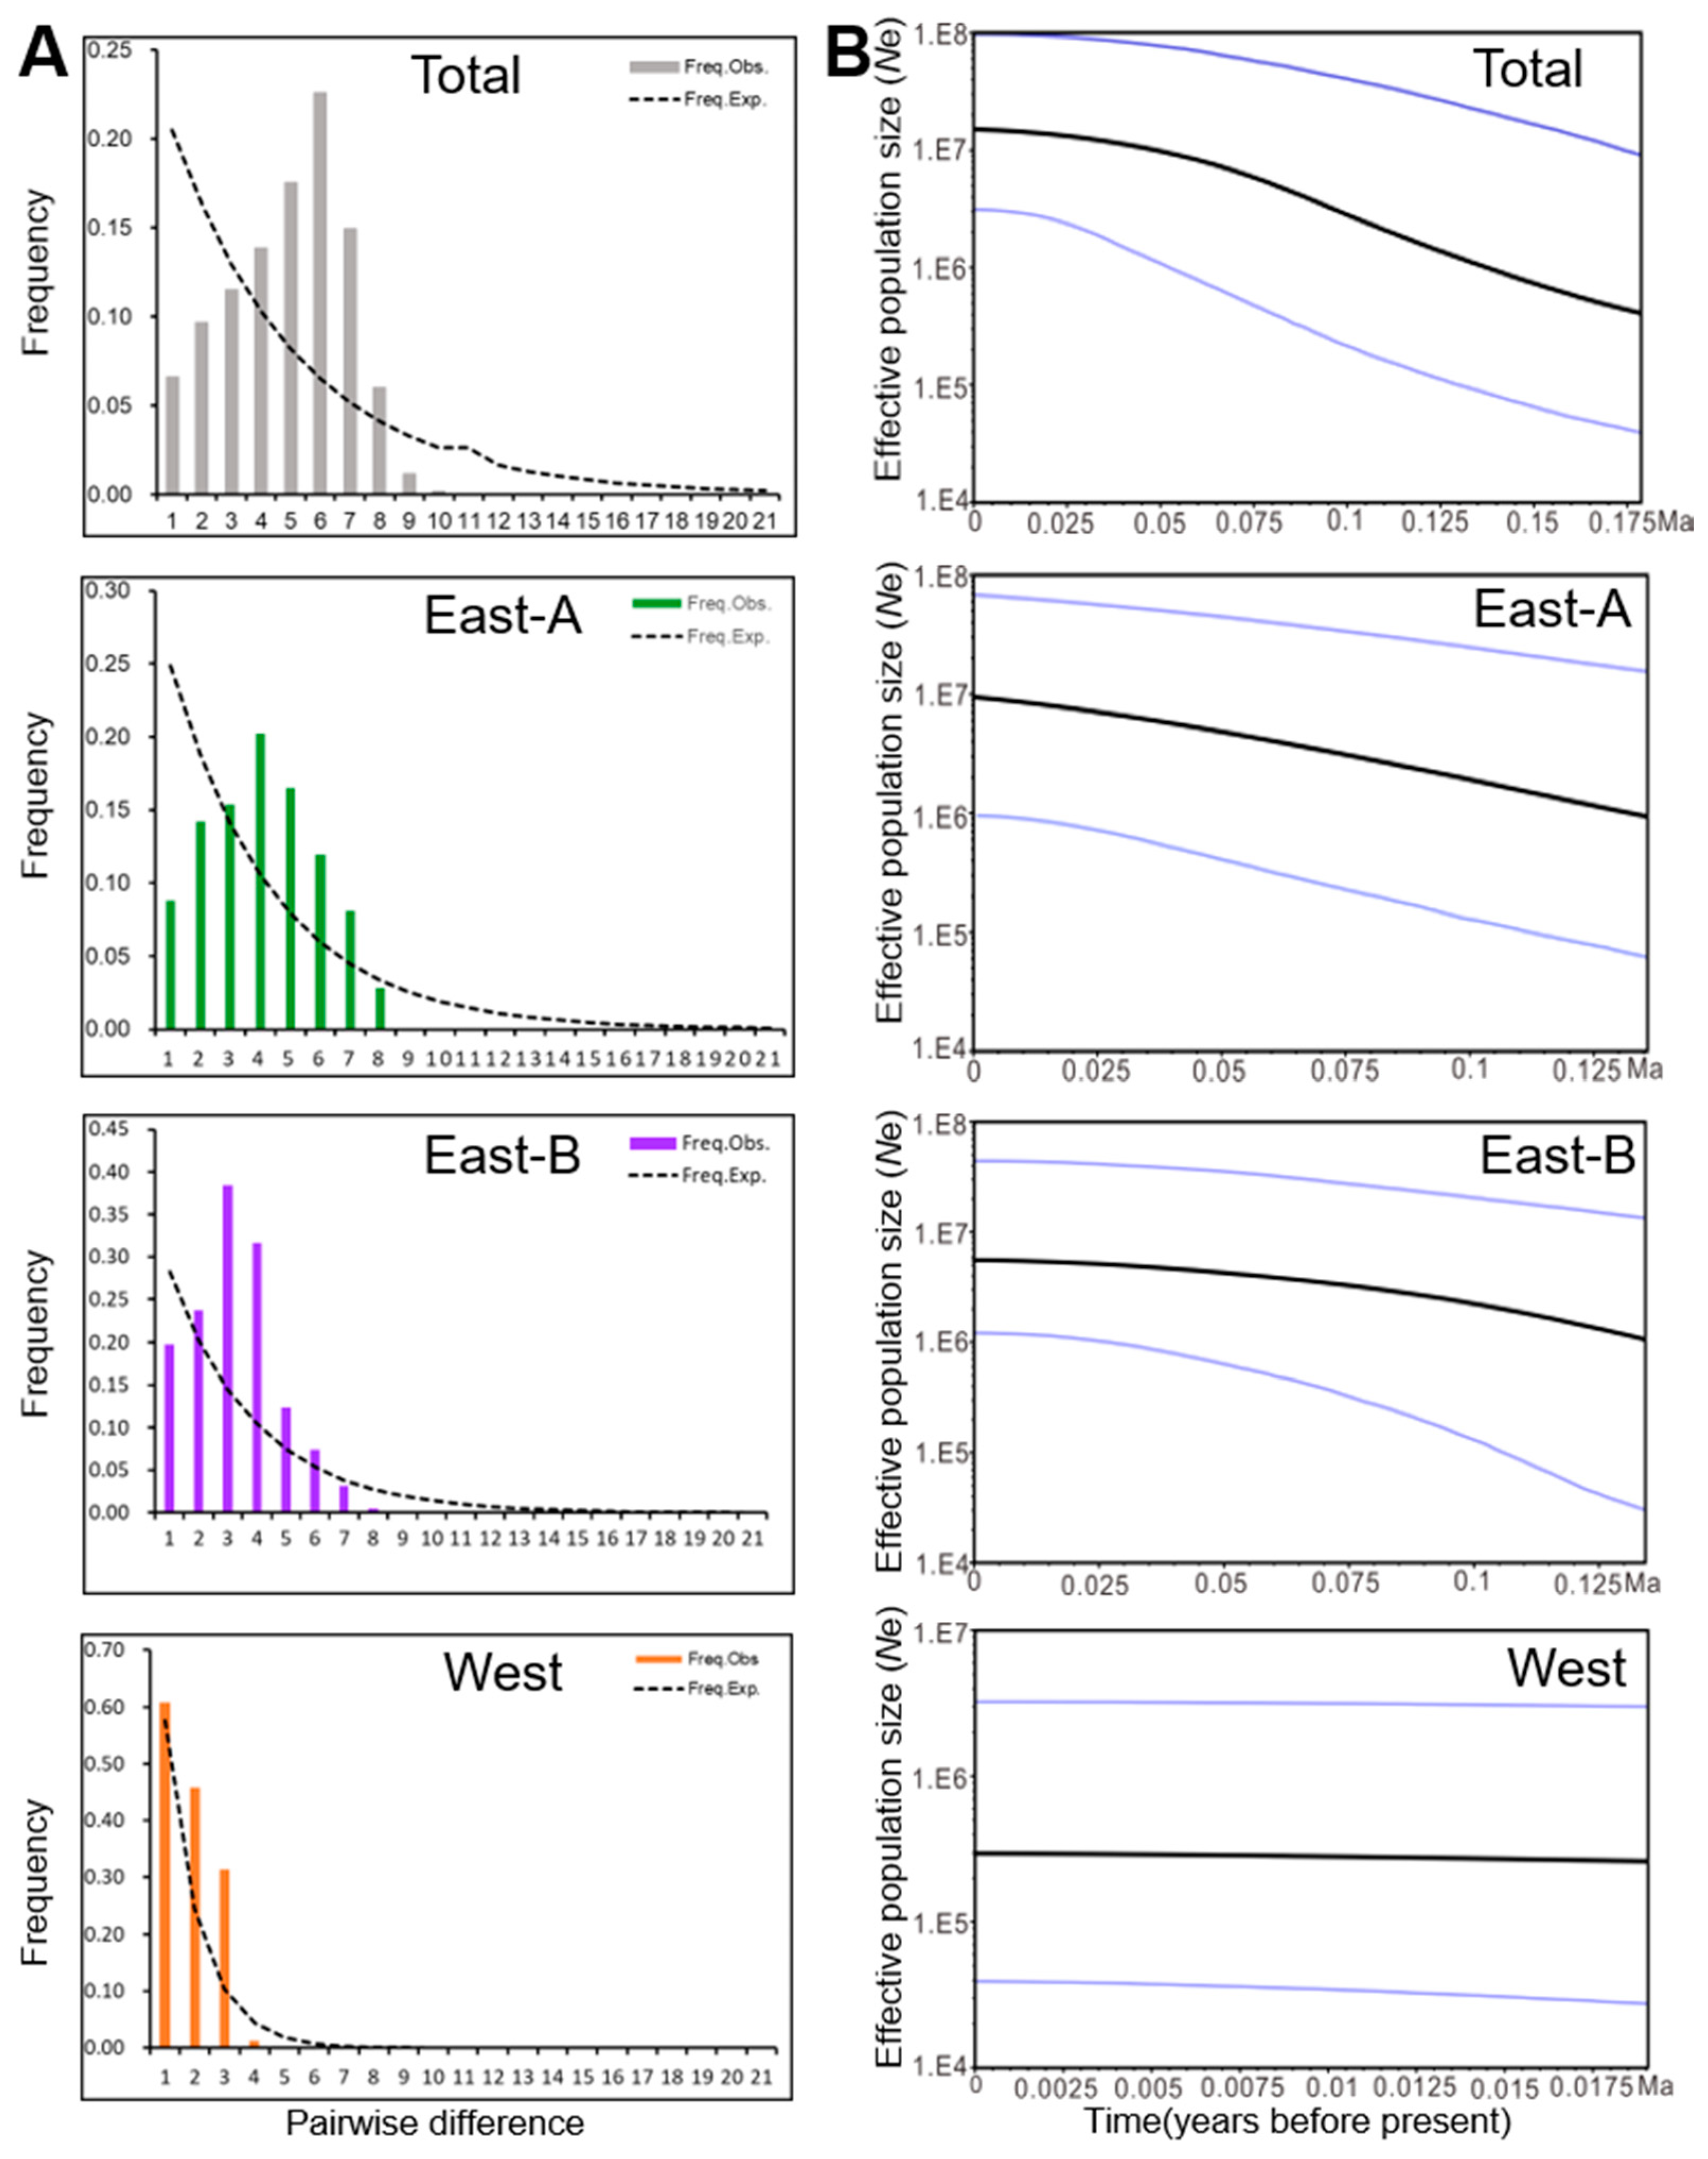
Obtaining neutrality tests with significantly negative values (Tajima’s D = −0.624, p = 0.034; Fu’s Fs = −13.614, p = 0.002) and the mismatch distribution analysis (MDA) results suggest that a distinct population expansion occurred in N. tangutorum (Table 2 and Figure 5A), which is consistent with our Bayesian skyline plot (BSP) analysis (Figure 5B). The population expansion, however, is projected to have been regional within the eastern lineages since the effective population size of the West lineage has remained relatively stable since 0.0175 Ma (Figure 5A,B).

2.5. Ecological Niche Modeling (ENM)

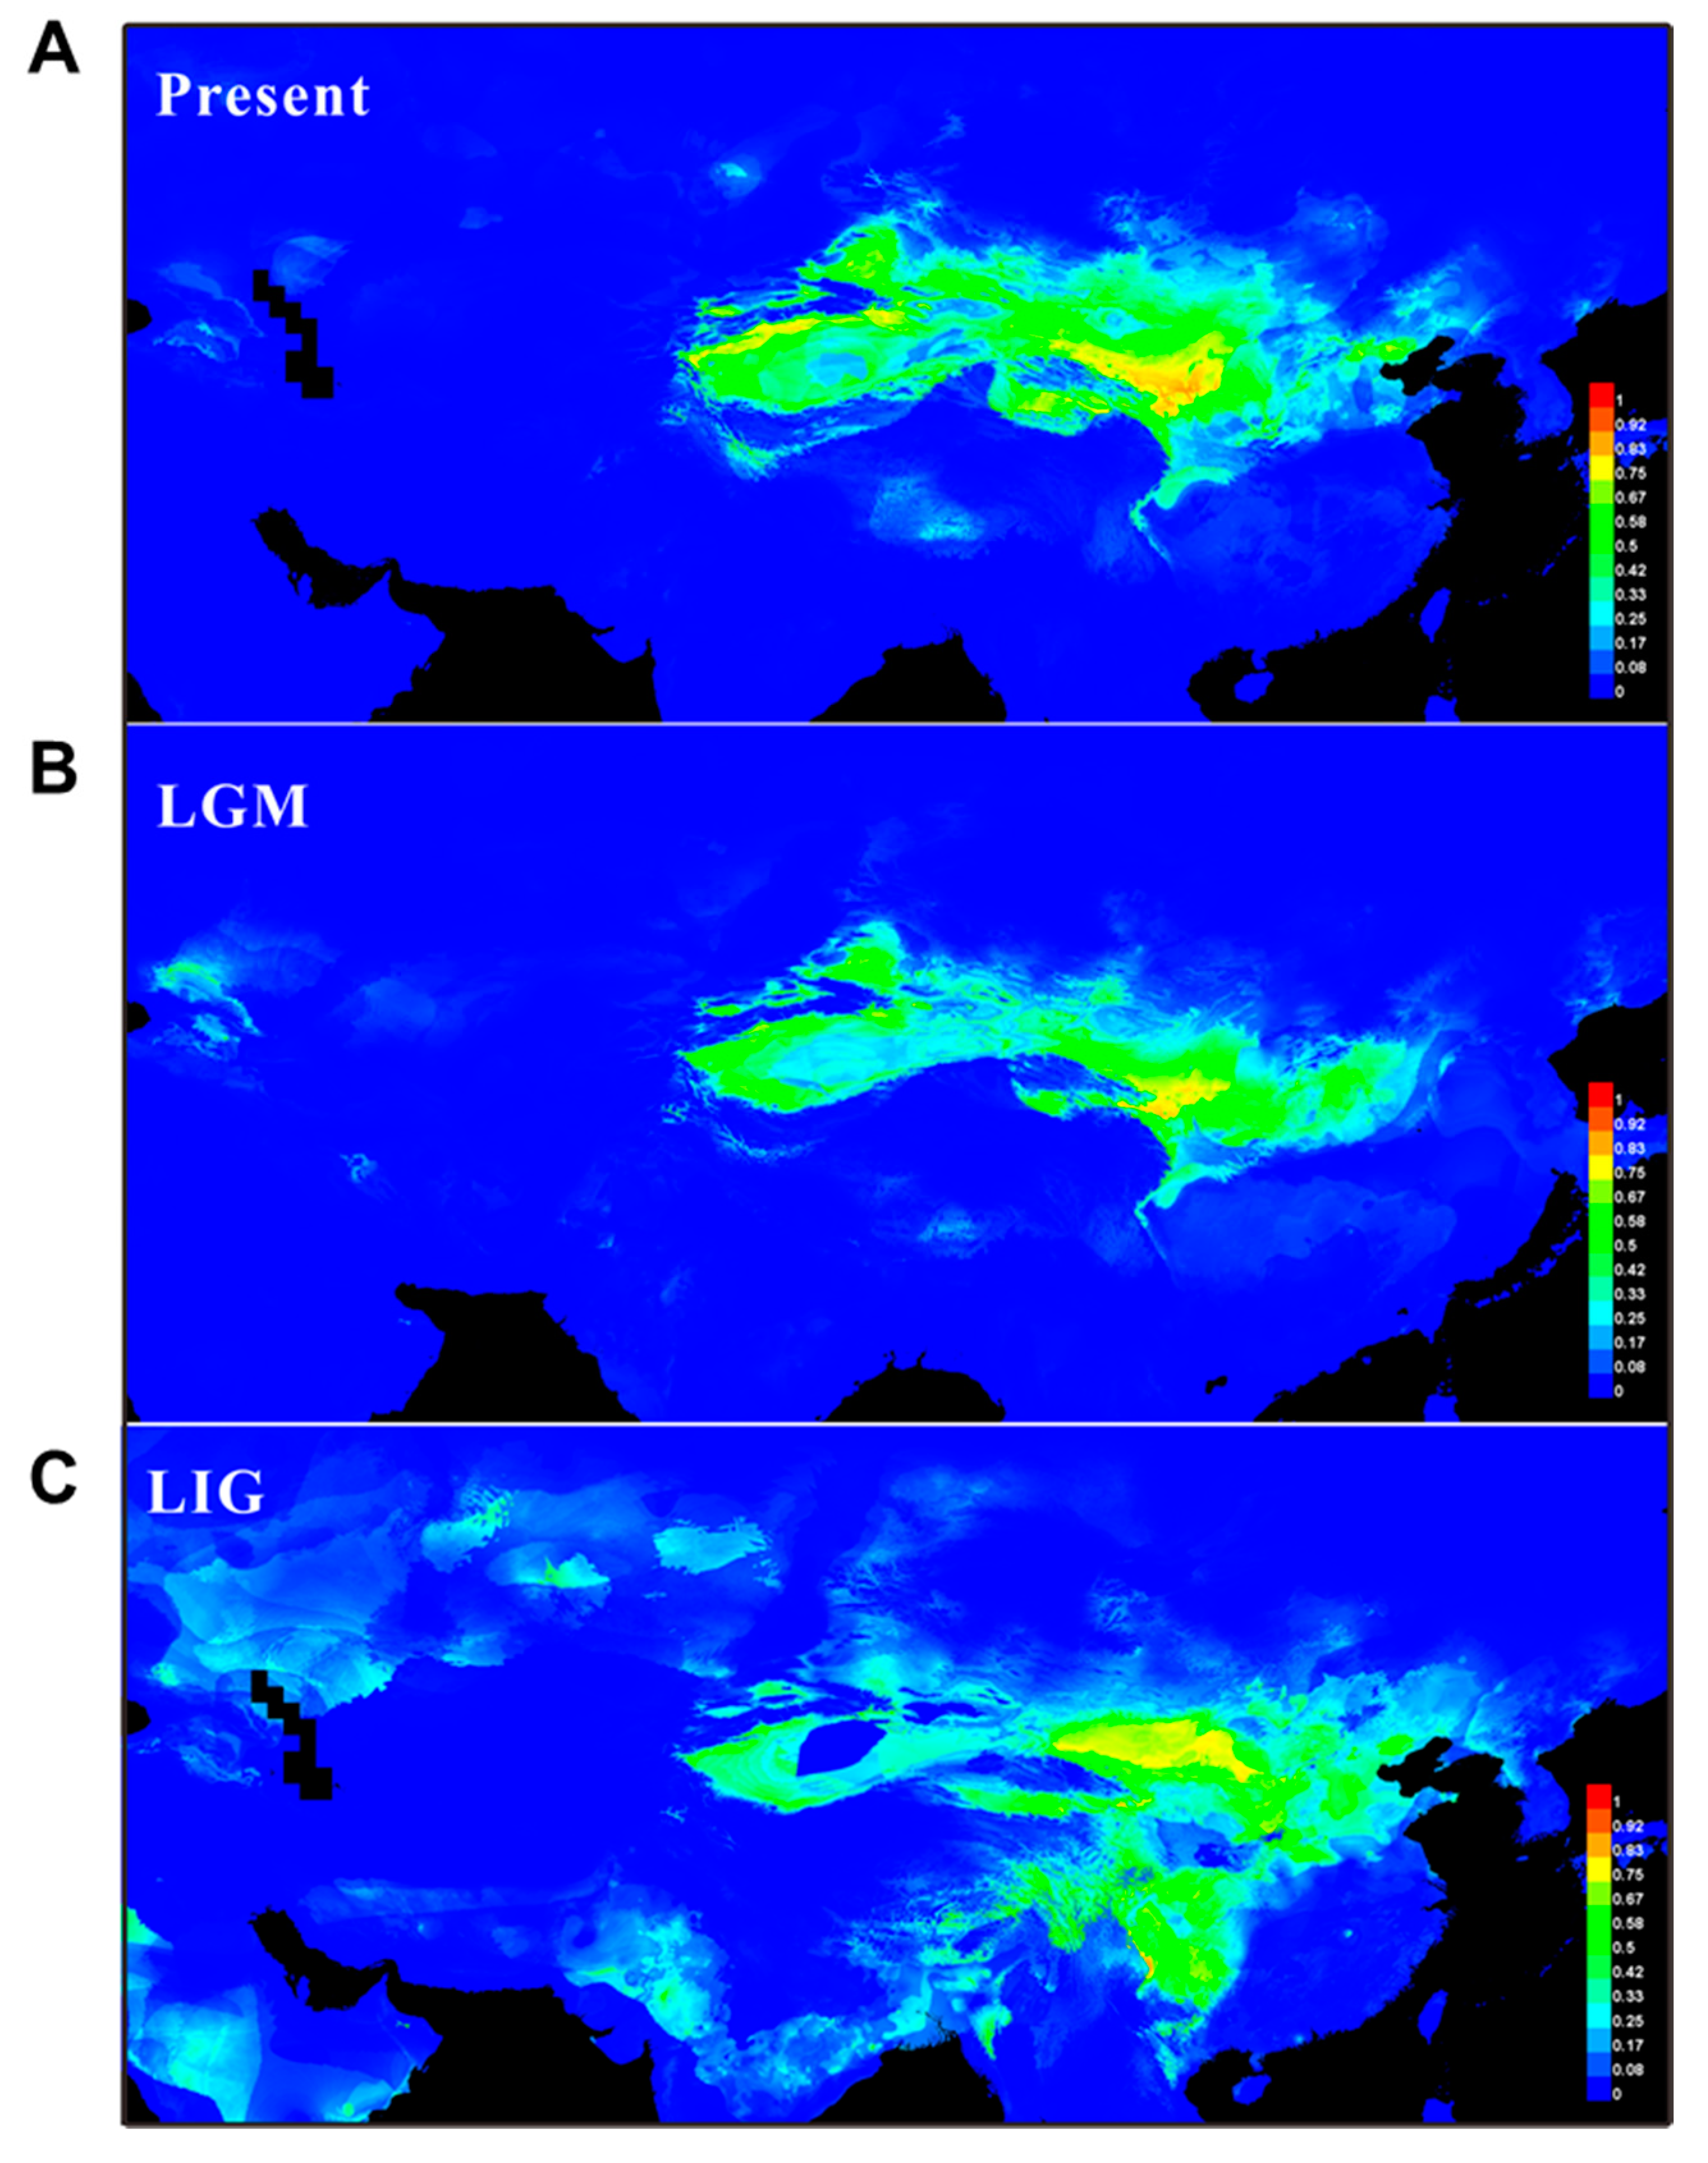
Based on the 206 recorded natural localities, including our sampling sites, the potential distribution of N. tangutorum was evaluated using Maxent software. The results revealed that the underlying niche range of N. tangutorum almost covers the entire eastern desert and semi-desert regions of northwest China (Figure 6A). Additionally, the area under the curve (AUC) with a value of 0.963 ± 0.014 confirmed that the ENM analysis conducted in the present study was reasonable and accurate. Furthermore, out of 19 bioclimate variants, factors Bio19 (precipitation in coldest quarter) and Bio11 (mean temperature of coldest quarter) were indicated to play a central role in determining the potential niches of N. tangutorum (Supplementary Table S4). The ENM data revealed that the distribution range of N. tangutorum fluctuated during the periods of the Last Glacial Maximum (LGM) and Last Inter-Glacial (LIG) in comparison to its present distribution. More specifically, the preferred habitats of N. tangutorum contracted significantly during the LGM period, while the habitats expanded and became fragmented during the LIG period (Figure 6B,C).

3. Discussion

3.1. Geographic Structure and Genetic Diversity of N. tangutorum

The impact of historical geological and paleo-climate events on the distribution and geographical structure of species has been well established in many species that inhabit the regions of the QTP [7,29,37,38]. The influence of the development and evolution of EAMS on the phylogeographic structure and genetic diversity of plant species has largely been unexplored, especially for the species located in EAMS-sensitive zones. In the present study, molecular variance analysis of cpDNA sequences was used to dissect the mechanisms underlying the population divergence and demographic history of the desert shrub species N. tangutorum in responses to East Asian monsoon circulation scenarios. Although 21 populations with a total of 161 individuals of N. tangutorum might have not covered its entire distributional ranges in the northwest China and other regions in Central Asia, these sampled populations were located in the EAMS-sensitive zones, enabling us to disentangle the above-mentioned issues.
The genetic diversity analysis (Nst > Gst, Table 2) displayed a significant phylogeographical structure among all populations of N. tangutorum. The sampled populations clustered into three distinct lineages, designated as West, East-A, and East-B lineages, based on the construction of a phylogenetic network and PhyML tree (Figure 2A and Figure 4). Notably, the haplotypes predominantly located in western and eastern regions were found to be separated into the so-called West and East lineages, respectively (Figure 2B), suggesting that molecular variance among populations is conserved and regional, as has been recently reported for several alpine species, such as Lancea tibetica, Panzerina lanata, and Corydalis hendersonii [6,15,39]. It is worth noting that the H31 haplotype, as a recent common ancestral haplotype, was first differentiated from the outgroup lineage with high bootstrap values, while its adjacent H11 haplotype was shared with both East-A and East-B lineages (Figure 2A and Figure 3). This finding suggests that the N. tangutorum population originated in the eastern region of northwest China. Notably, the phylogenetic analysis indicated that the East-A lineage diverged first (Figure 4), which is consistent with a previous report indicating that eastern central Asia is the ancestral origin of Nitraria [36]. Higher degrees of genetic variation were found in both East-A (HT = 0.843) and East-B (HT = 0.930) lineages than in the West lineage (HT = 0.375) (Table 2), further demonstrating that population divergence in N. tangutorum originated in the eastern groups. Taken together, these data suggest that genetic variation is a major driver of population differentiation [40,41,42].
A significantly high level of pairwise genetic differentiation was evident between the western and two eastern lineages (ΦST (West versus East-A) = 0.538, p < 0.05; ΦST (West versus East-B) = 0.553, p < 0.01) (Table 4), indicating that an evident geographical isolation occurred between them. The geographic isolation may be attributed to the local mountain topography, since the complex local topography of the QTP and adjacent regions has been demonstrated to have triggered inter- or intra-species divergence, altering the phylogeographic genetic structure patterns in a variety of plant species [8,29,37,43]. The high level of genetic differentiation among the groups (FCT = 0.520, p < 0.01) also indicates restricted gene flow and the high probability of genetic isolation among the groups. Similar scenarios have been found in other desert species, such as R. soongarica and N. sphaerocarpa [23,44,45]. Due to the commonality of the data obtained on the above-mentioned species, which are distributed in the arid region of northwest China [28], it is plausible to suggest that regional topography and paleoclimate have a significant impact on the adaption and evolution of the N. tangutorum plants. Notably, our results revealed a high-level of genetic differentiation between different populations of N. tangutorum, but a stable level within individual populations. These findings were made based on the fact that the level of genetic diversity among populations was approximately two-fold greater than within populations (HT = 0.922 vs. HS = 0.470, respectively) (Table 2). The higher differentiation level among populations of N. tangutorum may be due to the intensifying aridification of northwest China induced by geological and paleoclimate scenarios, such as the uplift of the QTP, the fluctuation of glacial–interglacial cycles, as well as the onset and development of EAMS [11,23,46]. We hypothesize that the regional vast deserts encompassing the range of N. tangutorum species, such as the Bardain Jaran and Tengger Deserts, could potentially drive population divergence by impeding gene flow between N. tangutorum populations.

3.2. Intraspecific Divergence in N. tangutorum

The highest level of genetic differentiation was observed between the eastern populations of N. tangutorum based on the analysis of phylogenetic structure and geographical distribution of all the identified haplotypes (Figure 2 and Figure 3). Our analysis also revealed that both East-A and East-B lineages located in the eastern region exhibited intraspecific divergence [ΦST (East-A versus East-B) = 0.388, p < 0.01], and that the East-A lineage possessed the highest level of genetic diversity (HT = 0.930, p < 0.05) relative to the other lineages. An analogous phylogeographical genetic structure has been found in other xerophytes, such as R. soongarica, Ephedra sinica, E. intermedia, A. squarrosum, and Panzerina lanata [6,23,28,45,46]. The genetic divergence induced by the Quaternary climate oscillations was the result of this climatic event fostering habitat fragmentation, geographic isolation, and an increase in dispersal distance, which has been well established in many plant species [3,28,29,47]. The isolation of ecological niches may also contribute to genetic divergence. For example, genetic differentiation of the closely-related species E. sinica and E. intermedia resulted from changes in their ecological niches [46]. Based on the ENM analysis conducted in the present study, the potentially suitable ranges for N. tangutorum were significantly affected by paleoclimate changes (Figure 6). The preferred habitats of N. tangutorum were contracted due to the onset of a cold and dry climate during the LGM period (Figure 6B), while its habitat was extensively expanded and fragmented under the warm and moist climate of the LIG period (Figure 6C). It is widely believed that the range of a large proportion of alpine species contracted under glacial oscillations, and that this phenomenon accelerated the process of genetic divergence. This premise has been documented in many species of plants [16,19,39,48,49] and animals [50,51,52]. Two bioclimate factors, ‘precipitation’ and ‘temperature’, were greatly reduced during the LGM [53], and have been identified as the major factors determining suitable distribution ranges for N. tangutorum (Supplementary Table S4). These two factors are largely controlled by the EAMS, which covers the entire range of N. tangutorum in arid northwest China, including the Kumtag, Hexi corridor, Badain Jaran, and Tengger deserts (Figure 2B). Therefore, in addition to ecological niche changes and geographic barriers, it is apparent that the EAMS has also played a crucial role in triggering intraspecific divergence and population expansion, thus shaping the current genetic structure of the species of N. tangutorum.

3.3. Intraspecific Differentiations Triggered by the Local Monsoon Climate

The divergence of N. tangutorum from N. roborowskii was evaluated in our study by molecular dating. Based on the variations in the cpDNA sequence, the divergence has been projected to have occurred around 5.34 Ma (Figure 4, point “a”), which is generally consistent with the results of a previous report [36]. The aridification and range fragmentation due to orogenesis also accelerated the process of genetic divergence from N. roborowskii as drought-tolerant N. tangutorum prefers arid conditions. This is a common phenomenon that has also been documented in other plant species, including Caragana spp. [54], Meconopsis integrifolia [55], Ephedra spp. [56], and Phyllolobium spp. [57]. It has also been suggested that the EASM intensified in the late Miocene–Pliocene [58,59], which may be correlated with the separation of N. tangutorum from N. roborowskii.
The intraspecific divergence of N. tangutorum between different populations located in the eastern region was determined to have occurred ca. 2.53 Ma (Figure 4, point “b”). During this time, the EASM decreased and the EAWM began to strengthen. These paleoclimate events, especially the EAWM and the colder and drier climate [60,61], might have facilitated intraspecific differentiation in N. tangutorum. We suggested that the intensification of the EAWM contributed mostly to the initial intraspecific divergence of eastern N. tangutorum groups (East-A and East-B lineages) based on two factors. First, it is widely believed that the EAWM resulted in a cold and dry climate that would have enhanced arid conditions in northwest China [62], environmental conditions that are representative of the preferred habitats of N. tangutorum. Second, the intensifying EAWM aggravated aridification and accelerated the expansion of deserts in northwest China [63], thus further fostering habitat fragmentation that could drive intraspecific divergence [38]. The EAWM steadily strengthened during the Quaternary, while the EASM underwent a gradual weakening until ~1.8 Ma [62]. Rapid diversification of eastern populations of N. tangutorum toward western regions occurred with the stepwise intensification of the EAWM after ~1.85 Ma (Figure 4, point “c”). The West lineage completely diverged from the East-B lineage by ~0.62 Ma (Figure 4, point “d”), a timing that could be related to EAWM-induced enhancement of habitat aridification and isolation. We propose that the EAWM fostered the dispersion of the seeds of N. tangutorum toward west regions, thus contributing to intraspecific divergence and allopatric differentiation in N. tangutorum. In addition to the establishment of the western lineage of N. tangutorum, further diversification of the eastern populations occurred which lead to the complete establishment of two distinct East-A and East-B lineages during the EAWM.

3.4. Population Demography and Colonization

Both BSP and MDA analyses of genetic variation revealed that East-A and East-B lineages located in the EAMS zone experienced a slight population expansion (Figure 5). In particular, the potential habitat of two East lineages of N. tangutorum extensively expanded and fragmented during the LIG, relative to its present distribution, and then significantly contracted during the LGM. This kind of phylogeographic pattern of N. tangutorum appears to be consistent with the well-recognized ‘contraction/recolonization’ hypothesis described by Muellner-Riehl [10], which suggests that the species in the regions of the QTP contracted into glacial refugia during the LGM period and expanded again after the ice ages [10]. In fact, the suitable ranges of the majority of desert plants shrank during the LGM and expanded in the LIG, including species like Larix spp. and E. przewalskii [64,65]. Our findings suggest that the glacial and interglacial climates might have greatly contracted the range and accelerated the fragmentation of N. tangutorum, whereas the alternate climates are closely related to the East Asian monsoon. Although the influence of glacial and interglacial climates on population demography has been established in the desert plant, Populus euphratica [38], the impact of the monsoon system is not well understood. Nitraria tangutorum populations probably experienced frequent bottlenecks and habitat fragmentation during the climatic oscillations that occurred between the EAWM and EASM in the Pleistocene. It is plausible that these scenarios might have further promoted the accumulation of new mutations in local populations [38,66,67]. Consequently, this would have enlarged the effective population in the eastern climate-sensitive region as previously described [23].
It is noteworthy that the Western lineage originated from the JQ population harboring the H19 haplotype present in the East-A lineage (Figure 2 and Table 1). This feature, along with the coincident analysis of ancestral haplotypes determined by RASP (Figure 3), strongly suggests that the western populations might have migrated from the eastern regions across the Hexi corridor and colonized the western region (Figure 7). The EAWM initially intensified during the Pliocene–Pleistocene boundary (2.6 Ma) based on numerous stratigraphic studies conducted across the Loess Plateau [60,68,69]. Thus, it appears that the East-A group expanded toward the western region, driven by the EAWM (Figure 7). Contrastingly, the surrounding mountain topography of the Hexi corridor, such as the Qilian, Longshou, Mazong, and Heli mountains, could have served as a barrier to seed dispersal in N. tangutorum. The Hexi corridor has been recognized as a floristic passage from central Asia to the local deserts [70], and as a possible refugium for desert plants [44,71]. Therefore, we suggest that the Hexi corridor may have served as a “dispersal corridor” for population migration of N. tangutorum from the eastern to the western desert regions during the intensification of the EAWM (Figure 7).
The migration model may be common for plants in the arid northwest China, because other plant species grown in the areas adjacent to the Hexi corridor, for example, Atraphaxis spp., Zygophyllum xanthoxylon, as well as two closely related species of N. tangutorum, N. roborowskii and N. sphaerocarpa, are also suggested to expand toward the western regions in postglacial periods through the Hexi corridor [71,72,73]. However, the most extensive glaciation occurred in northwest China around 0.8 Ma, when the climate was extremely harsh for species survival and even led to the extinction of many plant species. Therefore, it is reasonable to suggest that the Hexi corridor was a suitable refugium for N. tangutorum. When the climate was milder during the last stage of glaciation, N. tangutorum continued to disperse toward western regions and recolonize its present locations. Subsequently, the West lineage became completely separated from the East groups around 0.62 Ma (Figure 4, point “d”) during the mid-Pleistocene. We suggest that the EAWM experienced consecutive periods of intensification after the H19 haplotype was established in the Hexi corridor region (population JQ).

4. Materials and Methods

4.1. Population Sampling

A total of 21 populations comprising 161 individuals of N. tangutorum were collected from its main distribution ranges in the EAMS-sensitive zone that included the Sinkiang, Gansu, Ningxia, Inner Mongolia, and Qinghai provinces (Table 1). The collection sites were all located in the arid northwest China spanning the Taklimakan desert, Qaidam basin, Kumtag desert, Hexi corridor, and Badain Jaran-Tengger desert from the west to the east. Fresh leaves were sampled from 5 to 8 individuals of each population. The sampled plants were spaced at least 30 m apart from each other to decrease sampling bias. The samples were placed in sealed envelopes and dehydrated with silica gel. The geographic location of each sampled site was recorded with a global positioning system (GPS; Garmin, Taiwan; Supplementary Table S1). N. roborowskii was sampled for use as an outgroup in the subsequent analyses. Voucher specimens were deposited in the Key Laboratory of Stress Physiology and Ecology in Cold and Arid Regions, Cold and Arid Regions Environmental and Engineering Research Institute, Chinese Academy of Sciences.

4.2. DNA Extraction, PCR Amplification and Sequencing

Genomic DNA was isolated and purified using a Plant Genomic DNA kit (Qiagen, Valencia, CA, USA), and stored at −40 °C for subsequent PCR amplification. Five pairs of cpDNA primers, trnH-psbA, ndhC-trnV, psbE-petL, rps4 and rpl32-trnL were identified as being suitable for use in the study based on the prescreening of 24 primer pairs (Supplementary Table S5). The five selected primer pairs were used to generate PCR fragments of all 161 individuals of N. tangutorum for sequencing (Supplementary Table S2). The PCR reaction conditions and thermal programs were identical to those that were previously reported [23]. The PCR products were purified with TIAN quick Midi Purification Kits (TIANGEN, Beijing, China), and were subsequently sequenced using both forward and reverse primers on an ABI 3130xl Genetic Analyzer (Applied Biosystems, Foster City, CA, USA) platform. All the obtained sequences were examined using BioEdit v 7.0.5.3 software and aligned with ClustalX v.1.8150 with final alignment adjustments that were performed by visual inspection. All the obtained sequences of N. tangutorum were deposited in GenBank as accessions MT582159-MT582188.

4.3. Population Nucleotide Diversity and Phylogeographical Analysis

Nucleotide diversity parameters, including segregating sites (s), number of haplotypes (n), nucleotide diversity (pi), total haplotype diversity (hd), and nucleotide diversity within populations (π) in each population, were determined using DnaSP v. 5.10 software as previously described [23]. Arlequin v.3.11 software was used to generate pairwise matrices of genetic differentiation. The spatial genetic structures of chlorotypes for all N. tangutorum populations were determined by a spatial analysis of molecular variance by identifying the number of groups (K) with the highest value of genetic differentiation using SAMOVA v.1.0 software. The online tool, PERMUT (http://www.pierroton.inra.fr/genetics/lab-/software/PermutCpSSR) was employed to calculate population divergence parameters [number of substitution types (NST) and interpopulation differentiation (GST)], and population haplotype diversity (total-population, HT; within-population, Hs) with 1000 random permutations. The genetic differentiation among groups (FCT), populations within group, and within populations (FST) were determined by conducting a hierarchical analysis of molecular variance (AMOVA) using Arlequin v.3.1156 software with default parameters. The pairwise differentiations (ΦST) between all pairs of three groups were also estimated using 1000 permutations.

4.4. Phylogenetic Analyses and Molecular Dating

The NETWORK v.4.6.1.2 and PhyML v.3.0 software programs were used to construct the topologies and phylogenetic relationship of chlorotypes using median-joining and maximum likelihood models, respectively. The selection of a nucleotide substitution model and ML analysis were performed as described in our previous studies [23,28]. In addition, the dating time of the divergence between lineages was evaluated by Bayesian analysis implemented using the BEAST v.1.8.0 as described in our previous study [23], except that the root age of the outgroup N. roborowskii lineage was set at upper 86.16 Ma and lower 57.7 Ma based on the available fossil information for N. tangutorum [36]. In addition, the reconstruct ancestral state in phylogenies (RASP) v.3.0 software was employed to evaluate the ancestral state and haplotype divergence using the Bayesian Binary Method (BBM) [28].

4.5. Inference of Demographic History and Ecological Niche Modelling

The predicted demographic expansion of populations was estimated through neutrality tests with Tajima’s D, Fu’s Fs, and MDA using Arlequin v3.11 software. The historical dynamics of population size were also analyzed in parallel using the Arlequin v3.11 software by BSP. The preferred distributions of N. tangutorum were predicted based on a total of 206 recorded natural localities containing the collection sites used in this study along with online herbarium records (Chinese Virtual Herbarium, available at http://www.cvh.org.cn/). To predict the potential distribution range of N. tangutorum in response to glacial climatic oscillations, Maxent v.3.3 software was used to construct ecological niche modeling (ENM) under the maximum entropy algorithm using the WorldClim database from the years 1955–2000 (http://www.worldclim.org/) as described in our previous study [23].

5. Conclusions

The past climate oscillation and geological events have been considered as important drivers to trigger the diversification, population expansion, and speciation of plant species, especially those distributed in the QTP and adjacent regions. The evolution of EAMS, closely correlated with the multiple uplift of the QTP, has been found to result in the aridification of the central Asia interior, including the northwest China. Nitraria tangutorum that bears important economic and ecological values is a drought-tolerant shrub widely distributed in a broad range of sensitive zones of EAMS, especially the EAWM, in the northwest China. However, its genetic geographical patterns and demographic history under the EAWM were largely elusive. In this study, we profiled the genetic structure and population dynamic history of N. tangutorum using five cpDNA fragments of 161 individuals in a total of 21 populations. Three distinct lineages, including East-A, East-B, and West, were identified through the phylogenic analysis. Furthermore, the eastern regions were suggested to be the ancestral areas, wherein the split of East-A and -B lineages was significantly earlier than that of the West lineage. The higher level of genetic diversity among all populations than within populations was proposed to be closely linked to intensifying aridification of the northwest China induced by geological and paleoclimate scenarios, while the EAWM with characteristics of cold and drought enhanced the regional aridification. According to the results of ENM analysis, the potential distributions of N. tangutorum were predicted to contract and expand during the LGM and LIG periods, respectively, when the EAMS controlling two bioclimate factors, precipitation and temperature, predominantly influenced the surrounding environments for plant survival and led to inter- and intra-specific differentiation. Intriguingly, the West lineage was suggested to have resulted from the dispersal of N. tangutorum located in the eastern regions through the Hexi corridor under the strengthened EAWM during the mid-Pleistocene. Thus, EAWM was regarded as a major trigger of regional diversification and population expansion of drought-tolerant N. tangutorum. This study will therefore deeply facilitate our understanding of the development of EASM and its influences on phylogeographic structures and demography of drought-tolerant plants distributed in northwest China.

Supplementary Materials

The following are available online at https://www.mdpi.com/2223-7747/9/9/1100/s1. Supplementary Table S1. Geographical information for the sampled populations of Nitraria tangutorum; Supplementary Table S2. Characteristics of the primers and thermal programs for the five cpDNA fragments in this study; Supplementary Table S3. Variable sites of the aligned sequences in 33 haplotypes; Supplementary Table S4. List of the bioclimatic variables defining the ecological niche of Nitraria tangutorum; Supplementary Table S5. Twenty-four most variable regions in chloroplast genomes detected in this study.

Author Contributions

Conceptualization, H.Y., B.Z. and X.-F.M.; methodology, H.Y., L.W. and L.-S.P.T.; software, H.Y., L.W., Y.S. and C.Q.; validation, H.Y., H.Z. and W.W.; formal analysis, H.Y. and B.Z.; investigation, H.Y. and B.Z.; resources, H.Y. and X.-F.M.; data curation, H.Y., L.-S.P.T. and B.Z.; writing—original draft preparation, H.Y. and B.Z.; writing—review and editing, H.Y., B.Z. and L.-S.P.T.; visualization, B.Z. and L.-S.P.T.; supervision, B.Z.; project administration, H.Y., H.Z., W.W. and B.Z.; funding acquisition, H.Y., H.Z., W.W. and B.Z. All authors have read and agreed to the published version of the manuscript.

Funding

This research was funded by the National Natural Science Foundation of China (Nos 31860060 and 41761107), Natural Science Foundation of Qinghai Province (Nos 2017-ZJ-940Q, 2017-ZJ-943Q and 2019-ZJ-908), the Open Project of State Key Laboratory of Plateau Ecology and Agriculture of Qinghai University (No. 2017-ZZ-09), the Open Project of Key Laboratory of Restoration Ecology for Cold Regions in Qinghai (No. 2019-KF-09), the Qinghai Innovation Platform Construction Project (No. 2017-ZJ-Y20), and the Second Tibetan Plateau Scientific Expedition and Research (STEP) program (Nos 2019QZKK0302 and 2019QZKK0502).

Conflicts of Interest

The authors declare no conflict of interest.

Abbreviations

QTPQinghai-Tibet Plateau
EAMSEast Asian monsoon system
EASMEast Asian summer monsoon
EAWMEast Asian winter monsoon
MaMillion years ago
cpDNAchloroplast DNA
GPSglobal positioning system
AMOVAanalysis of molecular variance
MLMaximum likelihood
RASPreconstruct ancestral state in phylogenies
BSPBayesian skyline plot
MDAmismatch distribution analysis
ENMecological niche modeling
LGMLast Glacial Maximum
LIGLast Inter-Glacial

References

  1. Hewitt, G. The genetic legacy of the Quaternary ice ages. Nature 2000, 405, 907–913. [Google Scholar] [CrossRef] [PubMed]
  2. Hewitt, G.M. Genetic consequences of climatic oscillations in the Quaternary. Philos. Trans. R. Soc. Lond. Ser. B Biol. Sci. 2004, 359, 183–195. [Google Scholar] [CrossRef] [Green Version]
  3. Meng, H.H.; Gao, X.Y.; Huang, J.F.; Zhang, M.L. Plant phylogeography in arid Northwest China: Retrospectives and perspectives. J. Syst. Evol. 2015, 53, 33–46. [Google Scholar] [CrossRef]
  4. Wang, P.; Zhang, X.; Tang, N.; Liu, J.; Xu, L.; Wang, K. Phylogeography of Libanotis buchtormensis (Umbelliferae) in disjunct populations along the deserts in northwest China. PLoS ONE 2016, 11, e0159790. [Google Scholar] [CrossRef] [PubMed] [Green Version]
  5. Zhang, Y.; Yu, Q.; Zhang, Q.; Hu, X.; Hu, J.; Fan, B. Regional-scale differentiation and phylogeography of a desert plant Allium mongolicum (Liliaceae) inferred from chloroplast DNA sequence variation. Plant Syst. Evol. 2017, 303, 451–466. [Google Scholar] [CrossRef]
  6. Zhao, Y.; Zhang, H.; Pan, B.; Zhang, M. Intraspecific divergences and phylogeography of Panzerina lanata (Lamiaceae) in northwest China. PeerJ 2019, 7, e6264. [Google Scholar] [CrossRef] [Green Version]
  7. Favre, A.; Päckert, M.; Pauls, S.U.; Jähnig, S.C.; Uhl, D.; Michalak, I.; Muellner-Riehl, A.N. The role of the uplift of the Qinghai-Tibetan Plateau for the evolution of Tibetan biotas. Biol. Rev. Camb. Philos. Soc. 2015, 90, 236–253. [Google Scholar] [CrossRef]
  8. Liu, J.Q.; Duan, Y.W.; Hao, G.; Ge, X.J.; Sun, H. Evolutionary history and underlying adaptation of alpine plants on the Qinghai-Tibet Plateau. J. Syst. Evol. 2014, 52, 241–249. [Google Scholar] [CrossRef]
  9. Liu, J.Q.; Wang, Y.J.; Wang, A.L.; Hideaki, O.; Abbott, R.J. Radiation and diversification within the Ligularia-Cremanthodium-Parasenecio complex (Asteraceae) triggered by uplift of the Qinghai-Tibetan Plateau. Mol. Phylogenet. Evol. 2006, 38, 31–49. [Google Scholar] [CrossRef]
  10. Muellner-Riehl, A.N. Mountains as evolutionary arenas: Patterns, emerging approaches, paradigm shifts and their implications for plant phylogeographic research in the Tibeto-Himalayan Region. Front. Plant Sci. 2019, 10, 195. [Google Scholar] [CrossRef] [Green Version]
  11. Meng, H.H.; Zhang, M.L. Diversification of plant species in arid northwest China: Species-level phylogeographical history of Lagochilus Bunge ex Bentham (Lamiaceae). Mol. Phylogenet. Evol. 2013, 68, 398–409. [Google Scholar] [CrossRef] [PubMed]
  12. Christmas, M.J.; Breed, M.F.; Lowe, A.J. Constraints to and conservation implications for climate change adaptation in plants. Conserv. Genet. 2016, 17, 305–320. [Google Scholar] [CrossRef] [Green Version]
  13. Guo, F.; Lenoir, J.; Bonebrake, T.C. Land-use change interacts with climate to determine elevational species redistribution. Nat. Commun. 2018, 9, 1315. [Google Scholar] [CrossRef] [PubMed] [Green Version]
  14. Jia, S.W.; Zhang, M.L. Pleistocene climate change and phylogeographic structure of the Gymnocarpos przewalskii (Caryophyllaceae) in the northwest China: Evidence from plastid DNA, ITS sequences and Microsatellite. Ecol. Evol. 2019, 9, 5219–5235. [Google Scholar] [CrossRef] [Green Version]
  15. Li, Q.; Guo, X.; Niu, J.; Duojie, D.; Li, X.; Opgenoorth, L.; Zou, J. Molecular phylogeography and evolutionary history of the endemic species Corydalis hendersonii (Papaveraceae) on the Tibetan Plateau inferred from chloroplast DNA and ITS sequence variation. Front. Plant Sci. 2020, 11, 436. [Google Scholar] [CrossRef] [Green Version]
  16. Li, Y.; Gao, Q.B.; Gengji, Z.M.; Jia, L.K.; Wang, Z.H.; Chen, S.L. Rapid intraspecific diversification of the alpine species Saxifraga sinomontana (Saxifragaceae) in the Qinghai-Tibetan Plateau and Himalayas. Front. Genet. 2018, 9, 381. [Google Scholar] [CrossRef] [Green Version]
  17. Shahzad, K.; Jia, Y.; Chen, F.L.; Zeb, U.; Li, Z.H. Effects of mountain uplift and climatic oscillations on phylogeography and species divergence in four endangered Notopterygium herbs. Front. Plant Sci. 2017, 8, 1929. [Google Scholar] [CrossRef] [Green Version]
  18. Renner, S.S. Available data point to a 4-km-high Tibetan Plateau by 40 Ma, but 100 molecular-clock papers have linked supposed recent uplift to young node ages. J. Biogeogr. 2016, 43, 1479–1487. [Google Scholar] [CrossRef]
  19. Wang, Z.M.; Meng, S.Y.; Rao, G.Y. Quaternary climate change and habitat preference shaped the genetic differentiation and phylogeography of Rhodiola sect. Prainia in the southern Qinghai-Tibetan Plateau. Ecol. Evol. 2019, 9, 8305–8319. [Google Scholar] [CrossRef] [Green Version]
  20. Stewart, J.R.; Lister, A.M.; Barnes, I.; Dalén, L. Refugia revisited: Individualistic responses of species in space and time. Proc. Biol. Sci. 2010, 277, 661–671. [Google Scholar] [CrossRef] [Green Version]
  21. Liao, Y.Y.; Gichira, A.W.; Wang, Q.F.; Chen, J.M. Molecular phylogeography of four endemic Sagittaria species (Alismataceae) in the Sino-Japanese floristic region of east Asia. Bot. J. Linn. Soc. 2015, 180, 6–20. [Google Scholar] [CrossRef] [Green Version]
  22. Wang, Z.W.; Chen, S.T.; Nie, Z.L.; Zhang, J.W.; Zhou, Z.; Deng, T.; Sun, H. Climatic factors drive population divergence and demography: Insights based on the phylogeography of a riparian plant species endemic to the Hengduan mountains and adjacent regions. PLoS ONE 2015, 10, e0145014. [Google Scholar] [CrossRef] [PubMed] [Green Version]
  23. Yin, H.; Yan, X.; Shi, Y.; Qian, C.; Li, Z.; Zhang, W.; Wang, L.; Li, Y.; Li, X.; Chen, G.; et al. The role of East Asian monsoon system in shaping population divergence and dynamics of a constructive desert shrub Reaumuria soongarica. Sci. Rep. 2015, 5, 15823. [Google Scholar] [CrossRef] [Green Version]
  24. Gomez-diaz, E.; Sindaco, R.; Pupin, F.; Fasola, M.; Carranza, S. Origin and in situ diversification in Hemidactylus geckos of the Socotra Archipelago. Mol. Ecol. 2012, 21, 4074–4092. [Google Scholar] [CrossRef] [PubMed]
  25. Kong, H.; Condamine, F.L.; Harris, A.; Chen, J.; Pan, B.; Möller, M.; Hoang, V.S.; Kang, M. Both temperature fluctuations and East Asian monsoons have driven plant diversification in the karst ecosystems from southern China. Mol. Ecol. 2017, 26, 6414–6429. [Google Scholar] [CrossRef] [PubMed]
  26. Ma, X.; Wang, Z.; Tian, B.; Sun, H. Phylogeographic analyses of the East Asian endemic genus Prinsepia and the role of the East Asian monsoon system in shaping a north-south divergence pattern in China. Front. Genet. 2019, 10, 128. [Google Scholar] [CrossRef] [Green Version]
  27. Shi, C.M.; Ji, Y.J.; Liu, L.; Wang, L.; Zhang, D.X. Impact of climate changes from Middle Miocene onwards on evolutionary diversification in Eurasia: Insights from the mesobuthid scorpions. Mol. Ecol. 2013, 22, 1700–1716. [Google Scholar] [CrossRef]
  28. Qian, C.; Yin, H.; Shi, Y.; Zhao, J.; Yin, C.; Luo, W.; Dong, Z.; Chen, G.; Yan, X.; Wang, X.-R.; et al. Population dynamics of Agriophyllum squarrosum, a pioneer annual plant endemic to mobile sand dunes, in response to global climate change. Sci. Rep. 2016, 6, 26613. [Google Scholar] [CrossRef] [Green Version]
  29. Qiu, Y.X.; Fu, C.X.; Comes, H.P. Plant molecular phylogeography in China and adjacent regions: Tracing the genetic imprints of Quaternary climate and environmental change in the world’s most diverse temperate flora. Mol. Phylogenet. Evol. 2011, 59, 225–244. [Google Scholar] [CrossRef]
  30. Zhou, W.; Wang, Y.; Yang, F.; Dong, Q.; Wang, H.; Hu, N. Rapid determination of amino acids of Nitraria tangutorum Bobr. from the Qinghai–Tibet Plateau using HPLC-FLD-MS/MS and a highly selective and sensitive pre-column derivatization method. Molecules 2019, 24, 1665. [Google Scholar] [CrossRef] [Green Version]
  31. Wang, Y.; Chen, M.; Yan, L.; Yang, G.; Ma, J.; Deng, W. Quantifying threshold water tables for ecological restoration in arid northwestern China. Ground Water 2020, 58, 132–142. [Google Scholar] [CrossRef] [PubMed]
  32. Zhu, Y.J.; Lu, Q.; Wu, B.; Li, Y.H.; Yao, B.; Zhang, J.X. Effects of increased precipitation on the water use of Nitraira tangutorum at southeast edge of Baddain Jaran Desert in China. J. Appl. Ecol. 2013, 24, 41–48. [Google Scholar]
  33. Ni, W.; Gao, T.; Wang, H.; Du, Y.; Li, J.; Li, C.; Wei, L.; Bi, H. Anti-fatigue activity of polysaccharides from the fruits of four Tibetan plateau indigenous medicinal plants. J. Ethnopharmacol. 2013, 150, 529–535. [Google Scholar] [CrossRef] [PubMed]
  34. Zhao, J.Q.; Wang, Y.M.; Yang, Y.L.; Zeng, Y.; Wang, Q.L.; Shao, Y.; Mei, L.J.; Shi, Y.P.; Tao, Y.D. Isolation and identification of antioxidant and α-glucosidase inhibitory compounds from fruit juice of Nitraria tangutorum. Food Chem. 2017, 227, 93–101. [Google Scholar] [CrossRef] [PubMed]
  35. Petit, R.J.; Duminil, J.; Fineschi, S.; Hampe, A.; Salvini, D.; Vendramin, G.G. Comparative organization of chloroplast, mitochondrial and nuclear diversity in plant populations. Mol. Ecol. 2005, 14, 689–701. [Google Scholar] [CrossRef] [Green Version]
  36. Zhang, M.L.; Temirbayeva, K.; Sanderson, S.C.; Chen, X. Young dispersal of xerophil Nitraria lineages in intercontinental disjunctions of the Old World. Sci. Rep. 2015, 5, 13840. [Google Scholar] [CrossRef] [PubMed]
  37. Wen, J.; Zhang, J.Q.; Nie, Z.L.; Zhong, Y.; Sun, H. Evolutionary diversifications of plants on the Qinghai-Tibetan Plateau. Front. Genet. 2014, 5, 4. [Google Scholar] [CrossRef] [Green Version]
  38. Zeng, Y.F.; Zhang, J.G.; Abuduhamiti, B.; Wang, W.T.; Jia, Z.Q. Phylogeographic patterns of the desert poplar in Northwest China shaped by both geology and climatic oscillations. BMC Evol. Biol. 2018, 18, 75. [Google Scholar] [CrossRef] [Green Version]
  39. Xia, M.; Tian, Z.; Zhang, F.; Khan, G.; Gao, Q.; Xing, R.; Zhang, Y.; Yu, J.; Chen, S. Deep intraspecific divergence in the endemic herb Lancea tibetica (Mazaceae) distributed over the Qinghai-Tibetan Plateau. Front. Genet. 2018, 9, 492. [Google Scholar] [CrossRef]
  40. Polato, N.R.; Gray, M.M.; Gill, B.A.; Becker, C.G.; Casner, K.L.; Flecker, A.S.; Kondratieff, B.C.; Encalada, A.C.; Poff, N.L.; Funk, W.C.; et al. Genetic diversity and gene flow decline with elevation in montane mayflies. Heredity 2017, 119, 107–116. [Google Scholar] [CrossRef]
  41. Garot, E.; Joët, T.; Combes, M.C.; Lashermes, P. Genetic diversity and population divergences of an indigenous tree (Coffea mauritiana) in Reunion Island: Role of climatic and geographical factors. Heredity 2019, 122, 833–847. [Google Scholar] [CrossRef] [Green Version]
  42. Liu, Y.; Dietrich, C.H.; Wei, C. Genetic divergence, population differentiation and phylogeography of the cicada Subpsaltria yangi based on molecular and acoustic data: an example of the early stage of speciation? BMC Evol. Biol. 2019, 19, 5. [Google Scholar] [CrossRef] [PubMed] [Green Version]
  43. Cun, Y.Z.; Wang, X.Q. Plant recolonization in the Himalaya from the southeastern Qinghai-Tibetan Plateau: Geographical isolation contributed to high population differentiation. Mol. Phylogenet. Evol. 2010, 56, 972–982. [Google Scholar] [CrossRef] [PubMed]
  44. Su, Z.; Zhang, M. Evolutionary response to Quaternary climate aridification and oscillations in north-western China revealed by chloroplast phylogeography of the desert shrub Nitraria sphaerocarpa (Nitrariaceae). Biol. J. Linn. Soc. Lond. 2013, 109, 757–770. [Google Scholar] [CrossRef] [Green Version]
  45. Li, Z.H.; Chen, J.; Zhao, G.F.; Guo, Y.P.; Kou, Y.X.; Ma, Y.Z.; Wang, G.; Ma, X.F. Response of a desert shrub to past geological and climatic change: A phylogeographic study of Reaumuria soongarica (Tamaricaceae) in western China. J. Syst. Evol. 2012, 50, 351–361. [Google Scholar] [CrossRef]
  46. Yin, H.; Yan, X.; Zhang, W.; Shi, Y.; Qian, C.; Yin, C.; Tian, F.; Wang, X.; Ma, X.F. Geographical or ecological divergence between the parapatric species Ephedra sinica and E. intermedia? Plant Syst. Evol. 2016, 302, 1157–1170. [Google Scholar] [CrossRef]
  47. Bai, W.N.; Wang, W.T.; Zhang, D.Y. Phylogeographic breaks within Asian butternuts indicate the existence of a phytogeographic divide in East Asia. New Phytol. 2016, 209, 1757–1772. [Google Scholar] [CrossRef] [Green Version]
  48. Liu, M.L.; He, Y.L.; López-Pujol, J.; Jia, Y.; Li, Z.H. Complex population evolutionary history of four cold-tolerant Notopterygium herb species in the Qinghai-Tibetan Plateau and adjacent areas. Heredity (Edinb) 2019, 123, 242–263. [Google Scholar] [CrossRef]
  49. Zhang, Y.Z.; Zhu, R.W.; Zhong, D.L.; Zhang, J.Q. Nunataks or massif de refuge? A phylogeographic study of Rhodiola crenulata (Crassulaceae) on the world’s highest sky islands. BMC Evol. Biol. 2018, 18, 154. [Google Scholar] [CrossRef] [Green Version]
  50. Ding, L.; Liao, J. Phylogeography of the Tibetan hamster Cricetulus kamensis in response to uplift and environmental change in the Qinghai-Tibet Plateau. Ecol. Evol. 2019, 9, 7291–7306. [Google Scholar] [CrossRef] [Green Version]
  51. Ding, L.; Liao, J.; Liu, N. The uplift of the Qinghai-Tibet Plateau and glacial oscillations triggered the diversification of Tetraogallus (Galliformes, Phasianidae). Ecol. Evol. 2020, 10, 1722–1736. [Google Scholar] [CrossRef] [PubMed] [Green Version]
  52. Li, J.; Song, G.; Liu, N.; Chang, Y.; Bao, X. Deep south-north genetic divergence in Godlewski’s bunting (Emberiza godlewskii) related to uplift of the Qinghai-Tibet Plateau and habitat preferences. BMC Evol. Biol. 2019, 19, 161. [Google Scholar] [CrossRef] [PubMed] [Green Version]
  53. Rehfeld, K.; Münch, T.; Ho, S.L.; Laepple, T. Global patterns of declining temperature variability from the last glacial maximum to the holocene. Nature 2018, 554, 356–359. [Google Scholar] [CrossRef] [PubMed]
  54. Zhang, M.L.; Fritsch, P.W. Evolutionary response of Caragana (Fabaceae) to Qinghai–Tibetan Plateau uplift and Asian interior aridification. Plant Syst. Evol. 2010, 288, 191–199. [Google Scholar] [CrossRef]
  55. Yang, F.S.; Qin, A.L.; Li, Y.F.; Wang, X.Q. Great genetic differentiation among populations of Meconopsis integrifolia and its implication for plant speciation in the Qinghai-Tibetan Plateau. PLoS ONE 2012, 7, e37196. [Google Scholar] [CrossRef] [Green Version]
  56. Qin, A.L.; Wang, M.M.; Cun, Y.Z.; Yang, F.S.; Wang, S.S.; Ran, J.H.; Wang, X.Q. Phylogeographic evidence for a link of species divergence of Ephedra in the Qinghai-Tibetan Plateau and adjacent regions to the Miocene Asian aridification. PLoS ONE 2013, 8, e56243. [Google Scholar] [CrossRef] [Green Version]
  57. Zhang, M.L.; Kang, Y.; Zhong, Y.; Sanderson, S.C. Intense uplift of the Qinghai-Tibetan Plateau triggered rapid diversification of Phyllolobium (Leguminosae) in the Late Cenozoic. Plant Ecol. Divers. 2012, 5, 491–499. [Google Scholar] [CrossRef]
  58. Wan, S.; Li, A.; Clift, P.D.; Jiang, H. Development of the East Asian summer monsoon: Evidence from the sediment record in the South China Sea since 8.5 Ma. Palaeogeogr. Palaeoclimatol. Palaeoecol. 2006, 241, 139–159. [Google Scholar] [CrossRef]
  59. Ao, H.; Roberts, A.P.; Dekkers, M.J.; Liu, X.; Rohling, E.J.; Shi, Z.; An, Z.; Zhao, X. Late Miocene–Pliocene Asian monsoon intensification linked to Antarctic ice-sheet growth. Earth Planet Sci. Lett. 2016, 444, 75–87. [Google Scholar] [CrossRef] [Green Version]
  60. Guo, Z.T.; Ruddiman, W.F.; Hao, Q.Z.; Wu, H.B.; Qiao, Y.S.; Zhu, R.X.; Peng, S.Z.; Wei, J.J.; Yuan, B.Y.; Liu, T.S. Onset of Asian desertification by 22 Myr ago inferred from loess deposits in China. Nature 2002, 416, 159–163. [Google Scholar] [CrossRef]
  61. Miao, Y.; Herrmann, M.; Wu, F.; Yan, X.; Yang, S. What controlled Mid–Late Miocene long-term aridification in Central Asia?—Global cooling or Tibetan Plateau uplift: A review. Earth Sci. Rev. 2012, 112, 155–172. [Google Scholar] [CrossRef]
  62. Lu, H.; Guo, Z. Evolution of the monsoon and dry climate in East Asia during late Cenozoic: A review. Sci. China Earth Sci. 2014, 57, 70–79. [Google Scholar] [CrossRef]
  63. Sun, J.; Alloway, B.; Fang, X.; Windley, B.F. Refuting the evidence for an earlier birth of the Taklimakan Desert. Proc. Natl. Acad. Sci. USA 2015, 112, E5556–E5557. [Google Scholar] [CrossRef] [PubMed] [Green Version]
  64. Su, Z.H.; Zhang, M.L. Evolutionary history of a desert shrub Ephedra przewalskii (Ephedraceae): Allopatric divergence and range shifts in northwestern China. PLoS ONE 2016, 11, e0158284. [Google Scholar] [CrossRef] [PubMed]
  65. Zhang, H.X.; Zhang, M.-L.; Williams, D.M. Genetic evidence and species distribution modelling reveal the response of Larix sibirica and its related species to Quaternary climatic and ancient historical events. Biochem. Syst. Ecol. 2014, 54, 316–325. [Google Scholar] [CrossRef]
  66. Hallatschek, O.; Hersen, P.; Ramanathan, S.; Nelson, D.R. Genetic drift at expanding frontiers promotes gene segregation. Proc. Natl. Acad. Sci. USA 2007, 104, 19926–19930. [Google Scholar] [CrossRef] [Green Version]
  67. Excoffier, L.; Ray, N. Surfing during population expansions promotes genetic revolutions and structuration. Trends Ecol. Evol. 2008, 23, 347–351. [Google Scholar] [CrossRef]
  68. Meng, X.; Xia, P.; Zheng, J.; Wang, X. Evolution of the East Asian monsoon and its response to uplift of the Tibetan Plateau since 1.8 Ma recorded by major elements in sediments of the South China Sea. Chin. Sci. Bull. 2011, 56, 547–551. [Google Scholar] [CrossRef] [Green Version]
  69. Chen, L.; Zhang, R.; Pryor, S.C.; Li, X.; Wang, H. Influence of wintertime surface sensible heat flux variability over the central and eastern Tibetan Plateau on the East Asian winter monsoon. Clim. Dynam. 2020, 54, 4589–4603. [Google Scholar] [CrossRef]
  70. Liu, Y.X. A Study on origin and formation of the chinese desert floras. Acta Phytotax. Sin. 1995, 33, 131–143. [Google Scholar]
  71. Su, Z.; Lu, W.; Zhang, M. Phylogeographical patterns of two closely related desert shrubs, Nitraria roborowskii and N. sphaerocarpa (Nitrariaceae), from arid north-western China. Bot. J. Linn. Soc. 2016, 180, 334–347. [Google Scholar] [CrossRef] [Green Version]
  72. Shi, X.J.; Zhang, M.L. Phylogeographical structure inferred from cpDNA sequence variation of Zygophyllum xanthoxylon across north-west China. J. Plant Res. 2015, 128, 269–282. [Google Scholar] [CrossRef] [PubMed]
  73. Xu, Z.; Zhang, M.L.; Cohen, J.I. Phylogeographic history of Atraphaxis plants in arid northern China and the origin of A. bracteata in the Loess Plateau. PLoS ONE 2016, 11, e0163243. [Google Scholar] [CrossRef] [PubMed]
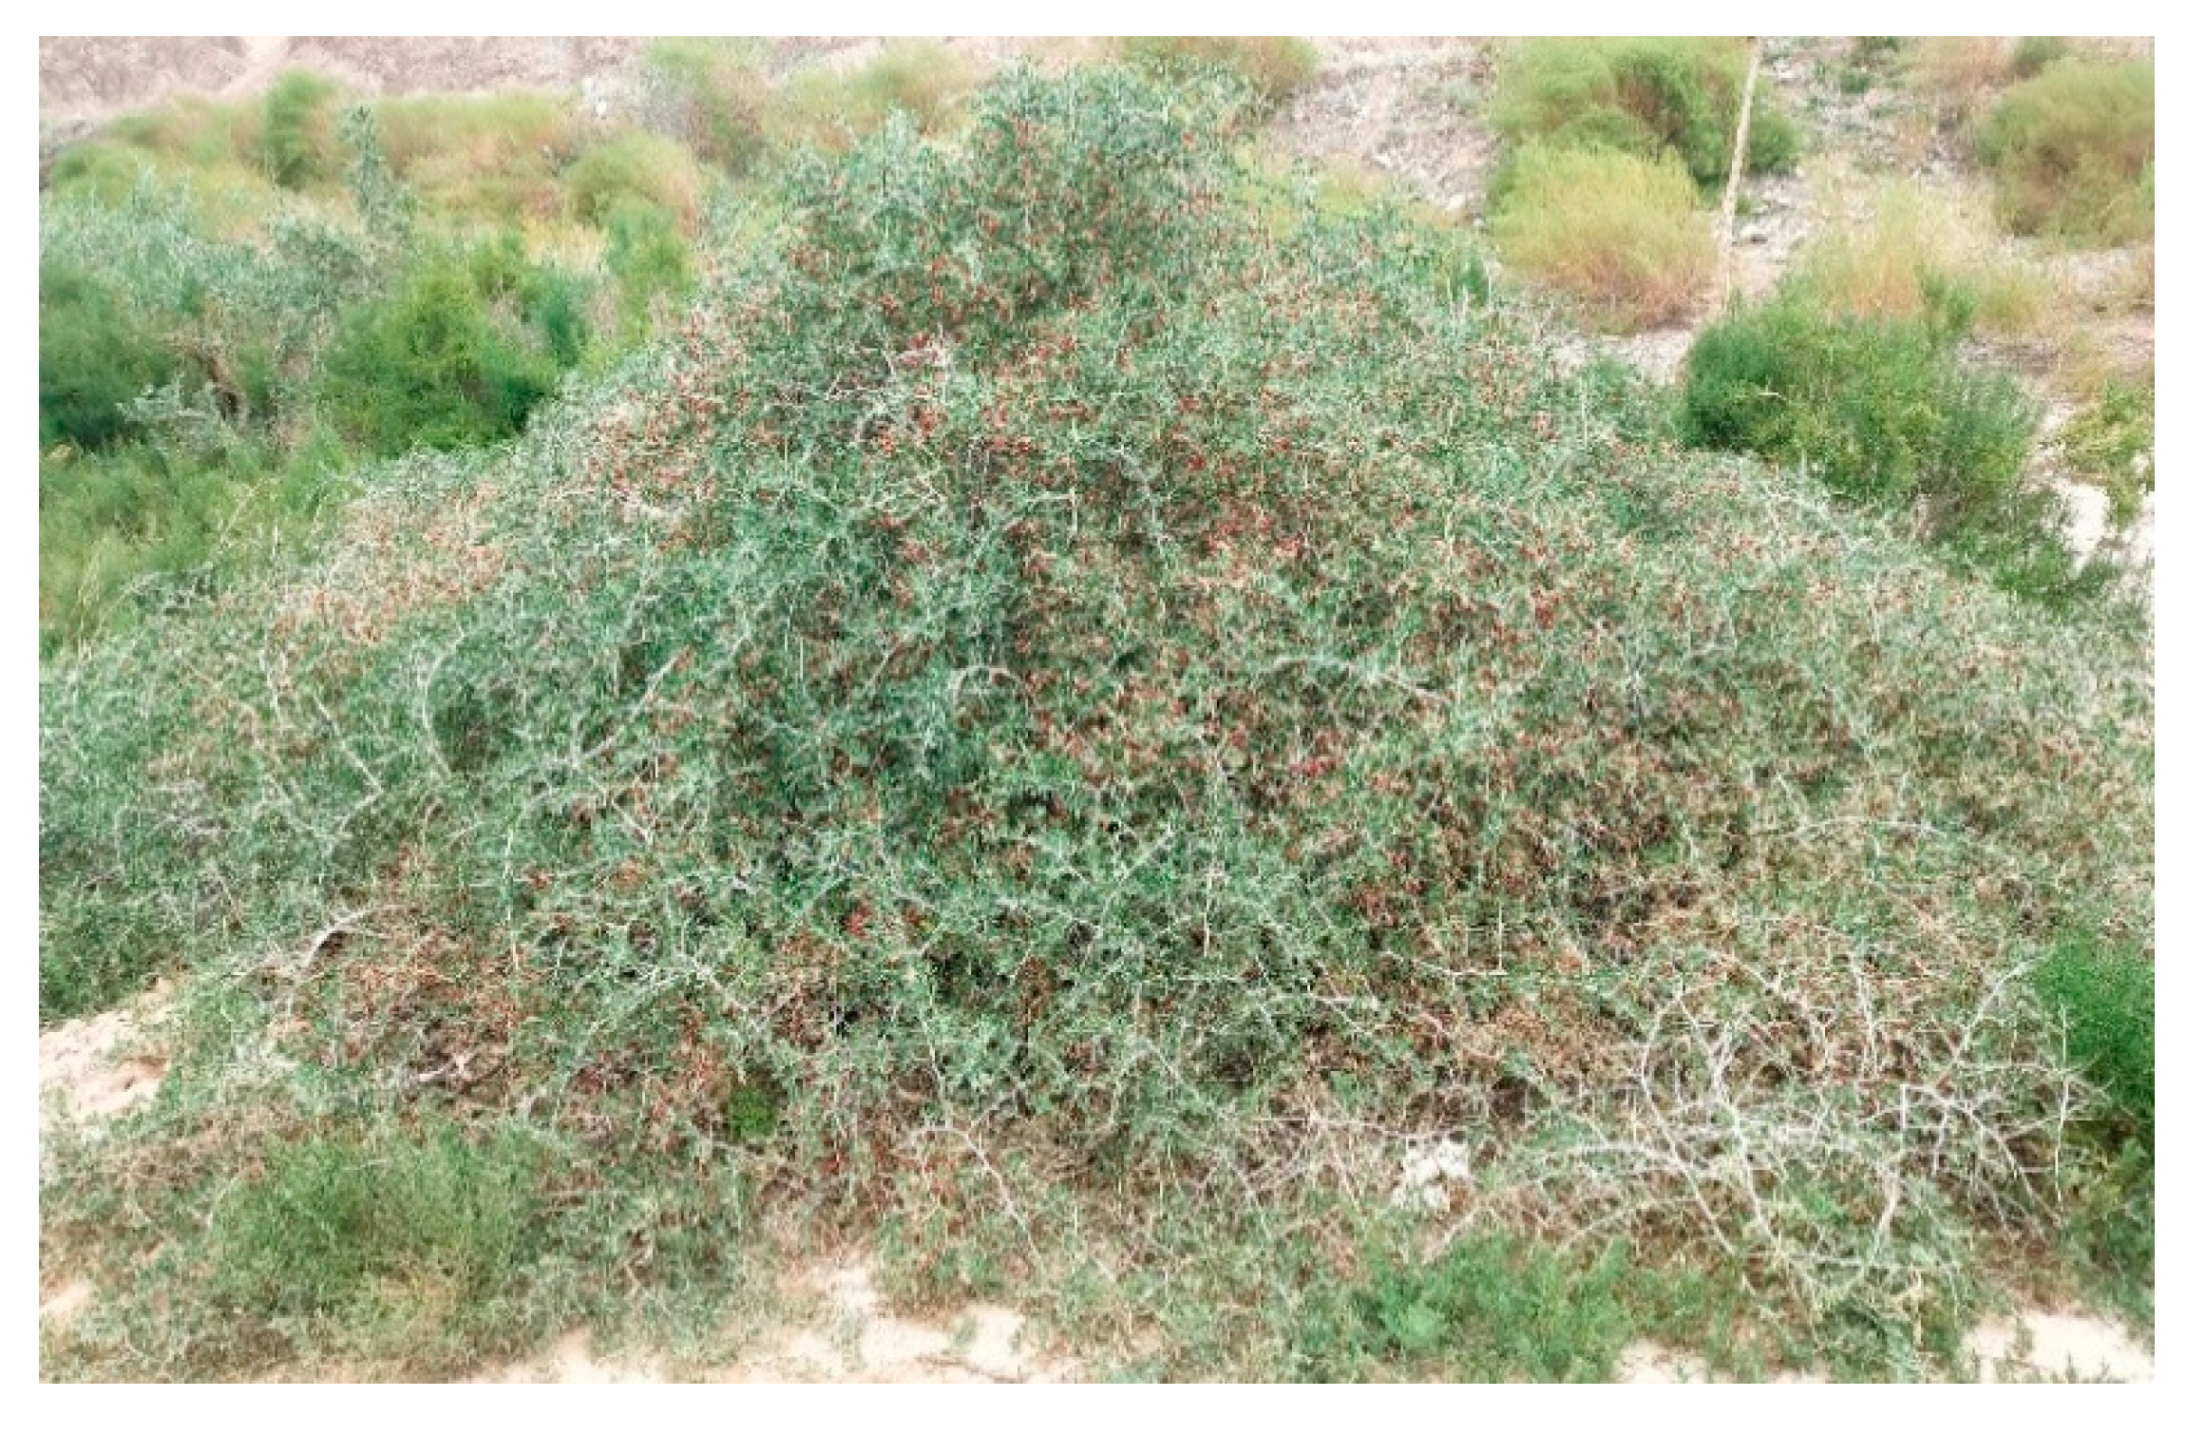
Figure 1. A representative plant of Nitraria tangutorum Bobr. investigated in this study.
Plants 09 01100 g001
Figure 2. Phylogenetic topology and geographical distribution of Nitraria tangutorum chloroplast DNA (cpDNA) haplotypes. (A) Haplotype topology built using median-joining approach. Pie size is proportional to haplotype frequency, and the red circles from medium vector 1 (mv1) to mv6 indicate missing haplotypes that are not sampled in this study. Different colors of the pie diagrams denote haplotypes from different lineages. (B) Geographical distribution of 31 haplotypes detected in N. tangutorum (population codes are presented in the Table 1).
Plants 09 01100 g002
Figure 3. Reconstruction of the ancestral distribution of Nitraria tangutorum based on chloroplast DNA (cpDNA) haplotypes as determined by reconstruct ancestral state in phylogenies (RASP) analysis. (A) Different colors represent different origin groups as shown in the map insert. (B) Results of the Bayesian Binary Markov chain Monte Carlo (MCMC) analysis. The pie chart in each node indicates the possible ancestral distribution inferred from Bayesian Binary MCMC (BBM) analysis implemented in RASP. The number above the branches indicate bootstrap support values above 80. H1-H33 represent 33 haplotypes. A, East-A group; B, East-B group; C, West group; AB, East group.
Plants 09 01100 g003
Figure 4. Phylogenetic relationship between Nitraria tangutorum haplotypes based on the concatenated dataset of five chloroplast DNA (cpDNA) fragments. Nodes indicate mean age estimates and 95% confidence intervals. Numbers above the tree branches indicate the bootstrap values calculated using posterior probabilities using BEAST software, while numbers below the tree branches represent maximum likelihood calculated using PhyML software. The black solid circles with the points “a” to “d” indicate divergence time between two clades. HPD, 95% highest posterior density.
Plants 09 01100 g004
Figure 5. Pairwise nucleotide differences and Bayesian skyline plot (BSP) analysis for the population dynamics of Nitraria tangutorum based on the chloroplast DNA sequencing data. (A) Mismatch distribution analysis (MDA) plots for the distribution frequency of pairwise nucleotide differences in total populations or within each lineage of N. tangutorum. The histogram represents the observed distribution of differences among chlorotypes, while the dashed lines illustrate simulated distributions based on a model of sudden (stepwise) demographic population expansion. Freq. obs, frequency of the observed pairwise differences; Freq. exp, frequency of the expected pairwise differences; (B) BSP analysis of effective population sizes was determined for the entire population and individual populations of N. tangutorum distributed in the East-A, East-B, and West regions. The solid line indicates the median value, and the area between both blue lines represents the boundary of the 95% central posterior density interval. X-axis: time, years before present (Ma); Y-axis, effective population size (Ne, the product of effective population size and generation length).
Plants 09 01100 g005
Figure 6. Predicted distribution of Nitraria tangutorum based on ecological niche modeling (ENM) using Maxent. (A) At the Last Inter-Glacial (LIG; ~0.14–0.12 Ma); (B) At the Last Glacial Maximum (LGM; ~0.021 Ma); (C) Under current conditions (1950–2000). The color scale in range of blue to red at the right of each image represents the lowest-to-the-highest potential distribution probability of the occurrence of N. tangutorum.
Plants 09 01100 g006
Figure 7. Proposed historical patterns of the migration and recolonization of Nitraria tangutorum in arid northwest China. (A) ~2.53 Ma: intraspecific differentiation occurred within the eastern groups of N. tangutorum triggered by the initial strengthening of the East Asian winter monsoon (EAWM). (B) ~1.82–0.62 Ma: putative routes of migration and recolonization of N. tangutorum across the Hexi corridor supported by the climatic conditions established by the EAWM. Color coding is consistent with Figure 2: brown spots represent the ancestor of N. tangutorum; purple, green and orange spots represent the haplotypes from the East-A, East-B, and West lineages, respectively. Red arrows represent the putative dispersal routes of N. tangutorum. Black arrows and number of arrows represent the direction and intensity of the EAWM and East Asian summer monsoon (EASM), respectively.
Plants 09 01100 g007
Table 1. Geographic and genetic information for the sampled populations of Nitraria tangutorum. s, number of segregating sites; h, number of haplotypes; Hd, estimates of haplotype diversity; π, nucleotide diversity within populations.
Population
(Code)
Location
(All in China)
GroupNumber of IndividualsHaplotypes
(Individuals)
shHdπ
TLMXTalimuxiang, SinkiangWest8H23(2) H24(2) H25(1) H26(3)440.82100.0004
SSSTSanshisituan, SinkiangWest8H23(8)010.00000.0000
QKLQiongkule, SinkiangWest5H23(5)010.00000.0000
QMQiemo, SinkiangWest6H23(6)010.00000.0000
JQJiuquan, GansuEast-A8H8(3) H16(3) H19(2)530.75000.0006
WKQWeikengquan, GansuEast-A8H1(1) H8(1) H27(6)430.46400.0003
AYQAyouqi, IMGEast-A8H1(8)010.00000.0000
HEYHuaeryuan, GansuEast-A8H1(8)010.00000.0000
MQXXMinqinxingxi, GansuEast-A8H1(8)010.00000.0000
HZTHaizitan, GansuEast-A8H1(4) H3(3) H11(1)520.25000.0003
LJTLuanjintan, NingxiaEast-A8H1(2) H3(2) H11(1) H20(1) H21(1) H22(1)1060.92800.0007
WLJWuliji, IMGEast-A8H16(2) H29(1) H30(4) H31(1)640.75000.0006
BLQBuliqi, IMGEast-A8H2(1) H3(6) H32(1)630.46400.0003
DLHDelingha, QinghaiEast-A8H8(7) H33(1)520.25000.0003
LYXLongyangxia, QinghaiEast-A8H1(8)010.00000.0000
DSTDashetai, IMGEast-B7H4(6) H10(1)540.71400.0004
WLERGWulanerige, IMGEast-B8H3(2) H4(3) H14(2) H28(1)640.82100.0005
YGYingen, IMGEast-B8H9(1) H4(2) H33(5)440.64200.0004
BLGBalagong, IMGEast-B8H4(2) H5(4) H6(1) H7(1)640.75000.0004
JLTJilanta, IMGEast-B8H11(1) H14(2) H15(1) H16(1) H17(2) H18(1)860.92800.0007
JCHKJichakou, IMGEast-B7H2(1) H3(1) H12(1) H13(2) H14(2)850.90400.0006
Table 2. Calculation of genetic diversity and molecular variance for chlorotype sequences of Nitraria tangutorum. HS, average gene diversity within populations; HT, total gene diversity; GST, interpopulation differentiation; NST, number of substitution types; NC, not computed due to small populations; * p < 0.05, ** p < 0.01.
RegionsHSHTGSTNSTNeutrality Tests
Fu’s FsTajiam’s D
East-A0.472 (0.116)0.843 (0.095)0.440 (0.099)0.691 (0.136)−8.024 ** (0.004)−1.306 (0.067)
East-B0.824 * (0.041)0.930 * (0.043)0.114 * (0.022)0.220 (NC)−6.468 ** (0.008)−0.077 (0.527)
West0.205 * (0.020)0.375 * (0.027)0.452 (NC)0.364 (NC)−0.645 (0.359)−1.589 * (0.046)
Total0.470 (0.081)0.922 * (0.034)0.490 (0.046)0.647 (0.041)−13.614 ** 0.002−0.624 * (0.034)
Table 3. Calculation of molecular variance for chlorotype sequences of Nitraria tangutorum. d.f., degrees of freedom; SS, sum of squares; VC, variance component; PV, percentage of variation; * p < 0.05.
RegionsSource of Variationd.f.SSVCPV (%)Fixation Index
East-AAmong populations1056.7050.62347.770FST = 0.478 *
Within-populations7752.5000.68152.230
Total87109.2051.305
East-BAmong populations538.0490.84943.500FST = 0.435 *
Within-populations4044.1251.10356.500
Total4582.1741.952
WestAmong populations33.4310.13233.070FST = 0.331 *
Within-populations236.1250.26666.930
Total269.5560.398
West, East-A and East-B in comparisonAmong groups2121.0131.31451.960FCT = 0.520 *
Among populations within groups1666.3980.44117.450FSC = 0.363 *
Within populations12697.5000.77430.590FST = 0.694 *
Total 144284.9102.530
Table 4. Pairwise genetic differentiation (ΦST) among the three lineages based on the chloroplast DNA (cpDNA) sequences of Nitraria tangutorum. * p < 0.05; ** p < 0.01.
East-AEast-BWest
East-A0.000 *
East-B0.388 *0.000 *
West0.538 *0.553 **0.000 *