Variability in the Qualitative and Quantitative Composition and Content of Phenolic Compounds in the Fruit of Introduced American Cranberry (Vaccinium macrocarpon Aiton)


 ,
,  ,
,
Abstract
1. Introduction
2. Results and Discussion
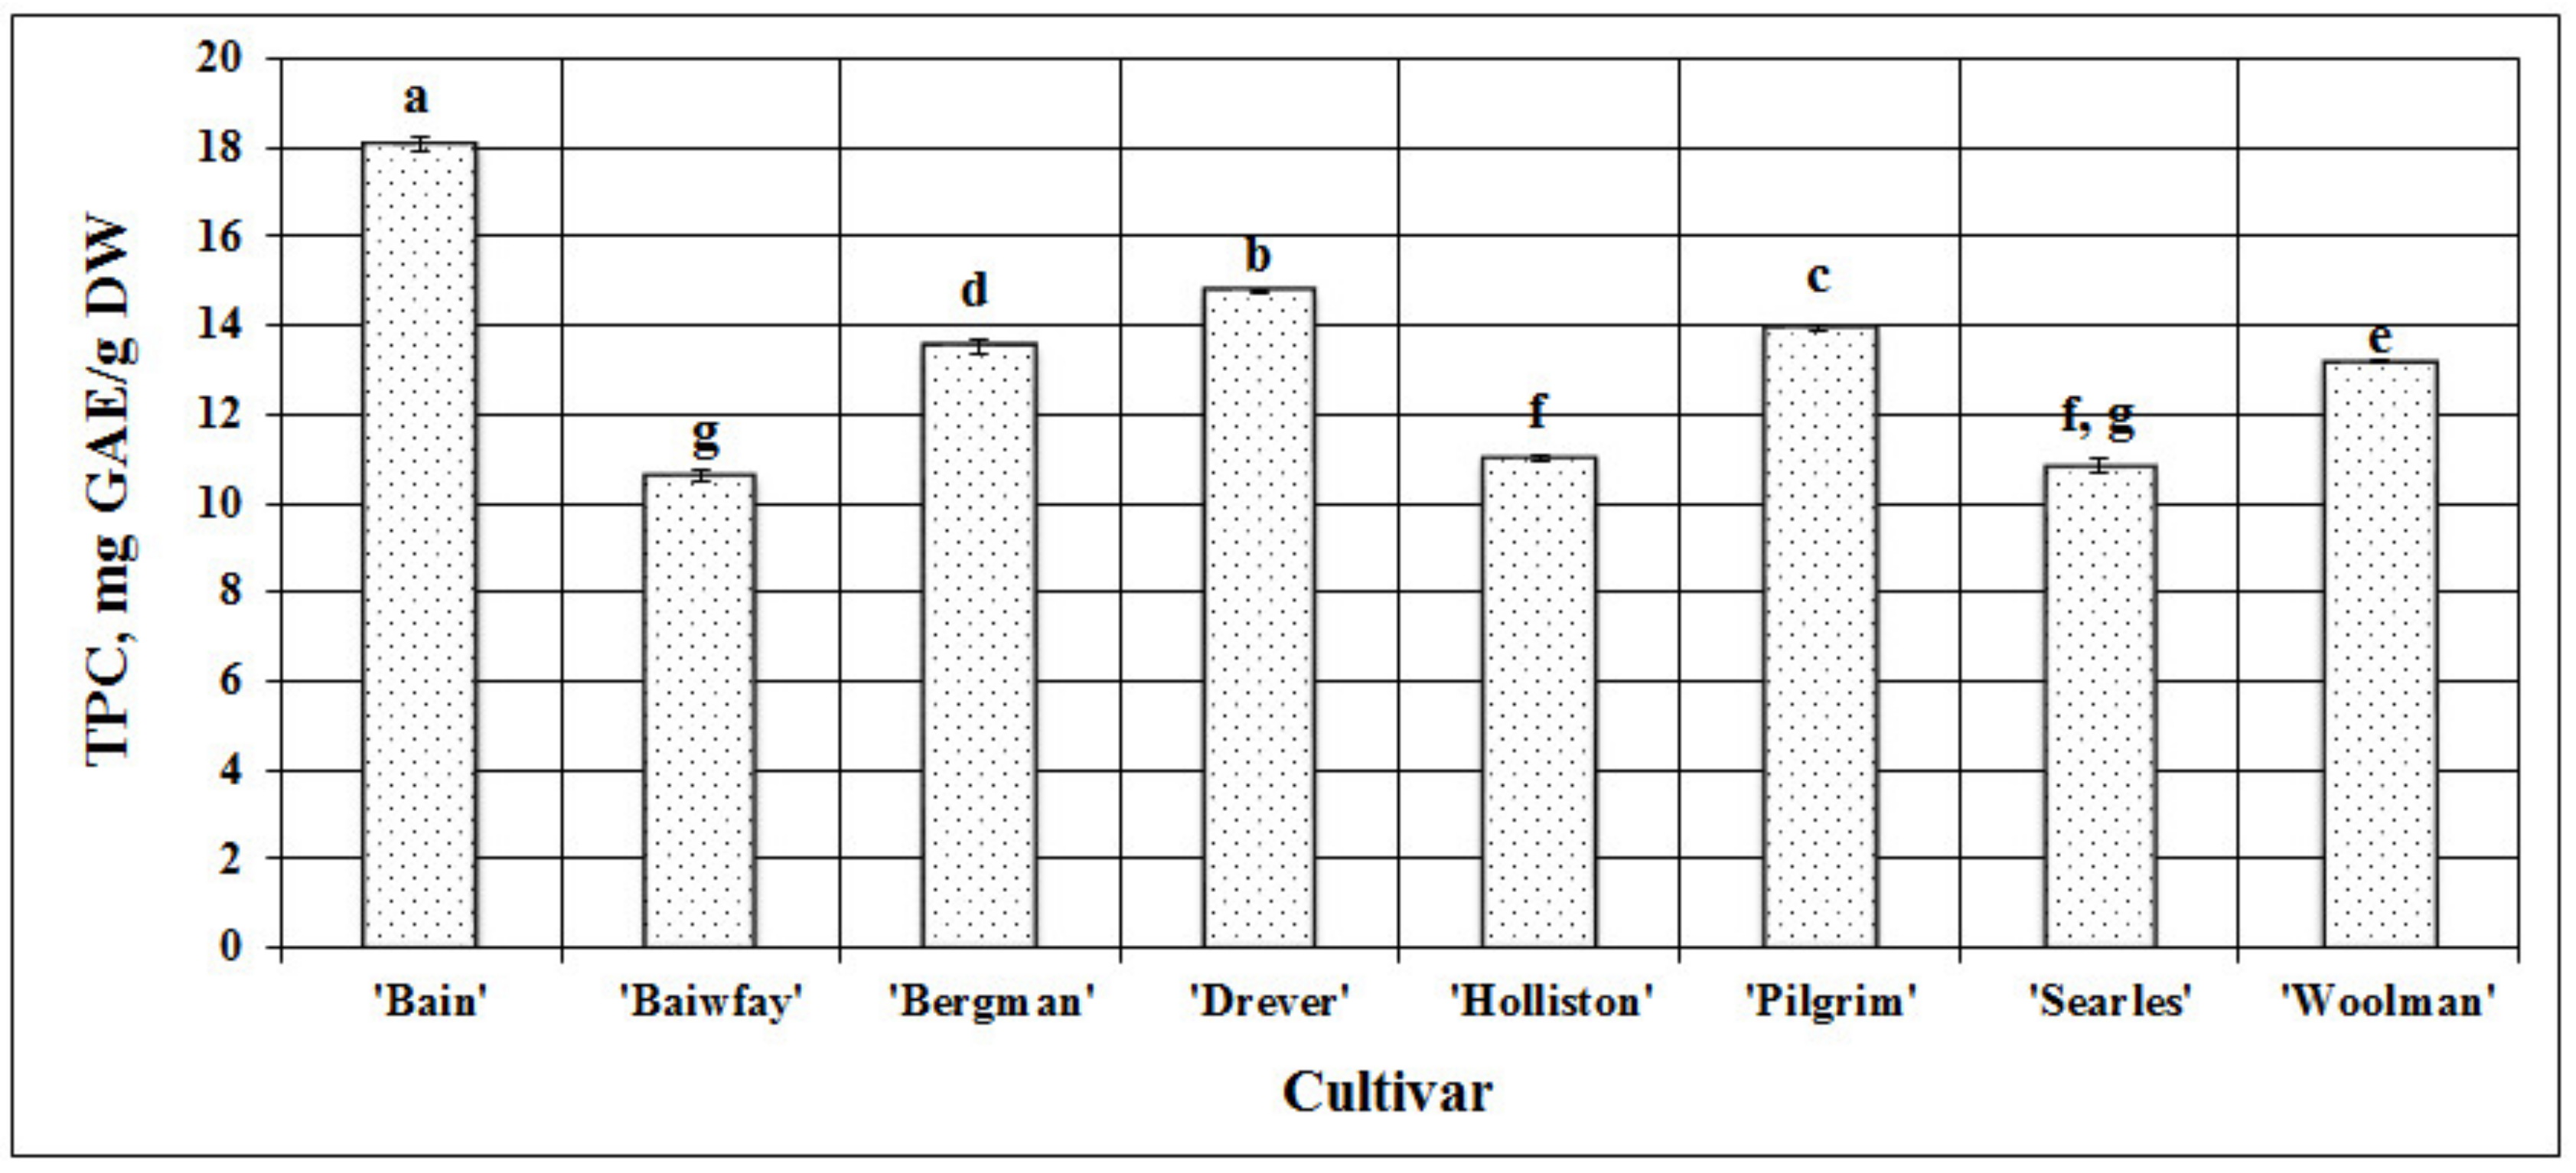
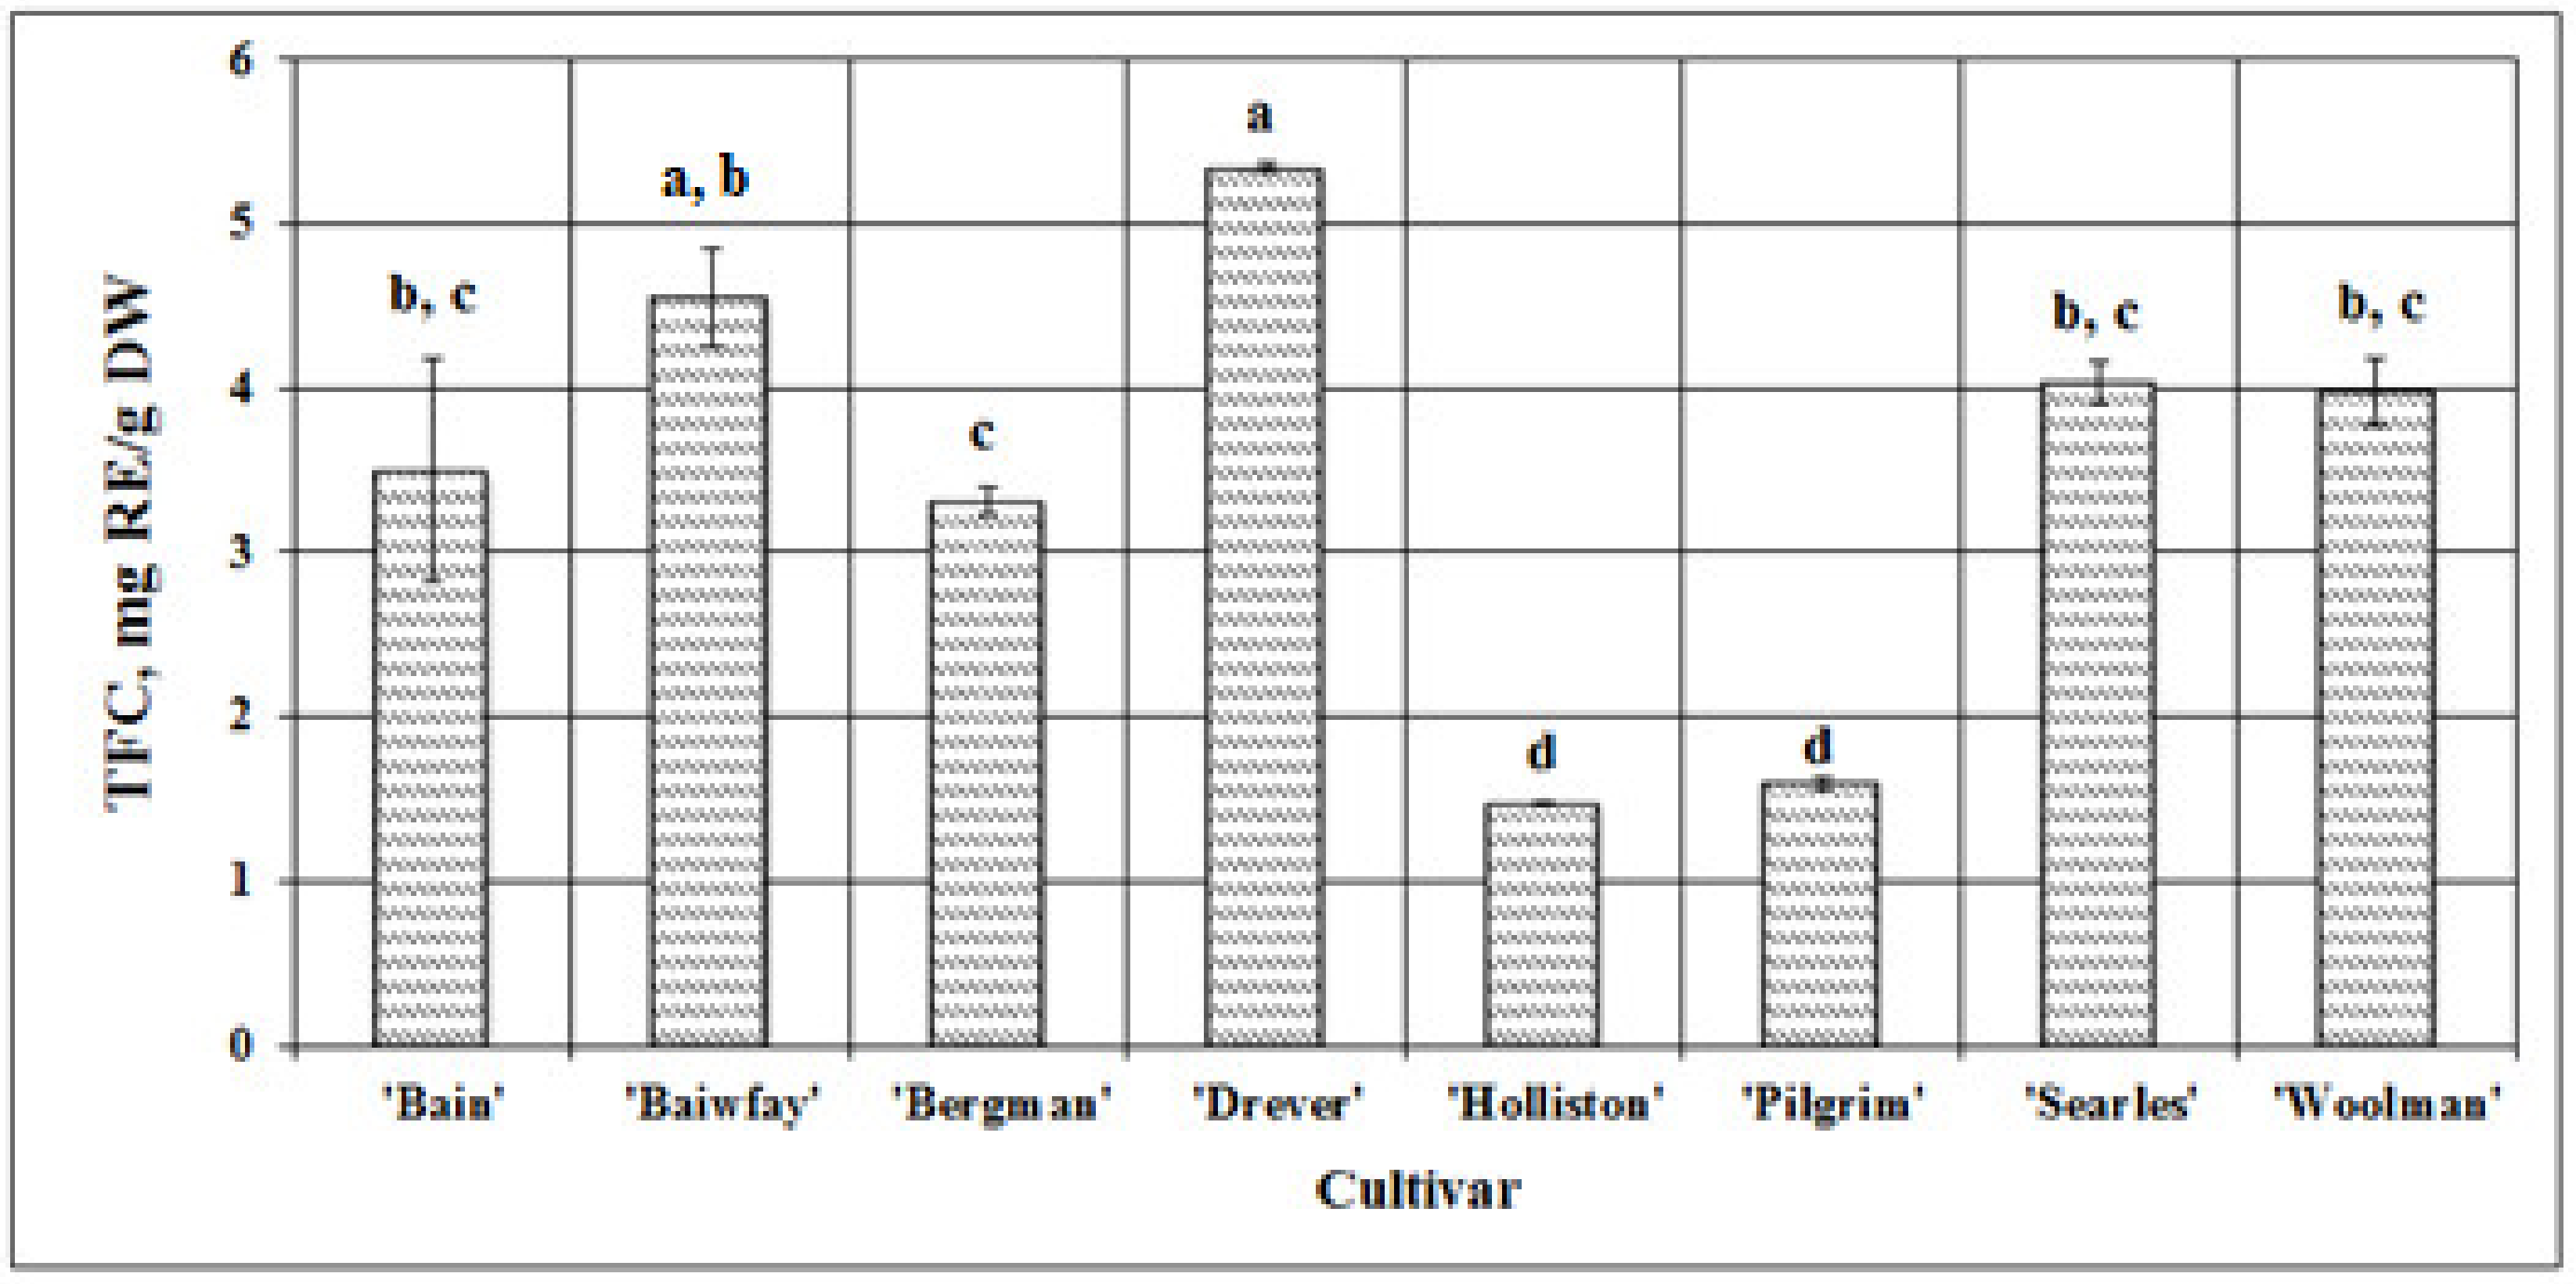
2.1. Determination of Total Phenolic and Flavonoid Content
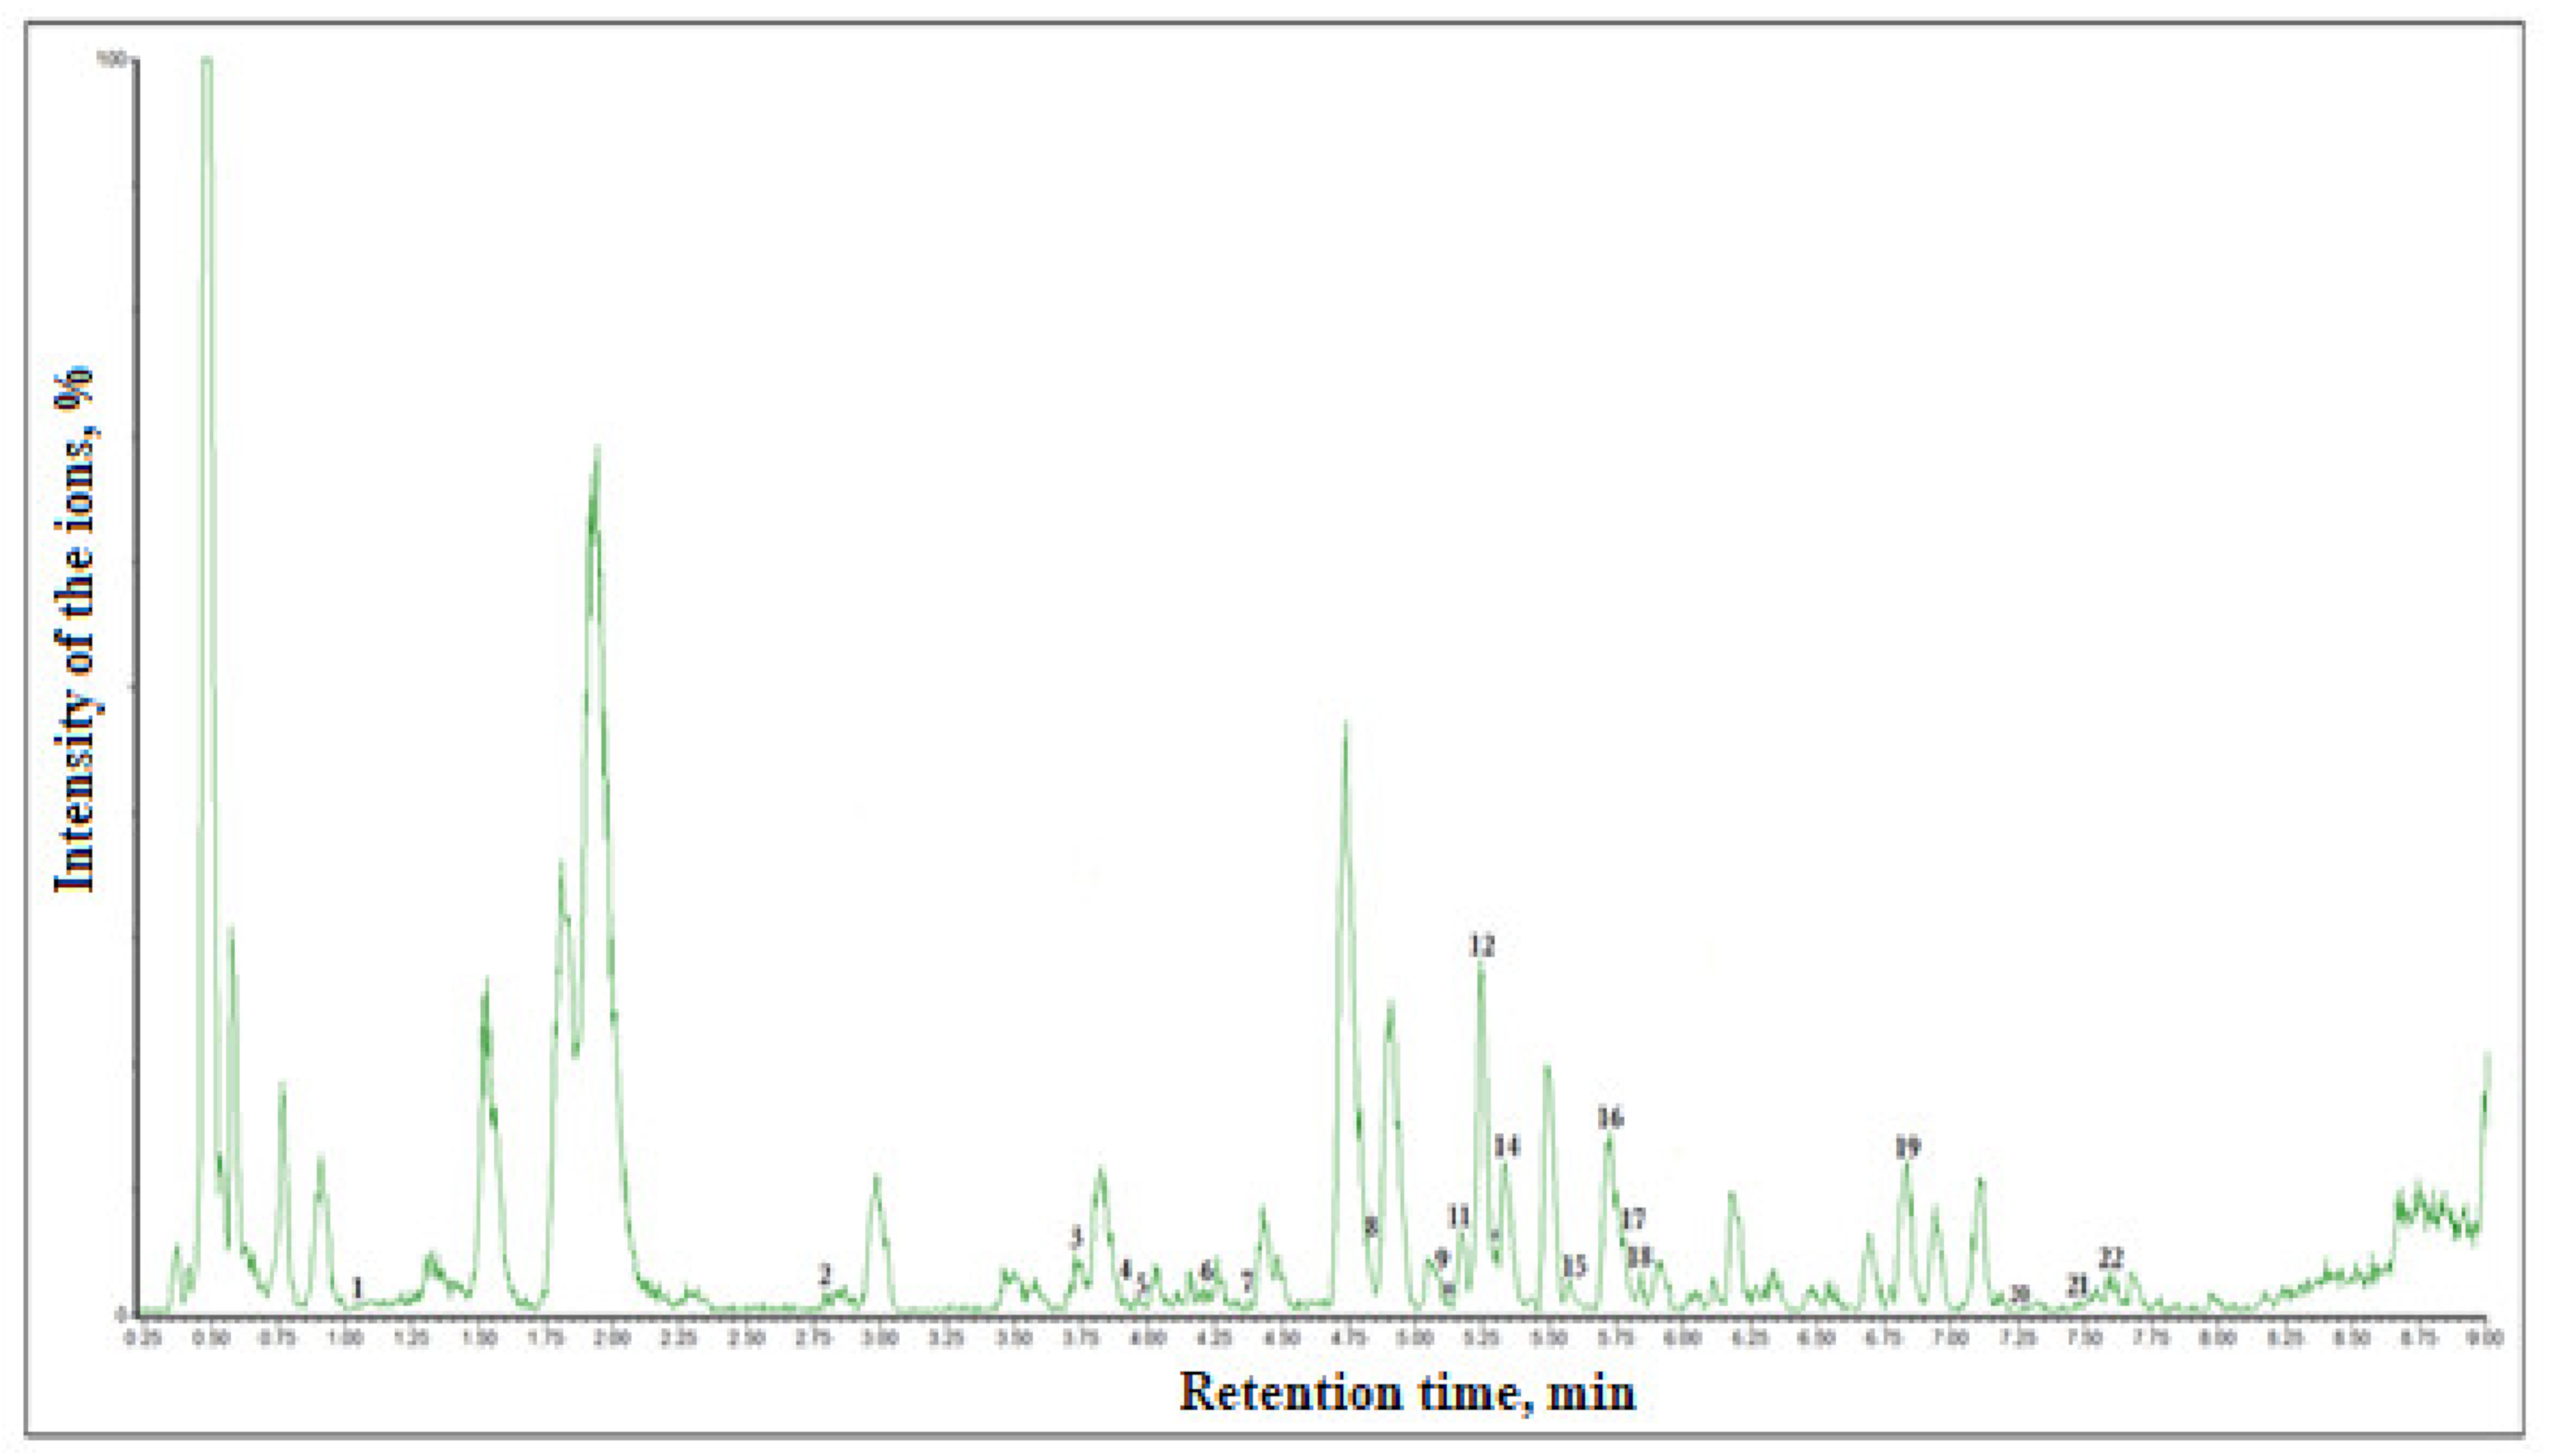
2.2. Identification and Quantification of Phenolic Compounds by UPLC-ESI-MS/MS
2.3. Measurements of Antioxidant Activity in Extracts
3. Materials and Methods
3.1. Plant Material
3.2. Chemicals
3.3. Apparatures
3.4. Preparation of the Cranberry Fruit Samples
3.5. Preparation of the Ethanol Extracts
3.6. Spectrophotometric Studies
3.6.1. Determination of Total Phenolic and Flavonoid Content
3.6.2. Evaluation of Antioxidant Activity
- (1)
- ABTS⋅+Assay. During the evaluation, 3 mL of ABTS⋅+ solution was mixed with 10 µL of extracts. A decrease in absorbance was measured at λ = 734 nm [56]. A calibration curve (𝑦 = 0.00003𝑥−0.00360; R2 = 0.9714) was prepared using standard Trolox solutions of 8000 to 24,000 µmol/L concentration.
- (2)
- TFPH⋅+Assay. 3 mL of TFPH⋅+ solution was mixed with 10 µL of extracts, and absorbance was measured at λ = 502 nm [57]. A calibration curve (𝑦 = 0.0000371𝑥 + 0.1471727; R2 = 0.9959) was prepared using standard Trolox solutions of 2000 to 16,000 µmol/L concentration.
- (3)
- CUPRAC Assay. CUPRAC solution included copper (II) chloride (0.01 M in water), ammonium acetate buffer solution (0.001 M, pH = 7), and neocuproine (0.0075 M in ethanol) (ratio 1:1:1). During the evaluation, 3 mL of CUPRAC reagent was mixed with 10 µL of extracts. An increase in absorbance was recorded at λ = 450 nm [58]. A calibration curve (𝑦 = 0.0000222𝑥 − 0.0132677; R2 = 0.9995) was prepared using standard Trolox solutions of 2000 to 48,000 µmol/L concentration.
- (4)
- FRAP Assay. FRAP solution included TPTZ (0.01 M dissolved in 0.04 M HCl), FeCl3 × 6H2O (0.02 M in water), and acetate buffer (0.3 M, pH 3.6) (ratio 1:1:10). During the evaluation, 3 mL of a freshly prepared FRAP reagent was mixed with 10 µL of extracts. An increase in absorbance was recorded at λ = 593 nm [59]. A calibration graph (y = 0.0000166𝑥 + 0.000950; R2 = 0.9926) was prepared using standard Trolox solutions of 400 to 24,000 µmol/L concentration.
3.7. Chromatographic Studies
3.8. Data Analysis
4. Conclusions
Author Contributions
Funding
Conflicts of Interest
References
- Martins, E. The growing use of herbal medicines: Issues relating to adverse reactions and challenges in monitoring safety. Front. Pharmacol. 2014, 4, 1–177. [Google Scholar]
- WHO Traditional Medicine Strategy: 2014–2023; World Health Organization: Geneva, Switzerland, 2013.
- Sandler, H.A.; Alpert, P.; Shumaker, D. Invasion of natural and agricultural cranberry bogs by introduced and native plants. Plant Ecol. 2007, 190, 219–231. [Google Scholar] [CrossRef]
- Viskelis, P.; Rubinskienė, M.; Jasutienė, I.; Šarkinas, A.; Daubaras, R.; Česonienė, L. Anthocyanins, Antioxidative, and Antimicrobial Properties of American Cranberry (Vaccinium macrocarpon Ait.) and their Press Cakes. J. Food Sci. 2009, 74, C157–C161. [Google Scholar] [CrossRef]
- Lacombe, A.; Wu, V.C.-H.; Tyler, S.; Edwards, K. Antimicrobial action of the American cranberry constituents; phenolics, anthocyanins, and organic acids, against Escherichia coli O157:H7. Int. J. Food Microbiol. 2010, 139, 102–107. [Google Scholar] [CrossRef]
- Osvalde, A.; Karlsons, A. Nutrient status of the American cranberries Vaccinium macrocarpon Ait. in Latvia. Agron. Res. 2017, 15, 196–204. [Google Scholar]
- He, X.; Liu, R.H. Cranberry Phytochemicals: Isolation, Structure Elucidation, and Their Antiproliferative and Antioxidant Activities. J. Agric. Food Chem. 2006, 54, 7069–7074. [Google Scholar] [CrossRef]
- McKay, D.L.; Blumberg, J.B. Cranberries (Vaccinium macrocarpon) and Cardiovascular Disease Risk Factors. Nutr. Rev. 2007, 65, 490–502. [Google Scholar] [CrossRef]
- Zhao, S.; Liu, H.; Gu, L. American cranberries and health benefits—An evolving story of 25 years. J. Sci. Food Agric. 2020, 100, 5111–5116. [Google Scholar] [CrossRef] [PubMed]
- Côté, J.; Caillet, S.; Dussault, D.; Sylvain, J.-F.; Lacroix, M. Effect of juice processing on cranberry antibacterial properties. Food Res. Int. 2011, 44, 2922–2929. [Google Scholar] [CrossRef]
- Nowack, R. Cranberry juice—A well-characterized folk-remedy against bacterial urinary tract infection. Wien. Med. Wochenschr. 2007, 157, 325–330. [Google Scholar] [CrossRef]
- Skrovankova, S.; Sumczynski, D.; Mlcek, J.; Jurikova, T.; Sochor, J. Bioactive Compounds and Antioxidant Activity in Different Types of Berries. Int. J. Mol. Sci. 2015, 16, 24673–24706. [Google Scholar] [CrossRef] [PubMed]
- Ceymann, M.; Arrigoni, E.; Schärer, H.; Nising, A.B.; Hurrell, R.F. Identification of apples rich in health-promoting flavan-3-ols and phenolic acids by measuring the polyphenol profile. J. Food Compos. Anal. 2012, 26, 128–135. [Google Scholar] [CrossRef]
- Rop, O.; Jurikova, T.; Mlcek, J.; Kramarova, D.; Sengee, Z. Antioxidant activity and selected nutritional values of plums (Prunus domestica L.) typical of the White Carpathian Mountains. Sci. Hortic. 2009, 122, 545–549. [Google Scholar] [CrossRef]
- Borowska, E.J.; Mazur, B.; Gadzała Kopciuch, R.; Buszewski, B. Polyphenol, anthocyanin and resveratrol mass fractions and antioxidant properties of cranberry cultivars. Food Technol. Biotechnol. 2009, 47, 56–61. [Google Scholar]
- Tikuma, B.; Liepniece, M.; Sterne, D.; Abolins, M.; Seglina, D.; Krasnova, I. Preliminary results of biochemical composition of two cranberry species grown in Latvia. In Proceedings of the X International Symposium on Vaccinium and Other Superfruits, Maastricht, The Netherlands, 17–22 June 2012; pp. 209–214. [Google Scholar]
- Povilaityté, V.; Budriuniené, D.; Rimkiené, S.; Viškelis, P. Investigation of Vaccinium macrocarpon Ait. fruits chemical composition. Dendrol. Lith. 1998, 4, 55–62. [Google Scholar]
- Rudy, S.; Dziki, D.; Krzykowski, A.; Gawlik-Dziki, U.; Polak, R.; Różyło, R.; Kulig, R. Influence of pre-treatments and freeze-drying temperature on the process kinetics and selected physico-chemical properties of cranberries (Vaccinium macrocarpon Ait.). LWT 2015, 63, 497–503. [Google Scholar] [CrossRef]
- Day, A.J.; Bao, Y.; Morgan, M.R.; Williamson, G. Conjugation position of quercetin glucuronides and effect on biological activity. Free. Radic. Biol. Med. 2000, 29, 1234–1243. [Google Scholar] [CrossRef]
- Singh, A.P.; Wilson, T.; Kalk, A.J.; Cheong, J.; Vorsa, N. Isolation of specific cranberry flavonoids for biological activity assessment. Food Chem. 2009, 116, 963–968. [Google Scholar] [CrossRef]
- Yan, X.; Murphy, B.T.; Hammond, G.R.; Vinson, J.A.; Neto, C.C. Antioxidant Activities and Antitumor Screening of Extracts from Cranberry Fruit (Vaccinium macrocarpon). J. Agric. Food Chem. 2002, 50, 5844–5849. [Google Scholar] [CrossRef]
- Neto, C.C. Cranberry and Its Phytochemicals: A Review of In Vitro Anticancer Studies. J. Nutr. 2007, 137, 186S–193S. [Google Scholar] [CrossRef]
- Shaheen, G.; Noreen, S. Health Promoting Potential Benefits of Vaccinium macrocarpon. Am. J. Phytomedicine Clin. Ther. 2016, 4, 127–134. [Google Scholar]
- Reed, J. Cranberry Flavonoids, Atherosclerosis and Cardiovascular Health. Crit. Rev. Food Sci. Nutr. 2002, 42, 301–316. [Google Scholar] [CrossRef]
- Pappas, E.; Schaich, K.M. Phytochemicals of Cranberries and Cranberry Products: Characterization, Potential Health Effects, and Processing Stability. Crit. Rev. Food Sci. Nutr. 2009, 49, 741–781. [Google Scholar] [CrossRef]
- Jurikova, T.; Skrovankova, S.; Mlček, J.; Balla, S.; Snopek, L. Bioactive Compounds, Antioxidant Activity, and Biological Effects of European Cranberry (Vaccinium oxycoccos). Molecules 2018, 24, 24. [Google Scholar] [CrossRef]
- Côté, J.; Caillet, S.; Doyon, G.; Sylvain, J.-F.; Lacroix, M. Bioactive Compounds in Cranberries and their Biological Properties. Crit. Rev. Food Sci. Nutr. 2010, 50, 666–679. [Google Scholar] [CrossRef]
- Ermel, G.; Georgeault, S.; Inisan, C.; Besnard, M. Inhibition of Adhesion of Uropathogenic Escherichia coli Bacteria to Uroepithelial Cells by Extracts from Cranberry. J. Med. Food 2012, 15, 126–134. [Google Scholar] [CrossRef]
- Gotteland, M.; Andrews, M.; Toledo, M.; Muñoz, L.; Caceres, P.; Anziani, A.; Wittig, E.; Speisky, H.; Salazar, G. Modulation of Helicobacter pylori colonization with cranberry juice and Lactobacillus johnsonii La1 in children. Nutrition 2008, 24, 421–426. [Google Scholar] [CrossRef]
- Vítor, J.M.; Vale, F.F. Alternative therapies for Helicobacter pylori: Probiotics and phytomedicine. FEMS Immunol. Med Microbiol. 2011, 63, 153–164. [Google Scholar] [CrossRef]
- Česonienė, L.; Daubaras, R.; Jasutienė, I.; Miliauskienė, I.; Zych, M. Investigations of anthocyanins, organic acids, and sugars show great variability in nutritional value of European cranberry (Vaccinium oxycoccos) fruit. J. Appl. Bot. Food Qual. 2015, 88, 295–299. [Google Scholar]
- Kim, D.; Hwang, G.; Liu, Y.; Wang, Y.; Singh, A.P.; Vorsa, N.; Koo, H. Cranberry Flavonoids Modulate Cariogenic Properties of Mixed-Species Biofilm through Exopolysaccharides-Matrix Disruption. PLoS ONE 2015, 10, e145844. [Google Scholar] [CrossRef]
- Feghali, K.; Feldman, M.; La, V.D.; Santos, J.; Grenier, D. Cranberry Proanthocyanidins: Natural Weapons against Periodontal Diseases. J. Agric. Food Chem. 2011, 60, 5728–5735. [Google Scholar] [CrossRef]
- Mukherjee, M.; Bandyopadhyay, P.; Kundu, D. Exploring the role of cranberry polyphenols in periodontits: A brief review. J. Indian Soc. Periodontol. 2014, 18, 136–139. [Google Scholar] [CrossRef] [PubMed]
- Jungfer, E.; Zimmermann, B.F.; Ruttkat, A.; Galensa, R. Comparing Procyanidins in Selected Vaccinium Species by UHPLC-MS2with Regard to Authenticity and Health Effects. J. Agric. Food Chem. 2012, 60, 9688–9696. [Google Scholar] [CrossRef]
- Abeywickrama, G.; Debnath, S.C.; Ambigaipalan, P.; Shahidi, F. Phenolics of Selected Cranberry Genotypes (Vaccinium macrocarpon Ait.) and Their Antioxidant Efficacy. J. Agric. Food Chem. 2016, 64, 9342–9351. [Google Scholar] [CrossRef]
- Ma, L.; Wang, R.; Nan, Y.; Li, W.; Wang, Q.; Jin, F. Phloretin exhibits an anticancer effect and enhances the anticancer ability of cisplatin on non-small cell lung cancer cell lines by regulating expression of apoptotic pathways and matrix metalloproteinases. Int. J. Oncol. 2015, 48, 843–853. [Google Scholar] [CrossRef]
- Sampath, C.; Rashid, M.R.; Sang, S.; Ahmedna, M. Specific bioactive compounds in ginger and apple alleviate hyperglycemia in mice with high fat diet-induced obesity via Nrf2 mediated pathway. Food Chem. 2017, 226, 79–88. [Google Scholar] [CrossRef]
- Nithiya, T.; Udayakumar, R. Antihyperlipidemic Effect of Phloretin on Streptozotocin Induced Diabetic Rats. DARU J. Pharm. Sci. 2018, 1, 105. [Google Scholar]
- Aliomrani, M.; Sepand, M.R.; Mirzaei, H.R.; Kazemi, A.R.; Nekonam, S.; Sabzevari, O. Effects of phloretin on oxidative and inflammatory reaction in rat model of cecal ligation and puncture induced sepsis. DARU J. Pharm. Sci. 2016, 24, 15. [Google Scholar] [CrossRef]
- Chang, W.-T.; Huang, W.-C.; Liou, C.-J. Evaluation of the anti-inflammatory effects of phloretin and phlorizin in lipopolysaccharide-stimulated mouse macrophages. Food Chem. 2012, 134, 972–979. [Google Scholar] [CrossRef]
- Antika, L.D.; Lee, E.-J.; Kim, Y.-H.; Kang, M.-K.; Park, S.-H.; Kim, D.Y.; Oh, H.; Choi, Y.-J.; Kang, Y.-H. Dietary phlorizin enhances osteoblastogenic bone formation through enhancing β-catenin activity via GSK-3β inhibition in a model of senile osteoporosis. J. Nutr. Biochem. 2017, 49, 42–52. [Google Scholar] [CrossRef]
- Tian, Y.; Lu, W.; Deng, H.; Yang, F.; Guo, Y.; Gao, L.; Xu, Y. Phlorizin administration ameliorates cognitive deficits by reducing oxidative stress, tau hyper-phosphorylation, and neuroinflammation in a rat model of Alzheimer’s disease. J. Food Biochem. 2018, 42, e12644. [Google Scholar] [CrossRef]
- Mei, X.; Zhang, X.; Wang, Z.; Gao, Z.; Liu, G.; Hu, H.; Zou, L.; Li, X. Insulin Sensitivity-Enhancing Activity of Phlorizin Is Associated with Lipopolysaccharide Decrease and Gut Microbiota Changes in Obese and Type 2 Diabetes (db/db) Mice. J. Agric. Food Chem. 2016, 64, 7502–7511. [Google Scholar] [CrossRef]
- Choi, H.-R.; Nam, K.-M.; Lee, H.-S.; Yang, S.-H.; Kim, Y.-S.; Lee, J.; Date, A.; Toyama, K.; Park, K.-C. Phlorizin, an Active Ingredient of Eleutherococcus senticosus, Increases Proliferative Potential of Keratinocytes with Inhibition of MiR135b and Increased Expression of Type IV Collagen. Oxidative Med. Cell. Longev. 2016, 2016, 1–8. [Google Scholar]
- Najafian, M.; Jahromi, M.Z.; Nowroznejhad, M.J.; Khajeaian, P.; Kargar, M.; Sadeghi, M.; Arasteh, A. Phloridzin reduces blood glucose levels and improves lipids metabolism in streptozotocin-induced diabetic rats. Mol. Biol. Rep. 2011, 39, 5299–5306. [Google Scholar] [CrossRef]
- Uberos, J.; Rodríguez-Belmonte, R.; Rodríguez-Pérez, C.; Molina-Oya, M.; Blanca-Jover, E.; Narbona-López, E.; Hoyos, A.M. Phenolic acid content and antiadherence activity in the urine of patients treated with cranberry syrup (Vaccinium macrocarpon) vs. trimethoprim for recurrent urinary tract infection. J. Funct. Foods 2015, 18, 608–616. [Google Scholar] [CrossRef]
- D’dharan, S.R.; Neelakantan, P. Therapeutic uses of cranberry (Vaccinium macrocarpon) extract—A review. Int. J. Pharmacogn. Phytochem. Res. 2013, 5, 197–199. [Google Scholar]
- Kalin, P.; Gülçin, İ.; Gören, A.C. Antioxidant activity and polyphenol content of cranberries (Vaccinium macrocarpon). Rec. Nat. Prod. 2015, 9, 496. [Google Scholar]
- Floegel, A.; Kim, D.-O.; Chung, S.-J.; Koo, S.I.; Chun, O.K. Comparison of ABTS/DPPH assays to measure antioxidant capacity in popular antioxidant-rich US foods. J. Food Compos. Anal. 2011, 24, 1043–1048. [Google Scholar] [CrossRef]
- Çelik, H.; Özgen, M.; Serçe, S.; Kaya, C. Phytochemical accumulation and antioxidant capacity at four maturity stages of cranberry fruit. Sci. Hortic. 2008, 117, 345–348. [Google Scholar] [CrossRef]
- Namieśnik, J.; Vearasilp, K.; Nemirovski, A.; Leontowicz, H.; Leontowicz, M.; Pasko, P.; Martinez-Ayala, A.L.; González-Aguilar, G.A.; Suhaj, M.; Gorinstein, S. In Vitro Studies on the Relationship Between the Antioxidant Activities of Some Berry Extracts and Their Binding Properties to Serum Albumin. Appl. Biochem. Biotechnol. 2014, 172, 2849–2865. [Google Scholar] [CrossRef]
- Council of Europe. European Pharmacopoeia, 10th ed.; Council of Europe: Strasbourg, France, 2019; p. 51. [Google Scholar]
- Bobinaitė, R.; Viškelis, P.; Venskutonis, P.R. Variation of total phenolics, anthocyanins, ellagic acid and radical scavenging capacity in various raspberry (Rubus spp.) cultivars. Food Chem. 2012, 132, 1495–1501. [Google Scholar] [CrossRef] [PubMed]
- Urbonavičiūtė, A.; Jakstas, V.; Kornyšova, O.; Janulis, V.; Maruška, A. Capillary electrophoretic analysis of flavonoids in single-styled hawthorn (Crataegus monogyna Jacq.) ethanolic extracts. J. Chromatogr. A 2006, 1112, 339–344. [Google Scholar] [CrossRef] [PubMed]
- Re, R.; Pellegrini, N.; Proteggente, A.; Pannala, A.; Yang, M.; Rice-Evans, C. Antioxidant activity applying an improved ABTS radical cation decolorization assay. Free. Radic. Biol. Med. 1999, 26, 1231–1237. [Google Scholar] [CrossRef]
- Asghar, M.; Khan, I.U. Measurement of antioxidant activity with trifluoperazine dihydrochloride radical cation. Braz. J. Med Biol. Res. 2008, 41, 455–461. [Google Scholar] [CrossRef] [PubMed]
- Apak, R.; Güçlü, K.; Demirata, B.; Özyürek, M.; Çelik, S.E.; Bektaşoğlu, B.; Berker, K.I.; Özyurt, D. Comparative Evaluation of Various Total Antioxidant Capacity Assays Applied to Phenolic Compounds with the CUPRAC Assay. Molecules 2007, 12, 1496–1547. [Google Scholar] [CrossRef]
- Benzie, I.F.; Strain, J. The Ferric Reducing Ability of Plasma (FRAP) as a Measure of “Antioxidant Power”: The FRAP Assay. Anal. Biochem. 1996, 239, 70–76. [Google Scholar] [CrossRef]
- González-Burgos, E.; Liaudanskas, M.; Viškelis, J.; Žvikas, V.; Janulis, V.; Gómez-Serranillos, M.P. Antioxidant activity, neuroprotective properties and bioactive constituents analysis of varying polarity extracts from Eucalyptus globulus leaves. J. Food Drug Anal. 2018, 26, 1293–1302. [Google Scholar] [CrossRef]


| Compound, mg/g | ‘Bain’ | ‘Baiwfay’ | ‘Bergman’ | ‘Drever’ | ‘Holliston’ | ‘Pilgrim’ | ‘Searless’ | ‘Woolman’ |
|---|---|---|---|---|---|---|---|---|
| Avicularin | 5.26 ± 0.20 b | 2.99 ± 0.11 c | 7.17 ± 0.31 a | 5.72 ± 0.23 b | 2.85 ± 0.11 c | 2.77 ± 0.10 c | 6.01 ± 0.25 b | 5.52 ± 0.22 b |
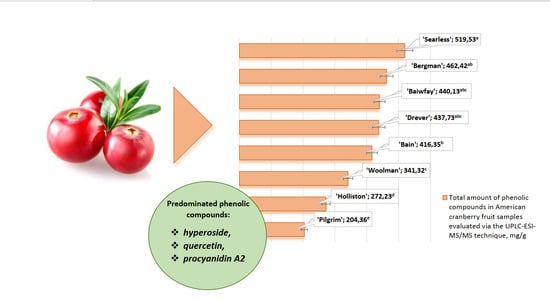
| Hyperoside | 116.22 ± 5.30 b,c | 121.33 ± 4.36 b | 152.45 ± 6.96 a | 135.80 ± 6.60 a,b | 86.19 ± 3.89 c,d | 71.66 ± 3.16 d | 123.56 ± 5.56 a,b | 133.95 ± 6.37 a,b |
| Isorhamnetin | 25.68 ± 1.09 b,c | 28.03 ± 1.03 b,c | 23.92 ± 1.01 c | 30.43 ± 1.10 b | 9.73 ± 0.43 d | 10.27 ± 0.49 d | 39.08 ± 1.56 a | 11.42 ± 0.47 d |
| Isorhamnetin-3-O-glucoside | 10.96 ± 0.50 c,d | 14.81 ± 0.59 b | 15.98 ± 0.71 b | 20.99 ± 0.89 a | 8.85 ± 0.32 d | 7.68 ± 0.35 d | 14.61 ± 0.64 b | 12.71 ± 0.58 b,c |
| Kaempferol | 0.42 ± 0.02 a | 0.30 ± 0.02 b,c | 0.38 ± 0.02 a,b | 0.37 ± 0.02 a,b | 0.13 ± 0.01 e | 0.44 ± 0.02 a | 0.16 ± 0.01 d,e | 0.24 ± 0.01 c,d |
| Quercetin | 107.48 ± 4.79 b | 99.89 ± 3.98 b,c | 88.82 ± 3.89 b,c | 85.73 ± 3.85 c | 33.11 ± 1.45 d | 32.58 ± 1.50 d | 137.90 ± 6.03 a | 39.11 ± 1.88 d |
| Quercitrin | 49.95 ± 2.24 a | 56.67 ± 2.02 a | 47.25 ± 2.12 a | 47.05 ± 2.27 a | 31.10 ± 1.45 b | 23.71 ± 0.86 b | 48.70 ± 2.20 a | 51.26 ± 2.31 a |
| Rutin | 0.18 ± 0.01 c | 0.18 ± 0.01 c | 0.26 ± 0.01 c | 3.16 ± 0.14 a | 0.19 ± 0.01 c | 0.31 ± 0.01 c | 0.25 ± 0.01 c | 1.29 ± 0.05 b |
| Luteolin-7-O-glucoside | 0.11 ± 0.01 c,d | 0.08 ± 0.01 d | 0.25 ± 0.01 b | 0.15 ± 0.01 c,d | 0.85 ± 0.04 a | 0.18 ± 0.01 b,c | 0.11 ± 0.01 c,d | 0.15 ± 0.01 c,d |
| (-)-Epicatechin | 12.96 ± 0.58 a | 10.89 ± 0.47 a,b | 9.52 ± 0.42 b | 10.54 ± 0.49 a,b | 9.04 ± 0.38 b | 4.87 ± 0.21 c | 12.07 ± 0.57 a | 3.57 ± 0.15 c |
| (+)-Catechin | 3.60 ± 0.11 a,b | 2.60 ± 0.10 c,d | 3.10 ± 0.12 b,c | 4.18 ± 0.17 a | 3.55 ± 0.18 a,b | 1.11 ± 0.06 e | 4.28 ± 0.17 a | 2.18 ± 0.09 d |
| Procyanidin A2 | 72.81 ± 3.21 c,d | 87.47 ± 3.85 b,c | 96.88 ± 3.98 a,b | 79.98 ± 3.52 b,c,d | 75.34 ± 2.80 c,d | 42.31 ± 1.98 e | 114.27 ± 5.32 a | 62.04 ± 2.79 d,e |
| Procyanidin C1 | 0.96 ± 0.03 a,b | 0.95 ± 0.04 a,b | 0.90 ± 0.05 b,c | 0.80 ± 0.03 b,c | 0.77 ± 0.03 b,c | 0.47 ± 0.02 d | 1.16 ± 0.05 a | 0.70 ± 0.04 c |
| Phloretin | 0.14 ± 0.01 a,b | 0.13 ± 0.01 a,b,c | 0.11 ± 0.01 b,c | 0.12 ± 0.01 b,c | 0.13 ± 0.01 a,b,c | 0.08 ± 0.01 c | 0.15 ± 0.01 a,b | 0.18 ± 0.01 a |
| Phloridzin | 4.73 ± 0.17 d | 6.28 ± 0.28 b,c | 4.77 ± 0.19 d | 5.40 ± 0.18 c,d | 4.43 ± 0.18 d | 2.45 ± 0.11 e | 7.85 ± 0.36 a | 7.43 ± 0.33 a,b |
| Gallic acid | 0.51 ± 0.02 c,d | 0.40 ± 0.02 d | 1.14 ± 0.04 b | 0.64 ± 0.02 c | 1.36 ± 0.05 a | 0.37 ± 0.02 d | 0.52 ± 0.03 c,d | 0.97 ± 0.03 b |
| Vanillic acid | 0.89 ± 0.03 e | 1.95 ± 0.07 c | 2.04 ± 0.09 b,c | 1.45 ± 0.06 d | 1.15 ± 0.04 d,e | 0.75 ± 0.03 e | 2.46 ± 0.11 b | 3.18 ± 0.14 a |
| Caffeic acid | 0.44 ± 0.01 c | 0.21 ± 0.01 d,e | 0.80 ± 0.03 a | 0.26 ± 0.01 d | 0.09 ± 0.01 f | 0.15 ± 0.01 e,f | 0.25 ± 0.01 d | 0.54 ± 0.02 b |
| Chlorogenic acid | 1.52 ± 0.08 c,d | 2.69 ± 0.11 b | 4.64 ± 0.21 a | 2.57 ± 0.12 b | 2.15 ± 0.08 b,c | 1.10 ± 0.05 d | 4.26 ± 0.19 a | 2.42 ± 0.09 b |
| Ferulic acid | 0.71 ± 0.03 c | 0.68 ± 0.03 c | 1.12 ± 0.05 a | 1.10 ± 0.01 a | 0.70 ± 0.03 c | 0.93 ± 0.04 a,b | 0.77 ± 0.04 b,c | 0.72 ± 0.03 c |
| Neochlorogenic acid | 0.02 ± 0.001 c | 0.25 ± 0.01 a | 0.04 ± 0.01 c | 0.12 ± 0.01 b | 0.01 ± 0.001 c | 0.01 ± 0.001 c | 0.04 ± 0.002 c | 0.0004 ± 0.0001 c |
| p-Coumaric acid | 0.80 ± 0.02 e | 1.34 ± 0.05 b | 0.9 ± 0.03 d,e | 1.18 ± 0.04 b,c | 0.53 ± 0.03 f | 0.16 ± 0.01 g | 1.07 ± 0.04 c,d | 1.76 ± 0.06 a |
| Total | 416.35 ± 17.32 b | 440.13 ± 17.63 a,b,c | 462.42 ± 20.36 a,b | 437.73 ± 19.85 a,b,c | 272.23 ± 13.32 d | 204.36 ± 9.87 e | 519.53 ± 25.12 a | 341.32 ± 15.02 c |
| Compound | Parent Ion (m/z) | Daughter Ion (m/z) | Cone Voltage, V | Collision Energy, eV |
|---|---|---|---|---|
| p-Coumaric acid | 163 | 93 | 28 | 22 |
| Vanillic acid | 167 | 152 | 26 | 12 |
| Gallic acid | 169 | 51 | 36 | 30 |
| Caffeic acid | 179 | 107 | 36 | 22 |
| Ferulic acid | 193 | 134 | 32 | 18 |
| Phloretin | 273 | 167 | 42 | 16 |
| Kaempferol | 285 | 185 | 50 | 25 |
| (-)-Epicatechin | 289 | 123 | 60 | 34 |
| (+)-Catechin | 289 | 123 | 60 | 34 |
| Quercetin | 301 | 151 | 48 | 20 |
| Isorhamnetin | 315 | 300 | 44 | 22 |
| Chlorogenic acid | 353 | 191 | 32 | 14 |
| Neochlorogenic acid | 353 | 191 | 32 | 14 |
| Avicularin | 433 | 301 | 50 | 20 |
| Phloridzin | 435 | 273 | 42 | 14 |
| Luteolin-7-O-glucoside | 447 | 285 | 66 | 26 |
| Quercitrin | 447 | 300 | 50 | 26 |
| Hyperoside | 463 | 300 | 50 | 26 |
| Isorhamnetin-3-O-glucoside | 477 | 314 | 60 | 28 |
| Procyanidin A2 | 575 | 285 | 50 | 25 |
| Rutin | 609 | 300 | 70 | 38 |
| Procyanidin C1 | 865,2 | 125 | 56 | 60 |
Publisher’s Note: MDPI stays neutral with regard to jurisdictional claims in published maps and institutional affiliations. |
© 2020 by the authors. Licensee MDPI, Basel, Switzerland. This article is an open access article distributed under the terms and conditions of the Creative Commons Attribution (CC BY) license (http://creativecommons.org/licenses/by/4.0/).
Share and Cite
Gudžinskaitė, I.; Stackevičienė, E.; Liaudanskas, M.; Zymonė, K.; Žvikas, V.; Viškelis, J.; Urbštaitė, R.; Janulis, V. Variability in the Qualitative and Quantitative Composition and Content of Phenolic Compounds in the Fruit of Introduced American Cranberry (Vaccinium macrocarpon Aiton). Plants 2020, 9, 1379. https://doi.org/10.3390/plants9101379
Gudžinskaitė I, Stackevičienė E, Liaudanskas M, Zymonė K, Žvikas V, Viškelis J, Urbštaitė R, Janulis V. Variability in the Qualitative and Quantitative Composition and Content of Phenolic Compounds in the Fruit of Introduced American Cranberry (Vaccinium macrocarpon Aiton). Plants. 2020; 9(10):1379. https://doi.org/10.3390/plants9101379
Chicago/Turabian StyleGudžinskaitė, Ieva, Elicija Stackevičienė, Mindaugas Liaudanskas, Kristina Zymonė, Vaidotas Žvikas, Jonas Viškelis, Rima Urbštaitė, and Valdimaras Janulis. 2020. "Variability in the Qualitative and Quantitative Composition and Content of Phenolic Compounds in the Fruit of Introduced American Cranberry (Vaccinium macrocarpon Aiton)" Plants 9, no. 10: 1379. https://doi.org/10.3390/plants9101379
APA StyleGudžinskaitė, I., Stackevičienė, E., Liaudanskas, M., Zymonė, K., Žvikas, V., Viškelis, J., Urbštaitė, R., & Janulis, V. (2020). Variability in the Qualitative and Quantitative Composition and Content of Phenolic Compounds in the Fruit of Introduced American Cranberry (Vaccinium macrocarpon Aiton). Plants, 9(10), 1379. https://doi.org/10.3390/plants9101379