Next Article in Journal
Identification of Markers Associated with Yield Traits and Morphological Features in Maize (Zea mays L.)
Next Article in Special Issue
Reactive Oxygen Species Alleviate Cell Death Induced by Thaxtomin A in Arabidopsis thaliana Cell Cultures
Previous Article in Journal
Discrimination of Myrtle Ecotypes from Different Geographic Areas According to Their Morphological Characteristics and Anthocyanins Composition
Previous Article in Special Issue
Biotechnological Potential of LSD1, EDS1, and PAD4 in the Improvement of Crops and Industrial Plants
 
 
Correction published on 20 January 2021, see Plants 2021, 10(2), 187.
Article

Hydrogen Peroxide and Superoxide Anion Radical Photoproduction in PSII Preparations at Various Modifications of the Water-Oxidizing Complex

by
Andrey Khorobrykh
Institute of Basic Biological Problems, FRC PSCBR RAS, Pushchino 142290, Moscow Region, Russia
Plants 2019, 8(9), 329; https://doi.org/10.3390/plants8090329
Submission received: 30 July 2019 / Revised: 25 August 2019 / Accepted: 29 August 2019 / Published: 5 September 2019
(This article belongs to the Special Issue ROS Responses in Plants)

Abstract

:
The photoproduction of superoxide anion radical (O2−•) and hydrogen peroxide (H2O2) in photosystem II (PSII) preparations depending on the damage to the water-oxidizing complex (WOC) was investigated. The light-induced formation of O2−• and H2O2 in the PSII preparations rose with the increased destruction of the WOC. The photoproduction of superoxide both in the PSII preparations holding intact WOC and the samples with damage to the WOC was approximately two times higher than H2O2. The rise of O2−• and H2O2 photoproduction in the PSII preparations in the course of the disassembly of the WOC correlated with the increase in the fraction of the low-potential (LP) Cyt b559. The restoration of electron flow in the Mn-depleted PSII preparations by exogenous electron donors (diphenylcarbazide, Mn2+) suppressed the light-induced formation of O2−• and H2O2. The decrease of O2−• and H2O2 photoproduction upon the restoration of electron transport in the Mn-depleted PSII preparations could be due to the re-conversion of the LP Cyt b559 into higher potential forms. It is supposed that the conversion of the high potential Cyt b559 into its LP form upon damage to the WOC leads to the increase of photoproduction of O2−• and H2O2 in PSII.

1. Introduction

Photosystem II (PSII) is a pigment–protein complex built into the thylakoid membrane. The main function of PSII is the light-induced oxidation of water to molecular oxygen with a transfer of electrons to the pool of plastoquinones. Recent crystallographic investigations of cyanobacterial PSII showed that a minimal structure capable of photosynthetic water oxidation and oxygen evolution (the so-called core complex of PSII) contains at least 20 protein subunits, 35 chlorophyll (Chl) molecules, 12 molecules of carotenoids, and at least 14–20 integral lipid molecules per monomer [1,2,3]. The light-induced charge separation with the formation of an oxidized primary electron donor, P680+• (the strongest biological oxidant, with a redox potential of 1.1–1.27 V [4,5]), occurs in the photochemical reaction centre (RC) consisting of main proteins, D1 (PsbA) and D2 (PsbD), and cytochrome b559 (Cyt b559). P680+• oxidizes TyrZ (tyrosine residue of D1 protein) with the formation of TyrZ, which in turn takes an electron from the Mn4CaO5 cluster, the inorganic core of the water-oxidizing complex (WOC). The sequential absorption of photons and charge separation in the RC result in the formation of intermediate states (S0–S4) of the WOC, and the transition from S4 to S0 is accompanied by the oxygen release.
An integral part of the reaction centre is Cyt b559, which participates in redox reactions and, in comparison with other redox components of the RC, is not located inside the D1/D2 heterodimer. Cyt b559 can be found in at least four different redox forms: the Cyt b559 high-potential (HP) form (E = from + 350 mV to + 450 mV), in intermediate-potential (IP) form (E = from + 125 to +240 mV), a low-potential (LP) form (E = from −40 to + 80 mV) (see [6]), and in a so-called very low-potential (VLP) form with Em = from −150 to −200 mV [7,8]. The ratio of the redox forms of Cyt b559 PSII preparations depends on the structural integrity and composition of PSII. It was shown that the perturbation of the WOC led to the decrease of HP Cyt b559 and the increase of IP and LP Cyt b559 [9,10]. It was also shown that the conversion of HP Cyt b559 to the LP Cyt b559 could be induced by acidification of the medium [11]. Cyt b559 is assumed to participate in cyclic electron transfer, which is considered to be a protective mechanism against the photoinhibition of PSII, but this photoprotective role of Cyt b559 is debated [12,13,14]. It has been shown that Cyt b559 shows the following enzymatic properties: oxygen reductase, superoxide reductase, superoxide oxidase, and plastoquinol oxidase (see review in [15]).
When electrons from water pass into the electron transport chain of PSII, compounds with low redox potential are formed. They are considered to be the essential sources for the production of superoxide anion radicals (O2−•), which are subsequently converted to H2O2 and O2 via spontaneous or enzyme-catalyzed dismutation. Using a luminol–peroxidase method for the detection of H2O2, it was shown that the light-induced yield of the H2O2 in isolated oxygen-evolving PSII membrane fragments was slight (about 0.01 H2O2 molecules per RC and saturating flash) [16,17]. Possible donors of electrons to O2 can be the reduced forms of the primary electron acceptor pheophytin (Pheo) [18], the primary (QA) and secondary (QB) quinone electron acceptors [19], plastosemiquinone (PQH) (where O2−• is produced via the proportion between plastoquinone (PQ) and plastoquinol (PQH2)) [20,21], and LP cytochrome Cyt b559 [22,23]. For a detailed description of O2-• and H2O2 photoproduction in PSII, see also [24,25].
It was shown that the treatments leading to the perturbation of the PSII donor side increased H2O2 photoproduction [16,17,26,27]. It was assumed that the increase of H2O2 photoproduction in the PSII after a partial injury of the WOC could be associated with the replacement of the four-electron (with the release of O2) by the two-electron (with the production of H2O2) oxidation of water [16,27]. However, using isotope-labelled water in combination with a detection system for H2O2 showed that the oxygen in H2O2 formed during the illumination of NaCI-wash PSII membranes did not originate from water [26]. Thus, H2O2 photoproduction in PSII can occur both via the disproportionation of O2−• formed as a result of the one-electron reduction of O2 on the PSII acceptor side and the incomplete photooxidation of water appearing after disturbance of the WOC.
In the present work, the effect of the step-by-step disassembly of the WOC on H2O2 and O2−• photoproduction in PSII membrane fragments and core complexes was investigated. The light-induced formation of O2−• and H2O2 in PSII was raised with the increasing destruction of the WOC. The comparison between H2O2 and O2−• photoproduction in PSII preparations showed that O2−• yield in all samples was approximately two times higher than H2O2. It is suggested that the stimulation of H2O2 photoproduction caused by the destruction of the WOC is mainly due to the acceptor side of PSII rather than the donor side via the enhancement of the O2−• production, and Cyt b559 can play a crucial role in this.

2. Results

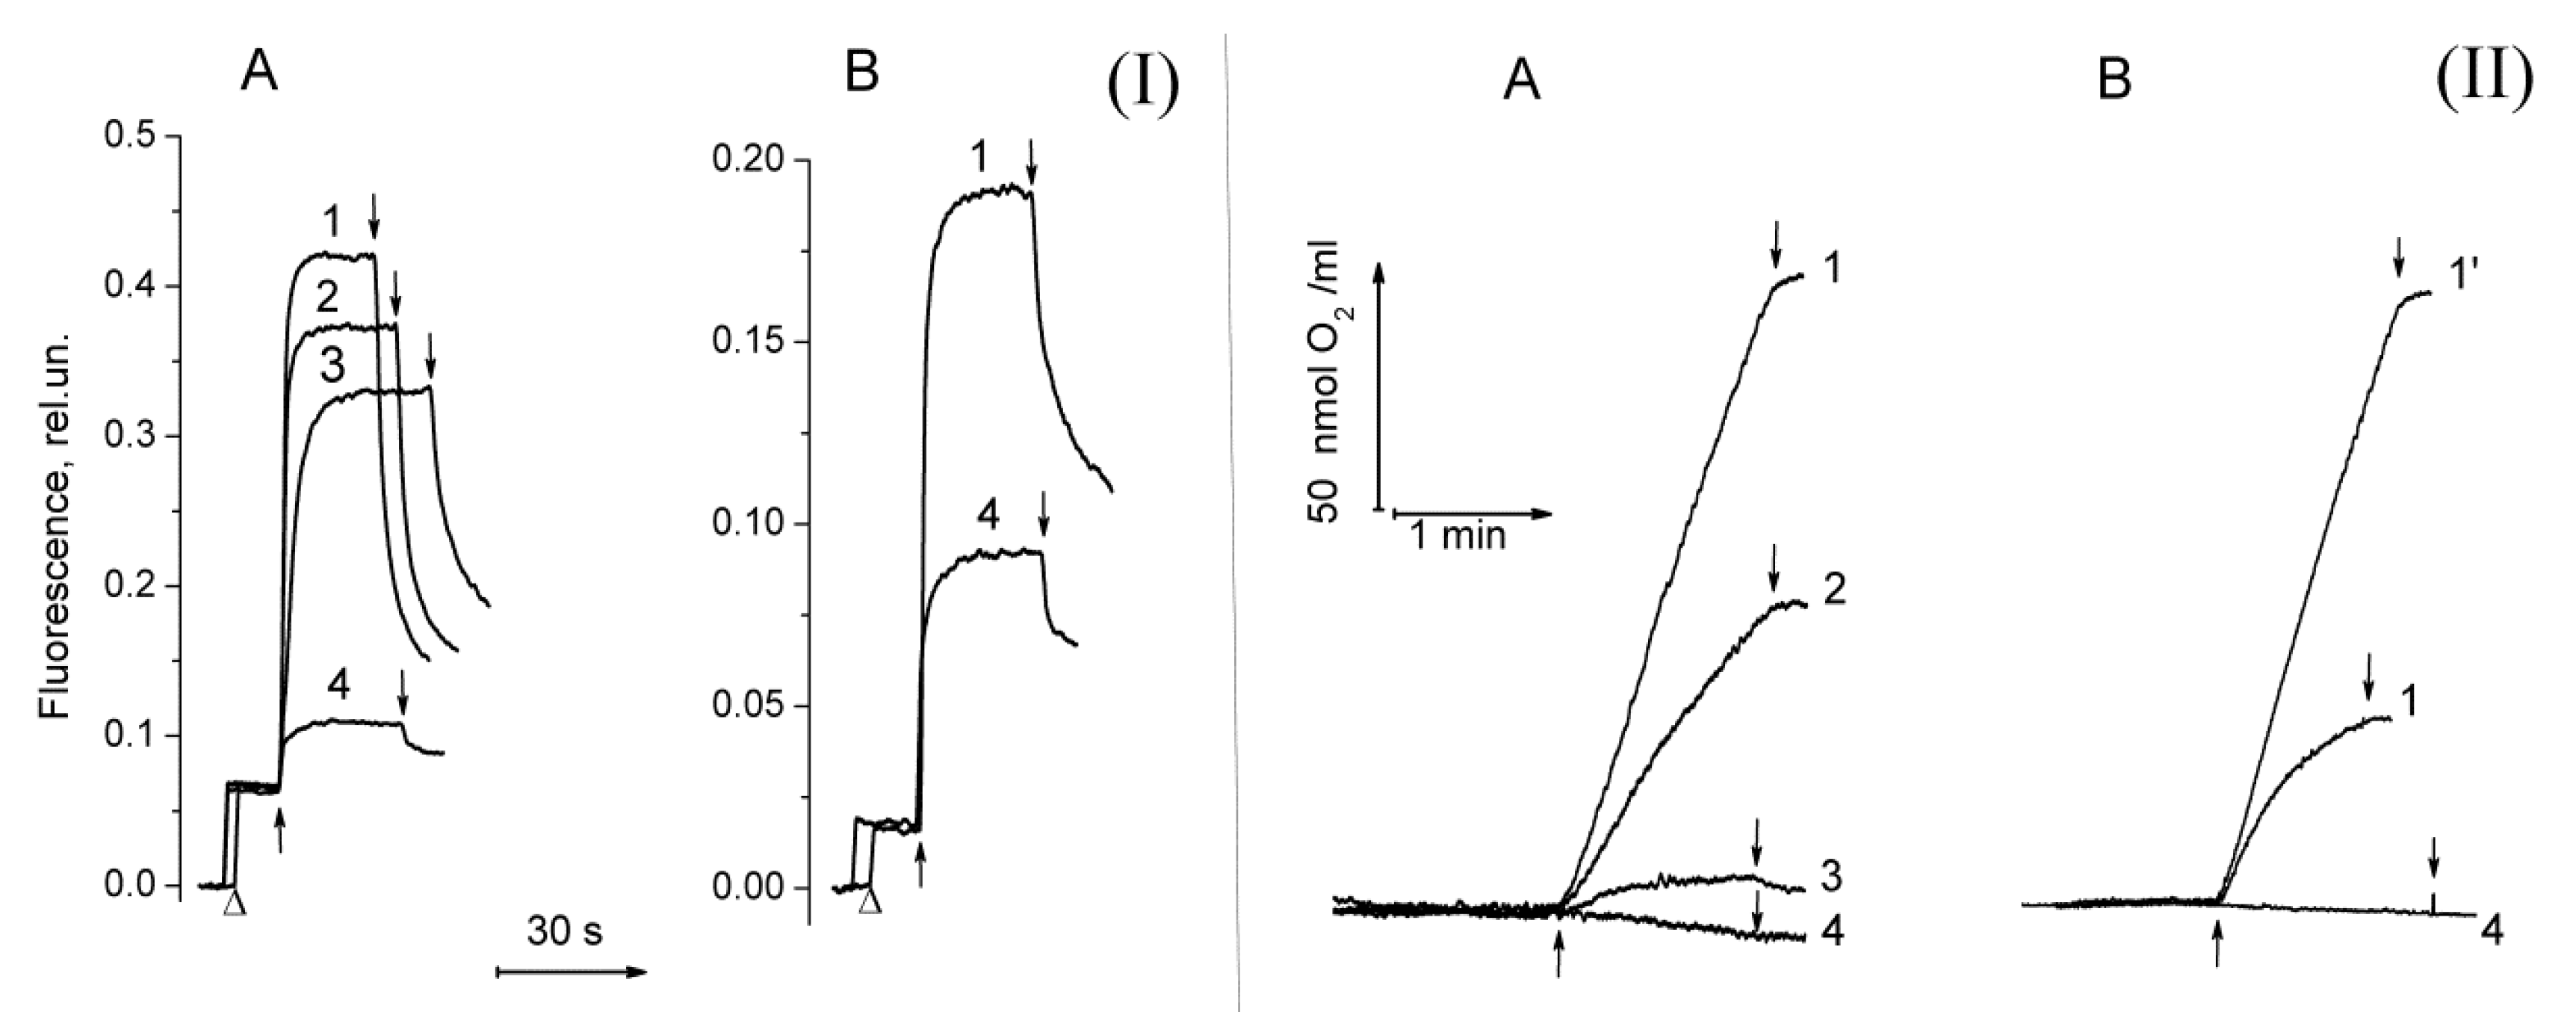
2.1. Functional Activity in PSII Preparations at Various Modifications of the WOC

The investigation of H2O2 and O2−• photoproduction in PSII was carried out on the PSII membranes and the PSII core complexes with different degrees of damage to the WOC: untreated, and NaCl-, CaCl2-, and NH2OH-treated PSII. The step-by-step disassembly of the WOC led to the suppression of PSII activity (oxygen-evolving activity and photoinduced ΔF). The yield of photoinduced ΔF was decreased by 20% and 30% after NaCl and CaCl2 treatments of PSII membranes, respectively (Figure 1(I)A, curves 2 and 3). The complete removal of Mn ions from the WOC by NH2OH treatment led to a 5-fold decrease in the ΔF (Figure 1(I)A, curve 4) due to the loss of electron donation from the Mn-containing WOC to the PS II reaction centre (RC), which is in accordance with previous publications [28]. The photosynthetic oxygen evolution was more sensitive to the treatments in comparison with the ΔF (Figure 1(II) A). The rate of photosynthetic oxygen evolution in the untreated PSII membranes was about 600 µmol O2 (mg Chl h)−1. The treatment of PSII membranes with NaCl and CaCl2 resulted in a decrease in the rate of photosynthetic O2 evolution by 30% and 90%, respectively. The Mn removal from the WOC completely inhibited the oxygen-evolving activity of PSII and resulted in O2 photoconsumption which, as was shown earlier, was associated with both the photoformation of organic hydroperoxides on the donor side via a radical chain mechanism and with the photoproduction of H2O2 on the acceptor side of PSII [29,30,31].
The PSII core complexes showed maximal oxygen-evolving activity (about 1300 µmol O2 (mg Chl h)−1) only in the presence of exogenous Ca2+ (Figure 1(II)B, curves 1 and 1’). The CaCl2 dependence of the oxygen-evolving activity in the core complexes can be associated with the partial removal of PsbP and PsbQ proteins during ion exchange chromatography, since the concentration of MgSO4 used to elute the PSII cores was about 100 mM. It was shown that the release of PsbP and PsbQ proteins from the WOC suppressed PSII oxygen-evolving activity and the addition of CaCl2 reconstituted high rates of oxygen evolution in the PS II preparations deprived of these proteins [32]. Due to this reason, only NH2OH treatment was performed to modify the WOC in the PSII core complexes. In comparison with PSII membranes (where the release of Mn from the WOC resulted in a drastic decrease in the ΔF), the yield of ΔF in the Mn-depleted PSII core complexes was about two times less than in the untreated ones (Figure 1(I)B). A similar yield of ΔF was also observed in Mn-depleted PSII core complexes which were obtained by isolation from Mn-depleted PSII membranes. This may be due to the removal of a quinone from the QB site, since the QB quinone can release from its binding site during the isolation of PSII core complexes [33]. Even though the yield of ΔF in the Mn-depleted PSII core complexes was sufficiently high, the ability of the samples to perform photosynthetic oxygen evolution was completely lost (Figure 1(II)B, curve 4).

2.2. The Ratio in Redox Forms of Cyt b559 in PSII Preparations at Various Modifications of the WOC

In addition to the suppression of the PSII functional activity, the destruction of the WOC changed the ratio in redox forms of Cyt b559 in the PSII membranes (Table 1). The contents of HP, IP, and LP Cyt b559 in the untreated PSII membranes were 57%, 9%, and 34%, respectively. The treatment of PSII membranes with 1 M NaCl caused a slight decrease in the content of HP Cyt b559 and an increase of its IP form without changing the content of LP Cyt b559. A much stronger disturbance of the WOC induced by the treatment of PSII membranes with 1 M CaCl2 was accompanied by a significant decrease in the proportion of HP Cyt b559 and increase of IP and LP Cyt b559; thus, the ratio of the redox form of Cyt b559 in the samples was about 20% of the HP form, 35% of the IP form, and 45% of the LP form. In the Mn-depleted PSII membranes, most of Cyt b559 was in the LP (52%) and the IP (31%) forms, and only 17% was in the HP form. The similar interrelationship between the state of the WOC and the ratio in the redox forms of Cyt b559 in PSII preparations was shown previously [9,10]. In contrast to PSII membranes, untreated PSII core complexes contained about 12 % of HP Cyt b559, and this percentage did not change after the removal of Mn from the WOC. However, the untreated and Mn-depleted PSII core complexes considerably differed in the content of IP and LP Cyt b559: For the untreated samples, the contents of the IP and LP forms were 45% and 43%, respectively, while Mn-depleted samples contained 21% of the IP form and 67 % of the LP form (Table 1).

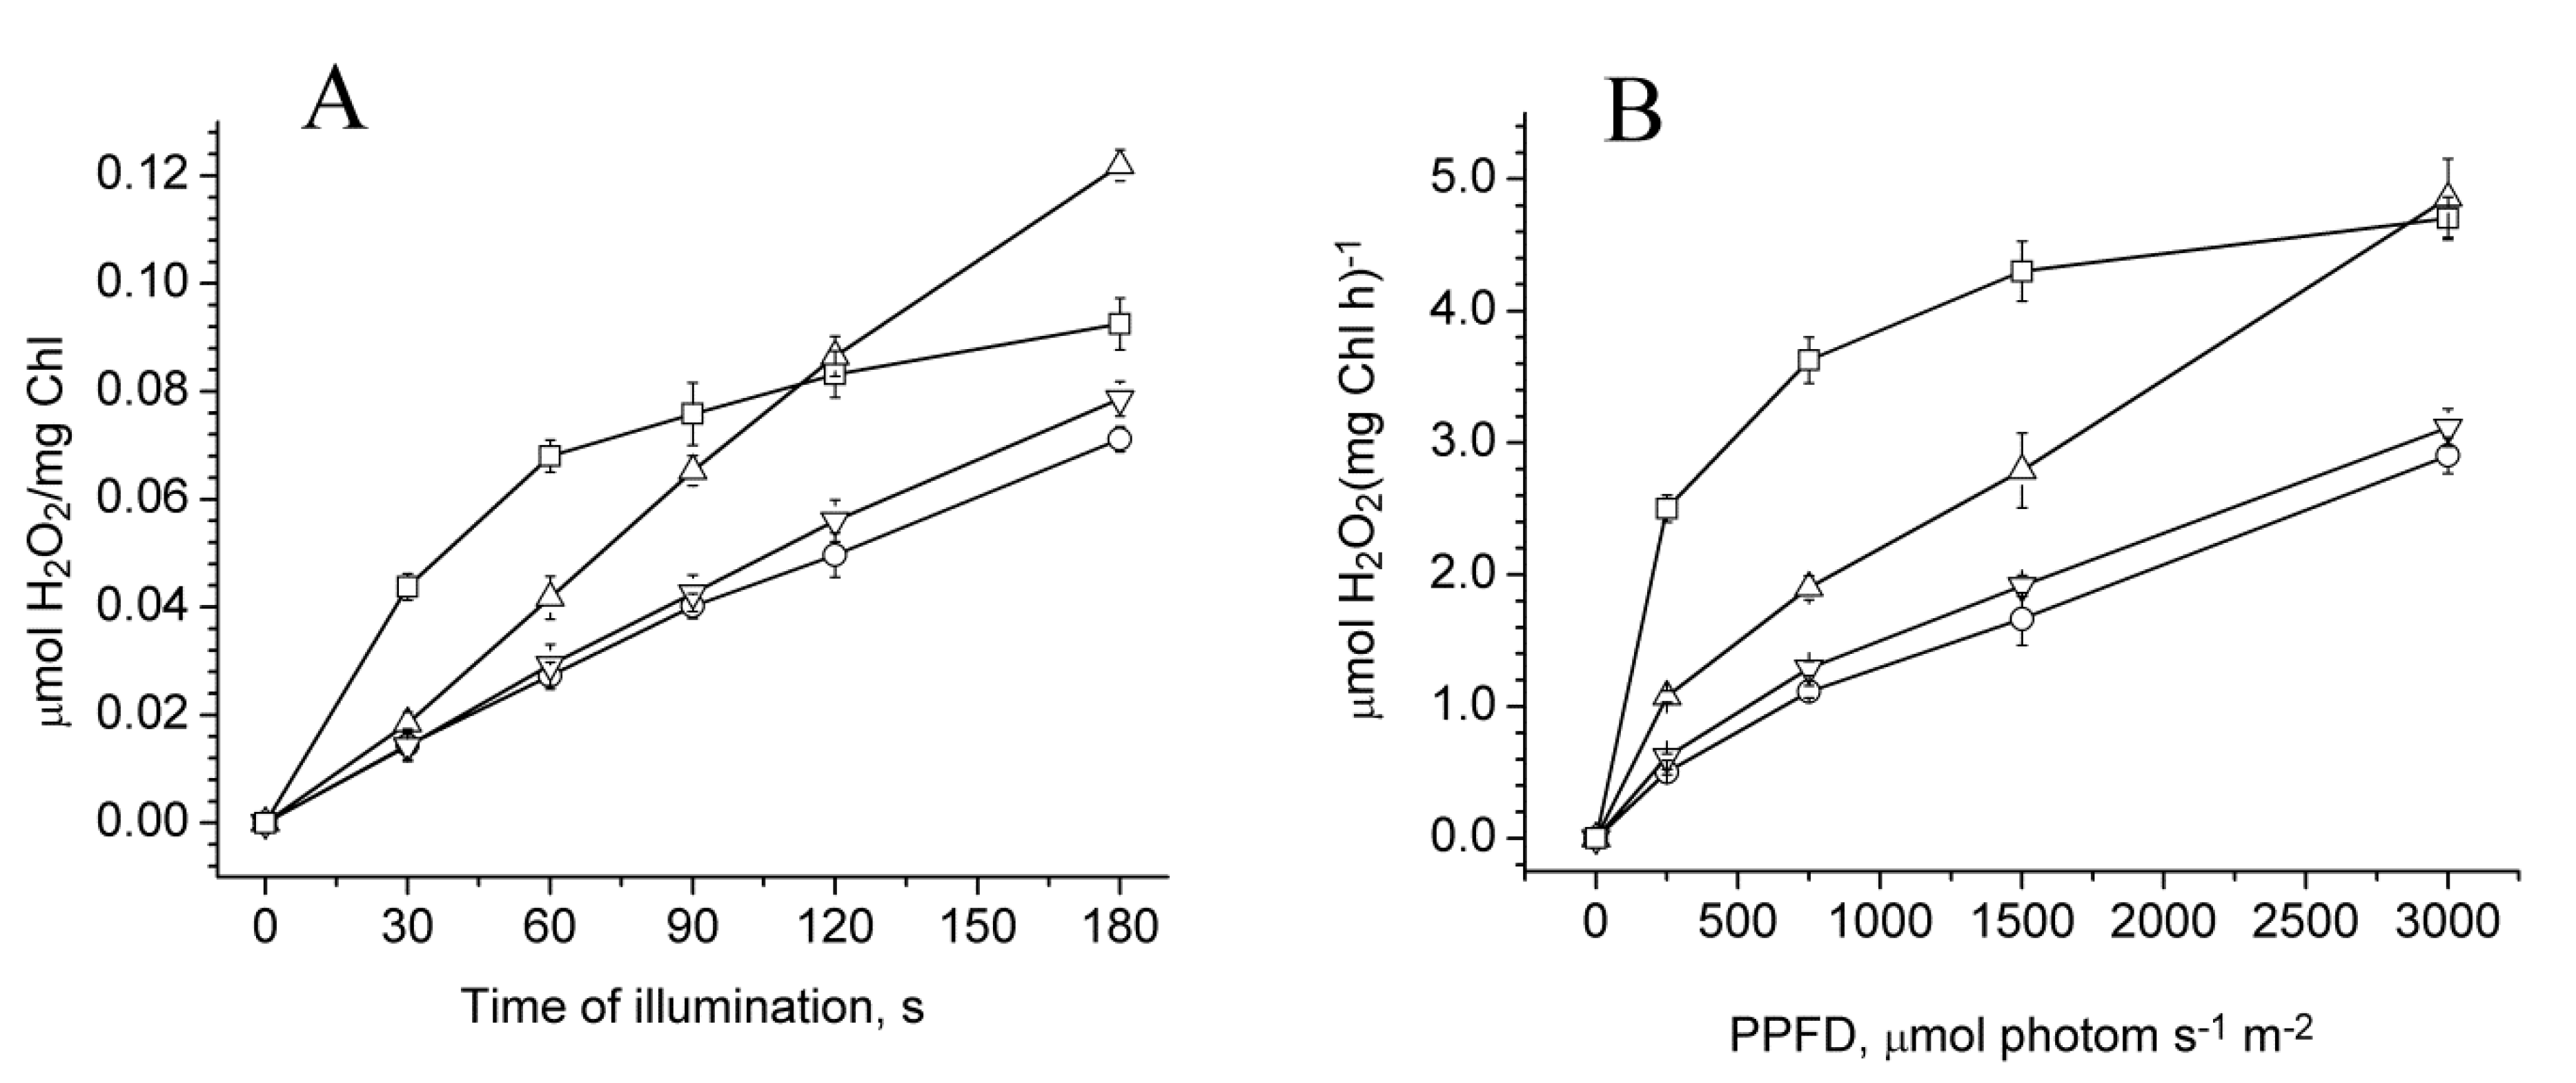
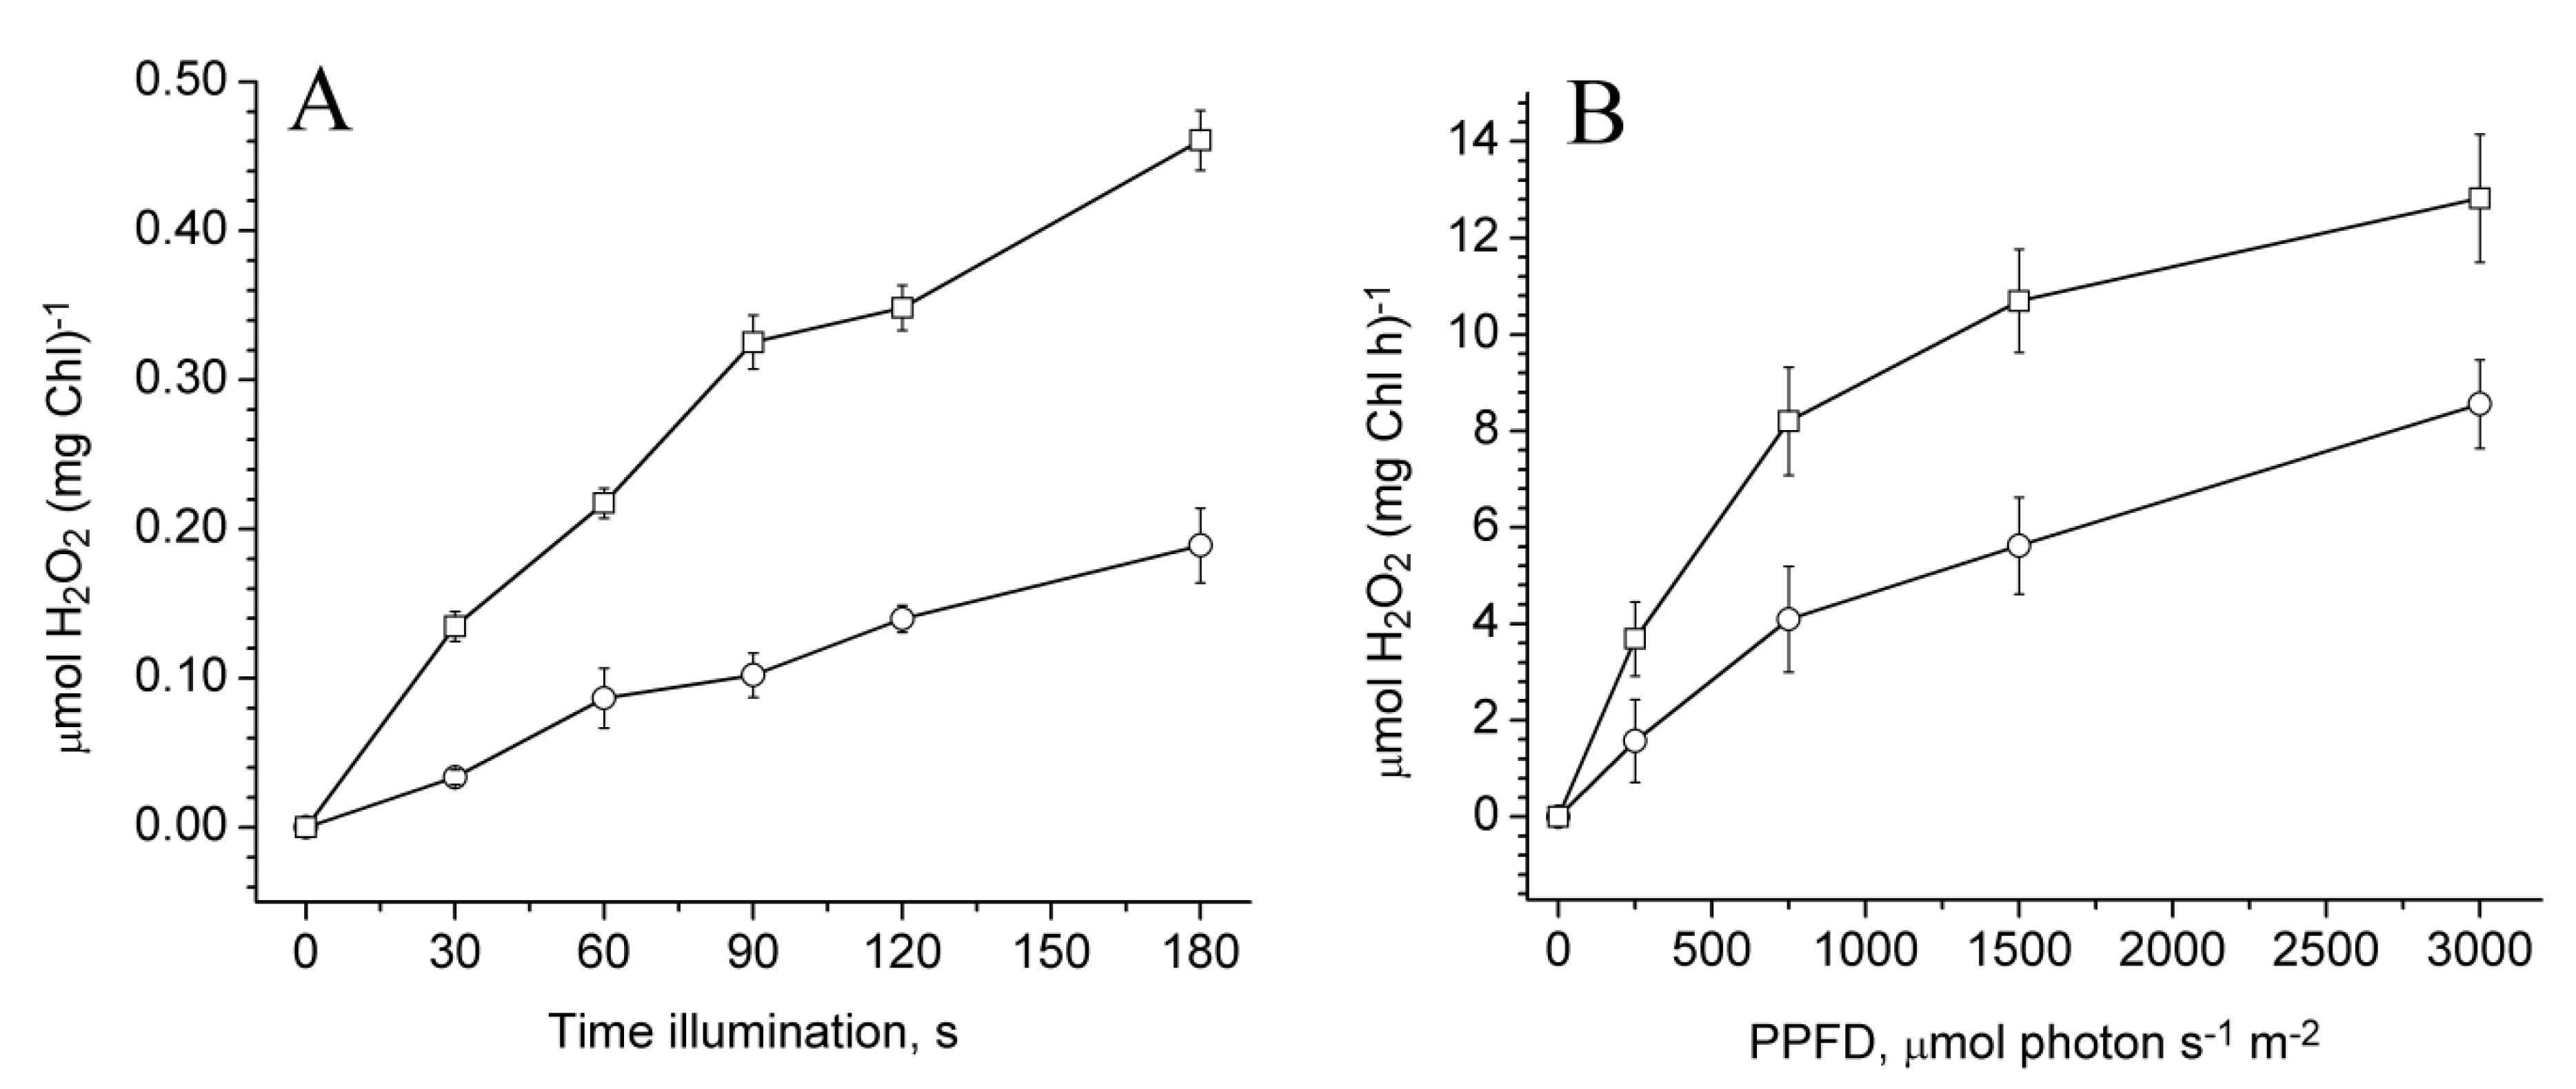
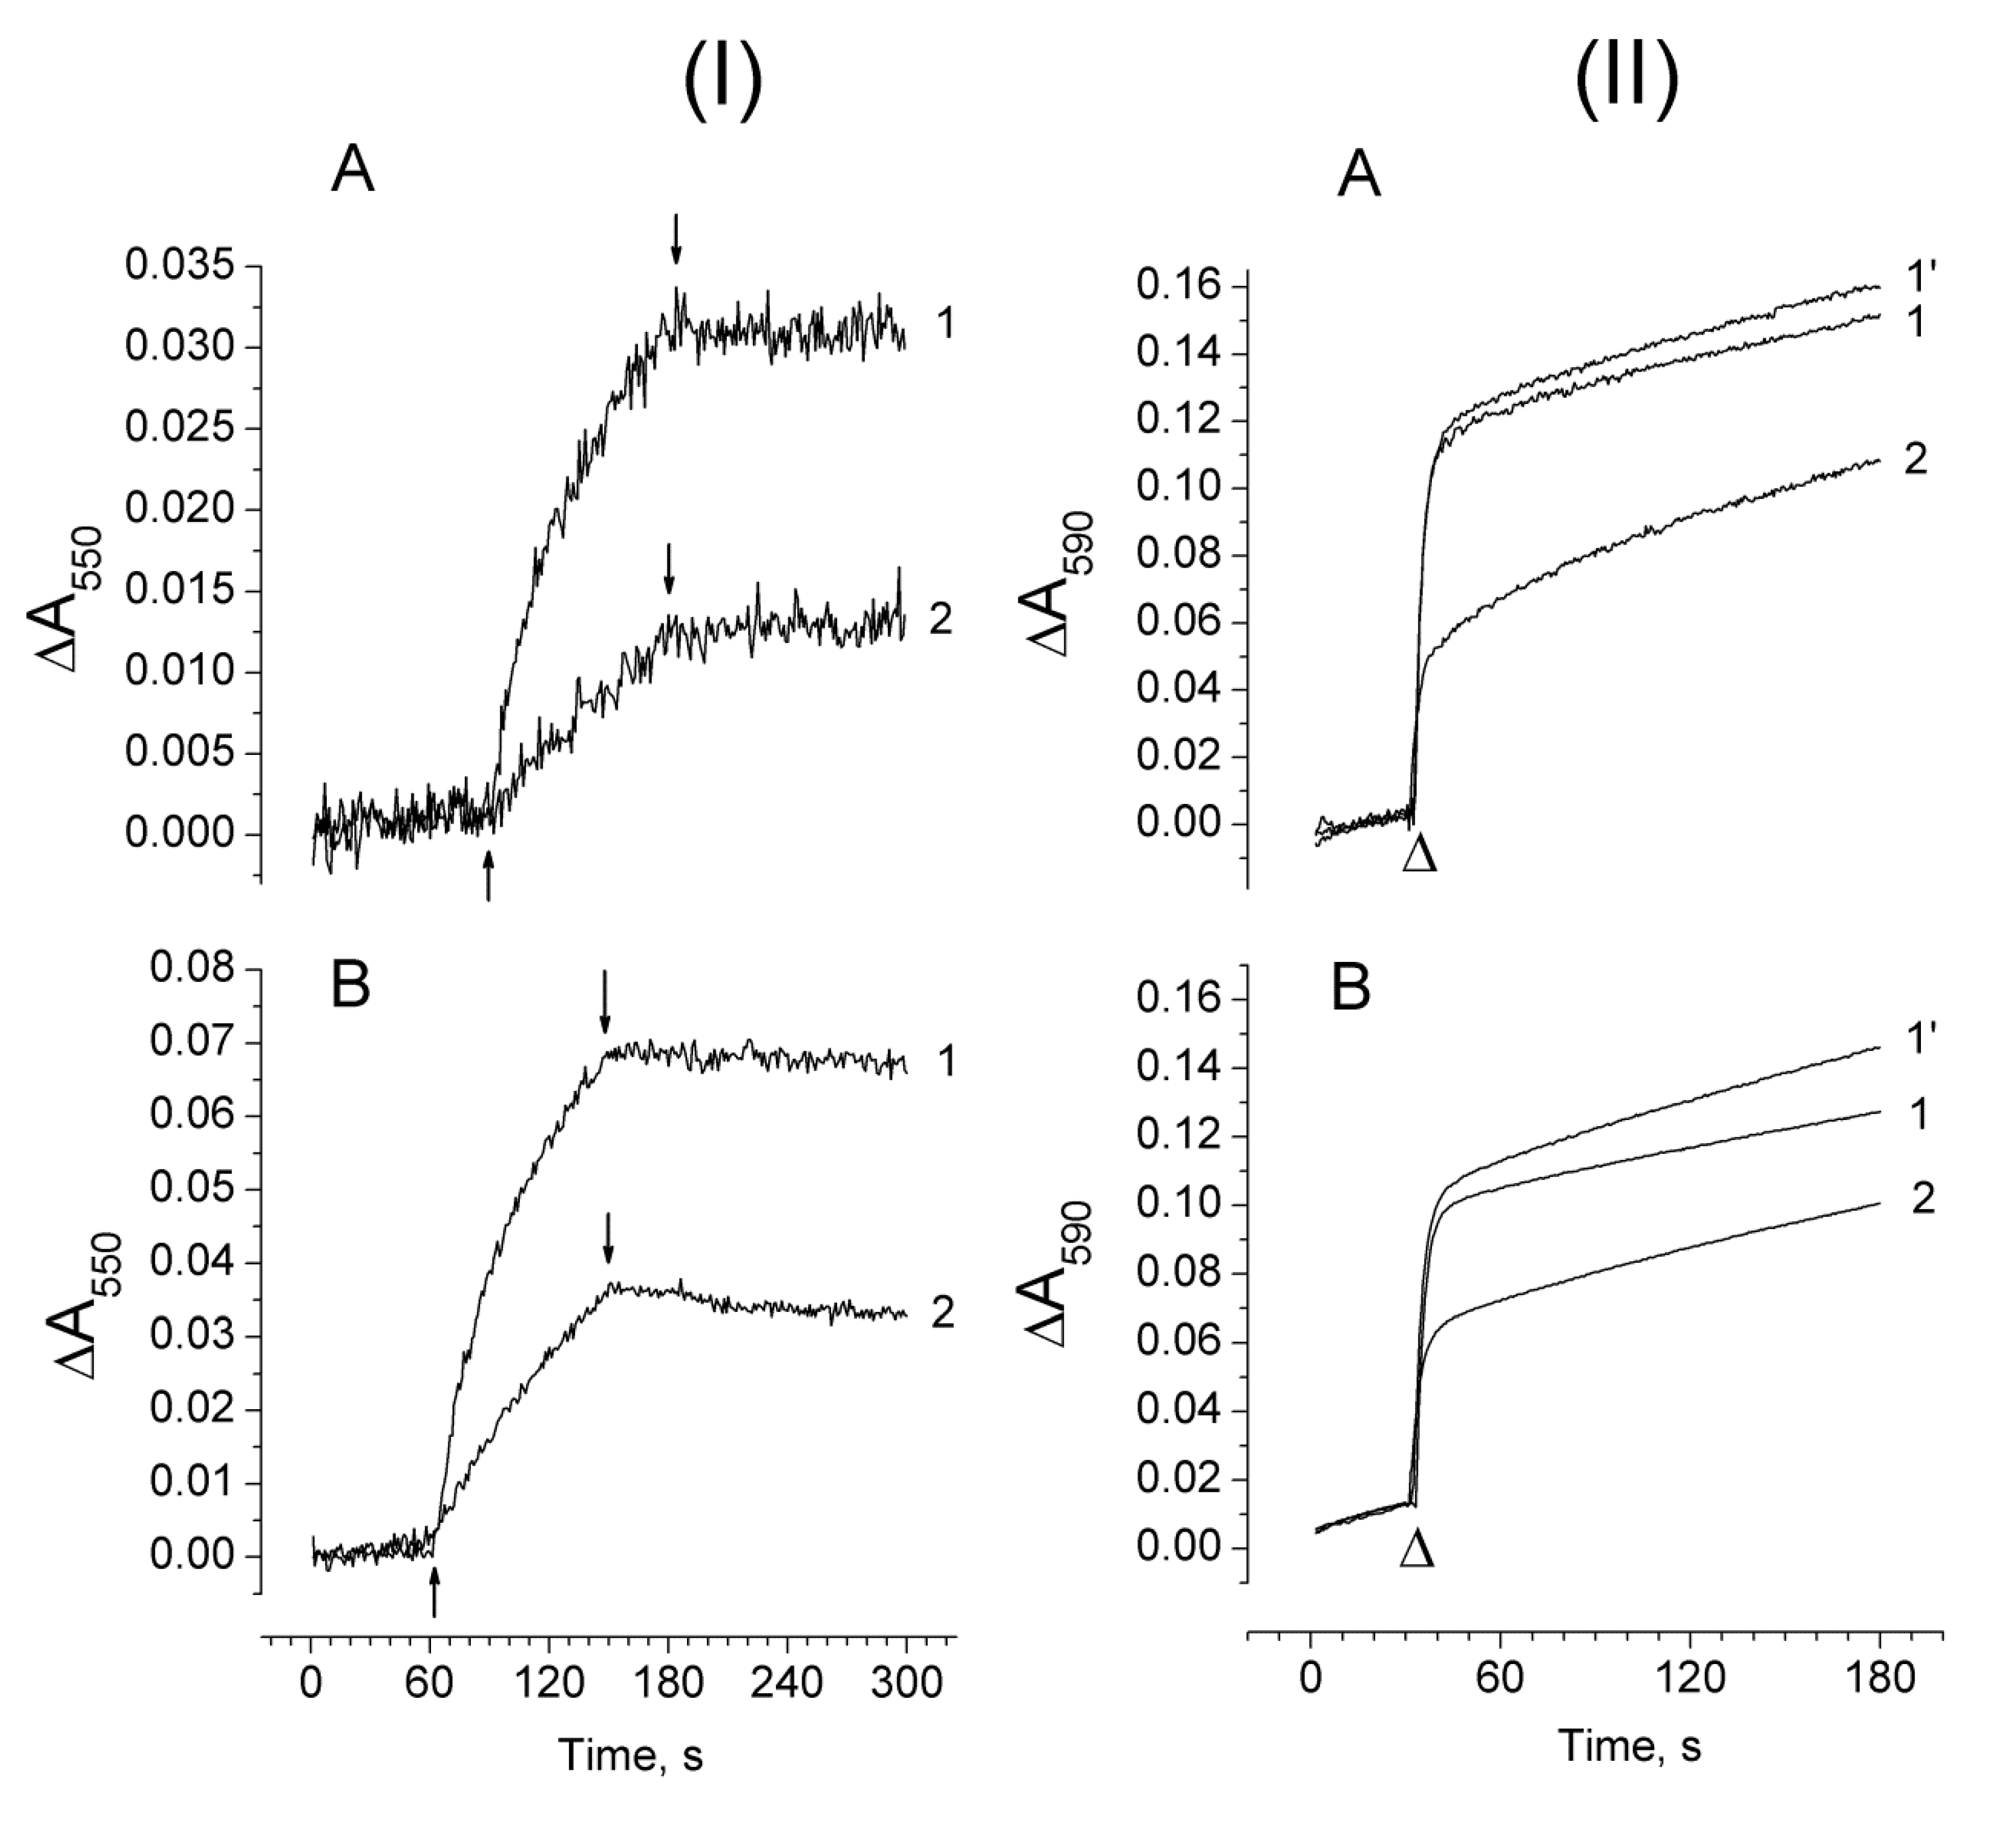
2.3. Photoproduction of H2O2 in PSII Preparations at Various Modifications of the WOC

Figure 2A illustrates the dependence of H2O2 photoproduction in the PSII membranes, varying in the degree of damage to the WOC, on the duration of illumination. The photoproduction of H2O2 by PSII membranes increased with the increasing destruction of the WOC. If, before treatments, the PSII membranes produced about 0.014 μmol H2O2 per mg Chl for 30 s of illumination (λ > 600 nm, 1500 µmol photon s−1 m−2), then after NaCl, CaCl2, and NH2OH treatments, the yield of H2O2 was 0.014, 0.018, and 0.045 μmol H2O2 per mg Chl, respectively. It appears from this that the Mn-depleted PSII membranes, in which the electron supply from water to the reaction centre was inhibited, produced three times more H2O2 than other samples. However, the capability of Mn-depleted PSII membranes to the light-induced production of H2O2 decreased during illumination. As a consequence, the amount of H2O2 produced by the Mn-depleted PSII membranes with 3 min of lighting was close to that generated by untreated samples. Ono and Inoue [34] showed that a gradual release of Mn from the WOC in the CaCl2-washed PSII membranes took place, and the Mn abundance in the samples decreased to about one half of the initial level after incubation in CaCl2-free medium at 0 °C under darkness for 7 h. In our case, the incubation time of the CaCl2-treated PSII membranes at 0 °C did not exceed 30 minutes, since a small aliquot of the samples was thawed for each series of measurements. In this regard, the number of reaction centres containing two manganese ions should be small based on the total number of reaction centres. Nevertheless, the CaCl2-treated samples containing about two Mn ions per RC were specially prepared. The rates of H2O2 and O2−• photoproduction in these samples were two times higher than those of the CaCl2-treated PSII membranes containing four Mn ions per RC (data not presented).
Figure 2B shows the dependence of the rate of H2O2 photoproduction by the PSII membranes on light intensity. The rate of H2O2 production was calculated by monitoring the concentration of H2O2 formed upon 1 min illumination of the samples. The rate of H2O2 photoproduction in untreated PSII membranes at 250 μmol photons m−2 s−1 was equal to 0.5 μmol H2O2 (mg Chl h)−1, and it increased two times after CaCl2 treatment of the PSII membranes and five times after Mn removal. The difference in the rate of H2O2 photoproduction between the untreated and Mn-depleted PSII membranes gradually decreased with increasing light intensity, to the extent that at the photosynthetic photon flux density (PPFD) of 3000 μmol of photons m−2 s−1, the rate of H2O2 photoproduction by Mn-depleted PSII membranes was only two times higher than in untreated ones (4.7 and 2.8 μmol H2O2 (mg Chl h)−1, respectively). At the same time, the difference in the rates of H2O2 production between untreated and NaCl- and CaCl2-treated PSII membranes upon the increase of PPFD was practically unchanged. Similar to PSII membranes, the removal of Mn clusters from the PSII core complexes stimulated the photoproduction of H2O2 (Figure 3). The rate of H2O2 photoproduction in Mn-depleted PSII core complexes calculated for 30 s after the start of continuous illumination (λ > 600 nm, 1500 µmol photon s−1 m−2) was four times higher than the untreated samples (16 μmol and 4 μmol H2O2 per mg Chl h, respectively). However, the suppression of H2O2 production in Mn-depleted PSII core complexes during illumination or at increasing light intensity occurred slower than in the Mn-depleted PSII membranes.
In addition to H2O2, other species of peroxides (such as organic hydroperoxides) also can be formed upon the illumination of PSII preparations, which is especially applicable to the Mn-depleted samples [29,30,31]. To obtain insight into the specificity of homovanilic acid (HVA) for other peroxide species, the reaction of the probe with two peroxides—m-chloroperbenzoic acid (MCPBA) as a model of a lipophilic hydroperoxide and tert-butyl hydroperoxide (TBHP) as a hydrophilic hydroperoxide—was examined. The addition of MCPBA or TBHP at a concentration even ten times higher than H2O2 resulted in only a slight increase in the fluorescence intensity of HVA, indicating that the contribution of hydroperoxides (which could be formed on the donor side of PSII) was negligible (Supplementary Materials Figure S1).

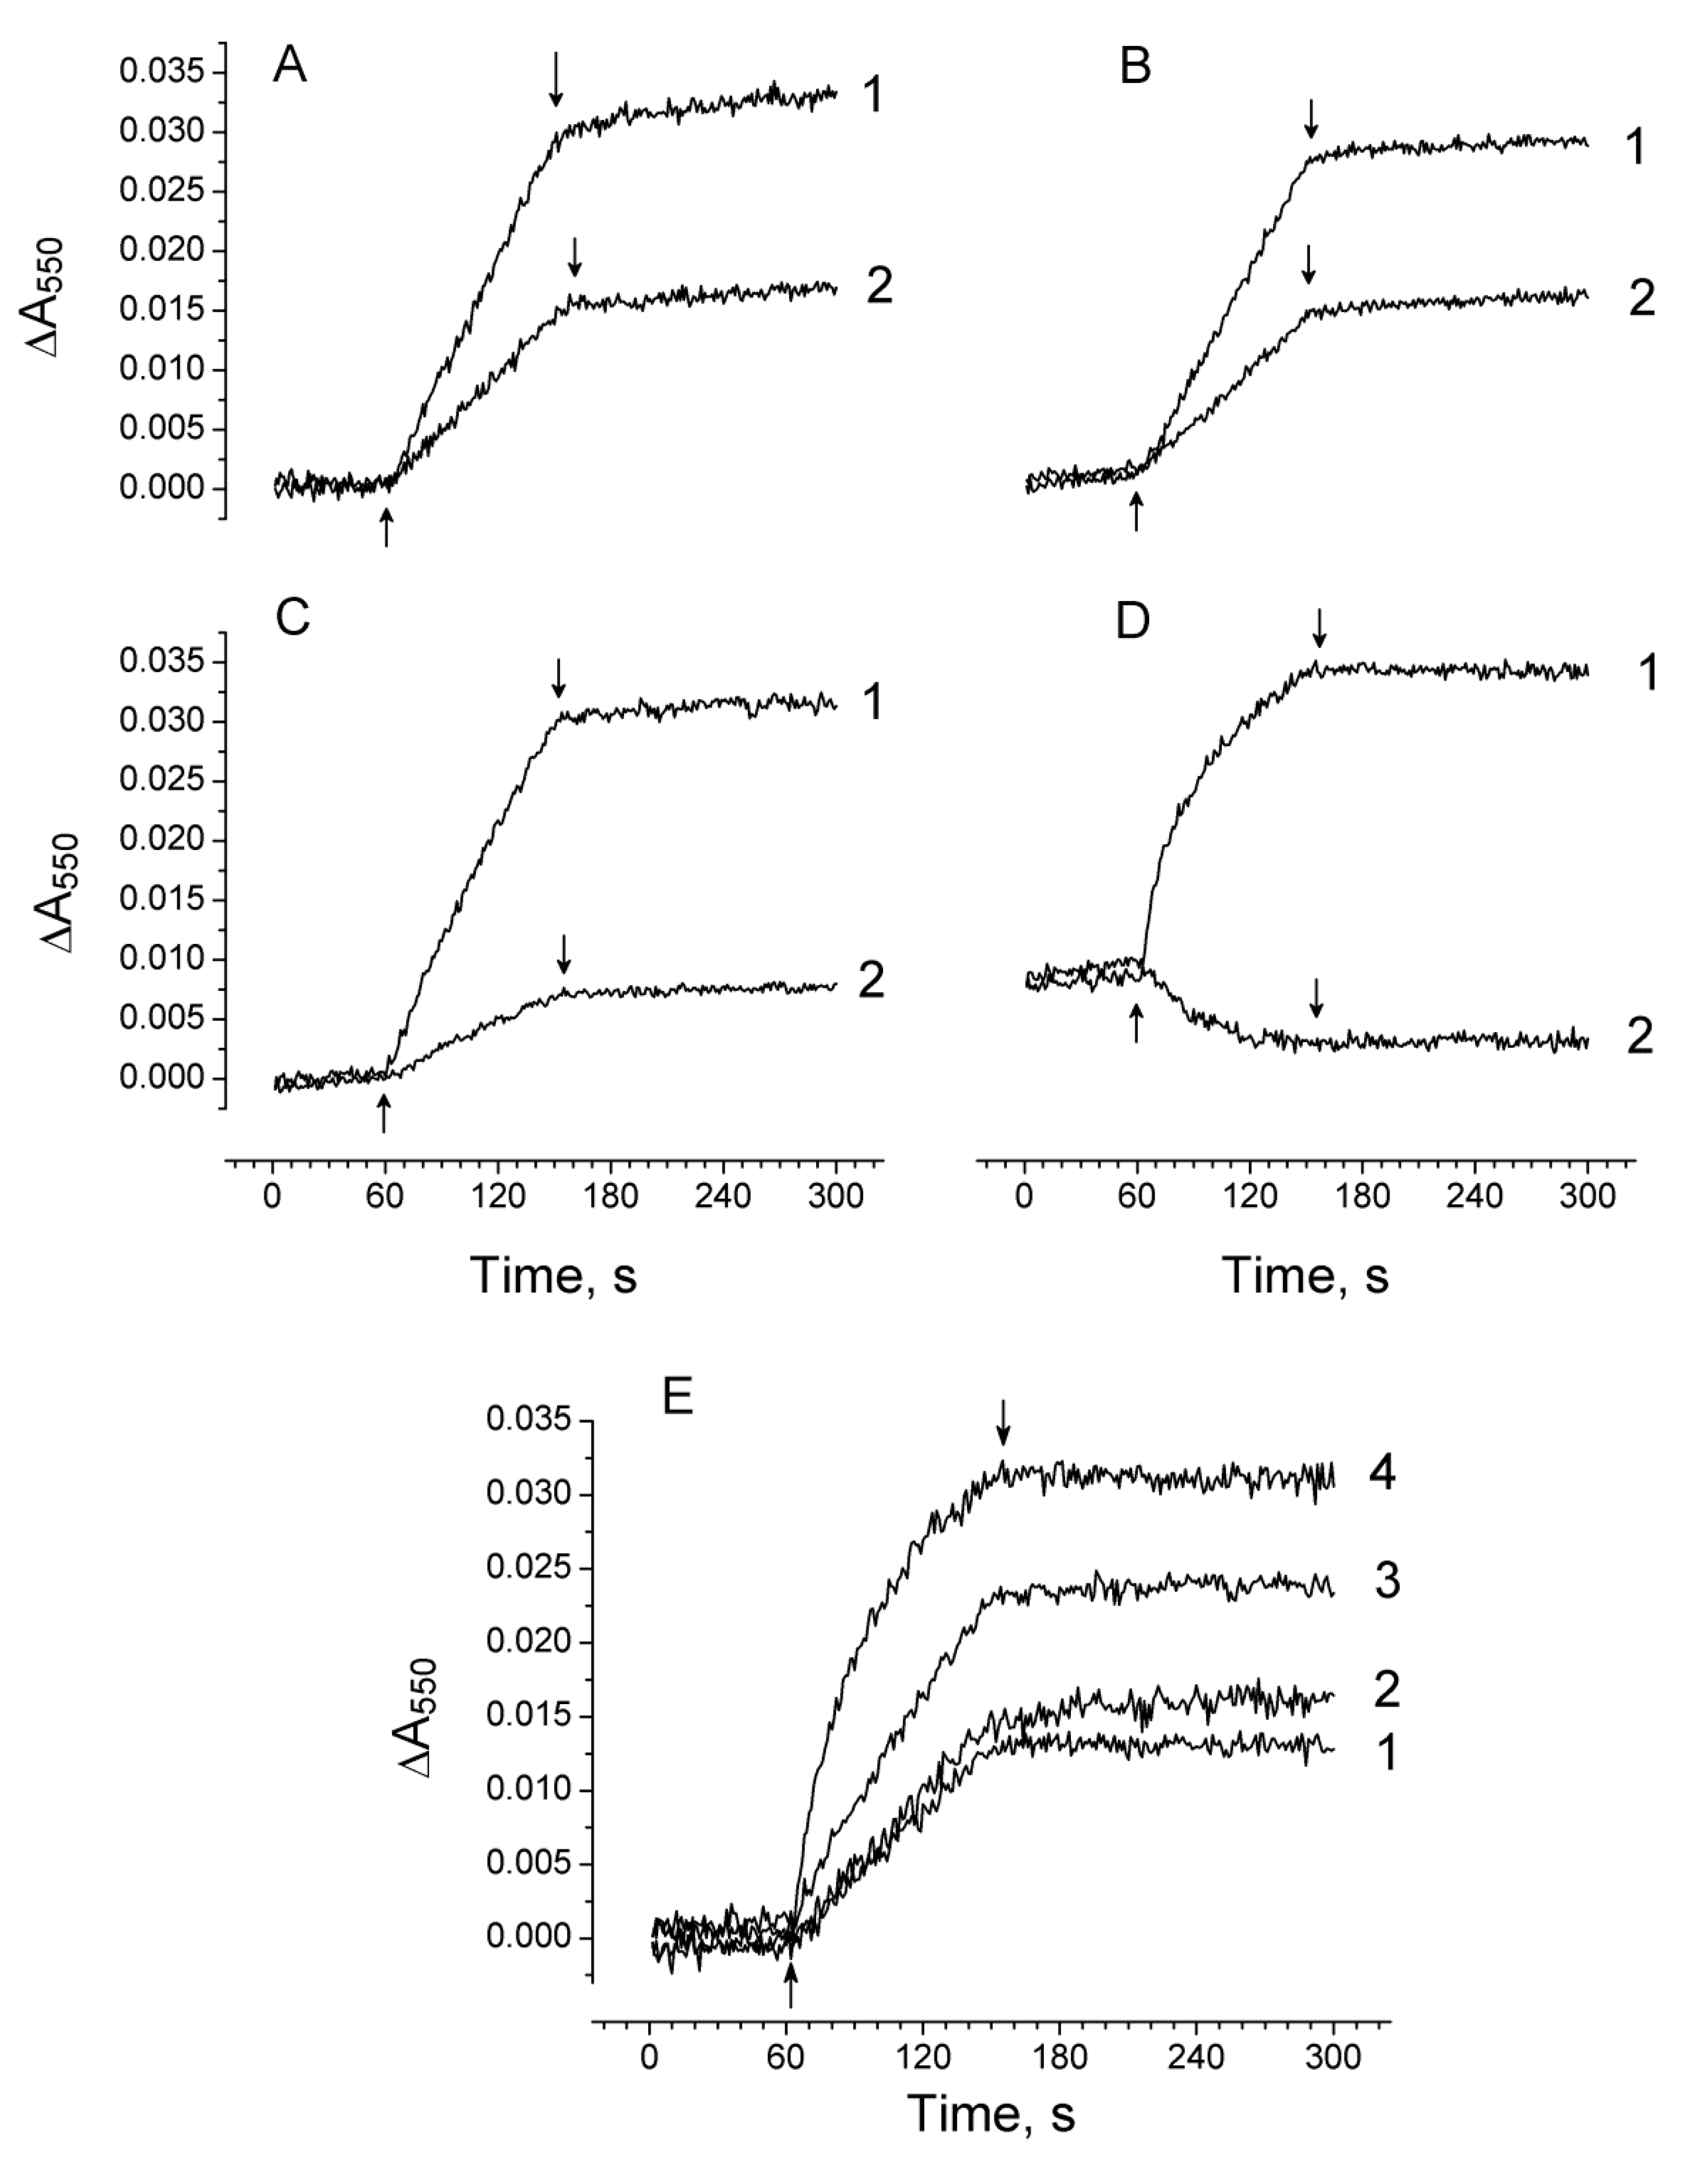
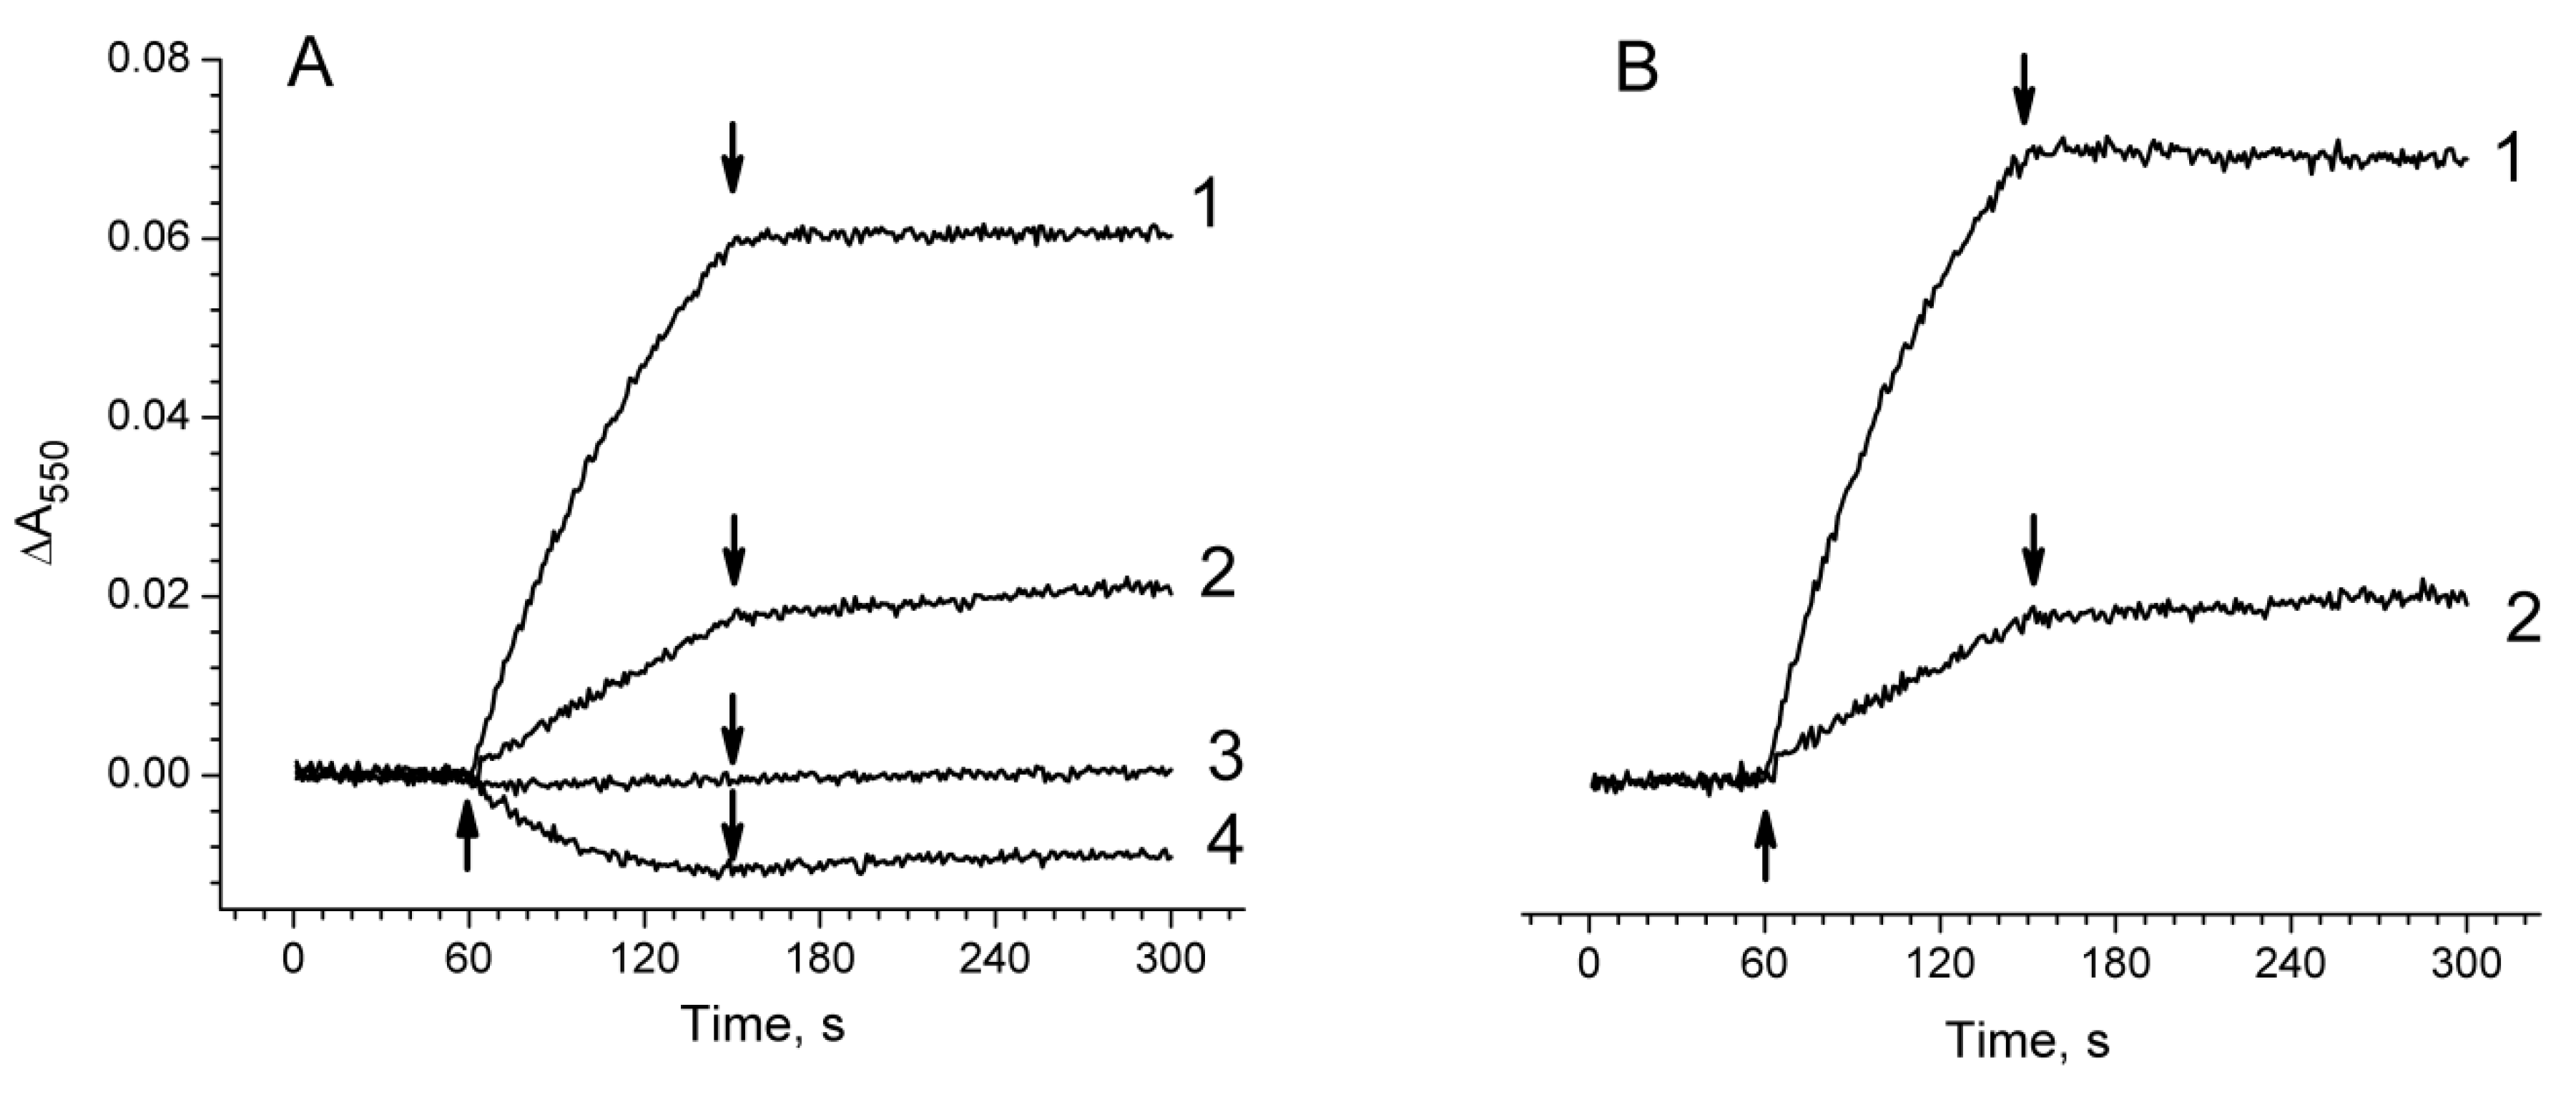
2.4. Photoproduction of O2−• in PSII Preparations at Various Modification of the WOC

The main path of H2O2 production in PSII is the disproportion of superoxide anion radicals, which are from the one-electron reduction of O2 on the acceptor side of PSII. The photoproduction of O2-• in the PSII preparations was investigated using Cyt c. To distinguish the photoreduction of Cyt c related to O2−• from its reduction by reduced electron carriers on the acceptor side of PSII [35], the measurements were performed both in the absence and in the presence of superoxide dismutase (SOD). The photoreduction of Cyt c in untreated PSII membranes as well as in NaCl- and CaCl2-treated PSII membranes in the absence of SOD occurred with equal rates (Figure 4A–C, curve 1). The rate of Cyt c photoreduction in the Mn-depleted PSII membranes was much higher in comparison with other samples (especially during the first 10 seconds of illumination (Figure 4D, curve 1). The SOD added to the PSII membranes suppressed the Cyt c photoreduction and degree of the suppression depending on the destruction of the WOC (Figure 4A–D, curve 2). The inhibition of the Cyt c photoreduction with SOD was equal to 50%, 60%, and 76% in the untreated PSII, NaCl-, and CaCl2-treated PSII membranes, respectively. The addition of SOD completely suppressed Cyt c photoreduction by the Mn-depleted PSII membranes, and negative ΔA550 was observed (Figure 4D, curve 2) which, as was shown recently [35], is associated with photooxidation of reduced Cyt c on the donor side of PSII. Figure 4E shows the kinetics of the Cyt c photoreduction after the subtraction of the kinetics measured in the presence of SOD, which demonstrates O2−•-dependent Cyt c reduction. These data indicate that the increase in the damage to the WOC stimulates O2−• photoproduction by PSII membranes. The removal of Mn clusters from the PSII core complexes also led to a significant increase in the rate of Cyt c photoreduction. However, in contrast to PSII membranes, the addition of SOD completely suppressed the Cyt c photoreduction both in untreated and Mn-depleted PSII core complexes (Figure 5A, curves 3 and 4), indicating that the samples were not capable of reducing Cyt c by electron carriers. Figure 5B shows the Cyt c reduction associated with the light-induced O2−• formation in PSII core complexes. As can be seen from the figure, Mn removal from the WOC led to a significant (more than five times) stimulation of O2−• photoproduction in PSII core complexes.
The addition of 20 µM diuron led to the almost complete suppression of H2O2 and O2−• photoproduction in all the samples. This demonstrates that H2O2 and O2−• photoproduction is linked to electron transport in PSII.
Table 2 shows the comparison in the rates of H2O2 and O2−• photoproduction in PSII preparations at various modifications of the WOC. As illustrated above, the ability of the Mn-depleted PSII preparations to produce H2O2 and O2−• was significantly decreased during illumination as a consequence of their sensitivity to light. Therefore, the rates were calculated for 30 s after the start of illumination (λ > 600 nm, 1500 µmol photon m−2 s−1) of the PSII preparations. The rate of light-induced formation of O2−• and H2O2 in the PSII preparations rose with the increasing destruction of the WOC, and the photoproduction of O2−• in all samples was almost two times higher than H2O2. The data suggest that all or most of the H2O2 comes from O2−• dismutation, where two molecules of O2−• form one peroxide molecule.

2.5. Effect of Exogenous Electron Donors on the Photoproduction of O2−• and H2O2 in Mn-Depleted PSII Preparations

Exogenous electron donors effectively restore photoinduced ΔF as a result of an increase in electron flow to the PSII reaction centre [28]. Figure 6I shows the Cyt c reduction associated with O2−• photoproduction in Mn-depleted PSII membranes (Figure 6IA) and in Mn-depleted PSII core complexes (Figure 6IB) upon the addition of 50 µM diphenylcarbazide (DPC). The restoration of electron flow in the Mn-depleted PSII preparations by DPC resulted in a three-fold suppression of O2−• photoproduction in PSII membranes, which was two-fold in PSII core complexes. The effect of the exogenous electron donor, Mn2+, on the photoproduction of H2O2 in the Mn-depleted PSII preparations was studied using an H2O2-dependent couple reaction between 3-methyl-2-benzothiazolinone hydrazone (MBTH) and 3-(dimethylamino) benzoic acid (DMAB) catalyzed by peroxidase. The use of another system for the determination of H2O2 was due to the fact that the electron donors used for the restoration of electron flow in the Mn-depleted PSII preparations affected the reaction of H2O2 with HVA. In addition to this, Mn2+ was used instead of DPC since DPC also affected the determination of H2O2 by this measuring system. MnCl2 (50 µM) added to the samples before illumination diminished the photoproduction of H2O2 in Mn-depleted PSII membranes and core complexes by 55% and 45%, respectively (Figure 6II, kinetics 1 and 2). Adding 50 µM MnCl2 to the samples after illumination had practically no effect on the light-induced yield of H2O2 (Figure 6II, kinetics 1′), indicating that MnCl2 did not affect the H2O2-dependent couple reaction between MBTH and DMAB as well, not leading to H2O2 decomposition.

3. Discussion

The obtained results demonstrate that the step-by-step disassembly of the WOC leading to the suppression of electron transport from the WOC to RC stimulates H2O2 and O2−• photoproduction in PSII, and, among the samples, the Mn-depleted PSII preparations (which are not capable of water oxidation) show the highest rate of H2O2 and O2−• photoproduction. The photoproduction of H2O2 in PSII can be associated with both the univalent reduction of O2 on the acceptor side to O2−• (see [24,25]) and H2O2 formed on the donor side when the WOC is perturbed without the release of manganese [16,27]. In our case, the stimulation of H2O2 photoproduction in the PSII preparations induced by the injury of the WOC was mainly due to the increase in the O2−• production on the acceptor side of PSII. This conclusion has been made based on the following observations: (1) The rate of O2−• photoproduction was approximately two times higher than H2O2 (Table 2), and in the reaction dismutation, two O2−• give the yield of one molecule of H2O2 (although the part of produced H2O2 can be oxidized by PSII during illumination, especially in the presence of exogenous Mn2+ [36,37]); (2) the PSII preparations deprived of Mn4CaO5 complex (when the water oxidation in PSII was lost entirely) showed maximal activity in O2−• and H2O2 photoproduction. However, in comparison with the samples holding the Mn cluster, the capability of Mn-depleted PSII membranes for H2O2 photoproduction drastically decreased during illumination or at high light intensity. This behavior of Mn-depleted PSII membranes can be attributed to the deficiency of the electron source and high sensitivity of Mn-depleted PSII preparations to photoinhibition. The sources of electrons for P680+• and TyrZ˙ in the absence of an Mn cluster can be chlorophylls and carotenoids (their photooxidation has been shown in several works [38,39,40,41,42]), lipids in the lipid belt around D1 and D2 (their presence in the RC has been demonstrated [2,43]), the amino acid residues involved in coordination of the Mn4CaO5 cluster [3], and His located in the vicinity of TyrZ. Apparently, the changes of the acceptor side caused by the modification of the WOC facilitate the photoproduction of O2−•. However, it cannot be excluded that the donor side of PSII also generates H2O2, especially in the case of CaCl2-treated PSII membranes [27,44], but its contribution seems negligible. In order to accurately estimate the contribution of the donor side, it is necessary to separate the H2O2 formed on the acceptor side from the donor side.
Pool PQ, pheophytin, QA, and Cyt b559 are considered to be the primary sources involved in O2−• and H2O2 photoproduction on the acceptor side (see [24,25]). It is worthwhile to consider the role of these cofactors in the enhancement of O2−• and H2O2 photoproduction by PSII preparations after the destruction of the WOC.
The pool of PQ is shown to be involved in H2O2 formation within the thylakoid membrane [20,21]. The isolation of PSII preparations results in the deprivation of the PQ pool. It was shown that the PQ content was about 2.5 PQ/RC for PSII membranes [45], while the QB quinone could be release from its binding site during the isolation of PSII core complexes (these complexes did not emit the B-band arising from S2QB charge recombination, although the vacant QB pocket preserved a high affinity for 3-(3,4-dichlorophenyl)-1,1-dimethylurea (DCMU)) [33]. The analysis of PQ in the PSII core complexes isolated from cyanobacterium Acaryochloris marina MBIC 11017 showed that these complexes contained about 1.4 PQ per RC [46]. Since the increase of O2−• and H2O2 photoproduction after damage to the WOC took place in both PSII membranes and core complexes, the participation of the PQ pool in O2−• and H2O2 photoproduction seems to be vague, although we cannot exclude the possibility that some free PQ in PSII membranes could be involved O2−• photoproduction. It was suggested [47] that O2•− can be formed via the reduction of O2 by plastosemiquinones formed through the one-electron reduction of plastoquinone at the QB site and one-electron oxidation of plastoquinol by Cyt b559. Thus, it is possible that the involvement of PQ in O2−• photoproduction induced by damage to the WOC occurs via its interaction with Cyt b559.
The redox potential of Pheo (its midpoint redox potential (Em) of the redox couple Pheo/Pheo at pH 7 is −610 mV [4,48]) favors the reduction of O2 to O2−•, since Em (O2/O2−•) is about −160 mV. According to Allakhverdiev and co-workers [49], the Em (Pheo/Pheo) in PSII core complexes from Synechocystis sp PCC 6803 was −525 mV for untreated and about −609 mV for Mn-depleted samples. Thus, the removal of manganese from the WOC shifts the Em (Pheo/Pheo) towards negative values. It seems that this shift in the redox potential of Pheo would not lead to a significant increase of O2−• and H2O2 photoproduction when the electron transport from the WOC to the RC was inhibited. In addition, the rate of H2O2 photoproduction in the Mn-depleted PSII preparations at low light intensity was five times higher than that in the samples containing “native” WOC, i.e., when the accumulation of the long-lived state of Pheo is less favorable. By contrast, the production of H2O2 in the Mn-depleted PSII preparations decreased with increasing light intensity or duration of illumination. It seems that the electron transfer directly from Pheo to O2 is not productive, although its reduction potential favors this reaction. Perhaps this is due to the recombination between P680+ and Pheo (which is less 5 ns) proceeding much faster than the electron transfer from Pheo to O2 or the difficulty of the formation of O2−• within RC. If the enhancement of O2−•/H2O2 photoproduction in Mn-depleted PSII preparations is mainly associated with Pheo, then the restoration of electron flow in the samples by exogenous electron donors (DPC and Mn2+) would lead to the increase in production of O2−• and H2O2. However, the restoration of electron flow in the samples diminishes the photoproduction of O2−• and H2O2 (Figure 6). Nevertheless, the stimulation of O2−•/H2O2 photoproduction can be linked to the shift in the Em of Pheo/Pheo if it is assumed that the light-induced formation of O2−• occurs in an aprotic environment, where Em for O2/O2−• varies from −480 mV to −710 mV [50].
The Em for QA/QA in intact PSII preparations isolated from spinach has values of −84 mV [51], about −162 mV [52] or −146 mV [49]. The discrepancy in the values is attributed to the removal of bicarbonate from PSII during the measurement procedure of Em (QA/QA) [53]. Thus, the redox potential of QA is not sufficient for the effective reduction of O2 to O2−• (although it is assumed that this reaction occurs because the ratio between O2 and O2−• is strongly shifted towards O2 [24]). In contrast to Pheo, the removal of the inorganic core of the WOC changes the Em (QA/QA) by 150 mV to positive values [49,54,55]. Such a change of Em (QA/QA) should lead to either to a slowdown or an interruption in the electronation of O2 by QA. However, the opposite tendency is observed: The destruction of the WOC accompanied by the shift of Em (QA/QA) to positive values stimulates the light-induced formation of O2−•. This result may infer that the QA site is not directly responsible for the enhancement of O2−•, and H2O2 photoproduction observed after the damage to the WOC. DCMU prevents electron transport between QA and QB by the competitive binding of the herbicide molecule in the QB site on the reaction centre. The blocking of the electron transport between QA and QB facilitates the light-induced accumulation of QA, as evidenced by the acceleration of Fv rise upon the addition of diuron [56]. Thus, the 90% suppression of the photoproduction of O2−• in the membranes and core complexes of PSII by diuron may also indicate that the main part of O2−• is not formed on the QA site. It is probably true that this effect of diuron can be associated with the effects on the another components of the PSII reaction centre. It was shown that DCMU influenced the functioning of the WOC, the light-induced accumulation of reduced pheophytin [57], and the redox potential of HP Cyt b559 [58].
The involvement of Cyt b559 in O2 reduction is presented in several works (see [15]), and all of them confirm that only LP Cyt b559 can be involved in the reduction of O2 to O2−•. The redox potential of LP Cyt b559 varies from −40 mV to +80 mV (see [6]), which is not enough for the reduction of O2. However, it is assumed that Em (O2/O2−•) can be close to 0 mV if the concentration of O2 greatly exceeds the level of produced O2−• [24]. Considering this fact, the LP Cyt b559 is capable of reducing O2 to O2−•. In addition to this, Cyt b559 can also exist in the VLP form, having more redox power for the reduction of O2 (the Em of the VLP form is from −150 to −200 mV [7,8]). The results presented here show that the increase in the fraction of LP Cyt b559 (including its VLP form) induced by damage to the WOC correlates with the rise of O2−• and H2O2 photoproduction. It seems that the increase of the O2−• photoproduction in PSII after the destruction of the WOC occurs due to the increase in the fraction of LP Cyt b559 and/or its VLP form. The suppression of O2−• and H2O2 photoproduction in the Mn-depleted PSII preparations observed upon the addition of the exogenous electron donors (Figure 6) can be ascribed to the conversion of LP Cyt b559 to higher-potential forms. The conversion of LP Cyt b559 to IP and HP forms during the illumination of Mn-depleted PSII preparations in the presence of exogenous electron donors to PS II was shown previously by Mizusawa and co-workers [9].
Thus, the destruction of the WOC leading to the suppression of electron transport within the reaction centre of PSII promotes O2−• and H2O2 photoproduction on the acceptor side of PSII through shifts in the redox potential of electron carriers of PSII. It seems that the conversion of HP and IP Cyt b559 to the LP form caused by the damage to the WOC makes a significant contribution to the enhancement of photoproduction of O2−• and H2O2 in PSII. However, it is not improbable that a shift in the Em (Pheo/Pheo) towards negative values may play a facilitating role in O2−• photoproduction in terms of its formation in the aprotic environment. Perhaps the light-induced overproduction of O2−•/H2O2 associated with damage to the WOC may be a signal for the activation of processes necessary for the repair of damaged PSII, since the photoformation of O2−• in native (undamaged) PSII is negligible.

4. Materials and Methods

4.1. Isolation of PS II Membranes and PSII Core Complexes

Oxygen-evolving PSII membrane preparations were isolated from spinach leaves according to the procedure in [59]. The samples were suspended in a medium containing 20 mM MES–NaOH (pH 6.5), 35 mM NaCl, 0.33 M sucrose, and 10% glycerol and stored at −76 °C. The isolation of PSII core complexes was performed according to the method in [60] with some modification: Bis-Tris buffer was replaced by MES. The concentration of chlorophyll (Chl) was measured as described previously [61]. The manganese content in PSII preparations was determined with an atomic absorption spectrophotometer equipped with a Kvant2A flame atomizer (Cortec, Russia).

4.2. Preparation of PSII Membranes with a Different Degree of Disassembly of the WOC and Mn-Depleted PSII Core Complexes

To obtain PSII membrane preparations with different degrees of disassembly of the WOC, the samples were treated by 1 M NaCl [62], 1 M CaCl2 [63], or 5 mM NH2OH [64]. According to the literature, the first treatment results in the depletion of two extrinsic proteins (PsbP and PsbQ) of the WOC (NaCl-treated PSII), while the incubation of the PSII preparations in the presence of 1 M CaCl2 releases all the external proteins (PsbP, PsbQ, and PsbO) from the WOC (CaCl2-treated PSII). Both these treatments do not extract manganese ions from the WOC, which suggests that the Mn cluster is relatively unaffected. The NH2OH treatment removes PsbP, PsbQ, and PsbO proteins and Mn ions from the WOC, but some amount of PsbO protein remains (Mn-depleted PSII).
Mn-depleted PSII core complexes were obtained by two approaches: (1) PSII core complexes were incubated in the presence of 5 mM NH2OH for 60 min, and then the samples were transferred to a Q-Sepharose column equilibrated with medium containing 20 mM MES-NaOH (pH 6.5), 35 mM NaCl, and 0.4 M sucrose with 0.03% (w/v) n-dodecyl-β-D-maltoside (medium A). After loading the samples, the column was washed with medium A with 1 mM ethylenediaminetetraacetic acid (EDTA) and then with medium A free from EDTA. The Mn-depleted PSII core complexes were eluted from the column by 100 mM MgSO4 being added into medium A; (2) Mn-depleted PSII core complexes were obtained from Mn-depleted PSII membranes in accordance with the procedure of isolation of PSII core complexes [60].
Atomic absorption spectroscopy measurements of the manganese content in PSII membranes showed that untreated and NaCl-treated PSII preparations had 4.2 ± 0.2 atoms of manganese per PSII reaction centre, while its content was 3.8 ± 0.1 and less than 0.1 Mn per RC in the CaCl2-treated and the Mn-depleted PSII membranes, respectively. The content of Mn ions in PSII core complexes was 3.9 ± 0.2 for untreated and close to 0 for the NH2OH-treated samples.

4.3. Measurements of Functional Activity of PSII Preparations

The functional activity of PSII preparations was estimated by photoinduced changes of chlorophyll fluorescence yield (ΔF) related to the photoreduction of the primary electron donor, QA, and oxygen evolution measurements. The kinetics of photoinduced ΔF were measured in a 10 mm cuvette at room temperature by using an XE-PAM fluorometer (Walz, Germany). The photosynthetic oxygen evolution was measured in a temperature-controlled chamber by a Clark-type oxygen electrode (Hansatech Instruments, UK) at continuous illumination (λ > 600 nm, 1500 µmol photons s−1 m−2). The measurements were carried out at 25 °C in the presence of artificial electron acceptors for PSII 0.1 mM 2,6-dichloro-p-benzoquinone (DCBQ) and 1 mM K3[Fe(CN)6].

4.4. Determination of H2O2 Photoproduction by PSII Preparations

The photoproduction of H2O2 in PSII membranes or core complexes was studied using the fluorescent probe homovanilic acid (HVA). The method is based on the H2O2-dependent oxidation of HVA mediated by horseradish peroxidase (HRP) to a highly fluorescent dimer [65]. The PSII preparations, resuspended in medium containing 20 mM MES–NaOH (pH 6.5), 35 mM NaCl, and 0.4 M sucrose at 50 μg of Chl/mL, were illuminated or kept under darkness at 25 °C. Then, an aliquot (500 μl) of the samples was added into the same volume of the reaction medium containing 100 mM Hepes (pH 7.6), 600 μM HVA, and 2 Un/mL HRP. After 30 min incubation at 37 °C, the PSII membranes were centrifuged at 12,000 g for 2 min. The supernatant was collected, and its fluorescence spectrum (350−500 nm, λex = 312 nm) was recorded with a Cary Eclipse fluorescence spectrophotometer (Agilent, USA). To remove the PSII core complexes from the solution, they were loaded on an Amicon Ultra centrifugal filter (Ultracel 30K, Merck Millipore, Germany) and centrifuged at 5000 g for 15 min. The fraction passing through the filter (free from PSII core complexes) was collected, and the fluorescence spectrum was recorded. The difference between the fluorescence spectra of illuminated and unilluminated samples, designated as the “light minus dark” fluorescence spectrum, represented the light-induced formation of H2O2. The number of H2O2 formed under the illumination of the PSII preparations was calculated from the fluorescence intensity of HVA upon the addition of 5 µM H2O2. The effect of the exogenous electron donor, Mn2+, on the photoproduction of H2O2 in Mn-depleted PSII was examined by the method based on the oxidative coupling of 3-methyl-2-benzothiazolinone hydrazone (MBTH) and 3-(dimethylamino) benzoic acid (DMAB) in the presence of H2O2 peroxidase catalyzes, with the couple reaction between MBTH and DMAB with the formation of a deep purple compound having an absorption band between 575 and 600 nm with a peak at 590 nm [27,66]. The use of this method for detecting hydrogen peroxide was because Mn2+ did not interfere with the determination of H2O2 when using this system, while the presence of Mn2+ affected the detection of H2O2 by HVA. The measurements were performed as follows: 5 mM DMAB and 0.1 mM MBTH were added to the samples illuminated in the absence or the presence of 50µM MnCl2, then the change at 590 nm was recorded before and after the injection of HRP (3 Un/mL).

4.5. Determination of O2−• Photoproduction by PSII Preparations

The light-induced generation of O2−• in PSII was detected by cytochrome c (Cyt c) [67,68]. PSII membranes or core complexes were resuspended at 10 µg Chl/mL in a buffer solution containing 50 mM MES-NaOH(pH 6.5), 35 mM NaCl, 0.4 M sucrose, and 10 μM Cyt c. Kinetics of absorbance changes at 550 nm related to the reduction of Cyt c upon illumination of PSII preparations with red light (λ > 600 nm, 1500 µmol (photon) s−1 m−2) were measured in a 10 mm cuvette at room temperature using a spectrophotometer Agilent 8453 (USA). The rate of photoreduction of Cyt c was estimated by monitoring the concentration of reduced Cyt c. The amount of reduced Cyt c was calculated using the differential extinction coefficient between ferrocytochrome c and ferricytochrome c at 550 nm (21.1 mM−1).

4.6. Analysis of Redox Forms of Cyt b559 in PSII Preparations

Redox states of Cyt b559 in PSII preparations were determined by measuring the differential (reduced-minus-oxidized) absorption spectrum of Cyt b559 on a Shimadzu UV-1800 (Japan) spectrophotometer. To oxidize Cyt b559, 50 µM potassium ferricyanide was added. The reduction of the HP, IP, and LP (LP+VLP) forms of Cyt b559 was achieved by the stepwise addition of 5 mM hydroquinone, 5 mM sodium ascorbate, and sodium dithionite, respectively. After each addition of the redox agent, a differential absorption spectrum was recorded. The content of HP Cyt b559 was attributable to the spectra of Cyt b559 obtained upon the addition of hydroquinone to the samples with ferricyanide. The fraction of IP Cyt b559 was determined as the difference between the spectra of Cyt b559 reduced by ascorbate and the spectra of Cyt b559 reduced by hydroquinone, for the LP form of Cyt b559, and from the spectra of dithionite-reduced Cyt b559 were subtracted the ascorbate-reduced spectra of Cyt b559.

Supplementary Materials

The following are available online at https://www.mdpi.com/2223-7747/8/9/329/s1, Figure S1: Time course of homovanilic acid oxidation at 37 °C induced by 10 µM H2O2 (◯), 100 µM tert-Butyl hydroperoxide, and 100 µM m-Chloroperbenzoic acid (☐).

Funding

The work was supported by the Russian Science Foundation (grant 14-14-00535); the results presented in Figure 3, Figure 5 and Figure 6 were obtained with support from the Ministry of Education and Science of the Russian Federation (theme AAAA-A17-117030110136-8).

Acknowledgments

I thank D. Yanykin for discussion of this work.

Conflicts of Interest

The authors declare no conflict of interest.

References

  1. Loll, B.; Kern, J.; Saenger, W.; Zouni, A.; Biesiadka, J. Lipids in photosystem II: Interactions with protein and cofactors. Biochim. Biophys. Acta 2007, 1767, 509–519. [Google Scholar] [CrossRef] [Green Version]
  2. Guskov, A.; Kern, J.; Gabdulkhakov, A.; Broser, M.; Zouni, A.; Saenger, W. Cyanobacterial photosytems II at 2.9-Å resolution and the role of quinones, lipids, channels and chloride. Nat. Struct. Mol. Biol. 2009, 16, 334–342. [Google Scholar] [CrossRef]
  3. Umena, Y.; Kawakami, K.; Shen, J.-R.; Kamiya, N. Crystal structure of oxygen-evolving photosystem II at a resolution of 1.9 Å. Nature 2011, 473, 55–61. [Google Scholar] [CrossRef]
  4. Klimov, V.V.; Allakhverdiev, S.I.; Demeter, S.; Krasnovsky, A.A. Photoreduction of pheophytin in chloroplast photosystem II as a function of the redox potential of the medium. Dokl. Akad. Nauk SSSR 1979, 249, 227–230. [Google Scholar]
  5. Ishikita, H.; Loll, B.; Biesiadka, J.; Saenger, W.; Knapp, E.-W. Redox potentials of chlorophylls in the photosystem II reaction center. Biochemistry 2005, 44, 4118–4124. [Google Scholar] [CrossRef]
  6. Müh, F.; Zouni, A. Cytochrome b559 in photosystem II. In Cytochrome Complexes: Evolution, Structures, Energy Transduction, and Signaling; Cramer, A., Kallas, T., Eds.; Springer: Dordrecht, The Netherlands, 2016; Volume 41, pp. 143–175. [Google Scholar]
  7. Shuvalov, V.A.; Schreiber, U.; Heber, U. Spectral and thermodynamic properties of the two hemes of the D1D2cytochrome b-559 complex of spinach. FEBS Lett. 1994, 337, 226–230. [Google Scholar] [CrossRef]
  8. Kaminskaya, O.; Kurreck, J.; Irrgang, K.D.; Renger, G.; Shuvalov, V.A. Redox and spectral properties of cytochrome b559 in different preparations of Photosystem II. Biochemistry 1999, 38, 16223–16235. [Google Scholar] [CrossRef]
  9. Mizusawa, N.; Miyao, M.; Yamashita, T. Restoration of the high-potential form of cytochrome b-559 by electron transport reactions through photosystem II in Tris-treated photosystem II membranes. Biochim. Biophys. Acta 1997, 1318, 145–158. [Google Scholar] [CrossRef]
  10. Mamedov, F.; Gadjieva, R.; Styring, S. Oxygen-induced changes in the redox state of the cytochrome b559 in photosystem II depend on the integrity of the Mn cluster. Physiol. Plant. 2007, 131, 41–49. [Google Scholar] [CrossRef]
  11. Crofts, J.; Horton, P. Dissipation of excitation energy by Photosystem II particles at low pH. Biochim. Biophys. Acta 1991, 1058, 187–193. [Google Scholar] [CrossRef]
  12. Barber, J.; De Las Rivas, J. A functional model for the role of cytochrome b559 in the protection against donor and acceptor side photoinhibition. Proc. Natl. Acad. Sci. USA 1993, 90, 10942–10946. [Google Scholar] [CrossRef]
  13. Thompson, L.K.; Brudvig, G.W. Cytochrome b-559 may function to protect Photosystem II from photoinhibition. Biochemistry 1988, 27, 6653–6658. [Google Scholar] [CrossRef]
  14. Faller, P.; Fufezan, C.; Rutherford, A.W. Side path electron donors: Cytochrome b559, chlorophyll Z and β-carotene. In Photosystem II: The Light-Driven Water: Plastoquinone Oxidoreductase; Wydrzynski, T., Satoh, K., Eds.; Springer: Dordrecht, The Netherlands, 2005; pp. 347–365. [Google Scholar]
  15. Pospíšil, P. Enzymatic function of cytochrome b559 in photosystem II. J. Photochem. Photobiolb. 2011, 104, 341–347. [Google Scholar] [CrossRef]
  16. Klimov, V.V.; Ananyev, G.M.; Zastryzhnaya, O.M.; Wydrzynski, T.; Renger, G. Photoproduction of hydrogen peroxide in Photosystem II membrane fragments: A comparison of four signals. Photosynth. Res. 1993, 38, 409–416. [Google Scholar] [CrossRef]
  17. Zastrizhnaya, O.M.; Khorobrykh, A.A.; Khristin, M.S.; Klimov, V.V. Photoinduced production of hydrogen peroxide at the acceptor side of photosystem II. Biochemistry 1997, 62, 357–362. [Google Scholar]
  18. Ananyev, G.M.; Renger, G.; Wacker, U.; Klimov, V.V. The photoproduction of superoxide radicals and the superoxide dismutase activity of Photosystem II. The possible involvement of cytochrome b559. Photosynth. Res. 1994, 41, 327–338. [Google Scholar] [CrossRef]
  19. Ananyev, G.; Wydrzynski, T.; Renger, G.; Klimov, V. Transient peroxide formation by the manganese-containing redox-active donor side of photosystem II upon inhibition of O2 evolution with lauroylcholine chloride. Biochim. Biophys. Acta 1992, 1100, 303–311. [Google Scholar] [CrossRef]
  20. Khorobrykh, S.A.; Ivanov, B.N. Oxygen reduction in a plastoquinone pool of isolated pea thylakoids. Photosynth. Res. 2002, 71, 209–219. [Google Scholar] [CrossRef]
  21. Khorobrykh, S.A.; Mubarakshina, M.; Ivanov, B.N. Photosystem I is not solely responsible for oxygen reduction in isolated thylakoids. Biochim. Biophys. Acta 2004, 1657, 164–167. [Google Scholar] [CrossRef] [Green Version]
  22. Kruk, J.; Strzałka, K. Dark reoxidation of the plastoquinone-pool is mediated by the low potential form of cytochrome b559 in spinach thylakoids. Photosynth. Res. 1999, 62, 273–279. [Google Scholar] [CrossRef]
  23. Pospišil, P.; Šnyrychova, I.; Kruk, J.; Strzałka, K.; Nauš, J. Evidence that cytochrome b559 is involved in superoxide production in Photosystem II: Effect of synthetic short-chain plastoquinones in a cytochrome b559 tobacco mutant. Biochem. J. 2006, 397, 321–327. [Google Scholar]
  24. Pospísil, P. Production of reactive oxygen species by photosystem II. Biochim. Biophys. Acta 2009, 1787, 1151–1160. [Google Scholar] [CrossRef] [Green Version]
  25. Pospíšil, P. Molecular mechanisms of production and scavenging of reactive oxygen species by photosystem II. Biochim. Biophys. Acta 2012, 1817, 218–231. [Google Scholar] [CrossRef] [Green Version]
  26. Schröder, W.P.; Åkerlund, H.E. Hydrogen Peroxide Production in Photosystem II Preparations. In Current Research in Photosynthesis; Baltscheffsky, M., Ed.; Kluwer Academic Publishers: Dordrecht, The Netherlands, 1990; Volume I, pp. 901–904. [Google Scholar]
  27. Hillier, W.; Wydrzynski, T. Increases in peroxide formation by the Photosystem II oxygen evolving reactions upon removal of the extrinsic 16, 22 and 33 kDa proteins are reversed by CaCl2 addition. Photosynth. Res. 1993, 38, 417–423. [Google Scholar] [CrossRef]
  28. Klimov, V.V.; Allakhverdiev, S.I.; Shuvalov, V.A.; Krasnovsky, A.A. Effect of extraction and re-addition of manganese on light reactions of photosystem II preparations. FEBS Lett. 1982, 148, 307–312. [Google Scholar] [CrossRef]
  29. Khorobrykh, S.A.; Khorobrykh, A.A.; Klimov, V.V.; Ivanov, B.N. Photoconsumption of oxygen in photosystem II preparations under impairment of the water-oxidizing complex. Biochemistry 2002, 67, 683–688. [Google Scholar]
  30. Yanykin, D.V.; Khorobrykh, A.A.; Khorobrykh, S.A.; Klimov, V.V. Photoconsumption of molecular oxygen on both donor and acceptor sides of photosystem II in Mn-depleted subchloroplast membrane fragments. Biochim. Biophys. Acta 2010, 1797, 516–523. [Google Scholar] [CrossRef] [Green Version]
  31. Khorobrykh, S.A.; Khorobrykh, A.A.; Yanykin, D.V.; Ivanov, B.N.; Klimov, V.V.; Mano, J. Photoproduction of catalase-insensitive peroxides on the donor side of manganese-depleted photosystem II: Evidence with a specific fluorescent probe. Biochemistry 2011, 50, 10658–10665. [Google Scholar] [CrossRef]
  32. Ghanotakis, D.F.; Babcock, G.T.; Yocum, C.F. Calcium reconstitutes high rates of oxygen evolution in polypeptide depleted Photosystem II preparations. FEBS Lett. 1984, 167, 127–130. [Google Scholar] [CrossRef] [Green Version]
  33. Sugiura, M.; Minagawa, J.; Inoue, Y. Properties of chlamydomonas photosystem II core complex with a His-tag at the C-Terminus of the D2 protein. Plant. Cell Physiol. 1999, 40, 311–318. [Google Scholar] [CrossRef]
  34. Ono, T.; Inoue, Y. Ca2+ dependent restoration of evolving activity in CaCl2 washed PSII particles depleted of 33, 24 and 16 kDa proteins. FEBS Lett. 1984, 168, 281–286. [Google Scholar] [CrossRef]
  35. Khorobrykh, A.A.; Yanykin, D.V.; Klimov, V.V. Photooxidation and photoreduction of exogenous cytochrome c by photosystem II preparations after various modifications of the water-oxidizing complex. Photosynthetica 2018, 56, 244–253. [Google Scholar] [CrossRef]
  36. Boussac, A.; Picaud, M.; Etienne, A.-L. Effect of potassium iridic chloride on the electron donation by Mn to photosystem II particles. Photobiochem. Photobiophys. 1986, 10, 201–211. [Google Scholar]
  37. Inoue, H.; Akahori, H.; Noguchi, M. Activation of Electron Donation from Hydrogen Peroxide by Manganese in Non-oxygen evolving Photosystem II Particles. Plant. Cell Physiol. 1987, 28, 1339–1343. [Google Scholar] [CrossRef]
  38. Klimov, V.V.; Shafiev, M.A.; Allakhverdiev, S.I. Photoinactivation of the reactivation capacity of photosystem II in pea subchloroplast particles after a complete removal of manganese. Photosynth. Res. 1990, 23, 59–65. [Google Scholar] [CrossRef]
  39. Telfer, A.; De Las Rivas, J.; Barber, J. β-Carotene within the isolated photosystem II reaction centre: Photooxidation and irreversible bleaching of this chromophore by oxidised P680. Biochim. Biophys. Acta 1991, 1060, 106–114. [Google Scholar] [CrossRef]
  40. Telfer, A.; Frolov, D.; Barber, J.; Robert, B.; Pascal, A. Oxidation of the two β-carotene molecules in the photosystem II reaction center. Biochemistry 2003, 42, 1008–1015. [Google Scholar] [CrossRef]
  41. Hanley, J.; Deligiannakis, Y.; Pascal, A.; Faller, P.; Rutherford, A.W. Carotenoid oxidation in photosystem II. Biochemistry 1999, 38, 8189–8195. [Google Scholar] [CrossRef]
  42. Tracewell, C.A.; Vrettos, J.S.; Bautista, J.A.; Frank, H.A.; Brudvig, G.W. Carotenoid photooxidation in photosystem II. Arch. Biochem. Biophys. 2001, 385, 61–69. [Google Scholar] [CrossRef]
  43. Mizusawa, N.; Wada, H. The role of lipids in photosystem II. Biochim. Biophys. Acta 2012, 1817, 194–208. [Google Scholar] [CrossRef] [Green Version]
  44. Yanykin, D.V.; Khorobrykh, A.A.; Terentyev, V.V.; Klimov, V.V. Two pathways of photoproduction of organic hydroperoxides on the donor side of photosystem 2 in subchloroplast membrane fragments. Photosynth. Res. 2017, 133, 129–138. [Google Scholar] [CrossRef]
  45. Kurreck, J.; Schödel, R.; Renger, G. Investigation of the plastoquinone pool size and fluorescence quenching in thylakoid membranes and Photosystem II (PS II) membrane fragments. Photosynth Res. 2000, 63, 171–182. [Google Scholar] [CrossRef]
  46. Yadav, D.K.; Prasad, A.; Kruk, J.; Pospíšil, P. Evidence for the involvement of loosely bound plastosemiquinones in superoxide anion radical production in photosystem II. PLoS ONE 2014, 9, e0130244. [Google Scholar] [CrossRef]
  47. Tomo, T.; Okubo, T.; Akimoto, S.; Yokono, M.; Miyashita, H.; Tsuchiya, T.; Noguchi, T.; Mimuro, M. Identification of the special pair of photosystem II in a chlorophyll d-dominated cyanobacterium. Proc. Natl. Acad. Sci. USA 2007, 104, 7283–7288. [Google Scholar] [CrossRef]
  48. Rappaport, F.; Guergova-Kuras, M.; Nixon, P.J.; Diner, B.A.; Lavergne, J. Kinetics and pathways of charge recombination in photosystem II. Biochemistry 2002, 41, 8518–8527. [Google Scholar] [CrossRef]
  49. Allakhverdiev, S.I.; Tsuchiya, T.; Watabe, K.; Kojima, A.; Los, D.A.; Tomo, T.; Klimov, V.V.; Mimuro, M. Redox potentials of primary electron acceptor quinone molecule (Qa) and conserved energetics of photosystem II in cyanobacteria with chlorophyll a and chlorophyll d. Proc. Natl. Acad. Sci. USA 2011, 108, 8054–8058. [Google Scholar] [CrossRef]
  50. Afanas’ev, I.B. Superoxide Ion: Chemistry and Biological Implications; CRC Press: Boca Raton, FL, USA, 1989; Volume 1, pp. 1–279. [Google Scholar]
  51. Krieger, A.; Rutherford, A.W.; Johnson, G.N. On the determination of redox midpoint potential of the primary quinone electron acceptor, QA, in photosystem II. Biochim. Biophys. Acta 1995, 1229, 193–201. [Google Scholar] [CrossRef]
  52. Shibamoto, T.; Kato, Y.; Nagao, R.; Yamazaki, T.; Tomo, T.; Watanabe, T. Species-dependence of the redox potential of the primary quinone electron acceptor QA in photosystem II verified by spectroelectrochemistry. FEBS Lett. 2010, 584, 1526–1530. [Google Scholar] [CrossRef]
  53. Brinkert, K.; De Causmaecker, S.; Krieger-Liszkay, A.; Fantuzzi, A.; Rutherford, A.W. Bicarbonate-induced redox tuning in Photosystem II for regulation and protection. Proc. Natl. Acad. Sci. USA 2016, 113, 12144–12149. [Google Scholar] [CrossRef] [Green Version]
  54. Krieger, A.; Weis, E. Energy-dependent quenching of chlorophyll-a- fluorescence: The involvement of proton-calcium exchange at photosystem II. Photosynthetica 1992, 27, 89–98. [Google Scholar]
  55. Johnson, G.N.; Rutherford, A.W.; Krieger, A. A change in the midpoint potential of the quinone QA in Photosystem II associated with photoactivation of oxygen evolution. Biochim. Biophys. Acta 1995, 1229, 201–207. [Google Scholar] [CrossRef]
  56. Hsu, B.D.; Lee, J.Y.; Pan, R.L. The two binding sites for DCMU in photosystem II. Biochem. Biophys. Res. Commun. 1986, 141, 682–688. [Google Scholar] [CrossRef]
  57. Klimov, V.V.; Shuvalov, V.A.; Heber, U. Photoreduction of pheophytin as a result of electron donation from the water-splitting system to Photosystem-II reaction centers. Biochim. Biophys. Acta 1985, 809, 345–350. [Google Scholar] [CrossRef]
  58. Kaminskaya, O.; Shuvalov, V.A.; Renger, G. Evidence for a novel quinone-binding site in the Photosystem II (PS II) complex that regulates the redox potential of cytochrome b559. Biochemistry 2007, 46, 1091–1105. [Google Scholar] [CrossRef]
  59. Ford, R.C.; Evans, M.C.W. Isolation of a photosystem 2 preparation from higher plants with highly enriched oxygen evolution activity. FEBS Lett. 1983, 160, 159–164. [Google Scholar] [CrossRef] [Green Version]
  60. Van Leeuwen, P.J.; Nieveen, M.C.; van de Meent, E.J.; Dekker, J.P.; van Gorkom, H.J. Rapid and simple isolation of pure photosystem II core and reaction center particles from spinach. Photosynth. Res. 1991, 28, 149–153. [Google Scholar] [CrossRef]
  61. Lichtenthaler, H.K. Chlorophylls and carotenoids: Pigments of photosynthetic biomembranes. Methods Enzymol. 1987, 148, 350–382. [Google Scholar]
  62. Miyao, M.; Murata, N. Partial disintegration and reconstitution of the photosynthetic oxygen evolution system. Binding of 24 kilodalton and 18 kilodalton polypeptides. Biochim. Biophys. Acta 1983, 725, 87–93. [Google Scholar] [CrossRef]
  63. Ono, T.; Inoue, Y. Mn-preserving extraction of 33-, 24- and 16 kDa proteins from O2-evolving PS II particles by divalent salt-washing. FEBS Lett. 1983, 164, 255–260. [Google Scholar] [CrossRef]
  64. Tamura, N.; Cheniae, G.M. Photoactivation of the water-oxidizing complex in Photosystem II membranes depleted of Mn and extrinsic proteins. I. Biochemical and kinetic characterization. Biochim. Biophys. Acta 1987, 890, 179–194. [Google Scholar] [CrossRef]
  65. Ruch, W.; Cooper, P.H.; Baggiolini, M. Assay of H2O2 production by macrophages and neutrophils with homovanillic acid and horse-radish peroxidase. J. Immunol. Methods 1983, 63, 347–357. [Google Scholar] [CrossRef]
  66. Ngo, T.T.; Lenhoff, H.M. A sensitive and versatile chromogenic assay for peroxidase and peroxidase-coupled reactions. Anal. Biochem. 1980, 105, 389–397. [Google Scholar] [CrossRef]
  67. Fridovich, I. Quantitative aspects of the production of superoxide anion radical by milk xanthine oxidase. J. Biol. Chem. 1970, 245, 4053–4057. [Google Scholar]
  68. Chen, G.X.; Kazimir, J.; Cheniae, G.M. Photoinhibition of hydroxylamine extracted photosystem II membranes: Studies of the mechanism. Biochemistry 1992, 31, 11072–11083. [Google Scholar] [CrossRef]
Figure 1. (I) Kinetics of photoinduced changes of chlorophyll fluorescence yield (ΔF) related to the photoreduction of the primary electron acceptor, QA, in photosystem II (PSII) membranes fragments (A) and PSII core complexes (B) before (1) and after modification of the water-oxidizing complex caused by treatments with NaCl (2), CaCl2 (3), and NH2OH (4). The measurements of ΔF were done in a medium containing 50 mM MES–NaOH (pH 6.5), 35 mM NaCl and 0.4 M sucrose at a Chl concentration of 10 μg/mL. Δ, switching of the measuring light; ↑ and ↓, actinic light on and off, respectively. (II) Kinetics of oxygen evolution in PSII membranes (A) and PSII core complexes (B) before (1) and after modification of the water-oxidizing complex caused by treatments with NaCl (2), CaCl2 (3), and NH2OH (4). The measurements were made in the medium containing 50 mM MES–NaOH (pH 6.5), 35 mM NaCl, 0.4 M sucrose at a Chl concentration of 10 μg/mL for the PSII membranes and at 5 μg/mL for the PSII core complexes in the presence of 1 mM K3[Fe(CN)6] and 100 µM DCBQ. (1′)—oxygen evolution in the PSII core complexes was done in the presence of 5 mM CaCl2.↑ and ↓ – light (λ > 650 nm, 1500 μmol photon s−1 m−2) on and off, respectively.
Plants 08 00329 g001
Figure 2. H2O2 photoproduction in PSII membranes before (◯) and after NaCl (▽), CaCl2 (△), and NH2OH (☐) treatments. (A) Dependence of H2O2 photoproduction in the PSII membranes on the duration of illumination (λ > 600 Hm, 1500 μmol photon s−1 m−2). (B) Dependence of H2O2 photoproduction in the PSII membranes on light intensity (the samples were illuminated at various light intensities for 1 min). The illumination of the samples was done in a medium containing 20 mM MES–NaOH (pH 6.5), 35 mM NaCl, and 0.4 M sucrose at 25 °C. The concentration of chlorophyll during illumination was 50 μg/mL.
Plants 08 00329 g002
Figure 3. H2O2 photoproduction in untreated (◯) and Mn-depleted PSII core complexes (☐). (A) Dependence of H2O2 photoproduction in the PSII core complexes on the duration of illumination (λ > 600 Hm, 1500 μmol photon s−1 m−2). (B) Dependence of H2O2 photoproduction in the PSII core complexes on light intensity (the samples were illuminated at various light intensities for 1 min). The illumination of the samples was done in a medium containing 20 mM MES–NaOH (pH 6.5), 35 mM NaCl and 0.4 M sucrose at 25 °C. The concentration of chlorophyll during illumination was 50 μg/mL.
Plants 08 00329 g003
Figure 4. Kinetics of Cyt c photoreduction by PSII membranes before (A) and after modification of the water-oxidizing complex caused by treatments of NaCl (B), CaCl2 (C), and NH2OH (D). The measurements were done in the absence of additions (1) and after the addition of 50 Un/mL SOD (2). Reaction medium contained 50 mM MES–NaOH (pH 6.5), 35 mM NaCl, 0.4 M sucrose, and 10 μM Cyt c. The PSII membranes were illuminated (λ > 600 nm, 1500 µmol photon s−1 m−2) at chlorophyll concentration of 10 µg/mL. Up and down arrows indicate light on and off, respectively. (E) Kinetics of Cyt c reduction associated with the light-induced O2−• formation in the PSII membranes before (1) and after modification of the water-oxidizing complex caused by treatments of NaCl (2), CaCl2 (3) and NH2OH (4). The kinetics was obtained by the subtraction of the kinetics of Cyt c photoreduction measured in the presence of SOD from that measured in the absence of SOD.
Plants 08 00329 g004
Figure 5. (A) Kinetics of Cyt c photoreduction by PSII core complexes before (2, 3) and after NH2OH treatment (1, 4). The measurements were done in the absence of additions (1, 2) and after the addition of 50 Un/mL SOD (3, 4). (B) Kinetics of Cyt c reduction associated with the light-induced O2−• formation in the PSII core complexes before (2) and after Mn removal (1). The kinetics was obtained by the subtraction of kinetics of Cyt c photoreduction measured in the presence of superoxide dismutase (SOD) from that measured in the absence of SOD. Reaction medium contained 50 mM MES–NaOH (pH 6.5), 35 mM NaCl, 0.4 M sucrose and 10 μM Cyt c. The samples were illuminated (λ > 600 nm, 1500 µmol photon s−1 m−2) at chlorophyll concentration of 10 µg/mL. Up and down arrows indicate light on and off, respectively.
Plants 08 00329 g005
Figure 6. (I) Kinetics of Cyt c photoreduction related to the production of O2−• in Mn-depleted PSII membranes (A) and Mn-depleted PSII core complexes (B) in the absence (1) and the presence of 50 µM DPC (2). ↑ and ↓ light on and off, respectively. (II) Absorption changes at 590 nm measuring H2O2 production in the Mn-depleted PSII membranes (A) and the Mn-depleted PSII core complexes (B) after illumination for 90 s (λ > 600 nm, 1500 µmol photon s−1 m−2) in the absence (1) and in the presence of 50 µM MnCl2 (2). 1′ −50 µM MnCl2 was added after the illumination of the samples. Chlorophyll concentration of the PSII membranes and core complexes was 50 µg Chl/mL and 20 µg Chl/mL, respectively. The light-induced yield of H2O2 in the samples was measured with 5 mM DMAB, 0.1 mM MBTH, and 3 unit/m1 horseradish peroxidase (HRP) (see Material and Methods). Δ—injection of HRP into the suspension of the samples.
Plants 08 00329 g006
Table 1. The ratio of Cyt b559 redox forms in PSII preparations after various modifications of the water-oxidizing complex.
Redox Forms of Cyt b559PSII MembranesPSII Core Complexes
UntreatedNaCl-TreatedCaCl2-TreatedMn-DepletedUntreatedMn-Depleted
HP56.643.719.817.41211.8
IP8.621.734.730.645.221
LP34.834.645.55242.867.2
Table 2. The rate of H2O2 and O2−• photoproduction in PSII preparations after various modifications of the water-oxidizing complex. The rates were calculated for 30 s after the start of illumination (λ > 600 nm, 1500 µmol photon m−2 s−1) of the samples.
The Rate of Photoproduction, µmol (mg Chl h)−1PSII MembranesPSII Core Complexes
UntreatedNaCl-TreatedCaCl2-TreatedMn-DepletedUntreatedMn-Depleted
H2O21.7 ± 0.361.7 ± 0.32.2 ± 0.255.25 ± 0.34.1 ± 0.616.2 ± 1.2
O2−•2.7 ± 0.12.6 ± 0.25.3 ± 0.1511.3 ± 0.36.9 ± 0.2537.8 ± 0.5

