Distribution and Community Assembly of Trees Along an Andean Elevational Gradient

 ,
,
Abstract
1. Introduction
2. Results
2.1. Forest Composition
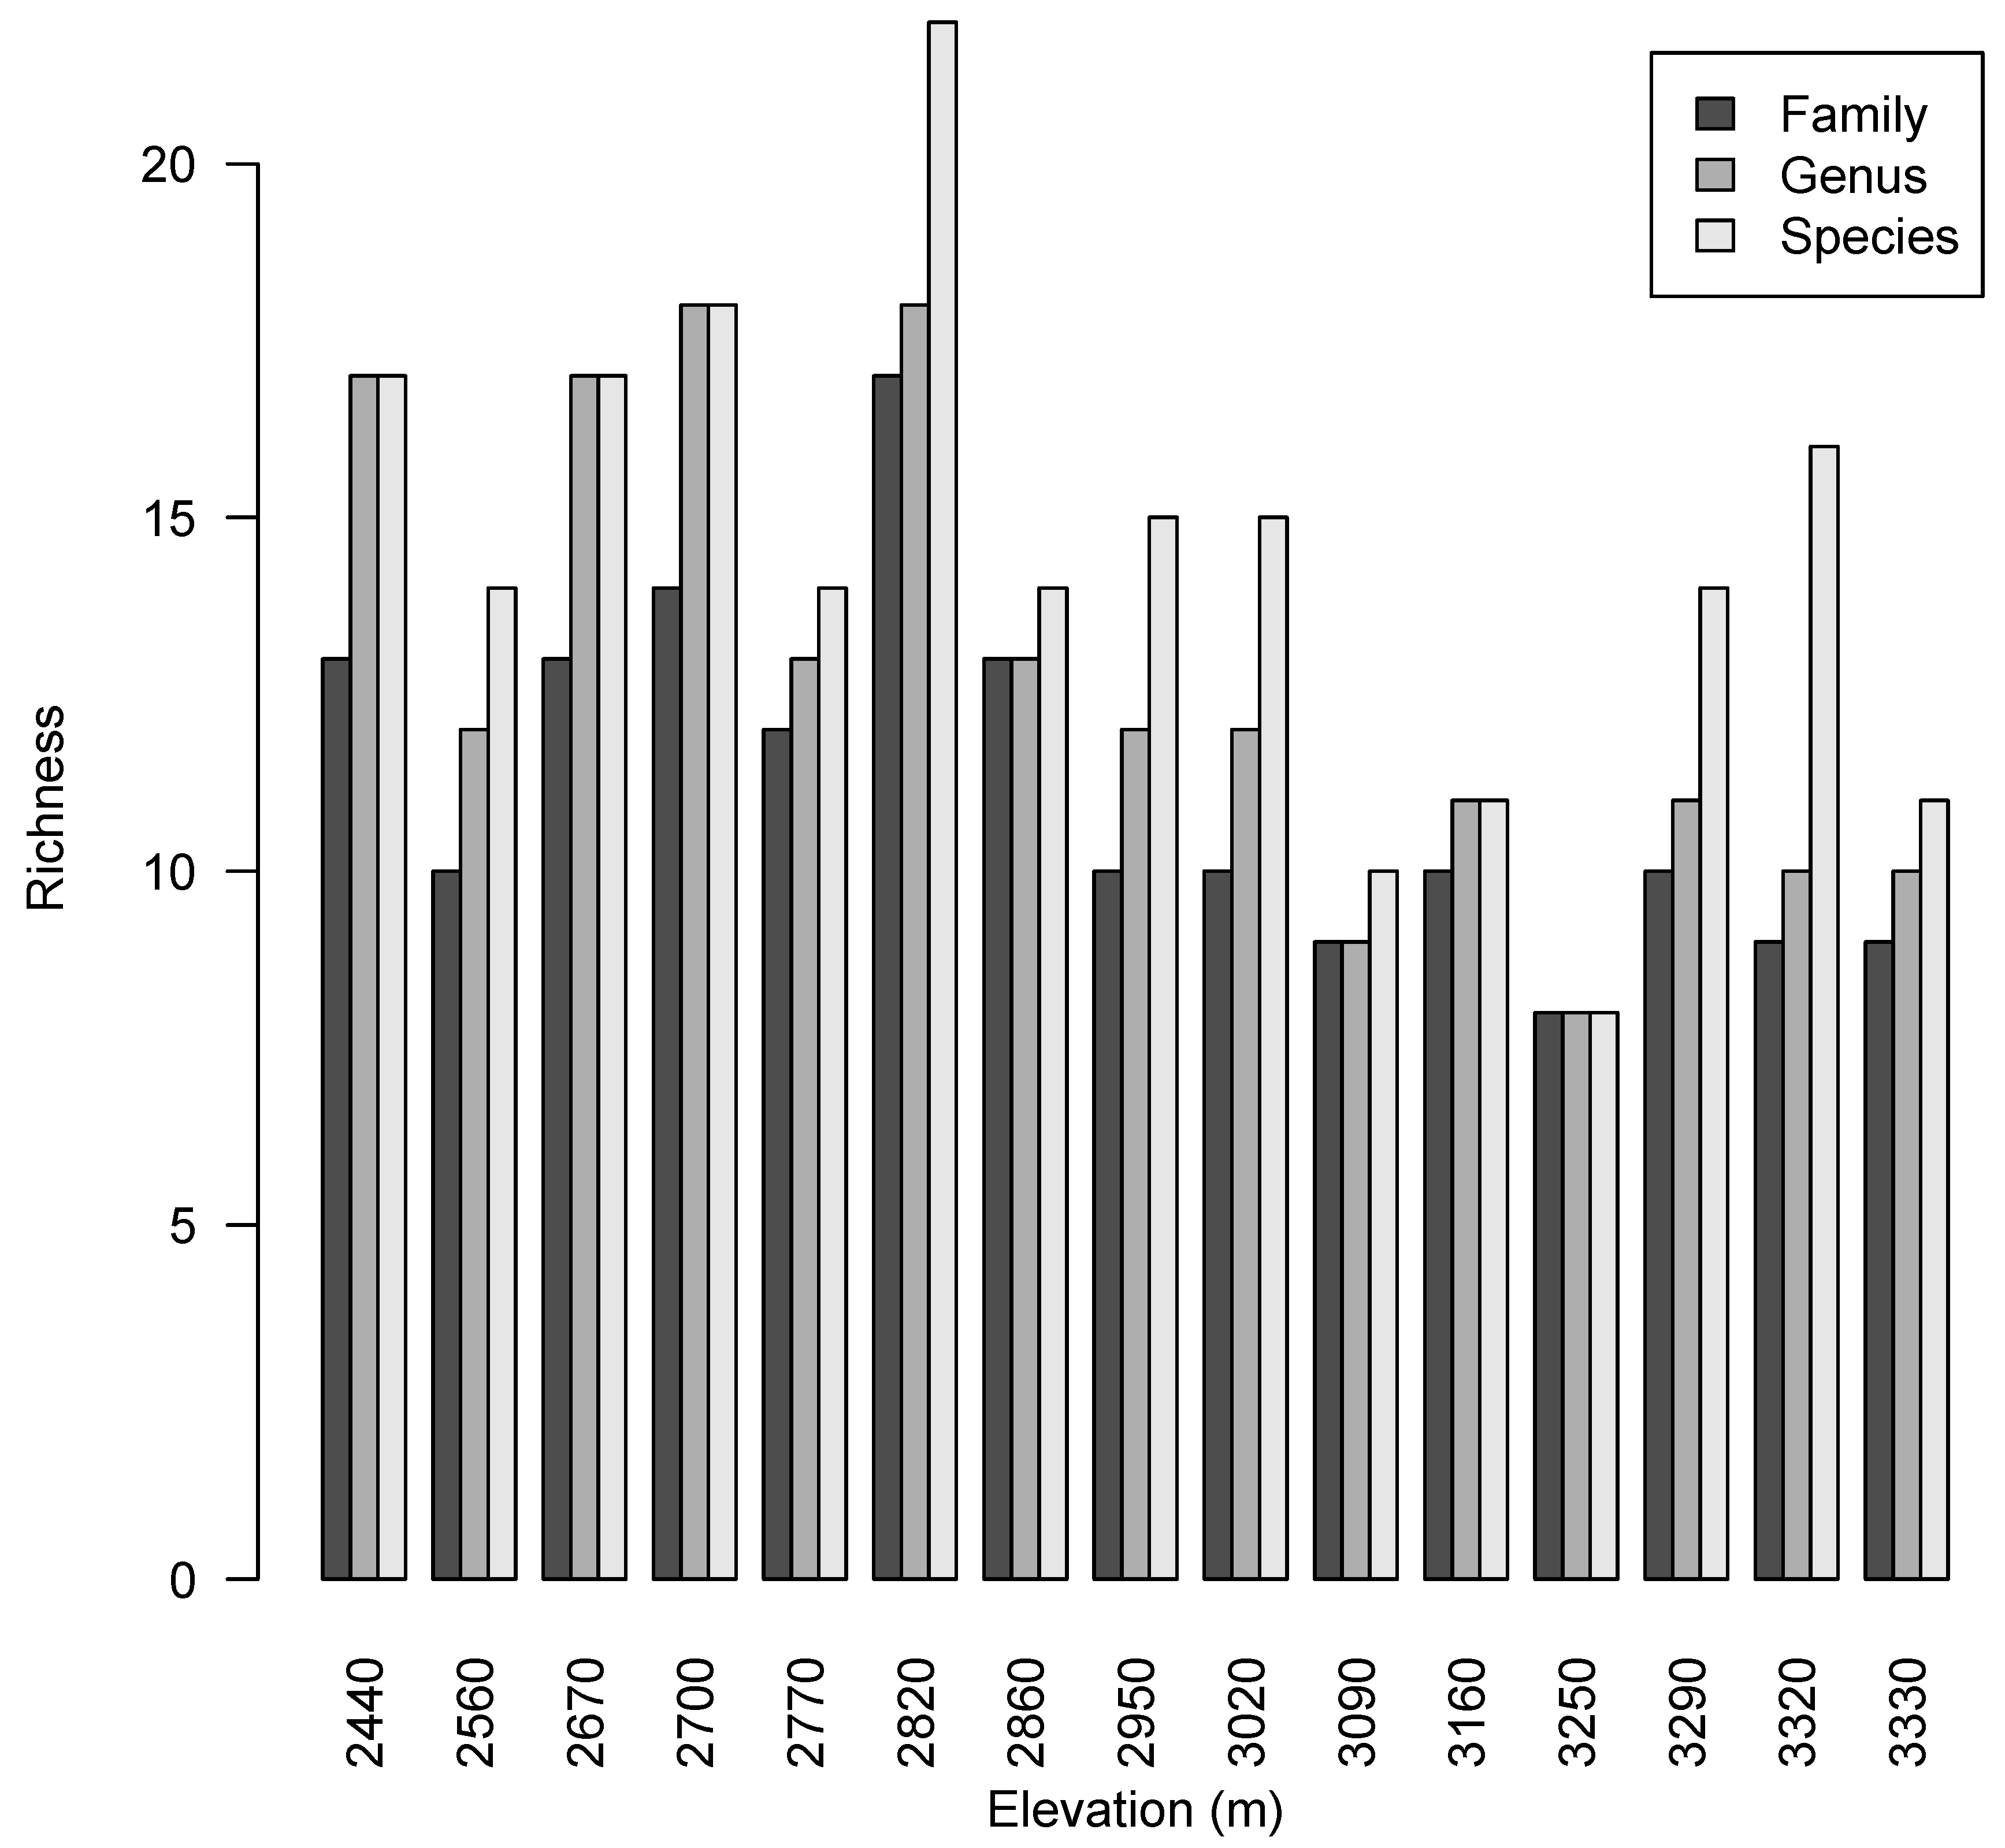
2.2. Taxonomic Diversity Analysis
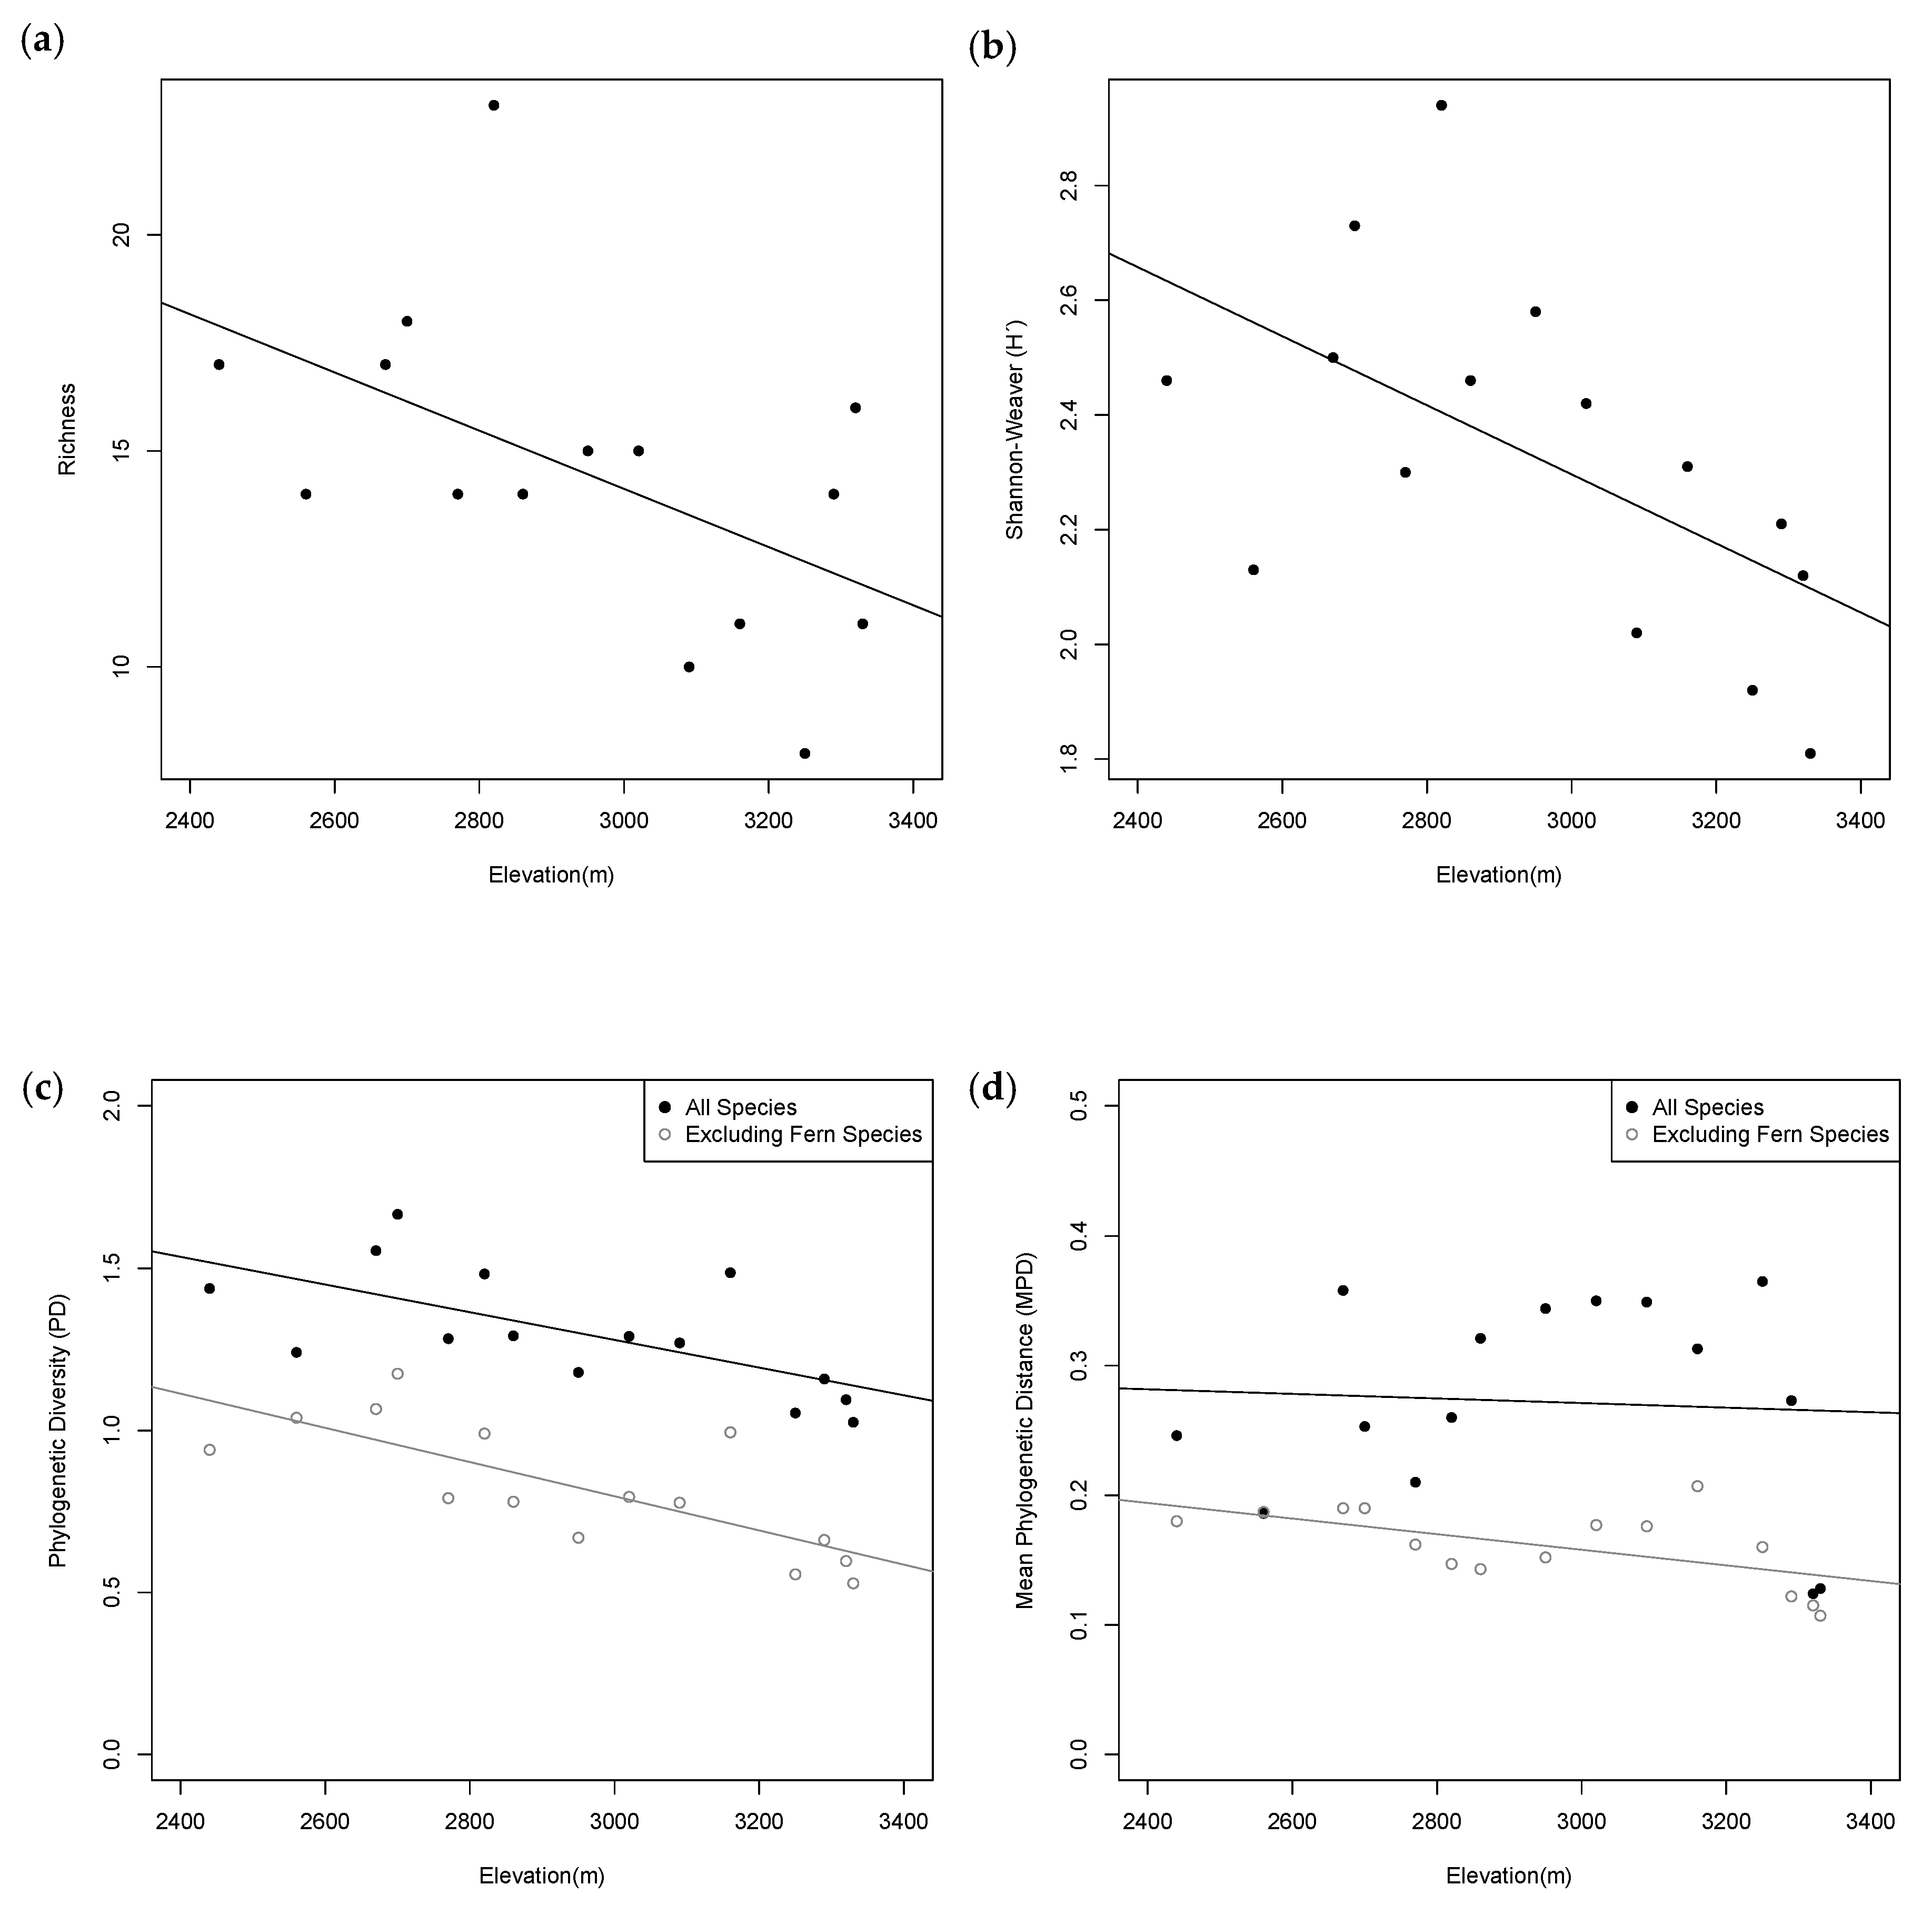
2.3. Phylogenetic Diversity Analysis
3. Discussion
3.1. Patterns of Taxonomic Distribution
3.2. Patterns of Phylogenetic Distribution
4. Materials and Methods
4.1. Study Site
4.2. Sampling Design
4.3. DNA Isolation, PCR Amplification, and Sequencing
4.4. Data Analysis
4.4.1. Community Composition
4.4.2. Phylogenetic Analysis
4.4.3. Phylogenetic Structure Analysis
5. Conclusions
Supplementary Materials
Author Contributions
Funding
Acknowledgments
Conflicts of Interest
References
- MacArthur, R.H. Geographical Ecology: Patterns in the Distribution of Species; Princeton University Press: Princeton, NJ, USA, 1984. [Google Scholar]
- Stevens, G.C. The elevational gradient in altitudinal range: An extension of Rapoport’s latitudinal rule to altitude. Am. Nat. 1992, 140, 893–911. [Google Scholar] [CrossRef] [PubMed]
- Brown, J.H. Macroecology; The University of Chicago Press: Chicago, IL, USA, 1995. [Google Scholar]
- Acharya, B.K.; Chettri, B.; Vijayan, L. Distribution of patterns of trees along an elevation gradient of Eastern Himalaya, India. Acta Oceanol. 2011, 37, 329–336. [Google Scholar] [CrossRef]
- Arellano, G.; Macía, M.J. Local and regional dominance of woody plants along an elevational gradient in a tropical montane forest of northwestern Bolivia. Plant Ecol. 2014, 215, 39–54. [Google Scholar] [CrossRef]
- Girardin, C.A.J.; Farfan-Rios, W.; Garcia, K.; Feeley, K.J.; Jørgensen, P.M.; Murakami, A.A.; Pérez, L.C.; Seidel, R.; Paniagua, N.; Claros, A.F.F.; et al. Spatial patterns of above ground structure, biomass and composition in a network of six Andean elevation transect. Plant Ecol. Divers. 2014, 7, 161–171. [Google Scholar] [CrossRef]
- Clark, D.B.; Hurtado, J.; Saatchi, S.S. Tropical rain forest structure, tree growth and dynamics along a 2700-m elevational transect in Costa Rica. PLoS ONE 2015, 10, e0122905. [Google Scholar] [CrossRef] [PubMed]
- Bruijnzeel, L.A. Hydrological functions of tropical forests: Not seeing the soil for the trees? Agric. Ecosyst. Environ. 2004, 104, 185–228. [Google Scholar] [CrossRef]
- Körner, C. The use of ‘altitude’ in ecological research. Trends Ecol. Evol. 2007, 22, 569–574. [Google Scholar] [CrossRef] [PubMed]
- Bryant, J.A.; Lamanna, C.; Horlon, H.; Kerkhoff, A.J.; Enquist, B.J.; Green, J.L. Microbes on mountainsides: Contrasting elevational patterns of bacterial and plant diversity. Proc. Natl. Acad. Sci. USA 2008, 105, 11505–11511. [Google Scholar] [CrossRef]
- Gentry, A.H. Patterns of diversity and floristic composition in Neotropical montane forests. In Biodiversity and Conservation of Neotropical Montane Forests; Churchill, S.P., Balsev, H., Forero, E., Luteyn, J.L., Eds.; The New York Botanical Garden: New York, NY, USA, 1995; pp. 103–126. [Google Scholar]
- Myers, N.; Mittermeier, R.A.; Mittermeier, C.G.; da Fonseca, G.A.B.; Kent, J. Biodiversity hotspots for conservation priorities. Nature 2000, 403, 853–858. [Google Scholar] [CrossRef]
- Chain-Guadarrama, A.; Finegan, B.; Vilchez, S.; Casanoves, F. Determinants of rain-forest floristic variation on an altitudinal gradient in southern Costa Rica. J. Trop. Ecol. 2012, 28, 463–481. [Google Scholar] [CrossRef]
- Asner, G.P.; Anderson, C.B.; Martin, R.E.; Knapp, D.E.; Tupayachi, R.; Sinca, F.; Malhi, Y. Landscape-scale changes in forest structure and functional traits along an Andes-to-Amazon elevation gradient. Biogeosciences 2014, 11, 843–956. [Google Scholar] [CrossRef]
- Wilson, S.J.; Rhemtulla, J.M. Small montane cloud forest fragments are important for conserving tree diversity in the Ecuadorian Andes. Biotropica 2018, 50, 586–597. [Google Scholar] [CrossRef]
- Bruijnzeel, L.A.; Veneklaas, E.J. Climatic conditions and tropical montane forest productivity: The fog has not lifted yet. Ecology 1998, 79, 3–9. [Google Scholar] [CrossRef]
- Dalling, J.W.; Heineman, K.; González, G.; Ostertag, R. Geographic, environmental and biotic sources of variation in the nutrient relations of tropical montane forests. J. Trop. Ecol. 2016, 32, 368–383. [Google Scholar] [CrossRef]
- Fahey, T.J.; Sherman, R.E.; Tanner, E.V.J. Tropical montane cloud forest: Environmental drivers of vegetation structure and ecosystem function. J. Trop. Ecol. 2016, 32, 355–367. [Google Scholar] [CrossRef]
- Lieberman, D.; Lieberman, M.; Peralta, R.; Hartshorn, G.S. Tropical forest structure and composition on a large-scale altitudinal gradient in Costa Rica. J. Ecol. 1996, 84, 137–152. [Google Scholar] [CrossRef]
- Shannon, C.E.; Weaver, W. The Mathematical Theory of Communication; University of Illinois Press: Urbana, IL, USA, 1949. [Google Scholar]
- Simpson, E.H. Measurement of diversity. Nature 1949, 163, 688. [Google Scholar] [CrossRef]
- Culmsee, H.; Leuschner, C. Consistent patterns of elevational change in tree taxonomic and phylogenetic diversity across Malesian mountain forests. J. Biogeogr. 2013, 40, 1997–2010. [Google Scholar] [CrossRef]
- Sproull, G.J.; Quigley, M.F.; Sher, A.; González, E. Long-term changes in composition, diversity and distribution patterns in four herbaceous plant communities along an elevational gradient. J. Veg. Sci. 2015, 26, 552–563. [Google Scholar] [CrossRef]
- Gómez-Hernández, M.; Williams-Linera, G.; Lodge, D.J.; Guevara, R.; Ruiz-Sanchez, E.; Gándara, E. Phylogenetic diversity of macromycetes and woody plants along an elevational gradient in Eastern Mexico. Biotropica 2016, 48, 577–585. [Google Scholar] [CrossRef]
- Pausas, J.G.; Austin, M.P. Patterns of plant species richness in relation to different environments: An appraisal. J. Veg. Sci. 2001, 12, 153–166. [Google Scholar] [CrossRef]
- Kessler, M.; Abrahamczyk, S.; Bos, M.; Buchori, D.; Putra, D.D.; Gradstein, S.R.; Höhn, P.; Kluge, J.; Orend, F.; Pitopang, R.; et al. Alpha and beta diversity of plants and animals along a tropical land-use gradient. Ecol. Appl. 2009, 19, 2142–2156. [Google Scholar] [CrossRef]
- Thinh, N.V.; Mitlöhner, R.; Bich, N.V. Comparison of floristic composition in four sites of a tropical lowland forest on the North-Central coast of Vietnam. J. Nat. Sci. 2015, 1, e144. [Google Scholar]
- Gentry, A.H. Changes in plant community diversity and floristic composition on environmental and geographical gradients. Ann. Mo. Bot. Gard. 1988, 75, 1–34. [Google Scholar] [CrossRef]
- Ashton, P.A. Floristic zonation of tree communities on wet tropical mountains revisited. Perspect. Plant Ecol. Evol. Syst. 2003, 6, 87–104. [Google Scholar] [CrossRef]
- Homeier, J.; Breckle, S.W.; Günter, S.; Rollenbeck, R.T.; Leuschner, C. Tree diversity, forest structure and productivity along altitudinal and topographical gradients in a species-rich Ecuadorian montane rain forest. Biotropica 2010, 42, 140–148. [Google Scholar] [CrossRef]
- Sundqvist, M.K.; Sanders, N.J.; Wardle, D.A. Community and ecosystem response to elevational gradients: Processes, mechanisms, and insights for global change. Annu. Rev. Ecol. Evol. Syst. 2013, 44, 261–280. [Google Scholar] [CrossRef]
- Barone, J.A.; Thomlinson, J.; Cordero, P.A.; Zimmerman, J.K. Metacommunity structure of tropical forest along an elevation gradient in Puerto Rico. J. Trop. Ecol. 2008, 24, 1–10. [Google Scholar] [CrossRef]
- Chun, J.; Lee, C. Diversity patterns and phylogenetic structure of vascular plants along elevational gradients in a mountain ecosystem, South Korea. J. Mt. Sci. 2018, 15, 280–295. [Google Scholar] [CrossRef]
- Webb, C.O. Exploring the phylogenetic structure of ecological communities: An example for rainforest trees. Am. Nat. 2000, 156, 145–155. [Google Scholar] [CrossRef] [PubMed]
- Webb, C.O.; Ackerly, D.D.; McPeek, M.A.; Donoghue, M.J. Phylogenies and community ecology. Annu. Rev. Ecol. Syst. 2002, 33, 475–505. [Google Scholar] [CrossRef]
- Swenson, N.G. The role of evolutionary processes in producing biodiversity patterns, and the interrelationships between taxonomic, functional and phylogenetic biodiversity. Am. J. Bot. 2011, 98, 472–480. [Google Scholar] [CrossRef] [PubMed]
- Heckenhauer, J.; Salim, K.A.; Chase, M.W.; Dexter, K.G.; Pennington, R.T.; Tan, S.; Kaye, M.E.; Samuel, R. Plant DNA barcodes and assessment of phylogenetic community structure of a tropical mixed dipterocarp forest in Brunei Darussalam (Borneo). PLoS ONE 2017, 12, e0185861. [Google Scholar] [CrossRef] [PubMed]
- Chun, J.; Lee, C. Partitioning the regional and local drivers of phylogenetic and functional diversity along temperate elevational gradients on an East Asian peninsula. Sci. Rep. 2018, 8, 2853. [Google Scholar] [CrossRef]
- Kembel, S.W.; Hubbell, S.P. The phylogenetic structure of a neotropical forest tree community. Ecology 2006, 87, S86–S99. [Google Scholar] [CrossRef]
- Kraft, N.J.B.; Valencia, R.; Ackerly, D.D. Functional traits and niche-based tree community assembly in an Amazonian forest. Science 2008, 322, 580–582. [Google Scholar] [CrossRef]
- Swenson, N.G.; Enquist, B.J. Opposing assembly mechanisms in a Neotropical dry forest: Implications for phylogenetic and functional community ecology. Ecology 2009, 90, 2161–2170. [Google Scholar] [CrossRef]
- Kress, W.J. Plant DNA barcodes: Applications today and in the future. J. Syst. Evol. 2017, 55, 291–307. [Google Scholar] [CrossRef]
- López-Angulo, J.; Swenson, N.G.; Cavieres, L.A.; Escudero, A. Interactions between abiotic gradients determine functional and phylogenetic diversity patterns in Mediterranean-type climate mountains in the Andes. J. Veg. Sci. 2017, 29, 245–254. [Google Scholar] [CrossRef]
- Losos, J.B. Phylogenetic perspectives on community ecology. Ecology 1996, 77, 1344–1354. [Google Scholar] [CrossRef]
- Slingsby, J.A.; Verboom, G.A. Phylogenetic relatedness limits co-occurrence at fine spatial scales: Evidence from the schoenoid sedges (Cyperaceae: Schoeneae) of the cape floristic region, South Africa. Am. Nat. 2006, 168, 14–27. [Google Scholar] [CrossRef]
- Erickson, D.L.; Jones, F.A.; Swenson, N.G.; Pei, N.; Bourg, N.A.; Chen, W.; Davies, S.J.; Ge, X.; Hao, Z.; Howe, R.W.; et al. Comparative evolutionary diversity and phylogenetic structure across multiple forest dynamics plots: A mega-phylogeny approach. Front. Genet. 2014, 5, 358. [Google Scholar] [CrossRef]
- Kress, W.J.; Erickson, D.L.; Jones, F.A.; Swenson, N.G.; Perez, R.; Sanjur, O.; Bermingham, E. Plant DNA barcodes and a community phylogeny of a tropical forest dynamics plot in Panama. Proc. Natl. Acad. Sci. USA 2009, 106, 18621–18626. [Google Scholar] [CrossRef]
- Hollingsworth, P.; Graham, S.W.; Little, D.P. Choosing and using a plant DNA barcode. PLoS ONE 2011, 6, e19254. [Google Scholar] [CrossRef]
- Saslis-Lagoudakis, C.H.; Klitgaard, B.B.; Forest, F.; Francis, L.; Ssavolainen, V.; Williamson, E.M.; Hawkins, J.A. The use of phylogeny to interpret cross-cultural patterns in plant use and guide medicinal plant discovery: An example from Pterocarpus (Leguminosae). PLoS ONE 2011, 6, e22275. [Google Scholar] [CrossRef]
- Kress, W.J.; Erickson, D.L.; Swenson, N.G.; Thompson, J.; Uriarte, M.; Zimmerman, J.K. Advances in the use of DNA barcodes to build a community phylogeny for tropical trees in a Puerto Rican forest dynamics plot. PLoS ONE 2010, 5, e15409. [Google Scholar] [CrossRef]
- Muscarella, R.; Uriarte, M.; Erickson, D.L.; Swenson, N.G.; Zimmerman, J.K.; Kress, W.J. A well-resolved phylogeny of the trees of Puerto Rico based on DNA barcode sequence data. PLoS ONE 2014, 9, e112843. [Google Scholar] [CrossRef]
- Ricklefs, R.E. Community diversity: Relative roles of local and regional processes. Science 1987, 235, 167–171. [Google Scholar] [CrossRef]
- Weiher, E.; Keddy, P.A. The assembly of experimental wetland plant communities. Oikos 1995, 73, 323–335. [Google Scholar] [CrossRef]
- Eiserhardt, W.L.; Svenning, J.; Borchsenius, F.; Kristianses, T.; Balslev, H. Separating environmental and geographical determinants of phylogenetic community structure in Amazonian plants (Arecaceae). Bot. J. Linn. Soc. 2013, 171, 244–259. [Google Scholar] [CrossRef]
- Boyle, E.E.; Adamowicz, S.J. Community phylogenetics: Assessing tree reconstruction methods and the utility of DNA barcodes. PLoS ONE 2015, 10, e0126662. [Google Scholar] [CrossRef]
- Mayfield, M.M.; Levine, J.M. Opposing effects of competitive exclusion on the phylogenetic structure of communities. Ecol. Lett. 2010, 13, 1085–1093. [Google Scholar] [CrossRef]
- Qian, H.; Hao, Z.; Zhang, J. Phylogenetic structure and phylogenetic diversity of angiosperm assemblages in forests along an elevational gradient in Changbaishan, China. J. Plant Ecol. 2014, 7, 154–165. [Google Scholar] [CrossRef]
- González-Caro, S.; Umaña, M.N.; Álvarez, E.; Stevenson, P.R.; Swenson, N.G. Phylogenetic alpha and beta diversity in tropical tree assemblages along regional-scale environmental gradients in northwest South America. J. Plant Ecol. 2014, 7, 145–153. [Google Scholar] [CrossRef]
- Jørgensen, P.M.; León-Yánez, S. Catalogue of the Vascular Plants of Ecuador; Missouri Botanical Garden Press: St. Louis, MO, USA, 1999. [Google Scholar]
- Valencia, R.; Jørgensen, P.M. Composition and structure of a humid montane forest on the Pasochoa volcano, Ecuador. Nord. J. Bot. 1992, 12, 239–247. [Google Scholar] [CrossRef]
- Kappelle, M.; Uffelen, J.V.; Cleef, A.M. Altitudinal zonation of montane Quercus forests along two transects in Chirripó National Park, Costa Rica. Vegetatio 1995, 119, 119–153. [Google Scholar] [CrossRef]
- Givnish, T.J. On the causes of gradients in tropical tree diversity. J. Ecol. 1999, 87, 193–210. [Google Scholar] [CrossRef]
- Swenson, N.G.; Anglada-Cordero, P.; Barone, J.A. Deterministic tropical tree community turnover: Evidence from patterns of functional beta diversity along an elevational gradient. Proc. R. Soc. B 2011, 278, 877–884. [Google Scholar] [CrossRef]
- Hutter, C.R.; Guayasamin, J.M.; Wiens, J.J. Explaining Andean megadiversity: The evolutionary and ecological causes of glass frog elevational richness patterns. Ecol. Lett. 2013, 16, 1135–1144. [Google Scholar] [CrossRef]
- Burgess, K.S.; Fazekas, A.J.; Kesanakurti, P.R.; Graham, S.W.; Husband, B.C.; Newmaster, S.G.; Percy, D.M.; Hajibabaei, M.; Barrett, S.C.H. Discriminating plant species in a local temperate flora using the rbcL + matK DNA barcode. Methods Ecol. Evol. 2011, 2, 333–340. [Google Scholar] [CrossRef]
- Dick, C.W.; Webb, C.O. Plant DNA barcodes, taxonomic management, and species discovery in tropical forests. In DNA Barcodes: Methods and Protocols; Kress, W.J., Erickson, D.L., Eds.; Springer: New York, NY, USA, 2012; pp. 379–394. [Google Scholar]
- Bressan, E.A.; Rossi, M.L.; Gerald, L.T.S.; Figueira, A. Extraction of high-quality DNA from ethanol-preserved tropical plant tissue. BMC Res. Notes 2014, 7, 268–273. [Google Scholar] [CrossRef]
- Swenson, N.G. Functional and Phylogenetic Ecology in R; Springer: New York, NY, USA, 2014. [Google Scholar]
- Muñoz, M.C.; Schaefer, H.M.; Böhning-Gaese, K.; Neuschulz, E.L.; Schleuning, M. Phylogenetic and functional diversity of fleshy-fruited plants are positively associated with seedling diversity in a tropical montane forest. Front. Ecol. Evol. 2017, 5, 93. [Google Scholar] [CrossRef]
- Li, X.; Zhu, X.; Niu, Y.; Sun, H. Phylogenetic clustering and overdispersion for alpine plants along elevational gradient in the Hengduan Mountains Region, southwest China. J. Syst. Evol. 2014, 52, 280–288. [Google Scholar] [CrossRef]
- Zhou, Y.; Wang, S.; Njogu, A.W.; Ochola, A.C.; Boru, B.H.; Mwachala, G.; Hu, G.; Wang, Q. Spatial congruence or mismatch between phylogenetic and functional structure of seed plants along a tropical elevational gradient: Different traits have different patterns. Front. Ecol. Evol. 2019, 7, 100. [Google Scholar] [CrossRef]
- Zhang, W.; Huang, D.; Wang, R.; Liu, J.; Du, N. Altitudinal patterns of species diversity and phylogenetic diversity across temperate mountain forests of Northern China. PLoS ONE 2016, 11, e0159995. [Google Scholar] [CrossRef]
- Xu, J.; Chen, Y.; Zhang, L.; Chai, Y.; Wang, M.; Guo, Y.; Li, T.; Yue, M. Using phylogeny and functional traits for assessing community assembly along environmental gradients: A deterministic process driven by elevation. Ecol. Evol. 2017, 7, 5056–5069. [Google Scholar] [CrossRef]
- Reynolds, A. Siempre Verde Bosque y Vegetacion Protector; Ministry of Environment of Ecuador: Ibarra, Imbabura, Ecuador, 2011; pp. 1–46. [Google Scholar]
- Instituto Geografico Militar. Ministerio de Agricultura y Ganaderia: Programa Nacional de Regionalizacion Agraria (PRONAREG); Soil map, 1:50,000; Instituto Geografico Militar: Quito, Ecuador, 1984. [Google Scholar]
- Jiménez-Paz, R.A. Floristic Composition, Structure and Diversity along an Elevational Gradient in an Andean Forest of Northern Ecuador. Bachelor’s Thesis, Pontificia Universidad Católica del Ecuador, Quito, Ecuador, 2016. [Google Scholar]
- Angiosperm Phylogeny Group (APG). An update of the Angiosperm Phylogeny Group classification for the orders and families of flowering plants: APG III. Bot. J. Linn. Soc. 2009, 161, 105–121. [Google Scholar] [CrossRef]
- Ivanova, N.V.; Fazekas, A.J.; Hebert, P.D. Semi-automated, membrane-based protocol for DNA isolation from plants. Plant Mol. Biol. Rep. 2008, 26, 186–198. [Google Scholar] [CrossRef]
- Ivanova, N.V.; Kuzmina, M.; Fazekas, A.; CCDB Protocols. DNA Extraction. 2016. Available online: http://ccdb.ca/site/wp-content/uploads/2016/09/CCDB_DNA_Extraction-Plants.pdf (accessed on 20 June 2019).
- Kuzmina, M.; Ivanova, N.; CCDB Protocols. PCR Amplification. 2011. Available online: http://ccdb.ca/site/wp-content/uploads/2016/09/CCDB_Amplification-Plants.pdf (accessed on 20 June 2019).
- Fazekas, A.J.; Kuzmina, M.L.; Newmaster, S.G.; Hollingsworth, P.M. DNA barcoding methods for land plants. In DNA Barcodes: Methods and Protocols; Kress, W.J., Erickson, D.L., Eds.; Springer: New York, NY, USA, 2012; pp. 223–252. [Google Scholar]
- Ivanova, N.V.; Grainger, C.; CCDB Protocols. PCR Product Visualization, Clean-up & Sequencing—Universal. 2006. Available online: http://ccdb.ca/site/wp-content/uploads/2016/09/CCDB_Sequencing.pdf (accessed on 20 June 2019).
- Kuzmina, M.; Ivanova, N.; CCDB Protocols. Sequencing. 2006. Available online: http://ccdb.ca/site/wp-content/uploads/2016/09/CCDB_PrimerSets-Plants.pdf (accessed on 20 June 2019).
- Levin, R.A.; Wagner, W.L.; Hoch, P.C.; Nepokroeff, M.; Pires, J.C.; Zimmer, E.A.; Sytsma, K.J. Family-level relationships of Onagraceae based on chloroplast rbcL and ndhF data. Am. J. Bot. 2002, 90, 107–115. [Google Scholar] [CrossRef]
- Ford, C.S.; Ayres, K.L.; Toomey, N.; Haider, N.; van Alphen Stahl, J.; Kelly, L.J.; Wikström, N.; Hollingsworth, P.M.; Duff, R.J.; Hoot, S.B.; et al. Selection of candidate coding DNA barcoding regions for use on land plants. Bot. J. Linn. Soc. 2009, 159, 1–11. [Google Scholar] [CrossRef]
- Dunning, L.T.; Savolainen, V. Broad-scale amplification of matK for DNA barcoding plants, a technical note. Bot. J. Linn. Soc. 2010, 164, 1–9. [Google Scholar] [CrossRef]
- Nagendra, H. Opposite trends in response for the Shannon and Simpson indices of landscape diversity. Appl. Geogr. 2002, 22, 175–186. [Google Scholar] [CrossRef]
- Morris, E.K.; Caruso, T.; Buscot, F.; Fischer, M.; Hancock, C.; Maier, T.S.; Meiners, T.; Müller, C.; Obermaier, E.; Prati, D.; et al. Choosing and using diversity indices: Insights for ecological applications from the German Biodiversity Exploratories. Ecol. Evol. 2014, 4, 3514–3524. [Google Scholar] [CrossRef]
- Oksanen, J.; Blanchet, F.G.; Friendly, M.; Kindt, R.; Legendre, P.; McGlinn, D.; Minchin, P.R.; O’Hara, R.B.; Simpson, G.L.; Solymos, P.; et al. Vegan: Community Ecology Package, 2.4-4. 2017. Available online: http://CRAN.R-project.org/package=vegan (accessed on 29 August 2019).
- R Core Team. R: A Language and Environment for Statistical Computing; R Foundation for Statistical Computer: Vienna, Austria, 2018; Available online: http://www.R-project.org/ (accessed on 29 August 2019).
- Kearse, M.; Moir, R.; Wilson, A.; Stones-Havas, S.; Cheung, M.; Sturrock, S.; Buxton, S.; Cooper, A.; Markowitz, S.; Duran, C.; et al. Geneious Basic: An integrated and extendable desktop software platform for the organization and analysis of sequence data. Bioinformatics 2012, 28, 1647–1649. [Google Scholar] [CrossRef]
- Katoh, K.; Misawa, K.; Kuma, K.; Miyata, T. MAFFT: A novel method for rapid multiple sequence alignment based on fast Fourier transform. Nucleic Acids Res. 2002, 30, 3059–3066. [Google Scholar] [CrossRef]
- Katoh, K.; Standley, D.M. MAFFT multiple sequence alignment software version 7: Improvements in performance and usability. Mol. Biol. Evol. 2013, 30, 772–780. [Google Scholar] [CrossRef]
- Stamatakis, A. RAxML-VI-HPC: Maximum likelihood-based phylogenetic analyses with thousands of taxa and mixed models. Bioinformatics 2006, 22, 2688–2690. [Google Scholar] [CrossRef]
- Stamatakis, A. RAxML version 8: A tool for phylogenetic analysis and post-analysis of large phylogenies. Bioinformatics 2014, 30, 1312–1313. [Google Scholar] [CrossRef]
- Biswal, D.K.; Debnath, M.; Kumar, S.; Tandon, P. Phylogenetic reconstruction in the Order Nymphaeales: ITS2 secondary structure analysis and in silico testing of maturase k (matK) as a potential marker for DNA bar coding. BMC Bioinform. 2012, 13, S26–S41. [Google Scholar] [CrossRef]
- Wei, S.; Wang, X.; Bi, C.; Xu, Y.; Wu, D.; Ye, N. Assembly and analysis of the complete Salix purpurea L. (Salicaceae) mitochondrial genome sequence. SpringerPlus 2016, 5, 1894–1903. [Google Scholar] [CrossRef]
- Stamatakis, A.; Hoover, P.; Rougemont, J. A rapid bootstrap algorithm for the RAxML web servers. Syst. Biol. 2008, 57, 758–771. [Google Scholar] [CrossRef]
- Kembel, S.W.; Cowan, P.D.; Helmus, M.R.; Cornwell, W.K.; Morlon, H.; Ackerly, D.D.; Blomberg, S.P.; Webb, C.O. Picante: R tools for integrating phylogenies and ecology. Bioinformatics 2010, 26, 1463–1464. [Google Scholar] [CrossRef]
- Faith, D.P. Conservation evaluation and phylogenetic diversity. Biol. Conserv. 1992, 61, 1–10. [Google Scholar] [CrossRef]
- Kembel, S. An Introduction to the Picante Package. 2010. Available online: http://picante.r-forge.r-project.org/picante-intro.pdf (accessed on 20 June 2019).
- Colwell, R.K.; Brehm, G.; Cardelús, C.L.; Gilman, A.C.; Longino, J.T. Global warming, elevational range shifts, and lowland biotic attrition in the wet tropics. Science 2008, 322, 258–261. [Google Scholar] [CrossRef]


| Plot | Elevation (m) | Number of Stems | Species Richness | Genus Richness | Family Richness | Species H´ | Species D2 | Species E |
|---|---|---|---|---|---|---|---|---|
| 1 | 2440 | 53 | 17 | 17 | 13 | 2.46 | 8.59 | 0.51 |
| 2 | 2560 | 42 | 14 | 12 | 10 | 2.13 | 5.62 | 0.40 |
| 3 | 2670 | 33 | 17 | 17 | 13 | 2.50 | 8.57 | 0.50 |
| 4 | 2700 | 29 | 18 | 18 | 14 | 2.73 | 12.94 | 0.72 |
| 5 | 2770 | 39 | 14 | 13 | 12 | 2.30 | 7.80 | 0.56 |
| 6 | 2820 | 44 | 23 | 18 | 17 | 2.94 | 15.87 | 0.69 |
| 7 | 2860 | 23 | 14 | 13 | 13 | 2.46 | 9.62 | 0.69 |
| 8 | 2950 | 24 | 15 | 12 | 10 | 2.58 | 11.52 | 0.77 |
| 9 | 3020 | 35 | 15 | 12 | 10 | 2.42 | 8.81 | 0.59 |
| 10 | 3090 | 21 | 10 | 9 | 9 | 2.02 | 5.88 | 0.59 |
| 11 | 3160 | 21 | 11 | 11 | 10 | 2.31 | 9.38 | 0.85 |
| 12 | 3250 | 17 | 8 | 8 | 8 | 1.92 | 5.90 | 0.74 |
| 13 | 3290 | 63 | 14 | 11 | 10 | 2.21 | 6.98 | 0.50 |
| 14 | 3320 | 100 | 16 | 10 | 9 | 2.12 | 5.23 | 0.33 |
| 15 | 3330 | 51 | 11 | 10 | 9 | 1.81 | 4.40 | 0.40 |
| Plot | Elevation (m) | PD | PD: No Ferns | MPD | MPD: No Ferns | MNTD | MNTD: No Ferns |
|---|---|---|---|---|---|---|---|
| 1 | 2440 | 1.438 | 0.940 | 0.246 | 0.180 | 0.160 | 0.127 |
| 2 | 2560 | 1.241 | 1.039 | 0.186 | 0.187 | 0.106 | 0.106 |
| 3 | 2670 | 1.555 | 1.066 | 0.358 * | 0.190 | 0.221 * | 0.098 |
| 4 | 2700 | 1.667 * | 1.175 | 0.253 | 0.190 | 0.127 | 0.091 |
| 5 | 2770 | 1.283 | 0.791 | 0.210 | 0.162 | 0.079 | 0.052 ^ |
| 6 | 2820 | 1.483 | 0.990^ | 0.260 | 0.147 ^ | 0.116 | 0.042 ^ |
| 7 | 2860 | 1.292 | 0.780 | 0.321 * | 0.143 | 0.079 | 0.099 |
| 8 | 2950 | 1.179 | 0.669 | 0.344 * | 0.152 | 0.050 ^ | 0.061 ^ |
| 9 | 3020 | 1.290 | 0.795 | 0.350 * | 0.177 | 0.205 * | 0.081 |
| 10 | 3090 | 1.270 | 0.777 | 0.349 * | 0.176 | 0.281 * | 0.172 |
| 11 | 3160 | 1.487 * | 0.994 * | 0.313 * | 0.207 | 0.218 * | 0.160 * |
| 12 | 3250 | 1.054 | 0.556 | 0.365 * | 0.160 | 0.282 * | 0.113 |
| 13 | 3290 | 1.159 | 0.662 | 0.273 | 0.122^ | 0.153 | 0.051 ^ |
| 14 | 3320 | 1.095 | 0.597 ^ | 0.124 ^ | 0.115^ | 0.025 ^ | 0.019 ^ |
| 15 | 3330 | 1.025 | 0.528 ^ | 0.128 | 0.107 | 0.098 | 0.087 |
© 2019 by the authors. Licensee MDPI, Basel, Switzerland. This article is an open access article distributed under the terms and conditions of the Creative Commons Attribution (CC BY) license (http://creativecommons.org/licenses/by/4.0/).
Share and Cite
Worthy, S.J.; Jiménez Paz, R.A.; Pérez, Á.J.; Reynolds, A.; Cruse-Sanders, J.; Valencia, R.; Barone, J.A.; Burgess, K.S. Distribution and Community Assembly of Trees Along an Andean Elevational Gradient. Plants 2019, 8, 326. https://doi.org/10.3390/plants8090326
Worthy SJ, Jiménez Paz RA, Pérez ÁJ, Reynolds A, Cruse-Sanders J, Valencia R, Barone JA, Burgess KS. Distribution and Community Assembly of Trees Along an Andean Elevational Gradient. Plants. 2019; 8(9):326. https://doi.org/10.3390/plants8090326
Chicago/Turabian StyleWorthy, Samantha J., Rosa A. Jiménez Paz, Álvaro J. Pérez, Alex Reynolds, Jennifer Cruse-Sanders, Renato Valencia, John A. Barone, and Kevin S. Burgess. 2019. "Distribution and Community Assembly of Trees Along an Andean Elevational Gradient" Plants 8, no. 9: 326. https://doi.org/10.3390/plants8090326
APA StyleWorthy, S. J., Jiménez Paz, R. A., Pérez, Á. J., Reynolds, A., Cruse-Sanders, J., Valencia, R., Barone, J. A., & Burgess, K. S. (2019). Distribution and Community Assembly of Trees Along an Andean Elevational Gradient. Plants, 8(9), 326. https://doi.org/10.3390/plants8090326