Review

Nitrogen Dioxide at Ambient Concentrations Induces Nitration and Degradation of PYR/PYL/RCAR Receptors to Stimulate Plant Growth: A Hypothetical Model

Department of Mathematical and Life Sciences, Hiroshima University, Higashi-Hiroshima 739-8526, Japan
*
Author to whom correspondence should be addressed.
Plants 2019, 8(7), 198; https://doi.org/10.3390/plants8070198
Submission received: 20 May 2019 / Revised: 21 June 2019 / Accepted: 24 June 2019 / Published: 30 June 2019
(This article belongs to the Special Issue Nitric Oxide Signaling in Plants)

Abstract

:
Exposing Arabidopsis thaliana (Arabidopsis) seedlings fed with soil nitrogen to 10–50 ppb nitrogen dioxide (NO2) for several weeks stimulated the uptake of major elements, photosynthesis, and cellular metabolisms to more than double the biomass of shoot, total leaf area and contents of N, C P, K, S, Ca and Mg per shoot relative to non-exposed control seedlings. The 15N/14N ratio analysis by mass spectrometry revealed that N derived from NO2 (NO2-N) comprised < 5% of the total plant N, showing that the contribution of NO2-N as N source was minor. Moreover, histological analysis showed that leaf size and biomass were increased upon NO2 treatment, and that these increases were attributable to leaf age-dependent enhancement of cell proliferation and enlargement. Thus, NO2 may act as a plant growth signal rather than an N source. Exposure of Arabidopsis leaves to 40 ppm NO2 induced virtually exclusive nitration of PsbO and PsbP proteins (a high concentration of NO2 was used). The PMF analysis identified the ninth tyrosine residue of PsbO1 (9Tyr) as a nitration site. 9Tyr of PsbO1 was exclusively nitrated after incubation of the thylakoid membranes with a buffer containing NO2 and NO2 or a buffer containing NO2 alone. Nitration was catalyzed by illumination and repressed by photosystem II (PSII) electron transport inhibitors, and decreased oxygen evolution. Thus, protein tyrosine nitration altered (downregulated) the physiological function of cellular proteins of Arabidopsis leaves. This indicates that NO2-induced protein tyrosine nitration may stimulate plant growth. We hypothesized that atmospheric NO2 at ambient concentrations may induce tyrosine nitration of PYR/PYL/RCAR receptors in Arabidopsis leaves, followed by degradation of PYR/PYL/RCAR, upregulation of target of rapamycin (TOR) regulatory complexes, and stimulation of plant growth.

1. Introduction

Atmospheric nitrogen dioxide (NO2) originates equally from natural sources, including soil microbes and lightning, and anthropogenic sources, including the combustion of fossil fuels [1,2]. Globally, atmospheric NO2 is a main pollutant in urban areas and a key precursor of ozone and particulate matter (PM) [3,4]. The current World Health Organization (WHO) annual guideline value for atmospheric NO2 is 40 µg/m3 (21.3 ppb) [4]. It has been reported that the average NO2 concentration in 141 countries is 50.6 µg/m3 (~27.3 ppb) [5]; this value is clearly higher than that recommended by the WHO.
Plants emit nitric oxide (NO) and NO2 [6,7,8,9]. Plants also absorb NO2 and assimilate NO2-derived nitrogen into amino acid nitrogen [10,11]. The compensation point concentration at which the emission of NO2 from plants and absorption into plants balance is reported to be 0.3–3 ppb [12]. Therefore, at 27 ppb NO2 (see above), plants are a sink for NO2. These nitrogen oxides (NO and NO2) are often considered as air pollutants [13]. For humans, NO2 at ambient concentrations is definitely toxic [14]. In contrast, the effects of atmospheric NO and NO2 are either toxic or non-toxic on plants contingent on their concentrations and the plant species [13,15,16,17,18]. It is noteworthy that in the nineteenth century, von Liebig (1827) [19] first proposed that lightning is important in the global nitrogen cycle to produce atmospheric NO and NO2 by the oxidation of N2, and that these nitrogen oxides serve as a natural fertilizer.
We discovered that atmospheric NO2 at ambient concentrations (10–50 ppb) acts as a stimulant signal for plant growth. We also sought understanding of why an air-pollutant such as NO2 can act as a stimulant factor for plant growth. Recently, based on previous research, we devised a hypothesis to answer this fundamental question, which is described below.

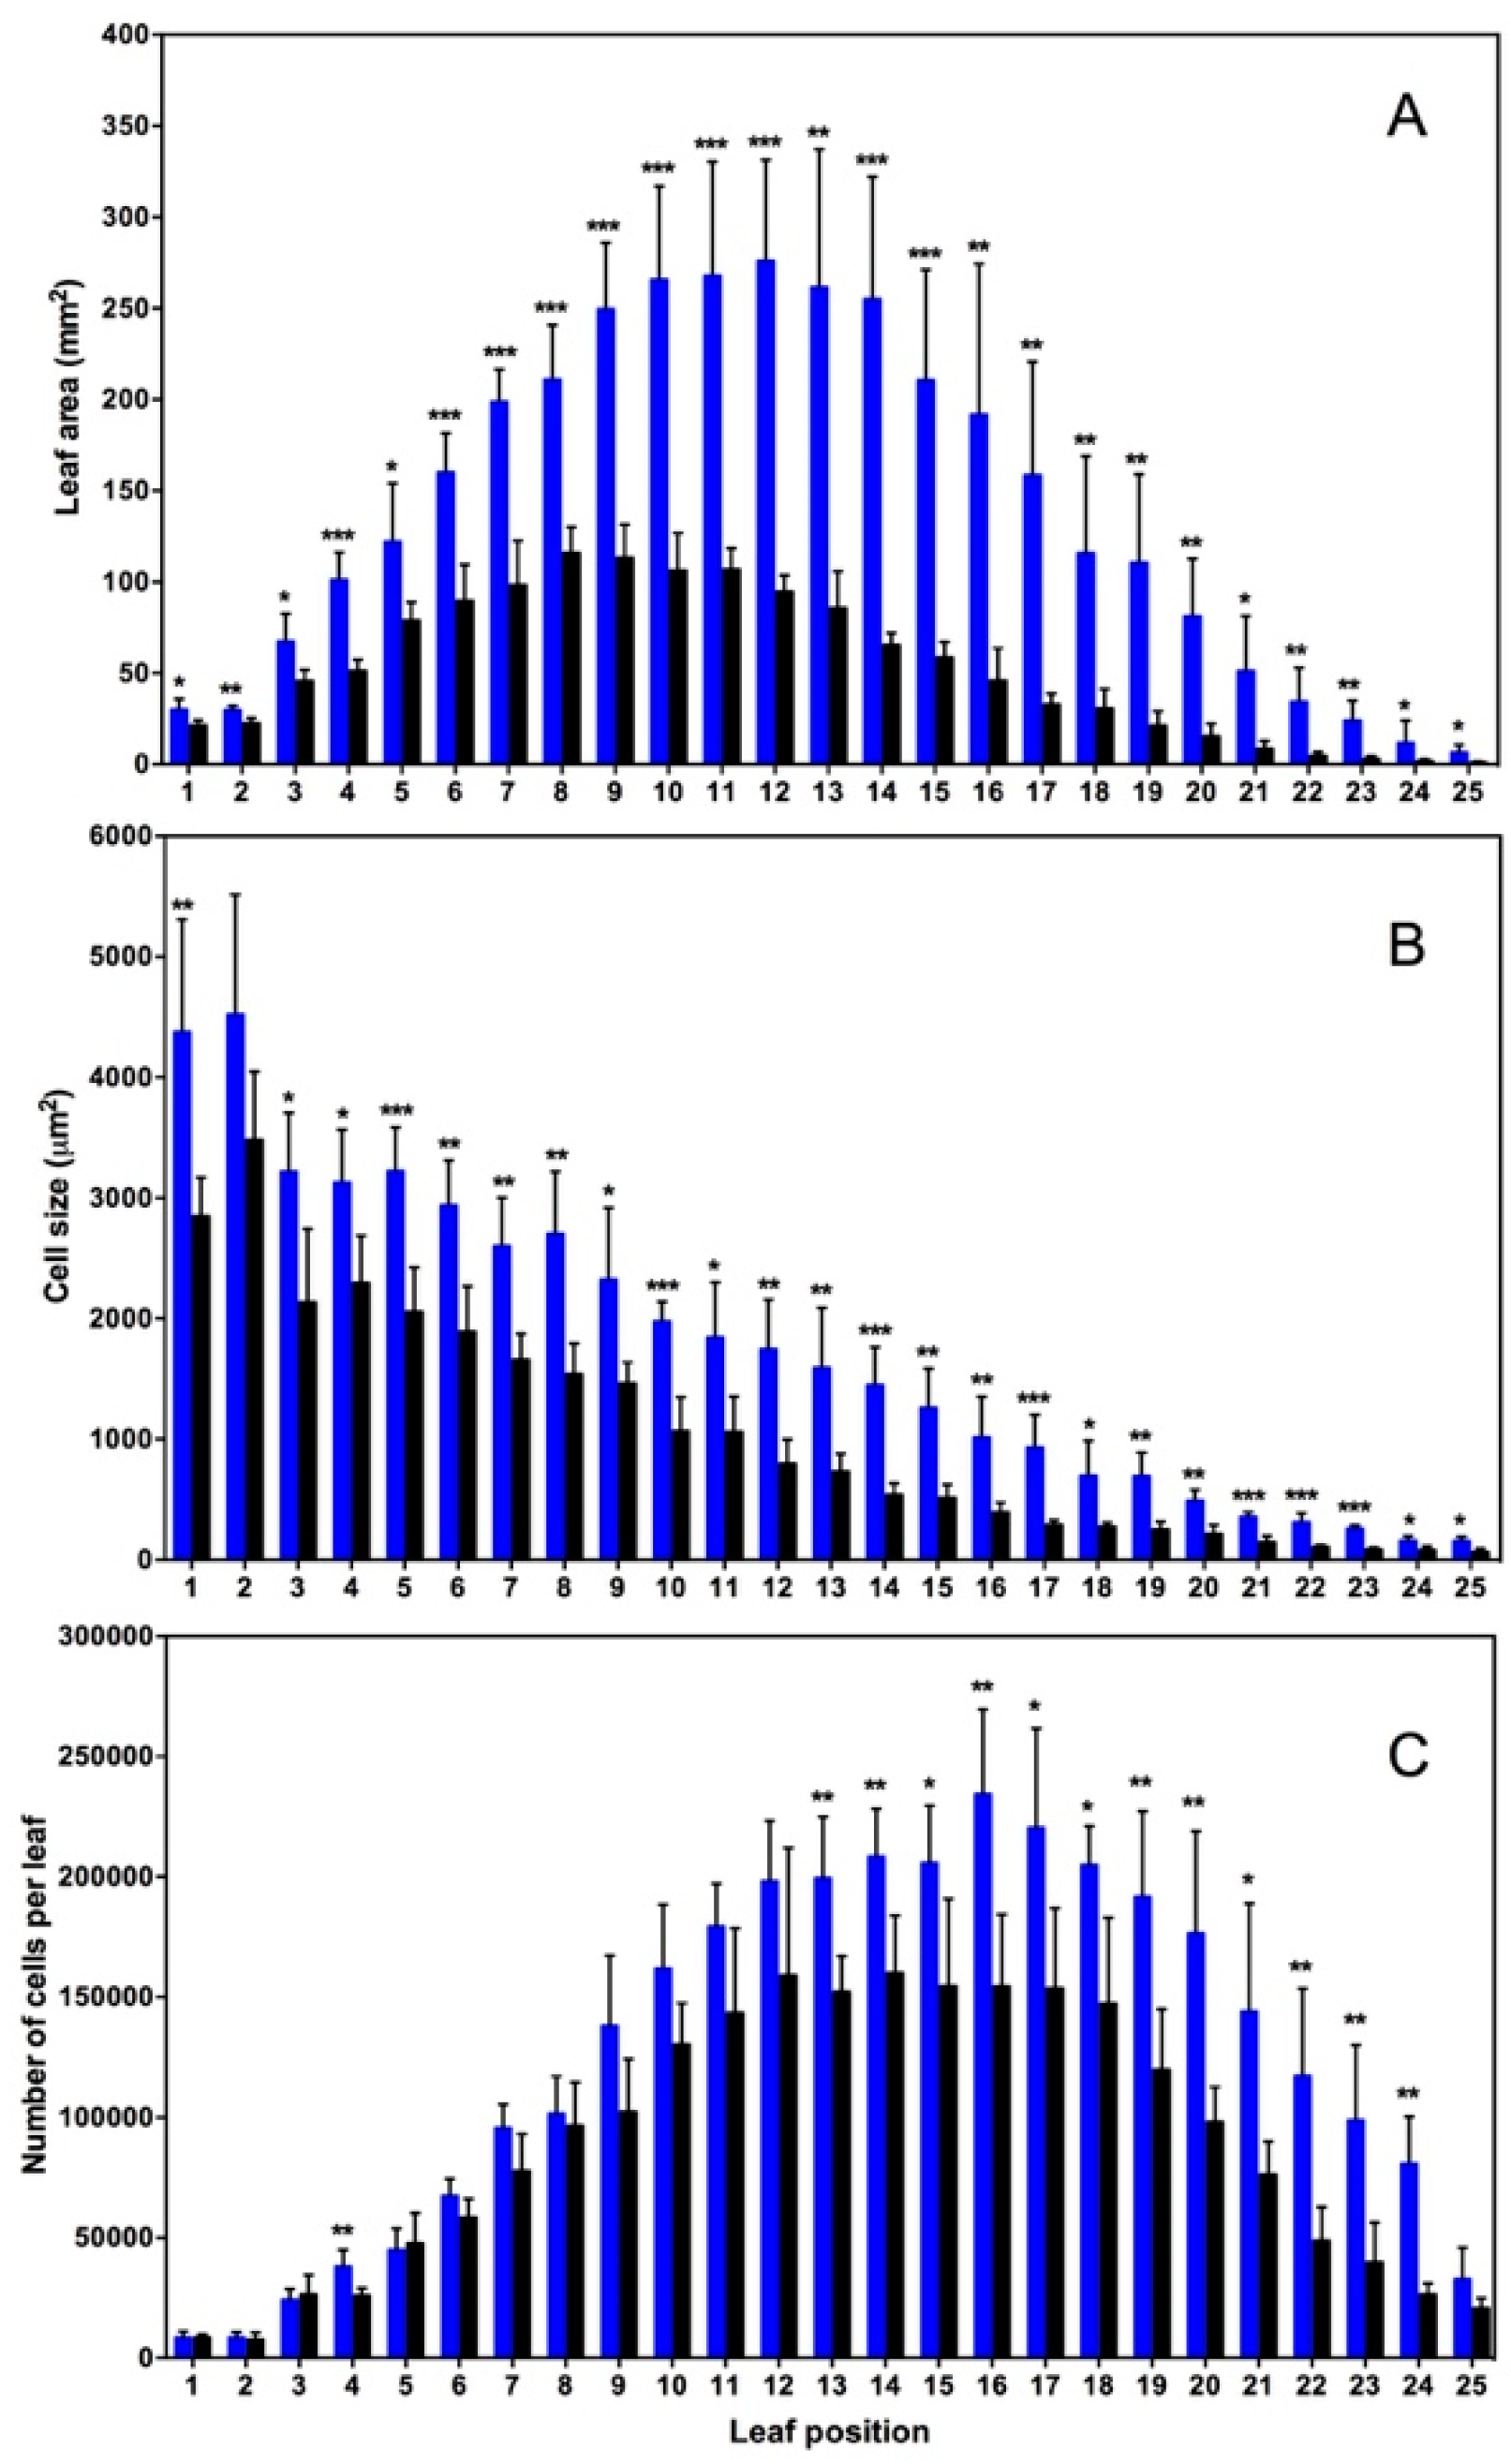
2. Nitrogen Dioxide at Ambient Concentrations of 10–50 ppb Acts as a Positive Plant Growth Signal in Arabidopsis Thaliana

Initially, we investigated the potential of plant material to mitigate atmospheric NO2 [20,21,22]. We found a higher than 600-fold difference in the assimilation ability of NO2 among 217 plant taxa [20]. We investigated hypothetical air-pollutant-philic plants [23,24] that utilize NO2 as the sole nitrogen source. During our research, we discovered that atmospheric NO2 at concentrations as low as 10−50 ppb positively regulates plant growth [25,26,27,28,29,30,31,32].
Arabidopsis thaliana (Arabidopsis) was grown in air without NO2 for the first week after sowing, and then for 1–4 weeks in air with (abbreviated as +NO2-treated plants) or without (–NO2 control plants) NO2 [26]. Seedlings were watered semiweekly with half-strength inorganic salts of Murashige and Skoog (M&S) medium [33] containing 19.7 mM nitrate and 10.3 mM ammonium. Plant age is expressed in weeks after sowing and corresponds to the time of harvest. The plant type utilized was accession C24 or Columbia. Their responses in terms of biomass increase and flowering time to NO2 were very similar qualitatively, but differed quantitatively (see below) [28].
NO2 concentration effect on the yield of shoot biomass in 4-week-old plants was first determined. Shoot biomass of +NO2-treated C24 plants under 10 ± 0.2 and 50 ± 0.3 ppb NO2 was 3.2-fold [29] and 2.5-fold greater relative to the –NO2 control plants. Treatments of 100 ± 20 and 200 ± 50 ppb NO2 produced no stimulation of growth, or somewhat repressed the growth of plants. In this study, 50 ± 0.3 ppb NO2 treatments were used. Images of typical 4-week-old + NO2 and –NO2 control plants (Columbia) are shown in Figure 1.
Increase in shoot biomass by NO2 treatment was accompanied by increase in uptake of seven major elements, such as carbon(C), N, phosphorus (P), potttasium (K), calcium (Ca), magnesium (Mg) and sulfur (S) into shoots. The contents of these elements per shoot dry weight (DW) were virtually the same for +NO2-treated plants and –NO2 control plants, and the contents of these elements per shoot were two times greater in +NO2-treated plants than in –NO2 control plants (Table S1) [26]. These findings agreed with our previous work on Nicotiana plumbaginifolia [24] and other vegetable plant species [27].
Arabidopsis thaliana accession Columbia also increased shoot biomass in response to NO2 treatment as in the case of accession C24 [26]. This is consistent with the report of Xu et al. (2010) [34]. Columbia grew faster than C24, and 4-week-old Columbia appeared to be close to the end of the vegetative growth. Shoot biomasses of +NO2-treated plants and –NO2 control plants of 4-week-old Columbia were 24.2 ± 5.5 and 14.3 ± 2.5 mg (mean ± SD, n = 5), respectively [26]. This difference in shoot biomass (1.7-fold) was smaller than that in C24 (2.5-fold, see above).
NO2 treatment significantly shortened flowering time in both the C24 and Columbia accessions. In accordance with Kotchoni et al. [34], the number of days after sowing when the flower bolts became 1 cm long was a measure of flowering time.
The accession C24 exhibited a median flowering time of 41 and 42 d in +NO2-treated and –NO2 control plants, respectively. This difference was statistically significant by Student’s t-test (P < 0.05) [25]. In the case of the accession Columbia, flowering time was remarkably shortened by NO2 treatment. The median flowering time of this accession was 34 and 40 d in +NO2-treated plants and –NO2 control plants, respectively [31]. This was statistically significant (P < 0.001) by Student’s t-test [25]. A similar flowering acceleration was observed in other plants. NO2 treatment shortened the flowering time by 3.2 days and increased fruit yield by 1.4 times in tomato [31]. In addition, NO2 has accelerated the flowering of mulkhiya plants [35].
NO at the same concentration as NO2 increased shoot biomass in Arabidopsis C24 [25,26] and Columbia [36]. This agrees with those reports that sodium nitroprusside, a NO donor, accelerates vegetative growth of Arabidopsis [37], and that NO gas stimulates the expansion of leaf discs of pea [38] and the vegetative growth of spinach [39].
As NO2 stimulate shoot biomass production, we expected a similar NO2 effect on the root biomass production. Among 6 plant species we studied so far, 2 showed NO2-stimulated root biomass production, but the remaining 4 showed no NO2-stimulated root biomass production: Sunflower [27] and Arabidopsis C24 [25] plants that were exposed with NO2 exhibited 0.4 ± 0.04 and 4.8 ± 0.08 (g/plant) root biomass (mean of 3 or 10 plants, respectively, ± SD) which were significantly higher (P < 0.05 or 0.001 by Student’s t test) than corresponding value of non-exposed plants (0.2 ± 0.08 and 2.5 ± 0.6). However, NO2 showed no statistically significant increases in the root biomass in lettuce, cucumber, pumpkin [27] and Nicotiana plumbaginifolia [24]. The causes and mechanisms for this result are completely unknown, and will be an important and intriguing subject for future studies. Interestingly, NO2 did stimulate the seed production of mulkhiya plants [35] although whether NO2 exhibits similar effects on other plant species such as Arabidopsis is not known yet. Similarly, how NO2 stimulates other aspects of whole life cycle of plants also is an important and intriguing subject of the future studies.
To investigate the physiological role of N derived from NO2 (NO2–N), Arabidopsis seedlings were fed with 15N-labeled gaseous NO2 (50 ppb) and unlabeled nitrate (19.7 mM) and ammonium (10.3 mM), and mass spectrometric N analysis [40] including the 15N/14N ratio analysis on the aboveground parts of plants was performed. The 15N/14N ratio is a measure of the content of NO2–N as a relative amount of the total plant N. We found that NO2–N occupied < 5% (4.05 ± 0.75%; mean ± SD, n = 3) of the total N in the +NO2-treated Arabidopsis C24 shoots. Therefore, NO2–N plays only a minor role as an N source, but instead plays an important role as a plant growth signal. Similar results indicating that NO2 plays an important role as a plant growth signal were obtained in Nicotiana plumbaginifolia [24] and other vegetable plant species [27].
The increased total leaf area following NO2 treatment (Table S1) indicated that NO2 treatment increases the sizes of individual leaves. Therefore, the sizes of individual rosette leaves in positions 1–25 on 5-week-old +NO-treated plants and –NO2 control plants, which had 28 and 25 rosette leaves, respectively, were measured. Leaves 1–11 and leaves 12–25 were in almost maturity stages and developing stages, respectively. Each of rosette leaves was separated by an angle of approximately 137° [41]. The oldest leaf located at the bottom (root side) was numbered as leaf 1, and progressively leaves were numbered as leaf 2, 3, 4 etc. to the youngest one located at the tip of the stem (close to apical meristem) as leaf 25 or 28. Leaves 1–11 and leaves 12–25 or 28 were in almost maturity stages and developing stages, respectively.
Microscopic study was performed according to Tsuge et al. (1996) [42]. The leaves of Arabidopsis C24 plants were fixed with a FAA solution (formaldehyde-acetic acid-ethanol), and microscopic observations were carried using a stereo microscope and a differential interference microscope. Microphotographs were taken to measure leaf area, cell number, and cell size (Figure 2). Leaves 1 (the oldest) to 25 (the youngest) in +NO2-treated plants had 1.3–8.4 times greater leaf areas compared with –NO2 control plants in the corresponding leaf positions (Figure 2A). The observed differences were significant statistically at all positions according to the Student’s t-test (Figure 2A) [25].
It is known that determinants of organ size are cell number and cell size [43,44,45]. Therefore, we investigated whether the increases in leaf areas following NO2 treatment were ascribable to increases in cell numbers or cell sizes, or both. In both the +NO2-treated and–NO2 control plants of Arabidopsis, palisade cells in the adaxial sub-epidermal layer were neatly aligned in the paradermal plane throughout leaf development [42], as reported previously [25]. Thus, the sizes and numbers of palisade cells in leaves of positions 1 to 25 in 5-week-old +NO2-treated plants and –NO2 control plants of Arabidopsis C24 were determined. (Figure 2B,C).
Leaf area as a function of leaf position was more or less asymmetric in both –NO2 control (black columns) and +NO2-treated plants (blue columns) (Figure 2A); –NO2 control plants exhibited a positively-skewed bell-shaped pattern, while +NO2-treated plants exhibited less skewed and less asymmetric pattern [25]. The ratio of leaf area of +NO2-treated plants to that of –NO2 control plants at the corresponding leaf positions (designated RLA) was calculated [25]. The RLA varied from 1.3–2.5 in leaves 1–11, while varied from 2.9–8.4 in leaves 12–25. This difference in RLA between leaves 1–11 and 12–25 was significant (P < 0.01), as assessed by Mann-Whitney U test [25].
The size of the cells decreased as a linear function of leaf position in plants with or without NO2 treatment (Figure 2B). This suggests that increase in cell size is a linear function of leaf age. Presence or absence of NO2 did not affect this result. Student’s t test showed that these results in the cell size at all positions, except leaf 2, were statistically significant (Figure 2B) [25].
The ratio of the cell size of +NO2-treated plants to that of the –NO2 control plants at the corresponding leaf position (designated RCS) was calculated. The RCS of leaves 12–25 (2.0–3.2) was larger than that of leaves 1–11 (1.3–1.9). This difference in RCS between leaves 12–25 and 1–11 was significant statistically (P < 0.01) by Mann-Whitney U test. This finding is in line with our previous observation that NO2 exerts a greater effect on leaf expansion in younger leaves than in older leaves [24].
Cell number as a function of leaf position exhibited a normal distribution for both the +NO2-treated plants and–NO2 control plants (Figure 2C). Plants with or without NO2 treatment did not show significant differences in cell numbers in almost all maturing leaves (positions 1–11, except leaf 4). This suggest that the NO2 treatment did not affect cell numbers in the leaves in maturity. Almost all younger leaves (positions 13–24 of leaves 12–25) showed statistically significant differences in cell number, suggesting that NO2 did increase cell numbers in developing leaves.
The ratio of the cell number of the +NO2-treated plants to that of the –NO2 control plants at the corresponding leaf position (designated RCN) was calculated. Leaves 12–25 had larger RCN (1.2–3.1) than that of leaves 1–11 (0.9–1.5). This difference in RCN between leaves 12–25 and 1–11 was found to be significant (P < 0.01) by the Mann-Whitney U test [25]. This observation indicated that the effect of NO2 on cell proliferation changed depending on developmental stage of the leaves, and was greater in younger leaves than in older leaves.
To investigate the correlations between ratio in leaf area and the ratio in cell size (or cell number), log(RLA), log(RCS) and log(RCN) values were calculated and analyzed using Pearson’s correlation analysis and Bonferroni’s correction (Table S2). The correlation between leaf area and cell size was found to be high and significant in leaves 1–25 (R = 0.9, P < 0.001). Interestingly enough, the correlation between leaf areas and cell size was found to be stronger in older leaves than in younger leaves; R = 0.7, P < 0.05 for 1–11 leaves, while R = 0.3, P > 0.5 for 12–25 leaves (Table S2). This means that the correlation between NO2-induced leaf expansion and cell size expansion was higher in older leaves than in younger leaves. Leaf area and cell number in leaves 1–25 were found to have a significantly high correlation (R = 0.9, P < 0.001). The same was found to be true when developing (12–25) (R = 0.9, P < 0.001) and maturing (1–11) (R = 0.7, P < 0.05) leaves were separately analyzed (Table S2) [25].
Thus, NO2-induced leaf expansion correlated well with cell proliferation in both younger and older leaves. It is concluded that NO2-mediated leaf expansion can largely be ascribed to cell proliferation in younger leaves, while the NO2 effect can be ascribed to both cell proliferation and enlargement in older leaves [25].

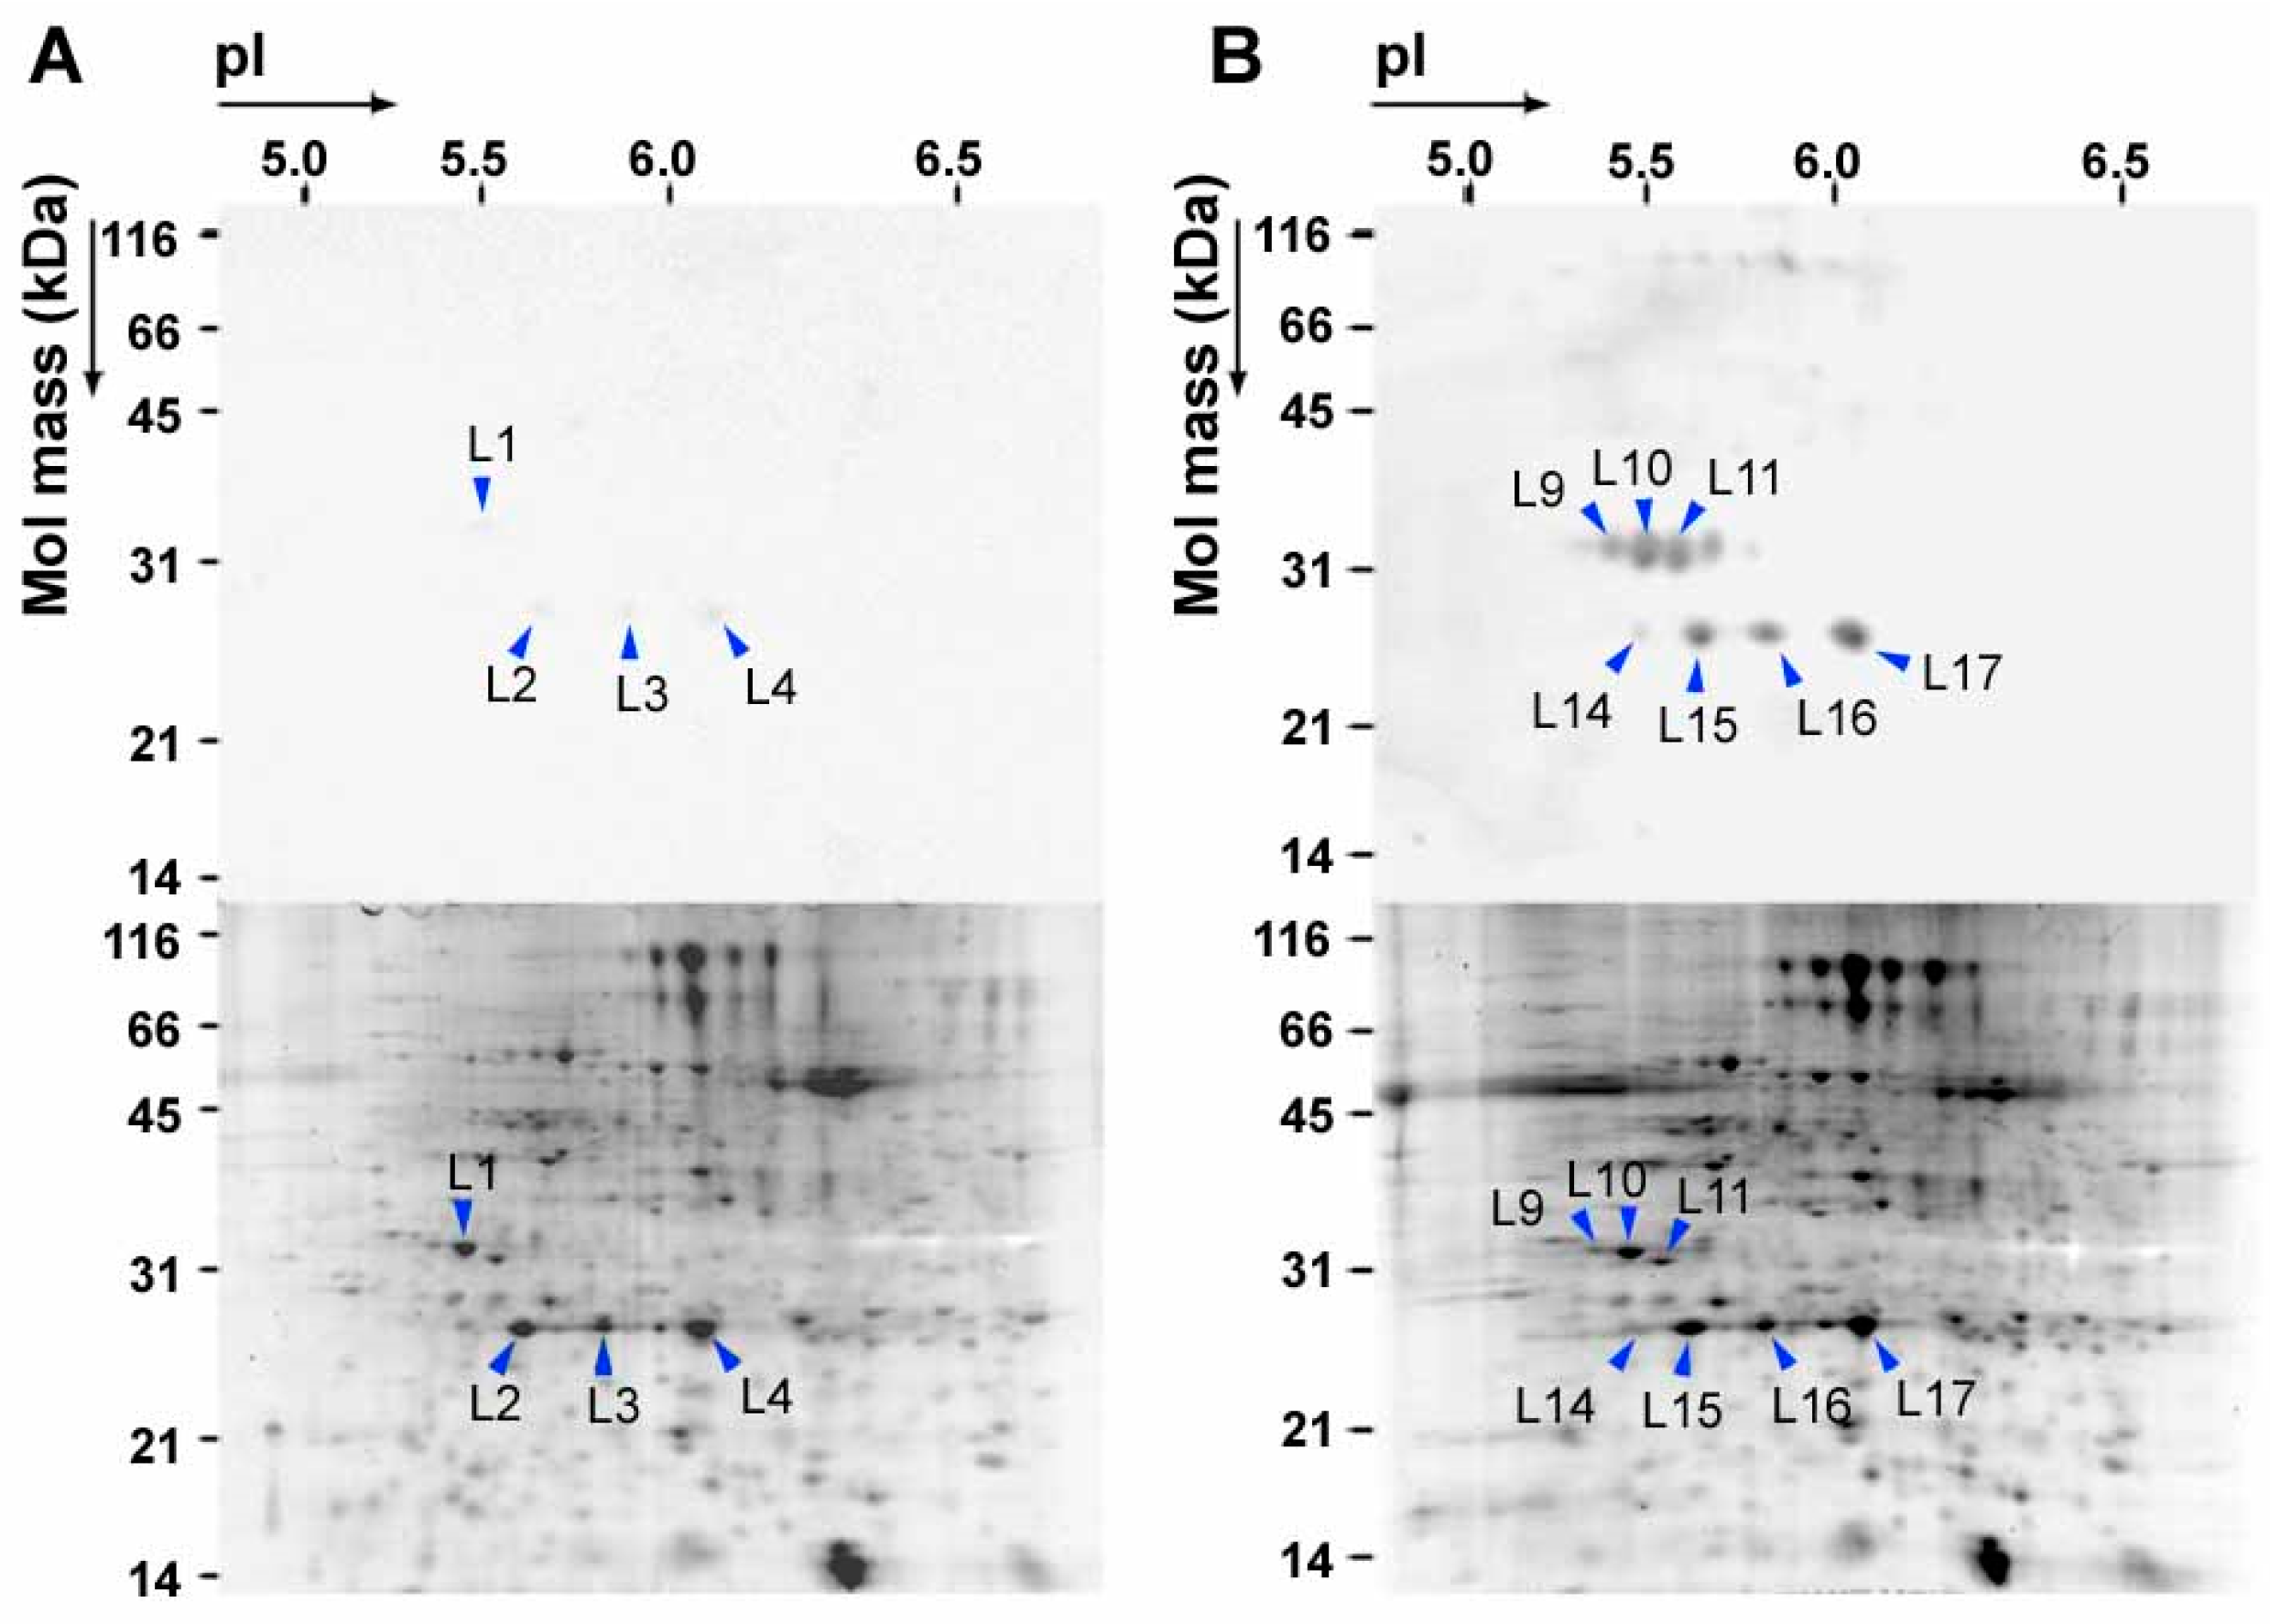
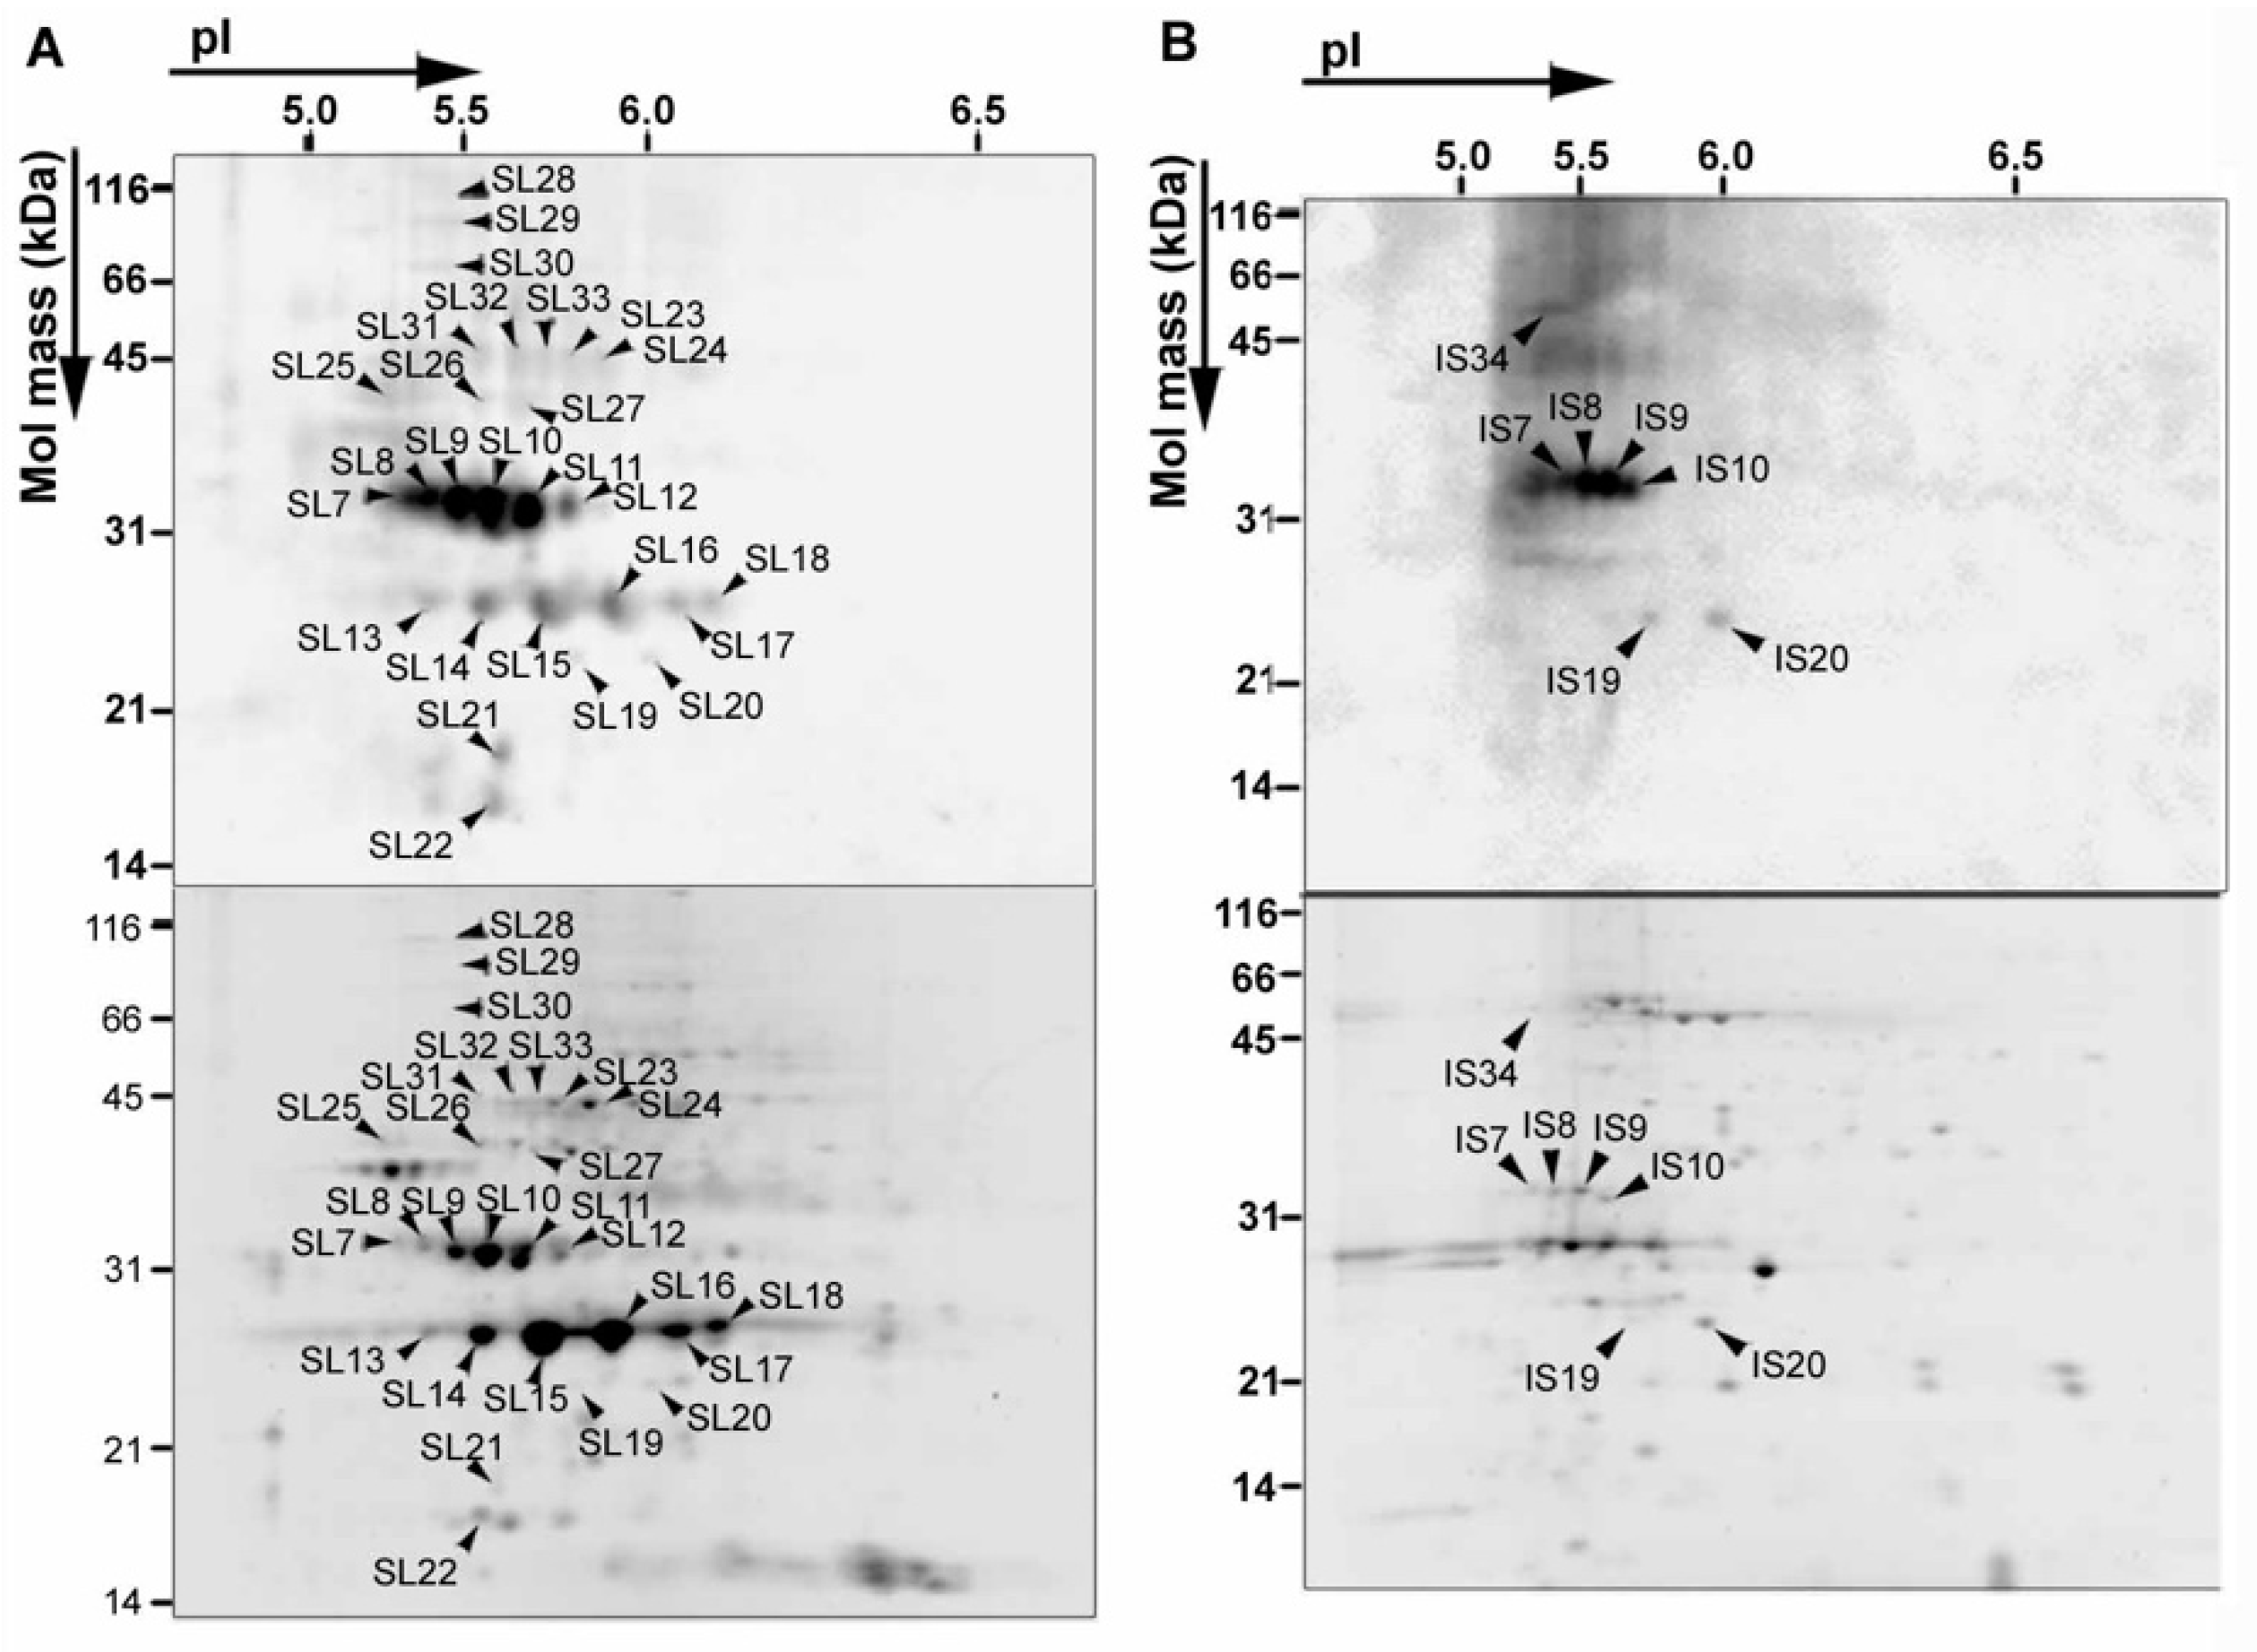
3. NO2 Selectively Nitrates Specific Cellular Proteins in Arabidopsis Leaves

Nitration of protein tyrosine is the addition of a nitro group on the carbon-3 of tyrosine residues of proteins to produce 3-nitrotyrosine (3-NT), which accompanies a drastic decrease (from 10.0 to 7.2) in the pKa of the tyrosine hydroxy group. Protein tyrosine nitration is an important post-translational modification in cell physiology, including cellular signaling [46,47]. According to a free radical mechanism [46,47,48], prior to their nitration, tyrosine residues are oxidized to tyrosyl radicals by an oxidation mechanism. Tyrosyl radicals undergo rapid radical-radical combination with NO2 radicals that exist in the close vicinity of the tyrosyl radicals to produce 3-NT. Nonetheless, biological protein nitration is not a simple chemical process, but is instead a characteristic selective process in which only a restricted number of proteins are nitrated [46,47,48].
Selectivity of protein nitration is central for protein nitration to play a vital role in signal transduction that reflects the cellular redox state [46,47,48,49,50]. Selectivity of protein tyrosine nitration has been investigated mainly in mammals [45,46,47,50,51]. Although a number (12–127 kinds) of plant proteins are reported to be nitratable [47,51,52,53], experimental substantiation on this issue in plant protein nitration is rather scarce. NO2 is a potent nitrating agent that nitrates tyrosine residues on proteins to yield NT [54,55] (see Section 4). Furthermore, NO2 is a hydrophobic molecule (less hydrophobic than NO but more so than carbon dioxide), and thus is almost freely permeable to cell membranes [56]. In addition to its signaling role in plant growth, NO2 is an in vivo intermediate involved in biological protein tyrosine nitration in animals [51] and plants [49]. Therefore, we used NO2 as a nitrating agent; for the sake of facilitating nitrated protein and nitration site identification, plants were exposed to high (4–40 ppm) concentrations of NO2 [57].
Arabidopsis (accession C24) plants were exposed to air containing or not containing 40 ppm NO2 for 8 h under illumination. Proteins were extracted from whole leaves (abbreviated as whole leaf protein). Alternatively, chloroplasts were isolated and fractionated into soluble (stromal and lumenal) and insoluble (thylakoid membrane) fractions, and proteins were extracted from each fraction (abbreviated as chloroplast protein) [57]. Proteins were analyzed using two-dimensional polyacrylamide gel electrophoresis (2D PAGE), followed by staining with SYPRO Ruby stain and Western blotting using a 3-NT-specific antibody.
The 2D PAGE images of whole leaf proteins and chloroplast proteins are shown in Figure 3 and Figure 4, respectively. The relative intensities of spots on Western blots (abbreviated as RISI), and those of the spots on SYPRO Ruby gels (abbreviated as RISS) were determined. Nitrated proteins identified in chloroplast protein fractions and their electrophoretic and proteomic characteristics are summarized in Table S3. Proteins that showed a high RISI and/or a high RISI/RISS were concluded to be selectively nitrated [57]. Seven 3-NT-positive spots were detected on a Western blot of whole leaf proteins from exposed leaves (Figure 3), all of which were identified as PsbO1, PsbO2 or PsbP1 by peptide mass fingerprinting (PMF) [57].
PsbO and PsbP are external proteins localized on the stromal side of the thylakoid membrane in PSII. PsbO and PsbP stabilize the oxygen-evolving complex (OEC) of PSII together with other external proteins, including PsbQ and PsbR [58,59,60]. No nitration of PsbQ or PsbR was detected. Thus, nitration was specific to PsbO and PsbP, while their RISI/RISS ratio was low (≤ 1.5) (Table S3). Non-exposed control plants exhibited very faint 3-NT-positive spots.
The number of 3-NT-positive spots was markedly increased in purified and fractionated chloroplast proteins (Figure 4, Table S3) [57]. Distinct 3-NT-positive protein spots were lined at 32 kDa (SL7–12), and distinct but clearly visible spots were lined at 27 kDa (SL13–18) on the Western blot of the soluble (stromal and lumenal) chloroplast protein fraction from +NO2-treated plants (Figure 4A, upper panel). Lined spots of less in number at 32 kDa (IS7–10) were detected on the Western blot of the thylakoid membrane protein fraction from +NO2-treated plants (Figure 4B, upper panel). PsbO and PsbP accounted for > 80% of the total RISI values [Table S3], and high RISI/RISS ratios (2.5–6.6) were exhibited by four non-PSII proteins such as peroxiredoxin II E (PRXII E) (spot SL21), thylakoid lumenal protein (SL22), RuBisCO activase (RCA, SL31), and the delta subunit of chloroplast ATP synthase (SL19) [Table S3]. Thus, PsbO, PsbP and these four non-PSII proteins are concluded to be selectively nitrated.
Despite that use of purified/fractionated chloroplast proteins markedly increased the number of 3-NT positive spots on Western blots (Figure 4), no 3-NT-positive spots attributable to other extrinsic (such as PsbQ and PsbR) or intrinsic (such as D1 and D2) proteins of PSII were detected, and nor were 3-NT-positive spots attributable to RuBisCO subunits (Figure 4, Table S3). Thus, NO2 selectively nitrates two PSII and four non-PSII proteins in Arabidopsis. PMF analysis using MALDI-TOFMS provided evidence that the ninth tyrosine residue (9Tyr) of PsbO1 is a nitration site [57].

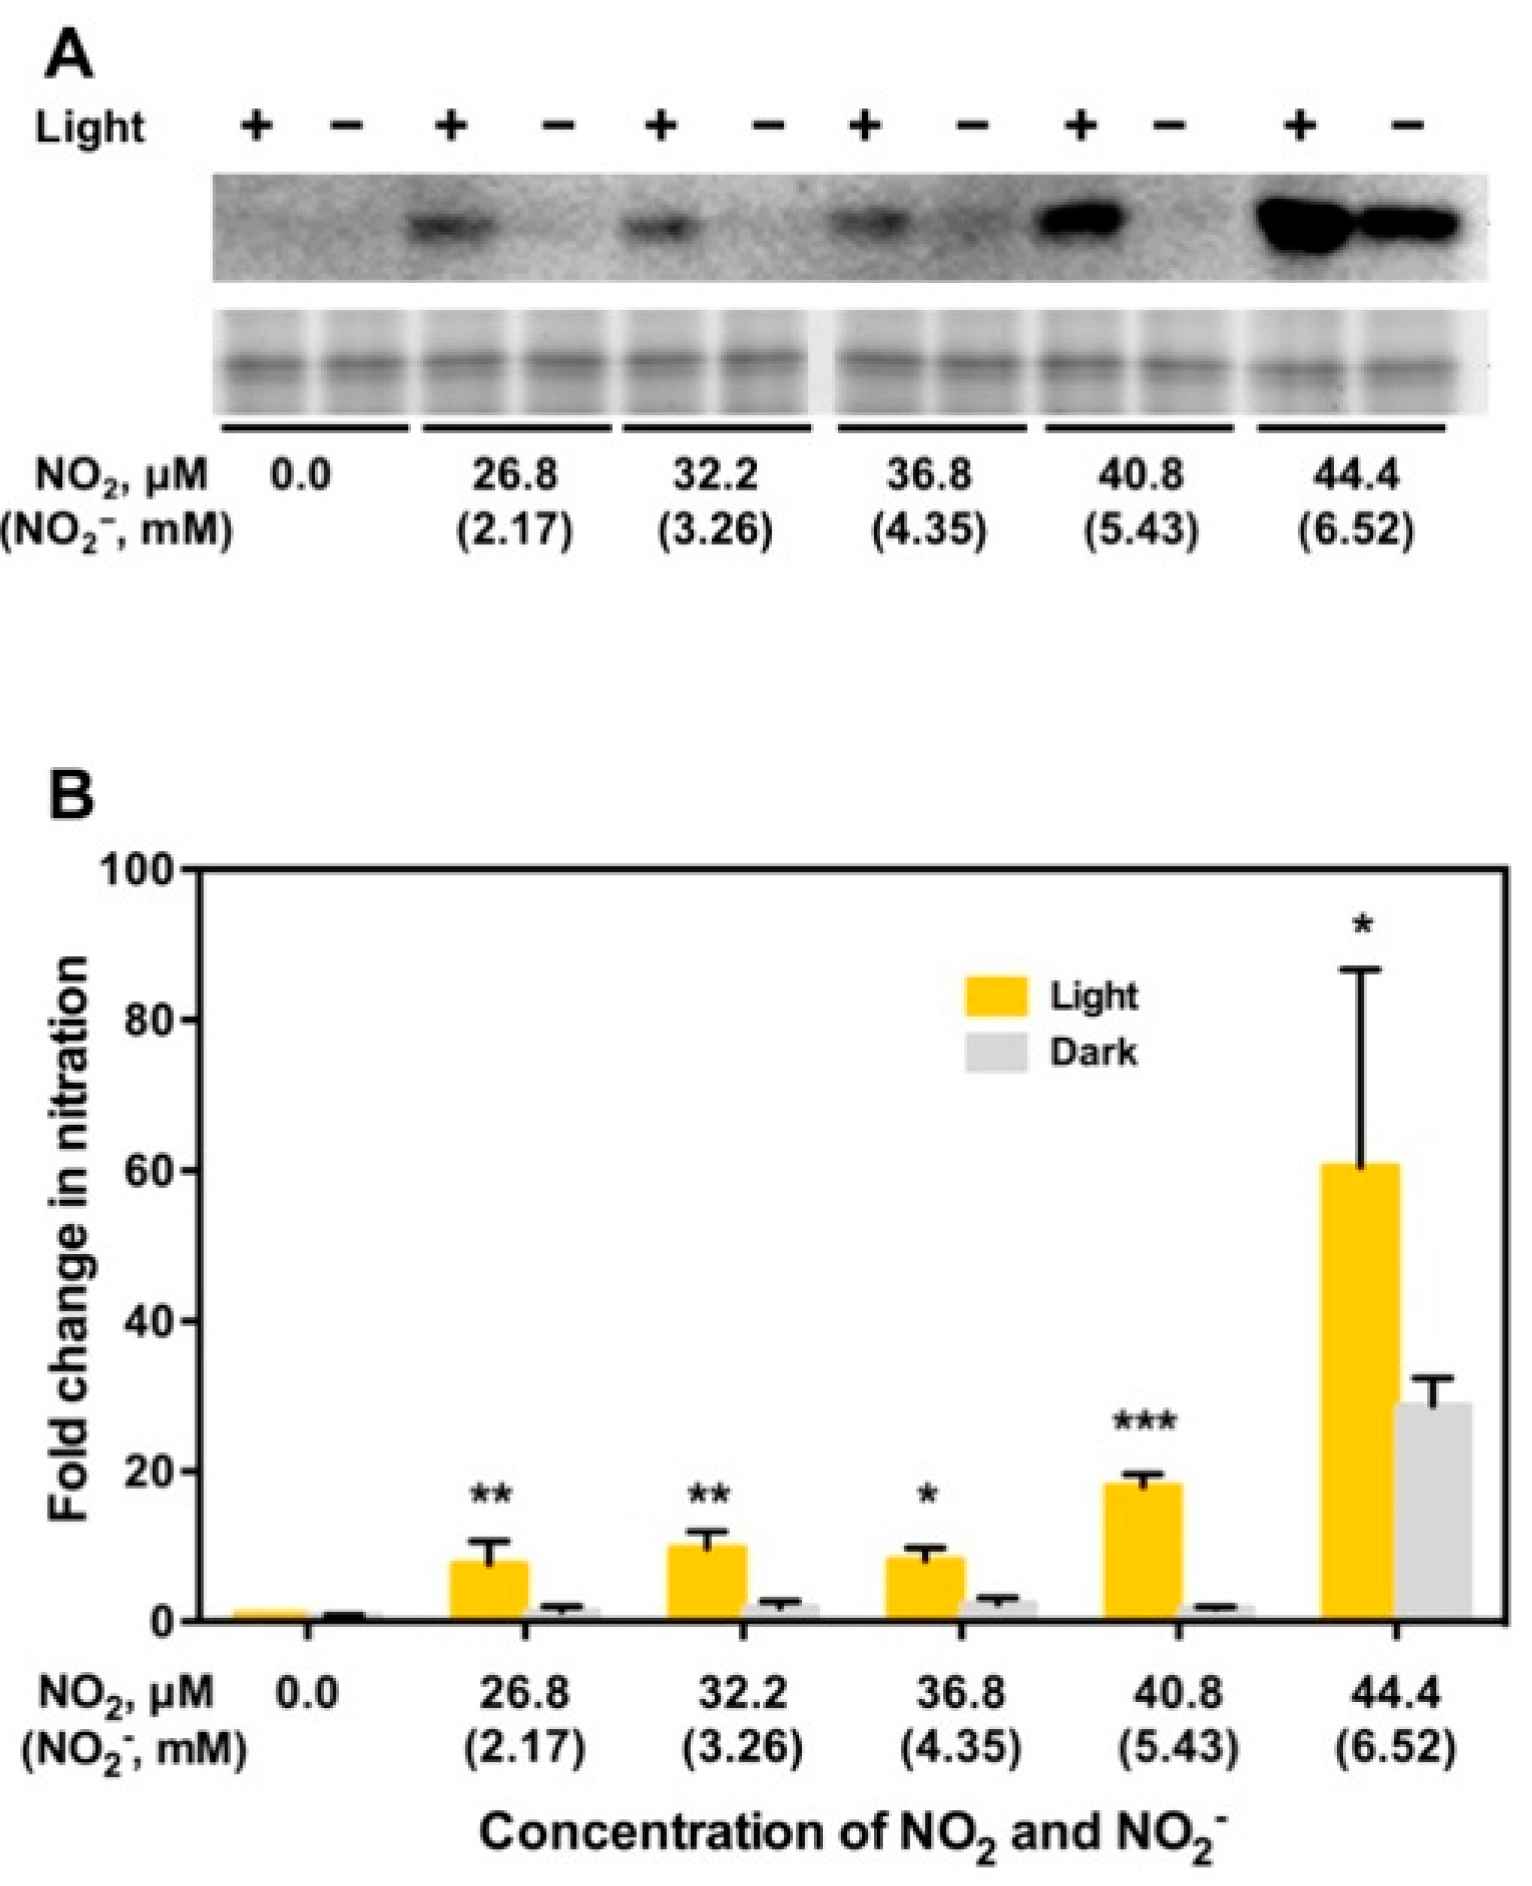
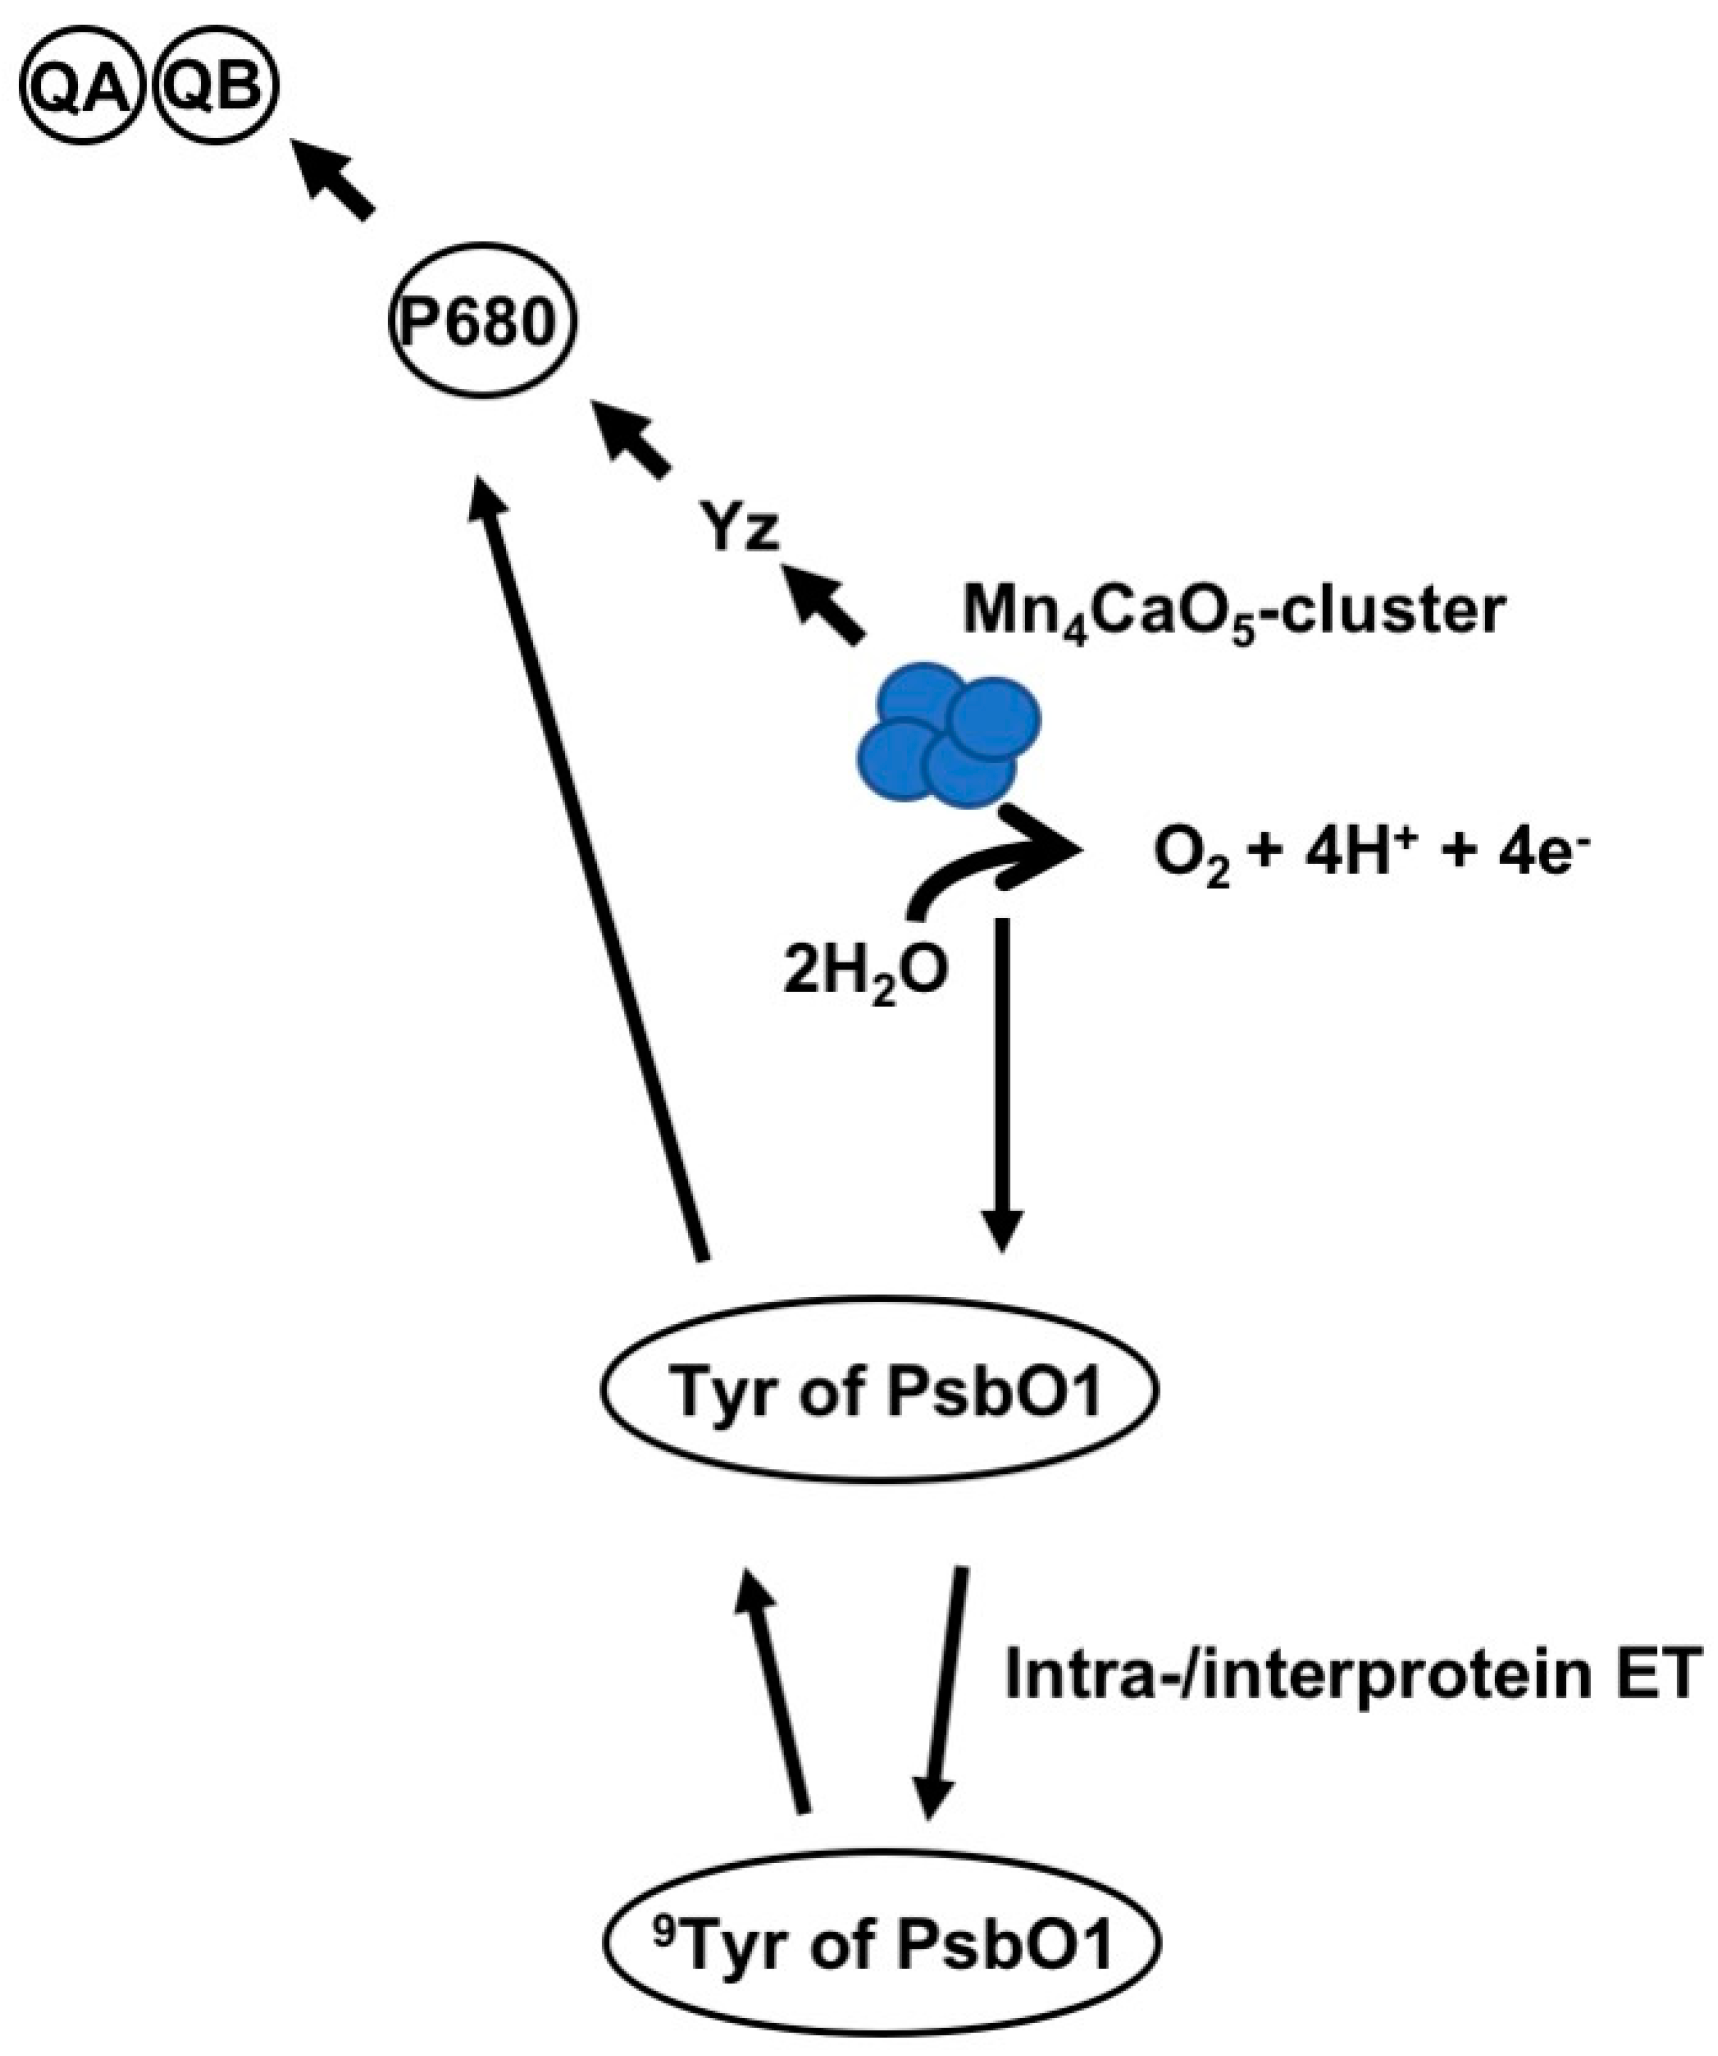
4. PsbO1 May Function as an Electron Element Like Yz in PSII Electron Transport Chain

To investigate the physiological significance of protein nitration, thylakoid membranes were isolated from Arabidopsis leaves and incubated in a buffer solution bubbled with NO2 gas or a buffer solution of potassium nitrite (KNO2). The former buffer contains NO2 and nitrite (NO2), while the latter contains NO2- alone [61]. NO2 dissociates in water as shown in reaction 1 [62], as described previously [61]. Concentrations of NO2 in the buffer were quantified by numerical solution of kinetic Equations (1)–(3). Nitrite (NO2) concentrations in the buffer were quantified by capillary electrophoresis [63].
NO 2 k 1 k 2   N 2 O 4 k 3 NO 2 + NO 3
d [ NO 2 ] d t = 2 k [ NO 2 ] 2 + 2 k 2 [ N 2 O 4 ]
d [ N 2 O 4 ] d t = k 1 [ NO 2 ] 2 - k 2 [ N 2 O 4 ] - k 3 [ N 2 O 4 ]
d [ NO 2 - ] d t = k 3 [ N 2 O 4 ]
where k1, k2 and k3 are rate constants 4.5 × 10⁸ mol−1 s−1, 6.4 × 10³ s−1, and 103 s−1, respectively [62].
A distinct 3-NT-positive band of 32.5 kDa was detected on a Western blot of proteins extracted from thylakoid membranes that were incubated in a buffer containing NO2 and NO2 under illumination (Figure 5A). This band was assigned to PsbO1 by liquid chromatography/mass spectrometry (LC/MS), followed by a Mascot search analysis [64]. On the other hand, no such band was detected following incubation thylakoid membranes in the same buffer in the dark at all concentrations of NO2 and NO2 (Figure 5). Thus, illumination is essential in NO2/NO2-mediated protein nitration. The intensities of the PsbO1 band on the Western blots were quantified using PDQuest software (ver. 7.0; Bio-Rad, Hercules, CA, USA) [64]. The intensity of the 3-NT-positive PsbO1 band after incubation in a buffer containing NO2 and NO2 was divided by the intensity of the 3-NT-positive PsbO1 band before incubation in the buffer. This value was designated fold-change in the PsbO1 band intensity, and plotted against the concentrations of NO2 and NO2 (Figure 5B). Incubation in the dark resulted null intensity of PsbO1 band at all concentrations of NO2 and NO2–except 44.4 μM NO2 and 6.52 mM NO2 (Figure 5). This confirms that illumination is essential in NO2/NO2-mediated protein nitration of PsbO1 in Arabidopsis thylakoid membranes.
Redox-active tyrosines play a key role in the photosynthetic electron in PSII. Yz (161Tyr of the D1 protein) in PSII is the most well-studied redox-active tyrosine residue in plants. Under illumination, it donates an electron to the PSII electron transport chain and itself is oxidized to tyrosyl radical [65,66]. It is reduced back to tyrosine by an electron derived from oxidation of water at the OEC. Thus, Yz functions as an electron relay element between P680 and OEC Mn4 cluster (Mn4Ca) through photosynthetic electron transfer [67]. Another tyrosine that has a similar function, YD (161Tyr of the D2 protein), is also known [65,66].
In light of our finding of the illumination-triggered nitration of 9Tyr of PsbO, it is conceivable that this tyrosine residue of PsbO1 is also redox-active, and that the photosynthetic electron transport chain can oxidize, upon illumination, this tyrosine residue to tyrosyl radical that is highly sensitive to nitration. The formed tyrosyl radical may rapidly react with NO2 to yield 3-NT. Therefore, we hypothesized a nitration mechanism that prior to nitration PSII photosynthetic electron transport, in response to illumination, oxidizes the nitratable tyrosine residue of PsbO1 to tyrosyl radical to react with NO2 to yield 3-NT [64].
Thylakoid membranes were incubated in a buffer containing NO2 and NO2 in the presence or absence of electron transport inhibitors such as 3-(3,4-dichlorophenyl)-1,1-dimethylurea (DCMU), sodium azide and 1,5-diphenylcarbazide (DPC). Proteins were extracted from the treated thylakoid membranes, nitration of PsbO1 was determined by quantification of intensity of PsbO1 band. The results are shown in Figure 6. Fold-change in PsbO1 band intensity is given by (intensity of PSBO1 band after incubation in a buffer containing NO2 and NO2)/(intensity of PSBO1 band before incubation in the buffer). DCMU inhibits the photosynthetic electron transport by inhibiting binding of plastoquinone [68], and decreased the fold-change in PsbO1 band intensity to about one-fifth of the control value (Figure 6). Azide inhibits the photosynthetic electron transport by inhibiting a variety of reactions, including oxidation of water [69]. Azide also decreased the fold-change in PsbO1 band intensity to one-tenth of the control value (Figure 6). DPC inhibits the photosynthetic electron transport by inhibiting photosynthetic electron flow [70]. DPC decreased the fold-change in PsbO1 band intensity to one-tenth of the control value (Figure 6). Our present findings that nitration of PsbO1 was substantially inhibited by photosynthetic electron transport inhibitors substantiate our postulated nitration mechanism, whereby nitratable tyrosine residue of PsbO1 undergoes one-electron oxidation to tyrosyl radical that is highly reactive with NO2 under illumination through PSII photosynthetic electron transport.
We next investigated oxygen evolution from isolated thylakoid membranes that had been treated or not treated with a buffer containing NO2 and NO2 [71]. This buffer contained NO2 and NO2 as nitrating agent [61]. As it is reported that nitrite anion inhibits PSII to decrease oxygen evolution [72,73,74], it is necessary to separately evaluate these two effects of nitrite on the oxygen evolution. Thylakoid membranes isolated from Arabidopsis leaves were incubated in a buffer containing NO2 and NO2 or a buffer containing NO2 alone in the light or in the dark [71]. After incubation, each of the treated thylakoid membrane samples was divided into two portions. The first portion was analyzed for nitration of PsbO1 by Western blotting using 3-NT-specific antibody. The intensity of the 3-NT-positive PsbO1 band was quantified. Using the second portion, oxygen evolution was quantified [71]. Results are shown in Figure 7.
Incubation of thylakoid membranes in a buffer containing NO2 alone at concentrations higher than 3.80 mM NO2 did not decrease oxygen evolution to null, but decreased it to one-third to half of the initial value (Figure 7B). On the other hand, oxygen evolution was decreased to almost null when co-existing NO2 concentration exceeded 34.6 μM (Figure 7B). This indicates that the effect of NO2 higher than 34.6 μM exceeds the effect of NO2 to inhibit oxygen evolution when thylakoid membranes were incubated in a buffer containing NO2 and NO2. This decrease in oxygen evolution is primarily ascribable to nitration of PsbO1 by NO2. This substantiates our hypothesis [71,75] that PsbO1 functions as an electron element, like Yz in photosynthetic electron transport.
In light of the present findings regarding the nitration characteristics of 9Tyr of PsbO1, selectivity, light dependence, inhibitor-inhibitable and inhibiting oxygen evolution [61,71], and the widely accepted free radical mechanism of tyrosine nitration [45,46], we suggest that illumination induces selective and preferential photo-oxidation of 9Tyr of PsbO1, similar to Yz. 9Tyr may act as an electronic element, similarly to Yz in PSII electron transport chain.
The 3D structure for plant PSII from pea [76] is the only currently available crystal structure of higher-plant PSII. Using this structure for plant PSII from pea [76] and a molecular graphics software (PyMOL Molecular Graphics System Software, ver. 2.0.7; Schrödinger, New York, NY, USA), 9Tyr of PsbO1 and the OEC were calculated to be 36.1Å apart. This is approximately five times greater than the distance between Yz and the OEC Mn4 cluster (Mn4Ca) (7.5–8.0 Å) [77,78], making it too large for direct interactions [77,79] between the 9Tyr of PsbO1 and OEC. However, electron transfer via peptide bonds as distant as more than 40 Å is reported [80]. Furthermore, a 134-Å electron transfer through the helical peptide was also reported [81]. In these cases, the amide groups reportedly act as quantum mechanical hopping sites for electron transfer. Long-range inter-protein electron transfer such as from cytochrome c to cytochrome c peroxidase has also been reported [82]. Moreover, electron transfer between the photosynthetic reaction center and cytochrome c across in Rhodobacter sphaeroides has been reported [83]. Taken together, inter-protein electron transfer plays a vital role in cellular metabolism including photosynthesis [82,83]. It is therefore postulated that long-range intra- and inter-protein electron transfer from PSII Mn cluster→9Tyr of PsbO1→P680+ (PSII primary electron donor) could support a hypothesis that 9Tyr of PsbO1 functions as an electronic element, like Yz, in PSII electron transport (Figure 8) [75].

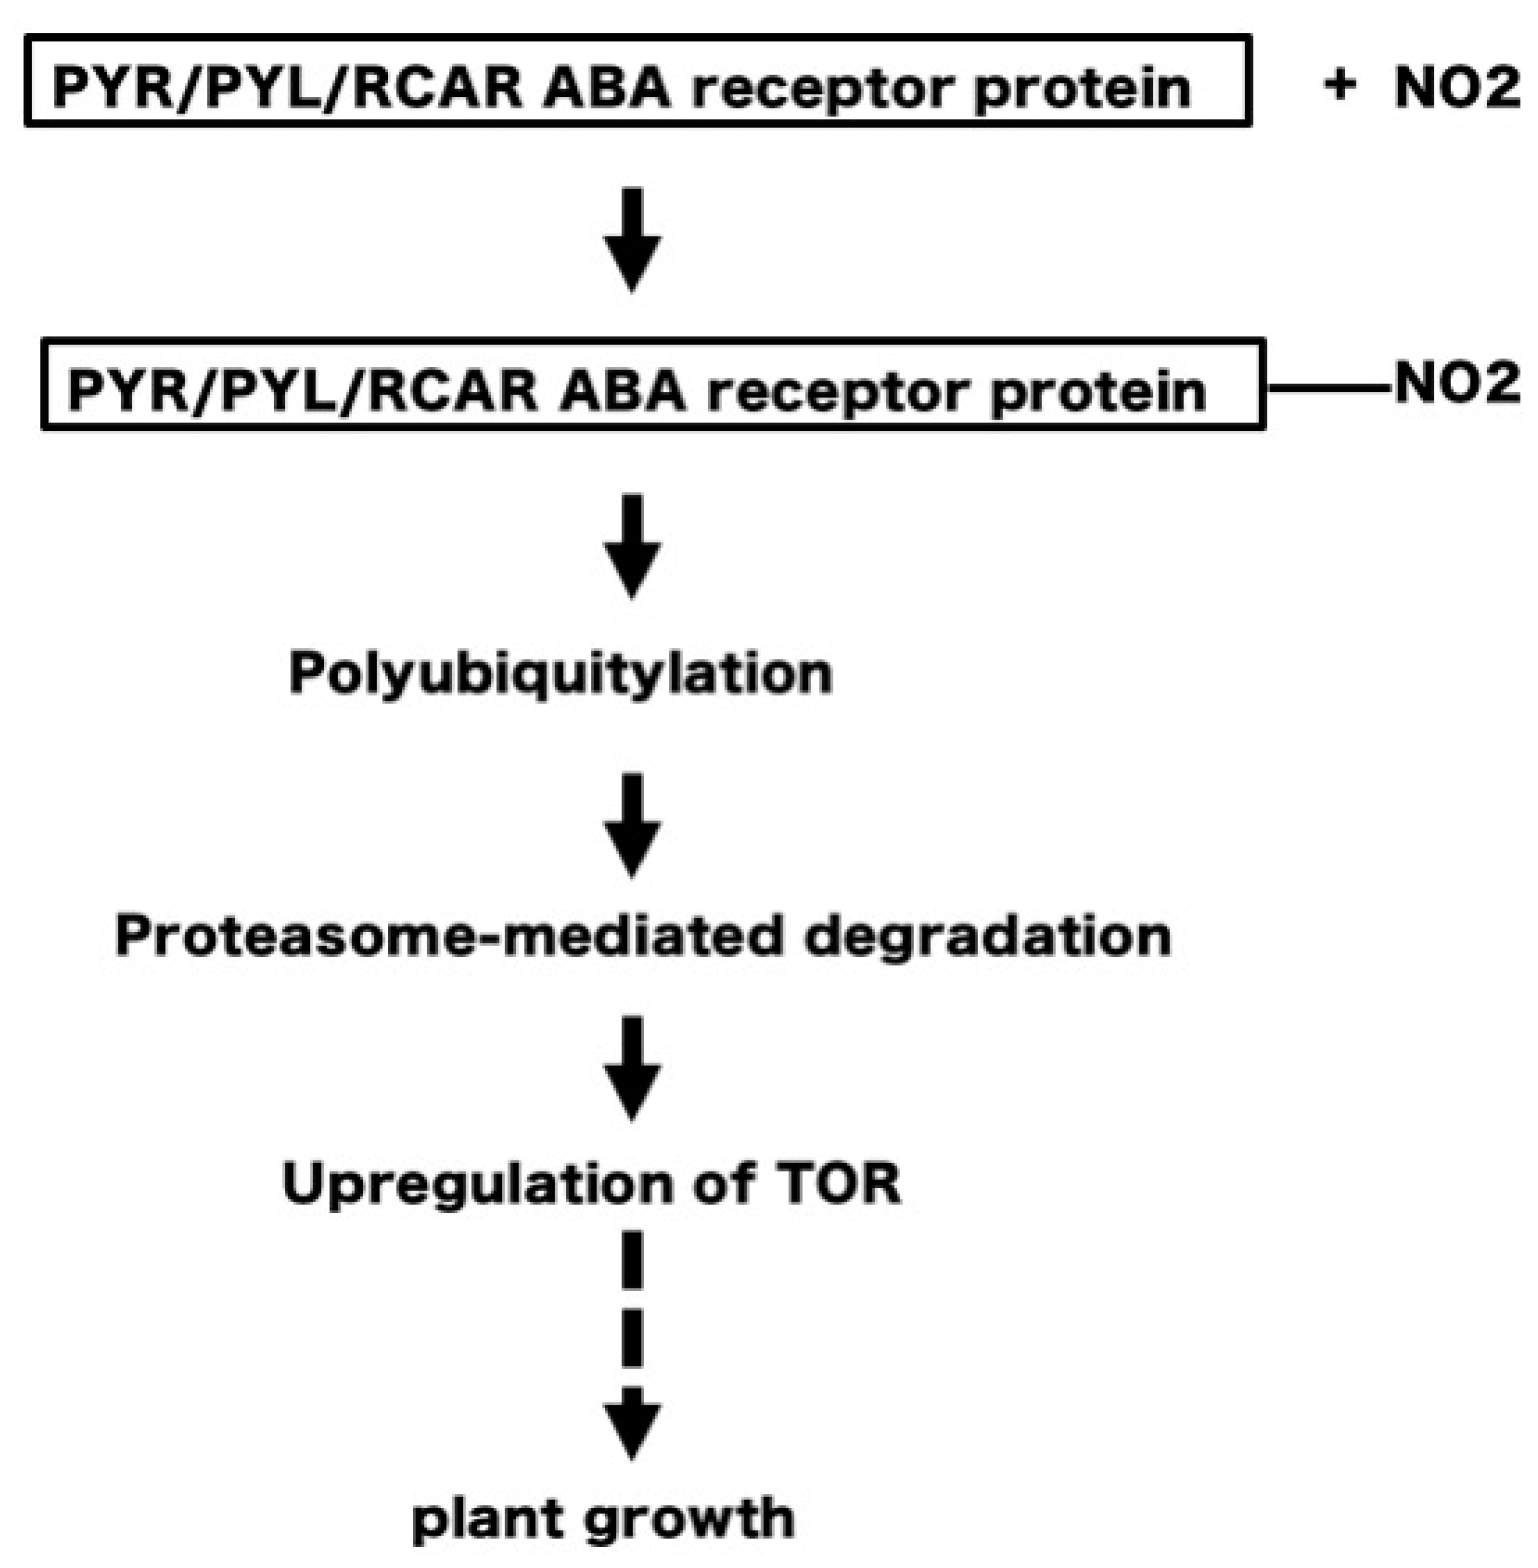
5. NO2 May Induce Tyrosine Nitration of PYR/PYL/RCAR ABA Receptors Leading to Degradation of the Receptors and Upregulation of TOR, to Stimulate Plant Growth

Our finding that NO2-induced nitration of PsbO1 results in reduced oxygen evolution from Arabidopsis thylakoid membranes shows that protein tyrosine nitration alters (downregulates) the physiological function cellular proteins of Arabidopsis leaves. This finding indicates that NO2-induced protein tyrosine nitration may be involved in NO2-stimulated plant growth. However, as the concentration of NO2 used in the study of plant growth (10–50 ppb) was about 800-4000 times lower than that used in the study of protein nitration (40 ppm), further investigations are required to clarify the physiological significance of the NO2-mediated nitration of cellular proteins.
Protein nitration always inhibits protein function in plants [49,84]. In mammalian cells, protein nitration also usually inhibits protein function [45,46,47,50,51], as in plants, but rarely results in gain-of-function of proteins [51]. It remains unknown how protein nitration, a negative regulator, stimulates plant growth. This question is similar to the fundamental and long-standing question as to why an air-pollutant and toxic compounds, such as NO2, act as a positive signal for plant growth. Inhibition of negative factors should induce plant growth. Figure 9 depicts a hypothetical model of how NO2-induced protein nitration stimulates plant growth. The rationale for this model is as follows:
Plant growth requires the orchestration of a variety of cellular processes, which are controlled by regulatory proteins such as the serine/threonine protein kinase target of rapamycin (TOR), which forms complexes with regulatory proteins [82,85,86]. TOR plays a central role in auxin signal transduction in Arabidopsis [87]. TOR is downregulated by the plant hormone abscisic acid (ABA). ABA detection and signaling are mediated by the pyrabactin resistance1/PYR1-like/regulatory components of the ABA receptor (PYR/PYL/RCAR) family [83,88,89]. Tyrosine nitration of PYR/PYL/RCAR proteins reportedly results in polyubiquitylation and proteasome-mediated degradation [89]. Thus, the degradation of PYR/PYL/RCAR receptor proteins eventually results in upregulation of TOR and stimulation of plant growth [85]. Therefore, it is conceivable that NO2 may induce tyrosine nitration of PYR/PYL/RCAR proteins, to degrade these proteins and upregulate TOR regulatory complexes to stimulate plant growth (Figure 9).

6. Future Perspectives

In future studies, antibody-assisted proteomic analysis is needed of nitratable proteins in Arabidopsis leaves that are exposed to low concentrations of NO2 (10–50 ppb), to ascertain whether PYR/PYL/RCAR proteins from Arabidopsis leaves are nitratable at such low concentrations of NO2. Future studies should also investigate whether auxin signal transduction in Arabidopsis leaves [90] is increased following exposure to ambient concentrations of NO2. In both cases, special care is needed to ensure that the samples are always isolated from ambient air that contains 10–50 ppb NO2. If NO2-mediated nitration of PYR/PYL/RCAR proteins cannot be detected, or the involvement of TOR/ABA in NO2-mediated plant growth stimulation cannot be ascertained, other target proteins of NO2, such as hexokinase-like (HKL) proteins [91], a negative effector of plant growth in Arabidopsis, should be investigated in Arabidopsis leaves.

Supplementary Materials

The following are available online at https://www.mdpi.com/2223-7747/8/7/198/s1, Table S1: Shoot biomass (mg), total leaf area (mm2), and content (µg/shoot) of carbon (C), nitrogen (N), phosphorus (P), potassium (K), calcium (Ca), magnesium (Mg), and sulfur (S) in 5-week-old Arabidopsis thaliana C24 plants grown with (+NO2-treated plants) and without (–NO2 control plants) NO2 treatment, Table S2: Correlation analysis between leaf area (RLA) and cell size ( RCS), and that between leaf area (RLA) and cell number RCN), Table S3: Identified nitrated proteins and their electrophoretic and mass spectrometric characteristics in chloroplast proteins extracted from Arabidopsis thaliana leaves exposed to NO2.

Author Contributions

Writing—original draft preparation, M.T.; editing, H.M.

Funding

This work was supported by a grant from the Nippon Life Insurance Foundation (to MT), a grant from the Nissan Science Foundation (to MT), a Grant-in-Aid for Creative Scientific Research from the Japan Science and Technology Agency (no. 13GS0023 to HM), a Grant-in-Aid for Scientific Research from the Japan Society for the Promotion of Science (no. 15710149 to MT) and a grant from the Naito Foundation (to MT).

Acknowledgments

We appreciate financial supports from the Nippon Life Insurance Foundation (to MT), a grant from the Nissan Science Foundation (to MT), a Grant-in-Aid for Creative Scientific Research from the Japan Science and Technology Agency (no. 13GS0023 to HM), a Grant-in-Aid for Scientific Research from the Japan Society for the Promotion of Science (no. 15710149 to MT) and a grant from the Naito Foundation (to MT).

Conflicts of Interest

The authors declare no conflict of interest.

References

  1. Aneja, V.P.; Roelle, P.A.; Murray, G.C.; Southerland, J.; Erisman, J.W.; Fowler, D.; Asman, W.A.H.; Naveen Patni, H. Atmospheric nitrogen compounds II: Emissions, transport, transformation, deposition and assessment. Atmos. Environ. 2001, 35, 1903–1911. [Google Scholar] [CrossRef]
  2. Oswald, R.; Behrendt, T.; Ermel, M.; Wu, D.; Su, H.; Cheng, Y.; Breuninger, C.; Moravek, A.; Mougin, E.; Delon, C.; et al. HONO emissions from soil bacteria as a major source of atmospheric reactive nitrogen. Science 2013, 6151, 1233–1235. [Google Scholar] [CrossRef] [PubMed]
  3. United States Environmental Protection Agency Home Page Integrated Science Assessment for Oxides of Nitrogen—Health Criteria (2016 Final Report). Available online: https://cfpub.epa.gov/ncea/isa/recordisplay.cfm?deid=310879 (accessed on 1 January 2019).
  4. World Health Organization. Home Page. Available online: http://www.who.int/mediacentre/factsheets/fs313/en/ (accessed on 1 January 2019).
  5. NationMaster Home Page. Available online: http://www.nationmaster.com/index.php (accessed on 1 January 2019).
  6. Klepper, L. Nitric oxide (NO) and nitrogen dioxide (NO2) emissions from herbicide-treated soybean plants. Atmos. Environ. 1979, 13, 537–542. [Google Scholar] [CrossRef]
  7. Dean, J.V.; Harper, J.E. Nitric oxide and nitrous oxide production by soybean and winged bean during the in vivo nitrate reductase assay. Plant Physiol. 1986, 82, 718–723. [Google Scholar] [CrossRef] [PubMed]
  8. Wildt, J.; Kley, D.; Rockel, A.; Rockel, P.; Segschneider, H.J. Emission of NO from several higher plant species. J. Geochem. Res. 1997, 102, 5919–5927. [Google Scholar] [CrossRef]
  9. Hari, P.; Raivonen, M.; Vesala, T.; Munger, J.W.; Pilegaard, K.; Kulmala, M. Atmospheric science: Ultraviolet light and leaf emission of NO(x). Nature 2003, 422, 134. [Google Scholar] [CrossRef] [PubMed]
  10. Yoneyama, T.; Sasakawa, H. Transformation of atmospheric NO2 absorbed in spinach leaves. Plant Cell Physiol. 1979, 20, 263–266. [Google Scholar]
  11. Yoneyama, T.; Sasakawa, H.; Ishizuka, S.; Totsuka, T. Absorption of atmospheric NO2 by plants and soils. Soil Sci. Plant Nutr. 1979, 25, 255–265. [Google Scholar]
  12. Breuninger, C.; Meixner, F.X.; Kesselmeier, J. Field investigations of nitrogen dioxide (NO2) exchange between plants and the atmosphere. Atmos. Chem. Phys. 2013, 13, 773–790. [Google Scholar] [CrossRef]
  13. Wellburn, A.R. Why are atmospheric oxides of nitrogen usually phytotoxic and not alternative fertilizers? New Phytol. 1990, 115, 395–429. [Google Scholar] [CrossRef]
  14. Chauhan, A.J.; Inskip, H.M.; Linaker, C.H.; Smith, S.; Schreiber, J.; Johnston, S.L.; Holgate, S.T. Personal exposure to nitrogen dioxide (NO2) and the severity of virus-induced asthma in children. Lancet 2003, 9373, 1939–1944. [Google Scholar] [CrossRef]
  15. Capron, T.M.; Mansfield, T.M. Inhibition of growth in tomato by air polluted with nitrogen oxides. J. Exp. Bot. 1977, 28, 112–116. [Google Scholar] [CrossRef]
  16. Sandhu, R.; Gupta, G. Effects of nitrogen dioxide on growth and yield of black turtle bean (Phaseolus vulgaris L.) cv. ‘Domino’. Environ. Pollut. 1989, 59, 337–344. [Google Scholar] [CrossRef]
  17. Saxe, H. Relative sensitivity of greenhouse pot plants to long-term exposures of NO- and NO2-containing air. Environ. Pollut. 1994, 85, 283–290. [Google Scholar] [CrossRef]
  18. Morikawa, H.; Higaki, A.; Nohno, M.; Takahashi, M.; Kamada, M.; Nakata, M.; Toyohara, G.; Okamura, Y.; Matsui, K.; Kitani, S.; et al. More than a 600-fold variation in nitrogen dioxide assimilation among 217 plant taxa. Plant Cell Environ. 1998, 21, 180–190. [Google Scholar] [CrossRef]
  19. von Liebig, J. Extrait d’une note sur la nitrification. Ann. Chem. Phys. 1827, 35, 329–333. [Google Scholar]
  20. Takahashi, M.; Higaki, A.; Nohno, M.; Kamada, M.; Okamura, Y.; Matsui, K.; Kitani, S.; Morikawa, H. Differential assimilation of nitrogen dioxide by 70 taxa of roadside trees at an urban pollution level. Chemosphere 2005, 61, 633–639. [Google Scholar] [CrossRef]
  21. Takahashi, M.; Sasaki, Y.; Ida, S.; Morikawa, H. Enrichment of nitrite reductase gene improves the ability of Arabidopsis thaliana plants to assimilate nitrogen dioxide. Plant Physiol. 2001, 126, 731–741. [Google Scholar] [CrossRef] [PubMed]
  22. Morikawa, H.; Takahashi, M.; Kawamura, Y. Metabolism and genetics of atmospheric nitrogen dioxide control using pollutant-philic plants. In Phytoremediation Transformation and Control of Contaminants; McCutcheon, S.C., Schnoor, J.L., Eds.; John Wiley & Sons: Hoboken, NJ, USA, 2003; pp. 765–786. ISBN 0-471-39435-1. [Google Scholar]
  23. Takahashi, M.; Morikawa, H. Air-pollutant-philic plants for air remediation. J. Environ. Prot. 2012, 3, 1346–1352. [Google Scholar] [CrossRef]
  24. Takahashi, M.; Nakagawa, M.; Sakamoto, A.; Ohsumi, C.; Matsubara, T.; Morikawa, H. Atmospheric nitrogen dioxide gas is a plant vitalization signal to increase plant size and the contents of cell constituents. New Phytol. 2005, 168, 149–154. [Google Scholar] [CrossRef]
  25. Takahashi, M.; Furuhashi, T.; Ishikawa, N.; Horiguchi, G.; Sakamoto, A.; Tsukaya, H.; Morikawa, H. Nitrogen dioxide regulates organ growth by controlling cell proliferation and enlargement in Arabidopsis. New Phytol. 2014, 201, 1304–1315. [Google Scholar] [CrossRef] [PubMed]
  26. Takahashi, M.; Morikawa, H. Nitrogen dioxide is a positive regulator of plant growth. Plant Signal. Behav. 2014, 9, e28033. [Google Scholar] [CrossRef] [PubMed] [Green Version]
  27. Adam, S.E.H.; Shigeto, J.; Sakamoto, A.; Takahashi, M.; Morikawa, H. Atmospheric nitrogen dioxide at ambient levels stimulates growth and development of horticultural plants. Botany 2008, 86, 213–217. [Google Scholar] [CrossRef]
  28. Takahashi, M.; Morikawa, H. Differential responses of Arabidopsis thaliana accessions to atmospheric nitrogen dioxide at ambient concentrations. Plant Signal. Behav. 2014, 9, e28563. [Google Scholar] [CrossRef] [PubMed]
  29. Takahashi, M.; Morikawa, H. Kinematic evidence that atmospheric nitrogen dioxide increases the rates of cell proliferation and enlargement to stimulate leaf expansion in Arabidopsis. Plant Signal. Behav. 2015, 10, e1022011. [Google Scholar] [CrossRef] [PubMed]
  30. Takahashi, M.; Morikawa, H. Nitrogen dioxide accelerates flowering without changing the number of leaves at flowering in Arabidopsis thaliana. Plant Signal. Behav. 2014, 9, e970433. [Google Scholar] [CrossRef] [PubMed]
  31. Takahashi, M.; Sakamoto, A.; Ezura, H.; Morikawa, H. Prolonged exposure to atmospheric nitrogen dioxide increases fruit yield of tomato plants. Plant Biotechnol. 2011, 8, 485–487. [Google Scholar] [CrossRef]
  32. Murashige, T.; Skoog, F. A revised medium for rapid growth and bioassays with tobacco cultures. Physiol. Plant. 1962, 15, 473–497. [Google Scholar] [CrossRef]
  33. Xu, Q.; Zhou, B.; Ma, C.; Xu, X.; Xu, J.; Jiang, Y.; Liu, C.; Li, G.; Herbert, S.J.; Hao, L. Salicylic acid-altering Arabidopsis mutants response to NO2 exposure. Environ. Contam. Toxicol. 2010, 84, 106–111. [Google Scholar] [CrossRef]
  34. Kotchoni, S.O.; Larrimore, K.E.; Mukherjee, M.; Kempinski, C.F.; Barth, C. Alterations in the endogenous ascorbic acid content affect flowering time in Arabidopsis. Plant Physiol. 2009, 149, 803–815. [Google Scholar] [CrossRef]
  35. Adam, S.E.H.; Abdel-Banat, B.M.A.; Sakamoto, A.; Takahashi, M.; Morikawa, H. Effect of Atmospheric Nitrogen Dioxide on Mulukhiya (Corchorus olitorius) Growth and Flowering. Am. J. Plant Physiol. 2008, 3, 180–184. [Google Scholar] [CrossRef] [Green Version]
  36. He, Y.; Tang, R.H.; Hao, Y.; Stevens, R.D.; Cook, C.W.; Ahn, S.M.; Jing, L.; Yang, Z.; Chen, L.; Guo, F.; et al. Nitric oxide represses the Arabidopsis floral transition. Science 2004, 305, 1968–1971. [Google Scholar] [CrossRef] [PubMed]
  37. Leshem, Y.Y.; Haramaty, E. The characterization and contrasting effects of the nitric oxide free radical in vegetative stress and senescence of Pisum sativum Linn. foliage. J. Plant Physiol. 1996, 148, 258–263. [Google Scholar] [CrossRef]
  38. Jin, C.W.; Du, S.T.; Zhang, Y.S.; Tang, C.X.; Lin, X.Y. Atmospheric nitric oxide stimulates plant growth and improves the quality of spinach (Spinaciaoleracea). Ann. Appl. Biol. 2009, 155, 113–120. [Google Scholar] [CrossRef]
  39. Morikawa, H.; Takahashi, M.; Sakamoto, A.; Matsubara, T.; Arimura, G.-I.; Kawamura, Y.; Fukunaga, K.; Fujita, K.; Sakurai, N.; Hirata, T.; et al. Formation of unidentified nitrogen in plants: An implication for a novel nitrogen metabolism. Planta 2004, 219, 14–22. [Google Scholar] [CrossRef] [PubMed]
  40. Tsuge, T.; Tsukaya, H.; Uchimiya, H. Two independent and polarized processes of cell elongation regulate leaf blade. Development 1996, 122, 1589–1600. [Google Scholar] [PubMed]
  41. Callos, J.D.; Medford, J.I. Organ positions and pattern formation in the shoot apex. Plant J. 1994, 6, 1–7. [Google Scholar] [CrossRef]
  42. Potters, G.; Pasternak, T.P.; Guisez, Y.; Palme, K.J.; Jansen, M.A. Stress-induced morphogenic responses: Growing out of trouble? Trends Plant Sci. 2007, 3, 98–105. [Google Scholar] [CrossRef] [PubMed]
  43. Granier, C.; Tardieu, F. Multi-scale phenotyping of leaf expansion in response to environmental changes: The whole is more than the sum of parts. Plant Cell Environ. 2009, 32, 1175–1184. [Google Scholar] [CrossRef] [PubMed]
  44. Kawade, K.; Horiguchi, G.; Tsukaya, H. Non-cell-autonomously coordinated organ size regulation in leaf development. Development 2010, 137, 4221–4227. [Google Scholar] [CrossRef] [Green Version]
  45. Ischiropoulos, H. Protein tyrosine nitration: An update. Arch. Biochem. Biophys. 2009, 484, 117–121. [Google Scholar] [CrossRef] [PubMed]
  46. Radi, R. Nitric oxide, oxidants, and protein tyrosine nitration. Proc. Nat. Acad. Sci. USA 2004, 101, 4003–4008. [Google Scholar] [CrossRef] [PubMed] [Green Version]
  47. Rubbo, H.; Radi, R. Protein and lipid nitration: Role in redox signaling and injury. Biochim. Biophys. Acta 2008, 1780, 1318–1324. [Google Scholar] [CrossRef] [PubMed]
  48. Corpas, F.J.; Chaki, M.; Leterrier, M.; Barroso, J.B. Protein tyrosine nitration: A new challenge in plants. Plant Signal. Behav. 2009, 4, 920–923. [Google Scholar] [CrossRef] [PubMed]
  49. Yadav, S.; David, A.; Baluška, F.; Bhatla, S.C. Rapid auxin-induced nitric oxide accumulation and subsequent tyrosine nitration of proteins during adventitious root formation in sunflower hypocotyls. Plant Signal. Behav. 2013, 8, e23196. [Google Scholar] [CrossRef] [PubMed] [Green Version]
  50. Ara, J.; Przedborski, S.; Naini, A.B.; Jackson-Lewis, V.; Trifiletti, R.R.; Horwitz, J.; Ischiropoulos, H. Inactivation of tyrosine hydroxylase by nitration following exposure to peroxynitrite and 1-methyl-4-phenyl-1,2,3,6-tetrahydropyridine (MPTP). Proc. Natl. Acad. Sci. USA 1998, 95, 7659–7663. [Google Scholar] [CrossRef] [Green Version]
  51. Souza, J.M.; Peluffo, G.; Radi, R. Protein tyrosine nitration–Functional alteration or just a biomarker? Free Radic. Biol. Med. 2008, 45, 357–366. [Google Scholar] [CrossRef]
  52. Álvarez, C.; Lozano-Juste, J.; Romero, L.C.; García, I.; Gotor, C.; León, J. Inhibition of Arabidopsis O-acetylserine(thiol)lyase A1 by tyrosine nitration. J. Biol. Chem. 2011, 286, 578–586. [Google Scholar] [CrossRef]
  53. Abello, N.; Kerstjens, H.A.M.; Postma, D.S.; Bischoff, R. Protein tyrosine nitration: Selectivity, physicochemical and biological consequences, denitration, and proteomics methods for the identification of tyrosine-nitrated proteins. J. Proteome Res. 2009, 8, 3222–3238. [Google Scholar] [CrossRef]
  54. Koeck, T.; Fu, X.; Hazen, S.L.; Crabb, J.W.; Stuehr, D.J.; Aulark, K.S. Rapid and selective oxygen-regulated protein tyrosine denitration and nitration in mitochondria. J. Biol. Chem. 2004, 279, 27257–27262. [Google Scholar] [CrossRef]
  55. Morot-Gaudry-Talarmain, Y.; Rockel, P.; Moureaux, T.; Quilleré, I.; Leydecker, M.T.; Kaiser, W.M.; Morot-Gaudry, J.F. Nitrite accumulation and nitric oxide emission in relation to cellular signaling in nitrite reductase antisense tobacco. Planta 2002, 215, 708–715. [Google Scholar] [PubMed]
  56. Cecconi, D.; Orzetti, S.; Vandelle, E.; Rinalducci, S.; Zolla, L.; Delledonne, M. Protein nitration during defense response in Arabidopsis thaliana. Electrophoresis 2009, 30, 2460–2468. [Google Scholar] [CrossRef]
  57. Takahashi, M.; Shigeto, J.; Sakamoto, A.; Izumi, S.; Asada, K.; Morikawa, H. Dual selective nitration in Arabidopsis: Almost exclusive nitration of PsbO and PsbP, and highly susceptible nitration of four non-PSII proteins, including peroxiredoxin II E. Electrophoresis 2015, 36, 2569–2578. [Google Scholar] [CrossRef] [PubMed]
  58. Nelson, N.; Yocum, C.F. Structure and function of photosystems I and II. Annu. Rev. Plant Biol. 2006, 57, 521–565. [Google Scholar] [CrossRef] [PubMed]
  59. Anderson, J.M.; Chow, W.S.; De Las Rivas, J. Dynamic flexibility in the structure and function of photosystem II in higher plant thylakoid membranes: The grana enigma. Photosynth. Res. 2008, 98, 575–587. [Google Scholar] [CrossRef] [PubMed]
  60. Suorsa, M.; Sirpiö, S.; Allahverdiyeva, Y.; Paakkarinen, V.; Mamedov, F.; Styring, S.; Aro, E.M. PsbR, a missing link in the assembly of the oxygen-evolving complex of plant photosystem II. J. Biol. Chem. 2006, 281, 145–150. [Google Scholar] [CrossRef] [PubMed]
  61. Takahashi, M.; Shigeto, J.; Shibata, T.; Sakamoto, A.; Izumi, S.; Morikawa, H. Differential abilities of nitrogen dioxide and nitrite to nitrate proteins in thylakoid membranes isolated from Arabidopsis leaves. Plant Signal. Behav. 2016, 11, e1237329. [Google Scholar] [CrossRef] [PubMed] [Green Version]
  62. Huie, R.E. The reaction kinetics of NO2. Toxicology 1994, 89, 193–216. [Google Scholar] [CrossRef]
  63. Kawamura, Y.; Takahashi, M.; Arimura, G.; Isayama, T.; Irifune, K.; Goshima, N.; Morikawa, H. Determination of levels of NO3, NO2 and NH4+ ions in leaves of various plants by capillary electrophoresis. Plant Cell Physiol. 1996, 37, 878–880. [Google Scholar] [CrossRef]
  64. Takahashi, M.; Shigeto, J.; Sakamoto, A.; Morikawa, H. Light-triggered selective nitration of PsbO1 in isolated Arabidopsis thylakoid membranes is inhibited by photosynthetic electron transport inhibitors. Plant Signal. Behav. 2016, 11, e1263413. [Google Scholar] [CrossRef] [Green Version]
  65. Peltier, J.B.; Friso, G.; Kalume, D.E.; Roepstorff, P.; Nilsson, F.; Adamska, I.; Van Wijk, K.J. Proteomics of the chloroplast: Systematic identification and targeting analysis of lumenal and peripheral thylakoid proteins. Plant Cell 2000, 12, 319–341. [Google Scholar] [CrossRef] [PubMed]
  66. Nakamura, S.; Noguchi, T. Infrared detection of a proton released from tyrosine YD to the bulk upon its photo-oxidation in photosystem II. Biochemistry 2015, 54, 5045–5053. [Google Scholar] [CrossRef] [PubMed]
  67. Fork, D.C.; Urbach, W. Evidence for the localization of plastocyanin in the electron-transport chain of photosynthesis. Proc. Natl. Acad. Sci. USA 1965, 53, 1307–1315. [Google Scholar] [CrossRef] [PubMed]
  68. Kawamoto, K.; Mano, J.; Asada, K. Photoproduction of the azidyl radical from the azide anion on the oxidizing side of photosystem II and suppression of photooxidation of tyrosine Z by the azidyl radical. Plant Cell Physiol. 1995, 36, 121–129. [Google Scholar] [CrossRef]
  69. Kovacs, L.; Hegde, U.; Padhye, S.; Bernat, G.; Demeter, S. Effect of potassium-(picrate)-(18-crown-6) on the photosynthetic electron transport. Z. Naturforsch. 1996, 51, 539–547. [Google Scholar] [CrossRef]
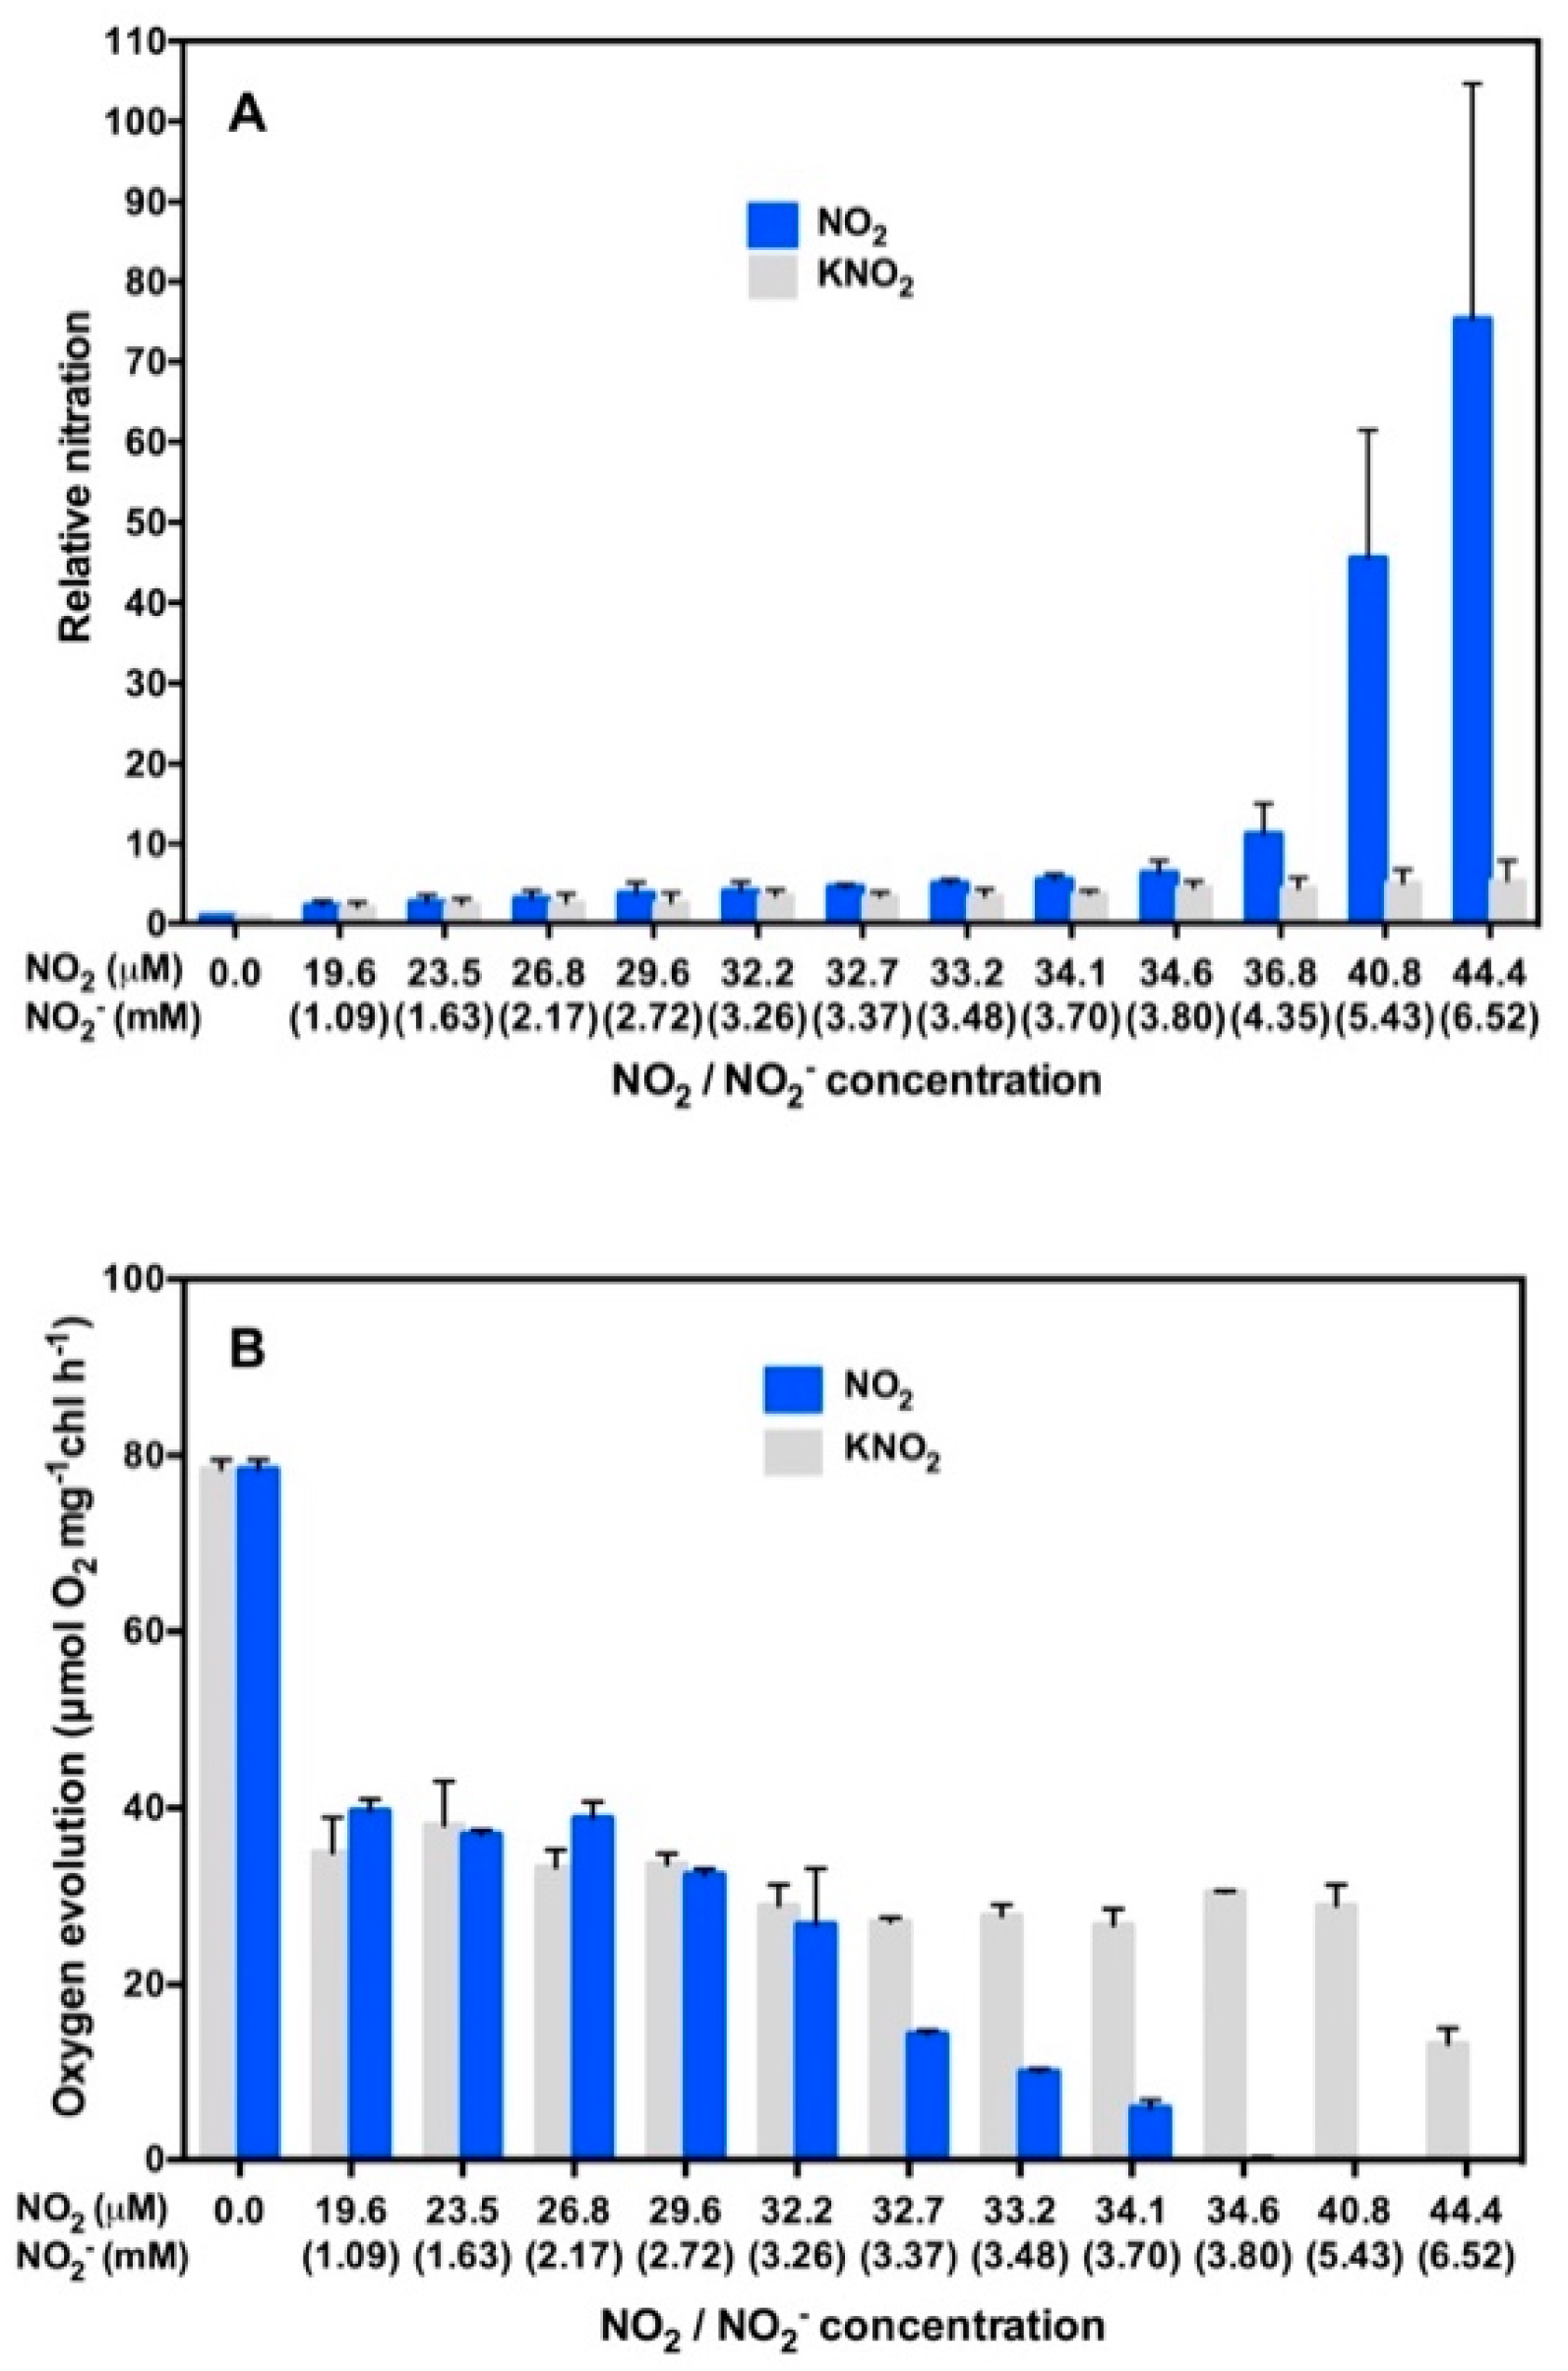
  70. Takahashi, M.; Shigeto, J.; Sakamoto, A.; Morikawa, H. Selective nitration of PsbO1 inhibits oxygen evolution from isolated Arabidopsis thylakoid membranes. Plant Signal. Behav. 2017, 12, e1304342. [Google Scholar] [CrossRef] [PubMed] [Green Version]
  71. Sinclair, J. Changes in spinach thylakoid activity due to nitrite ions. Photosynth. Res. 1987, 12, 255–263. [Google Scholar] [CrossRef]
  72. Wincencjusz, H.; Yocum, C.F.; Van Gorkom, H.J. Activating anions that replace Cl in the O2-evolving complex of photosystem II slow the kinetics of the terminal step in water oxidation and destabilize the S2 and S3 states. Biochemistry 1999, 38, 3719–3725. [Google Scholar] [CrossRef]
  73. Pokhrel, R.; Brudvig, G.W. Investigation of the inhibitory effect of nitrite on Photosystem II. Biochemistry 2013, 52, 3781–3789. [Google Scholar] [CrossRef]
  74. Takahashi, M.; Morikawa, H. A novel role for PsbO1 in photosynthetic electron transport as suggested by its light-triggered selective nitration in Arabidopsis thaliana. Plant Signal. Behav. 2018, 13, e1513298. [Google Scholar] [CrossRef]
  75. Su, X.; Ma, J.; Wei, X.; Cao, P.; Zhu, D.; Chang, W.; Liu, Z.; Zhang, X.; Li, M. Structure and assembly mechanism of plant C2S2M2-type PSII-LHCII supercomplex. Science 2017, 357, 815–820. [Google Scholar] [CrossRef] [PubMed]
  76. Umena, Y.; Kawakami, K.; Shen, J.-R.; Kamiya, N. Crystal structure of oxygen-evolving photosystem II at a resolution of 1.9 Å. Nature 2011, 473, 55–60. [Google Scholar] [CrossRef] [PubMed]
  77. Lakshmi, K.V.; Brudvi, G.W. Electron paramagnetic resonance distance measurements in photosynthetic reaction centers. In Distance Measurements in Biological Systems by EPR; Berliner, L.J., Eaton, G.R., Eaton, S.S., Eds.; Springer: London, UK, 2000; Volume 19, pp. 513–567. ISBN 978-1-4757-0575-1. [Google Scholar]
  78. Pigolev, A.V.; Klimov, V.V. The green alga Chlamydomonas reinhardtii as a tool for in vivo study of site-directed mutations in PsbO protein of photosystem II. Biochemistry (Moscow) 2015, 80, 662–673. [Google Scholar] [CrossRef] [PubMed]
  79. Morita, T.; Kimura, S. Long-range electron transfer over 4 nm governed by an inelastic hopping mechanism in self-assembled monolayers of helical peptides. J. Am. Chem. Soc. 2003, 125, 8732–8733. [Google Scholar] [CrossRef] [PubMed]
  80. Arikuma, Y.; Nakayama, H.; Morita, T.; Kimura, S. Ultra-long-range electron transfer through a self-assembled monolayer on gold composed of 120-Å-long α-helices. Langmuir 2011, 27, 1530–1535. [Google Scholar] [CrossRef] [PubMed]
  81. Mclendon, G.; Hake, R. Interprotein electron transfer. Chem. Rev. 1992, 92, 481–490. [Google Scholar] [CrossRef]
  82. Miyashita, O.; Okamura, M.Y.; Onuchic, J.N. Interprotein electron transfer from cytochrome c2 to photosynthetic reaction center: Tunneling across an aqueous interface. Proc. Natl. Acad. Sci. USA 2005, 102, 3558–3563. [Google Scholar] [CrossRef] [PubMed]
  83. Kolbert, Z.; Feigl, G.; Bordé, Á.; Molnár, Á.; Erdei, L. Protein tyrosine nitration in plants: Present knowledge, computational prediction and future perspectives. Plant Physiol. Biochem. 2017, 113, 56–63. [Google Scholar] [CrossRef] [Green Version]
  84. Salem, M.A.; Li, Y.; Bajdzienko, K.; Fisahn, J.; Watanabe, M.; Hoefgen, R.; Schöttler, M.A.; Giavalisco, P. RAPTOR controls developmental growth transitions by altering the hormonal and metabolic balance. Plant Physiol. 2018, 177, 565–593. [Google Scholar] [CrossRef]
  85. Chen, G.H.; Liu, M.J.; Xiong, Y.; Sheen, J.; Wu, S.H. TOR and RPS6 transmit light signals to enhance protein translation in deetiolating Arabidopsis seedlings. Proc. Natl. Acad. Sci. USA 2018, 115, 12823–12828. [Google Scholar] [CrossRef]
  86. Schepetilnikov, M.; Ryabova, L.A. Recent discoveries on the role of TOR (Target of Rapamycin) signaling in translation in plants. Plant Physiol. 2018, 176, 1095–1105. [Google Scholar] [CrossRef] [PubMed]
  87. Wang, P.; Zhao, Y.; Li, Z.; Hsu, C.C.; Liu, X.; Fu, L.; Hou, Y.J.; Du, Y.; Xie, S.; Zhang, C.; et al. Reciprocal regulation of the TOR kinase and ABA receptor balances plant growth and stress response. Mol. Cell. 2018, 69, 100–112.e6. [Google Scholar] [CrossRef] [PubMed]
  88. Castillo, M.C.; Lozano-Juste, J.; González-Guzmán, M.; Rodriguez, L.; Rodriguez, P.L.; León, J. Inactivation of PYR/PYL/RCAR ABA receptors by tyrosine nitration may enable rapid inhibition of ABA signaling by nitric oxide in plants. Sci. Signal. 2015, 8, 89. [Google Scholar] [CrossRef] [PubMed]
  89. Karve, A.; Brandon, D.; Moore, B.D. Function of Arabidopsis hexokinase-like1 as a negative regulator of plant growth. J. Exp. Bot. 2009, 60, 4137–4149. [Google Scholar] [CrossRef] [PubMed] [Green Version]
  90. John, F.; Roffler, S.; Wicker, T.; Ringli, C. Plant TOR signaling components. Plant Signal. Behav. 2011, 6, 1700–1705. [Google Scholar] [CrossRef] [Green Version]
  91. Antoniuk-Pablant, A.; Sherman, B.D.; Kodis, G.; Gervaldo, M.; Moore, T.A.; Moore, A.L.; Gust, D.; Megiatto, J.D., Jr. Mimicking the electron transfer chain in photosystem II with a molecular triad thermodynamically capable of water oxidation. Proc. Natl. Acad. Sci. USA 2012, 109, 15578–15583. [Google Scholar] [Green Version]
Figure 1. Typical 4-week-old plants of Arabidopsis thaliana accession Columbia grown in the presence (right) or absence (left) of 50 ppb nitrogen dioxide (NO2). Bar = 1 cm.
Plants 08 00198 g001
Figure 2. Area of leaves (A), size of cells (B), and number of cells (C) in 5-week-old Arabidopsis thaliana C24 plants as a function of leaf position. Plants were grown in the presence (+NO2-treated plants, blue columns) or absence (–NO2 control plants, black columns) of NO2. Values are expressed as means ± SD; n = 5. Statistical significance assessed by Student’s t-test (* P < 0.05; ** P < 0.01; *** P < 0.001).
Plants 08 00198 g002
Figure 3. 2D PAGE gel patterns of Arabidopsis whole leaf proteins extracted from +NO2-treated (right) and –NO2 control (left) plants. Western blots detected using 3-NT-specific antibody (upper panels) and gels stained with SYPRO Ruby (lower panels). Each gel was loaded with 100 µg protein.
Plants 08 00198 g003
Figure 4. 2D PAGE gel patterns of chloroplast proteins extracted from +NO2-treated plants. The stromal and lumenal protein fraction (A), and the thylakoid membranous protein fraction (B) are shown. Spots on gel (A) and (B) were numbered as SLn and ISn, respectively. Upper and lower panels of (A) and (B) correspond to Western blots detected using 3-NT-specific antibody and gels stained with SYPRO Ruby, respectively. Each lane of stromal and lumenal protein fraction and thylakoid membranous protein fraction was loaded with 40 and 20 μg protein, respectively.
Plants 08 00198 g004
Figure 5. Demonstration that light is essential to induce nitration of PsbO1. (A) Arabidopsis thylakoid membranes were incubated in a buffer containing NO2 and NO2 with or without illumination. Upper and lower panel show 3-NT-positive band and SYPRO-Ruby-stained band of PSBO1, respectively. (B) Fold-change in the PsbO1 band intensity (FCPSBO1) as a function of NO2 and NO2 concentrations in a buffer solution bubbled with NO2 gas. FCPSBO1 = (PsbO1 band intensity following incubation in a buffer bubbled with NO2 gas)/(PsbO1 band intensity following incubation in buffer without NO2 or NO2). Data represent means of 3 independent experiments ± SD. *, P < 0.05; ***, P < 0.001. Student’s t-test was done using GraphPad Prism 6.0 (GraphPad Software, La Jolla, CA, USA).
Plants 08 00198 g005
Figure 6. Demonstration that PSII electron transport inhibitors inhibit the nitration of PsbO1. Thylakoid membranes were incubated in a buffer bubbled with NO2 gas (containing 36.8 µM NO2 and 4.35 mM NO2). Inhibitors such as 30 µM 3-(3,4-dichlorophenyl)-1,1-dimethylurea (DCMU), 10 mM sodium azide, or 1 mM 1,5-diphenylcarbazide (DPC) were added or not added to the buffer. Proteins were extracted, electrophoresed and Western blotted using a 3-NT-specific antibody followed by quantification of the PSBO1 band intensity. See text for details. Fold-change in PsbO1 band intensity = (intensity of PSBO1 band following incubation in a buffer containing NO2 and NO2)/(intensity of PSBO1 band before incubation in the buffer). Mean ± SD of three independent experiments. One-way ANOVA with Tukey’s multiple comparison test was used to assess statistical significance: ***, P < 0.001.
Plants 08 00198 g006
Figure 7. Demonstration that nitration of PsbO1 inhibits oxygen evolution. Arabidopsis thylakoid membranes were incubated in light in a buffer containing NO2 and NO2 or a buffer containing NO2 alone. Incubated thylakoid membranes were divided into equal parts: first one for Western blot analysis and second one for oxygen evolution analysis. (A) Relative nitration of PsbO1 as a function of concentrations of NO2 or NO2. (B) Oxygen evolution as a function of concentrations of NO2 or NO2. The data represent the mean ± SD of three independent experiments.
Plants 08 00198 g007
Figure 8. A model to hypothesize a novel role of the ninth tyrosine residue of PsbO1 (9Tyr) in photosynthetic electron transport in PSII. Hypothetical long range inter- and intra-molecular electron transfer from manganese cluster to P680+ via 9Tyr of PsbO1 supported the 9Tyr as a novel electronic element, like Yz, in the PSII electron transport.
Plants 08 00198 g008
Figure 9. NO2 may induce tyrosine nitration of PYR/PYL/RCAR to degrade PYR/PYL/RCAR, and upregulate target of rapamycin (TOR) to stimulate plant growth.
Plants 08 00198 g009

