Article

Consistent Differences in Field Leaf Water-Use Efficiency among Soybean Cultivars

USDA-ARS Adaptive Cropping Systems Lab (Retired), Beltsville, MD 20705, USA
Plants 2019, 8(5), 123; https://doi.org/10.3390/plants8050123
Submission received: 10 April 2019 / Revised: 3 May 2019 / Accepted: 8 May 2019 / Published: 10 May 2019
(This article belongs to the Section Plant Physiology and Metabolism)

Abstract

:
High intrinsic water-use efficiency (WUEi), the ratio of leaf photosynthesis to stomatal conductance, may be a useful trait in adapting crops to water-limited environments. In soybean, cultivar differences in stomatal response to vapor pressure deficit have not consistently translated into differences in WUEi in the field. In this study, six cultivars of soybeans previously shown to differ in WUEi in indoor experiments were grown in the field in Beltsville, Maryland, and tested for mid-day WUEi on nine clear days during the mid-seasons of two years. Measurement dates were chosen for diverse temperatures, and air temperatures ranged from 21 to 34 °C on the different dates. Air saturation deficits for water vapor ranged from 0.9 to 2.2 kPa. Corrected carbon isotope delta values for 13C (CID) were determined on mature, upper canopy leaves harvested during early pod filling each year. WUEi differed among cultivars in both years and the differences were consistent across measurement dates. Correlations between mean WUEi and CID were not significant in either year. It is concluded that consistent cultivar differences in WUEi exist in these soybean cultivars under field conditions, but that carbon isotope ratios may not be useful in identifying them because of cultivar differences in mesophyll conductance.

1. Introduction

With projected increased frequency of drought, and decreased availability or increased cost of water for agriculture, increasing the efficiency of water use in agriculture is an important goal [1]. In addition to crop management strategies, inherent increases in crop water-use efficiency (WUE) could be useful in reaching this goal. For a given leaf to air difference in water vapor pressure (VPD), the ratio of photosynthesis to transpiration, termed leaf water-use efficiency, is inversely related to the ratio of substomatal CO2 concentration to ambient CO2 concentration (Ci/Ca) [1]. The realization that the discrimination between isotopes of carbon in CO2 in leaf photosynthetic CO2 fixation was related to Ci/Ca [2] led to many tests of intraspecific relationships between corrected isotope delta values for 13C (CID) and crop WUE. Significant correlations between CID and crop WUE have been found in many crop species, such as wheat [3], peanut [4], tomato [5,6], cowpea [7], cotton [8], barley [9], and sugar beet [10]. However, partly because of correlations between crop WUE and leaf size, plant size, and leaf CO2 assimilation rate in some species, improved crop WUE has been no guarantee of increased yield in dry conditions [1,11]. Clearly, other plant variables must also be managed. Sinclair [12] has argued that stomatal response properties limiting transpiration at high VPD, which would increase WUE, would have yield benefits in many agricultural species and environments.
In spite of common correlations between CID and crop WUE, in some cases CID has not been correlated with leaf gas exchange measurements of Ci/Ca [5,13,14]. This type of result is of concern for the general usefulness of CID as a selection tool to change Ci/Ca. Warren et al. [15] argued that mesophyll conductance (gm) to CO2 movement from the sub-stomatal air space to the site of fixation inside the chloroplast varied enough among species to disrupt relationships between CID and Ci/Ca. Barbour et al. [16] argued that variation in gm in barley disrupted correlations between CID and WUE, as did Gioliani [13] in rice. Seibt et al. [17] also emphasized that CID was not directly related to the Ci/Ca ratio, but to the Cc/Ca ratio, where Cc is the CO2 concentration at the site of fixation inside the chloroplast. Easlon et al. [18] provided evidence of the importance of genetic variation in gm to CID in Arabidopsis thaliana. Because gm may vary with temperature [19,20], light [21] and Ci [22], it is to be expected that CID may not always correlate highly with leaf Ci/Ca.
Regardless of variation in gm, leaf WUE at a given VPD would be proportional to Ci/Ca [23]. The ratio Ci/Ca depends on the ratio of photosynthesis to stomatal conductance, which is termed intrinsic leaf water-use efficiency (WUEi) [17]. While operational Ci is somewhat conservative in the steady-state over changes in light and temperature [24] it certainly varies with VPD in many cases. In soybeans, much prior work focused on “slow wilting” soybeans in which transpiration increased less rapidly with increasing VPD [25,26,27] as genetic resource to increase WUEi. However, it is disconcerting that genotypic differences in responses of transpiration to VPD in soybeans, identified in controlled environment tests and field tested in North Carolina [25,26,27] were not evident when tested in California [28]. In the tests in California, no genetic differences in WUEi occurred. In this study, cultivars of soybean identified in tests in indoor controlled environment chambers as differing in Ci/Ca and WUEi at a single VPD were grown in the field in Beltsville, Maryland, over two years to test whether this method of identification of high WUEi lines produced consistent differences in WUEi over a range of temperature and VPD conditions in the field. Leaf gas exchange was measured on nine clear days in mid-summer, chosen to have a wide range of air temperature and VPD values. Cultivars were compared for steady-state values of WUEi to determine whether any cultivar differences in WUEi were consistent across measurement days and years. Mature leaves harvested at early pod fill were analyzed for CID values for tests of correlations between CID and the mean leaf WUEi of the cultivars.

2. Results

Air and leaf temperatures during the leaf gas exchange measurements both ranged from 21 to 34 °C on the nine different dates (Figure 1 and Figure 2), and air saturation deficit (ASD) values ranged from 0.9 to 2.2 kPa. The correlation coefficient between ASD and air temperature was 0.399, which was not significant (P = 0.288).
The cultivar × date interaction term was significant for WUEi in 2017 (Table 1), but was not significant in 2018 (Table 2), nor was it significant for A or gs in either year. Despite the significant cultivar × date interaction for WUEi in 2017, the cultivars were clearly divided into two consistent groups of cultivars with contrasting WUEi on all of the measurement dates (Figure 1). Holt, Ripley and Fiskeby V all had higher WUEi than did Ford and Wabash on each date. In 2017, the three cultivars with high WUEi had both higher A and lower gs than the two cultivars with low WUEi (Table 3). In 2018, Holt and Fiskeby V again had higher WUEi than Ford and Wabash, while Spencer had low WUEi, similar to Ford and Wabash (Figure 2). Relationships between absolute values of A, gs and WUEi were unclear in 2018, because Spencer had high A, but low WUEi, and Wabash, with low WUEi also had low gs (Table 4).
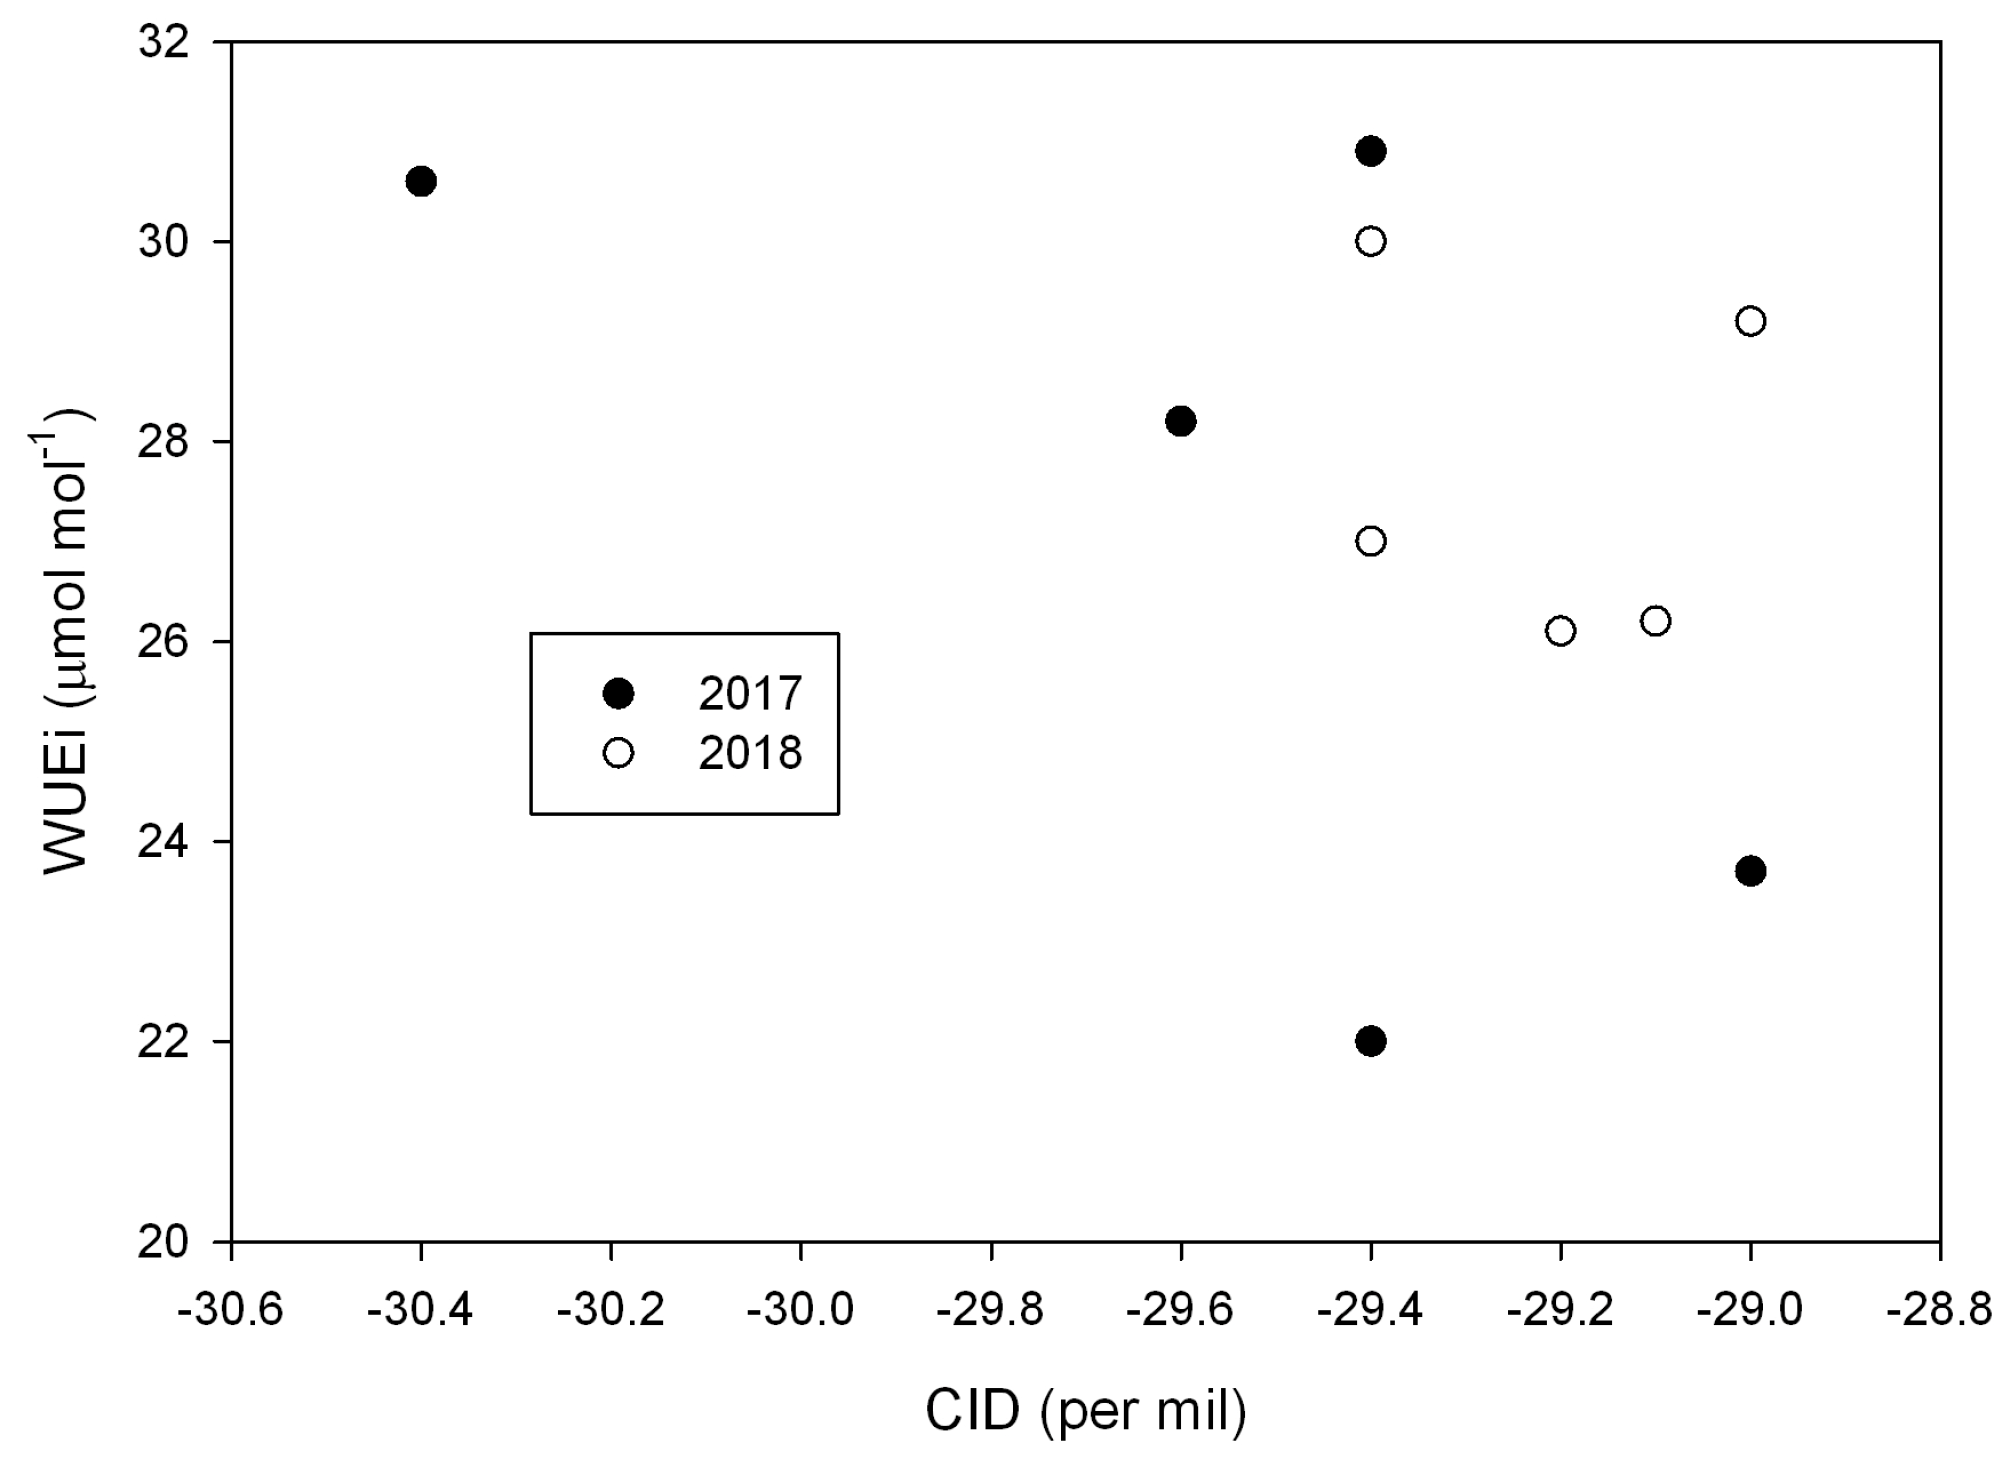
Significant differences among cultivars in CID values occurred in both years, although differences were larger in 2017 than 2018 (Table 4). In 2017, Holt had a smaller (more negative) value than the other four cultivars. In 2018, Holt and Spencer had the smallest values. In neither year was there a significant correlation between mean WUEi averaged over the measurement dates and CID (Figure 3). In 2017, the correlation coefficient was 0.647, with P = 0.238. In 2018, the correlation coefficient was 0.133, with P = 0.832.
On the two dates of each season of these experiments when mean leaf temperatures were close to those used in the previous indoor experiments, the correlation between Ci and Cc among cultivars was not significant in either year, with R2 = 0.194 (P = 0.458) in 2017, and R2 = 0.021 (P = 0.815) in 2018. The (non-significant) slopes were +0.622 in 2017, and −0.230 in 2018.

3. Discussion

It is highly likely that differences in gm among the cultivars disrupted the overall correlations between WUEi and CID, although this was specifically tested only on the two dates each year when leaf temperatures were similar to those in which gm had been measured in prior indoor experiments. On those measurement dates, there were no significant correlations between Ci and Cc among the cultivars. Because CID is related to Cc rather than Ci, cultivar differences in gm could easily have caused the poor overall correlations between CID and Ci in this experiment. The larger intraspecific variation in gm in rice of about 10× [13] than found in wheat, about 2× [29] could be related to the higher correlation between CID and WUEi in wheat [3] than in rice [13]. Measurements of gm currently involve time-consuming leaf gas exchange procedures [30], so that measuring leaf WUEi directly is probably more efficient than trying to correct CID values for gm variation in order to estimate WUEi. Unlike a prior study of soybeans [31], correlations between gs and gm [23] were not strong enough to preclude differences in WUEi in the cultivars examined here.
Although WUEi varied substantially across measurement days, differences among cultivars were quite consistent across days and also over the two years of this study. These results suggest that WUEi differences among these soybean cultivars were quite stable across a range of measurement temperatures and ASD, although maximum ASD values are not large in this environment. Any relationship between mean values of A or gs, and WUEi suggested by the data for 2017 was disrupted in 2018. Cultivar differences in WUEi among these soybean cultivars were not consistently associated with differences in mean values of either A or gs, but with operational Ci values. Reasons for cultivar differences in operational Ci are not known, but may be important for improvements in crop WUE.

4. Materials and Methods

In 2017, soybean cultivars Fiskeby V, Ford, Holt, Ripley, and Wabash were planted on 21 June at the South Farm of the Beltsville Agricultural Research Center. In 2018, the same cultivars were planted on 26 June in the same field, except that the cultivar Spencer was grown in place of Ripley. Seeds were obtained from the United States Department of Agriculture (USDA) soybean germplasm collection. These cultivars were chosen based on prior comparisons of their leaf gas exchange when grown indoors [23]. Fiskeby V, Holt, and Ripley had relatively high values of WUEi, and Ford, Wabash and Spencer had relatively low values of WUEi [23] under the single measurement condition used in that study. The soil of the test site was a silt loam, with a water table at about 1.5 m depth, and with phosphorus and potassium contents adequate for soybeans according soil tests, and a pH of about 6.5. In these field tests, plants were grown in single row plots, one meter apart, and thinned after the emergence to 25 plants per meter of row. There were six replicate plots per cultivar, with each plot at least 2 m in length.
In 2017 leaf gas exchange was measured using a CIRAS-1 portable photosynthesis system (PP Systems, Amesbury MA). With that system, leaf and air temperatures are not controlled, but cuvette air temperature is designed to be very similar to outside air temperature by the use of large ventilated heat exchangers. In 2018, a CIRAS-3 portable system was used, and air temperature was controlled using Peltier units to be equal to that of outside air at the time measurements were begun. On each day, measurements were begun near midday and were completed in less than 60 minutes, so the outside air temperature changed little over the course of the measurements each day. Preliminary measurements were made each day to adjust the water content of the inlet air such that the air surrounding the leaves during gas exchange measurements had approximately the same water vapor pressure as outside air. In measurements with both instruments, the CO2 concentration in the reference air stream was controlled to be 400 µmol·mol−1, and the CO2 concentration in the air surrounding the leaves was 370 ± 5 µmol·mol−1. This mode of operation was chosen in order that steady-state rates of leaf gas exchange could be measured within one minute of enclosing leaves in the cuvettes. Tests showed that stomatal conductance did not change within a minute of changing the water vapor or carbon dioxide content of air surrounding leaves. Measurement dates were chosen for clear sky conditions, with a range of air temperatures, and also had a range of air saturation deficits for water vapor (ASD). Because of frequent precipitation, soil water content was not low enough to limit leaf gas exchange. During the leaf gas exchange measurements, the photosynthetically active radiation always exceeded 1500 µmol m−2·s−1 inside the cuvette.
On each measurement day, the steady-state CO2 assimilation rate (A), stomatal conductance (gs), and sub-stomatal CO2 concentration (Ci) were obtained on a single leaf of each of six replicate plots of each cultivar, in random order. Leaves chosen for measurement were fully expanded upper canopy leaves which were in full sunlight several minutes before enclosing in the leaf cuvette. Air saturation deficits for water vapor were calculated from the temperature and water vapor content of outside air just prior to the leaf gas exchange measurements.
In 2017, there were five measurement dates, from 25 July to 9 August, and in 2018, there were four measurement dates, from 6 August to 23 August. On the earliest measurement date each year, plant development ranged from late vegetative to early flowering stage, depending upon the cultivar, and on the last date, plants were in early to mid-pod filling stages, depending upon the cultivar. A few days after the last leaf gas exchange measurements each year, the terminal leaflet of a mature upper canopy leaf was collected from each replicate plot for all cultivars and freeze-dried for the determination of corrected isotope delta (CID) values for 13C. CID was determined on each leaf sample by the Cornell Isotope Laboratory.
The gm of each cultivar previously measured in indoor experiments was used to calculate Cc values for leaf gas exchange measured in the field, in order to test the correlation between Ci and Cc across cultivars under field conditions. These calculations were made for a single date each year when leaf temperatures in the field were closest to those used to measure gm in the indoor experiments, which was 25 °C [23]. The two dates were 31 July 2017, when leaf temperatures averaged 26.7 °C, and 15 August 2018, when leaf temperatures averaged 26.0 °C.
Two-way analysis of variance (ANOVA) was conducted to test for effects of cultivar, measurement date, and their interaction on A, gs, and WUEi. These tests were undertaken separately each year, because the cultivars tested differed between years, as did the measurement instruments. One-way ANOVA was used to test for cultivar differences in CID each year. Correlations between cultivar means of WUEi and CID, and between Ci and Cc were tested separately each year.

Funding

This research received no external funding.

Conflicts of Interest

The author declares no conflict of interest.

References

  1. Condon, A.G.; Richards, R.A.; Rebetzke, G.L.; Farquhar, G.D. Breeding for High Water-Use Efficiency. J. Exp. Bot. 2004, 55, 2447–2460. [Google Scholar] [CrossRef]
  2. Farquhar, G.D.; O’Leary, M.H.; Berry, J.A. On the Relationship between Carbon Isotope Discrimination and the Intercellular Carbon Dioxide Concentration in Leaves. Aust. J. Plant Physiol. 1982, 9, 121–137. [Google Scholar] [CrossRef]
  3. Condon, A.G.; Farquhar, G.D.; Richards, R.A. Genotypic Variation in Carbon Isotope Discrimination and Transpiration Efficiency in Wheat. Leaf Gas Exchange and Whole Plant Studies. Aust. J. Plant Physiol. 1990, 17, 9–22. [Google Scholar] [CrossRef] [Green Version]
  4. Wright, G.C.; Hubick, K.T.; Farquhar, G.D. Discrimination in Carbon Isotopes of Leaves Correlates with Water-Use Efficiency of Field-Grown Peanut Cultivars. Aust. J. Plant Physiol 1988, 15, 815–825. [Google Scholar] [CrossRef]
  5. Martin, B.; Thorstenson, Y.R. Stable Carbon Isotope Composition (δ13 C), Water Use Efficiency, and Biomass Productivity of Lycopersicon esculentum, Lycopersicon pennellii, and the F1 Hybrid. Plant Physiol. 1988, 88, 213–217. [Google Scholar] [CrossRef]
  6. Martin, B.; Tauer, C.G.; Lin, R.K. Carbon Isotope Discrimination as a Tool to Improve Water-Use Efficiency in Tomato. Crop Sci. 1999, 39, 1775–1783. [Google Scholar] [CrossRef]
  7. Ismail, A.M.; Hall, A.E. Correlation between Water-Use Efficiency and Carbon Isotope Discrimination in Diverse Cowpea Genotypes and Isogenic Lines. Crop Sci. 1992, 32, 7–12. [Google Scholar] [CrossRef]
  8. Saranga, Y.; Flash, I.; Yakir, D. Variation in Water-Use Efficiency and Its Relation to Carbon Isotope Ratio in Cotton. Crop Sci. 1998, 38, 782–787. [Google Scholar] [CrossRef]
  9. Anyia, A.O.; Slaski, J.J.; Nyachiro, J.M.; Archambault, D.J.; Juskiw, P. Relationship of Carbon Isotope Discriminatin to Water Use Efficiency and Productivity of Barley Under Field and Greenhouse Conditions. J. Agron. Crop Sci. 2007, 193, 313–323. [Google Scholar] [CrossRef]
  10. Rajabi, A.; Ober, E.S.; Griffiths, H. Genotypic Variation for Water Use Efficiency, Carbon Isotope Discrimination, and Potential Surrogate Measures in Sugar Beet. Field Crops Res. 2009, 112, 172–181. [Google Scholar] [CrossRef]
  11. Blum, A. Effective Use of Water (EUW) and not Water-Use Efficiency (WUE) is the Target of Crop Yield Improvement under Drought Stress. Field Crops Res. 2009, 112, 119–123. [Google Scholar] [CrossRef]
  12. Sinclair, T.R. Is Transpiration Efficiency a Viable Plant Trait in Breeding for Crop Improvement? Funct. Plant Biol. 2012, 39, 359–365. [Google Scholar] [CrossRef]
  13. Gioliani, R.; Koteyeva, N.; Voznesenskaya, E.; Evans, M.A.; Cousins, A.B.; Edwards, G.E. Coordination of Leaf Photosynthesis, Transpiration, and Structural Traits in Rice and Wild Relatives (Genus Oryza). Plant Physiol. 2013, 162, 1632–1651. [Google Scholar] [CrossRef]
  14. Zhao, B.; Kondo, M.; Maeda, M.; Ozaki, Y.; Zhang, J. Water-Use Efficiency and Carbon Isotope Discrimination in Two Cultivars of Upland Rice During Different Developmental Stages under Three Water Regimes. Plant Soil 2004, 261, 61–75. [Google Scholar] [CrossRef]
  15. Warren, C.R.; Adams, M.A. Internal Conductance does not Scale with Photosynthetic Capacity: Implications for Carbon Isotope Discrimination and the Economics of Water and Nitrogen Use in Photosynthesis. Plant Cell Physiol. 2006, 29, 192–201. [Google Scholar] [CrossRef]
  16. Barbour, M.M.; Warren, C.R.; Farquhar, G.D.; Forrester, G.; Brown, H. Variability in Mesophyll Conductance between Barley Genotypes, and Effects on Transpiration Efficiency and Carbon Isotype Discrimination. Plant Cell Environ. 2010, 33, 1176–1185. [Google Scholar]
  17. Seibt, U.; Rajabi, A.; Griffiths, H.; Berry, J.A. Carbon Isotopes and Water Use Efficiency: Sense and Sensitivity. Oecologia 2008, 155, 441–454. [Google Scholar] [CrossRef]
  18. Easlon, H.M.; Nemali, K.S.; Richards, J.H.; Hanson, D.T.; Juenger, T.E.; McKay, K. The Physiological Basis for Genetic Variation in Water Use Efficiency and Carbon Isotype Composition in Arabidopsis thaliana. Photosynth. Res. 2014, 119, 119–129. [Google Scholar] [CrossRef]
  19. Bernacchi, C.J.; Portis, A.R.; Nakano, H.; Von Caemmerer, S.; Long, S.P. Temperature Response of Mesophyll Conductance. Implications for the Determination of Rubisco Enzyme Kinetics and for Limitations to Photosynthesis in Vivo. Plant Physiol. 2002, 130, 1992–1998. [Google Scholar] [CrossRef] [Green Version]
  20. Von Caemmerer, S.; Evans, J.R. Temperature Responses of Mesophyll Conductance Differ Greatly between Species. Plant Cell Environ. 2015, 38, 629–637. [Google Scholar] [CrossRef]
  21. Hassiotou, F.; Ludwig, M.; Renton, M.; Venklaas, E.J.; Evans, J.R. Influence of Leaf Dry Mass Per Area, CO2, and Irradiance on Mesophyll Conductance in Sclerophylls. J. Exp. Bot. 2009, 60, 2303–2314. [Google Scholar] [CrossRef] [PubMed]
  22. Flexas, J.; Diaz-Espejo, A.; Galmes, J.; Kaldenhoff, R.; Medrano, H.; Ribas-Carbo, M. Rapid Variations of Mesophyll Conductance in Response to Changes in CO2 Concentration around Leaves. Plant Cell Environ. 2007, 30, 1284–1298. [Google Scholar] [CrossRef] [PubMed]
  23. Bunce, J. Variation among Soybean Cultivars in Mesophyll Conductance and Leaf Water Use Efficiency. Plants 2016, 5, 44. [Google Scholar] [CrossRef] [PubMed]
  24. Wong, S.C.; Cowan, I.F.; Farquhar, G.D. Stomatal Conductance Correlates with Photosynthetic Capacity. Nature 1979, 282, 424–426. [Google Scholar] [CrossRef]
  25. Fletcher, A.L.; Sinclair, T.R.; Allen, L.H., Jr. Transpiration Responses to Vapor Pressure Deficit in Well-Watered “Slow-Wilting” and Commercial Soybean. Environ. Exp. Bot. 2007, 61, 145–151. [Google Scholar] [CrossRef]
  26. Sadok, W.; Sinclair, T.R. Genetic Variability of Transpiration Response to Vapor Pressure Deficit among Soybean Cultivars. Crop Sci. 2009, 49, 955–960. [Google Scholar] [CrossRef]
  27. Gilbert, M.E.; Holbrook, N.M.; Zwieniecki, M.A.; Sadok, W.; Sinclair, T.R. Field Confirmation of Genetic Variation in Soybean Transpiration Response to Vapor Pressure Deficit and Photosynthetic Compensation. Field Crops Res. 2011, 124, 85–92. [Google Scholar] [CrossRef]
  28. Medina, V.; Gilbert, M.E. Physiological Trade-Offs of Stomatal Closure under High Evaporative Gradients in Field Grown Soybean. Funct. Plant Biol. 2016, 43, 40–51. [Google Scholar] [CrossRef]
  29. Jahan, E.; Amthor, J.S.; Farquhar, G.D.; Trethowan, R.; Barbour, M.M. Variation in Mesophyll Conductance among Australian Wheat Genotypes. Funct. Plant Biol. 2014, 41, 568–580. [Google Scholar] [CrossRef]
  30. Pons, T.L.; Flexas, J.; Von Caemmeer, S.; Evans, J.R.; Genty, B.; Ribas-Carbo, M.; Brugnoli, E. Estimating Mesophyll Conductance to CO2: Methodology, Potential Errors, and Recommendations. J. Exp. Bot. 2009, 60, 2217–2234. [Google Scholar] [CrossRef]
  31. Tomeo, M.J.; Rosenthal, D.M. Variable Mesophyll Conductance among Soybean Cultivars Sets a Tradeoff between Photosynthesis and Water-Use-Efficiency. Plant Physiol. 2017, 174, 241–257. [Google Scholar] [CrossRef]
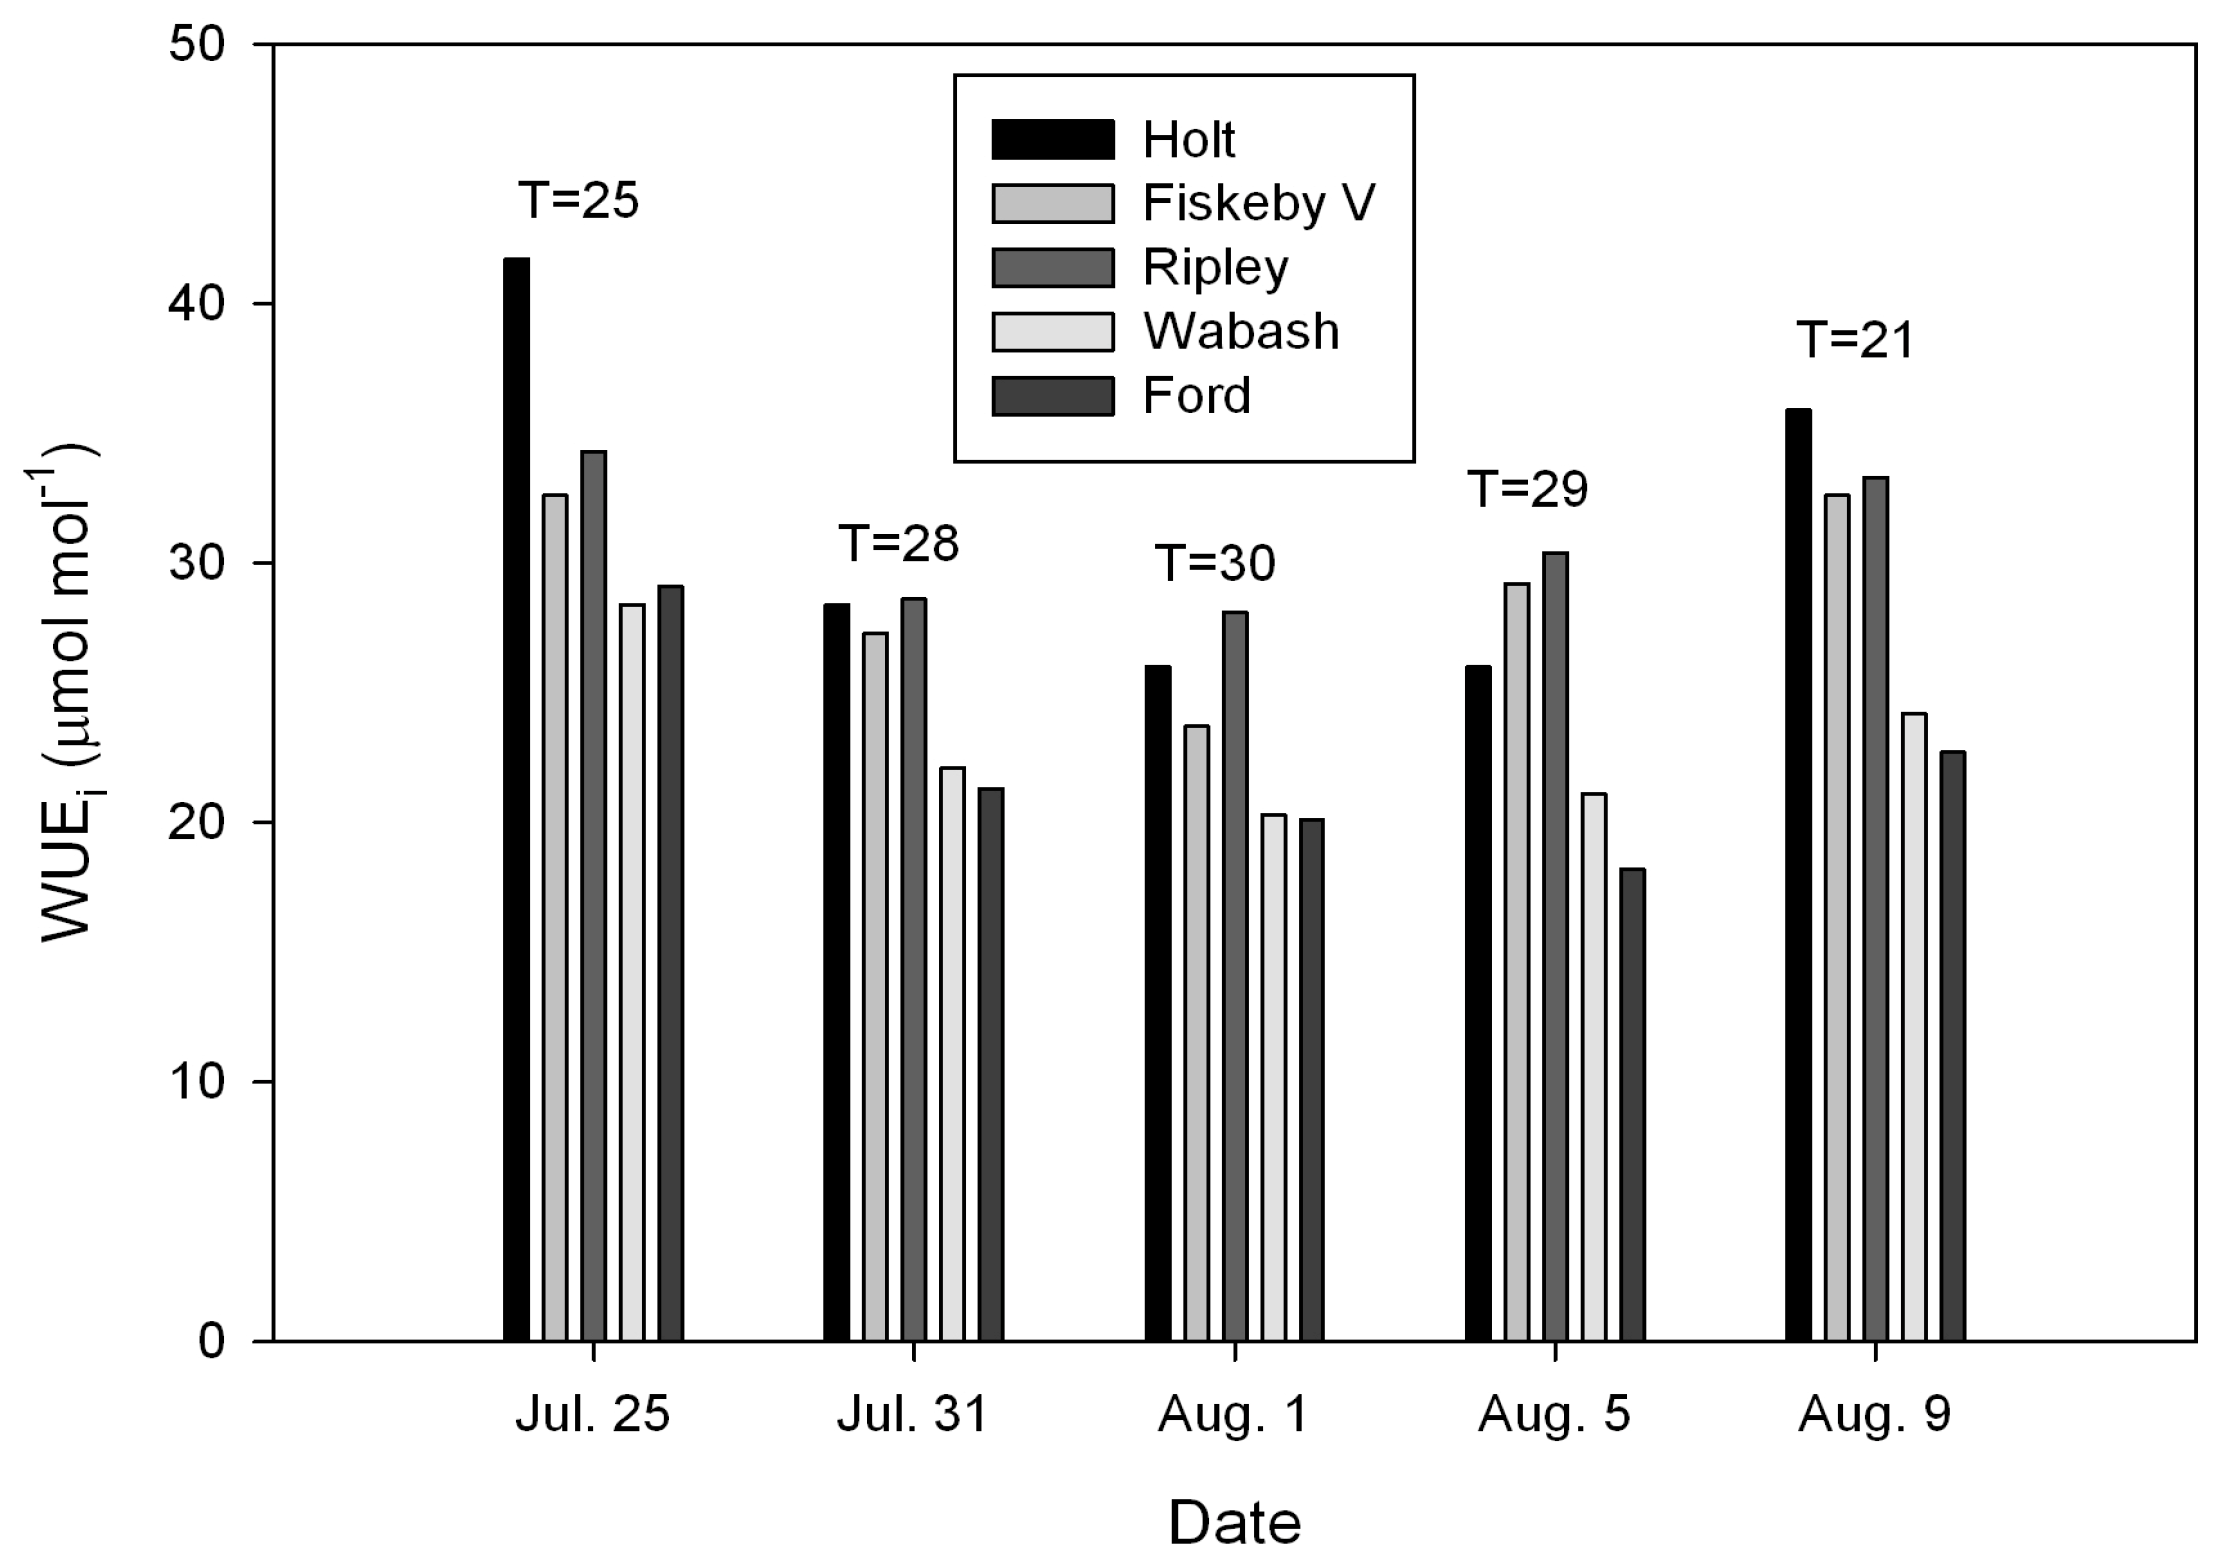
Figure 1. Intrinsic leaf water-use efficiency (WUEi) in five cultivars of soybeans measured on five dates in 2017. Air temperatures (°C) during the measurements on each date are provided.
Plants 08 00123 g001
Figure 2. Intrinsic leaf water-use efficiency (WUEi) in five cultivars of soybeans measured on four dates in 2018. Air temperatures (°C) during the measurements on each date are provided.
Plants 08 00123 g002
Figure 3. Relationships between mean intrinsic leaf water-use efficiency (WUEi) and corrected isotope delta values for 13C (CID) among five cultivars of soybeans in 2017 and 2018. Correlations between WUEi and CID were non-significant at P = 0.05 in either year. See text for details.
Plants 08 00123 g003
Table 1. Analysis of variance for measurements of water-use efficiency (WUEi) of five soybean cultivars measured on five dates in 2017.
SourceDF (Degrees of Freedom)Sum of SquaresMean SquareF-ValueP-Value
Cultivar4181245327.9<0.0001
Date4179644927.7<0.0001
Cultivar × Date1652532.82.030.0178
Residual105170116.2
Table 2. Analysis of variance for measurements of WUEi of five soybean cultivars measured on four dates in 2018.
SourceDFSum of SquaresMean SquareF-ValueP-Value
Cultivar433583.87.04<0.0001
Date3231877365<0.0001
Cultivar × Date1218215.91.280.245
Residual96114111.9
Table 3. Mean values of A, gs, WUEi, and carbon isotope delta (CID) values of five soybean cultivars measured on five dates in 2017. Values within columns followed by different letters were significantly different at P = 0.05, using a protected Least Significant Difference (LSD) test.
CultivarWUEi (µmol·mol−1)A (µmol·m−2·s−1)gs (mol·m−2·s−1)CID (per·mil)
Fiskeby V28.2 b27.9 b0.990 b−29.4 b
Ford22.0 c25.3 c1.149 a−29.6 b
Holt30.6 a29.6 a0.967 b−30.4 a
Ripley30.9 a28.9 ab0.936 b−29.4 b
Wabash23.7 c24.7 c1.043 ab−29.0 b
Table 4. Mean values of A, gs, WUEi, and CID values of five soybean cultivars measured on four dates in 2018. Values within columns followed by different letters were significantly different at P = 0.05, using a protected LSD test.
CultivarWUEi (µmol·mol−1)A (µmol·m−2·s−1)gs (mol·m−2·s−1)CID (per·mil)
Fiskeby V29.2 a36.2 b1.24 bc−29.0 b
Ford26.1 b31.6 c1.21 cd−29.2 ab
Holt30.0 a39.6 a1.32 b−29.4 a
Spencer27.0 b39.0 a1.44 a−29.4 a
Wabash26.2 b29.8 c1.14 d−29.1 b