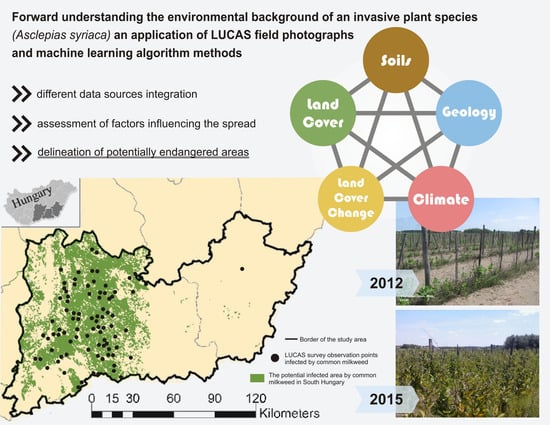
Understanding the Environmental Background of an Invasive Plant Species (Asclepias syriaca) for the Future: An Application of LUCAS Field Photographs and Machine Learning Algorithm Methods

 ,
,  ,
,  , ,
, ,
Abstract
1. Introduction
- How can we identify the biogeographical and anthropogenic factors involved in the appearance of an invasive plant species (such as common milkweed)?
- What geological, pedological, and land cover factors influence the appearance of common milkweed?
- What significance do environmental (biogeographical) factors and land cover have in the presence of common milkweed? What kind of relationship characterizes the system?
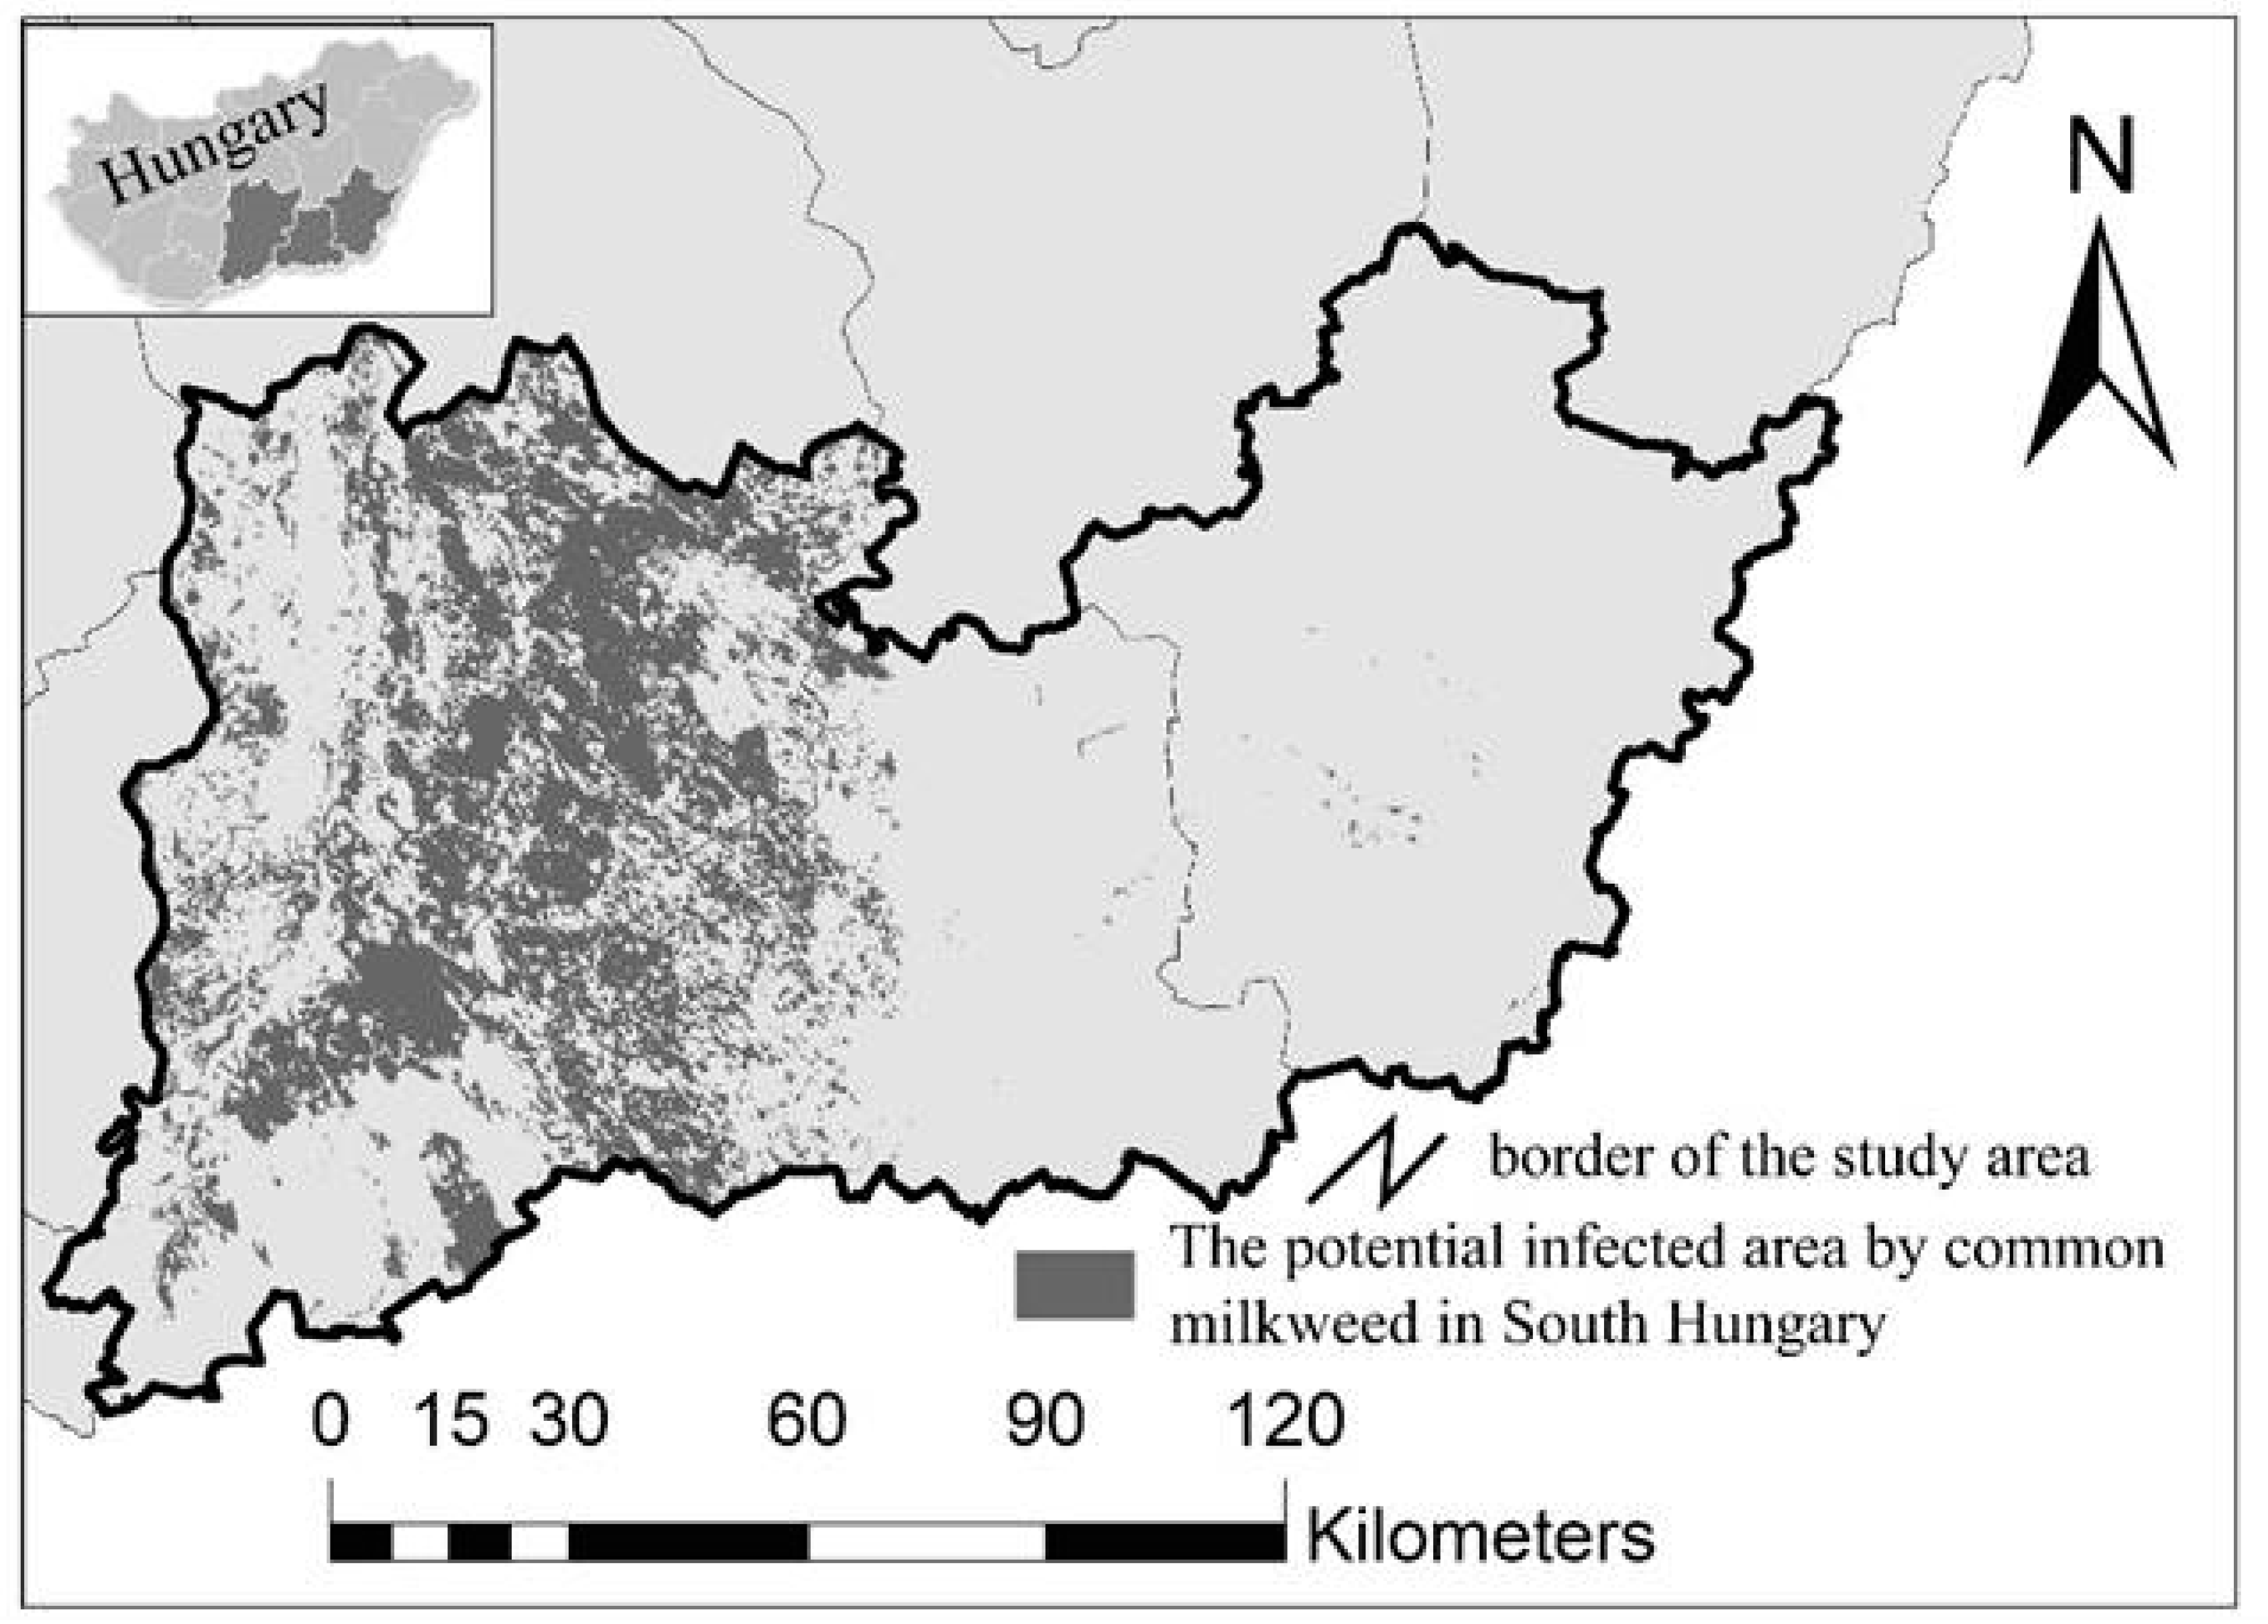
- How can the area potentially infected with common milkweed be outlined within the research area?
2. Results and Discussion
3. Materials and Methods
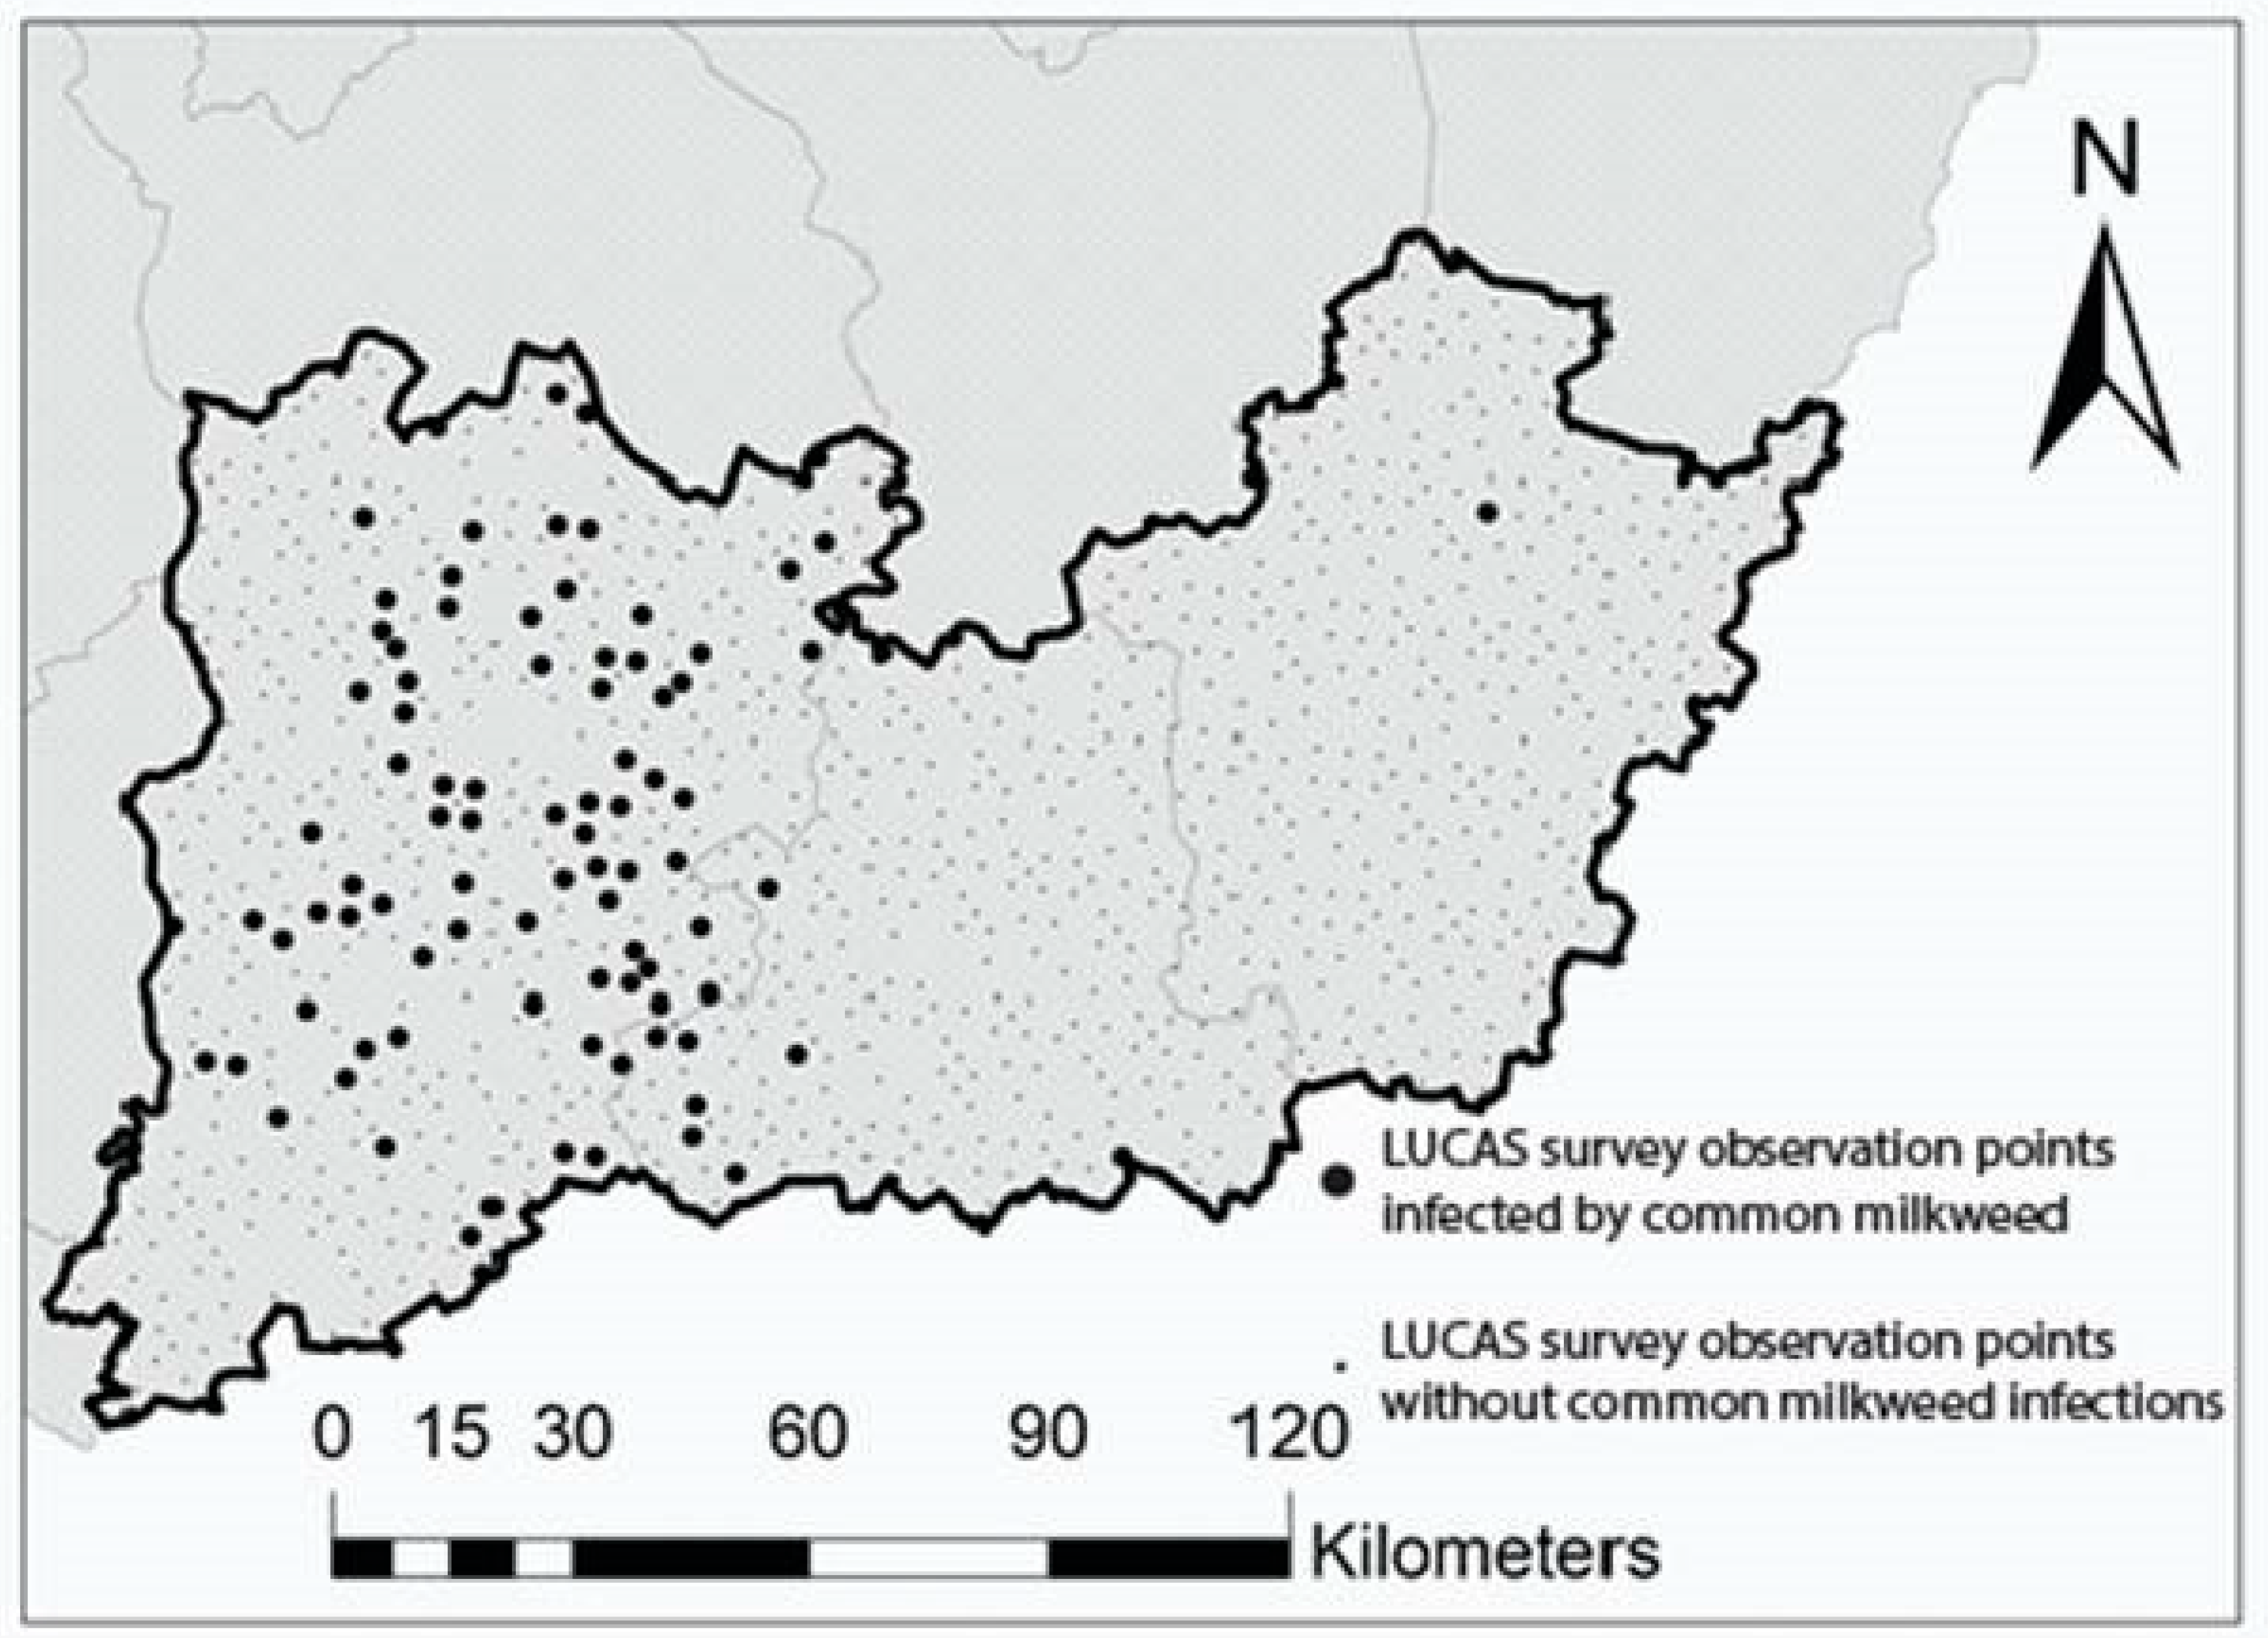
3.1. Study Area
3.2. Identification of Sites Invaded by Common Milkweed
3.3. Digital Databases for Investigating the Environmental Driving Forces of Common Milkweed Spreading
3.4. Statistical Methods
3.4.1. Exploratory Analysis and Pre-Processing of Data
3.4.2. The C5.0 Classification Model
4. Conclusions
Author Contributions
Funding
Acknowledgments
Conflicts of Interest
Appendix A

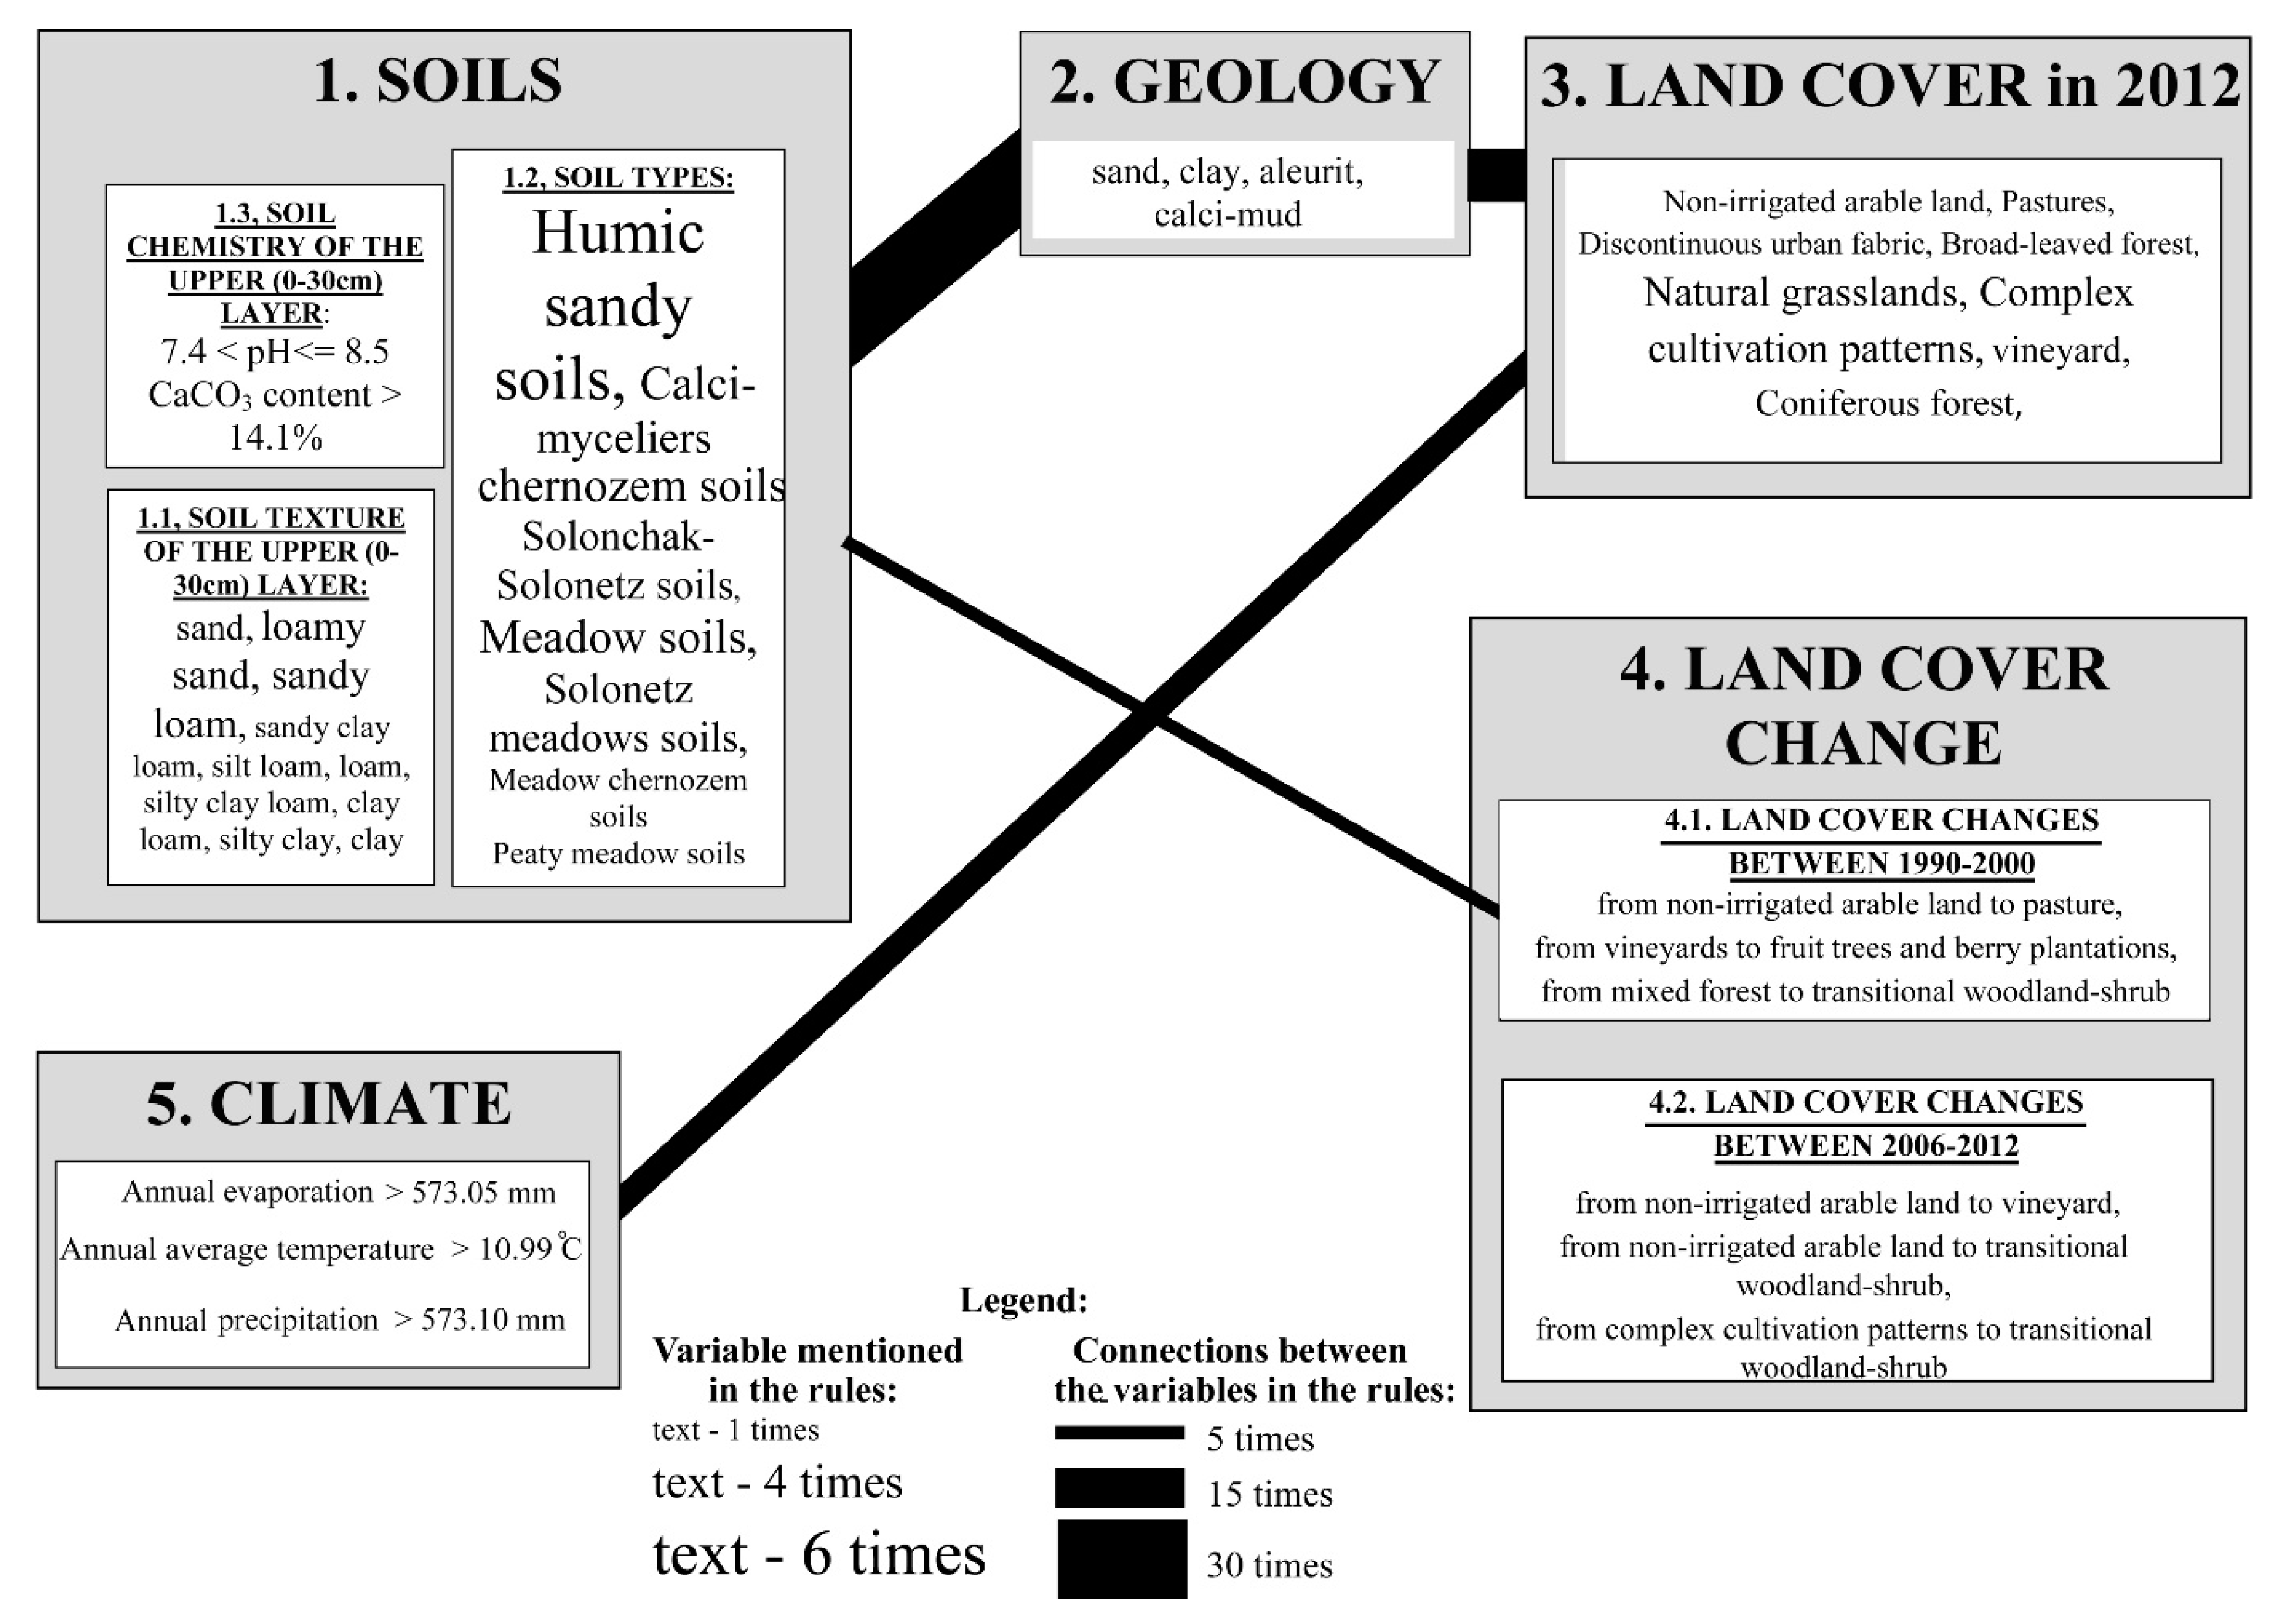
| Rules number | 1. SOILS | 2. GEOLOGY | 3. LAND COVER in 2012 | 4. LAND COVER CHANGE | 5. CLIMATE |
|---|---|---|---|---|---|
| 1 | SOIL TYPES: Humic sandy soils, Calci-myceliers chernozem soils, Solonchak-Solonetz soils, Meadow soils | Sand | Non-irrigated arable land | no change between 2006–2012 | - |
| 2 | SOIL TYPES: Humic sandy soils, Solonchak-Solonetz soils, Solonetz-meadow soils | - | Pastures | no change between 1990–2000 no change between 2006–2012 | - |
| 3 | SOIL TYPES: Humic sandy soils, Solonetz-meadow soils, Meadow soils | - | Discontinuous urban fabric, Broad-leaved forest, Natural grasslands | no change between 1990–2000 | - |
| 4 | SOIL TEXTURE OF THE UPPER (0–30 cm) LAYER: sand, loamy sand, sandy loam SOIL TYPES Humic sandy soils, Calci-myceliers chernozem soils, Solonetz-meadow soils | - | - | no change between 1990–2000 no change 2006–2012 | Annual rainfall is over 537.1 mm |
| 5 | SOIL TYPES: Humic sandy soils, Solonchak-Solonetz soils, Meadow soils | - | - | Land cover change between 1990–2000: from Non-irrigated arable land to pasture, from Vineyards to Fruit trees and berry plantations, from Mixed forest to Transitional woodland-shrub | - |
| 6 | SOIL TEXTURE OF THE UPPER (0–30 cm) LAYER: loamy sand, sandy loam SOIL TYPES: Chernozem medow soils, Peaty meadow soils | - | - | - | - |
| 7 | - | - | - | Land cover change between 2006–2012 from Non-irrigated arable land to vineyard, from from Non-irrigated arable land to Transitional woodland-shrub, from Complex cultivation patterns to Transitional woodland-shrub, | - |
| 8 | SOIL TYPES: Humic sandy soils, Calci-myceliers chernozem soils, Meadow soils | clay, aleurit, calci-mud | Complex cultivation patterns | - | - |
| 9 | SOIL TEXTURE OF THE UPPER (0–30 cm) LAYER: sandy clay loam, silt loam, loam, silty clay loam, clay loam, silty clay, clay | - | - | - | - |
| 10 | - | Vineyard, Complex cultivation patterns, Coniferous forest, Natural grasslands | - | Annual average temperature is over 10.9 °C | |
| 11 | - | Vineyard, Complex cultivation patterns, Coniferous forest, Natural grasslands | - | Annual evaporation is over 573 mm | |
| 12 | SOIL CHEMISTRY OF THE UPPER (0–30 cm) LAYER: 7.4 < soil ph <= 8.5 CaCO3 content > 14.1% SOIL TEXTURE OF THE UPPER (0–30 cm) LAYER:silt loam, loam | clay, aleurit, calci-mud | - | - | |
| 13 | SOIL TEXTURE OF THE UPPER (0–30 cm) LAYER: sand, loamy sand, sandy loam | - | - | - |
Appendix B


References
- Sala, O.E.; Chapin, F.S.; Armesto, J.J.; Berlow, E.; Bloomfield, J.; Dirzo, R.; Huber-Sanwald, E.; Huenneke, L.F.; Jackson, R.B.; Kinzig, A.; et al. Global biodiversity scenarios for the year 2100. Science 2000, 287, 1770–1774. [Google Scholar] [CrossRef] [PubMed]
- Hulme, P.E. Biological invasions in Europe: Drivers, pressures, states, impacts and responses. Issues Environ. Sci. Technol. 2007, 25, 56–80. [Google Scholar]
- Lowry, E.; Rollinson, E.J.; Laybourn, A.J.; Scott, T.E.; Aiello-Lammens, M.E.; Gray, S.M.; Mickley, J.; Gurevitch, J. Biological invasions: A field synopsis, systematic review, and database of the literature. Ecol. Evol. 2013, 3, 182–196. [Google Scholar] [CrossRef] [PubMed]
- Joshi, C.; de Leeuw, J.; van Duren, I.C. Remote sensing and GIS applications for mapping and spatial modelling of invasive species. In Proceedings of the ISPRS, Istanbul, Turkey, 12–23 July 2004; Volume 35, p. 87. [Google Scholar]
- Mehta, S.V.; Haight, R.G.; Homans, F.R.; Polasky, S.; Venette, R.C. Optimal detection and control strategies for invasive species management. Ecol. Econ. 2007, 61, 237–245. [Google Scholar] [CrossRef]
- Maxwell, B.D.; Lehnhoff, E.; Rew, L.J. The rationale for monitoring invasive plant populations as a crucial step for management. Invasive Plant Sci. Manag. 2009, 2, 1–9. [Google Scholar] [CrossRef]
- Morisette, J.T.; Jarnevich, C.S.; Ullah, A.; Cai, W.; Pedelty, J.A.; Gentle, J.E.; Stohlgren, T.J.; Schnase, J.L. A tamarisk habitat suitability map for the continental United States. Front. Ecol. Environ. 2006, 4, 11–17. [Google Scholar] [CrossRef]
- Genovesi, P.; Scalera, R.; Brunel, S.; Roy, D.; Solarz, W. Towards an Early Warning and Information System for Invasive Alien Species (IAS) Threatening Biodiversity in Europe; European Environment Agency: Copenhagen, Denmark, 2010. [Google Scholar]
- Wittenberg, R.; Cock, M.J.W. Invasive Alien Species: A Toolkit of Best Prevention and Management Practices; Wittenberg, R., Cock, M.J.W., Eds.; CABI: Wallingford, UK, 2001; ISBN 9780851995694. [Google Scholar]
- He, K.S.; Rocchini, D.; Neteler, M.; Nagendra, H. Benefits of hyperspectral remote sensing for tracking plant invasions. Divers. Distrib. 2011, 17, 381–392. [Google Scholar] [CrossRef]
- Maucha, G.; Büttner, G. Validation of the european corine land cover 2000 database. In Proceedings of the 25th EARSeL Symposium on Global Developments in Environmental Earth Observation from Space, Porto, Portugal, 6–11 June 2005. [Google Scholar]
- Kitka, D.; Szilassi, P. Geographic factors influencing the spreading of invasive species: A gis-based case study in the southern great plain of Hungary. J. Landsc. Ecol. 2016, 14, 155–169. [Google Scholar]
- Thuiller, W.; Richardson, D.M.; Midgley, G.F. Will Climate Change Promote Alien Plant Invasions. In Biological Invasions; Springer: Berlin/Heidelberg, Germany, 2007; pp. 197–211. [Google Scholar]
- Dukes, J.S.; Mooney, H.A. Does global change increase the success of biological invaders? Trends Ecol. Evol. 1999, 14, 135–139. [Google Scholar] [CrossRef]
- Kleinbauer, I.; Dullinger, S.; Peterseil, J.; Essl, F. Climate change might drive the invasive tree Robinia pseudacacia into nature reserves and endangered habitats. Biol. Conserv. 2010, 143, 382–390. [Google Scholar] [CrossRef]
- Ladányi, Z.; Rakonczai, J.; Deák, Á.J. A Hungarian landscape under strong natural and human impact in the last century. Carpathian J. Earth Environ. Sci. 2011, 6, 35–44. [Google Scholar]
- Botta-Dukát, Z. Invasion of alien species to Hungarian (semi-)natural habitats. Acta Bot. Hung. 2008, 50, 219–227. [Google Scholar] [CrossRef]
- Bellard, C.; Leroy, B.; Thuiller, W.; Rysman, J.F.; Courchamp, F. Major drivers of invasion risks throughout the world. Ecosphere 2016, 7, e01241. [Google Scholar] [CrossRef]
- Jarnevich, C.S.; Reynolds, L.V. Challenges of predicting the potential distribution of a slow-spreading invader: A habitat suitability map for an invasive riparian tree. Biol. Invasions 2011, 13, 153–163. [Google Scholar] [CrossRef]
- Tokarska-Guzik, B.; Pisarczyk, E. Risk Assessment of Asclepias Syriaca; 2015; Available online: https://circabc.europa.eu/sd/a/8dbd637b-6d8b-4608-b2b1-b51dd21cacde/Asclepias%20syriaca%20RA.pdf (accessed on 11 December 2019).
- Bagi, I. Common milkweed (Asclepias syriaca L.). In The Most Important Invasive Plants in Hungary; Botta-Dukát, Z., Balogh, L., Eds.; Institute of Ecology and Botany, Hungarian Academy of Sciences: Vácrátót, Hungary, 2008; pp. 151–159. [Google Scholar]
- Follak, S.; Schleicher, C.; Schwarz, M. Roads support the spread of invasive Asclepias syriaca in Austria. Die Bodenkult. J. Land Manag. Food Environ. 2018, 69, 257–265. [Google Scholar] [CrossRef]
- Kelemen, A.; Valkó, O.; Kröel-Dulay, G.; Deák, B.; Török, P.; Tóth, K.; Miglécz, T.; Tóthmérész, B. The invasion of common milkweed (Asclepias syriaca) in sandy old-fields—Is it a threat to the native flora? Appl. Veg. Sci. 2016, 19, 218–224. [Google Scholar] [CrossRef]
- Bakacsy, L. Invasion impact is conditioned by initial vegetation states. Community Ecol. 2019, 20, 11–19. [Google Scholar] [CrossRef]
- Gallé, R.; Császár, P.; Makra, T.; Gallé-Szpisjak, N.; Ladányi, Z.; Torma, A.; Ingle, K.; Szilassi, P. Small-scale agricultural landscapes promote spider and ground beetle densities by offering suitable overwintering sites. Landsc. Ecol. 2018, 33, 1435–1446. [Google Scholar] [CrossRef]
- Jurová, J.; Renčo, M.; Gömöryová, E.; Čerevková, A. Effects of the invasive common milkweed (Asclepias syriaca) on nematode communities in natural grasslands. Nematology 2019, 1, 1–16. [Google Scholar] [CrossRef]
- Szitár, K.; Kröel-Dulay, G.; Török, K. Invasive Asclepias syriaca can have facilitative effects on native grass establishment in a water-stressed ecosystem. Appl. Veg. Sci. 2018, 21, 607–614. [Google Scholar] [CrossRef]
- Csontos, P.; Bózsing, E.; Cseresnyés, I.; Penksza, K. Reproductive potential of the alien species Asclepias syriaca (Asclepiadaceae) in the rural landscape. Pol. J. Ecol. 2009, 57, 383–388. [Google Scholar]
- Mezösi, G.; Meyer, B.C.; Loibl, W.; Aubrecht, C.; Csorba, P.; Bata, T. Assessment of regional climate change impacts on Hungarian landscapes. Reg. Environ. Chang. 2013, 13, 797–811. [Google Scholar] [CrossRef]
- Bartha, S.; Campetella, G.; Ruprecht, E.; Kun, A.; Házi, J.; Horváth, A.; Virágh, K.; Molnár, Z. Will interannual variability in sand grassland communities increase with climate change? Community Ecol. 2008, 9, 13–21. [Google Scholar] [CrossRef]
- Rutkowski, L.; Kamiński, D.; Nienartowicz, A.; Filbrandt-Czaja, A.; Adamska, E.; Deptuła, M. New localities and habitat preferences of common milkweed Asclepias syriaca L. in Toruń (Central Poland). Ecol. Quest. 2015, 22, 75–86. [Google Scholar] [CrossRef]
- Szilassi, P. Land cover variability and the changes of land cover pattern in landscape units of Hungary. J. Landsc. Ecol. 2017, 15, 131–138. [Google Scholar]
- Farkas, J.Z.; Rakonczai, J.; Hoyk, E. Environmental, economical and social climate vulnerability: A case study on the Hungarian South Great Plain. TER Tarsad. 2015, 29, 149–174. [Google Scholar]
- Farkas, J.Z.; Hoyk, E.; Rakonczai, J. Geographical analysis of climate vulnerability at a regional scale: The case of the southern great plain in Hungary. Hung. Geogr. Bull. 2017, 66, 129–144. [Google Scholar] [CrossRef]
- Martino, L.; Fritz, M. New insight into land cover and land use in Europe. Stat. Focus 2008, 33, 1–8. [Google Scholar]
- European Comission, Eurostat. LUCAS, 2009: Technical Reference Document C-1: General Implementation Land Cover and Use Water Management Soil Transect Photos; 2009; Available online: https://ec.europa.eu/eurostat/documents/205002/208938/LUCAS2009_C1-Instructions_Revised20130925.pdf/ (accessed on 11 December 2019).
- European Comission, Eurostat. LUCAS, 2012: Technical Reference Document C-1: General Implementation Land Cover and Use Water Management Soil Transect Photos; 2012; Available online: https://ec.europa.eu/eurostat/documents/205002/208012/LUCAS2012_C1-InstructionsRevised_20130110b.pdf (accessed on 11 December 2019).
- European Comission, E. LUCAS Technical Reference Document C1 Instructions for Surveyors; 2015; Available online: https://ec.europa.eu/eurostat/documents/205002/6786255/LUCAS2015-C1-Instructions-20150227.pdf (accessed on 11 December 2019).
- Rabus, B.; Eineder, M.; Roth, A.; Bamler, R. The shuttle radar topography mission—A new class of digital elevation models acquired by spaceborne radar. ISPRS J. Photogramm. Remote Sens. 2003, 57, 241–262. [Google Scholar] [CrossRef]
- Pásztor, L.; Laborczi, A.; Bakacsi, Z.; Szabó, J.; Illés, G. Compilation of a national soil-type map for Hungary by sequential classification methods. Geoderma 2018, 311, 93–108. [Google Scholar] [CrossRef]
- Laborczi, A.; Szatmári, G.; Kaposi, A.D.; Pásztor, L. Comparison of soil texture maps synthetized from standard depth layers with directly compiled products. Geoderma 2019, 352, 360–372. [Google Scholar] [CrossRef]
- Szatmári, G.; Pirkó, B.; Koós, S.; Laborczi, A.; Bakacsi, Z.; Szabó, J.; Pásztor, L. Spatio-temporal assessment of topsoil organic carbon stock change in Hungary. Soil Tillage Res. 2019, 195, 104410. [Google Scholar] [CrossRef]
- Szatmári, G.; Pásztor, L. Comparison of various uncertainty modelling approaches based on geostatistics and machine learning algorithms. Geoderma 2019, 337, 1329–1340. [Google Scholar] [CrossRef]
- Bakacsi, Z.; Tóth, T.; Makó, A.; Barna, G.; Laborczi, A.; Szabó, J.; Szatmári, G.; Pásztor, L. National level assessment of soil salinization and structural degradation risks under irrigation. Hung. Geogr. Bull. 2019, 68, 141–156. [Google Scholar] [CrossRef]
- European Environment Agency (EEA). EEA Corine Land Cover (CLC) 2006, Version 18.5.1. Methodology. 2016. Available online: https://www.eea.europa.eu/publications/COR0-landcover (accessed on 11 December 2019).
- Szentimrey, T.; Bihari, Z.; Lakatos, M.; Szalai, S. Mathematical, methodological questions concerning the spatial interpolation of climate elements. Idojaras 2011, 115, 1–11. [Google Scholar]
- László Gyalog, L.S.I. of H. Geological Map of Hungary Scale 1:100 000. 2005. [Google Scholar]
- Lunardon, N.; Menardi, G.; Torelli, N. ROSE: A Package for Binary Imbalanced Learning. Contrib. Res. Artic. 2014, 6, 79–89. [Google Scholar] [CrossRef]
- Breiman, L. Randomforest2001. Mach. Learn. 2001. [Google Scholar]
- Quinlan, J.R. Combining Instance-Based and Model-Based Learning. In Proceedings of the Tenth International Conference on Machine Learning, Amherst, MA, USA, 27–29 June 1993. [Google Scholar]
- Johnson, T.R.; Kuhn, K.M. Bayesian Thurstonian models for ranking data using JAGS. Behav. Res. Methods 2013. [Google Scholar] [CrossRef]
- Kuhn, M.; Wing, J.; Weston, S.; Williams, A.; Keefer, C.; Engelhardt, A.; Cooper, T.; Mayer, Z.; Kenkel, B.; R Core Team; et al. Caret: Classification and Regression Training. In R Packag. Version 6.0-79; 2018; Available online: https://cran.r-project.org/web/packages/caret/caret.pdf (accessed on 11 December 2019).


| Absence (Observed) | Presence (Observed) | |
|---|---|---|
| Absence (predicted) | 186 | 10 |
| Presence (predicted) | 28 | 19 |
| Significance Level of a Given Geographical Condition (Variables) | Name of the Geographical Conditions (Variables) |
|---|---|
| 100.00% | Soil texture of the upper soil layer (between 0–30 cm) |
| 11.82% | Soil types |
| 11.11% | Land cover in 2012 |
| 8.29% | Geology |
| 7.58% | Land cover change between 1990–2000 |
| 7.05% | Land cover change between 2006–2012 |
| 3.70% | CaCO3 content of the upper soil layer (between 0–30 cm) |
| 3.70% | pH of the upper soil layer (between 0–30 cm) |
| 2.82% | Annual precipitation |
| 2.65% | Annual average temperature |
| 1.59% | Annual evaporation |
| Name | Reference | Type | |
|---|---|---|---|
| Soil | Soil type | [40] | Categorical |
| United States Department of Agriculture (USDA) soil texture (0–30 cm) | [41] | Categorical | |
| Calcium carbonate (0–30 cm) [%] | [40] | Continuous | |
| pH (0–30 cm) | [40] | Continuous | |
| Sand content (0–30 cm) [%] | [42] | Continuous | |
| Clay content (0–30 cm) [%] | [42] | Continuous | |
| Silt content (0–30 cm) [%] | [42] | Continuous | |
| Organic matter content (0–30 cm) [%] | [42,43] | Continuous | |
| Rooting depth [m] | [40] | Continuous | |
| Topography | Groundwater level [m] | [44] | Continuous |
| Vertical distance to channel network [m] | derived from a digital elevation model | Continuous | |
| Distance to channel network [m] | derived from a digital elevation model | Continuous | |
| Land cover | CORINE Land Cover (2012) | [45] | Categorical |
| CORINE Land Cover (1990–2000) | [45] | Categorical | |
| CORINE Land Cover (2000–2006) | [45] | Categorical | |
| CORINE Land Cover (2006–2012) | [45] | Categorical | |
| Climate | Long-term mean annual precipitation | [46] | Continuous |
| Long-term mean annual temperature | [46] | Continuous | |
| Long-term mean annual evaporation | [46] | Continuous | |
| Long-term mean annual evapotranspiration | [46] | Continuous | |
| Geology | Parent material | [44,47] | Categorical |
© 2019 by the authors. Licensee MDPI, Basel, Switzerland. This article is an open access article distributed under the terms and conditions of the Creative Commons Attribution (CC BY) license (http://creativecommons.org/licenses/by/4.0/).
Share and Cite
Szilassi, P.; Szatmári, G.; Pásztor, L.; Árvai, M.; Szatmári, J.; Szitár, K.; Papp, L. Understanding the Environmental Background of an Invasive Plant Species (Asclepias syriaca) for the Future: An Application of LUCAS Field Photographs and Machine Learning Algorithm Methods. Plants 2019, 8, 593. https://doi.org/10.3390/plants8120593
Szilassi P, Szatmári G, Pásztor L, Árvai M, Szatmári J, Szitár K, Papp L. Understanding the Environmental Background of an Invasive Plant Species (Asclepias syriaca) for the Future: An Application of LUCAS Field Photographs and Machine Learning Algorithm Methods. Plants. 2019; 8(12):593. https://doi.org/10.3390/plants8120593
Chicago/Turabian StyleSzilassi, Péter, Gábor Szatmári, László Pásztor, Mátyás Árvai, József Szatmári, Katalin Szitár, and Levente Papp. 2019. "Understanding the Environmental Background of an Invasive Plant Species (Asclepias syriaca) for the Future: An Application of LUCAS Field Photographs and Machine Learning Algorithm Methods" Plants 8, no. 12: 593. https://doi.org/10.3390/plants8120593
APA StyleSzilassi, P., Szatmári, G., Pásztor, L., Árvai, M., Szatmári, J., Szitár, K., & Papp, L. (2019). Understanding the Environmental Background of an Invasive Plant Species (Asclepias syriaca) for the Future: An Application of LUCAS Field Photographs and Machine Learning Algorithm Methods. Plants, 8(12), 593. https://doi.org/10.3390/plants8120593