Article

Identification of Anther Length QTL and Construction of Chromosome Segment Substitution Lines of Oryza longistaminata

Plant Breeding Laboratory, Faculty of Agriculture, Kyushu University. 744, Motooka, Nishi-ku, Fukuoka 819-0395, Japan
*
Author to whom correspondence should be addressed.
Plants 2019, 8(10), 388; https://doi.org/10.3390/plants8100388
Submission received: 30 August 2019 / Revised: 22 September 2019 / Accepted: 29 September 2019 / Published: 29 September 2019
(This article belongs to the Special Issue Genetics in Rice)

Abstract

:
Life histories and breeding systems strongly affect the genetic diversity of seed plants, but the genetic architectures that promote outcrossing in Oryza longistaminata, a perennial wild species in Africa, are not understood. We conducted a genetic analysis of the anther length of O. longistaminata accession W1508 using advanced backcross quantitative trait locus (QTL) analysis and chromosomal segment substitution lines (CSSLs) in the genetic background of O. sativa Taichung 65 (T65), with simple sequence repeat markers. QTL analysis of the BC3F1 population (n = 100) revealed that four main QTL regions on chromosomes 3, 5, and 6 were associated to anther length. We selected a minimum set of BC3F2 plants for the development of CSSLs to cover as much of the W1508 genome as possible. The additional minor QTLs were suggested in the regional QTL analysis, using 21 to 24 plants in each of the selected BC3F2 population. The main QTLs found on chromosomes 3, 5, and 6 were validated and designated qATL3, qATL5, qATL6.1, and qATL6.2, as novel QTLs identified in O. longistaminata in the mapping populations of 94, 88, 70, and 95 BC3F4 plants. qATL3, qATL5, and qATL6.1 likely contributed to anther length by cell elongation, whereas qATL6.2 likely contributed by cell multiplication. The QTLs were confirmed again in an evaluation of the W1508ILs. In several chromosome segment substitution lines without the four validated QTLs, the anthers were also longer than those of T65, suggesting that other QTLs also increase anther length in W1508. The cloning and diversity analyses of genes conferring anther length QTLs promotes utilization of the genetic resources of wild species, and the understanding of haplotype evolution on the differentiation of annuality and perenniality in the genus Oryza.

1. Introduction

Life histories and breeding systems strongly affect the genetic diversity of seed plants. Annuals tend to allocate their resources to sexual reproduction to produce as many flowers as possible for the one-time dispersal of seeds. By contrast, perennial species tend to primarily allocate resources to vegetative growth because of the need to occupy physical space, and to use local water and nutrient resources over an extended life span depending on the ecological circumstances [1].
Perennial species tend to show higher heterozygosity when compared with the annual species or domesticated species [2]. Heterozygosity has been found to correlate with fitness-related traits, such as survival probability, reproductive success, and disease resistance [3,4,5,6,7]. Populations of perennials maintain high genetic diversity by producing few but large floral organs, and by promoting relatively high outcrossing rates with mechanisms to prevent self-pollination—such as self-incompatibility or monoecious flowers [8,9]. An understanding of the genetic architecture of a favorable trait that promotes outcrossing will help to answer a question: What set of polymorphisms or genes contribute to outcrossing characteristics? However, the genetic basis of breeding system-associated traits is not fully understood.
There are eight species of the genus Oryza with the AA genome: Two Asian wild species (O. rufipogon Griff. and O. nivara Sharma et Shastry), two wild species in Africa (O. longistaminata A. Chev. & Roehr. and O. barthii A. Chev.), one wild species in South America (O. glumaepatula Steud.), one wild species in Australia (O. meridionalis Ng.), and two cultivated species [10]. Of the two cultivated rice species, O. sativa L. (Asian rice) is domesticated from the Asian perennial wild species O. rufipogon, and O. glaberrima Steud. (African rice) is domesticated from the African annual wild species O. barthii. The Asian cultivated and wild species form a species complex in which the production of hybrid progeny is possible. The differentiation of annual (O. nivara) and perennial (O. rufipogon) species reflects adaptation to their ecological niches [11,12]. In Africa, the annual species O. barthii and the perennial species O. longistaminata occupy different ecological habitats. Oryza longistaminata is characterized by a rhizome [13], and has a particularly large anther [14], as indicated by the species name ‘longistaminata’ (long stamen). Thus, the anther is one of the key traits of this species. Additionally, it has high heterozygosity [15] that is likely due to its self-incompatibility and high outcrossing rate, achieved by the large reproductive organs [16]. Cultivated rice is a self-pollinated species with an outcrossing rate of less than 4% [17]. The outcrossing rate of perennial wild species tends to be higher than that of cultivated species. That of O. longistaminata and O. rufipogon reaches 100% in certain combinations of hybridization, although the rate for wild species typically ranges from 3.2% to 50% [18,19]. To fully understand perenniality and their outcrossing characteristics, we need to investigate the genetic architectures of their reproductive systems.
Chromosomal segment substitution lines (CSSLs) facilitate the genetic analysis and characterization of quantitative traits of donor varieties, or species in the genetic background of a recurrent parent. CSSLs are powerful genetic tools for the identification of quantitative trait loci (QTLs) [20,21,22,23] in trials across different years and environments [24,25,26]. Studies of anther QTLs have been conducted with F2 populations and recombinant inbred line (RIL) populations derived from the interspecific crosses between O. rufipogon and O. sativa [27,28,29], or intraspecific crosses between the indica and japonica subspecies of O. sativa [30]. However, QTLs that confer anther length in O. longistaminata have not been examined and validated using near-isogenic lines (NIL) in the genetic background of O. sativa.
In this study, we elucidated the genetic basis of anther length in O. longistaminata, by using advanced backcross QTL analysis and CSSLs in the genetic background of O. sativa L. cv. Taichung 65 (T65). QTLs conferring anther length identified in BC3F1 and BC3F2 populations were validated in the BC3F4 population, in which single QTL regions were segregating. We validated the QTLs again by constructing CSSLs of O. longistaminata. NILs were evaluated to characterize the histological cause of increased anther length. CSSLs chromosome segments derived from O. longistaminata acc. W1508 were named as W1508ILs, using the term ‘introgression lines’ (ILs) to refer to CSSLs based on interspecific hybridization.

2. Results

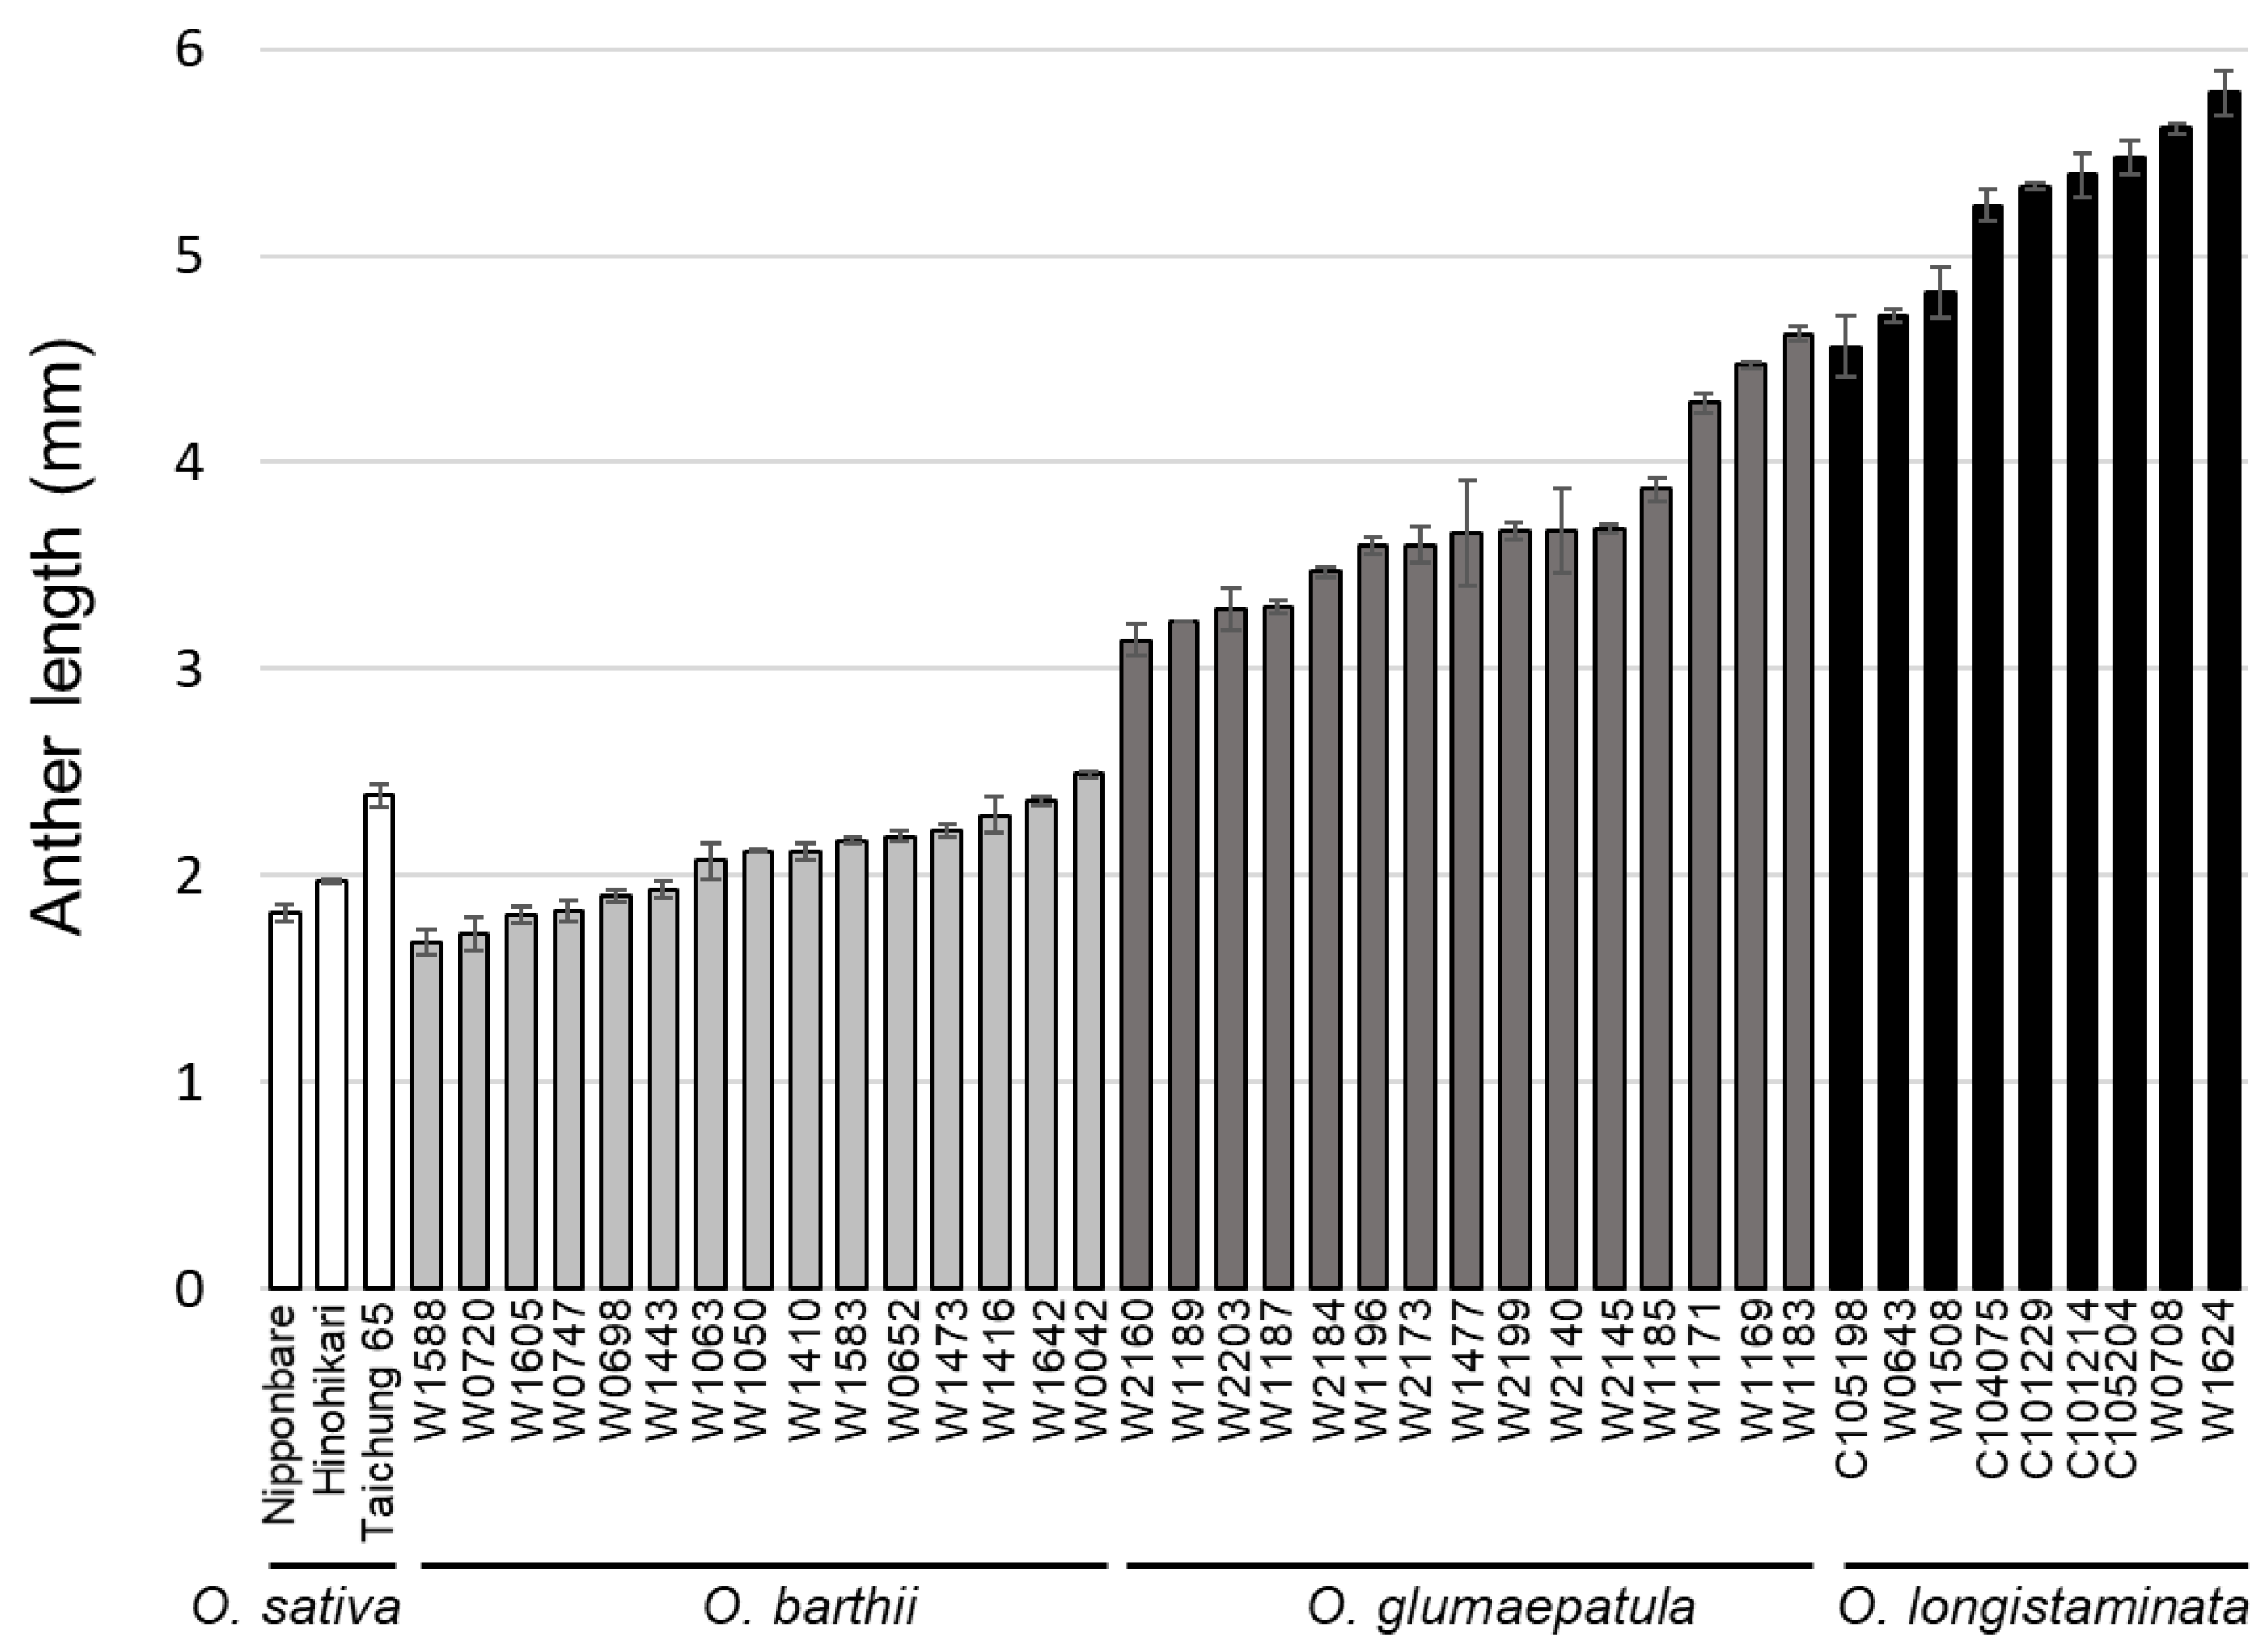
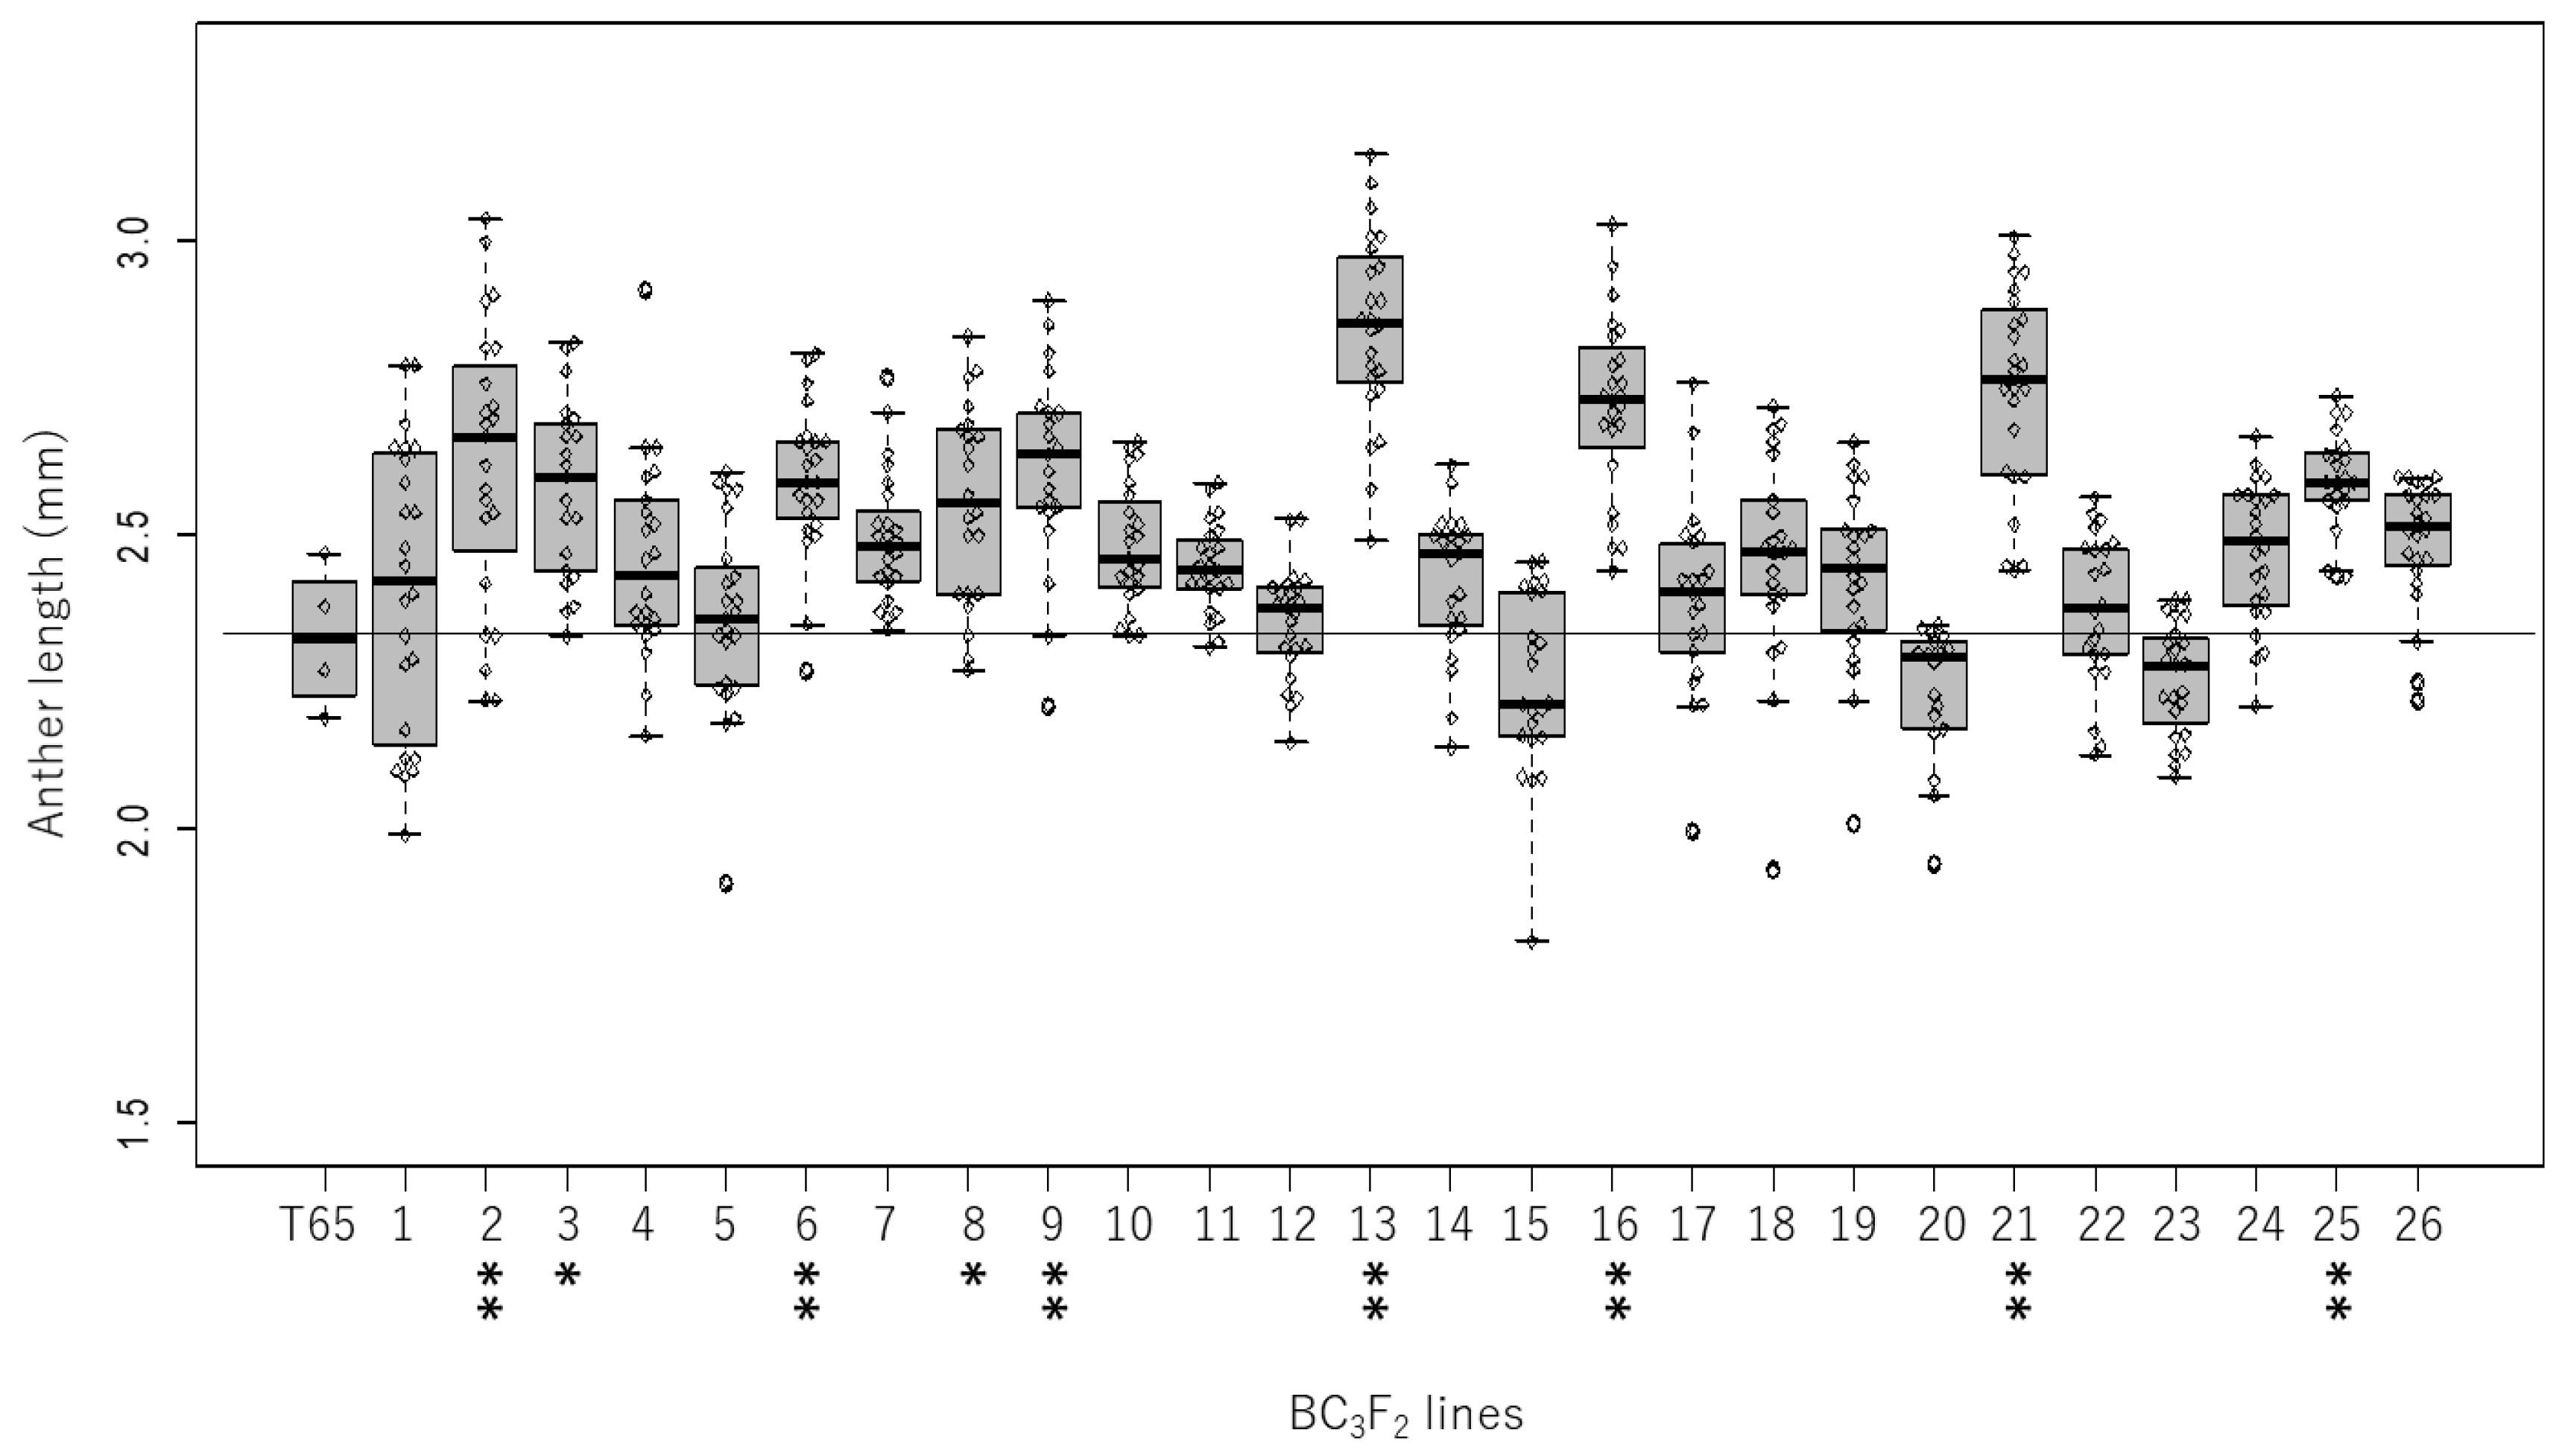
2.1. Genetic Variation in Anther Length in the Backcrossed Population

We measured the anther length of O. barthii, O. glumaepatula, and O. longistaminata (Figure 1) to evaluate the genetic variation in anther length. The anther length of O. longistaminata were longer than those of all O. barthii and O. glumaepatula accessions, except for O. glumaepatula W1183. To identify the QTLs derived from O. longistaminata in a uniform genetic background, we developed CSSLs carrying W1508 (O. longistaminata) chromosomal segments in the genetic background of O. sativa T65.
We developed 372 BC3F1 plants by recurrent backcrossing to F1, BC1, and BC2 plants to develop the CSSLs of W1508 (Figure 2). We genotyped 100 BC3F1 plants, and selected 26 BC3F1 plants that covered as much of the W1508 genome as possible, to minimize the number of candidate CSSLs (Figure S1). Simple interval mapping (n = 100) suggested that O. longistamina alleles at one QTL on chromosome (Chr.) 3, one QTL on Chr. 5, and two QTLs on Chr. 6 increased the anther length (Table S1). The other peaks were below the experiment-wise threshold levels of the logarithm of odds (LOD) at LODα = 0.05 = 2.65 and LODα = 0.01 = 3.40. Multiple QTL analysis using forward/backward model selection also suggested that these four QTLs additively increase anther length without epistasis, which explains more than half (55.5%) of the phenotypic variation in the BC3F1 population (Figure S2, Table S1).
To construct CSSLs, and to perform regional QTL analysis using 21 to 24 plants of the BC3F2 populations derived from the selected 26 BC3F1 plants covering the whole genome, we defined a heterozygous “target region” as a genomic region in BC3F1 plants for the fixation of the W1508-derived segments on the homozygous condition in the progeny (Figure S1). The anther length of T65 was 2.33 mm and that of W1508 was 4.33 mm. The mean anther length of the 26 BC3F2 lines ranged from 2.23 to 2.85 mm. Nine BC3F2 lines had a significantly higher mean anther length than T65, but none had a significantly lower mean anther length (Figure 3). Our working hypothesis was that the W1508 segments in the 9 BC3F2 lines with a higher mean anther length (boxed in Figure S1) most likely had QTLs associated with longer anther length. Simple interval mapping in the 26 BC3F2 populations at the target regions detected 13 minor QTLs on Chrs. 1, 2, 3, 4, 5, 6, 9, 10, and 11 (Table S2).

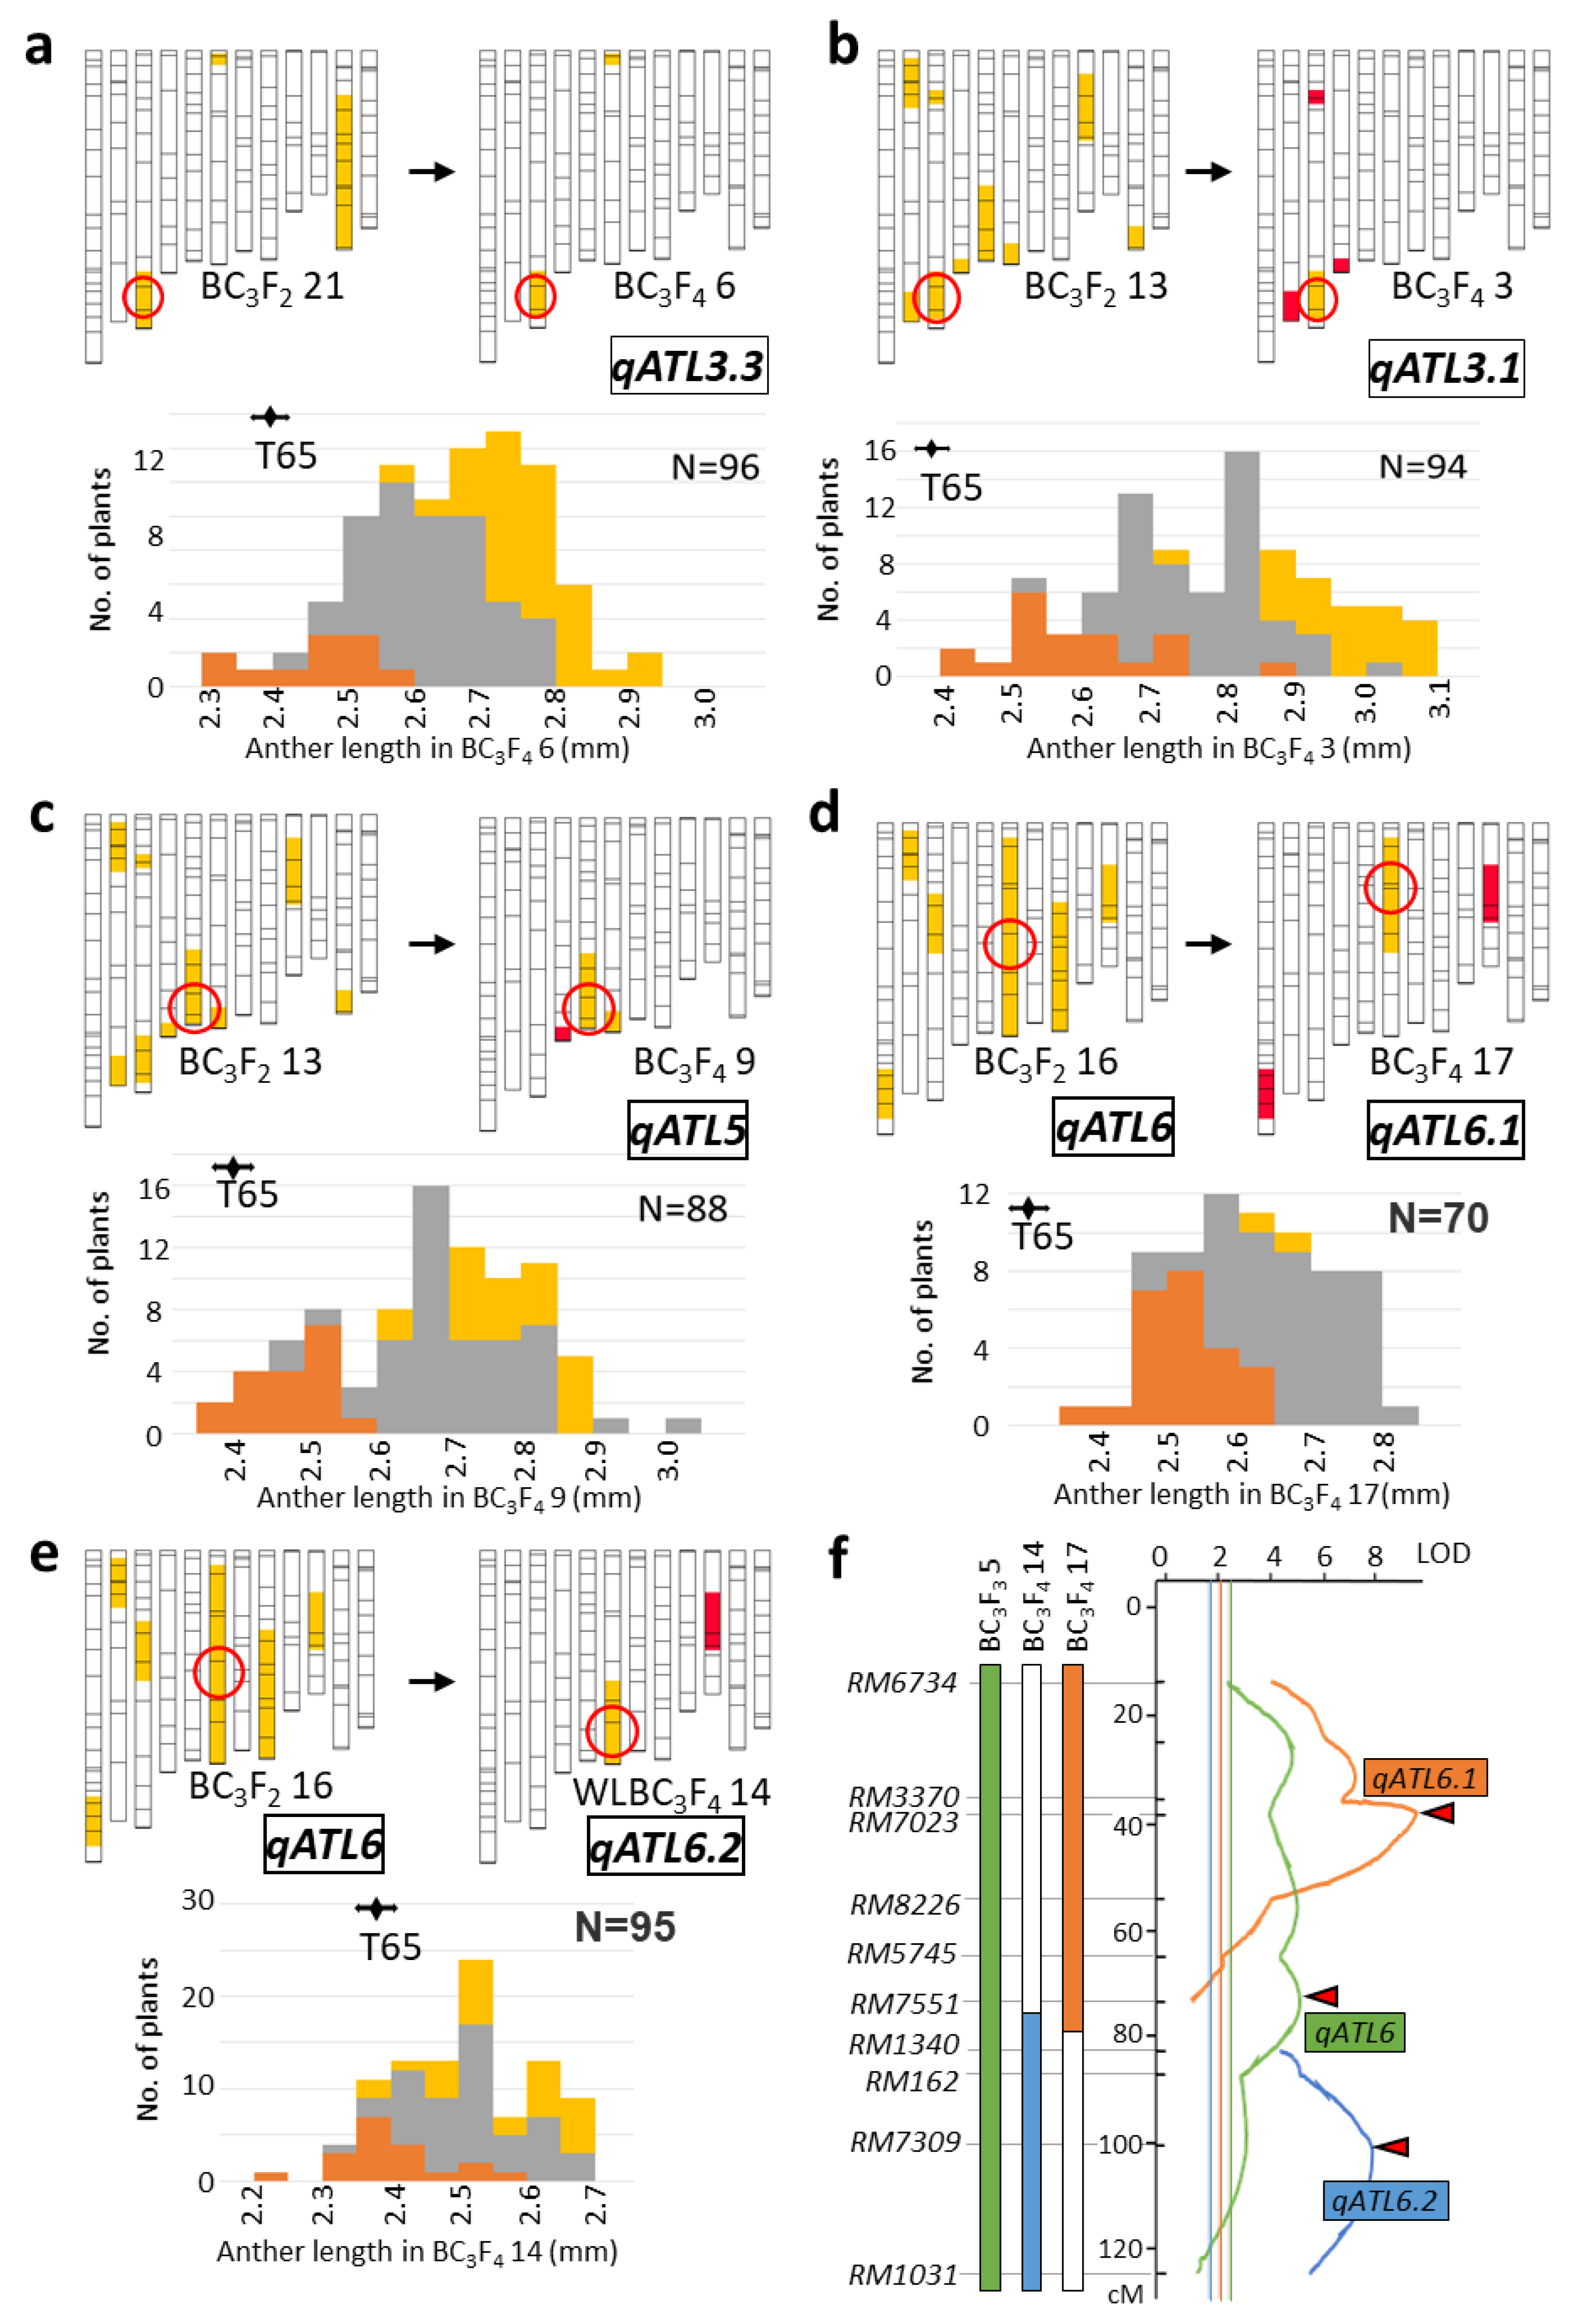
2.2. Validation of QTL

For the identification of major QTLs conferring anther length, we conducted QTL analysis on BC3F2 13, 16, and 21 families that had the highest anther length means of 2.88 mm, 2.82 mm, and 2.68 mm, respectively (Figure 4). In the BC3F2 21 population (n = 44), there was segregation on chromosomes 3, 6, and 11 (Figure 4a). The QTL positively regulating anther length located between RM3436 and RM5959 on chromosome 3 was named qATL3.3. It was validated using the more advanced BC3F4 6 (n = 96) generation at 151.5 cM on chromosome 3, with the LOD value 18.27. qATL3.3 explained 58.4% of the phenotypic variance in the BC3F4 population, with 0.17 mm of additive effect and 0.03 mm of dominant effect (Table S2).
Among the 71 plants in the BC3F2 13 population, the range of anther length was 2.26–3.32 mm, with a population mean of 2.82 mm. Simple interval mapping revealed two QTL: qATL3.1 at 137.6 cM on Chr. 3, and qATL5 at 122 cM on Chr. 5. Segregation distortion at qATL5 was detected at the closest marker, RM1054, with a ratio of 22 T65 homozygotes: 43 T65 heterozygotes: 6 W1508 homozygotes. qATL3.1 and qATL5 were each independently validated in the more advanced BC3F4 3 and nine populations, respectively, derived from the BC3F2 13 population (Figure 4b,c). qATL3.1 was detected again at 142.5 cM on Chr. 3, with an LOD score of 15.70, an additive effect of 0.19 mm, and a dominance effect of −0.002 mm, explaining 47.6% of the phenotypic variance (Table S2). qATL3.3 and qATL3.1 seemed to be identical QTLs, because substitution of the O. longistaminata chromosome segment ranged between the SSR markers RM3525 and RM5959. We unified the QTL names qATL3.3 and qATL3.1 as the single QTL qATL3.1. In BC3F4 9, qATL5 was detected again at 121.4 cM on the long arm of Chr. 5, with an LOD score of 17.28, an additive effect of 0.16 mm, and a dominance effect of 0.08 mm, explaining 59.6% of the phenotypic variation.
The BC3F2 16 population (n = 86) segregated at genomic regions on Chrs. 1, 2, 3, 6, 8, and 10, with anther lengths ranging from 2.21 to 3.10 mm and a population mean of 2.68 mm (Figure 4d,e). In the QTL analysis, the QTLs derived from O. longistaminata on Chr. 6 (qATL6) increased anther length. Because the genomic region of qATL6 ranged widely from 13.8 to 114.8 cM, with LOD scores greater than the 5% significance level, we assumed that multiple QTLs on Chr. 6 were linked (Figure 4f). We examined two progeny lines of the BC3F2 16 population, BC3F4 17 and 14, that had the separated O. longistaminata chromosome segments on the short and long arms, respectively. In BC3F4 17, QTL qATL6.1 was detected at 38.3 cM on Chr. 6S (Figure 4d,f), which, with an additive effect of 0.06 mm and a dominance effect of 0.08 mm, explained 48.8% of the phenotypic variation in anther length. RM7023 segregation distortion of the nearest-neighbor marker, RM7023, gaved at a ratio of 25 T65 homozygotes: 47 T65 heterozygotes: 1 W1508 homozygotes. In BC3F4 14, a QTL designated as qATL6.2 was detected on the long arm of Chr. 6 (Figure 4e,f) at RM7309, with an LOD score of 7.91, an additive effect of 0.08 mm, and a dominance effect of 0.04 mm.

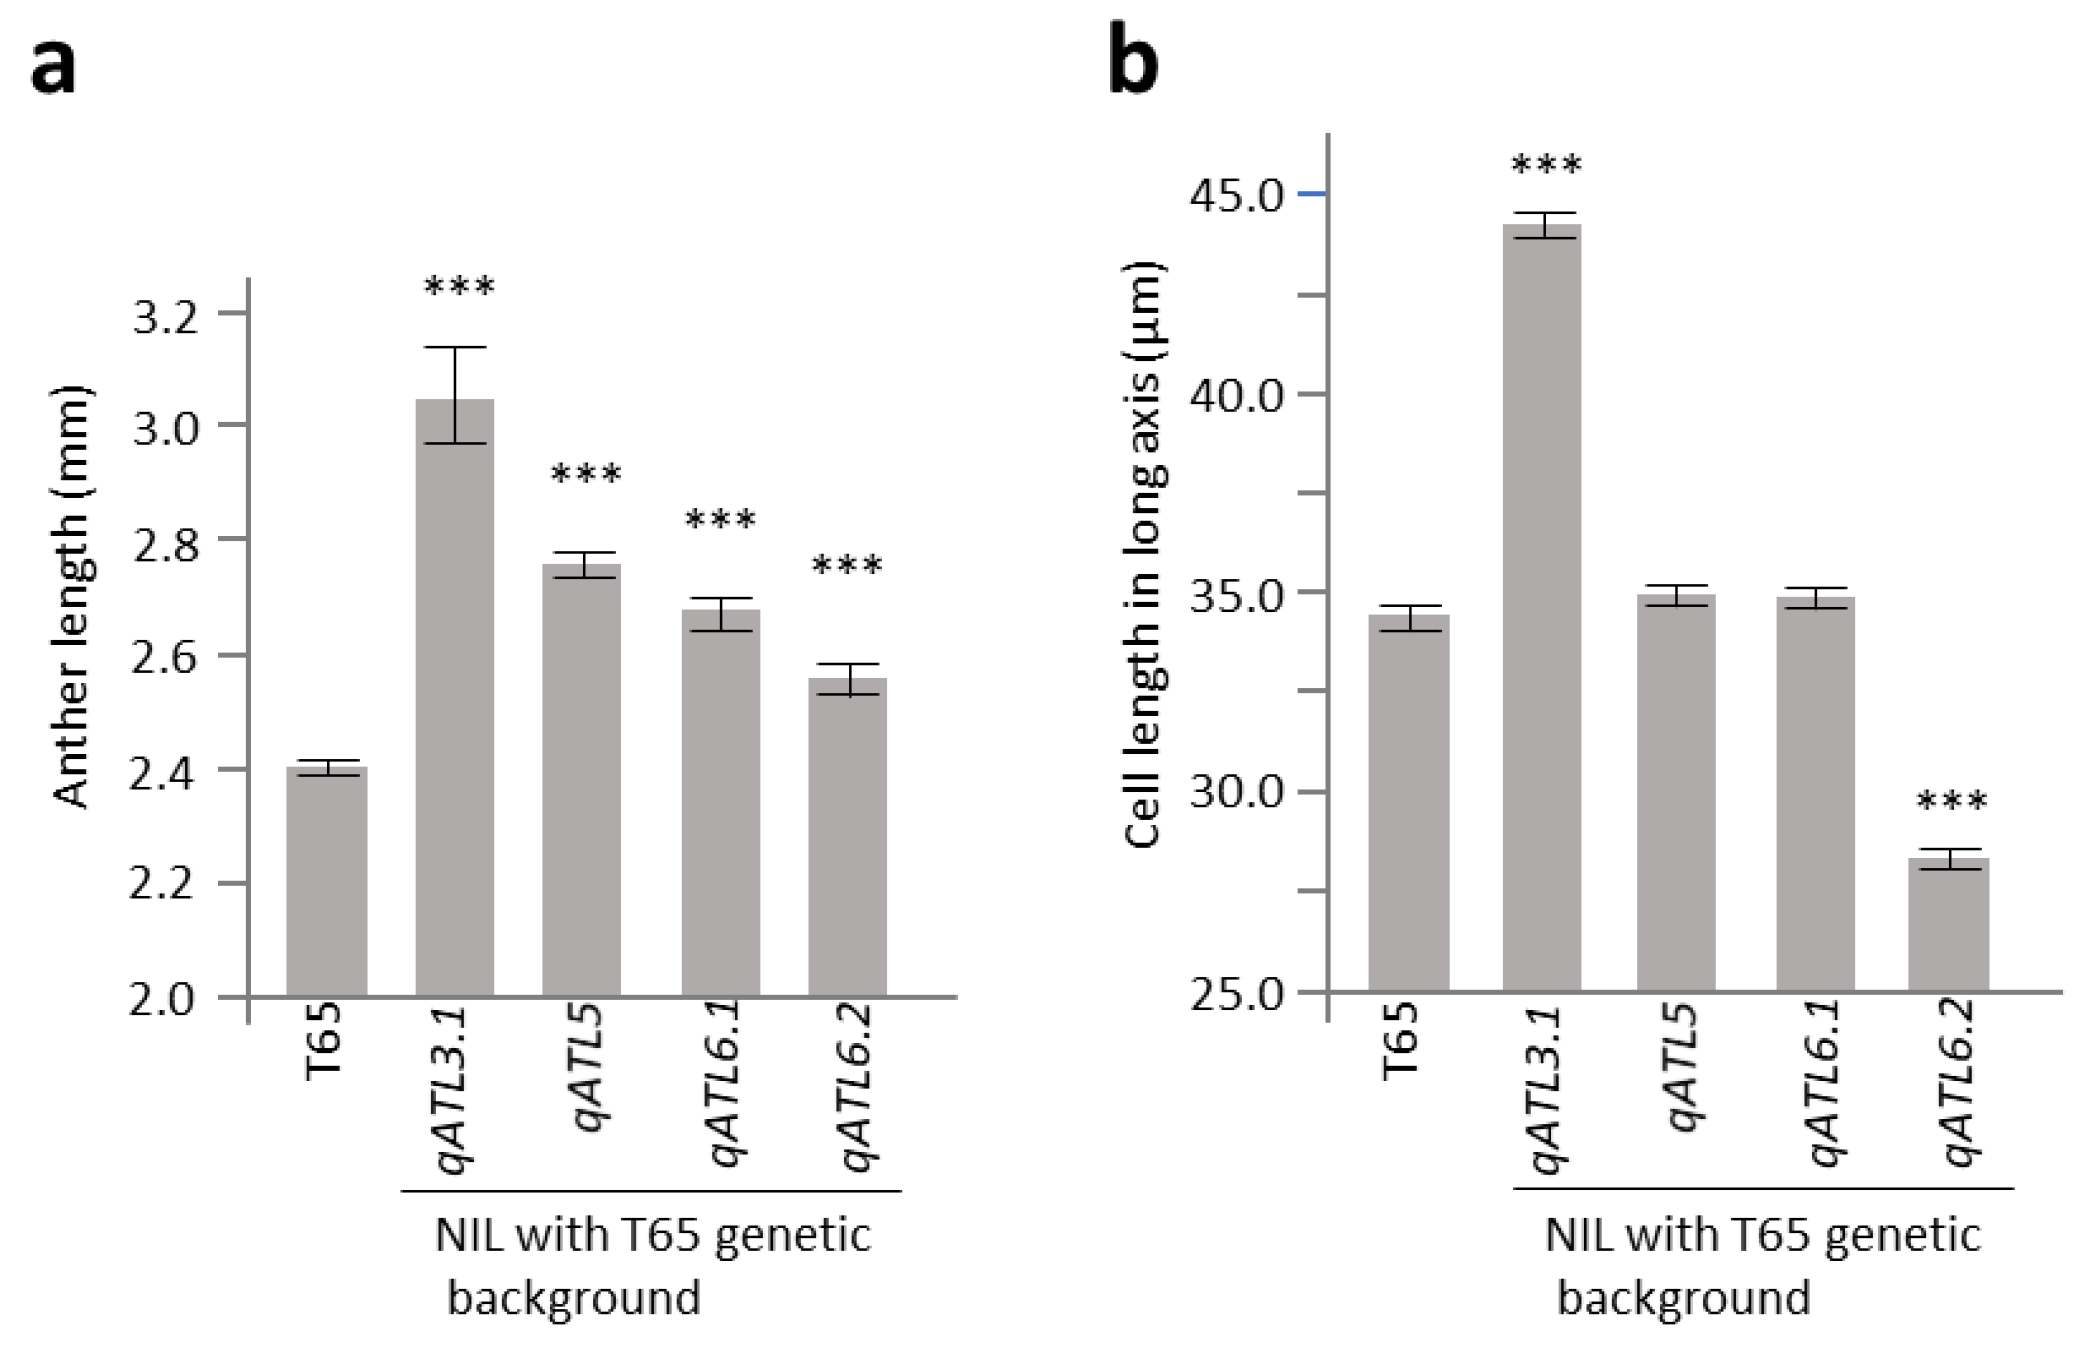
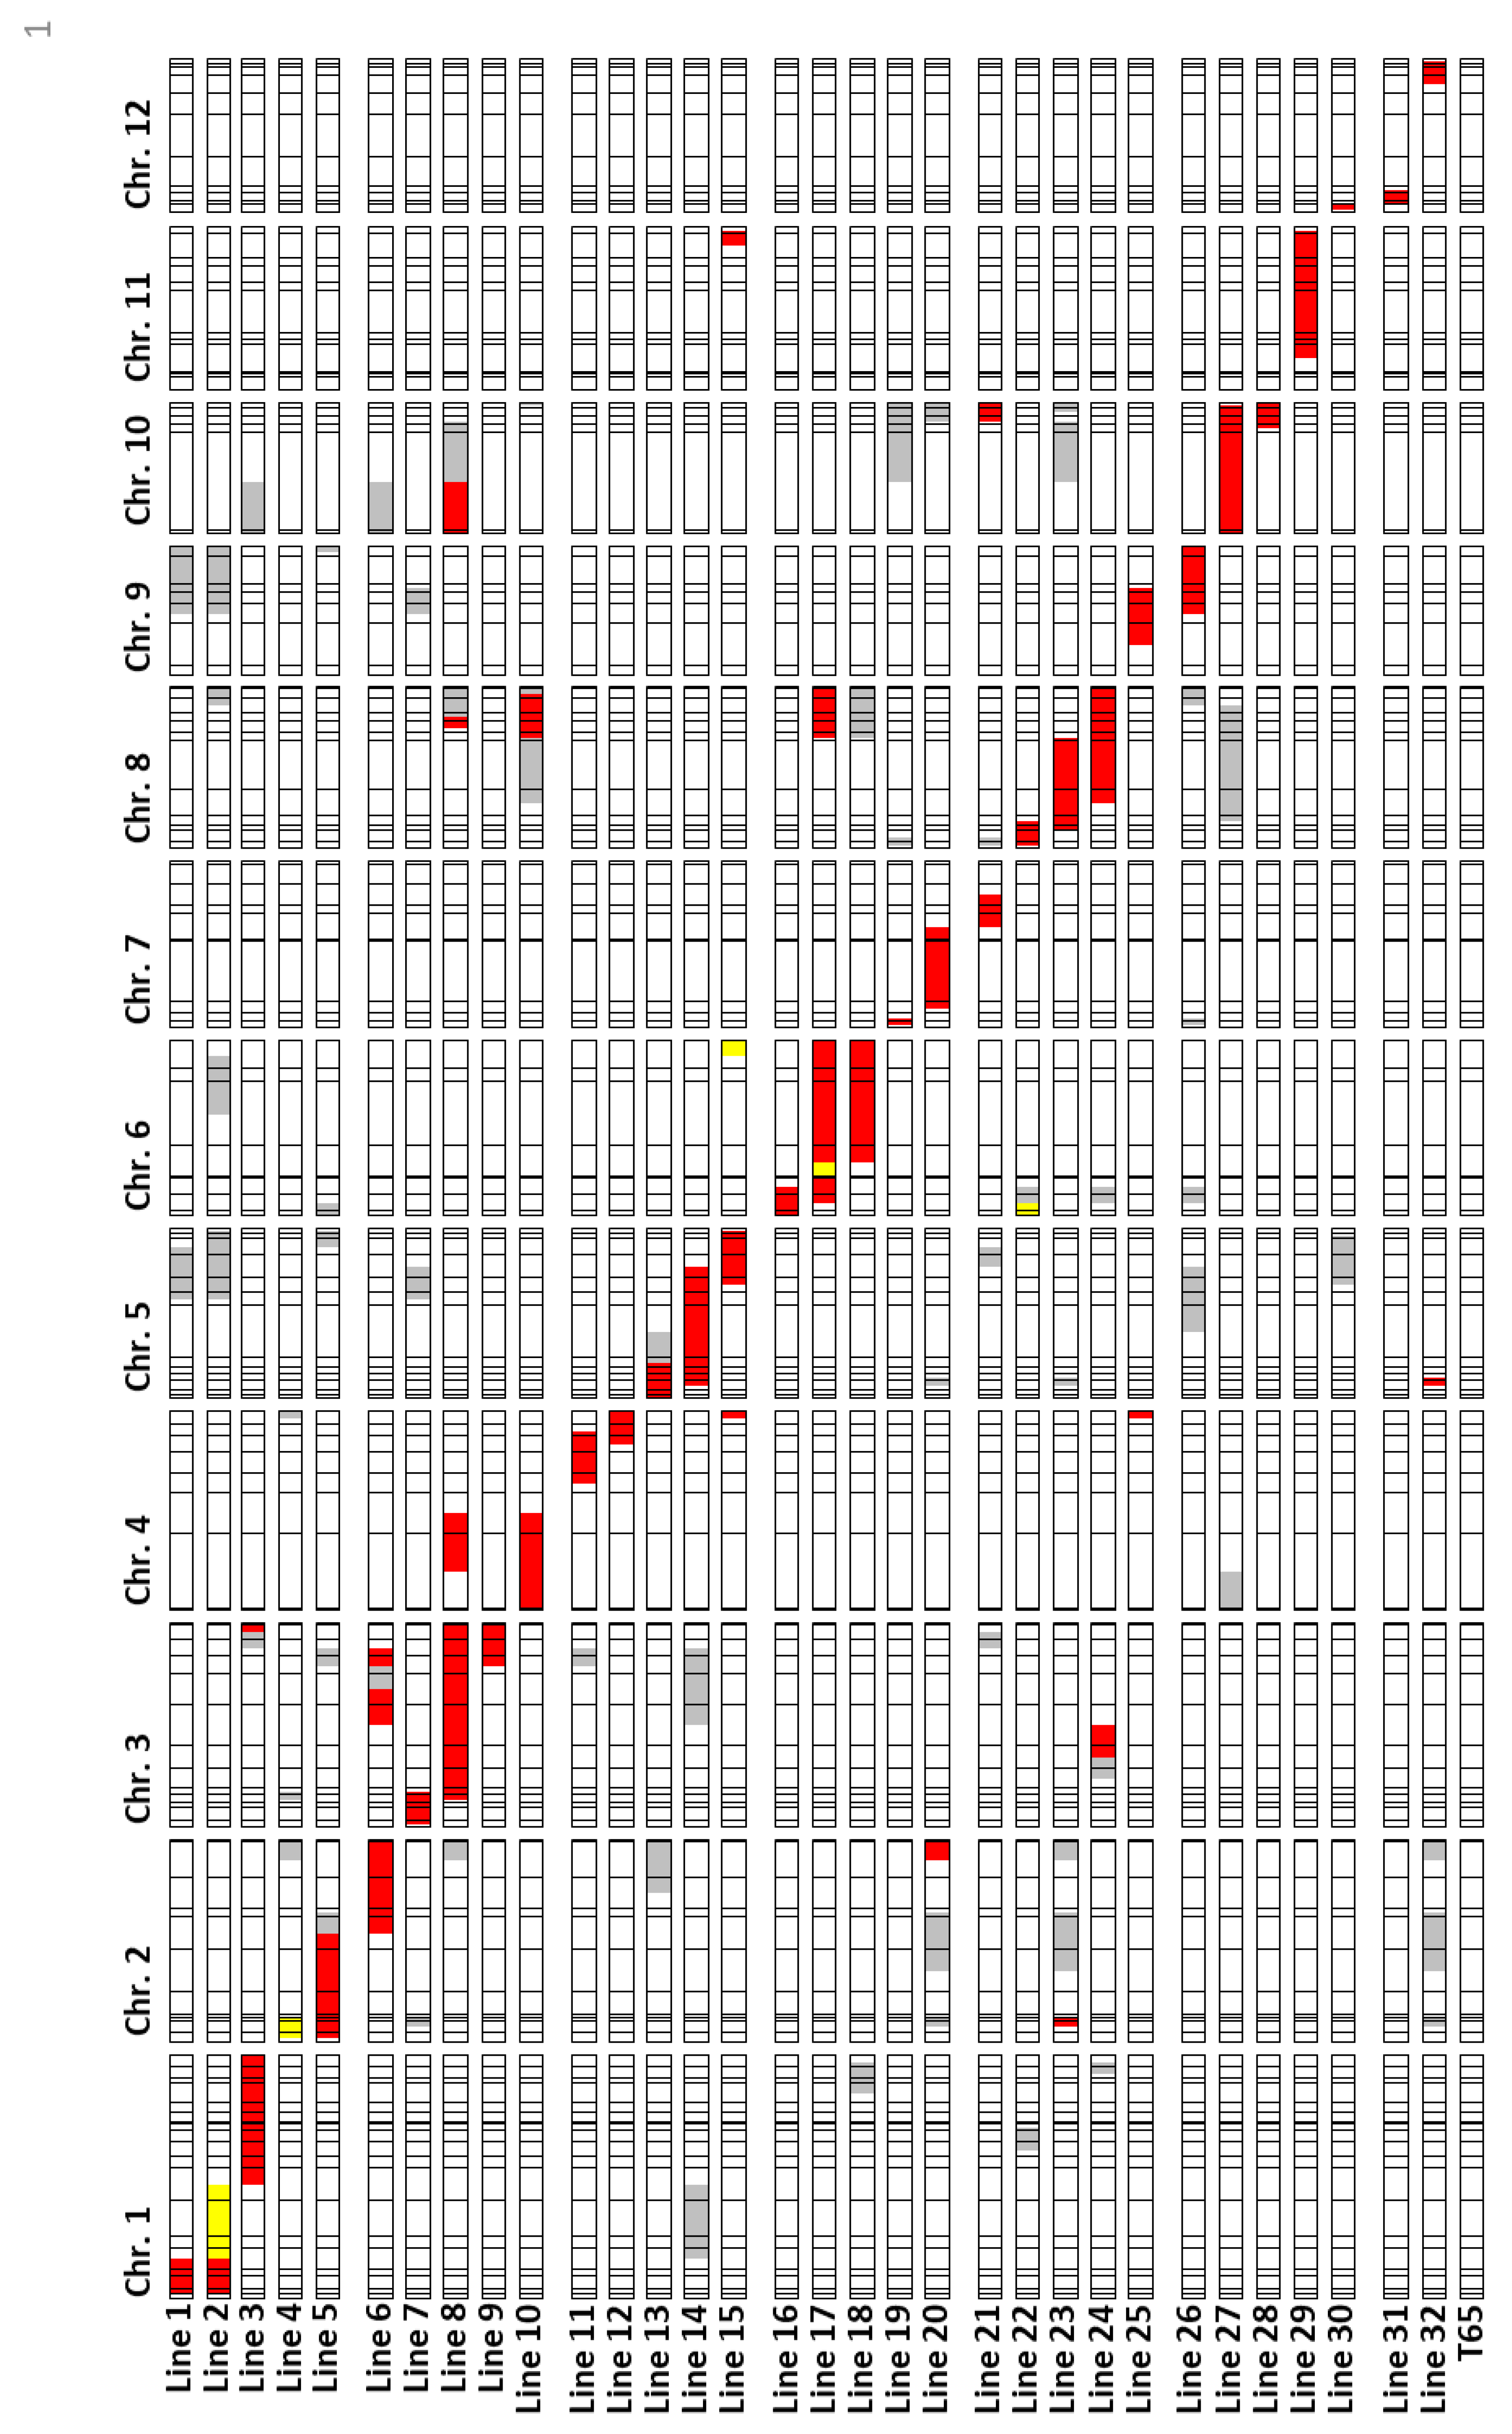
2.3. Characterization of Anther Length QTL Using Near-Isogenic Lines

To understand the cytological characteristics of the anther length in near-isogenic lines (NILs) for qATL3.1, qATL5, qATL6.1, and qATL6.2, we investigated the longitudinal lengths of epidermal cells (cell length, CL) in the mid-anther region. The anther length of the NILs for qATL3.1, qATL5, qATL6.1, and qATL6.2 were significantly longer than those of T65, according to Dunnett’s multiple comparison (Figure 5a). The CL of the qATL3.1 NIL was significantly longer than that of T65, but that of the qATL5 and qATL6.1 NILs was not different (Figure 5b). The average CL in the qATL6.2 NIL was significantly smaller than that in T65. These results suggest that the positive effect of qATL3.1 on anther length was due primarily to cell elongation in the longitudinal direction, whereas that of the other QTLs, particularly qATL6.2, might have been due to cell number. Next, we investigated the anther length and pollen grain numbers (PGN) of T65, W1508, and the QTL NILs. PGNs increased in the order of 1910.0 in T65, 2091.1 in the qATL6B NIL, 2598.1 in the qATL6.1 NIL, 2690.1 in the qATL5 NIL, 3058.8 in the qATL3.1 NIL, and 6862.2 in W1508.

2.4. Evaluation on W1508Ils

The target chromosome segments of W1508 selected in BC3F1 were fixed to homozygotes for the W1508 genes in BC3F2, BC3F3, BC3F4, and BC3F5, to construct the W1508ILs (Figure 6). We selected 32 lines covering the whole genomic region of W1508 using 125 SSR markers. Introgression of W1508 chromosomes did not occur at RM3148 on Chr. 1; RM5635 on Chr. 4; RM2381 on Chr. 7; RM8219 on Chr. 9; RM7557, RM26090, and RM5918 on Chr. 11; or RM3455, RM7195, RM1261, and RM309 on Chr. 12. The mean anther length in four or five plants increased significantly in W1508ILs 1, 2, 3, 7, 8, 9, 15, and 29, and decreased significantly in W1508IL 20 (Table S3). W1508ILs 8 and 9 carried qATL3, and W1508IL 15 carried qATL5. However, the mean anther length in W1508IL 17 (carrying qATL6.1) or 18 (carrying qATL6.2) did not increase significantly in five plant samples, suggesting that four or five replicates were not sufficient to detect the QTLs, despite being major QTL, for increased anther length. The minor QTLs detected in the BC3F2 populations were likely associated with the mean anther length in W1508ILs 1 and 2 at RM3604, and in W1508IL 7 at RM5755.

3. Discussion

Polygenes or QTLs control most agronomic traits. For genetic analysis of quantitative traits, segregating populations such as F2, RIL, and advanced backcross populations allow complicated genetic architectures to be disassembled to a few genetic elements, thereby increasing the power of detection. Because our objective was to construct a platform from which to analyze the genetic difference between O. sativa and O. longistaminata, we evaluated the phenotypic character anther length, which is a key character in O. longistaminata, and genotyped BC3 populations and W1508ILs. We used genome-wide QTL exploration and model fitting procedures, and determined that phenotypic variation in anther length was explained by four QTLs on Chrs. 3, 5, and 6. Our subsequent single-factor segregation analyses of QTLs in BC3F4 populations validated qATL3.1 (with an additive effect of 0.17 mm), qATL3.3 (0.19 mm), qATL5 (0.16 mm), qATL6.1 (0.06 mm), and qATL6.2 (0.08 mm). qATL3.1 and qATL3.3 were detected near one another on Chr. 3. Although we considered these two QTLs to be identical, their LOD peaks indicated different genomic positions, most likely owing to the slight segregation distortion around qATL3.3 (df = 2, P = 0.006). QTLs regulating anther length were also reported around the same regions in O. rufipogon [27,28], and close to the qATL5 region in F2 populations derived from O. sativa × O. rufipogon [21], and in RILs derived from O. sativa subsp. indica × O. rufipogon W1944 [28,29]. QTLs that increase anther length have also been detected on Chr. 6 [27,28]. However, these previously identified QTLs have not been validated in O. sativa backcross populations in the absence of effects of other QTLs. Therefore, they may not be identical to the QTLs found here.
QTL analysis in NILs showed that the increase in anther length at flowering was likely due to cell elongation under the influence of qATL3, qATL5, and qATL6.1, and to cell division under the influence of qATL6B. The development of stamens is divided into two phases [31]. The early phase features the morphogenesis of floral organs, including stamen tissues, from the floral meristem. The late phase comprises pollen maturation, filament elongation, anther dehiscence, and pollen release, which are modulated by auxin (AUX), gibberellin (GA), and jasmonate (JA) [32,33,34,35]. AUX and GA can also regulate the early phase [34,36]. The expression of a MYB transcription factor, HvGAMYB, in barley, is upregulated by GA in early anther development in the nuclei of the epidermis, endothecium, middle layer, and tapetum, leading to sterility and shorter anther length [37]. Because AUX, GA, and JA affect stamen morphogenesis and male gametogenesis, the QTLs might be involved in epidermal cells via plant hormone signaling.
Because the mean anther length in T65 was 2.27 mm, we expected a plant homozygous for the O. longistaminata alleles at the four QTLs without epistatic effect among them to have an anther length of 3.21 mm (2.27 + 2 (0.17 + 0.16 + 0.06 + 0.08) mm), due to the additive effects of qATL3.1, qATL5, qATL6.1, and qATL6.2, or, of 3.25 mm (2.27 + 2 (0.19 + 0.16 + 0.06 + 0.08) mm) due to qATL3.3, qATL5, qATL6.1, and qATL6.2. As the anther length of W1508 was longer at 4.33 mm, additional, unidentified QTLs and interactions with minor effects are likely hidden in the O. longistaminata genome. QTL exploration in BC3F2 populations by simple interval mapping using only 21 to 24 plants in each population suggested 10 chromosomal regions with effects that increased anther length, and three that decreased anther length. We expected that the target regions independently segregated with qATL3.1, qATL5, qATL6.1, and qATL6.2 in the QTL analysis of BC3F2 generations, and that the QTL analysis nested in each of the BC3F2 populations eliminated the genetic “noise” caused by qATL3.1, qATL5, qATL6.1, and qATL6.2 in some of the BC3F2 populations, by fixation of the homozygous condition for the T65 allele (Table S2). The BC3F2 8, 10, and 11 populations, in which the BC3F1 parents did not retain the major QTL regions, might segregate QTLs additively with anther length increases of 0.15, 0.10, and 0.10 mm, respectively, at the SSR markers RM5755, RM3317, and RM5635. The BC3F2 25 population did not have the O. longistaminata segment at the major QTL regions, but the mean anther length of the population was significantly higher than that of T65 (Figure 3). Two populations—BC3F2 6 and 17—also did not have the major QTL region, and so most likely had another, unidentified QTL which could not be detected in the BC3F1 population. We also inferred chromosomal regions associated with increasing anther length at the major QTLs on Chrs. 3, 5, and 6, but the LOD peak positions were shifted, most likely owing to the few recombinations around QTL regions in populations with only 21 to 24 individuals. This result demonstrates that analysis in BC3F2 populations covering the whole genome of O. longistaminata increased the detection power, and that it was a practical way to perform the QTL scan where whole-genome genotyping is not available, despite reduced accuracy of the inferred map positions. This practical approach will be useful in the design of future experiments. The simple sum of the additive effects of the W1508 alleles at all QTLs reached 2.14 mm when homozygous (Table S2), which almost explained the difference between W1508 and T65 (4.33 mm − 2.27 mm = 2.06 mm). This suggested that multiple QTLs functioned additively, or by interacting with each other to form anthers as O. longistaminata.
The genetic analysis of anther length, which likely reflected on the lifestyle of the perennial wild rice species O. longistaminata, revealed that at least four major QTLs, qATL3.1, qATL5, qATL6.1, and qATL6.2 increased anther length. Regional QTL analysis and CSSL analysis suggested that additional minor QTLs were also associated with regulation of anther length.

4. Materials and Methods

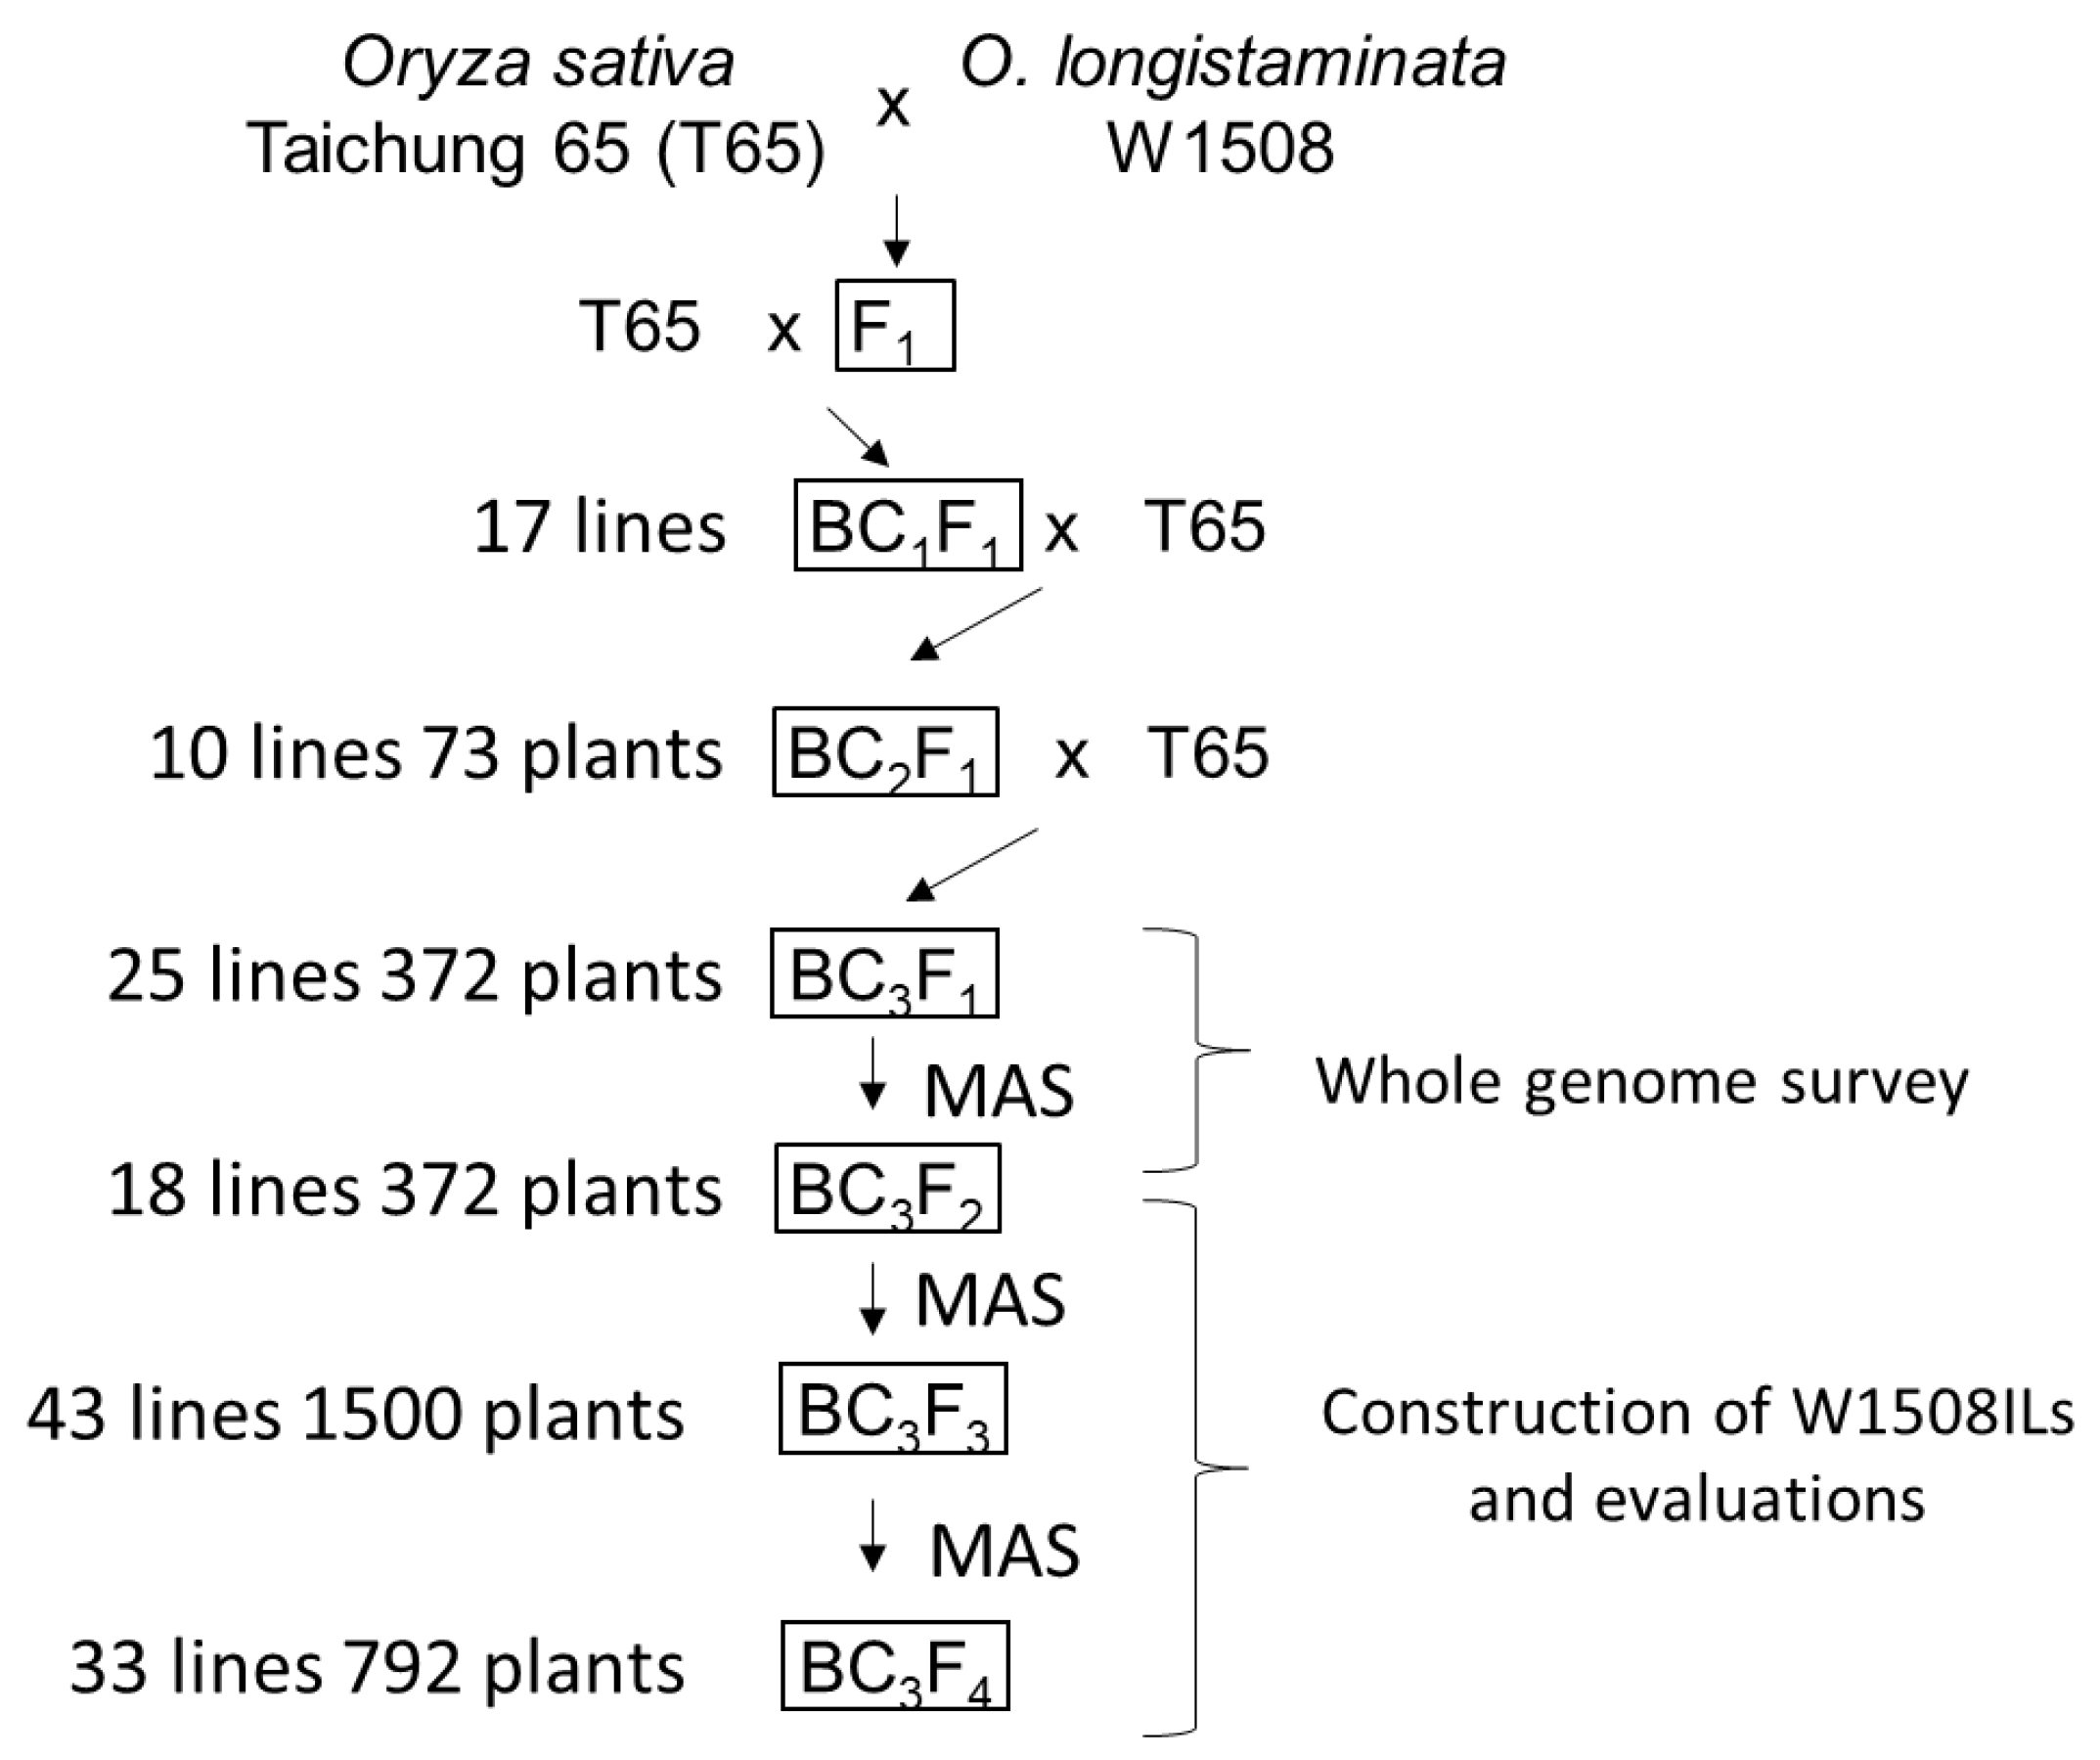
4.1. Plant Materials

We used O. longistaminata accession W1508, which was originally collected in Madagascar. Oryza sativa L. ssp. japonica Taichung 65 (T65) and W1508 were crossed, to develop F1 plants with T65 cytoplasm. The National Institute of Genetics, Mishima, Japan, kindly provided O. longistaminata ratton and the seeds of O. barthii and O. glumaepatula accessions, and F1 plants derived from a cross between T65 and W1508. T65 was used as the male parent in recurrent backcrosses to develop BC3F1 plants (Figure 2). The BC3F2 population was grown in 2015 and 2016.

4.2. Measurement of Anther Length

Panicles were collected at the heading stage and fixed and preserved in 70% ethanol. All anthers from 1 spikelet, just before anthesis, were removed and placed on a glass slide and then photographed under a microscope (Axioplan, Carl Zeiss, Jena, Germany) with a digital camera (DMX-1200, Nikon, Tokyo, Japan). The lengths of 4 to 6 anthers were measured in ImageJ software version 1.8 [38]. The average anther length was used as the phenotypic value of an individual plant.

4.3. Genotyping

Adult leaves were freeze-dried (FDU-1200, Eyela, Tokyo, Japan) and ground with a Multi-bead shocker (Yasui Kikai, Osaka, Japan). Genomic DNA was extracted by the potassium acetate method [39] from ground samples. The plants were genotyped for 124 simple sequence repeat (SSR) markers evenly distributed across the rice genomes (Table S1). For each marker, a 15 μL reaction mixture consisted of 50 mM KCl, 10 mM Tris (pH 9.0), 1.5 mM MgCl2, 200 μM dNTPs, 0.2 μM primers, 0.75 U of GoTaq DNA polymerase (Promega, Fitchburg, WI, USA), and ∼10 ng of genomic DNA template. PCR was performed on a GeneAmp PCR System 9700 (Applied Biosystems, Foster City, CA, USA). The thermal profile was an initial denaturation at 95 °C for 5 min: 35 cycles of 95 °C for 30 s, 55 °C for 30 s, and 72 °C for 30 s; and then a final elongation step at 72 °C for 7 min. The amplified products were electrophoresed in 4% agarose gel in 0.5× TBE buffer.

4.4. QTL Analysis

Simple interval mapping by an R/qtl library was used to detect QTLs conferring anther length [40]. LOD score thresholds with a significance level of 5% were empirically estimated by 1000 permutation tests. LOD peaks that exceeded the thresholds defined the QTLs. For multiple QTL mapping in the BC3F1 population, a forward/backward stepwise search was used for model selection, including epistasis of two loci by using the stepwiseqtl function in the R/qtl library, with a penalized LOD score criterion to balance model fitting and model complexity.

4.5. Measurement of Numbers of Pollen Grains

Six ethanol-fixed anthers from one spikelet per plant were crushed in a 1.5-mL tube containing 10 μL of 1% I2–KI solution, and then suspended in 390 μL of distilled water. One μL of the suspension was applied to a glass slide, and pollen grains in 10 fields were photographed under a light microscope (Axioplan, Carl Zeiss, Jena, Germany). The pollen grains were counted in each field, and the numbers were multiplied by the dilution ratio to estimate the pollen grain number per anther.

4.6. Observation of Epidermal Cells of Anthers

Anthers were put in a drop of distilled water on a glass slide, and cut at both ends, and pollen was removed by pipetting back and forth. The epidermal cells of three anthers from one spikelet per plant were photographed at the center in the long axis of the anthers, through an optical microscope (Axioplan, Carl Zeiss, Jena, Germany) with a digital camera (DMX-1200, Nikon, Tokyo, Japan), and were counted in ImageJ. Three plants per line were evaluated as a replicate each, and the average value of epidermal cell length of nine anthers was calculated.

5. Conclusions

Genetic analysis of anther length, which is likely to relate to an outcrossing lifestyle in the perennial wild rice species O. longistaminata, revealed that at least four major QTLs, qATL3, qATL5, qATL6.1, and qATL6.2 increase anther length. The regional QTL analysis and constructed CSSL series (designated ‘W1508IL’) suggested additional minor QTLs associated with the regulation of anther length. The cloning and diversity analysis of genes conferring anther length QTLs promotes utilization of the genetic resources of wild species, and the understanding of haplotype evolution on the differentiation of annuality and perenniality in the genus Oryza.

Supplementary Materials

The following are available online at https://www.mdpi.com/2223-7747/8/10/388/s1, Figure S1: Graphical genotypes of BC3F1 for candidates for introgression lines of W1508 in T65 genetic background; Figure S2: Model selections of QTLs including main and interaction effects for anther length; Table S1: QTLs detected by simple interval mapping and multiple QTL mapping in BC3F1 population; Table S2: Summary of simple interval mapping for anther length in BC3F1, BC3F2, and BC3F4 populations derived from a cross between T65 and W1508; Table S3: Anther length of W1508ILs; Table S4: SSR markers for genotyping in this study.

Author Contributions

Funding acquisition, A.Y. and H.Y.; investigation, T.O. and Y.Y.; resources, A.Y. and H.Y.; supervision, H.Y.; validation, T.O.; writing, original draft, T.O.; writing, review and editing, Y.Y.

Funding

This work was supported by a Grant-in-Aid from the Japan Agency for Medical Research and Development (National Bioresource Project (Rice)) JP19km0210105j0003 and JSPS KAKENHI Grant Number 18K05576. This work was partially supported by the Science and Technology Research Partnership for Sustainable Development (SATREPS) Grant number JPMJSA1706.

Acknowledgments

Wild rice species accessions used in this study were distributed from the National Institute of Genetics supported by the National Bioresource Project (NBRP), AMED, Japan, and were kindly shared from Maekawa, Institute of Plant Science and Resources, Okayama University, Japan.

Conflicts of Interest

The authors declare no conflicts of interest.

References

  1. Friedman, J.; Rubin, M.J. All in good time: Understanding annual and perennial strategies in plants. Am. J. Bot. 2015, 102, 497–499. [Google Scholar] [CrossRef] [PubMed] [Green Version]
  2. Kuroda, Y.; Urajrong, H.; Sato, Y.I. Population genetic structure of wild rice (Oryza rufipogon) in mainland southeast Asia as revealed by microsatellite polymorphisms. Topics 2002, 12, 159–170. [Google Scholar] [CrossRef]
  3. Annavi, G.; Newman, C.; Buesching, C.D.; Macdonald, D.W.; Burke, T.; Dugdale, H.L. Heterozygosity-fitness correlations in a wild mammal population: Accounting for parental and environmental effects. Ecol. Evol. 2014, 4, 2594–2609. [Google Scholar] [CrossRef] [PubMed]
  4. Charpentier, M.J.E.; Williams, C.V.; Drea, C.M. Inbreeding depression in ring-tailed lemurs (Lemur catta): Genetic diversity predicts parasitism, immunocompetence, and survivorship. Conserv. Genet. 2008, 9, 1605–1615. [Google Scholar] [CrossRef]
  5. Slate, J.; Kruuk, L.E.B.; Marshall, T.C.; Pemberton, J.M.; Clutton-Brock, T.H. Inbreeding depression influences lifetime breeding success in a wild population of red deer (Cervus elaphus). Proc. R. Soc. Lond. B 2000, 267, 1657–1662. [Google Scholar] [CrossRef] [PubMed]
  6. Acevedo-Whitehouse, K.; Vicente, J.; Gortazar, C.; Hofle, U.; Fernandez-de-Mera, I.G.; Amos, W. Genetic resistance to bovine tuberculosis in the Iberian wild boar. Mol. Ecol. 2005, 14, 3209–3217. [Google Scholar] [CrossRef]
  7. David, P. Heterozygosity-fitness correlations: New perspectives on old problems. Heredity 1998, 80, 531–537. [Google Scholar] [CrossRef] [PubMed]
  8. Charlesworth, D. Evolution of plant breeding systems. Curr. Biol. 2006, 16, 726–735. [Google Scholar] [CrossRef]
  9. Hamrick, J.L.; Godt, M.J.W. Effects of life history traits on genetic diversity in plant species. Philos. Trans. R Soc. Biol. Sci. 1977, 351, 1291–1298. [Google Scholar] [CrossRef]
  10. Vaughan, D.A.; Lu, B.R.; Tomooka, N. The evolving story of rice evolution. Plant Sci. 2008, 174, 394–408. [Google Scholar] [CrossRef]
  11. Banaticla-Hilario, M.C.N.; Berg, R.G.; Hamilton, N.R.S.; McNally, K.L. Local differentiation amidst extensive allele sharing in Oryza nivara and O. rufipogon. Ecol. Evol. 2013, 3, 3047–3062. [Google Scholar] [CrossRef]
  12. Liu, R.; Zheng, X.M.; Zhou, L.; Zhou, H.F.; Ge, S. Population genetic structure of Oryza rufipogon and Oryza nivara: Implications for the origin of O. nivara. Mol. Ecol. 2015, 24, 5211–5228. [Google Scholar] [CrossRef] [PubMed]
  13. Reuscher, S.; Furuta, T.; Bessho-Uehara, K.; Cosi, M.; Jena, K.K.; Toyoda, A.; Fujiyama, A.; Kurata, N.; Ashikari, M. Assembling the genome of the African wild rice Oryza longistaminata by exploiting synteny in closely related Oryza species. Commun. Biol. 2018, 1, 162. [Google Scholar] [CrossRef] [PubMed]
  14. Hiroi, K.; Mamun, A.A.; Wada, T.; Takeoka, Y. A Study on the interspecific variation of spikelet structure in the genus Oryza. Jpn. J. Crop Sci. 1991, 60, 153–160. [Google Scholar] [CrossRef]
  15. Zhang, Y.; Zhang, S.; Liu, H.; Fu, B.; Li, L.; Xie, M.; Song, Y.; Li, X.; Cai, J.; Wan, W.; et al. Genome and comparative transcriptomics of African wild rice Oryza longistaminata provide insights into molecular mechanism of rhizomatousness and self-incompatibility. Mol. Plant 2015, 8, 1683–1686. [Google Scholar] [CrossRef]
  16. Chu, Y.E.; Morishima, H.; Oka, H.I. Partial self-incompatibility found in Oryza perennis subsp. barthii. Gene Genet. Sys. 1969, 44, 225–229. [Google Scholar] [CrossRef]
  17. Sahadevan, P.C.; Namboodiri, K.M.N. Natural crossing in rice. Proc. Indian Acad. Sci. Sect. B 1963, 58, 176–185. [Google Scholar]
  18. Oka, H.I.; Morishima, H. Variations in the breeding systems of wild rice, Oryza perennis. Evolution 1967, 21, 249–258. [Google Scholar] [CrossRef]
  19. Sakai, K.I.; Narise, T. Studies on the breeding behavior of wild rice. Annu. Rep. Natl. Inst. Genet. Jpn. 1959, 9, 64–65. [Google Scholar]
  20. Eshed, Y.; Zamir, D. A genomic library of Lycopersicon pennellii in L. esculentum: A tool for fine mapping genes. Euphytica 1994, 79, 175–179. [Google Scholar] [CrossRef]
  21. Eshed, Y.; Zamir, D. An introgression line population of Lycopersicon pennellii in the cultivated tomato enables the identification and fine mapping of yield associated QTL. Genetics 1995, 141, 1147–1162. [Google Scholar] [PubMed]
  22. Eshed, Y.; Zamir, D. Less-than-additive epistatic interactions of quantitative trait loci in tomato. Genetics 1996, 143, 1807–1817. [Google Scholar] [PubMed]
  23. Chetelat, R.T.; Meglic, V. Molecular mapping of chromosome segments introgressed from Solanum lycopersicoides into cultivated tomato (Lycopersicon esculentum). Theor. Appl. Genet. 2000, 100, 232–241. [Google Scholar] [CrossRef]
  24. Grandillo, S.; Ku, H.M.; Tanksley, S.D. Characterization of fs8.1, a major QTL influencing fruit shape in tomato. Mol. Breed. 1996, 2, 251–260. [Google Scholar] [CrossRef]
  25. Yamamoto, T.; Kuboki, Y.; Lin, S.Y.; Sasaki, T.; Yano, M. Fine mapping of quantitative trait loci Hd-1, Hd-2 and Hd-3, controlling heading date of rice, as single Mendelian factor. Theor. Appl. Genet. 1998, 97, 37–44. [Google Scholar] [CrossRef]
  26. Monforte, A.J.; Tanksley, S.D. Fine mapping of a quantitative trait locus (QTL) from Lycopersicon hirsutum chromosome 1 affecting fruit characteristics and agronomic traits: Breaking linkage among QTLs affecting different traits and dissection of heterosis for yield. Theor. Appl. Genet. 2000, 100, 471–479. [Google Scholar] [CrossRef]
  27. Xiong, L.Z.; Liu, K.D.; Dai, X.K.; Xu, C.G.; Zhang, Q.F. Identification of genetic factors controlling domestication related traits of rice using an F2 population of a cross between Oryza sativa and O. rufipogon. Theor. Appl. Genet. 1999, 98, 243–251. [Google Scholar] [CrossRef]
  28. Cai, W.; Morishima, H. (2002) QTL clusters reflect character associations in wild and cultivated rice. Theor. Appl. Genet. 2002, 104, 1217–1228. [Google Scholar] [CrossRef]
  29. Uga, Y.; Fukuta, Y.; Ohsawa, R.; Fujimura, T. Variations of floral traits in Asian cultivated rice (Oryza sativa L.) and its wild relatives (O rufipogon Griff.). Breed. Sci. 2003, 53, 345–352. [Google Scholar] [CrossRef]
  30. Uga, Y.; Siangliw, M.; Nagamine, T.; Ohsawa, R.; Fujimura, T.; Fukuta, Y. Comparative mapping of QTLs determining glume, pistil and stamen sizes in cultivated rice (Oryza sativa L.). Plant Breed. 2010, 129, 657–669. [Google Scholar] [CrossRef]
  31. Goldberg, R.B.; Beals, T.P.; Sanders, P.M. Anther development: Basic principles and practical applications. Plant Cell 1993, 5, 1217–1229. [Google Scholar] [CrossRef] [PubMed]
  32. McConn, M.; Browse, J. The critical requirement for linolenic acid is pollen development, not photosynthesis, in an Arabidopsis Mutant. Plant Cell 1996, 8, 403–416. [Google Scholar] [CrossRef] [PubMed]
  33. Cecchetti, V.; Altamura, M.M.; Falasca, G.; Costantino, P.; Cardarelli, M. Auxin regulates Arabidopsis anther dehiscence, pollen maturation, and filament elongation. Plant Cell 2008, 20, 1760–1774. [Google Scholar] [CrossRef] [PubMed]
  34. Cheng, Y.; Dai, X.; Zhao, Y. Auxin biosynthesis by the YUCCA flavin monooxygenases controls the formation of floral organs and vascular tissues in Arabidopsis. Genes Dev. 2006, 20, 1790–1799. [Google Scholar] [CrossRef] [PubMed]
  35. Jewell, J.B.; Browse, J. Epidermal jasmonate perception is sufficient for all aspects of jasmonate-mediated male fertility in Arabidopsis. Plant J. 2016, 85, 634–647. [Google Scholar] [CrossRef] [PubMed]
  36. Plackett, A.R.; Thomas, S.G.; Wilson, Z.A.; Hedden, P. Gibberellin control of stamen development: A fertile field. Trends Plant Sci. 2011, 16, 568–578. [Google Scholar] [CrossRef] [PubMed]
  37. Murray, F.; Kalla, R.; Jacobsen, J.; Gubler, F. A role for HvGAMYB in anther development. Plant J. 2003, 33, 481–491. [Google Scholar] [CrossRef]
  38. Schneider, C.A.; Rasband, W.S.; Eliceiri, K.W. NIH Image to ImageJ: 25 years of image analysis. Nat. Methods 2012, 9, 671–675. [Google Scholar] [CrossRef]
  39. Dellaporta, S.L.; Wood, J.; Hicks, J.B. A plant DNA minipreparation: Version II. Plant Mol. Biol. Rep. 1983, 1, 19–21. [Google Scholar] [CrossRef]
  40. Broman, K.W.; Wu, H.; Sen, S.; Churchill, G.A. R/qtl: QTL mapping in experimental crosses. Bioinformatics 2003, 19, 889–890. [Google Scholar] [CrossRef] [Green Version]
Figure 1. Distribution of anther length (mm) in cultivars of O. sativa and accessions of O. barthii, O. glumaepatula, and O. longistaminata. Mean ± SE, n = 3.
Plants 08 00388 g001
Figure 2. Breeding scheme of genetic materials used in this study. MAS represents marker-assisted selection.
Plants 08 00388 g002
Figure 3. Box plots of anther length among the 26 BC3F2 populations. A thin horizontal line shows the average anther length in the Taichung 65 (T65) genetic background. Thick horizontal bars represent average values. Ranges between upper and lower quantiles are indicated by grey boxes. Maximum and minimum values excluding outlier are indicated by upper and lower whiskers, respectively. * and ** represent significant differences at P = 0.05 and P = 0.01, respectively.
Plants 08 00388 g003
Figure 4. Validation of the anther length quantitative trait locus (QTLs) located on chromosomes 3, 5, and 6 in BC3F4 populations segregating at only one QTL region. (a)–(e) Graphical genotypes of the parents of BC3F3 and BC3F4 populations, and frequency distributions of anther length in BC3F4 populations for (a) qATL3.3, (b) qATL3.1, (c) qATL5, (d) qATL6.1, and (e) qATL6.2. Graphical genotypes: Yellow, heterozygous; red, homozygous for the W1508 allele. Frequency distributions shown in colors by genotypes at RM5959 (a), RM3525 (b), RM1054 (c), RM7023 (d), and RM7309 (e): Orange, homozygous for T65; yellow, homozygous for W1508; gray, heterozygous; (f) logarithm of odds (LOD) curves in simple interval mapping of anther length for detection of qATL6 (green) in BC3F3 5, qATL6.1 (orange) in BC3F4 17, and qATL6.2 (blue) in BC3F4 14.
Plants 08 00388 g004
Figure 5. Characterization of QTLs using nearly isogenic lines (NIL) carrying W1508 chromosomal segments around QTL regions detected in this study. (a) Anther length (mm) in the NILs. Mean ± SE, n = 3; (b) cell length (µm) in the long axis of anthers in the NILs. * and ** represent significant differences in Dunnett’s multiple comparisons to T65 control at 5% and 1% levels, respectively. The numbers of observed cells were 1460, 997, 953, 879, and 1033 in qATL3.1 NIL, qATL5 NIL, qATL6.1 NIL, qATL6.2 NIL, and T65 respectively.
Plants 08 00388 g005
Figure 6. Construction of chromosome segment substitution lines of O. longistaminata accession W1508 (W1508ILs) in the genetic background of O. sativa L. cv. Taichung 65. Red and white boxes represent homozygous genotypes for W1508 and Taichung 65 alleles, respectively. Yellow boxes represent heterozygous genotypes. Missing genotypes at markers showing heterozygous genotypes at BC3F1 generation are indicated by grey.
Plants 08 00388 g006

