Article

Overexpression of Phosphoenolpyruvate Carboxykinase Increases Photosynthetic Efficiency and Salt Tolerance in Rice


by
Suchismita Prusty
1,†,
Swetaleena Mishra
1,†,
Sowmya Poosapati
2,*,
Durga Madhab Swain
3,* and
Ranjan Kumar Sahoo
1,*
1
School of Biotechnology, Centurion University of Technology and Management, Bhubaneswar 757001, Odisha, India
2
Howard Hughes Medical Institute and Plant Molecular and Cellular Biology Laboratory, Salk Institute for Biological Studies, San Diego, CA 92037, USA
3
Vidya USA Corporation, 7 Otis Stone Hunter Road, Bunnell, FL 32100, USA
*
Authors to whom correspondence should be addressed.
These authors contributed equally to this work.
Plants 2026, 15(9), 1402; https://doi.org/10.3390/plants15091402
Submission received: 10 March 2026 / Revised: 24 April 2026 / Accepted: 27 April 2026 / Published: 4 May 2026
(This article belongs to the Section Plant Physiology and Metabolism)

Abstract

Salinity stress is one of the major obstacles to glycophytic crop production worldwide, including rice. It alters cellular metabolism, causing significant crop destruction that results in substantial reductions in yield. The overexpression of C4 enzymes, such as phosphoenolpyruvate carboxykinase (PEPCK), at high levels in C3 transgenic plants through genetic engineering can decrease oxidative stress while increasing photosynthetic capabilities. In this research, we evaluate the efficiency of transgenic rice plants (Oryza sativa L. cv. IR64) overexpressing PEPCK genes in mitigating salinity stress and increasing photosynthetic efficiency. The T1 transgenics showed increased levels of several biochemical factors, including ascorbate peroxidase (APX), catalase (CAT), proline, glutathione reductase (GR), and guaiacol peroxidase (GPX) activities. This was accompanied by reduced levels of malondialdehyde (MDA), hydrogen peroxide (H2O2), and electrolytic leakage, suggesting an effective antioxidant defense mechanism against the oxidative damage driven by salt stress. Photosynthetic parameters—such as chlorophyll content, net photosynthetic rate, intercellular CO2 content, and stomatal conductance—were elevated in transgenic plants compared to control plants. The transgenics also exhibited superior agronomic characteristics. Our findings provide conclusive evidence of the PEPCK gene’s potential role in regulating salt stress response and tolerance in rice plants.

1. Introduction

The rapid expansion of the global population has led to a significant increase in the demand for food production, despite a projected decline in available fertile land. To meet the needs of an estimated population of 9.7 billion by 2050, it is projected that a 70% increase over current production levels will be required, particularly for staple crops such as rice (O. sativa), wheat (Triticum aestivum), soy (Glycine max), and maize (Zea mays) [1]. Furthermore, natural catastrophes and shifting climatic conditions present major obstacles to achieving target crop yields. One of the primary constraints affecting global agricultural productivity is soil salinity, which affects approximately 25% of total arable land. In certain regions, such as Central Asia, salinity afflicts 60–65% of the soil in stress-affected areas [2]. These conditions lead to a significant 10–25% reduction in crop yields and, in extreme instances, can result in total desertification [3].
Excessive salt concentrations (100–200 mM NaCl) inhibit the growth of major glycophytic crops, including rice, corn, wheat, soybeans, potatoes, and various legumes. Rice (O. sativa L.), a primary food source for over half the global population, is notably salt-sensitive. For instance, soil salinity results in rice output deficits of as much as 45% in the Indo-Gangetic Basin of India and 36–69% in the Indus Basin of Pakistan. Consequently, immediate intervention to mitigate the effects of salinity is essential for maintaining cropland viability and boosting productivity in an economically sustainable manner. To establish long-term food security, researchers are increasingly focused on developing new transgenic varieties, as the introduction of genetically engineered crops with enhanced salt tolerance represents a practical and necessary solution to the current crisis.
One possible strategy involves the integration of the C4-like mechanism into C3 plant mesophyll cells [4]. The transformation from C3 to C4 plants requires gradual modifications in metabolic pathways that might lead to the development of improved varieties with evolutionary advantages. Although the engineering of high-level and cell-specific gene expression poses obstacles for the insertion of C4 biochemistry into C3 plants, genes encoding the majority of metabolite transporters and enzymes of the C4 pathway have recently been discovered [5]. One such gene with significant potential is PEPCK, which is engaged in several metabolic activities, justifying its inclusion in the current study.
PEPCK functions as a primary cytosolic decarboxylase enzyme present in C4 plants and has been observed to respond positively to salt stress in some plant species [6]. PEPCK has a role in gluconeogenesis and the TCA cycle [7]. It also contributes to the maintenance of pH and is involved in the metabolism of amino acids, nitrogen, sugars, organic acids, and malate [8]. Through genetic engineering, transgenic crops expressing high levels of the C4 enzymes PEPC or PEPCK have demonstrated improved photosynthetic capability [8]. Although previous studies have reported the involvement of PEPCK in response to drought stress and various environmental factors, limited data exist regarding its involvement in salt stress tolerance, especially in C3 crops like rice, which require detailed analysis [9].
In the present research, it is postulated that PEPCK gene overexpression in rice might enhance carbon metabolism and improve photosynthetic efficacy, even under salinity stress. To validate this, we overexpressed the PEPCK gene to generate transgenic rice plants and analyzed their genetic, physiological, biochemical, and agronomic responses under salt stress, while also exploring the underlying mechanisms. This study aims to overexpress a gene (PEPCK) from a C4 plant species in a C3 plant system to enhance photosynthetic performance and abiotic stress tolerance, with the goal of inducing C4-like physiological characteristics. The findings of our research could further contribute to our understanding of C4-linked metabolic attributes and support current attempts to increase the photosynthetic efficiency of rice.

2. Materials and Method

2.1. Generation and Molecular Characterization of Transgenic Rice Plants Overexpressing PEPCK Gene

The coding region of the PEPCK gene was amplified from Urochloa panicoides cDNA (GenBank accession no. AF136163.1) using the forward primer 5′-ATGGAGTTGGTTCAGAATAAAA-3′ and the reverse primer 5′-GGTGTGGAGTTCTCTTA-3′. The amplified fragment was cloned into pRT-100 at the NcoI site to generate the 35S promoter:PEPCK:poly(A) cassette, which was subsequently subcloned into the PstI site of pCAMBIA1301. The construct was introduced into embryogenic calli derived from mature rice seeds (O. sativa L. cv. IR64) via Agrobacterium tumefaciens strain LBA4404 following Sahoo and Tuteja [10]. Genomic DNA (0.15–0.20 µg) was isolated from the fresh leaves (0.5 g) of putative T1 transgenic plants and used as a template for PCR analysis. Screening was performed using a forward primer (5′-ATGGAGTTGGTTCAGAATAAAA-3′) and a reverse primer (5′-GGTGTGGAGTTCTCTTA-3′) to confirm the presence of the transgene. Transgene integration was further verified by Southern blot analysis as described by Sambrook et al. [11]. Moreover, 20 µg of genomic DNA was digested with XbaI and separated on 0.8% agarose gels by gel electrophoresis. It was then subjected to depurination (0.2 N HCl) and denaturation (1.5 M NaCl, 0.5 N NaOH), followed by a neutralization process (0.5 M Tris-HCl, 1.5 M NaCl, pH 8.0) wherein each step was carried out for 20 min. The DNA was transferred to a nylon membrane through capillary blotting (6× SSC buffer and 0.4 N NaOH) overnight and crosslinked with UV-Crosslinkers after being neutralized in 1 M Tris Cl. for 10 min. The membrane was pre-hybridized in buffer containing 5× SSC, 5× Denhardt’s solution, 0.1% SDS, 100 µg/mL denatured salmon sperm DNA, and 10% dextran sulfate at 60 °C. Hybridization was performed with a denatured, labeled DNA probe (α−32P dCTP-labeled CaMV 35S promoter fragment) for 16–18 h at 60 °C. Post-hybridization washes were carried out under stringent conditions, and signals were detected by autoradiography.
The wild type (non-transformed) plants served as controls. Ten plants per independent line (three biological replicates and ten technical replicates, for a total of thirty plants) were used as biological replicates. Analyses were performed on T1 seedlings subjected to stress treatments.

2.2. Tolerance Index Assessment of T1 Plants

Three-week-old IR64 T1 rice plants overexpressing PEPCK and wild-type (control) plants were grown in one big tank filled with 200 mM NaCl instead of water. The response of these plants was recorded in 30-day intervals as described in our earlier studies [12,13]. The salt level was ensured in the course of the experiment periodically by maintaining a fixed volume of solution and adding more NaCl solution as required. Despite the fact that 200 mM NaCl level is higher than usual field salinity, this metric is frequently used in controlled experiments in order to identify stress tolerance thresholds and assess the performance of transgenic lines under harsh saline circumstances. Following the stress treatment, various physiological and biochemical assays were performed to evaluate the stress response, including measurements of photosynthetic efficiency, growth parameters, and stress-related biochemical markers. Each treatment consisted of three biological replicates, with at least 8–10 plants per replicate.
The tolerance index (TI) was calculated for PEPCK T1 transgenic lines (L2, L7, and L12) and wild-type plants under salt stress using the formula:
T1 (%) = [(plant dry weight under 200 mM NaCl)/(plant dry weight under water)] × 100

2.3. Relative Gene Expression Analysis

For gene expression studies, total RNA was extracted from leaf tissues after 24 h of treatment (the time frame helps to record early transcriptional reactions during the salt stress acclimation period, before serious stress-induced damage begins), using TRIzol reagent. First-strand cDNA was synthesized using SuperScript II Reverse Transcriptase (Invitrogen, Carlsbad, CA, USA) and an oligo(dT)18 primer according to the manufacturer’s instructions. Quantitative real-time PCR (qRT-PCR) was performed using gene-specific primers (Forward: 5′-GGAAATCCTCGACCCCATCA-3′; Reverse: 5′-CGATCTTGTAGCTGGCGAAC-3′). The relative levels of the transcript accumulated for the gene were normalized to α-tubulin (primers: forward 5′-GGTG GAGGTGATGATGCTTT-3′ and reverse 5′-ACCACGGGCAAAGTTG TTAG-3′). Amplification was carried out in a StepOne Real-Time PCR System (Applied Biosystems, Foster City, CA, USA) under the following conditions: 95 °C for 30 s, 60 °C for 30 s, and 72 °C for 30 s. Relative gene expression was quantified using the 2−ΔΔCT method as described by Jayaraman et al. [14]. The PCR efficiency, which is dependent on the assay, performance of the master mix and quality of the sample, was calculated as efficiency = 10 (–1/slope) − 1 (3.6C slope C 3.1) by the software itself (Applied Biosystems, StepOne™ Software v2.3, http://www.appliedbiosystems.com). ‘C’ is defined as threshold cycle. All reactions were performed in triplicate, and mean expression values were calculated for each sample.

2.4. Measurement of Salinity Tolerance by Leaf Disk Senescence Assay

Leaf disks (1 cm × 1 cm) were excised from fully expanded leaves of three-week-old IR64 T1 rice plants overexpressing PEPCK (lines L2, L7, and L12) and wild-type control plants. The disks were floated in NaCl solutions containing 100 mM and 200 mM for 72 h (because it enables the formation of quantifiable salt-induced senescence without causing total tissue degeneration) at room temperature. Control disks were incubated in distilled water under identical conditions. After the treatment, chlorophyll retention and the degree of leaf bleaching were assessed to evaluate salt stress tolerance. The experiment was conducted with three biological replicates following the method described by Tuteja et al. [12]. Using spectrophotometry (wavelengths—A663, A645), the total chlorophyll (Ca + b) content was calculated. After the 300 mg of leaves were ground into a powder using liquid nitrogen, they were put into a 15 mL Falcon tube. The tube was stirred after adding 5 mL of 80% acetone, then left in the dark for the entire night. The centrifugation process ran for 15 min at 4 °C (3000 rpm). The supernatant was moved to a fresh centrifuge tube, and spectrophotometry was used to determine the absorbance of chlorophyll (henceforth abbreviated as A). The following formula is used to compute the chlorophyll concentrations (80% acetone was used as a blank control).
Ca + b (mg/g) = [8.02 × A663 + 20.20 × A645] × V/1000 × W
where V = volume of the extract (mL); W = weight of fresh leaves (g).

2.5. Assessments of Antioxidants in PEPCK Transgenic Lines

The 21-day-old control plant and PEPCK transgenic plant seedlings were cultivated in 200 mM NaCl for 24 h in this experiment before being utilized for biochemical studies. Following the salt stress treatment, the accumulation of malondialdehyde (MDA), hydrogen peroxide (H2O2), as well as ion leakage were analyzed [15]. The enzyme activity of the ascorbate peroxidase (APX), catalase (CAT), guaiacol peroxidase (GPX), and glutathione reductase (GR) was also evaluated, as they play significant functions in stress responses [15].

2.5.1. Proline Estimation

Proline content was determined following the method of Bates et al. Fresh root tissues (500 mg) were ground to a fine powder in liquid nitrogen and homogenized in 10 mL of 3% sulphosalicylic acid under ice-cold conditions [16]. After centrifuging the resulting mixture at 10,000× g for 15 min, 2 mL of the solution was combined with 2 mL of acid ninhydrin and glacial acetic acid. The mix was cooled in ice to stop the chemical reaction after being incubated at 100 °C for one h, during which time a colorful complex was produced in the water bath. The colored complex was vortexed for 15–20 s after adding 4 mL of toluene. Afterward, at 520 nm, the optical density of the layer comprising the chromophore was evaluated to determine the proline content by utilizing an L-Proline standard curve.

2.5.2. Determination of H2O2 Content

The H2O2 level was determined using an updated version of Jana and Choudhuri’s approach [17]. Hydrogen peroxide (H2O2) content was determined using fresh leaf tissue (100 mg). The tissue was ground to a fine powder in liquid nitrogen and homogenized in 3 mL of 50 mM phosphate buffer (pH 7.0). The homogenate was filtered and centrifuged at 6000× g for 25 min at 4 °C. An aliquot of 0.9 cm3 of the supernatant was mixed with 0.3 cm3 of 1% (v/v) TiCl4 in concentrated HCl, and the mixture was centrifuged again at 6000× g for 15 min at 4 °C for H2O2 estimation. At 410 nm, the absorbance of yellow supernatant was determined. The values were compared with a standard curve.
The estimation of the levels of electrolytic leakage, lipid peroxidation, and relative water content (RWC) was determined using the procedure outlined by Tuteja et al. [13].

2.5.3. Lipid Peroxidation Measurement (MDA Content)

Malondialdehyde (MDA), a breakdown product of lipid peroxidation, was measured to quantify lipid peroxidation [18]. Using a mixer mill (MM400, Retsch, Haan, Germany) with two cycles of 35 Hz per minute, leaves (0.1 g) were crushed into a fine powder. Following the addition of 1 mL of 0.1% trichloroacetic acid (TCA), the resulting solution was centrifuged for 15 min at 5000× g and 25 °C. Following centrifugation, 0.75 mL of 0.25% 2-thiobarbituric acid in 10% TCA was mixed with 0.3 mL of the supernatant, and the absorbance was measured at 532 nm and 600 nm. Implementing an absorption coefficient of 155 mM−1 cm−1, the MDA concentration was evaluated by deducting the absorbance of the supernatant at 600 nm from that at 532 nm.

2.5.4. Electrolytic Leakage (Membrane Permeability)

Three days post salt stress, leaves were cut into 1 cm square pieces, placed in a test tube, and rinsed with 5 mL of deionized water to remove surface contaminants. Electrical conductivity (EC) was subsequently evaluated both prior to and after autoclaving at 121 °C for 20 min, while the material was immersed in 5 mL of deionized water in a test tube for two hours.
The formula for calculating the cell membrane stability [%] was 100 − [(EC1/EC2) × 100], where EC1 represents the electric conductivity following a two-hour dip in deionized water and EC2 represents electrical conductivity following a 20 min autoclave [19].

2.5.5. Relative Water Content

Barrs and Whetherley’s approach was implemented, and plants from all treatments were chosen at random [20]. To calculate initial mass (Mi), a leaf specimen weighing about 0.1 g was divided into smaller fragments and analyzed. To calculate the completely water-saturated mass (Mf), the leaf specimens were submerged in de-ionized water for 12 h. After a three-day drying at 60 °C, the specimen’s dry mass (Md) was measured, and RWC [%] was calculated using the formula [(Mi − Md)/(Mf − Md)] × 100.

2.6. Quantification of Photosynthetic Parameters

Over the course of 30 days (perfect to access developmental and metabolic responses, so they will have enough time to acclimate and develop stable phenotypic differences), mature IR64 rice control plants and PEPCK transgenic rice plants were subjected to 0 mM and 200 mM NaCl, respectively. On a sunny weather between 10:00 a.m. and 12:00 p.m., the fourth and fifth fully extended leaves of transgenic lines (L2, L7, and L12) as well as control plants were measured for stomatal conductance (gs), intercellular CO2 concentration (Ci), net photosynthetic rate (Pn), and transpiration rate using an infrared gas analyzer (IRGA from LiCor, located in Lincoln, NE, USA). The examination was conducted in the following atmospheric factors: atmospheric temperature of 30 ± 2 °C, relative humidity of 68.2 ± 6%, atmospheric CO2 of 404 μmol mol−1, photosynthetically active radiation (PAR) of 1900 ± 6 μmol m−2 s−1.

2.7. The Agronomic Attributes of T1 Transgenic Plant

Following a 30-day treatment with 100 mM NaCl and 200 mM NaCl, various growth related agronomic parameters were measured (done on 60 day old plant, record taken at the end of the treatment period), including plant height, leaf area, number of tillers/plant, root length, root dry weight, straw dry weight, plant dry weight pre- and post-salt stress in both control and PEPCK transgenic rice lines. Yield-related agronomic parameters (90 day old plant, without further treatment with salt stress) such as plant height, number of tillers/plant, number of panicles/plant, number of chaffy grains/panicle, number of filled grain/panicle and, leaf area, 100-grain weight, root dry weight, straw dry weight, root length, and plant dry weight pre- and post-salt stress in both control and PEPCK transgenic rice lines were also measured and on a meter scale, the length of the shoot and roots were determined. Plant samples were desiccated in a hot-air oven (Memmert, Model 500, Schwabach, Germany) at 80 °C for four days until a uniform weight was achieved. Dry weight was established by incubating the specimens in a desiccator. The leaf area was determined using a leaf area meter (manufactured by Systronics in Hyderabad, India).

2.8. Determining the Endogenous Ion Content and Soluble Sugar and Hormones

To estimate endogenous ions (potassium, nitrogen, sodium, and phosphorus concentration), leaves from T1 transgenic lines and control lines cultivated for 8 weeks (to ensure that plants under prolonged exposure to salt attained a stable vegetative stage, allowing for accurate assessment of long-term ion buildup and homeostatic regulation in both control and transgenic lines) on 0 mM NaCl and 200 mM NaCl, respectively, were used. Jackson’s method was utilized to calculate the total nitrogen concentration [21]. A spectrophotometer was utilized to determine the phosphorus concentration in accordance with Gupta’s instructions [22]. Using a flame ionization photometer and regular procedure, the potassium content was determined [23]. The Munns et al. [24] technique was used to test the sodium content. After subjecting both transgenic and control plants to a 24 h salt treatment, the amounts of fructose and glucose in both the roots and shoots were determined [25]. As previously stated by Chen et al. [26], estimates of the endogenous plant hormones (GA and IAA) have been determined. Zeatin was measured utilizing optimized MRM transitions and genuine standards under identical analytical circumstances. Approximately 1 g of the leaf (fresh leaves) was collected, frozen instantly in liquid nitrogen and homogenized to fine powder, out of which 100 mg of powdered tissue was used for hormone extractions. A total of 1 mL of cold 80% (v/v) methanol was used to derive the phytohormones, which then underwent incubation for 12 h at 4 °C with occasional mixing. It was then centrifuged at 12,000× g (4 °C for 15 min), and the supernatant was collected and dried completely using a stream of nitrogen gas (35 °C). The dry supernatant was dissolved in 100 mL of acetonitrile (95% v/v) and re-centrifuged for 15 min at 12,000× g (4 °C). The supernatant was acquired for the assessment of liquid chromatography–mass spectrometry. Quality control samples were prepared from mixing all experimental samples to acquire a representative composite sample. This was used successively (once after every 10 samples) to ensure the integrity of the results. The hormones were determined by liquid chromatography–electrospray ionization tandem mass spectrometry (LC–ESI–MS/MS) system.
Experimental conditions—HPLC: column, Waters ACQUITY UPLC HSS T3 C18 (1.8 μm, 2.1 mm × 100 mm); solvent system: water (0.1% acetic acid): acetonitrile (0.1% acetic acid). The gradient conditions—100:0 v/v V/V at 0 min, 5:95 v/v at 11.0 min, 5:95 v/v at 12.0 min, 95:5 v/v at 12.1 min, and 95:5 v/v at 15.0 min; flow rate: 0.40 mL/min; temperature: 40 °C. The injection volume—5 μL. A triple quadrupole-linear ion trap mass spectrometer (Q TRAP, API 4500, Q TRAP LC/MS/MS System, AB Sciex software-SCIEX OS version 3.4.5) having an electrospray ionization (ESI) source working with positive ion mode was used for the mass spectrometric study. ESI source parameters—ion source: turbo spray; source temperature: 550 °C; ion spray voltage (IS): 5500 V; ion source gas I (GSI), gas II (GSII), and curtain gas (CUR) were set at 55, 60, and 25.0 psi, respectively, with high collision gas (CAD). Multiple reaction monitoring (MRM) mode was used to collect data, and each hormone’s transitions were calibrated, using nitrogen (5 psi) as the collision gas. Hormones were determined by comparing their mass transitions and retention durations to those of real standards. External calibration curves were used for quantification, and outcomes were reported as ng g−1 dry weight. The hormones were characterized by their distinct retention times and MRM transitions that were derived from verified standards under the same LC–MS/MS conditions. The detection limit lies between 0.1 and 1.0 ng g−1.

2.9. Statistical Analysis

Data from three independent transgenic rice lines were collected, and mean values and standard errors were calculated. Applying SPSS (12.0 Inc., Chicago, IL, USA), the ANOVA test was run on the collected data to find the least significant difference (LSD) for the statistically significant data, which allowed for the identification of treatment-wise changes in the mean. Duncan’s multiple-range analyses (DMRT) were utilized to determine the means.

3. Results

3.1. Molecular Assessment of the Transgenic PEPCK Plants

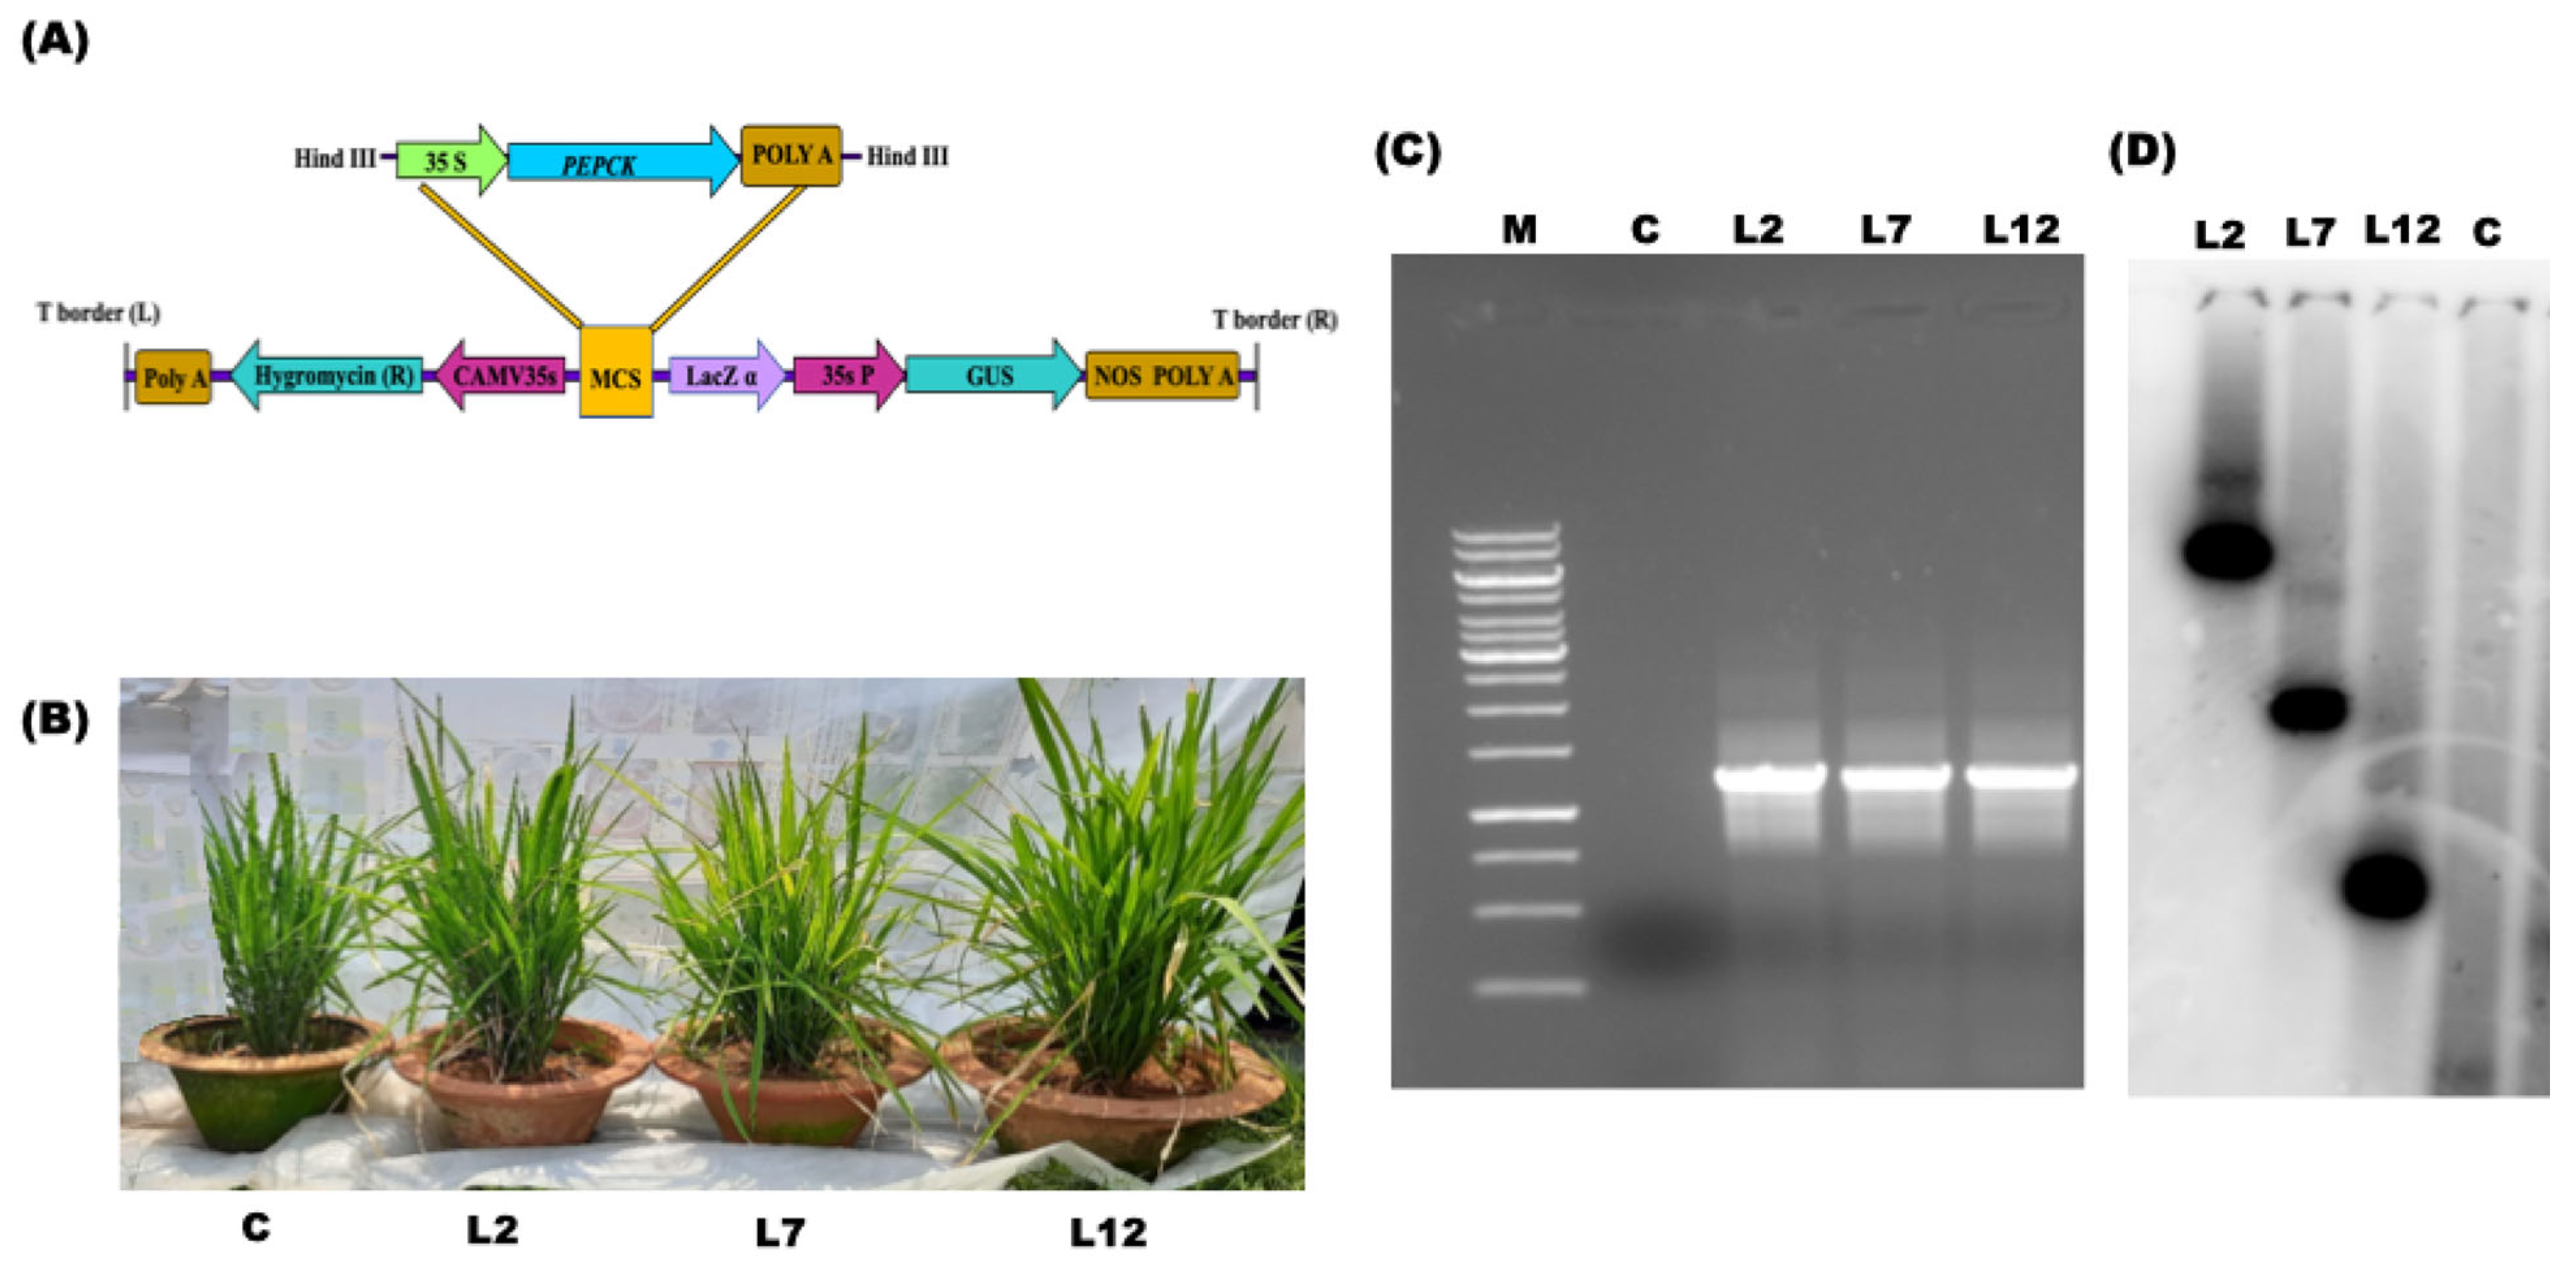
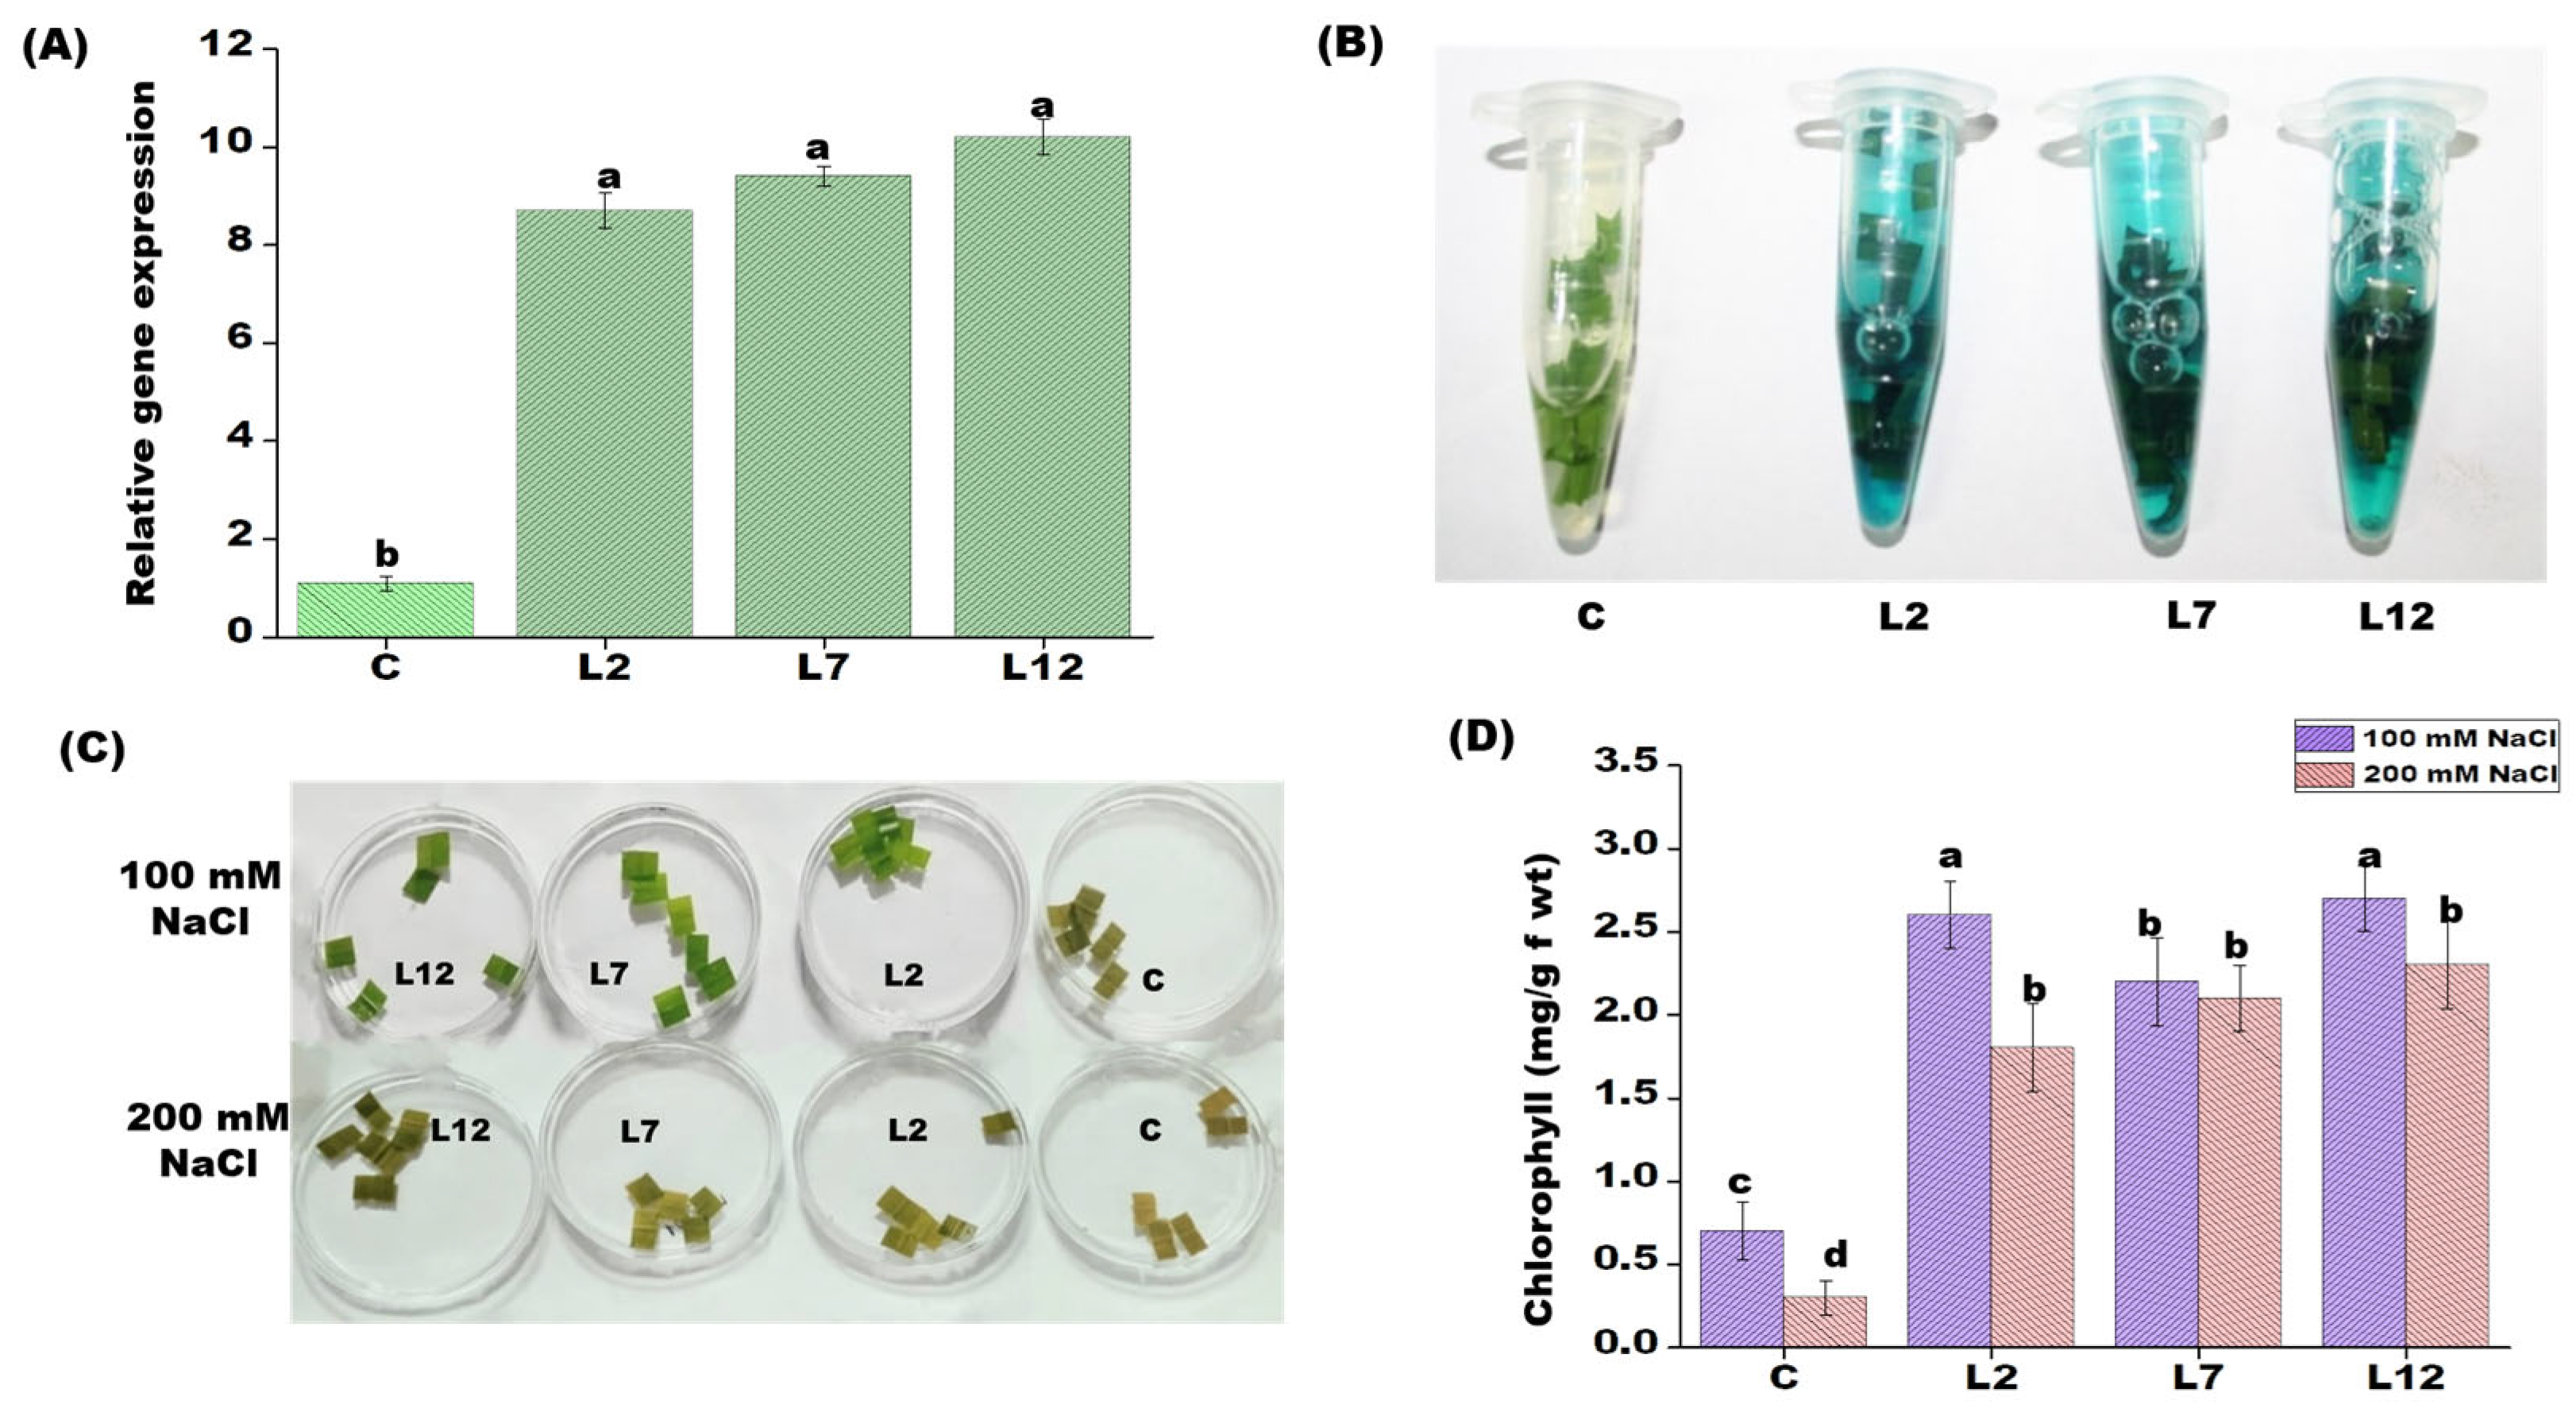
Transgenic IR64 rice plants were generated using the pCAMBIA1301-PEPCK T-DNA construct (Figure 1A). The presence of the PEPCK transgene was confirmed via PCR using gene-specific primers and β-glucuronidase (GUS) expression analysis. Three transgenic T1 lines (L2, L7, and L12) were selected based on positive GUS staining and PCR results (Figure 1B–D and Figure 2B). Quantitative real-time PCR (qRT-PCR) revealed that these selected lines exhibited approximately a 10-fold increase in PEPCK transcript levels compared to control plants grown under normal conditions (Figure 2A). The stable integration of the PEPCK transgene was confirmed through Southern blot analysis, where the lines L2 and L7 show two distinct bands, suggesting multiple copy insertion, and L12 shows one band, suggesting one copy number.

3.2. PEPCK Overexpression Confers Salt Tolerance

Leaf disk assay was conducted as an initial screen to evaluate the salt stress tolerance of T1 transgenic lines (L2, L7, and L12) overexpressing PEPCK. Leaf disks (approximately 1 cm × 1 cm) from transgenic and control plants were incubated in 100 and 200 mM NaCl for 72 h. Following salt treatment, leaf tissues exhibited visible discoloration. Compared to control plants, all transgenic lines showed a significantly lower reduction in chlorophyll content, suggesting enhanced tolerance to saline stress at both mild (100 mM) and severe (200 mM) concentrations (Figure 2C,D). Within the transgenic lines, L7 showed maximum chlorophyll retention under 100 mM NaCl and 200 mM NaCl, followed by L12 and L2 (Figure 2C,D).

3.3. Biochemical and Physiological Responses of PEPCK Transgenic Plants Under Salt Stress

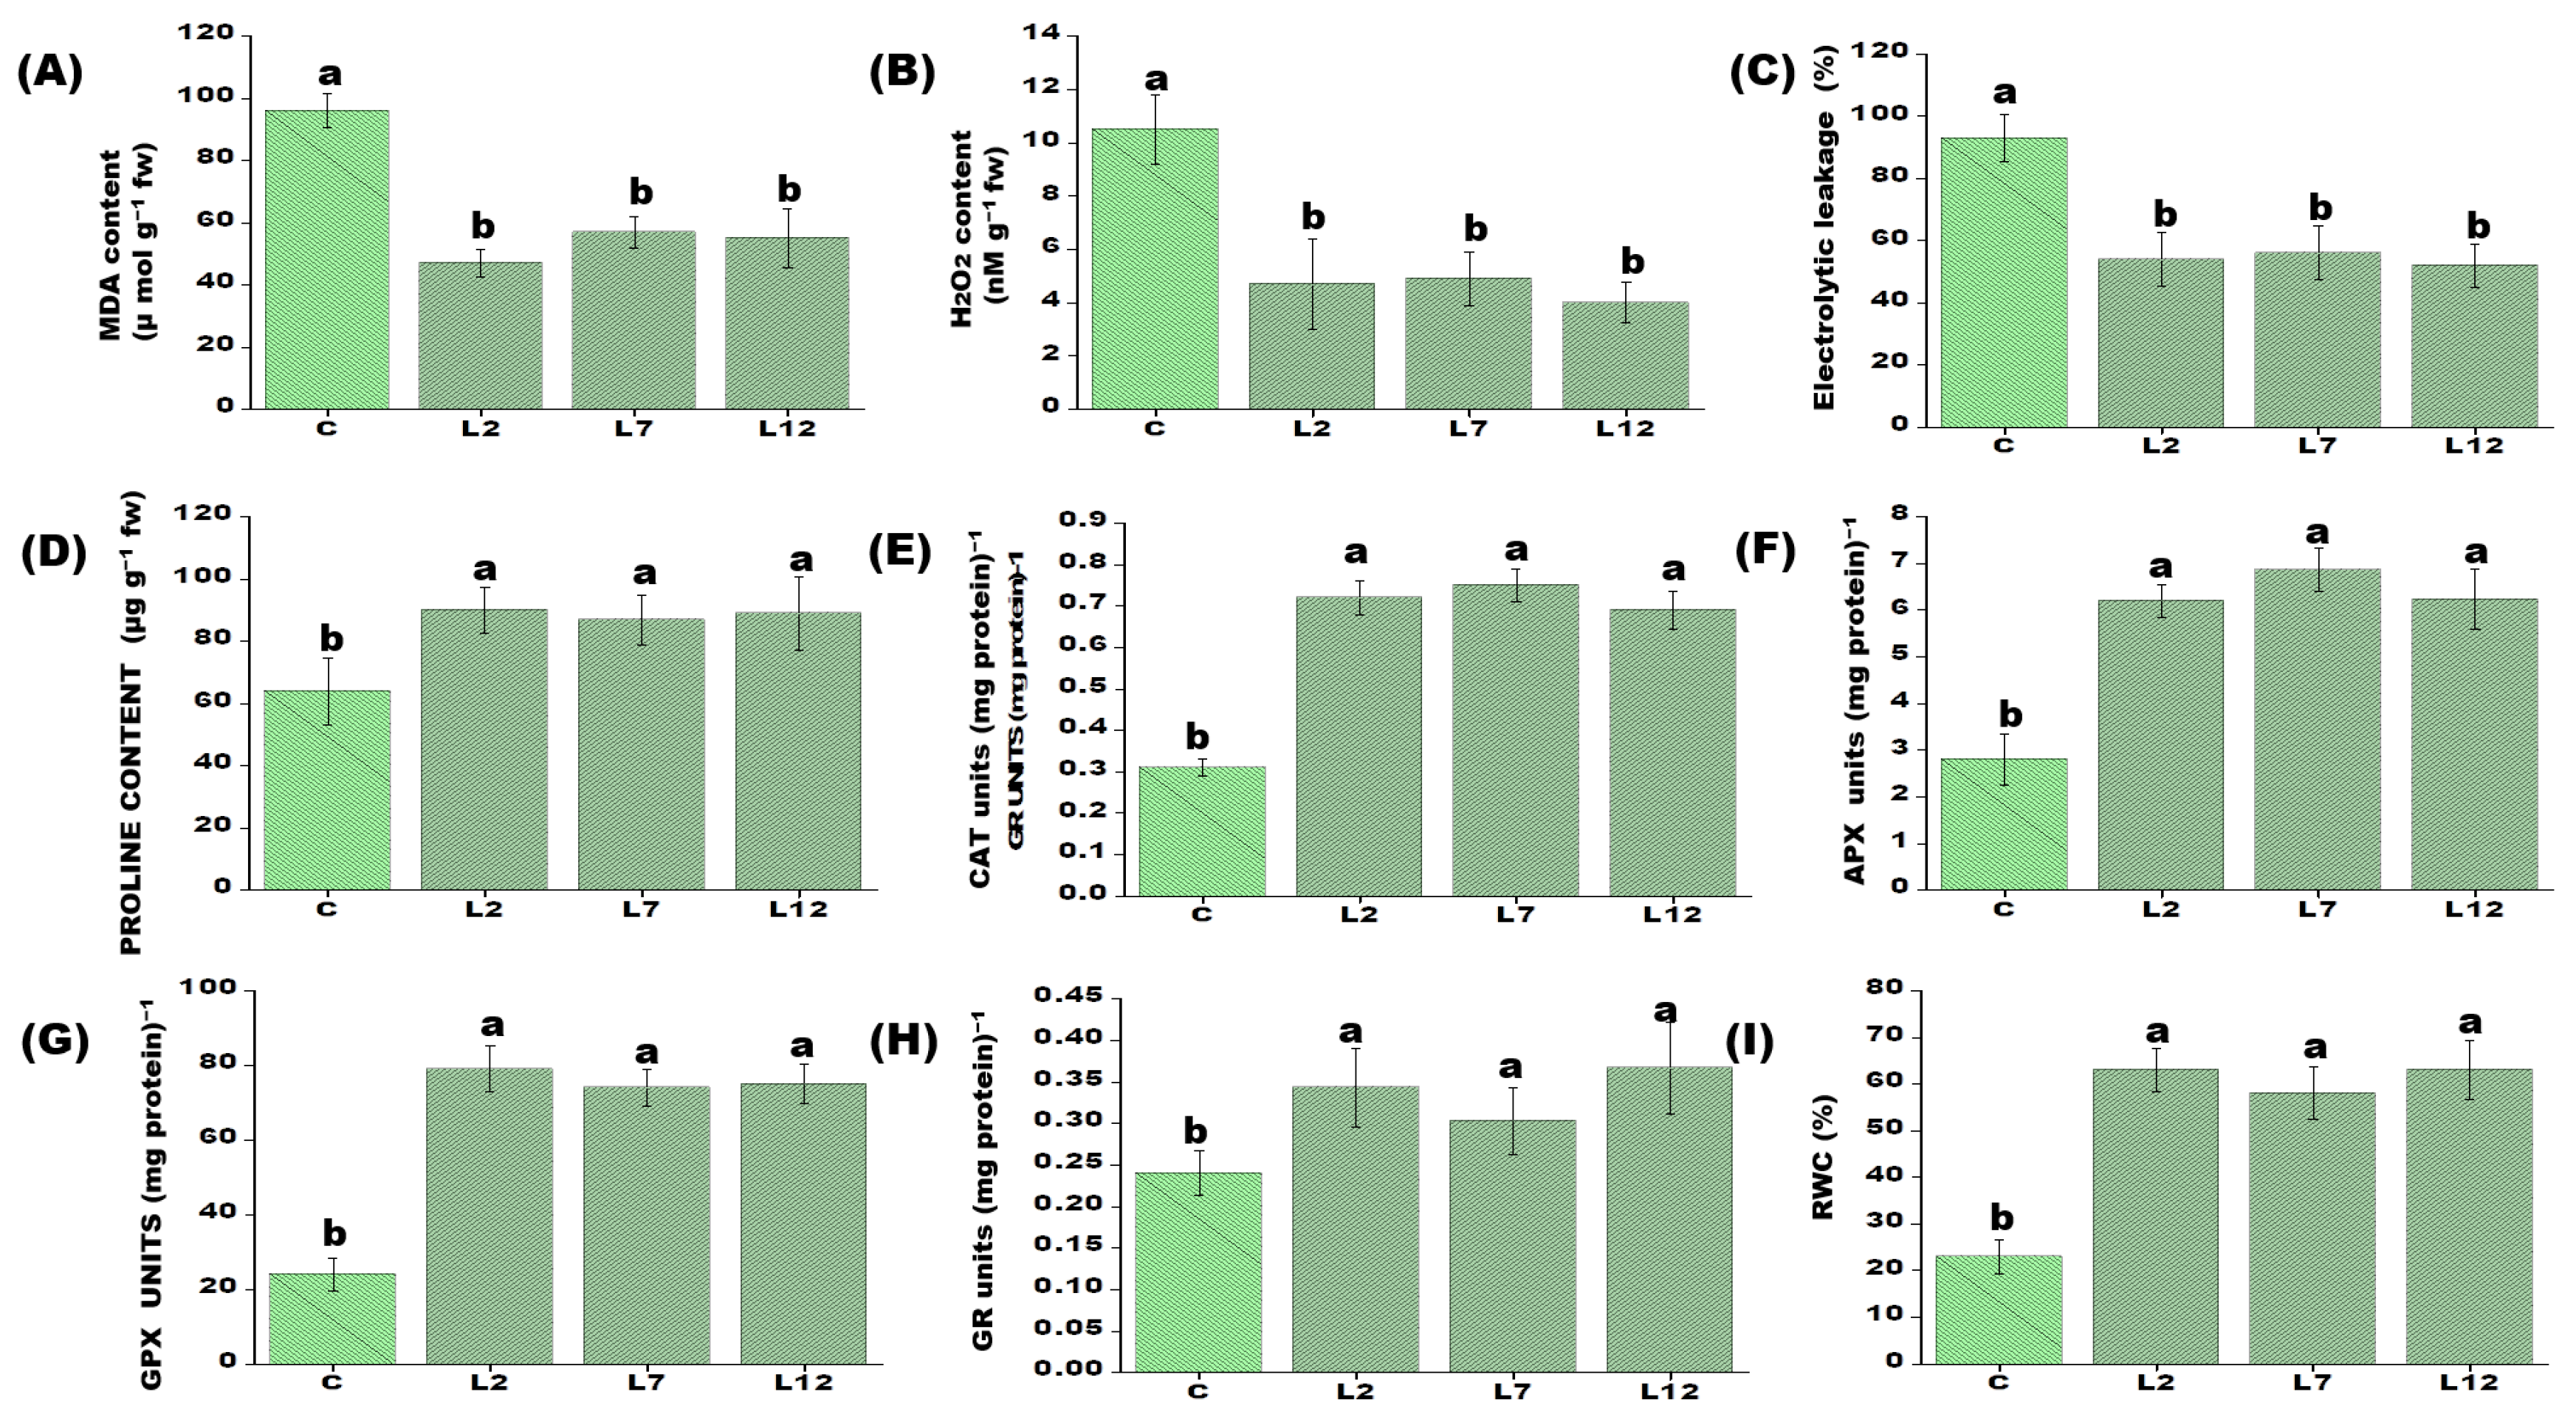
To further evaluate physiological responses to salt stress, selected T1 transgenic lines were subjected to severe salinity (200 mM NaCl). Following treatment, the transgenic plants exhibited two-fold lower MDA levels compared to water-treated controls. Additionally, PEPCK-overexpressing lines showed approximately 2.5-fold lower H2O2 accumulation and 1.5-fold lower ion leakage after salt exposure (Figure 3A–C). The enhanced salt tolerance was further supported by a robust biochemical defense response. Under 200 mM NaCl stress, the transgenic lines displayed a 1.5-fold increase in proline content and a 2.7-fold higher RWC. Furthermore, the activities of key antioxidant enzymes—including CAT (~1.5-fold), APX (~2.4-fold), GPX (~3.2-fold), and GR (~2.4-fold)—were substantially upregulated in the transgenic lines compared with control plants.

3.4. PEPCK Alleviates Agronomic Features in Rice Under Salt Stress

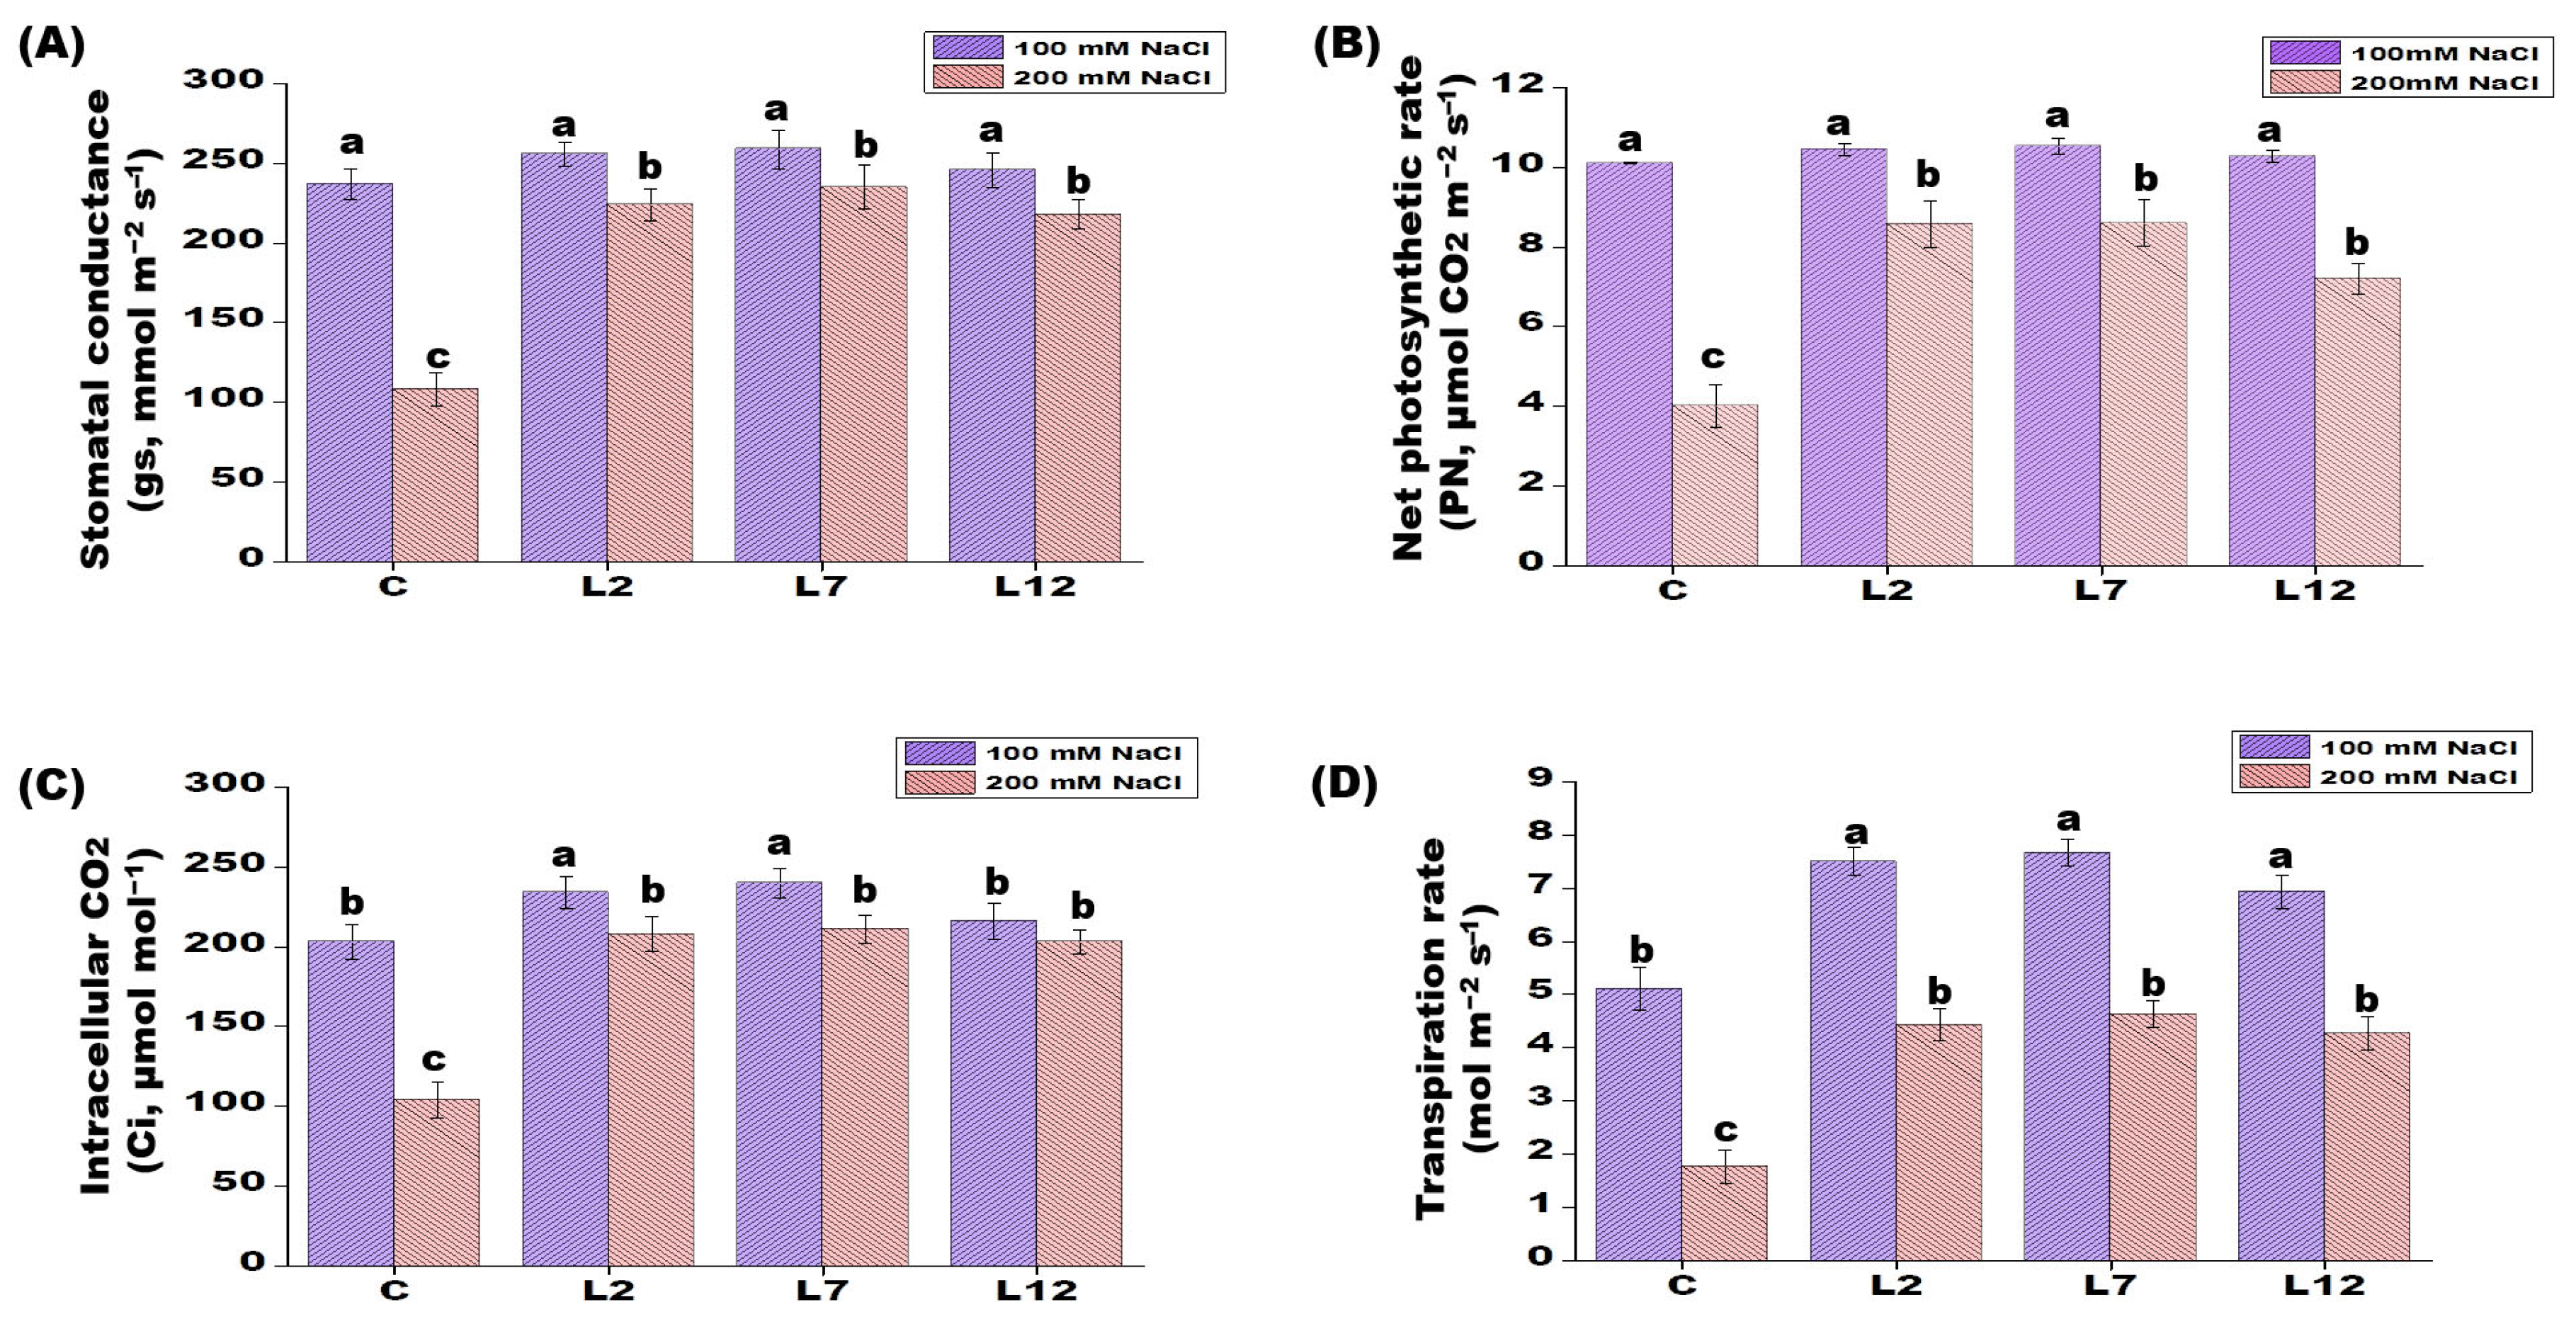
To assess the effect of salt stress on the growth of rice lines overexpressing PEPCK, several agronomic and physiological parameters were measured, including plant height, tiller number per plant, panicle number per plant, filled grains per panicle, chaffy grains per panicle, straw dry weight, 100-grain weight, root length, root dry weight, leaf area, and shoot length (Table 1 and Table 2). The T1 PEPCK overexpressing lines (L2, L7, and L12) exhibited a segregating ratio of 3:1 (HygR:HygS), approximately, as observed in the T1 transgenic rice seeds (Table 3). While comparing the developmental rate of T1 transgenics rice seedlings under NaCl stress to that of control plants, no discernible variation was seen. Under salt stress, T1 transgenic plants exhibited higher values for most growth parameters compared with control plants. In addition, photosynthetic parameters—including stomatal conductance (gs), Pn, Ci, and transpiration rate—were significantly elevated in the transgenic lines relative to controls. Additionally, among the transgenic lines, L7 showed higher photosynthetic parameters, followed by L12 and L2 (Figure 4A–D). Notably, control rice plants failed to reach the flowering stage under salt stress conditions (Table 2 and Table 3). Furthermore, ion content analysis under 200 mM NaCl revealed that PEPCK T1 transgenic lines accumulated lower sodium levels than control plants, while exhibiting higher concentrations of potassium, phosphorus, and nitrogen (Table 2). Here, too, L2 transgenic lines showed the lowest response, and L7 showed the highest response. These results indicate that PEPCK-overexpressing plants experienced reduced stress and were able to maintain normal physiological and growth activities under saline conditions.

3.5. Carbohydrate Metabolism and Hormone Signaling Under Salt Stress

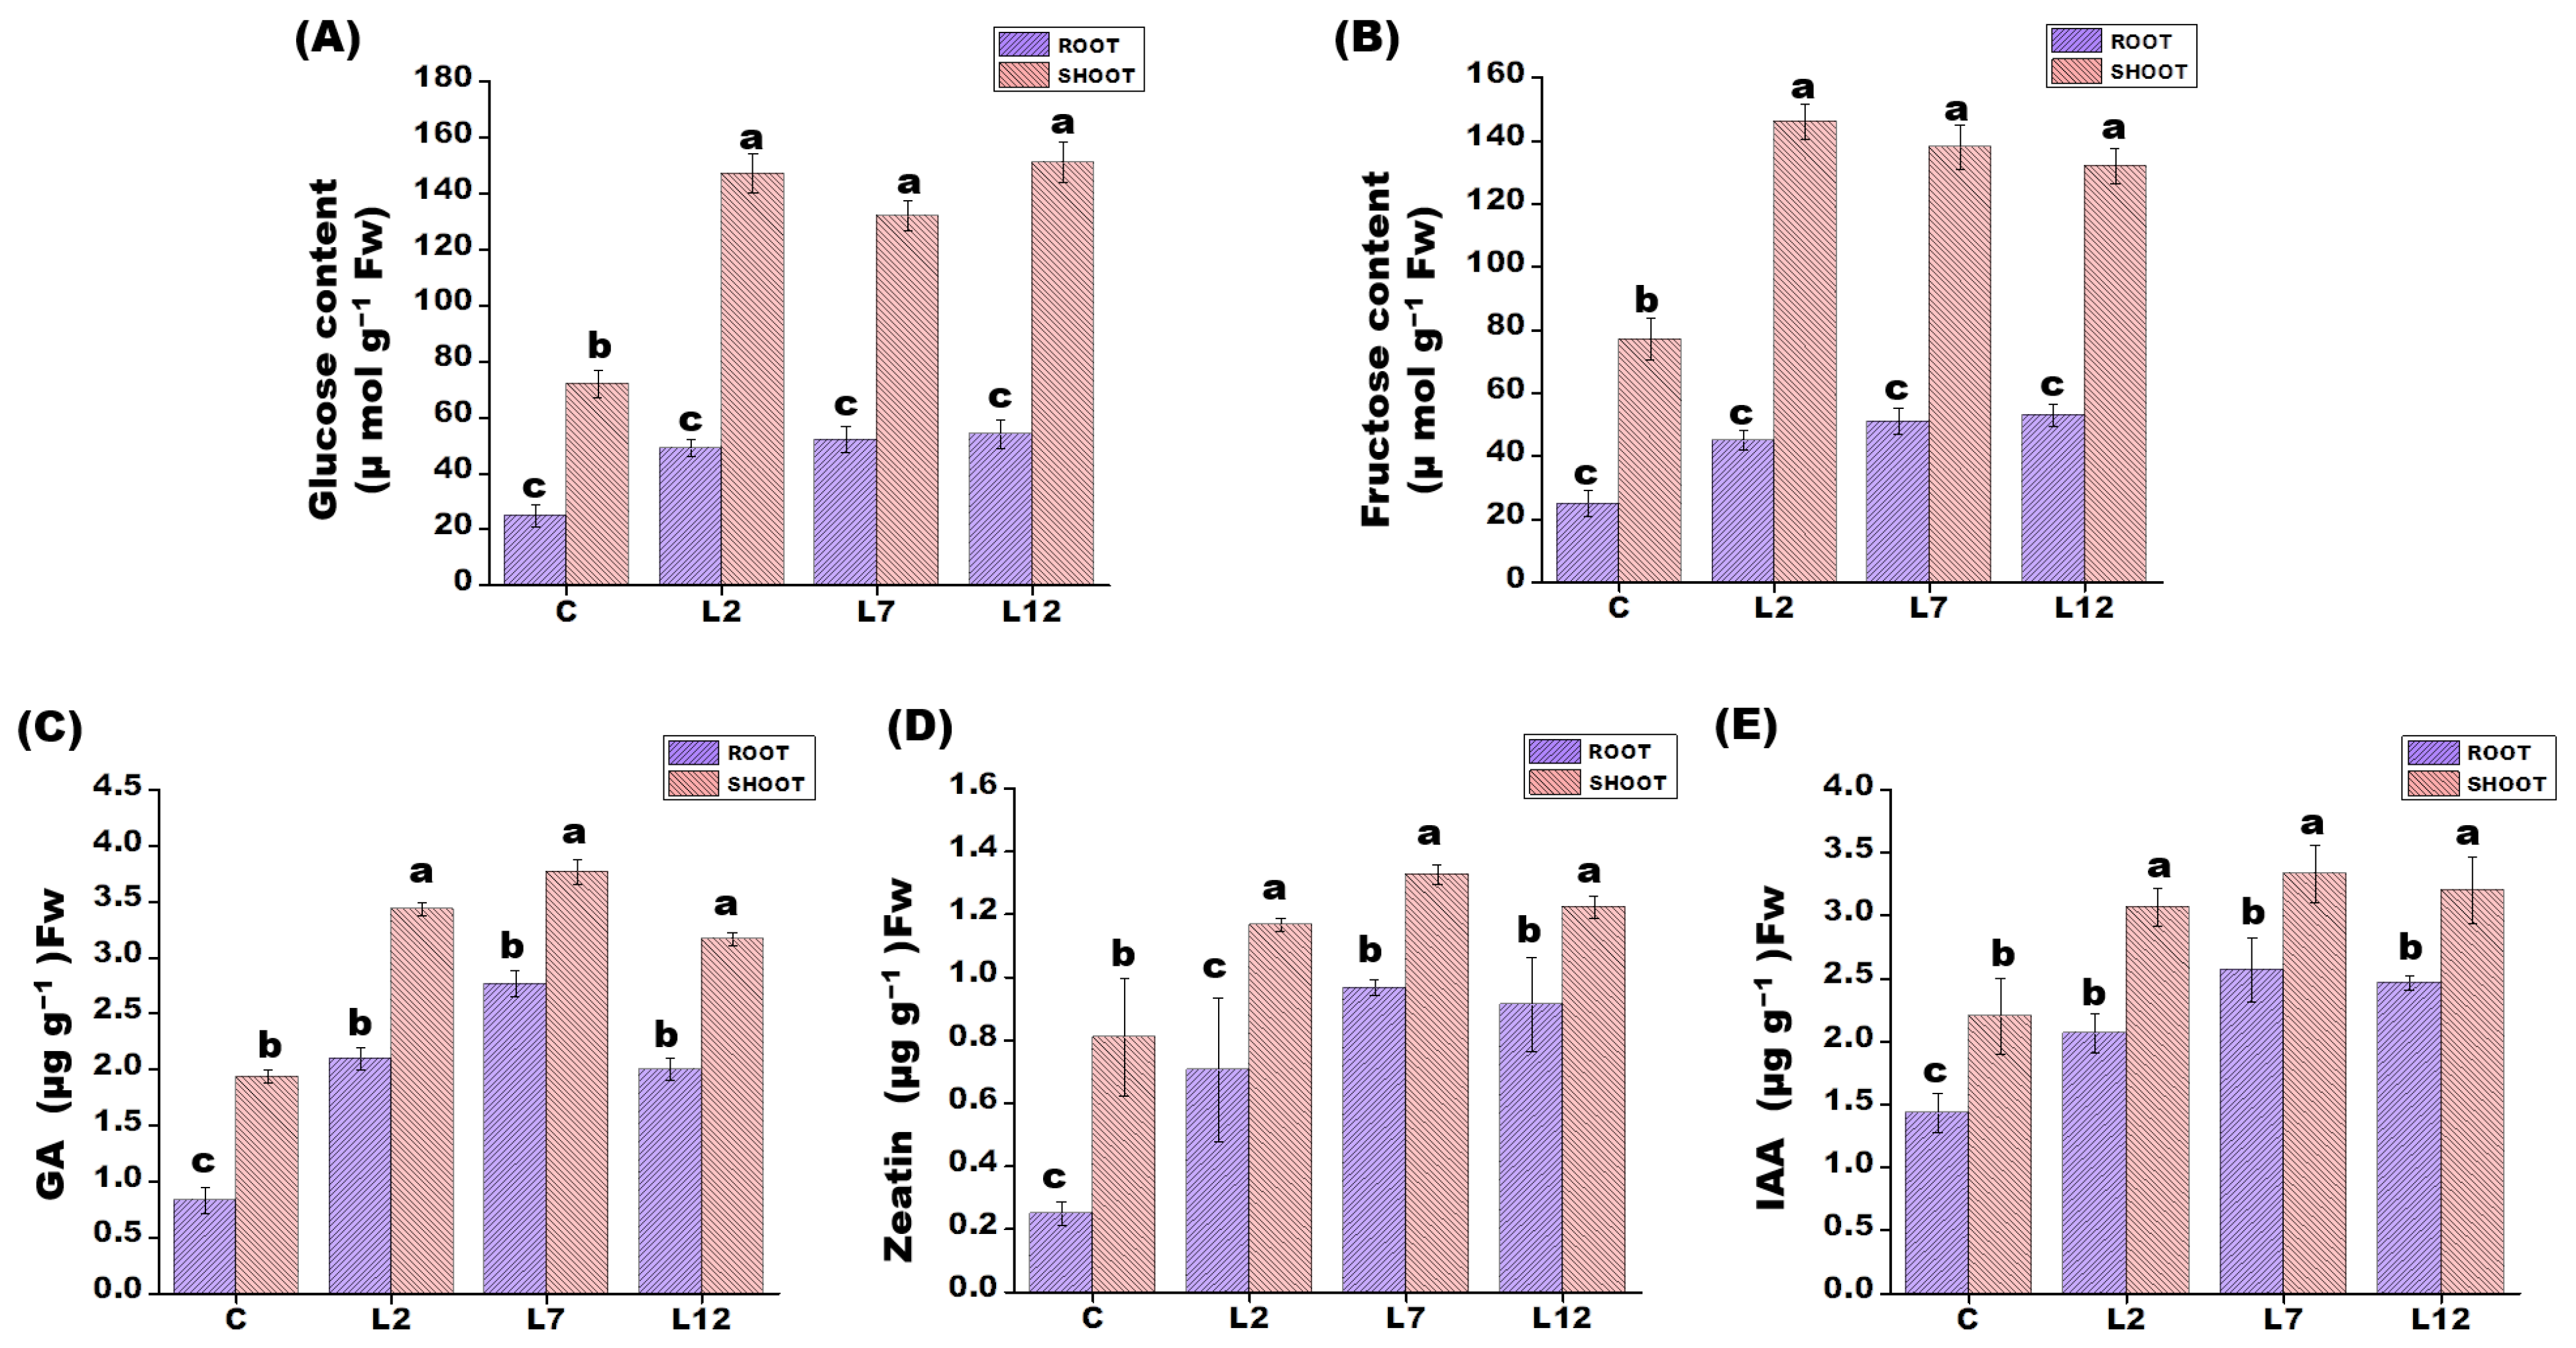
During salt stress, PEPCK-overexpressing T1 plants accumulated significantly higher levels of soluble sugars compared with control rice lines. Specifically, fructose levels increased by approximately 2.5-fold and glucose levels by nearly 2-fold in both shoots and roots of the transgenic plants (Figure 5A,B). In addition to changes in carbohydrate metabolism, hormone profiling revealed notable differences between transgenic and control plants. The roots and shoots of PEPCK-overexpressing lines exhibited higher concentrations of key growth-regulating phytohormones, including (GA), zeatin, and (IAA), compared with control plants (Figure 5C–E).

4. Discussion and Conclusions

Rice production is severely affected by salinity, a complex multigenic stress that influences multiple physiological and metabolic processes in plants. Previous studies have reported the involvement of PEPCK in plant tolerance to abiotic stresses, including salinity and drought, in species such as Arabidopsis thaliana and Sorghum bicolor [27,28]. Tolerance to salt stress requires the coordinated regulation of several processes, including ion homeostasis and reactive oxygen species (ROS) detoxification [29]. Therefore, the objective of the present study was to investigate the role and possible mechanism of PEPCK in conferring salt stress tolerance in rice (O. sativa L. cv. IR64).
Compared with other abiotic stresses, PEPCK expression has been reported to increase nearly three-fold under NaCl treatment. Previous studies have also shown that several genes, including OsHKT1, PDH45 and OsBAT1, are activated in response to salt stress [13,30]. In the present study, transgenic rice lines overexpressing PEPCK were generated, and three representative lines (L2, L7, and L12) were selected for functional validation under saline conditions.
A decline in chlorophyll content under abiotic stress is often associated with chlorophyll degradation, which has been widely reported in various crops, including rice [31]. Using the salt tolerance index and the leaf disk senescence assay, we observed significantly enhanced tolerance to salinity in PEPCK-overexpressing transgenic rice lines. Exposure to salt stress (100 and 200 mM NaCl) caused visible leaf bleaching in both transgenic and control plants, reflecting stress-induced damage (Figure 2C,D). However, the loss of chlorophyll was more pronounced at 200 mM NaCl than at 100 mM NaCl, and the degree of bleaching was greatest in the control plants. In contrast, the transgenic lines exhibited enhanced tolerance under both moderate (100 mM) and severe (200 mM) salinity conditions. Under normal growth conditions, the transgenic plants showed development comparable to control plants, whereas under salt stress, they exhibited significantly better growth, demonstrating the beneficial effect of PEPCK overexpression.
Furthermore, the transgenic lines maintained higher endogenous nutrient levels, indicating an improved capacity to cope with salt stress. Our findings perfectly aligned with the findings of Abdala et al. [32] in their research on O. sativa L. spp. Japonica, var. Nipponbare, where the enhanced salt tolerance in the transgenic lines was associated with improved endogenous nutrient levels due to expression of stress-responsive genes like AP59, AP37, and DREB1A. Similar observations have been reported previously where overexpression of OsSTAP1 in rice was shown to enhance salt tolerance by improving ion homeostasis [33]; however, the effect on soluble sugar accumulation was not examined in that study. Under salt stress, leaves of the PEPCK-overexpressing transgenic lines accumulated higher potassium and lower sodium levels compared with control plants. These results suggest that PEPCK overexpression may restrict sodium accumulation in leaves, thereby protecting the photosynthetic machinery from salt-induced damage.
The PEPCK transgenic lines maintained significantly higher chlorophyll content under saline conditions compared with control plants, which could be linked to the increased activity of antioxidant enzymes, ROS detoxification and lower H2O2 levels. These findings were consistent with earlier reports on improved stress tolerance in transgenic rice crops [30,31].
The presence of higher levels of chlorophyll content in PEPCK transgenic lines under saline conditions implies increased protection of the photosynthetic system. This impact may be attributable to improved antioxidant enzyme activity and effective ROS detoxification, resulting in decreased H2O2 buildup and maintenance of chloroplast integrity. OsBAT1 and PDH45 genes overexpressed in transgenic rice plants with enhanced photosynthetic efficiency and stress tolerance had proven to retain chlorophyll under stress in a comparable manner, indicating the protective function of metabolic and redox control [30,31]. However, these studies did not detect substantial changes in sugar buildup, suggesting that PEPCK may be involved in controlling carbon partitioning and osmotic balance under stressful circumstances. In support of our study, the suppression of OsNYC3, the overexpression of chloroplastic FBPase, and the occurrence of drought-tolerance QTLs have been linked to increased chlorophyll retention under stress conditions [34,35,36]. Salt stress typically reduces photosynthetic parameters, such as intercellular CO2 concentration (Ci), net photosynthetic rate (Pn), and stomatal conductance (gs). However, the reduction in these parameters was less pronounced in the PEPCK-overexpressing lines than in the control plants, indicating improved photosynthetic performance under salinity stress. These findings are consistent with earlier studies reporting enhanced stress tolerance in transgenic plants [31,37]. The ability of the transgenic plants to maintain higher chlorophyll levels likely contributed to improved regulation of the photosynthetic system during salt stress.
Salt stress is known to induce the production of reactive oxygen species (ROS), which can damage proteins, nucleic acids, mitochondria, chloroplasts, and plasma membranes through lipid peroxidation and oxidative degradation [38]. In the present study, transgenic plants exhibited significantly lower levels of lipid peroxidation, ion leakage, and H2O2 accumulation compared with control plants under salt stress. These results are consistent with findings from previous studies [39,40]. Salinity-induced accumulation of H2O2, a major ROS, can oxidatively damage biomolecules such as proteins, lipids, and nucleic acids, leading to loss of membrane integrity [41]. Plants mitigate such damage through antioxidant defense systems, including the ascorbate–glutathione (AsA–GSH) cycle, in which ascorbate serves as an electron donor for detoxification of H2O2. Antioxidant enzymes such as APX, GPX, and GR play critical roles in this process. GR catalyzes the NADPH-dependent reduction in oxidized glutathione (GSSG) to its reduced form (GSH), thereby maintaining a high GSH/GSSG ratio. Our results indicate that the T1 transgenic lines exhibited significantly higher activities of antioxidant enzymes—including APX, GPX, and GR—under salt stress compared with control plants. These findings suggest that the overexpression of PEPCK is associated with modulating the antioxidant and defense machinery in rice under saline conditions, along with enhanced ROS-scavenging capacity.
Sugars also play an important role in plant defense against salinity by stabilizing cellular structures, interacting with phospholipid head groups, and contributing to ROS detoxification [42]. In this study, transgenic lines overexpressing PEPCK accumulated higher levels of fructose and glucose compared with control plants. The elevated accumulation of these sugars is suggestive of an enhanced capacity for osmotic adjustment and energy availability under saline conditions. Although the core metabolic mechanisms were not specifically investigated in the present investigation, the findings offer insightful information about their possible contribution. Similar accumulation of soluble sugars under salt stress has been reported in several plant species, including Medicago sativa, Z. mays, and Vitis vinifera [43,44,45]. Moreover, the transgenic rice plants showed significantly higher endogenous levels of plant hormones in both shoots and roots. These elevated hormone levels may have contributed to improved growth, cellular expansion, regulation of molecular and biochemical pathways, as well as stress adaptation in the transgenic plants under salt stress. However, further research is required in order to determine their specific regulatory mechanisms. These observations are consistent with previous reports highlighting the role of phytohormones in stress adaptation [46,47,48].
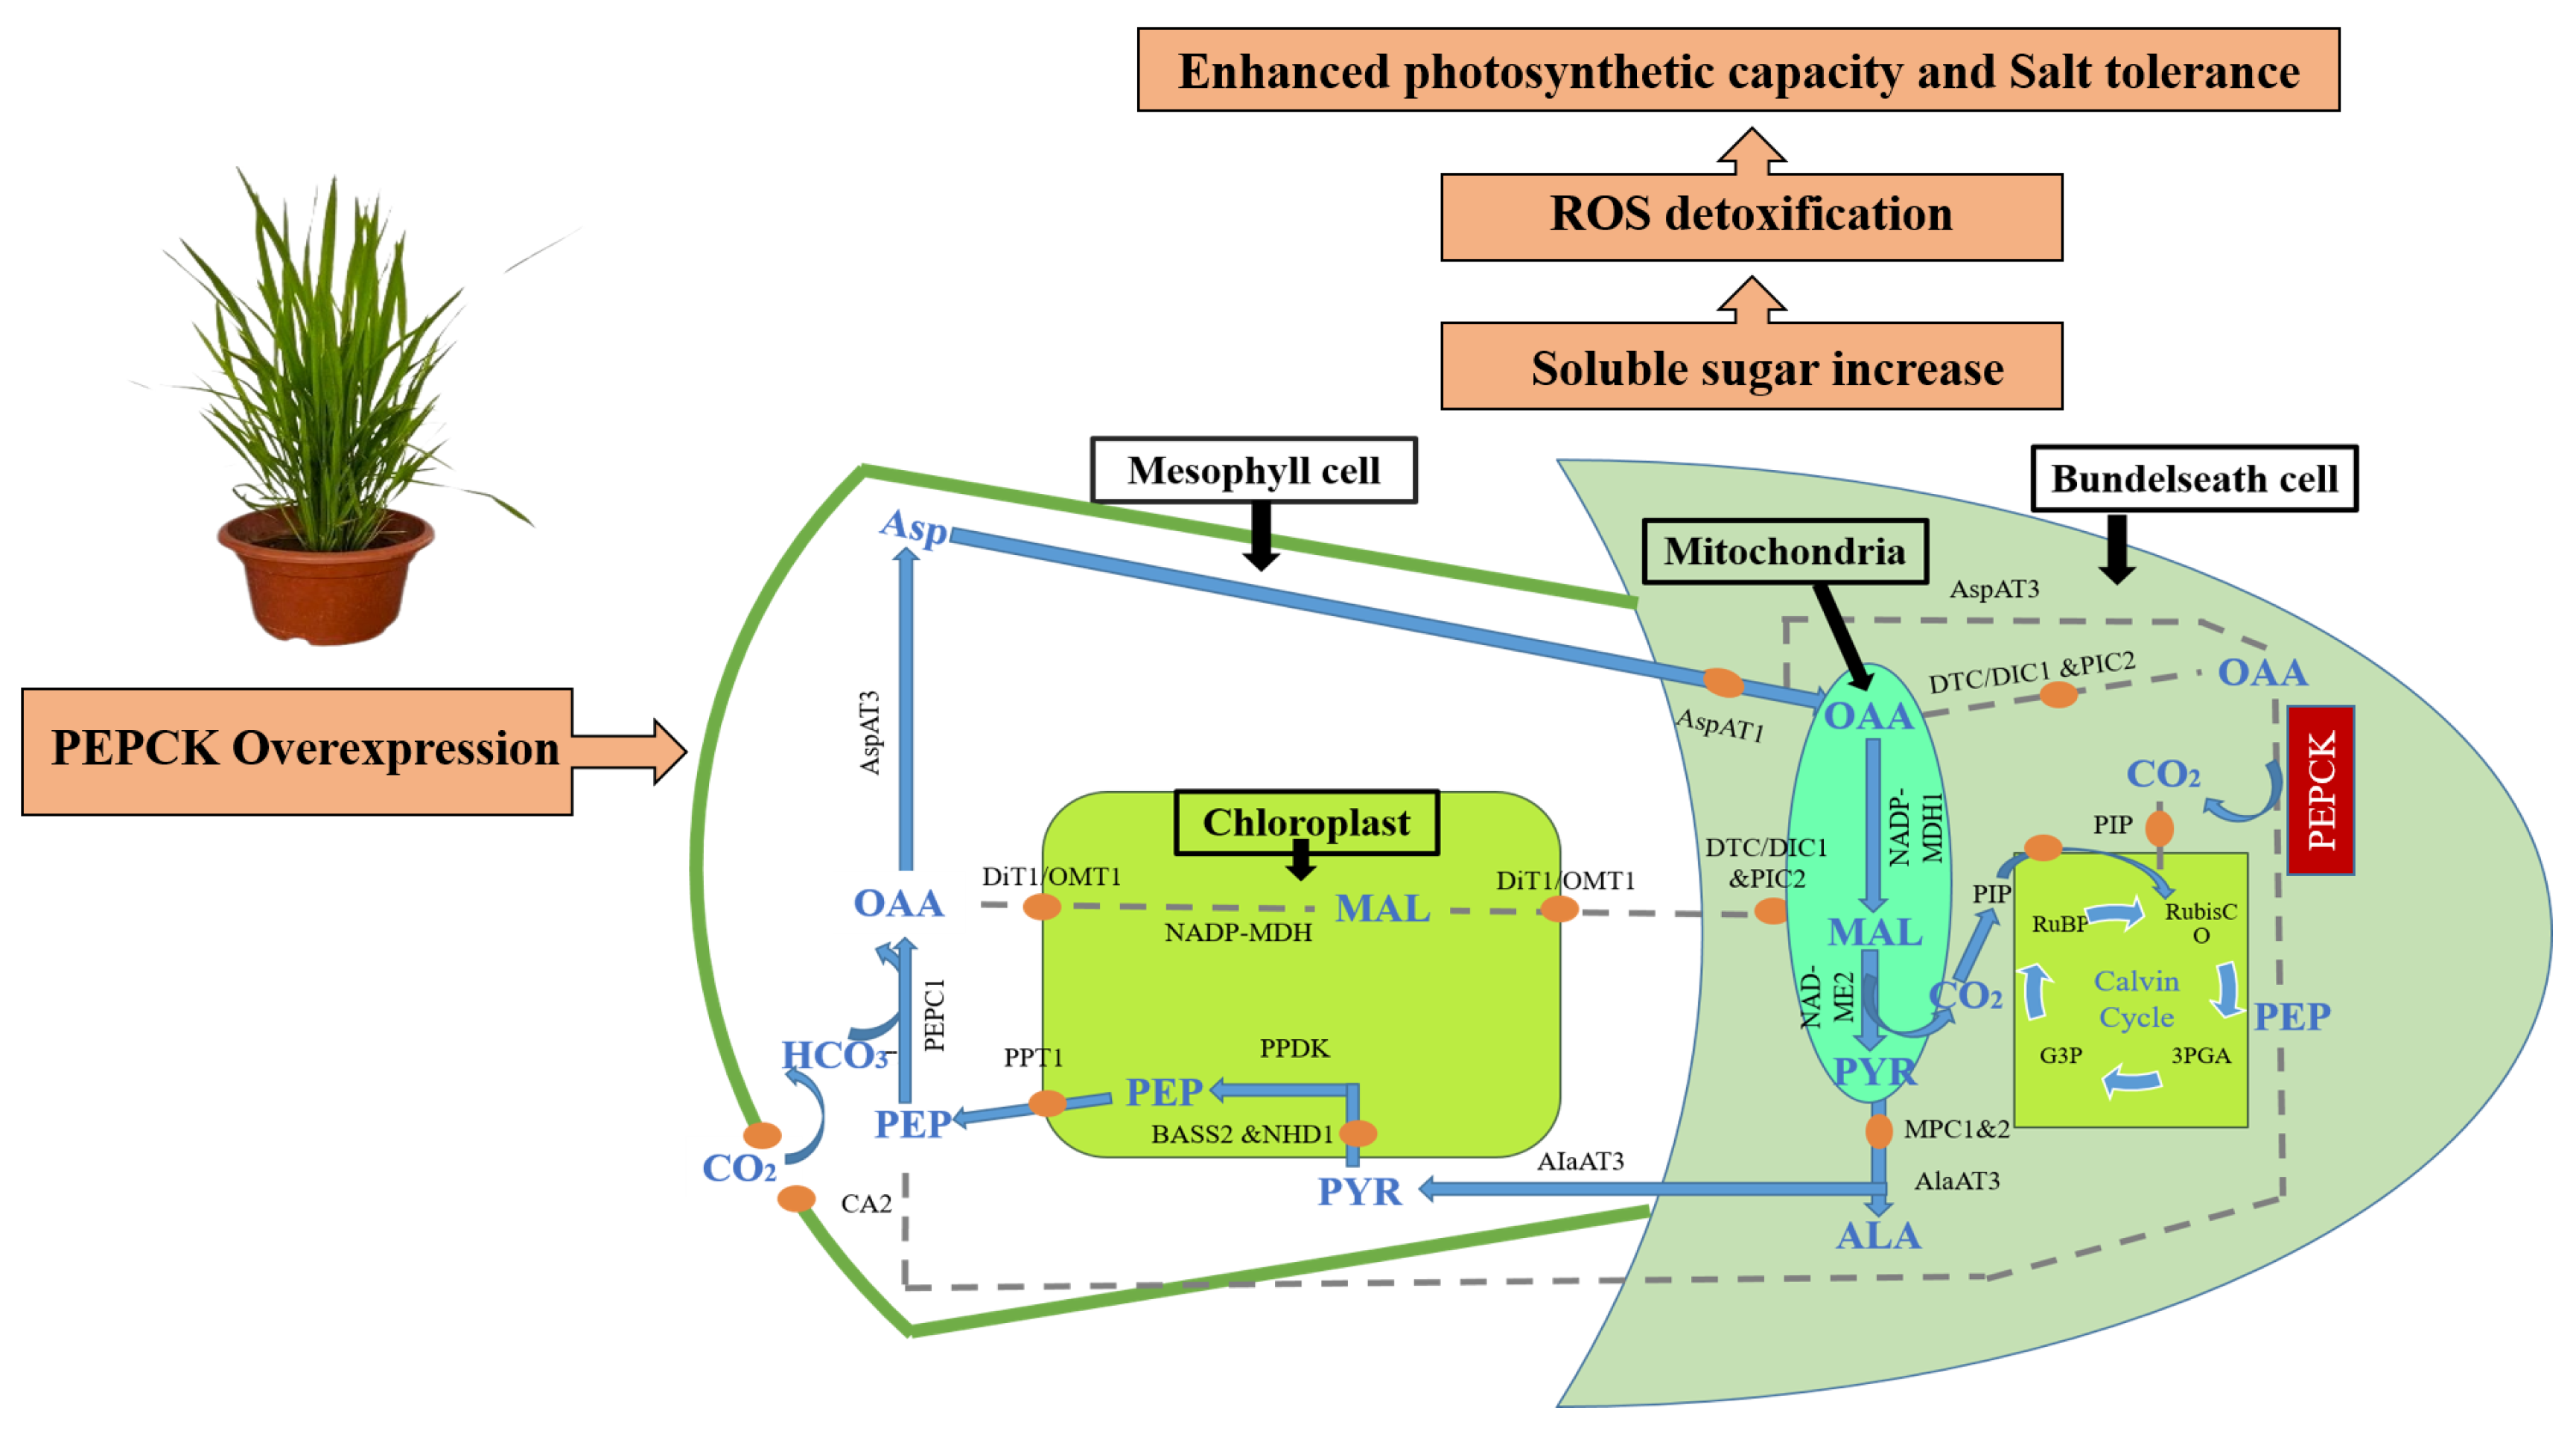
Based on these observations, we propose a conceptual model describing the role of PEPCK in salinity tolerance. Under high salinity conditions, excessive accumulation of Na+ ions disrupts cellular homeostasis and reduces photosynthetic efficiency. Overexpression of PEPCK is linked to variations in the metabolism of carbon, leading to increased production of osmoprotective sugars. However, this research did not explicitly evaluate the direct role of gluconeogenesis and the tricarboxylic acid (TCA) cycle, indicating that it is still theoretical. These metabolic adjustments, specifically the conversion to PEP from OAA via PEPCK and the subsequent alteration in carbon flux, help to maintain carbon–nitrogen balance, stabilize cellular pH, facilitate detoxification of ROS, and ultimately improve salinity tolerance (Figure 6). Figure 6 also depicts that, as PEPCK is involved in the decarboxylation step of the C4 pathway, it may serve as a link between the carbon metabolism and the stress-responsive metabolic process.
In conclusion, the present study demonstrates that overexpression of PEPCK enhances salinity tolerance in transgenic rice while maintaining growth and yield-related traits. These findings highlight the potential of targeting metabolic pathway components such as PEPCK to improve crop resilience to salinity stress and contribute to sustainable agricultural productivity under changing climatic conditions. Although the results are promising, it is important to recognize some limitations of our study. Adding to these significant findings, future investigations may broaden the relevance of our study. As an example, assessing PEPCK-overexpressing lines in a wider range of field-specific saline environments would offer additional insight into how well they function in varying environmental situations. Furthermore, if a greater number of independent transgenic lines and a variety of genetic backgrounds are included, then the findings would have broader applicability. Although the current work indicates that PEPCK may be involved in controlling antioxidant defense, osmotic balance, and carbon metabolism at the mechanistic level, it remains to be further elucidated. Future research may provide insight into PEPCK’s role in pathways, including gluconeogenesis and the TCA cycle, using sophisticated techniques like metabolic flux measurement, isotope labeling, and thorough enzymatic investigations. Further comprehensive research might help create more effective methods for designing crops to withstand salt and expand our knowledge of PEPCK-mediated stress responses.

Author Contributions

Conceptualization, S.P. (Sowmya Poosapati), D.M.S. and R.K.S.; Methodology, S.P. (Suchismita Prusty), S.M. and R.K.S.; Validation, S.P. (Suchismita Prusty), S.M. and R.K.S.; Formal analysis, S.P. (Suchismita Prusty) and S.M.; Investigation, S.P. (Suchismita Prusty) and S.M.; Data curation, S.M. and S.P. (Suchismita Prusty); Writing—original draft, S.P. (Suchismita Prusty), S.M. and R.K.S.; Writing—review and editing, S.P. (Sowmya Poosapati) and D.M.S.; Visualization, S.P. (Suchismita Prusty); Supervision, S.P. (Sowmya Poosapati), D.M.S. and R.K.S.; Project administration, S.P. (Suchismita Prusty); Funding acquisition, S.P. (Sowmya Poosapati), D.M.S. and R.K.S. All authors have read and agreed to the published version of the manuscript.

Funding

This research received no external funding.

Data Availability Statement

The original contributions presented in this study are included in the article. Further inquiries can be directed to the corresponding authors.

Conflicts of Interest

Author D.M.S. is employed by the company, Vidya USA Corporation, 7 Otis Stone Hunter Road, Bunnell, FL 32100, USA. The remaining authors declare that the research was conducted in the absence of any commercial or financial relationships that could be construed as a potential conflict of interest.

References

  1. Li, Y.; Zhong, H.; Shan, Y.; Hang, Y.; Wang, D.; Zhou, Y.; Hubacek, K. Changes in global food consumption increase GHG emissions despite efficiency gains along global supply chains. Nat. Food 2023, 4, 483–495. [Google Scholar] [CrossRef] [PubMed]
  2. Mamasolieva, M.A.; Gafurova, L.A.; Hudoynazarov, I.A. Study the effect of a Biosolvent preparation on the amount of salts in saline soils and antioxidant enzymes of cotton. J. Soil. Salin. Water Qual. 2023, 15, 242–251. [Google Scholar]
  3. Shahid, S.A.; Zaman, M.; Heng, L. Soil Salinity: Historical Perspectives and a World Overview of the Problem. In Guideline for Salinity Assessment, Mitigation and Adaptation Using Nuclear and Related Techniques; Springer: Berlin/Heidelberg, Germany, 2018; pp. 43–53. [Google Scholar] [CrossRef]
  4. Jobe, T.O.; Zenzen, I.; Rahimzadeh, K.P.; Kopriva, S. Integration of sulfate assimilation with carbon and nitrogen metabolism in transition from C3 to C4 photosynthesis. J. Exp. Bot. 2019, 15, 4211–4221. [Google Scholar] [CrossRef]
  5. Ermakova, M.; Danila, F.R.; Furbank, R.T.; von Caemmerer, S. On the road to C4 rice: Advances and perspectives. Plant J. 2020, 101, 940–950. [Google Scholar] [CrossRef]
  6. Shen, Z.; Dong, X.M.; Gao, Z.F.; Chao, Q.; Wang, B.C. Phylogenic and phosphorylation regulation difference of phosphoenolpyruvate carboxykinase of C3 and C4 plants. J. Plant Physiol. 2017, 213, 16–22. [Google Scholar] [CrossRef]
  7. Liu, X.C.; Lin, X.H.; Liu, S.C.; Zhu, C.Q.; Grierson, D.; Li, S.J.; Chen, K.S. The effect of NH4+ on phosphoenolpyruvate carboxykinase gene expression, metabolic flux and citrate content of citrus juice sacs. Plant Physiol. Biochem. 2021, 167, 123–131. [Google Scholar] [CrossRef]
  8. Prusty, S.; Sahoo, R.K. PEPCK Gene for Enhanced Photosynthesis and Salinity Stress Tolerance in Rice: A Review. Agric. Rev. 2022, 45, 636–644. [Google Scholar] [CrossRef]
  9. Cacefo, V.; Ribas, A.F.; Zilliani, R.R.; Neris, D.M.; Domingues, D.S.; Moro, A.L.; Vieira, L.G. Decarboxylation mechanisms of C4 photosynthesis in Saccharum spp.: Increased PEPCK activity under water-limiting conditions. BMC Plant Biol. 2019, 19, 144. [Google Scholar] [CrossRef] [PubMed]
  10. Sahoo, R.K.; Tuteja, N. Development of Agrobacterium-mediated transformation technology for mature seed-derived callus tissues of indica rice cultivar IR64, GM Crops. Food 2012, 3, 123–128. [Google Scholar] [CrossRef]
  11. Sambrook, J.; Fritsch, E.F.; Maniatis, T. Molecular Cloning: A Laboratory Manual, 2nd ed.; Cold Spring Harbor Laboratory Press: Cold Spring Harbor, NY, USA, 1989. [Google Scholar]
  12. Tuteja, N.; Sahoo, R.K.; Garg, B.; Tuteja, R. OsSUV3 dual helicase functions in salinity stress tolerance by maintaining photosynthesis and antioxidant machinery in rice (Oryza sativa L. cv. IR64). Plant J. 2013, 76, 115–127. [Google Scholar] [CrossRef]
  13. Tuteja, N.; Sahoo, R.K.; Huda, K.M.; Tula, S.; Tuteja, R. OsBAT1 augments salinity stress tolerance by enhancing detoxification of ROS and expression of stress-responsive genes in transgenic rice. Plant Mol. Biol. Rep. 2015, 33, 1192–1209. [Google Scholar] [CrossRef]
  14. Jayaraman, A.; Puranik, S.; Rai, N.K.; Vidapu, S.; Sahu, P.P.; Lata, C.; Prasad, M. cDNA-AFLP analysis reveals differential gene expression in response to salt stress in foxtail millet (Setaria italica L.). Mol. Biotechnol. 2008, 40, 241–251. [Google Scholar] [CrossRef]
  15. Garg, B.; Jaiswal, J.P.; Misra, S.; Tripathi, B.N.; Prasad, M.A. A comprehensive study on dehydration-induced antioxidative responses during germination of Indian bread wheat (Triticum aestivum L. em Thell) cultivars collected from different agroclimatic zones. Physiol. Mol. Biol. Plants 2012, 18, 217–228. [Google Scholar] [CrossRef]
  16. Bates, L.S.; Waldren, R.P.; Teare, I.D. Rapid determination of proline in water stress studies. Plant Soil 1973, 39, 205–207. [Google Scholar] [CrossRef]
  17. Jana, S.; Choudhuri, M.A. Glycolate metabolism of three submerged aquatic angiosperms during aging. Aquat. Bot. 1981, 12, 345–354. [Google Scholar] [CrossRef]
  18. De Vos, C.H.R.; Schat, H.; Vooijs, R.; Ernst, W.H.O. Copper-induced damage to the permeability barrier in roots of Silene cucubalus. J. Plant Physiol. 1989, 135, 164–179. [Google Scholar] [CrossRef]
  19. Blum, A.; Ebercon, A. Cell membrane stability as a measure of drought and heat tolerance in wheat 1. Crop Sci. 1981, 21, 43–47. [Google Scholar] [CrossRef]
  20. Barrs, H.D.; Weatherley, P.E. A re-examination of the relative turgidity technique for estimating water deficit in leaves. Aust. J. Biol. Sci. 1962, 15, 413–428. [Google Scholar] [CrossRef]
  21. Jackson, T.L. Soil Chemical Analysis; Prentice-Hall of India Private Limited: New Delhi, India, 1973. [Google Scholar]
  22. Gupta, P.K. Methods in Environmental Analysis Water, Soil and Air; Agrobios: Jodhpur, India, 2004; pp. 242–245. [Google Scholar]
  23. Chapman, H.D.; Pratt, P.F. Method and of Analysis of Soil, Plant and Water, 2nd ed.; California University Agricultural Division: Davis, CA, USA, 1982; p. 170. [Google Scholar]
  24. Munns, R.; Wallace, P.A.; Teakle, N.L.; Colmer, T.D. Measuring soluble ion concentrations (Na+, K+, Cl) in salt-treated plants. In Plant Stress Tolerance: Methods and Protocols; Sunkar, R., Ed.; Methods in molecular biology series; Humana Press: Totowa, NJ, USA, 2010; Volume 639, pp. 371–382. [Google Scholar] [CrossRef]
  25. Karkacier, M.; Erbas, M.; Uslu, M.K.; Aksu, M. Comparison of different extraction and detectionmethods for sugars using amino-bonded phase HPLC. J. Chromatogr. Sci. 2003, 41, 331–333. [Google Scholar] [CrossRef]
  26. Chen, Y.; Dan, Z.; Li, S. Measuring endogenous GA and IAA. Bio-Protocol 2022, 12, 1–4. [Google Scholar] [CrossRef] [PubMed]
  27. Li, Y.; Tan, B.; Wang, D.; Mu, Y.; Li, G.; Zhang, Z.; Pan, Y.; Zhu, L. Proteomic analysis revealed different molecular mechanisms of response to PEG stress in drought-sensitive and drought-resistant sorghums. Int. J. Mol. Sci. 2022, 23, 13297. [Google Scholar] [CrossRef] [PubMed]
  28. Feria, A.B.; Bosch, N.; Sánchez, A.; Nieto-Ingelmo, A.I.; Osa, C.; Echevarría, C.; Mauriño, S.G.; Monreal, J.A. Phosphoenolpyruvate carboxylase (PEPC) and PEPC-kinase (PEPC-k) isoenzymes in Arabidopsis thaliana: Role in control and abiotic stress conditions. Planta 2016, 244, 901–913. [Google Scholar] [CrossRef] [PubMed]
  29. Hao, S.; Wang, Y.; Yan, Y.; Liu, Y.; Wang, J.; Chen, S. A review on plant responses to salt stress and their mechanisms of salt resistance. Horticulturae 2021, 7, 132. [Google Scholar] [CrossRef]
  30. Wang, J.; Nan, N.; Li, N.; Liu, Y.; Wang, T.J.; Hwang, I.; Liu, B.; Xu, Z.Y. A DNA methylation reader–chaperone regulator–transcription factor complex activates OsHKT1; 5 expression during salinity stress. Plant Cell 2020, 32, 3535–3558. [Google Scholar] [CrossRef]
  31. Sahoo, R.K.; Tuteja, R.; Gill, R.; Jiménez Bremont, J.F.; Gill, S.S.; Tuteja, N. Marker-free rice (Oryza sativa L. cv. IR 64) overexpressing PDH45 gene confers salinity tolerance by maintaining photosynthesis and antioxidant machinery. Antioxidants 2022, 11, 770. [Google Scholar] [CrossRef]
  32. Abdala, K.A.; Liao, J.; Mohammed, E.A.; Wu, J.M. Transgenic rice (Oryza sativa L.) varieties exhibit superior salt stress resilience: A comparative study of physiological and biochemical responses in transgenic and non-transgenic genotypes. Plant Physiol. Rep. 2024, 29, 948–974. [Google Scholar] [CrossRef]
  33. Wang, Y.; Wang, J.; Zhao, X.; Yang, S.; Huang, L.; Du, F.; Li, Z.; Zhao, X.; Fu, B.; Wang, W. Overexpression of the transcription factor gene OsSTAP1 increases salt tolerance in rice. Rice 2020, 13, 50. [Google Scholar] [CrossRef]
  34. Cao, W.; Zhang, H.; Zhou, Y.; Zhao, J.; Lu, S.; Wang, X.; Chen, X.; Yuan, L.; Guan, H.; Wang, G.; et al. Suppressing chlorophyll degradation by silencing OsNYC3 improves rice resistance to Rhizoctonia solani, the causal agent of sheath blight. Plant Biotechnol. J. 2022, 20, 335–349. [Google Scholar] [CrossRef]
  35. Mukherjee, S.; Mukherjee, A.; Das, P.; Bandyopadhyay, S.; Chattopadhyay, D.; Chatterjee, J.; Majumder, A.L. A salt-tolerant chloroplastic FBPase from Oryza coarctata confers improved photosynthesis with higher yield and multi-stress tolerance to indica rice. Plant Cell. Tissue Organ Cult. PCTOC 2021, 145, 561–578. [Google Scholar] [CrossRef]
  36. Nounjan, N.; Mahakham, W.; Siangliw, J.L.; Toojinda, T.; Theerakulpisut, P. Chlorophyll retention and high photosynthetic performance contribute to salinity tolerance in rice carrying drought tolerance quantitative trait loci (QTLs). Agriculture 2020, 10, 620. [Google Scholar] [CrossRef]
  37. Liu, C.; Hu, Z.H.; Yu, L.F.; Chen, S.T.; Liu, X.M. Responses of photosynthetic characteristics and growth in rice and winter wheat to different elevated CO2 concentrations. Photosynthetica 2020, 58, 5. [Google Scholar] [CrossRef]
  38. Yildiz, M.; Poyraz, İ.; Çavdar, A.; Özgen, Y.; Beyaz, R. Plant responses to salt stress. In Plant Breeding—Current and Future View; IntechOpen: London, UK, 2020. [Google Scholar] [CrossRef]
  39. Basu, S.; Kumari, S.; Kumar, P.; Kumar, G.; Rajwanshi, R. Redox imbalance impedes photosynthetic activity in rice by disrupting cellular membrane integrity and induces programmed cell death under submergence. Physiol. Plant. 2021, 172, 1764–1778. [Google Scholar] [CrossRef]
  40. Kaewneramit, T.; Buaboocha, T.; Sangchai, P.; Wutipraditkul, N. OsCaM1-1 overexpression in the transgenic rice mitigated salt-induced oxidative damage. Biol. Plant 2019, 63, 335. [Google Scholar] [CrossRef]
  41. Ali, M.; Kamran, M.; Abbasi, G.H.; Saleem, M.H.; Ahmad, S.; Parveen, A.; Malik, Z.; Afzal, S.; Ahmar, S.; Dawar, K.M.; et al. Melatonin-induced salinity tolerance by ameliorating osmotic and oxidative stress in the seedlings of two tomato (Solanum lycopersicum L.) cultivars. J. Plant Growth Regul. 2021, 40, 2236–2248. [Google Scholar] [CrossRef]
  42. Ejaz, S.; Fahad, S.; Anjum, M.A.; Nawaz, A.; Naz, S.; Hussain, S.; Ahmad, S. Role of osmolytes in the mechanisms of antioxidant defense of plants. Sustain. Agric. Rev. 2020, 39, 95–117. [Google Scholar] [CrossRef]
  43. Gao, Y.; Long, R.; Kang, J.; Wang, Z.; Zhang, T.; Sun, H.; Li, X.; Yang, Q. Comparative proteomic analysis reveals that antioxidant system and soluble sugar metabolism contribute to salt tolerance in alfalfa (Medicago sativa L.) leaves. J. Proteome Res. 2018, 18, 191–203. [Google Scholar] [CrossRef]
  44. Bai, X.; Zeng, X.; Huang, S.; Liang, J.; Dong, L.; Wei, Y.; Li, Y.; Qu, J.; Wang, Z. Marginal impact of cropping BADH transgenic maize BZ-136 on chemical property, enzyme activity, and bacterial community diversity of rhizosphere soil. Plant Soil. 2019, 436, 527–541. [Google Scholar] [CrossRef]
  45. Yang, Z.; Shen, L.; Hu, L.; Cai, Y.; Zheng, Q.; Wu, Y. The PEPCK and FBP genes regulate gluconeogenesis metabolism in grape berries in response to light intensity. Horticulturae 2024, 10, 1270. [Google Scholar] [CrossRef]
  46. Anjum, N.; Maiti, M.K. OsNAC121 regulates root development, tillering, panicle morphology, and grain filling in rice plant. Plant Mol. Biol. 2024, 114, 82. [Google Scholar] [CrossRef] [PubMed]
  47. Swain, D.M.; Sahoo, R.K.; Srivastava, V.K.; Tripathy, B.C.; Tuteja, R.; Tuteja, N. Function of heterotrimeric G-protein γ subunit RGG1 in providing salinity stress tolerance in rice by elevating detoxification of ROS. Planta 2017, 245, 367–383. [Google Scholar] [CrossRef]
  48. Swain, D.M.; Sahoo, R.K.; Chandan, R.K.; Ghosh, S.; Kumar, R.; Jha, G.; Tuteja, N. Concurrent overexpression of rice G-protein β and γ subunits provide enhanced tolerance to sheath blight disease and abiotic stress in rice. Plant 2019, 250, 1505–1520. [Google Scholar] [CrossRef] [PubMed]
Figure 1. Molecular characterization and analysis of the expression of T1 transgenic lines (PEPCK). (A) Schematic representation of T-DNA region of pCAMBIA1301, containing the PEPCK gene (1.4 kb) inserted in HindIII restriction enzyme site of the Multiple Cloning Site (MCS) with the promoter (CaMV35S) and terminator (poly A). (B) The PEPCK overexpressing T1 transgenic lines (L2, L7, and L12) and control plant (wild type) were used for further analysis (60-day-old plants). (C) Polymerase chain reaction (PCR) analysis of PEPCK overexpressing transgenic (T1) lines by using CaMV35S promoter-specific forward and gene reverse primers, showing the expected amplification of a 1.4 kb fragment in three independent transgenic lines (L2, L7, and L12). Here, M represents the marker, and L2, L7 and L12 are independent transgenic lines. (D) Southern blot analysis showing the integration and copy number of the PEPCK gene in all three transgenic lines.
Plants 15 01402 g001
Figure 2. Genotypic and phenotypic characterization of PEPCK overexpressed T1 transgenic lines. (A) Relative gene expression analysis of the T1 PEPCK transgenic lines to observe the RNA expression (fold change) in control and transgenic lines. (B) Visualization of GUS activity in leaf tissues of transgenic lines with control plants. (C) Leaf disk senescence assay for salt tolerance in T1 PEPCK transgenic rice lines with control plants (after 72 h of salt treatment). (D) Chlorophyll content (mg g−1 fw) in T1 PEPCK transgenic lines under 100 and 200 mM NaCl after 72 h. Each value represents the mean of three replicates ± SE. Different letters on the top of bars indicate significant differences at p ≤ 0.05 level as determined by Duncan’s multiple range test (DMRT).
Plants 15 01402 g002
Figure 3. Biochemical analysis and the response of the antioxidant machinery in PEPCK overexpressing T1 transgenic lines (L2, L7, and L12) and control rice plants exposed to 24 h salt stress (200 mM NaCl). (A) Determination of lipid peroxidation expressed in terms of MDA content. (B) Changes in the level of hydrogen peroxide (H2O2) content. (C) Measurement of electrolytic leakage. (D) Changes in the level of proline accumulation. (E) Catalase (CAT) activity in transgenic lines after salt stress, where one unit of enzyme activity is defined as 1 μmol H2O2 oxidized min−1. (F) Changes in ascorbate peroxidase (APX) enzyme activity in transgenic lines after salt stress, where one unit of enzyme activity is defined as 1 μmol of ascorbate oxidized min−1. (G) Changes in guaiacol peroxidase (GPX) activity in transgenic lines after salt stress. (H) Changes in glutathione reductase (GR) activity in transgenic lines after salt stress, where one unit of enzyme activity is defined as 1 μmol of GS-TNB formed min−1 due to reduction in 5,5′-dithiobis-(2-nitrobenzoic acid), known as DTNB. (I) Estimation of relative water content (RWC%) in leaf disks of transgenic and control rice. Each value represents the mean of three replicates ± SE. Different letters on the top of bars indicate significant differences at p ≤ 0.05 level as determined by Duncan’s multiple range test (DMRT).
Plants 15 01402 g003
Figure 4. Measurement of photosynthetic characteristics of control and PEPCK T1 transgenic lines (L2, L7, and L12) under 0 mM NaCl and 200 mM NaCl treatment. (A) Stomatal conductance. (B) Net Photosynthetic rate. (C) Intracellular CO2. (D) Transpiration rate. Values are means of three replicates ± SE (n = 3). Different letters on the top of bars indicate significant differences at p ≤ 0.05 level as determined by Duncan’s multiple range test (DMRT).
Plants 15 01402 g004
Figure 5. Soluble sugar and endogenous hormone content in roots and shoots of PEPCK overexpressing T1 transgenic lines (L2, L7, and L12) compared to control rice plants exposed to 24 h salinity stress (200 mM NaCl). (A) Glucose content in shoots and roots in transgenic lines and control line after salt stress. (B) Fructose content in shoots and roots in transgenic lines and control line after salt stress. (C) Endogenous GA content in transgenic lines and control line after salt stress. (D) Endogenous Zeatin content in transgenic lines and control line after salt stress. (E) Endogenous IAA content in transgenic lines and control line after salt stress. Each value represents the mean of three replicates ± SE. Different letters on the top of bars indicate significant differences at p ≤ 0.05 level as determined by Duncan’s multiple range test (DMRT).
Plants 15 01402 g005
Figure 6. Schematic representation of biochemical and physiological responses of plants under salinity stress and how to counteract these effects. The plants activate upregulation of phosphoenolpyruvate carboxykinase (PEPCK), which promotes gluconeogenesis and modulates the tricarboxylic acid (TCA) cycle. This metabolic adjustment leads to increased soluble sugar accumulation and enhanced reactive oxygen species (ROS) detoxification, ultimately contributing to enhancing photosynthetic capabilities and improved stress tolerance. Abbreviation: CO2 carbon dioxide; HCO3: bicarbonate; OAA: oxaloacetic; MAL: malate; PYR: pyruvate; Asp: aspartate and PEP: phosphoenolpyruvate. Names in black correspond to C4 genes; CA: carbonic anhydrase; PEPC: phosphoenolpyruvate carboxylase; AspAT: aspartate aminotransferase; DiT1: dicarboxylate transporter; OMT1: oxoglutarate/malate transporter; NADP-MDH: NADP-dependent malate dehydrogenase; DTC: dicarboxylate/tricarboxylate transporter; DIC1: dicarboxylate carrier; PIC: phosphate carrier; NAD-ME: NAD-malic enzyme; PEPCK: phosphoenolpyruvate carboxykinase; PIP: plasma membrane intrinsic protein; MPC1&2: mitochondrial pyruvate carrier; AlaAT: alanine aminotransferase; PPDK: pyruvate phosphate dikinase; BASS2: sodium-dependent pyruvate transporter; NHD1 sodium: proton antiporter and PPT: phosphate/phosphoenolpyruvate translocator.
Plants 15 01402 g006
Table 1. Agronomical parameters of rice (O. sativa L. cv. IR64) null-segregant and T1 generation of PEPCK overexpressing transgenic lines (line 2, line 7, and line 12) under 0 and 200 mM NaCl on 60 day old plant (salt treatment was given for 30 days).
AttributesControl PlantsNaCl (mM)-Grown T1 PEPCK Transgenic Plants
L2L7L12
0200020002000200
Plant height (cm)72 ± 3.0 b31 ± 2.0 c76 ± 2.6 a68 ± 2.6 b71 ± 3.0 b66 ± 3.6 b78 ± 2.0 a71 ± 3.0 b
Root length (cm)26 ± 1.0 ab12.3 ± 1.1 c28.3 ± 0.5 a23.1 ± 0.7 b23.8 ± 0.7 b23 ± 0.5 b29.6 ± 0.7 a25.1 ± 1.0 ab
Root dry weight (g)2.5 ± 0.4 b1.3 ± 0.2 c2.8 ± 0.1 a2.0 ± 0.2 b3.1 ± 0.3 a2.5 ± 0.4 b2.6 ± 0.3 b2.3 ± 0.1 b
Leaf area (cm2/plant)93 ± 3.6 ab39 ± 3.0 c93 ± 2.5 ab84 ± 3.0 b97 ± 2.0 a92 ± 2.5 ab100 ± 2.6 a87 ± 2.0 b
Total protein (mg g−1 FW)1.9 ± 0.04 a0.7 ± 0.11 c2.0 ± 0.10 a1.5 ± 0.22 b2.0 ± 0.09 a1.9 ± 0.10 ab1.9 ± 0.05 a1.6 ± 0.26 b
Nitrogen (%)0.3 ± 0.006 b0.1 ± 0.004 c0.3 ± 0.012 a0.3 ± 0.014 b0.3 ± 0.015 a0.3 ± 0.009 ab0.3 ± 0.010 a0.3 ± 0.011 b
Phosphorus (%)0.3 ± 0.008 a0.1 ± 0.008 c0.3 ± 0.009 ab0.2 ± 0.009 b0.3 ± 0.009 a0.2 ± 0.008 b0.3 ± 0.006 ab0.2 ± 0.007 b
Potassium (%)0.2 ± 0.001 a0.1 ± 0.007 c0.2 ± 0.008 a0.1 ± 0.006 b0.2 ± 0.004 a0.1 ± 0.002 b0.1 ± 0.003 b0.1 ± 0.004 b
Sodium (%)0.04 ± 0.003 b0.07 ± 0.002 a0.04 ± 0.004 b0.05 ± 0.005 b0.04 ± 0.004 b0.04 ± 0.003 b0.04 ± 0.004 b0.07 ± 0.003 a
Each value represents mean of three replicates ± SE. Means were compared using ANOVA. Different letters on the top of bars indicate significant differences at p ≤ 0.05 level, as determined by Duncan’s multiple range test (DMRT).
Table 2. Comparison of various yield parameters in rice (O. sativa L. cv. IR64) control and T1 generation of PEPCK overexpressing transgenic lines on 90 day old plant (line 2, line 7 and line 12) under 0 and 200 mM NaCl.
ParametersControl PlantsNaCl (mM)-Grown T1 PEPCK Transgenic Plants
L2L7L12
0200020002000200
Time required for flowering (days)96 ± 3.6 aND95 ± 3.6 a96 ± 3.9 a97 ± 3.0 a97 ± 3.6 b92 ± 3.6 a95 ± 2.2 a
No. of tillers/plant21 ± 1.52 bND24 ± 0.17 a18 ± 0.57 c26 ± 0.57 a20 ± 0.17 b22 ± 1.15 ab14. ± 0.57 c
No. of
panicle/plant
25 ± 1 aND23 ± 0.6 ab14 ± 0.5 c26 ± 0.6 a17 ± 1.0 b20 ± 0.5 b11 ± 0.57 c
No. of filled grain/panicle86 ± 3.4 bND89 ± 3.0 ab80 ± 3.0 c94 ± 3.0 a83 ± 3.0 b84 ± 3.6 b72 ± 3.6 c
No. of chaffy grains/panicle10.3 ± 0.57 aND5.3 ± 0.57 c10.6 ± 0.57 a7.6 ± 0.57 b8.6 ± 0.57 b4.6 ± 0.57 c11 ± 1.0 a
Straw dry weight (g)55 ± 3.0 bND59 ± 2.6 ab49 ± 2.6 c63 ± 3.0 a54 ± 2.51 b59 ± 2.5 ab48 ± 1.15 c
100 grain weight2.9 ± 0.18 aND3.0 ± 0.30 a2.8 ± 0.13 c3.2 ± 0.15 a2.6 ± 0.06 b2.5 ± 0.13 b2.2 ± 0.06 c
Control plants did not survive until harvesting under 200 mM NaCl. Each value represents mean of three replicates ± SE. Means were compared using ANOVA. Different letters on the top of bars indicate significant differences at p ≤ 0.05 level as determined by Duncan’s multiple range test (DMRT). ND: not determined as the control plants did not survive or had poor growth under salt stress conditions.
Table 3. Segregation ratio (HygR:HygS) of T1 PEPCK overexpressing transgenic rice plants (O. sativa L. cv. IR64).
WT (Control)Line 2Line 7Line 12
Segregation ratio (HygR:HygS) [n] a02.62:1 [178]2.72:1 [156]3.1:1 [184]
a Recording made from seeds.
Disclaimer/Publisher’s Note: The statements, opinions and data contained in all publications are solely those of the individual author(s) and contributor(s) and not of MDPI and/or the editor(s). MDPI and/or the editor(s) disclaim responsibility for any injury to people or property resulting from any ideas, methods, instructions or products referred to in the content.