Article

Agronomic Response of Silage Maize to Varying Irrigation Water and Nitrogen Levels Under Subsurface Drip Irrigation: Implications for Yield and Water Use Productivity

1
Department of Soil and Water Resources, Batı Akdeniz Agricultural Research Institute, 07100 Antalya, Türkiye
2
Department of Field Crops, Batı Akdeniz Agricultural Research Institute, 07100 Antalya, Türkiye
3
Department of Agricultural Structures and Irrigation, Faculty of Agriculture, Akdeniz University, 07058 Antalya, Türkiye
4
Department of Economy, Batı Akdeniz Agricultural Research Institute, 07100 Antalya, Türkiye
5
Department of Agricultural Structures and Irrigation, Faculty of Agriculture, Ondokuz Mayıs University, 55270 Samsun, Türkiye
*
Author to whom correspondence should be addressed.
Plants 2026, 15(17), 2734; https://doi.org/10.3390/plants15172734
Submission received: 10 June 2026 / Revised: 19 August 2026 / Accepted: 31 August 2026 / Published: 7 September 2026
(This article belongs to the Special Issue Irrigation Management for Sustainable Soil and Plant Health)

Abstract

Excessive or poorly timed nitrogen (N) fertilization can increase nitrate leaching and associated environmental risks. This two-year field study evaluated the combined effects of three irrigation regimes and four N rates on the biomass yield, water productivity, and economic performance of silage maize under subsurface drip irrigation (SDI). The irrigation treatments were full irrigation (I1), 50% of I1 (deficit irrigation, I2), and 120% of I1 (excess irrigation, I3); the N treatments were 0 (N0), 140 (N1), 210 (N2), and 280 kg N ha−1 (N3). The experiment was established in a randomized complete block split-plot design with three replications during the 2022 and 2023 growing seasons. Seasonal irrigation ranged from 198 to 471 mm in 2022 and from 214 to 470 mm in 2023. The N1I2 treatment consistently produced the highest green forage yield (109,520 and 112,330 kg ha−1 in 2022 and 2023, respectively) while using approximately half the irrigation water applied to I1. It also produced the highest reported water productivity and irrigation water productivity, with values of 42.4 and 55.3 kg m−3 in 2022 and 44.4 and 52.5 kg m−3 in 2023, respectively. According to the partial-budget analysis, N1I2 generated the highest net profit (USD 31,941.83 ha−1 in 2022 and USD 28,500.08 ha−1 in 2023) and relative profit ratios of 4.17 and 11.48, respectively. Under the soil, climate, and price conditions of this study, applying 140 kg N ha−1 with deficit irrigation at 50% of the full-irrigation amount provided the best balance among biomass production, irrigation water use, and economic return.

1. Introduction

Maize (Zea mays L.) is one of the world’s most important cereal crops and is cultivated across diverse agroecological zones for grain, forage, and industrial uses. Silage maize is particularly valuable as ruminant feed because of its high biomass production, fermentable carbohydrate content, and digestibility. As demand for animal-derived products increases, improving the resource efficiency of silage maize production has become an important component of sustainable agricultural intensification [1,2].
Maize production depends strongly on water and nitrogen (N), which support cell expansion, chlorophyll formation, photosynthesis, and biomass accumulation. Nitrogen deficiency restricts leaf-area development and radiation interception, whereas excessive N application can increase lodging, delay maturity, reduce N-use efficiency, and contribute to environmental losses [3,4].
Water scarcity further constrains sustainable crop production. Agriculture accounts for approximately 70% of global freshwater withdrawals, and climate change is expected to increase drought risk and atmospheric evaporative demand in many maize-growing regions. Under water-limited conditions, inadequate irrigation management can reduce yield and alter nutrient availability. Because nitrate delivery to roots is strongly influenced by transpiration-driven mass flow, soil-water availability also affects plant N uptake [5,6].
Water stress affects maize growth, development, and yield; however, the yield attainable from a given water allocation depends on more than the total seasonal irrigation amount. Irrigation timing, soil-water stored in the root zone at crop establishment, and effective rainfall during the growing season also influence crop response [7,8].
Previous studies have shown that silage maize yield is sensitive to both irrigation timing and irrigation level [9,10,11,12,13]. Water deficits during tasseling, silking, pollination, and grain filling are especially damaging because these reproductive stages coincide with high crop evapotranspiration (ETc). Yield reductions have therefore been related to decreases in ETc and transpiration, and stage-specific yield-ETc relationships have been proposed [14,15].
Subsurface drip irrigation (SDI) is a precision-irrigation technology that can improve water productivity when it is properly designed and managed. Locating laterals below the soil surface reduces direct soil evaporation, facilitates uniform water delivery within the root zone, and enables precise fertigation. Compared with less precisely managed surface or sprinkler systems, SDI can reduce non-beneficial water losses; however, excessive irrigation can still cause deep percolation and nutrient leaching.
The response of maize to irrigation and N fertilization is interactive. Adequate N promotes canopy development and biomass accumulation, whereas excessive N under wet soil conditions may increase vegetative growth without a proportional increase in harvestable biomass. The optimum N rate therefore depends on irrigation method, soil properties, climate, cultivar, and management. Most previous studies have emphasized grain maize or conventional irrigation, and fewer have evaluated silage maize under SDI.
Silage maize differs from grain maize in harvest stage, biomass partitioning, and nutrient accumulation. Because nearly all aboveground biomass is harvested, often near the milk-to-dough stage, its seasonal N demand and water-use pattern may differ from those of grain maize. Determining crop-specific N requirements under SDI is therefore necessary to avoid both insufficient and excessive fertilization.
Increasing competition for water has also led to measures such as metering agricultural withdrawals, restricting new wells in water-stressed areas, and promoting region-specific cropping patterns. Under these conditions, reliable estimates of yield response to a limited water allocation are essential for water-intensive crops such as maize [16].
Although SDI has been investigated in Türkiye, region-specific evidence on the technical and economic performance of N fertigation for silage maize remains limited. Differences in soil texture, climate, cultivar, and management prevent a single N recommendation from being applied universally. Accordingly, this study evaluated the combined effects of three irrigation levels and four N rates on green forage yield, dry matter yield, water productivity, irrigation water productivity, and economic performance of silage maize under SDI. The objective was to identify a management combination that balanced biomass production, resource-use efficiency, and economic return under Mediterranean conditions.

2. Materials and Methods

2.1. Study Area and Climate

The experiment was conducted in 2022 and 2023 at the Batı Akdeniz Agricultural Research Institute (BATEM) in Antalya, Türkiye (36°56′29″ N, 30°53′04″ E; 11 m above sea level). Long-term monthly climate data (1930–2023) and data for the two experimental growing seasons are presented in Table 1. The site has a Mediterranean climate characterized by hot, dry summers and mild, wet winters. Mean growing-season air temperature was 25.9 °C in 2022 and 26.3 °C in 2023; corresponding precipitation totals were 12.0 and 123.6 mm, and mean relative humidity values were 66.2% and 67.2%, respectively. Climate data were obtained from the meteorological station at the experimental site.

2.2. Soil and Irrigation Water Characteristics

Selected physical and chemical properties of the experimental soil are presented in Table 2. Gravimetric field capacity ranged from 23.1% to 23.5%, and the permanent wilting point ranged from 10.8% to 11.7% across the 0–120 cm soil profile.
Selected chemical properties of the irrigation water are presented in Table 3. The electrical conductivity (EC) was 0.56 dS m−1 and the sodium adsorption ratio (SAR) was 0.34. The water was classified as C2S1, indicating medium salinity and a low sodium hazard.

2.3. Agronomic Practices

The Pehlivan 07 silage maize cultivar, registered by BATEM, was used. Registration records report a plant height of 300–310 cm, a dry matter content of 31.5%, and a silage yield of 73.990 kg ha−1. Seeds were sown at a row spacing of 70 cm, an intra-row spacing of 15 cm, and a depth of 3–5 cm. Sowing was performed mechanically on 18 May 2022 and 16 May 2023.

2.4. Irrigation System and Installation

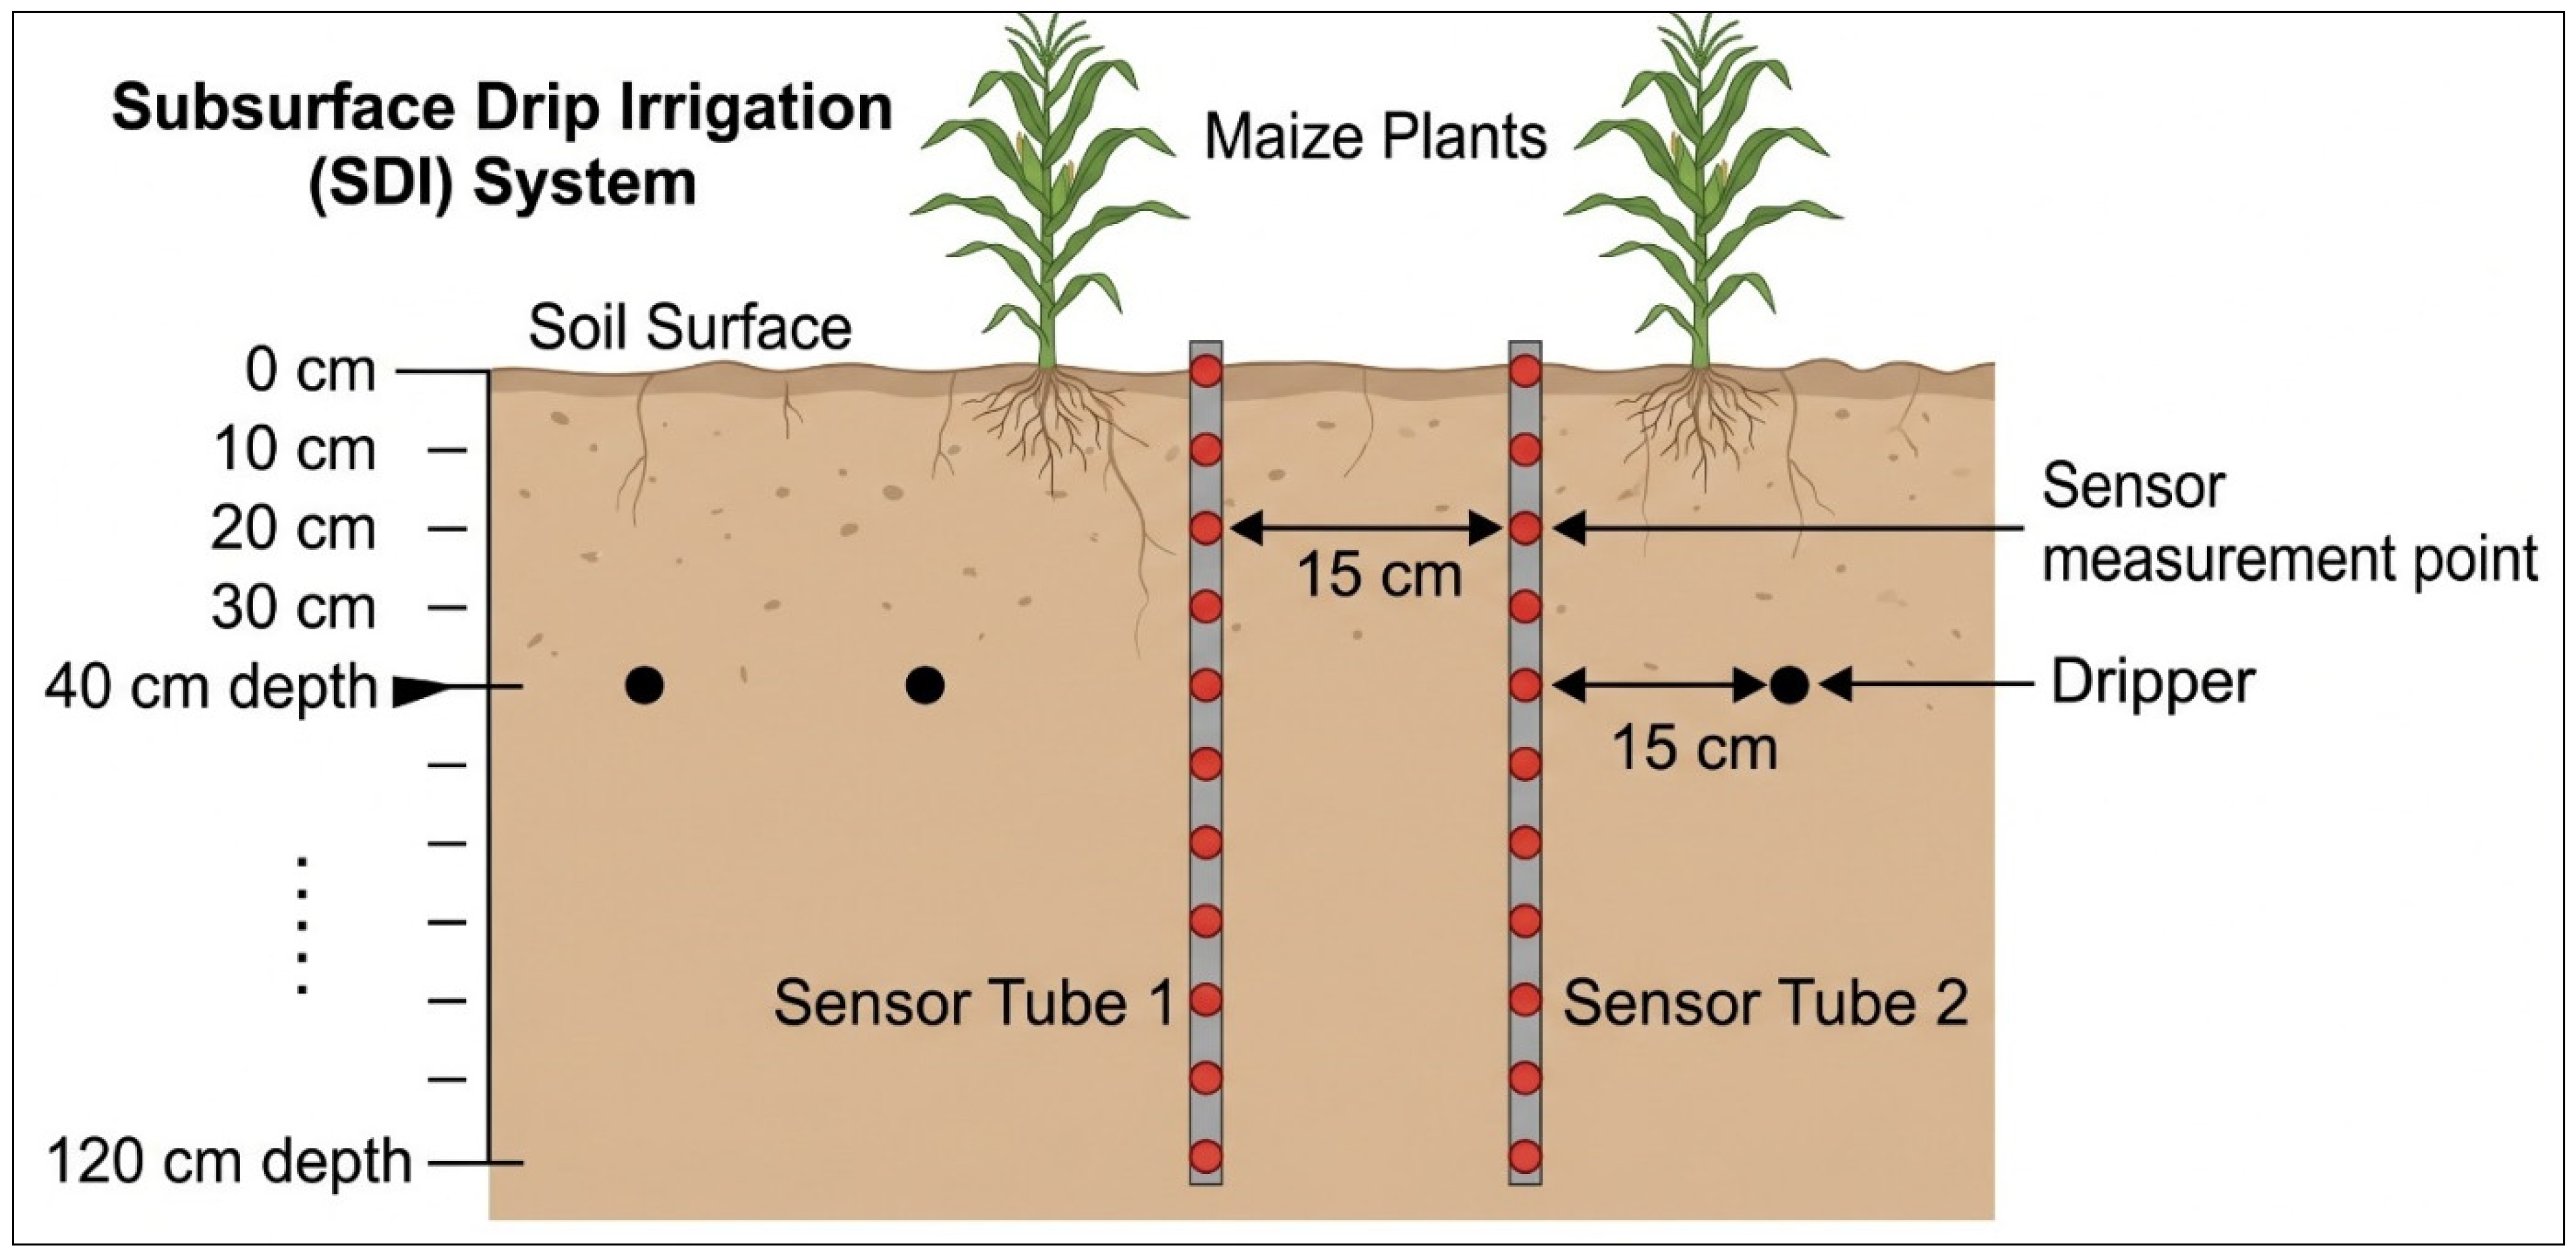
The SDI control unit consisted of sand-and-gravel and disc filters, a pressure gauge, a water meter, valves and fittings, a fertilizer tank, and a fertilizer-injection system. The polyethylene mainline, manifolds, and laterals were installed below ground. Laterals were buried 40 cm below the soil surface and spaced 70 cm apart. Emitters were spaced 30 cm apart and had a nominal discharge of 2.1 L h−1.

2.5. Experimental Design and Treatments

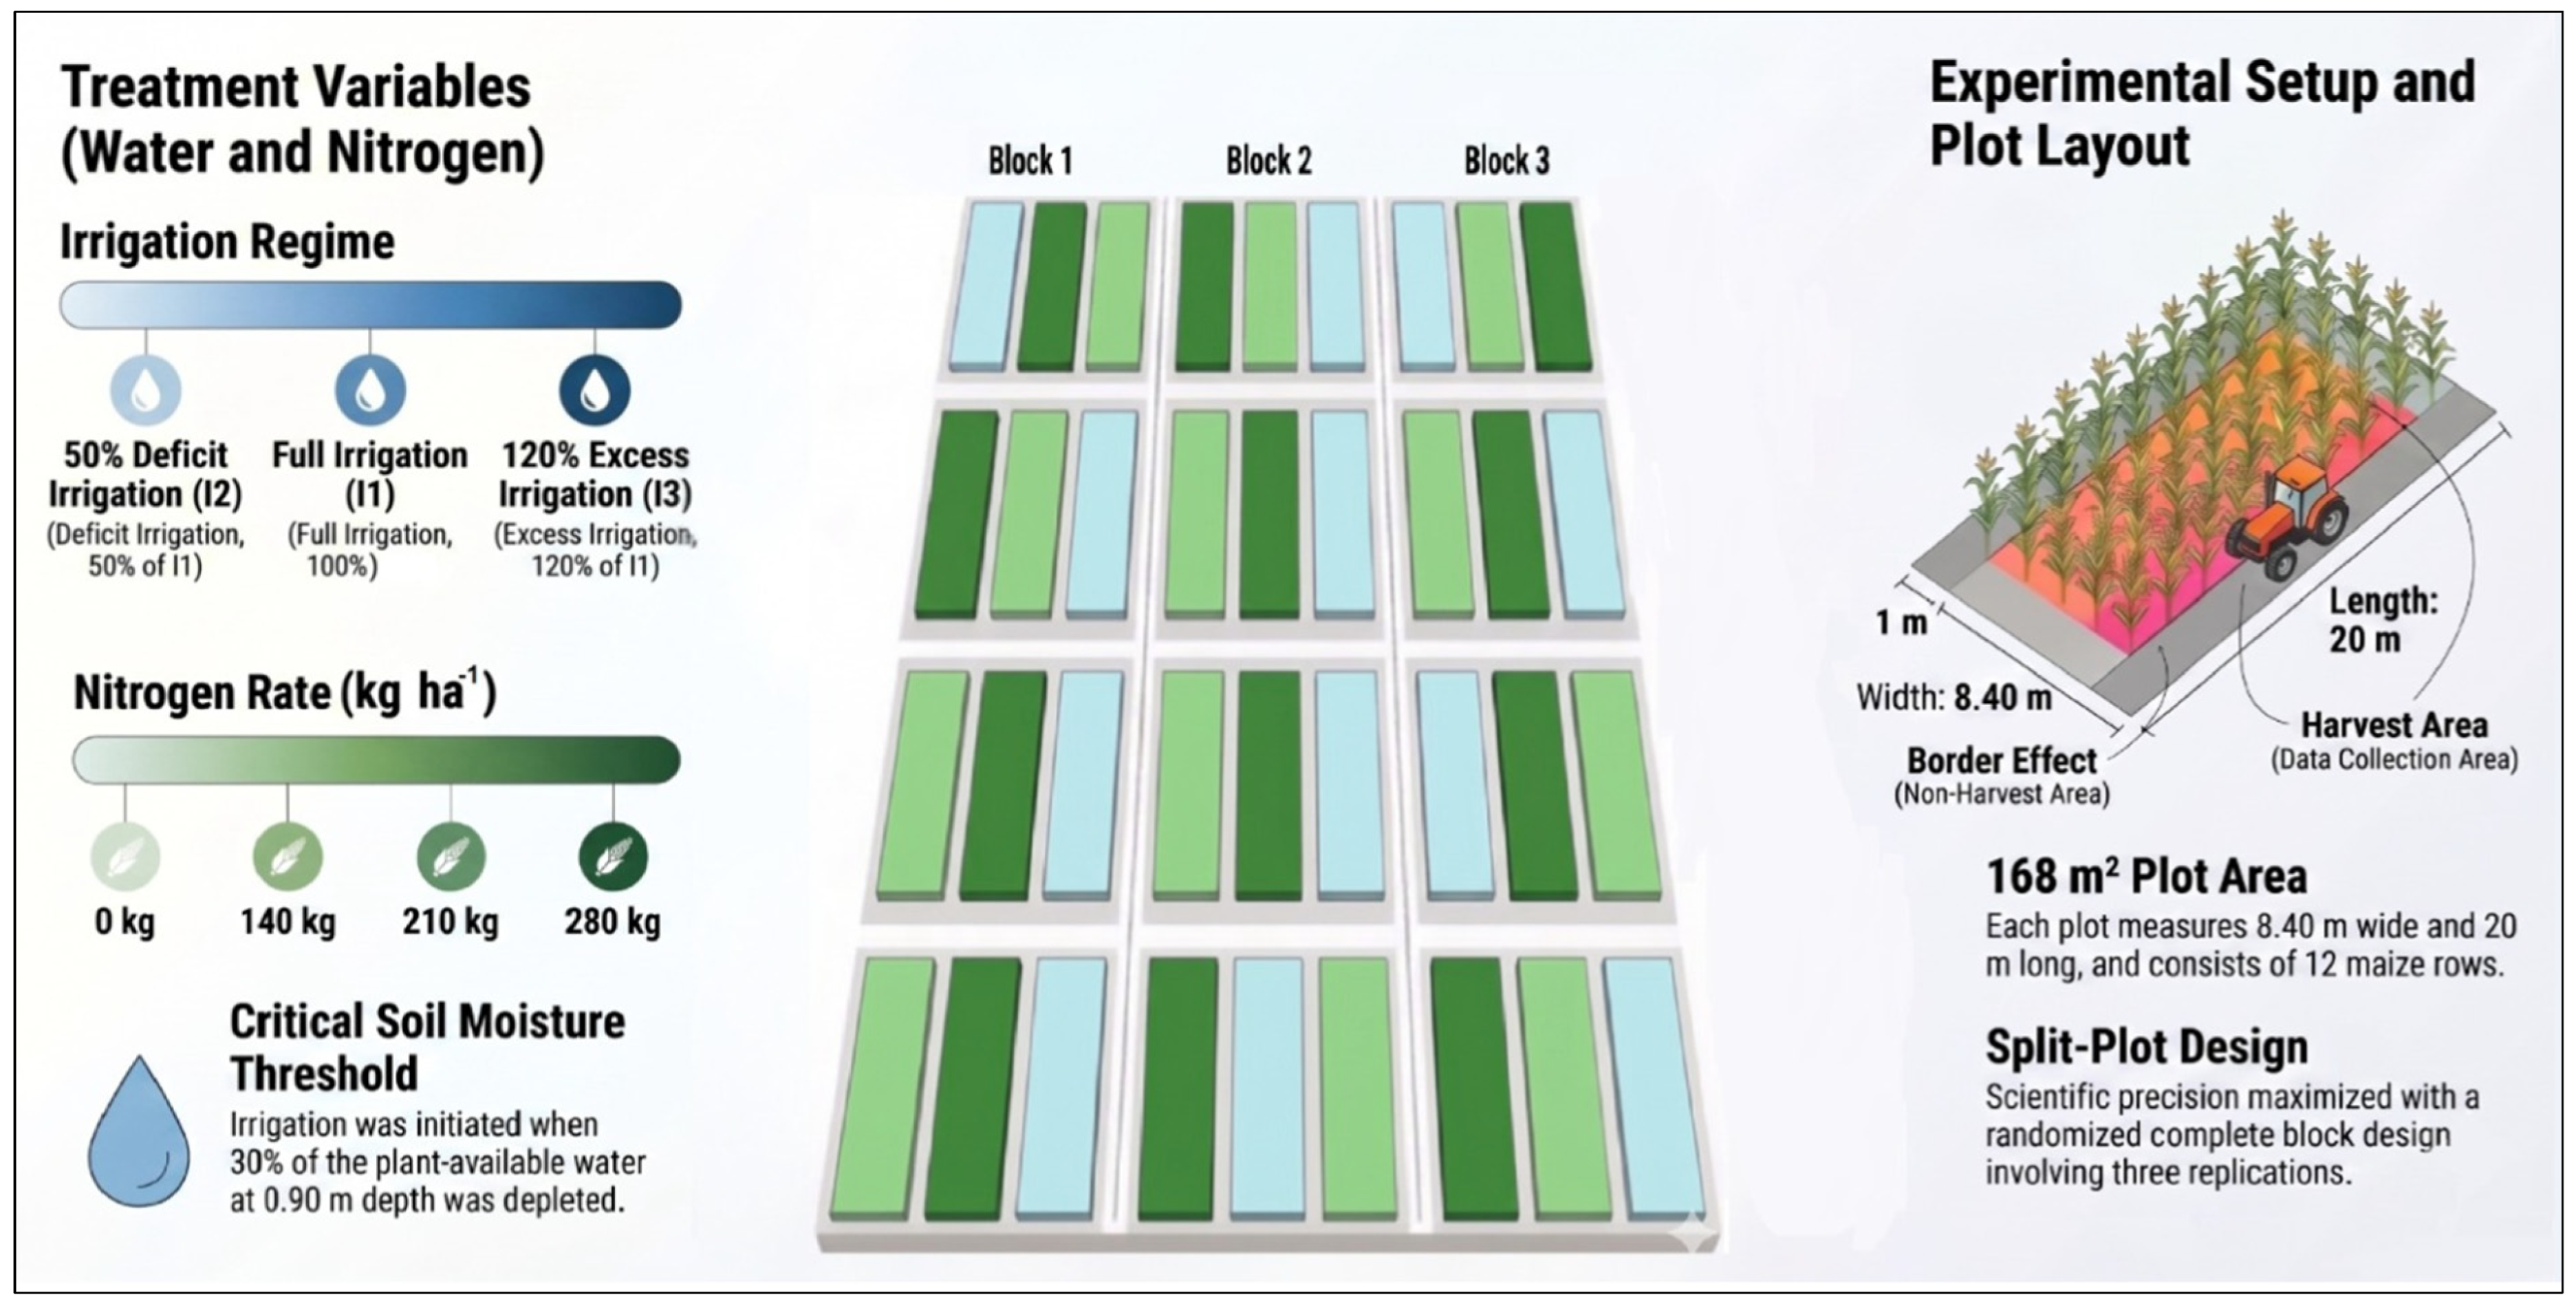
The experiment included four N rates (N0: 0; N1: 140; N2: 210; and N3: 280 kg N ha−1) and three irrigation levels. I1 was the full-irrigation treatment, I2 received 50% of the water applied to I1, and I3 received 120% of the I1 amount. Treatment irrigation began when 30% of the available soil-water in the 0–0.90 m profile of I1 had been depleted. The I1 irrigation depth was the amount required to restore the 0–0.90 m soil profile to field capacity; I2 and I3 then received 50% and 120% of that amount, respectively (Figure 1).
The two-year field experiment was arranged as a randomized complete block split-plot design with three replications. Irrigation treatments (I1, I2, and I3) were assigned to the main plots, and the four N rates (N0, N1, N2, and N3) were independently randomized to subplots within each irrigation main plot. Thus, each block contained three main plots, and each main plot was divided into four nitrogen subplots. Each subplot consisted of 12 rows, was 8.40 m wide and 20.0 m long, and covered 168 m2. A 2.0 m buffer separated adjacent plots and blocks. The harvest area excluded 1 m from each end and one border row on each side, leaving the central 10 rows for yield determination.
Soil-water content was monitored using Drill & Drop (Sentek Sensor Technologies, 77 Magil Road Stepney, Adelaide, Australia) frequency-domain reflectometry (FDR) probes together with gravimetric sampling. Access probes were installed to a depth of 120 cm, and soil-water content was recorded at 10 cm depth intervals through the profile (Figure 2).
Urea (46% N) was used as the N source. One-fifth of the total N rate was applied at sowing, two-fifths at the six- to seven-leaf stage, and the remaining two-fifths at tasseling [17]. Fertilizer was applied with the irrigation water through a pressure-differential fertilizer tank [18].

2.6. Soil-Water Balance and Crop Evapotranspiration

Because SDI wetted only part of the soil surface, canopy cover (Pc) was used to scale irrigation and evapotranspiration calculations to the cropped area. A minimum Pc of 35% was used at the beginning of treatment irrigation; thereafter, measured Pc values were used. Irrigation depths for I2 and I3 were calculated as fixed proportions of the I1 depth.
For each irrigation treatment, the net irrigation depth for I1, which restored the allowable soil-water depletion to field capacity, was calculated using Equation (1). Treatments I2 and I3 received 50% and 120% of this amount, respectively.
d n = ( F C W P ) 100 × R y × D × P c × γ t
In Equation (1), dn is the net irrigation depth (mm), FC is field-capacity water content (%), WP is permanent wilting-point water content (%), Ry is the allowable fraction of available soil-water depleted (%), D is effective root depth (mm), Pc is canopy cover (%), and γt is soil bulk density (g cm−3).
Crop evapotranspiration was calculated for the interval between successive soil-water measurements using the soil-water-balance approach (Equation (2)) [19,20,21]. The resulting ETc values were then adjusted using the measured Pc for each treatment.
E T c = I + P ± S D P R O
In Equation (2), ETc is crop evapotranspiration (mm), I is irrigation (mm), P is precipitation (mm), ΔS is the change in soil-water storage within the effective root zone (mm), DP is deep percolation (mm), and RO is surface runoff (mm). Deep percolation was estimated by monitoring soil-water changes below the 0.90 m root zone, at depths of 0.90–1.20 m.

2.7. Water Productivity and Irrigation Water Productivity

Water productivity (WP) was defined as the ratio of marketable yield to actual crop evapotranspiration (Equation (3)) [22].
W P = Y i e l d E T a
In Equation (3), WP is water productivity (kg m−3), Y is marketable yield (kg ha−1), and ETa is actual evapotranspiration (mm). Unit conversion must be applied when yield is expressed per hectare and water depth is expressed in millimeters.
Irrigation water productivity (IWP) was defined as the ratio of marketable yield to the seasonal irrigation depth (Equation (4)) [23].
IWP = Y i e l d I
In Equation (4), IWP is irrigation water productivity (kg m−3), Y is marketable yield (kg ha−1), and I is seasonal irrigation depth (mm). Unit conversion must be applied when yield is expressed per hectare and irrigation is expressed as a depth.

2.8. Canopy Cover (Pc)

Canopy cover was measured before each irrigation on the same five preselected plants. Pc was calculated by dividing the mean width of the shaded canopy, projected perpendicular to the row, by the 70 cm row spacing. A minimum Pc of 35% was used until the measured value exceeded 35%, after which the measured value was used [24,25].

2.9. Leaf Area Index

Leaf area index (LAI) was determined using Equation (5).
LAI = Total leaf area/Corresponding ground area
Three plants were sampled from each subplot. Their total leaf area was measured with a LI-COR LI-3000A (LI-COR Biosciences, 4647 Superior Street, Lincoln, NE, USA) leaf-area meter. The corresponding ground area was calculated from the fixed row spacing (0.70 m) and intra-row plant spacing (0.15 m), giving 0.105 m2 plant−1 and 0.315 m2 for the three sampled plants. LAI was calculated as total leaf area (m2) divided by the corresponding ground area (m2); therefore, LAI is dimensionless (m2 m−2). This calculation follows the plant-spacing approach described by Köksal et al. [26].

2.10. Green Forage Yield

All plants within the designated harvest area were cut and weighed. Plot-level fresh biomass was converted to green forage yield on a hectare basis (kg ha−1).

2.11. Dry Matter Yield

Three plants were selected randomly from each subplot and weighed fresh. Samples were oven-dried at 70 °C for 48 h and weighed again. Dry matter concentration was calculated as dry mass divided by fresh mass, and dry matter yield was obtained by multiplying this concentration by green forage yield.

2.12. Statistical Analysis

Data collected during the 2022 and 2023 growing seasons were subjected to a combined analysis of variance (ANOVA). The experiment was conducted as a randomized complete block split-plot design with three replications in each year. Irrigation level (IL), consisting of three levels (I1, I2, and I3), was assigned to the main plots, while nitrogen dose (ND), consisting of four levels (N0, N1, N2, and N3), was randomized to the subplots within each irrigation main plot. Thus, each block contained three irrigation main plots, each of which was divided into four nitrogen subplots. The combined analysis across years was performed according to the following statistical model:
Y i j k l = μ + Y i + B j ( i ) + N k + ( Y × N ) i k + e i j k ( a ) + I l + ( Y × I ) i l + ( N × I ) k l + ( Y × N × I ) i k l + e i j k l ( b )
where Y i j k l represents the observed response; μ is the overall mean; Y i is the effect of the i th year; B j ( i ) is the effect of the j th block nested within the i th year; N k is the effect of the k th nitrogen dose; I l is the effect of the l th irrigation level; and Y × N , Y × I , N × I , and Y × N × I represent the corresponding two- and three-way interactions. The term e i j k ( a ) represents the main-plot error associated with the randomization of irrigation treatments within blocks, whereas e i j k l ( b ) represents the subplot residual error associated with nitrogen treatments. The combined analysis across years was performed using a split-plot ANOVA model with year and block-within-year effects. Irrigation and its interaction with year were evaluated against the appropriate main-plot error, whereas nitrogen and interactions involving nitrogen were evaluated against the subplot residual error. Because irrigation had three levels, its treatment effect has 2 degrees of freedom. Nitrogen had four levels and therefore 3 degrees of freedom; the irrigation × nitrogen interaction had 6 degrees of freedom. Statistical significance was assessed at p < 0.05. The complete ANOVA results for green forage yield, dry matter yield, water productivity, and irrigation water productivity are provided in Supplementary Table S1.

2.13. Economic Analysis

A partial-budget approach was used to compare the additional benefits and costs associated with the irrigation and N treatments [27]. Gross production value, variable cost, total production cost, gross profit, net profit, production cost per kilogram, and relative profit were calculated for each treatment and year. The selling prices used in the analysis were USD 0.36 kg−1 in 2022 and USD 0.28 kg−1 in 2023. The variable and total production costs were retained as the basis of the economic comparison, and the treatment-related irrigation and N costs were included in the variable-cost calculations. All monetary calculations were first performed in Turkish Lira for each year and then converted to USD using the corresponding annual exchange rate (TRY 16.59 USD−1 in 2022 and TRY 24.11 USD−1 in 2023). Thus, exchange-rate differences between years were not pooled into a single conversion rate.

3. Results and Discussion

3.1. Irrigation and Crop Evapotranspiration

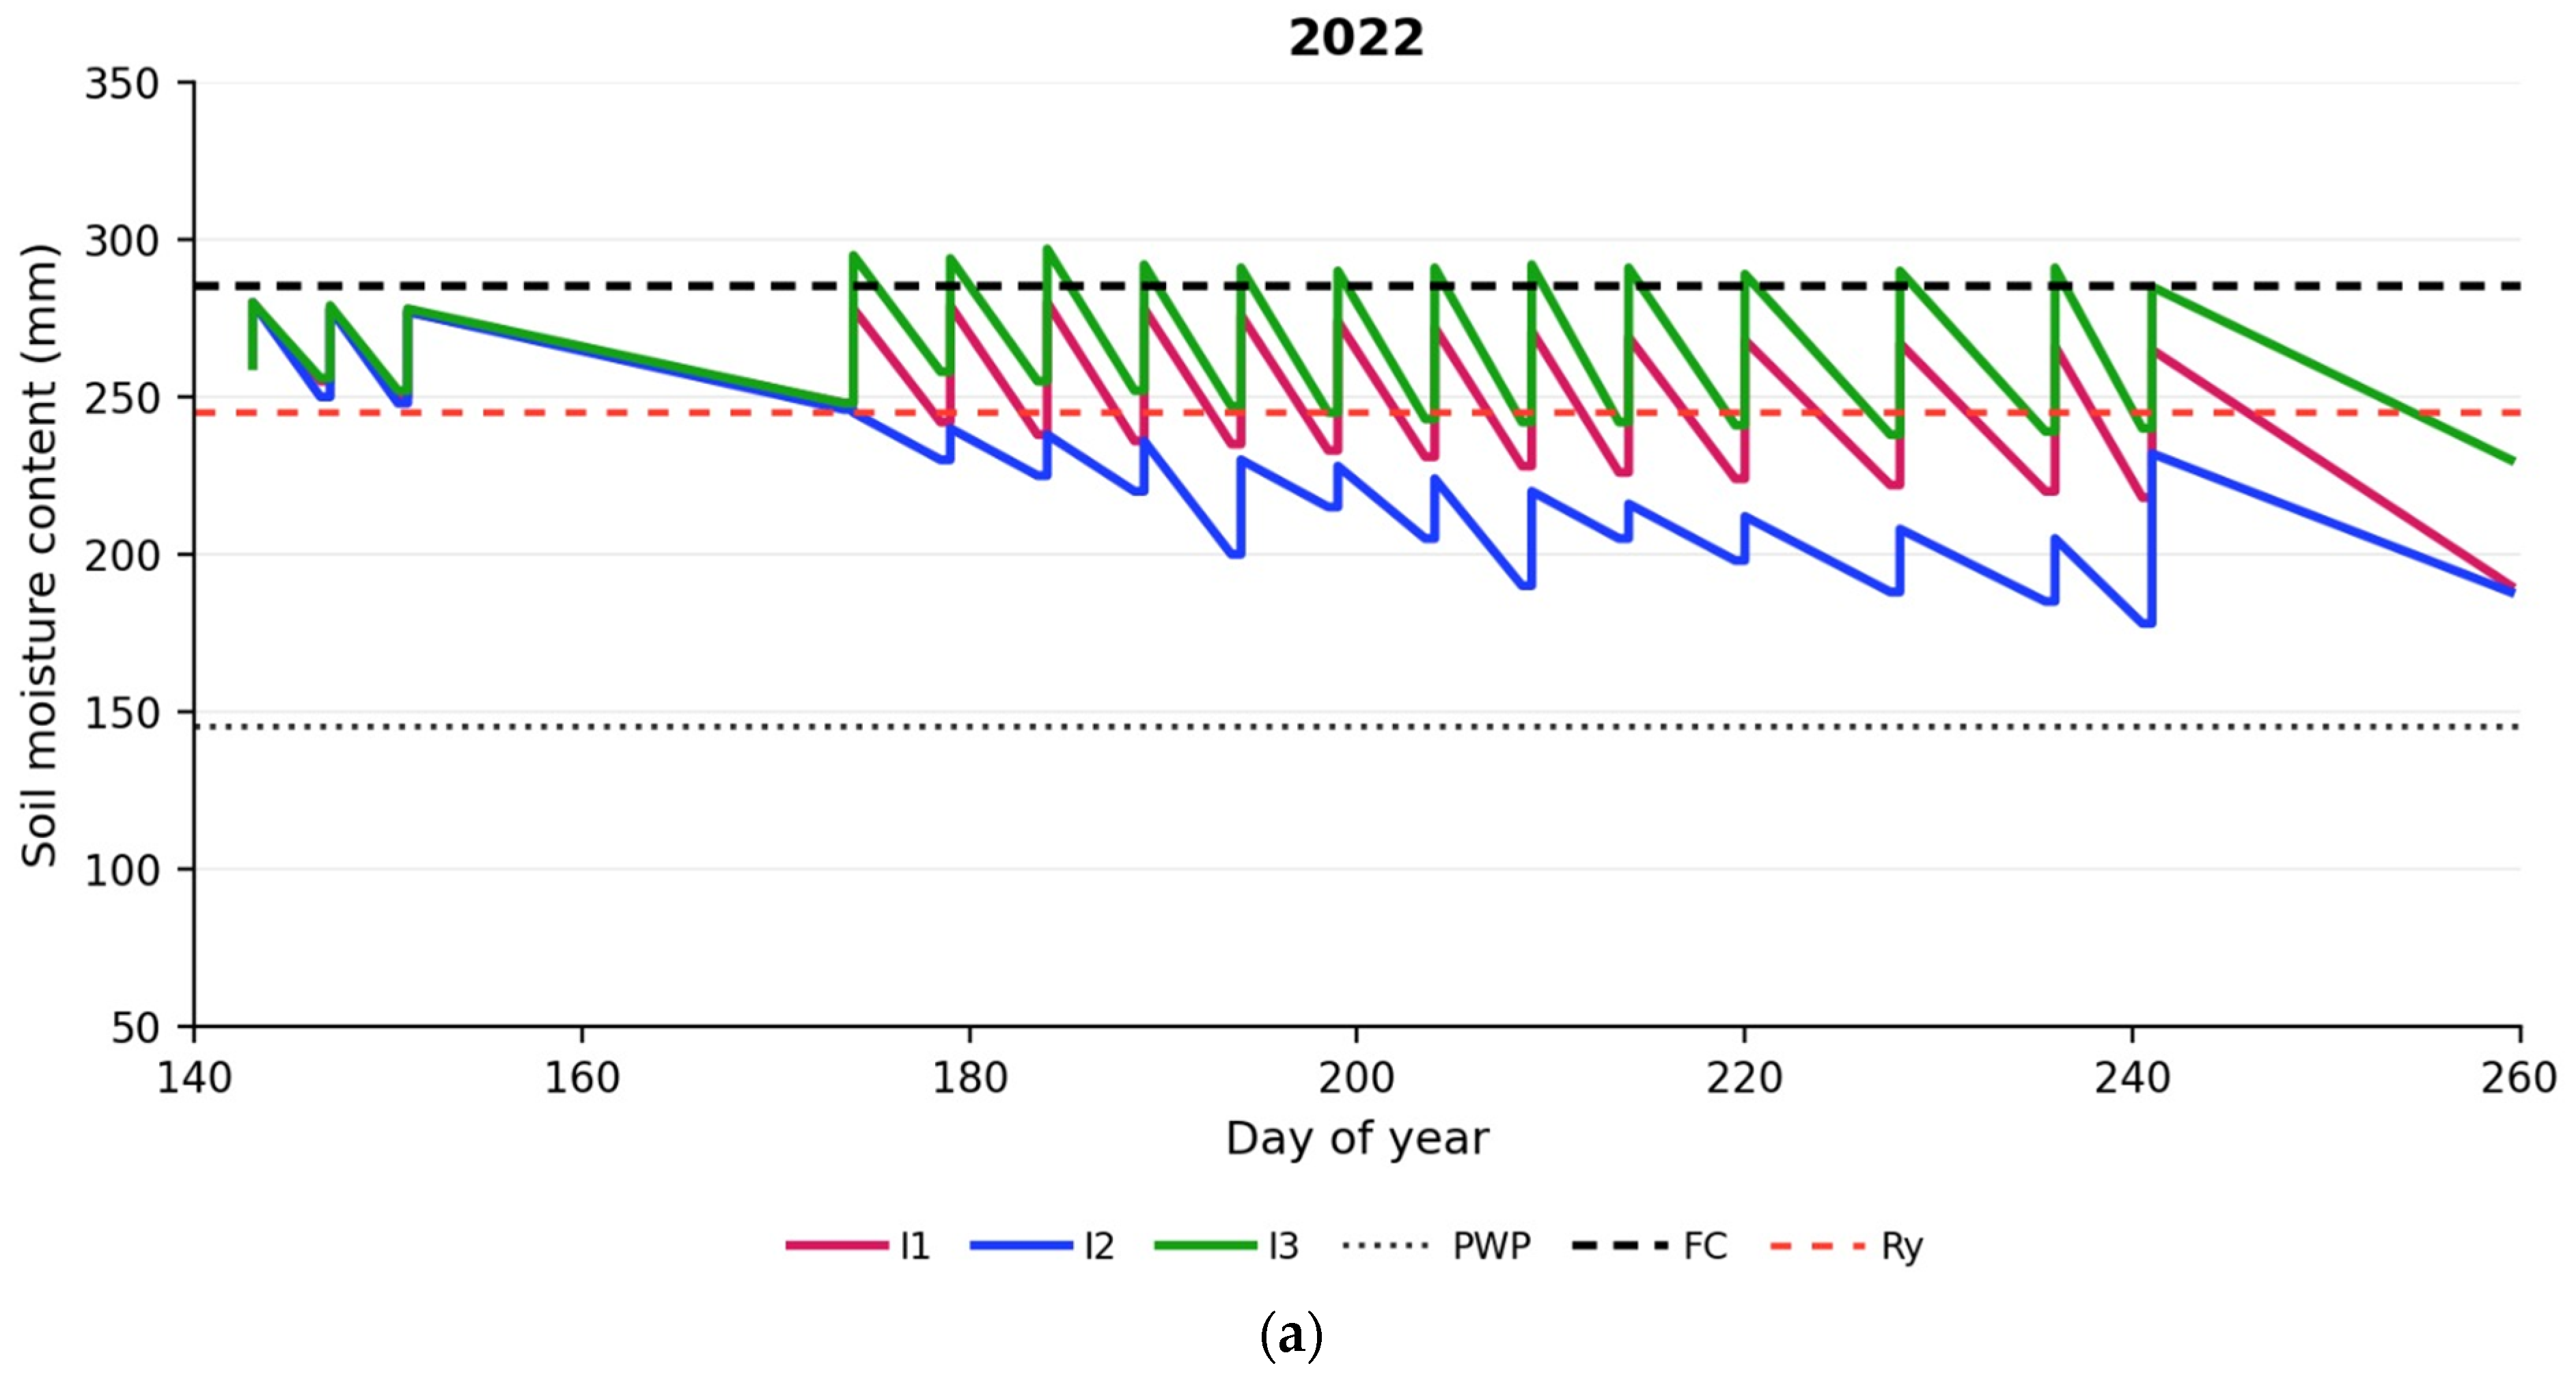
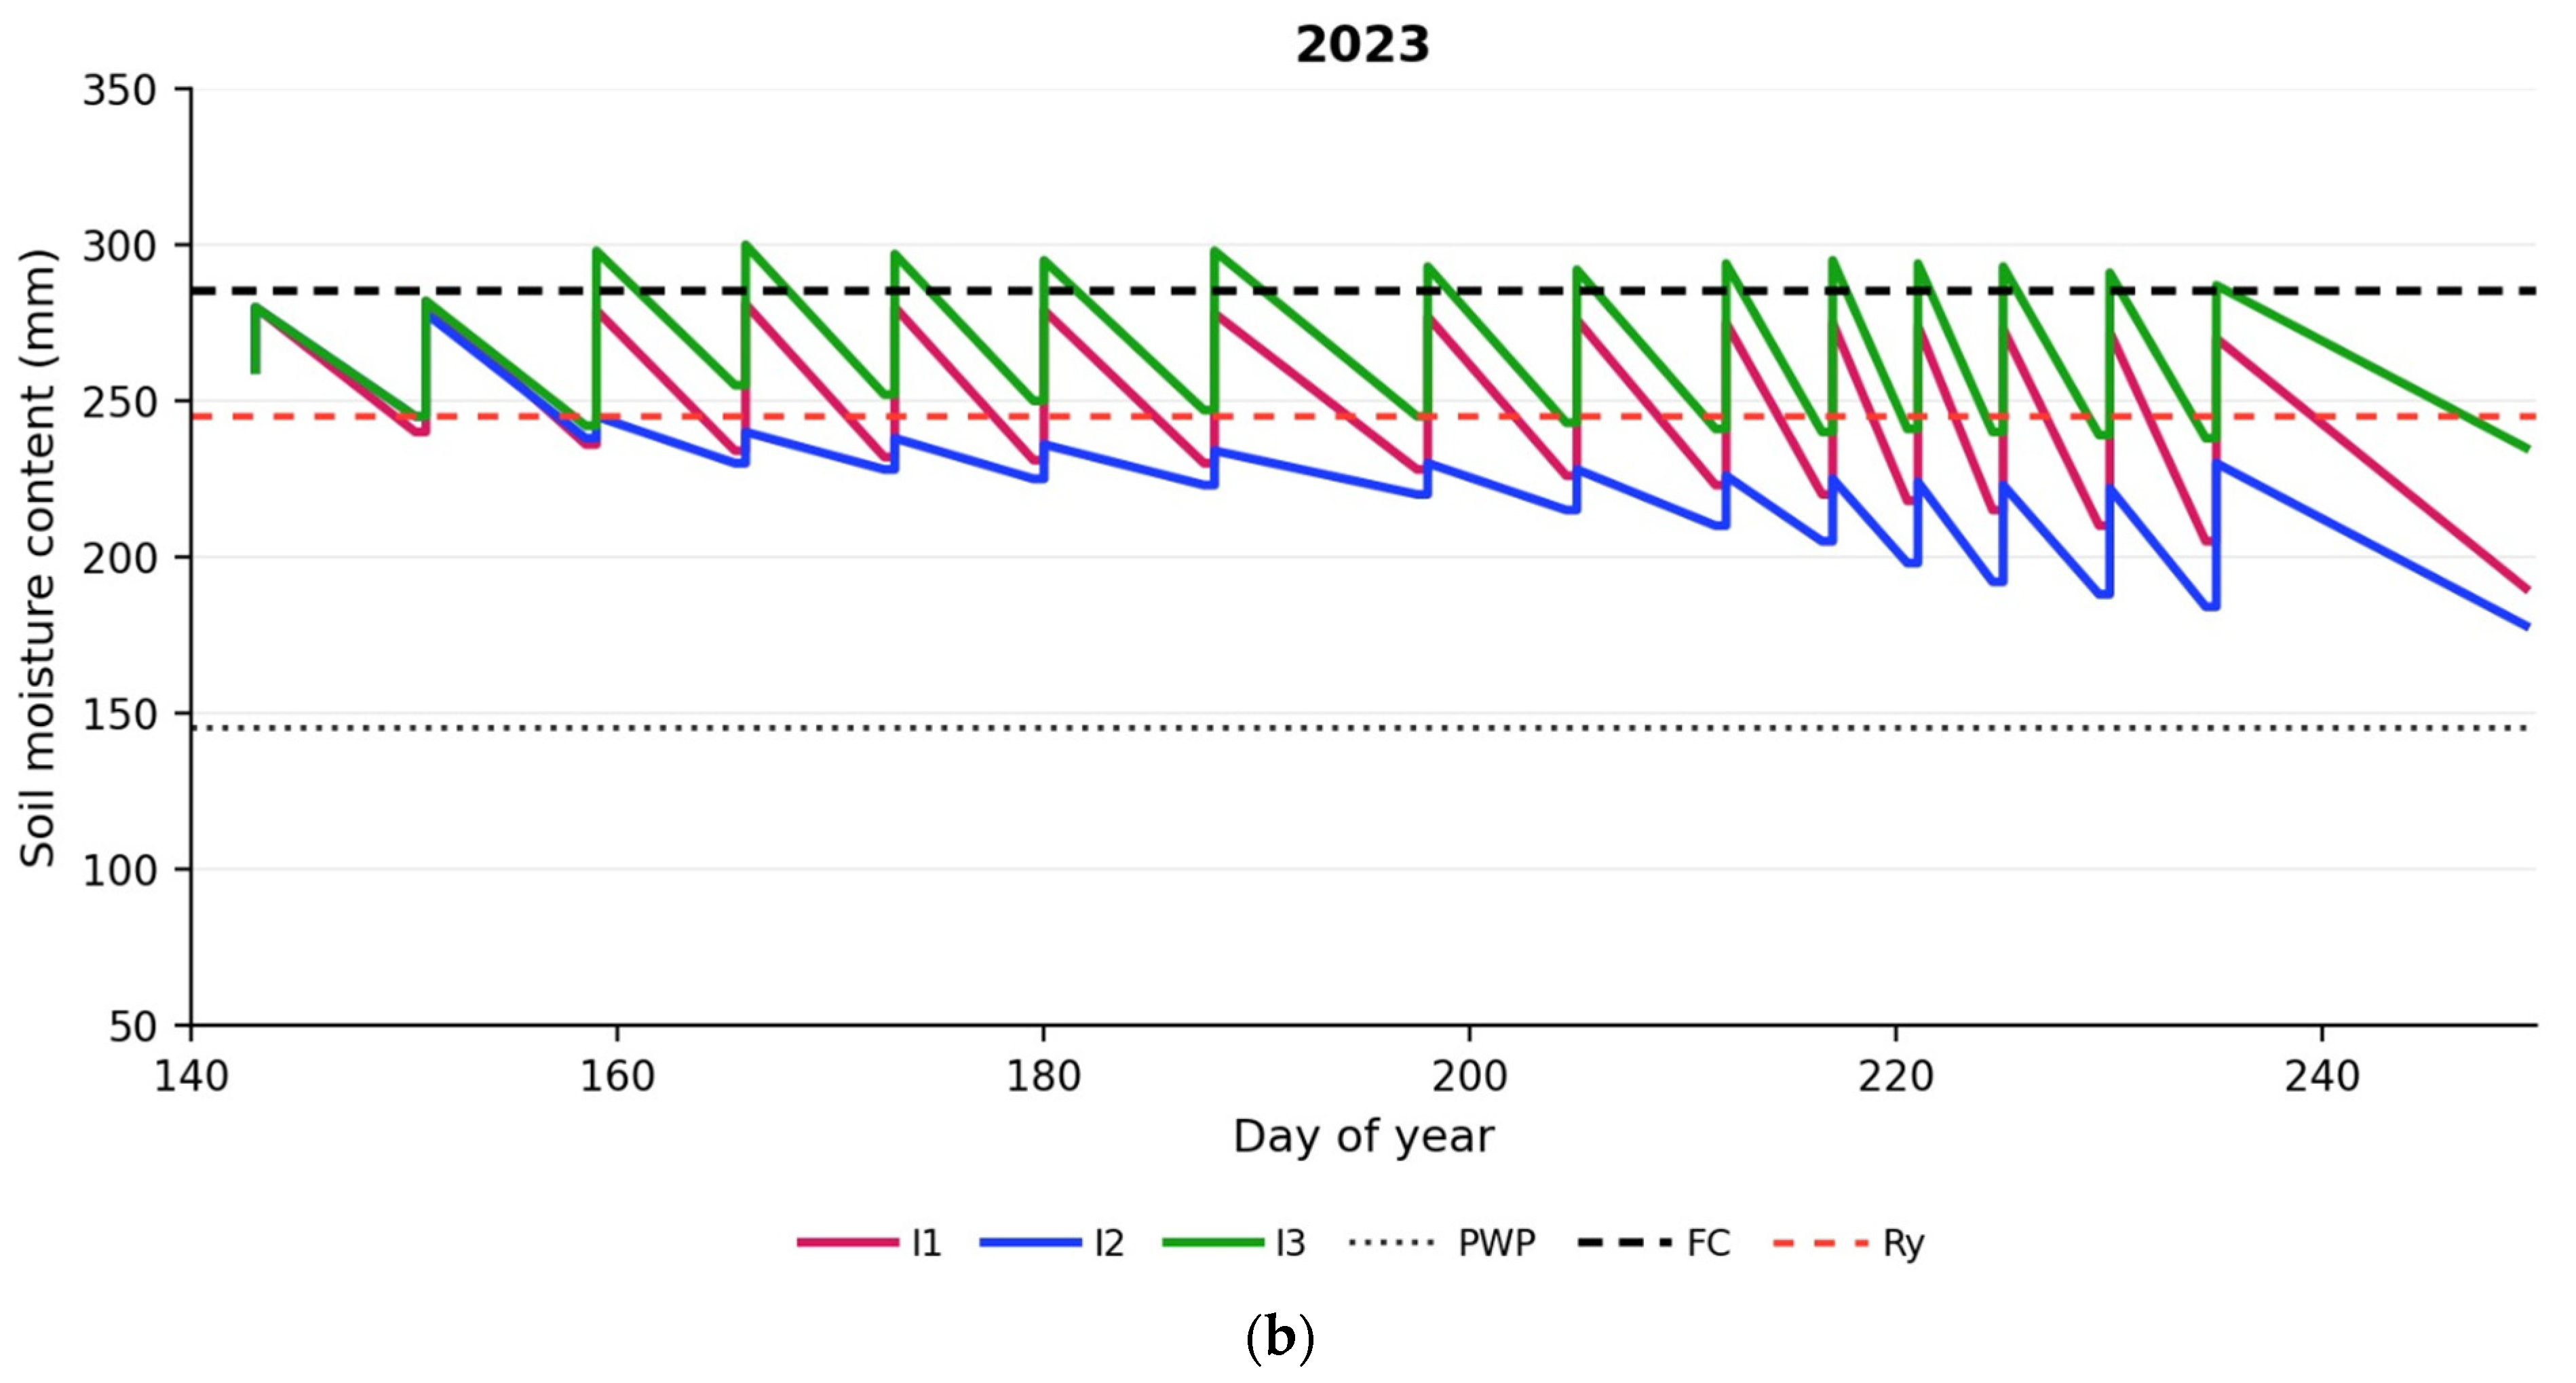
All plots were irrigated uniformly until the five-leaf stage. Treatment irrigation was applied from 23 June to 29 August 2022 (13 irrigation events) and from 19 June to 29 August 2023 (12 events). Monthly and seasonal water-balance components are presented in Table 4, and temporal changes in root-zone soil-water are shown in Figure 3 for 2022 and 2023.

3.2. Canopy Cover

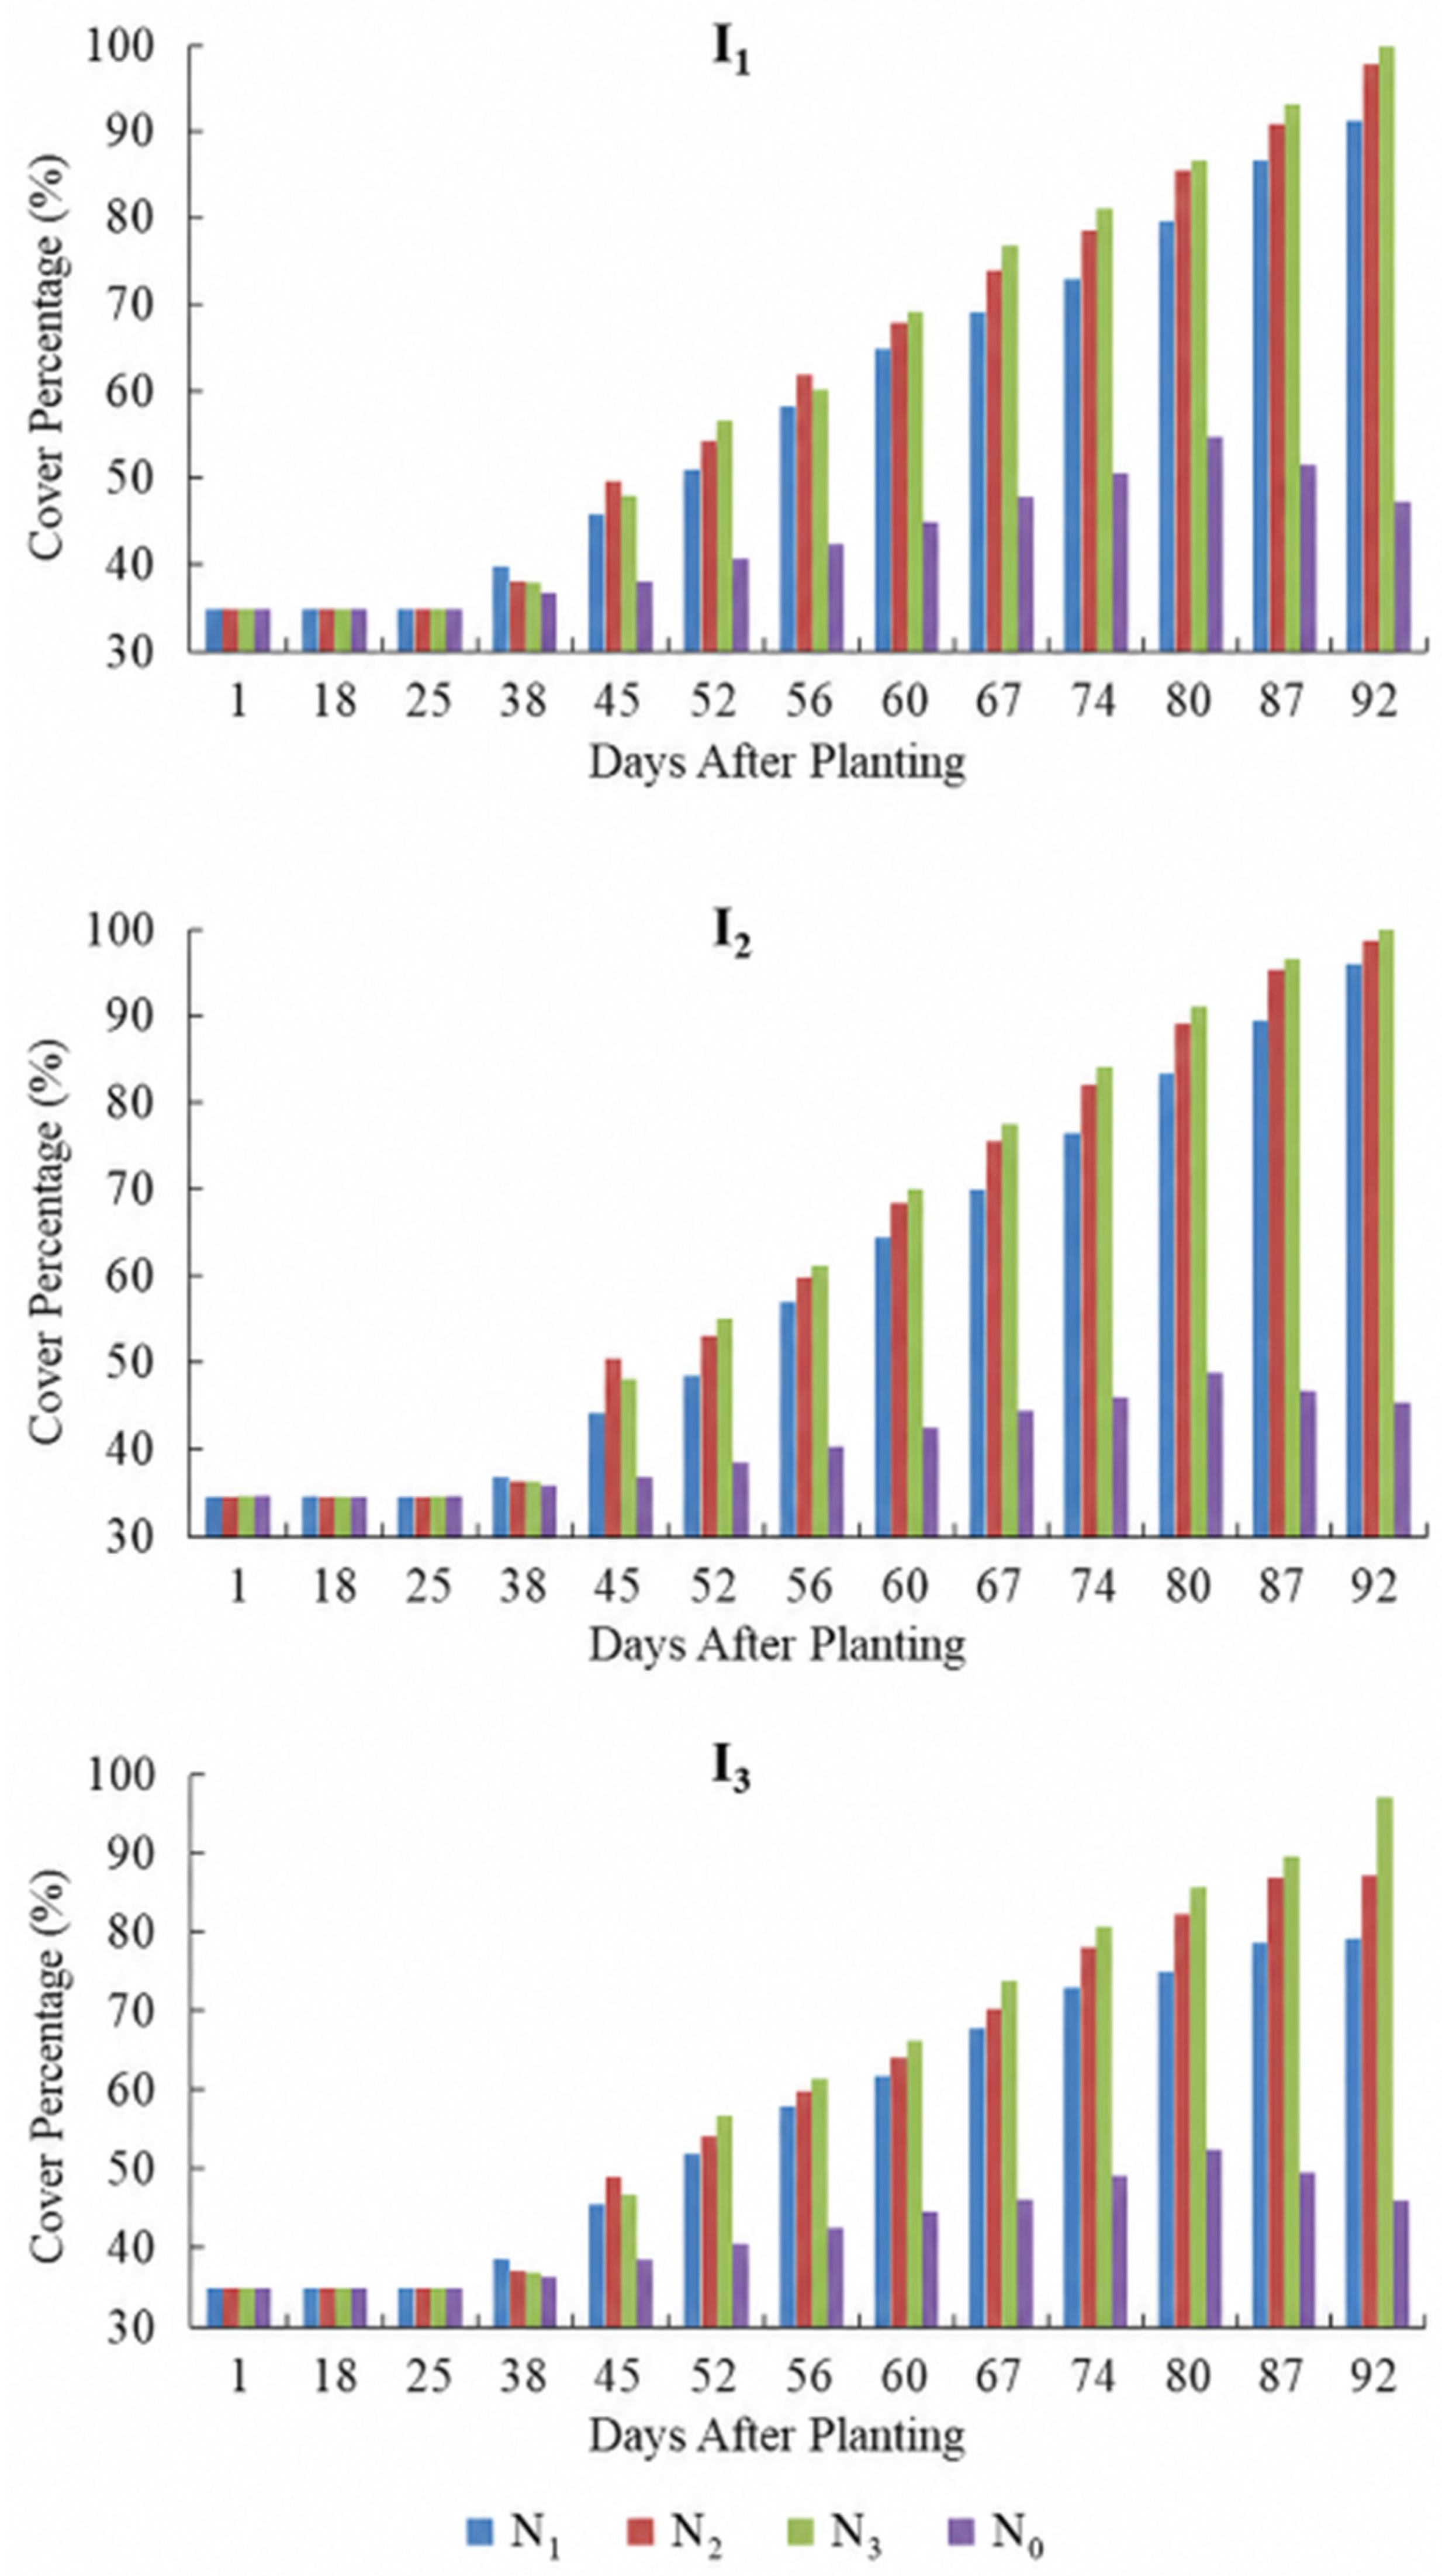
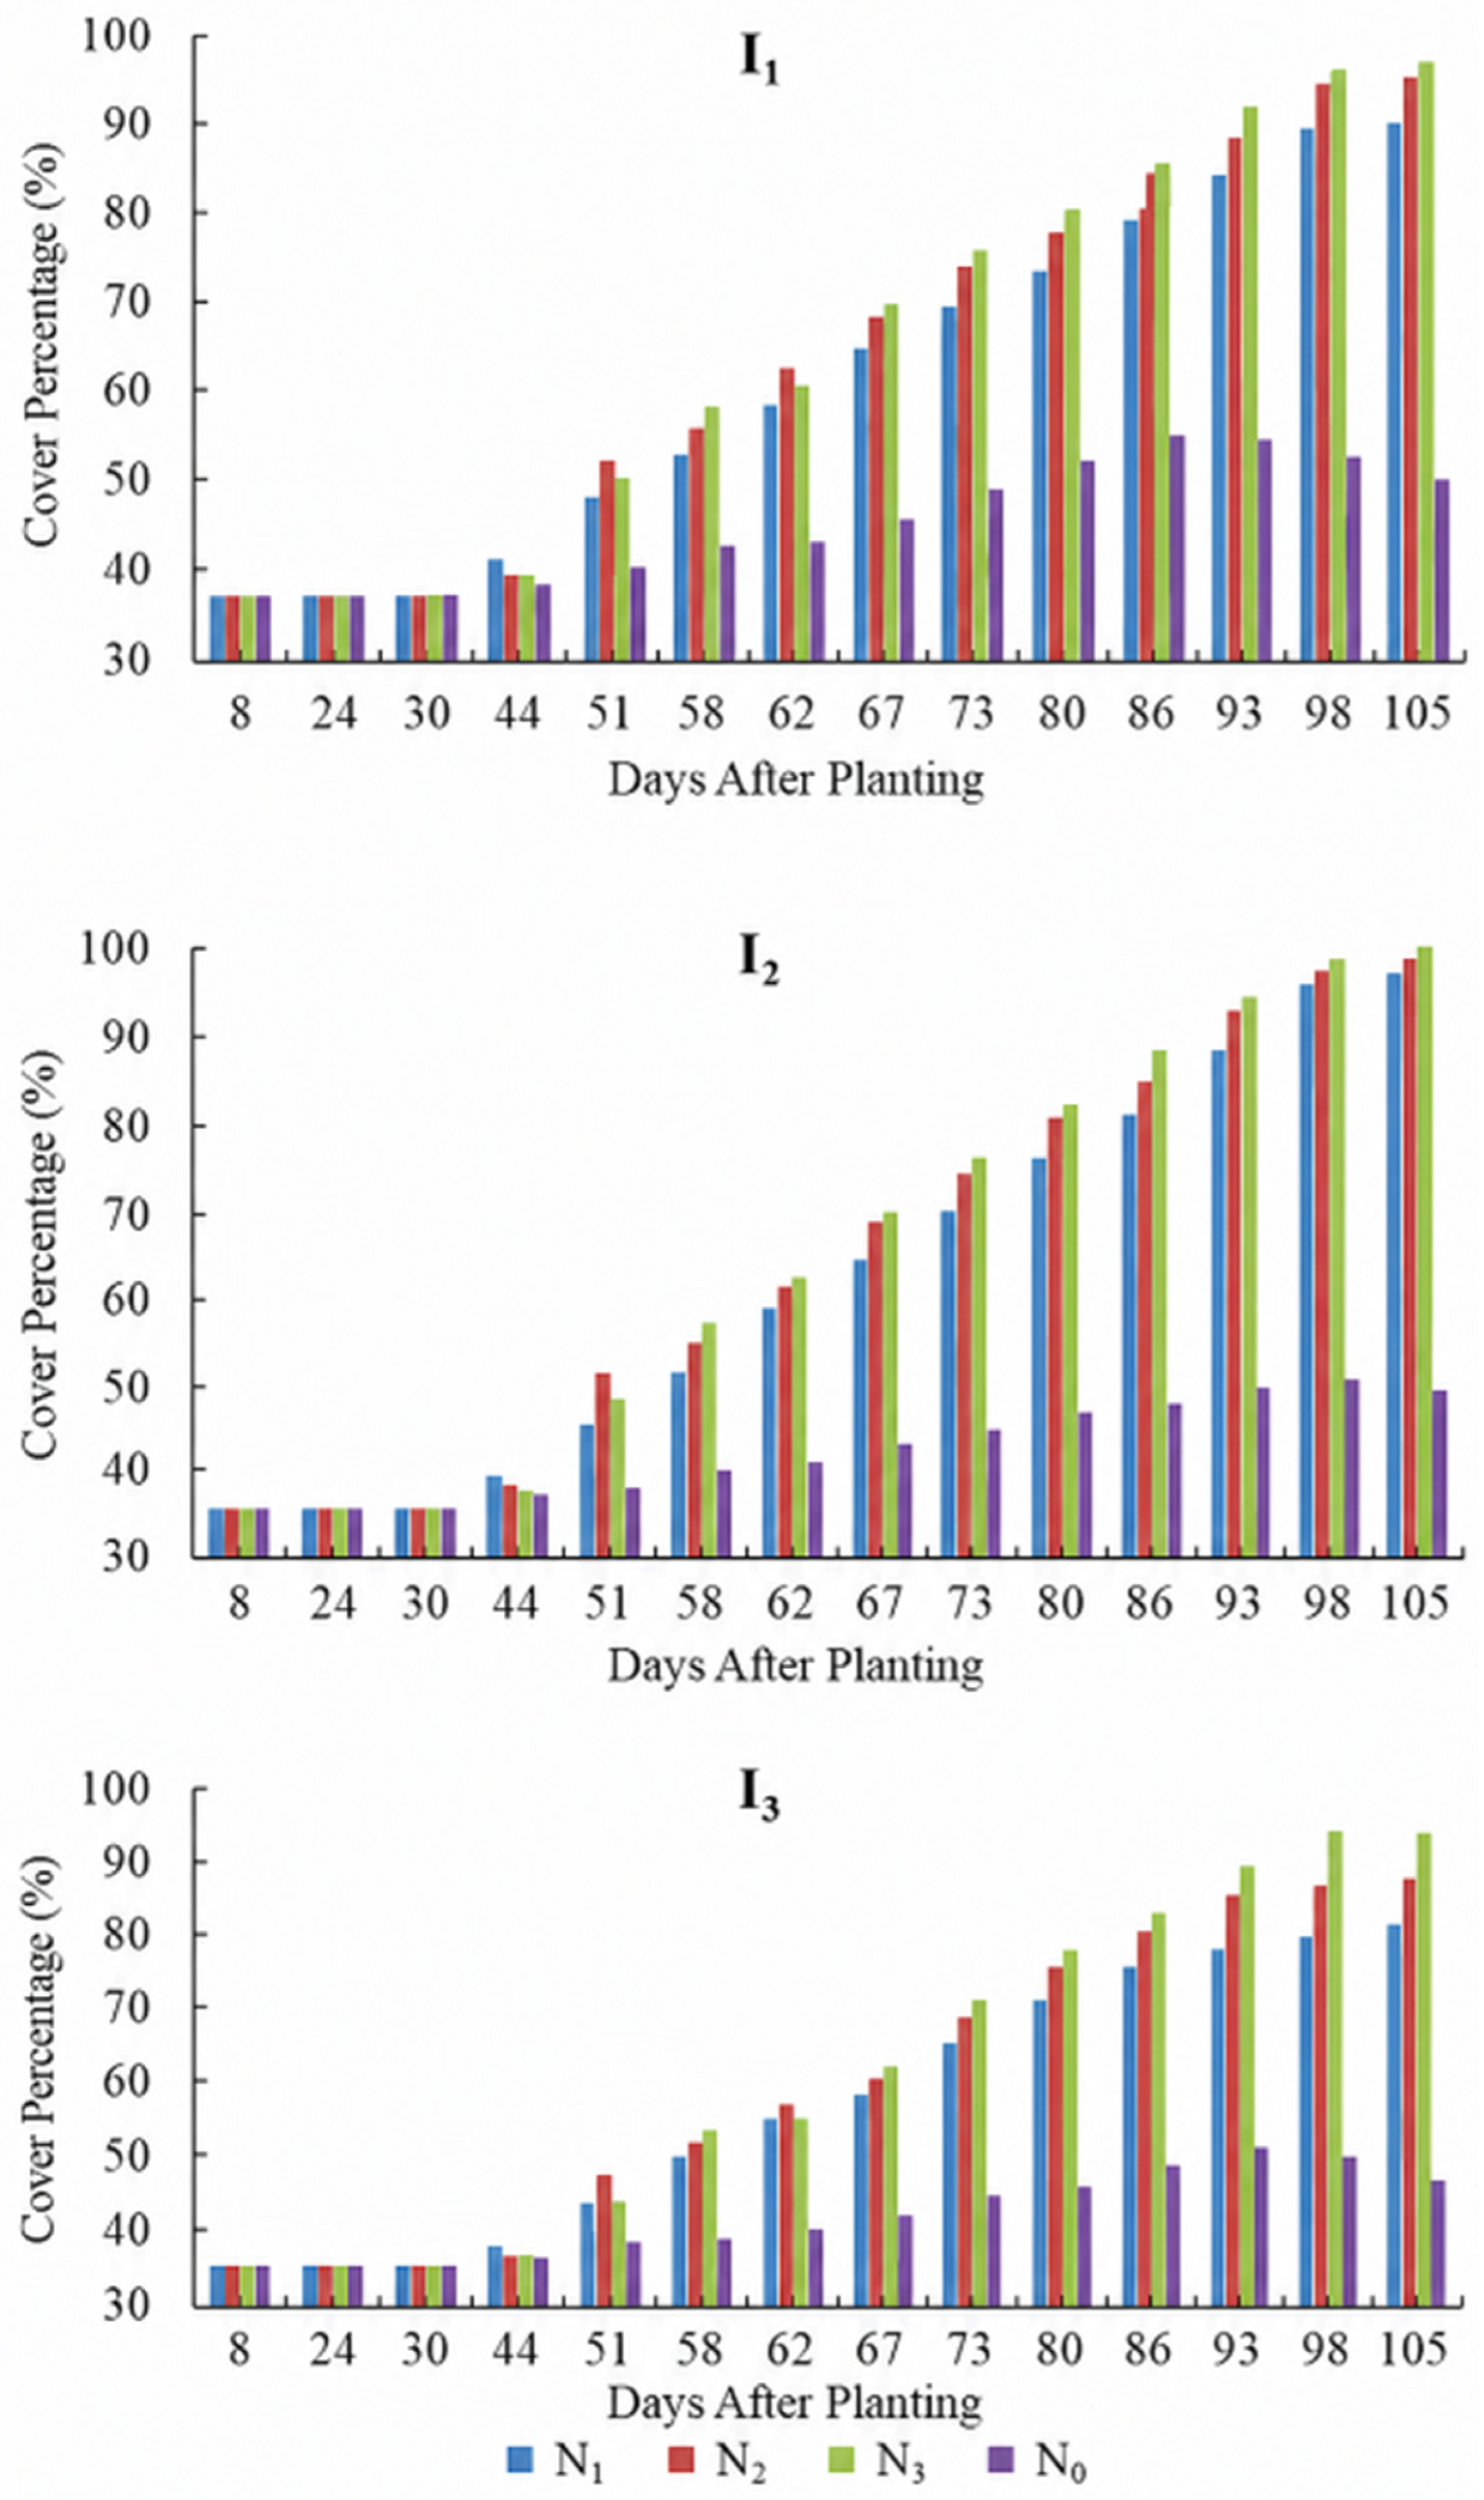
Canopy cover was set to 35% for irrigation calculations until measured Pc exceeded 35%; measured values were then used [24]. Pc was determined before each irrigation from the same five plants in each treatment. The seasonal patterns are shown in Figure 4 and Figure 5. Canopy development was slower in 2022 than in 2023, which may reflect the lower air and soil temperatures during May and June 2022. As canopy cover increases, a larger proportion of evapotranspiration is attributable to transpiration and a smaller proportion to direct soil evaporation. This shift influences both irrigation calculations and water productivity [28].
Ramachandiran and Pazhanivelan [29] reported canopy cover values of approximately 90% for maize under favorable growing conditions and observed a positive relationship between evapotranspiration and canopy development.
Greater canopy development generally increases crop water use by increasing transpiring leaf area [30,31]. It can also contribute to biomass production through greater light interception. These relationships should nevertheless be interpreted together with soil-water availability and plant N status.

3.3. Leaf Area Index

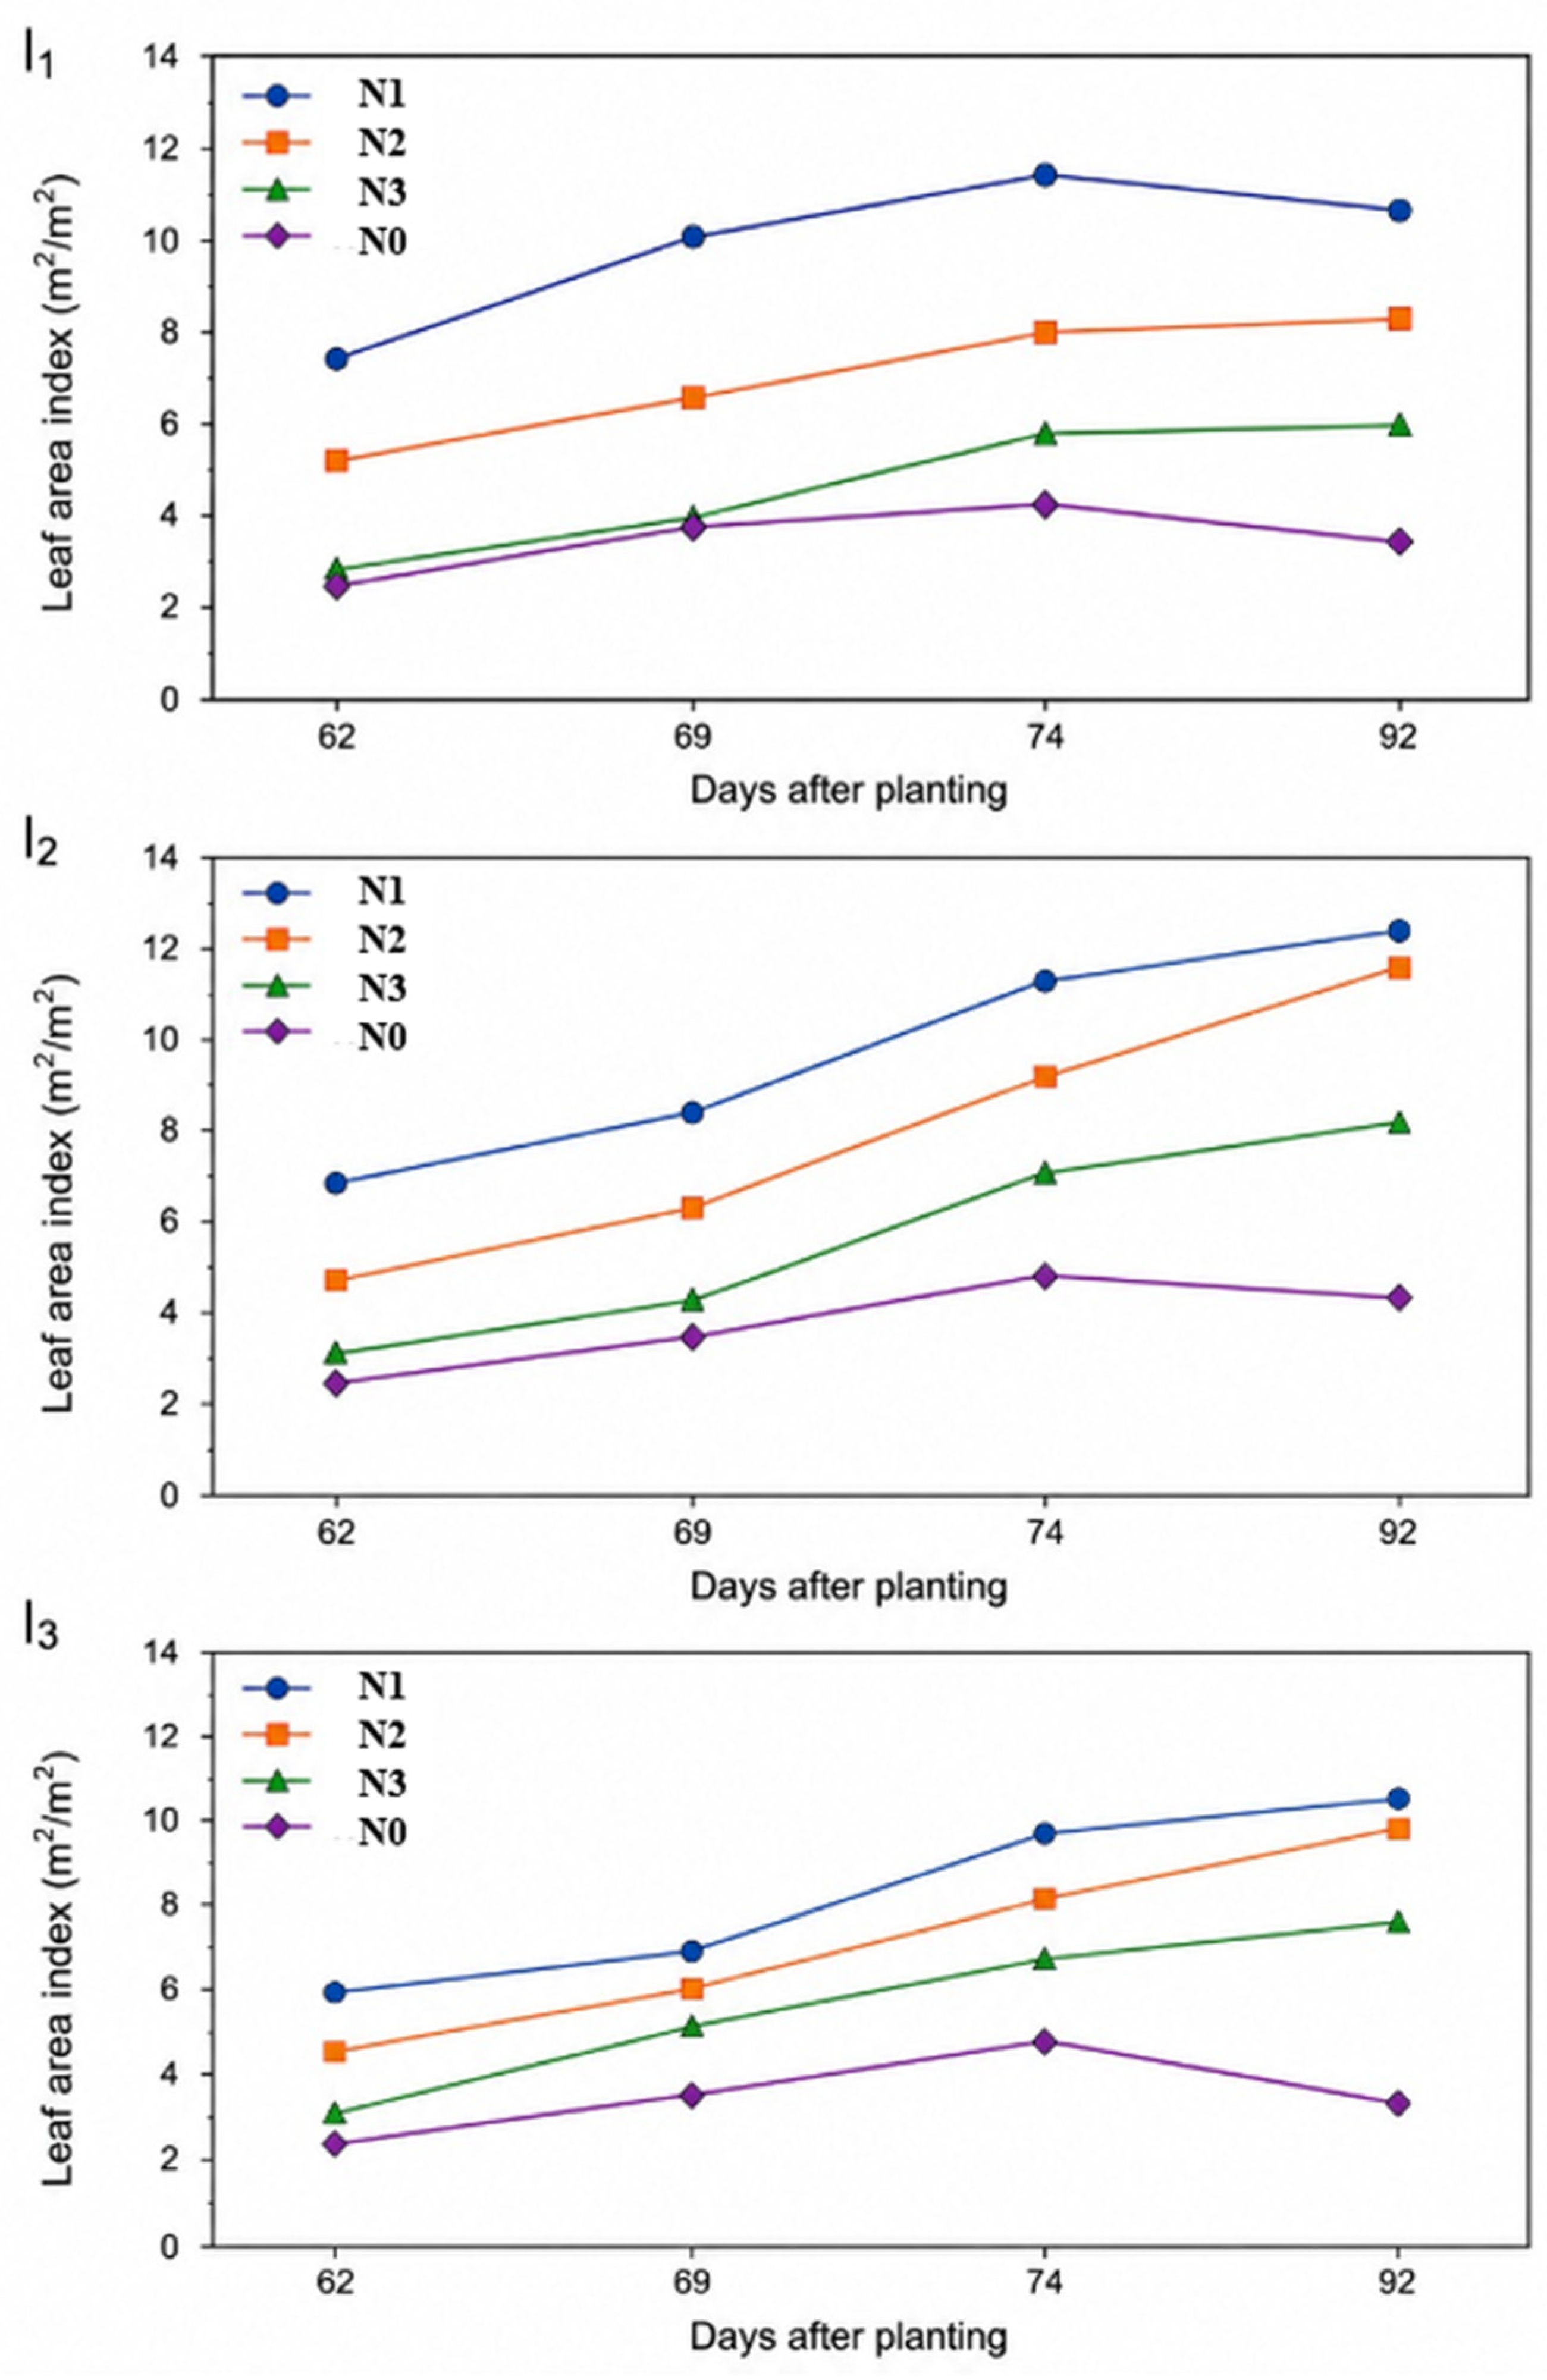
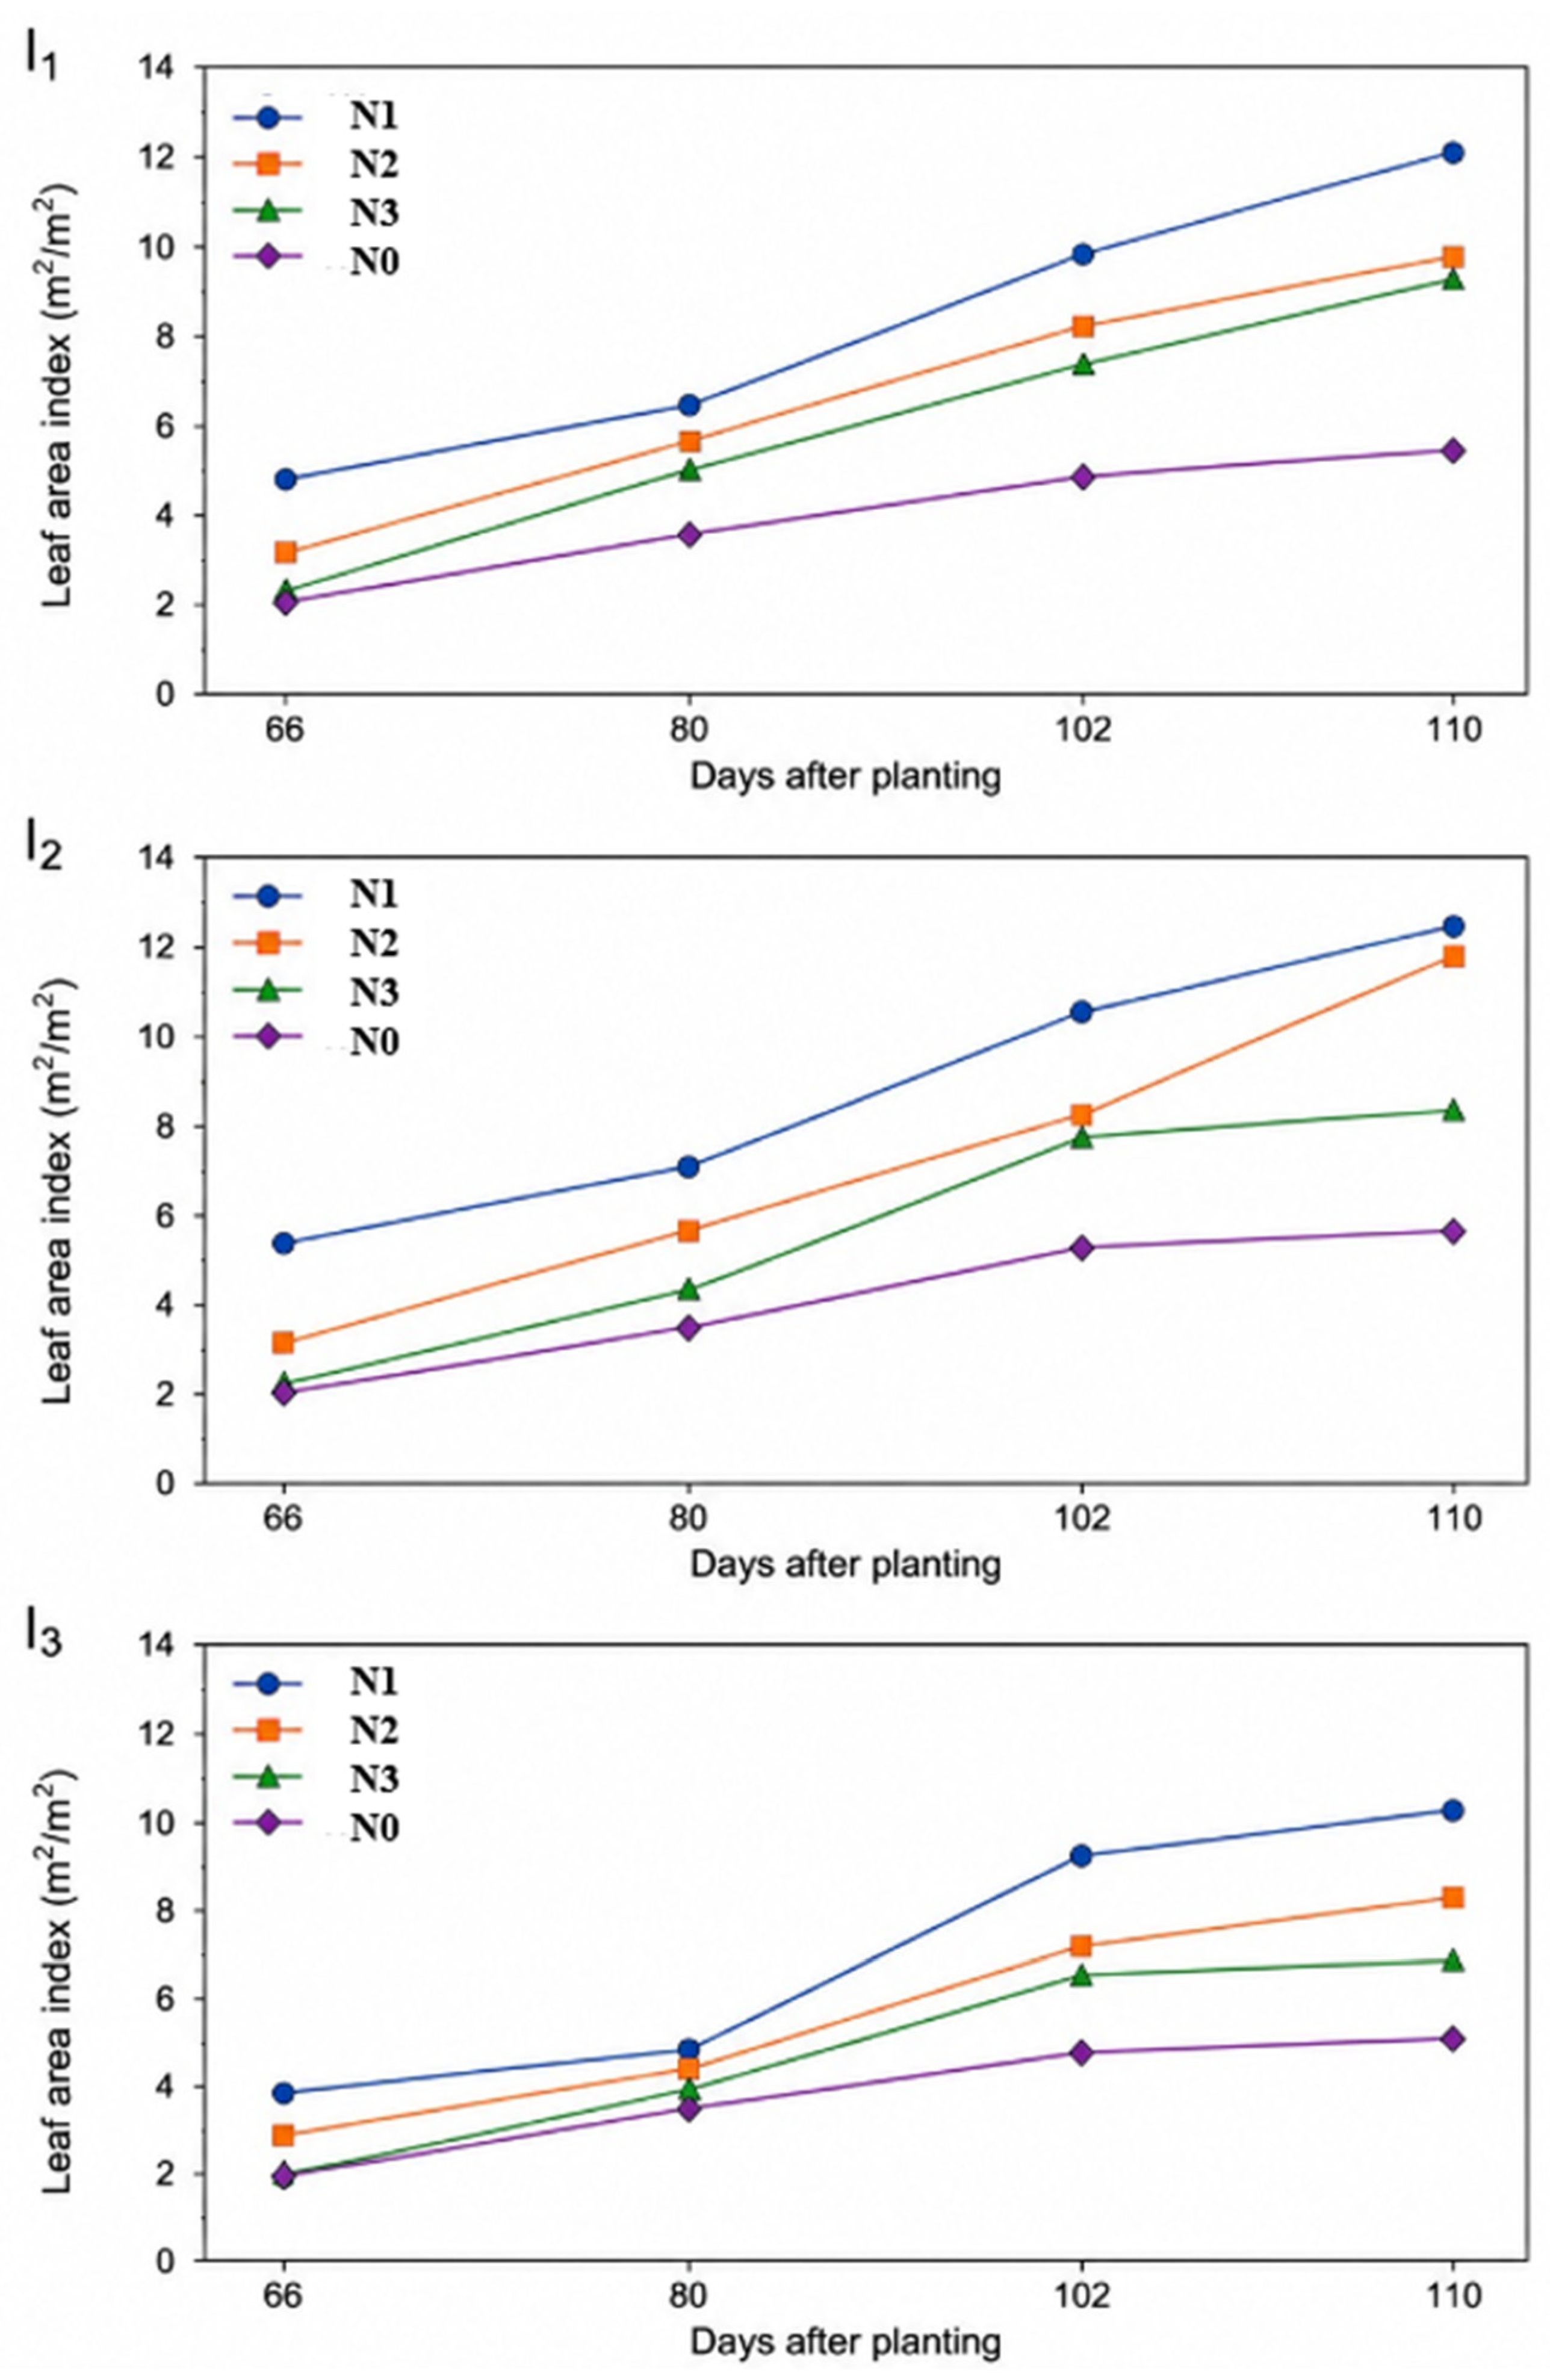
Seasonal changes in LAI under the irrigation and N treatments are shown in Figure 6 and Figure 7. In both years, LAI increased from early vegetative growth to midseason and then declined as leaves senesced. The maximum LAI was observed under I2, whereas I3 generally produced the lowest maximum LAI. Maximum LAI values in 2022 were 11.6, 12.4, and 10.6 m2 m−2 for I1, I2, and I3, respectively; the corresponding values in 2023 were 12.1, 12.4, and 10.25 m2 m−2. The largest LAI values were generally associated with N1, and LAI did not increase consistently as the N rate increased. Deep percolation occurred under I3 (Table 4), indicating water movement below the monitored root-zone balance. However, because nitrate concentrations in soil- or drainage-water were not measured, nitrate leaching cannot be confirmed from deep percolation alone. Adequate soil-water supports cell division, leaf expansion, and canopy development, whereas water stress restricts leaf production and can accelerate senescence [32,33]. Across the two seasons, the maximum observed LAI values were 12.1 m2 m−2 for I1, 12.4 m2 m−2 for I2, and 10.6 m2 m−2 for I3. Zhu et al. [34] reported optimum LAI values of 10.93 and 11.12 m2 m−2 under irrigation levels slightly above 100% ETc and N rates of approximately 322–334 kg ha−1. Irmak et al. [35] reported mean maize LAI values of 6.40 and 6.03 m2 m−2 under different irrigation systems, whereas Liu et al. [36] reported maximum values near 5.0–5.3 m2 m−2. The comparatively high LAI values observed here may reflect differences in cultivar, plant density, environment, and measurement method.

3.4. Green Forage and Dry Matter Yields

Green forage and dry matter yields and Duncan groupings for the years 2022 and 2023 are presented in Table 5. Among the fertilized treatments, N1I2 produced the highest green forage yield in both 2022 (109,520 kg ha−1) and 2023 (112,330 kg ha−1), followed by N2I2 (105,780 and 96,800 kg ha−1, respectively). Among fertilized treatments, N1I3 produced the lowest green forage yield in both years (61,030 and 57,800 kg ha−1). These results indicate that increasing irrigation above the full-irrigation level did not increase biomass yield and that the crop response depended on the interaction between irrigation and N rate. The ANOVA results, including degrees of freedom, F statistics, and p values, are provided in Supplementary Tables S1 and S2.
Reported green forage yields in the literature vary widely with cultivar and environment. Ergül [37] reported 67,950–102,360 kg ha−1 in Konya, Güçük and Baytekin [38] reported 90,260–92,850 kg ha−1 in Şanlıurfa, and Çelebi and Türk [39] reported 55,090–103,160 kg ha−1 in Isparta. Kiziloglu et al. [40] found that silage-maize yield declined as water deficit increased and reported a linear relationship between crop evapotranspiration and green forage yield. Sarımehmetoğlu [41] reported dry biomass yields of 16,000–20,000 kg ha−1 for fully irrigated maize cultivars under Çukurova conditions.

3.5. Water Productivity and Irrigation Water Productivity

The reported WP and IWP values are presented in Table 5. N1I2 produced the highest values in both years: WP was 42.4 kg m−3 in 2022 and 44.4 kg m−3 in 2023, whereas IWP was 55.3 and 52.5 kg m−3, respectively. The green forage yield did not increase proportionally with irrigation amount. Under I3, yield remained lower than under I1 or I2 for several N rates, suggesting that water application above the full-irrigation amount was not beneficial under the conditions of this study. The ANOVA results, including degrees of freedom, F statistics, and p values, are provided in Supplementary Tables S3 and S4. Duncan groupings are given in Table 5.
On the basis of the reported WP and IWP values, N1I2 was the most efficient treatment. The reported values are within or above the ranges cited for maize by Karimi and Gomrokchi [42], Djaman and Irmak [43], and Gheysari et al. [12]. However, direct comparisons require the same yield basis (fresh biomass, dry biomass, or grain) and consistent conversion of yield and water depth to kg m−3.
Several studies have reported increases in yield as irrigation approaches the full-irrigation level [40,44]. In the present study, however, the highest reported IWP occurred under deficit irrigation. Excess water under SDI may increase deep percolation and reduce nutrient availability, but the proposed role of nitrate leaching cannot be confirmed without measurements of soil mineral N or drainage-water nitrate. The results therefore suggest that moderate N and deficit irrigation can improve the economic and apparent water-use performance of SDI-grown silage maize. Previous studies have also shown that deficit irrigation can either increase or decrease WP and IWP depending on stress severity, timing, irrigation method, and the yield component used in the calculation [40,45,46,47,48].

3.6. Economic Analysis

Because silage maize is an annual crop, treatment profitability was evaluated using partial budgeting. The analysis compared the additional revenue and costs associated with each irrigation-N combination. Results for 2022 and 2023 are summarized in Table 6 and Supplementary Tables S5 and S6. Maintaining adequate root-zone water and supplying N at an appropriate rate are important for maximizing both biomass yield and farm-level return.
In 2022, N1I2 (140 kg N ha−1 with deficit irrigation) produced the highest net profit (USD 31,941.83 ha−1), followed by N2I2 (USD 27,983.79 ha−1) and N1I1 (USD 18,362.88 ha−1). In 2023, N1I2 again produced the highest net profit (USD 28,500.08 ha−1), followed by N1I1 (USD 20,794.14 ha−1) and N2I2 (USD 18,659.62 ha−1). The selling prices used were USD 0.36 kg−1 in 2022 and USD 0.28 kg−1 in 2023, and the exchange rates were TRY 16.59 per USD in 2022 and TRY 24.11 per USD in 2023. Thus, under the prices and costs used in the analysis, deficit irrigation combined with the lowest nonzero N rate was the most profitable treatment.

4. Conclusions

This two-year study showed that the agronomic and economic responses of silage maize to N depended strongly on the irrigation level under SDI. Among the tested combinations, applying 140 kg N ha−1 with irrigation equal to 50% of the full-irrigation amount (N1I2) produced the highest green forage yield in both years, the highest WP and IWP values reported in the study, and the greatest net profit. Relative to I1, I2 reduced seasonal irrigation by approximately 49% in 2022 and 47% in 2023. Applying water above the full-irrigation amount did not improve yield and resulted in measured deep percolation. However, the occurrence of deep percolation should not be interpreted as direct evidence of nitrate leaching because nitrate concentrations were not measured. These findings support moderate N application combined with deficit irrigation as a potentially effective strategy for silage maize under the soil and Mediterranean climatic conditions of the study. Nevertheless, validation across additional sites and seasons is required before broad recommendations are made.

Supplementary Materials

The following supporting information can be downloaded at https://www.mdpi.com/article/10.3390/plants15172734/s1, Table S1: Results of variance analysis of green forage yield for research topics; Table S2: Results of variance analysis of dry matter yield for research topics; Table S3: Results of variance analysis of water productivity for research topics; Table S4: Results of variance analysis of irrigation water productivity for research topics; Table S5: Economic analysis of different irrigation levels and nitrogen rates in silage maize (2022 year); Table S6: Economic analysis of different irrigation levels and nitrogen rates in silage maize (2023 year).

Author Contributions

Conceptualization: F.A.; methodology: F.A., K.A., C.K., D.B., and B.C.; field investigation: F.A., Ö.Ö., G.U., Ş.E., M.P., and M.K.; economic analysis: F.A. and Ş.G.Y.; formal analysis: F.A., K.A., D.B., and B.C.; writing—original draft: F.A.; writing—review and editing: F.A., K.A., G.U., C.K., D.B., and B.C. All authors have read and agreed to the published version of the manuscript.

Funding

This study used data from project TAGEM/TSKAD/B/22/A9/P3/5552, conducted at the Batı Akdeniz Agricultural Research Institute (BATEM) and supported by the General Directorate of Agricultural Research and Policies (TAGEM).

Data Availability Statement

The original contributions presented in this study are included in the article/Supplementary Materials. Further inquiries can be directed to the corresponding author.

Conflicts of Interest

The authors declare no conflicts of interest.

References

  1. Anaya-Salgado, A.; Quevedo-Nolasco, A.; Bolaños-González, M.A.; Flores-Velázquez, J.; Reyes-González, A.; Santana-Espinoza, S.; Maltos-Buendía, J.; Sánchez-Duarte, J.I.; Maldonado-Jaquez, J.A. The water efficiency and productivity of forage maize (Zea mays L.) in a semi-arid region under different humidity, nitrogen, and substrate levels. Crops 2026, 6, 1. [Google Scholar] [CrossRef] [Scilit]
  2. Food and Agriculture Organization of the United Nations (FAO). FAOSTAT: Production Indices. 2026. Available online: https://www.fao.org/faostat/en/#home (accessed on 12 February 2026).
  3. Hammad, H.M.; Ahmad, A.; Abbas, F.; Farhad, W. Optimizing water and nitrogen use for maize production under semiarid conditions. Turk. J. Agric. For. 2012, 36, 519–532. [Google Scholar] [CrossRef] [Scilit]
  4. Zhou, M.; Wang, Y.; Gu, J.; Ma, N.; Hou, W.; Sun, J.; Fan, X.; Yin, G. Effects of increasing maize planting density on yield, water productivity and irrigation water productivity in China: A comprehensive meta-analysis incorporating soil and climatic factors. Agric. Water Manag. 2025, 317, 109671. [Google Scholar] [CrossRef] [Scilit]
  5. Kaur, T.; Pawan, K.; Sharma, A.S.; Singh, B.S.; Singh, S. Precision irrigation and fertilization strategies for sustainable cotton-wheat systems in water-scarce regions. Agric. Water Manag. 2025, 317, 109669. [Google Scholar] [CrossRef] [Scilit]
  6. Thapa, B.; Awal, R.; Fares, A.; Veettil, A.V.; Elhassan, A.; Rahman, A. Optimized Irrigation and Nitrogen Fertilization Enhance Sorghum Yield and Resilience in Drought-Prone Regions. Plants 2025, 14, 2913. [Google Scholar] [CrossRef] [Scilit] [PubMed]
  7. Payero, J.O.; Tarkalson, D.D.; Irmak, S.; Davison, D.; Petersen, J.L. Effect of irrigation amounts applied with subsurface drip irrigation on corn evapotranspiration, yield, water-use efficiency, and dry matter production in a semiarid climate. Agric. Water Manag. 2008, 95, 895–908. [Google Scholar] [CrossRef] [Scilit]
  8. Aydinsakir, K.; Erdal, S.; Buyuktas, D.; Bastug, R.; Toker, R. The influence of regular deficit irrigation applications on water use, yield, and quality components of two corn (Zea mays L.) genotypes. Agric. Water Manag. 2013, 128, 65–71. [Google Scholar] [CrossRef] [Scilit]
  9. Simsek, M.; Can, A.; Denek, N.; Tonkaz, T. The effects of different irrigation regimes on yield and silage quality of corn under semi-arid conditions. Afr. J. Biotechnol. 2011, 10, 5869–5877. [Google Scholar] [CrossRef] [Scilit]
  10. Karasu, A.; Kușcu, H.; Bayram, G. The effect of different irrigation water levels on grain yield, yield components and some quality parameters of silage Maize (Zea mays indentata Sturt.). Not. Bot. Horti Agrobot. Cluj-Napoca 2015, 43, 138–145. [Google Scholar] [CrossRef] [Scilit]
  11. Tari, A.F. The impact of different irrigation intervals and levels on yield and quality of drip-irrigated corn silage (Zea mays L.) under arid climate. Appl. Ecol. Environ. Res. 2022, 20, 4173–4191. [Google Scholar] [CrossRef] [Scilit]
  12. Gheysari, M.; Pirnajmedin, F.; Movahedrad, H.; Majidi, M.M.; Zareian, M.J. Crop yield and irrigation water productivity of silage maize under two water stress strategies in semi-arid environment: Two different pot and field experiments. Agric. Water Manag. 2021, 255, 106999. [Google Scholar] [CrossRef] [Scilit]
  13. Mohammadi, S.; Mirlatifi, S.M.; Homaee, M.; Dehghanisanij, H.; Hajirad, I. Evaluation of silage maize production under pulsed drip irrigation in a semi-arid region. Irrig. Sci. 2024, 42, 269–283. [Google Scholar] [CrossRef] [Scilit]
  14. Yerli, C.; Sahin, U.; Ors, S.; Kiziloglu, F.M. Improvement of water and crop productivity of silage maize by irrigation with different levels of recycled wastewater under conventional and zero tillage conditions. Agric. Water Manag. 2023, 277, 108100. [Google Scholar] [CrossRef] [Scilit]
  15. Hajirad, I. Optimizing pulsed and continuous drip irrigation strategies to enhance yield and water productivity of silage maize in semi-arid regions. Cogent Food Agric. 2025, 11, 2583753. [Google Scholar] [CrossRef] [Scilit]
  16. Akın, F.; Cemek, B. The effects of different water deficit levels on yield and water-use productivity of sesame irrigated by subsurface drip irrigation. Irrig. Sci. 2025, 43, 995–1013. [Google Scholar] [CrossRef] [Scilit]
  17. Yolcu, R.; Üzen, N.; Çetin, Ç. Irrigation and nitrogen fertigation strategies providing the maximum net return and water productivity for second crop silage corn. Soil Water J. 2016, 5, 59–64. [Google Scholar]
  18. Çetin, Ö.; Tolay, I. Fertigasyon: Sulama Ile Birlikte Gübreleme; HASAD Yayıncılık: Istanbul, Turkey, 2009; 160p. [Google Scholar]
  19. Jensen, M.E.; Burman, R.D.; Allen, R.G. Evapotranspiration and Irrigation Water Requirements; Manuals and Reports on Engineering Practices No: 70; ASCE: New York, NY, USA, 1990. [Google Scholar]
  20. Allen, R.G.; Pereira, L.S.; Raes, D.; Smith, M. Crop Evapotranspiration: Guidelines for Computing Crop Water Requirements (FAO Irrigation and Drainage Paper No. 56); Food and Agriculture Organization of the United Nations: Rome, Italy, 1998. [Google Scholar]
  21. Evett, S.R. Water and energy balances at soil-plant-atmosphere interfaces. In The Soil Physics Companion; Warrick, A.W., Ed.; CRC Press: Boca Raton, FL, USA, 2002; pp. 127–188. [Google Scholar]
  22. Kijne, J.W.; Barker, R.; Molden, D.J. Water Productivity in Agriculture: Limits and Opportunities for Improvement; CABI Publishing Book Information: Wallingford, UK, 2003; 358p. [Google Scholar]
  23. Rodrigues, G.C.; Pereira, L.S. Assessing economic impacts of deficit irrigation as related to water productivity and water costs. Biosys. Eng. 2009, 103, 536–551. [Google Scholar] [CrossRef] [Scilit]
  24. Keller, J.; Bliesner, R. Sprinkle and Trickle Irrigation; Chapman: New York, NY, USA, 1990. [Google Scholar]
  25. Çetin, Ö.; Üzen, N. Yüzey ve yüzeyaltı damla sulamanın toprakta nem değişimi ve toprak su tansiyonuna etkisi. Harran Tarım Gıda Bilim. Derg. 2018, 22, 461–470. [Google Scholar]
  26. Köksal, E.; İlbeyi, A.; Üstün, H.; Özcan, H. Yeşil Fasulye Sulama Suyu Yönetiminde Örtü Sıcaklığı ve Spektral Yansıma Oranı Değerlerinin Kullanım Olanakları; Tagem Yayın No: TAGEM-BbTopraksu-29.S.26; General Directorate of Agricultural Research and Policies (TAGEM), Ministry of Agriculture and Forestry: Ankara, Türkiye, 2007.
  27. Sezen, S.M.; Yazar, A.; Arıoğlu, H.; Şengül, H.; Konuşkan, D.; Eker, S.; Çolak, Y.B.; Günaçtı, H.; Atağ, G.; Kuşvuran, K. Akdeniz iklim koşullarında damla yöntemiyle uygulanan geleneksel ve kısmi kök kuruluğu (prd) kısıntılı sulama stratejilerinin ayçiçeği verimi ve yağ kalitesine etkilerinin belirlenmesi; TAGEMBB-090201C3 no’lu Proje Sonuç Raporu; General Directorate of Agricultural Research and Policies (TAGEM), Ministry of Agriculture and Forestry: Ankara, Türkiye, 2013; 152p.
  28. Çetin, Ö.; Üzen, N.; Temiz, M.G.; Sessiz, A. Güneş Enerjisi Kullanarak Damla Sulama İle Sulanan Pamukta Fertigasyonda Azotlu Gübre Yönetimi; Dicle Üniversitesi Koordinatörlüğü: Diyarbakır, Türkiye, 2013. [Google Scholar]
  29. Ramachandiran, K.; Pazhanivelan, S. Relationship between spectral vegetation indices and crop parameters of maize under nitrogen and water stress. J. Agrometeorol. 2017, 19, 114–119. [Google Scholar] [CrossRef] [Scilit]
  30. Irmak, S. Maize response to different subsurface drip irrigation management strategies: Yield, production functions, basal and crop evapotranspiration. Agric. Water Manag. 2024, 300, 108927. [Google Scholar] [CrossRef] [Scilit]
  31. Huo, J.; Wang, P.; Yu, A.; Pang, X.; Jiang, K.; Wang, Y.; Yin, B.; Shang, Y.; Cai, H.; Feng, Z.; et al. Moderate winter irrigation reduction improves maize water productivity under green manure incorporation by optimizing root distribution and water consumption. Agric. Water Manag. 2026, 333, 110568. [Google Scholar] [CrossRef] [Scilit]
  32. Farah, S.M. Effects of plant density and fertilization on the yield and quality of flue-cured tobacco in the Kenana area of the Sudan. J. Agric. Sci. 1975, 84, 75–80. [Google Scholar] [CrossRef] [Scilit]
  33. Karamanos, A.J. Water Stress and Leaf Growth of Field Beans (Viciafaba L.) in the Field: Leaf Number and Total Leaf Area. Ann. Bot. 1978, 42, 1393–1402. [Google Scholar] [CrossRef] [Scilit]
  34. Zhu, T.; Liu, F.; Wang, G.; Guo, H.; Ma, L. Impact of drip irrigation and nitrogen application on plant height, leaf area index, and water-use efficiency of summer maize in southern Xinjiang. Plants 2025, 14, 956. [Google Scholar] [CrossRef] [Scilit] [PubMed]
  35. Irmak, S.; Mohammed, A.T.; Kukal, M.S. Maize response to coupled irrigation and nitrogen fertilization under center pivot, subsurface drip and surface (furrow) irrigation: Growth, development and productivity. Agric. Water Manag. 2022, 263, 107457. [Google Scholar] [CrossRef] [Scilit]
  36. Liu, Y.; Wang, N.; Jiang, C.; Wang, Y. Effects of irrigation type and fertilizer application rate on growth, yield, and water and fertilizer-use efficiency of silage corn in the North China Plain. PeerJ 2024, 12, e18315. [Google Scholar] [CrossRef] [Scilit] [PubMed]
  37. Ergül, Y. Silajlık Mısır Çeşitlerinin Önemli Tarımsal ve Kalite Özelliklerinin Belirlenmesi Üzerinde Araştırma. In Yüksek Lisans Tezi; Selçuk Üniversitesi Fen Bilimleri Enstitüsü Tarla Bitkileri Ana Bilim Dalı: Konya, Türkiye, 2008. [Google Scholar]
  38. Güçük, T.; Baytekin, H. Bozova sulu koşullarında ikinci ürün olarak yetiştirilen silaj mısır, silaj sorgum ve sorgum-sudanotu melez çeşitlerinde hasat zamanının verim ve verim unsurlarına etkisi. In Proceedings of the GAP I. Tarım Kongresi, Şanlıurfa, Türkiye, 26–28 May 1999; pp. 683–690. [Google Scholar]
  39. Çelebi, F.G.; Türk, M. Yüzey Altı Damla Sulama Yöntemi ile Sulanan Silajlık Mısırda (Zea mays L.) Kısıtlı Su Uygulamalarının Verim ve Kalite Üzerine Etkileri. Ziraat Fak. Derg. 2021, 16, 207–213. [Google Scholar]
  40. Kiziloglu, F.M.; Sahin, U.; Kuslu, Y.; Tunc, T. Determining water–yield relationship, water use efficiency, crop and pan coefficients for silage maize in a semiarid region. Irrig. Sci. 2009, 27, 129–137. [Google Scholar] [CrossRef] [Scilit]
  41. Sarımehmetoğlu, G. Farklı Sulama Uygulamaları Altında Mısır Çeşitlerinin Sulama Suyu ve Gübre Kullanım Etkinliği. Master’s Thesis, Ç.Ü. Fen Bilimleri Ens, Adana, Türkiye, 2007. [Google Scholar]
  42. Karimi, M.; Gomrokchi, A. Yield and water use efficiency of corn planted in one or two rows and applying furrow or drip tape irrigation systems in Ghazvin Province, Iran. Irrig. Drain. 2011, 60, 35–41. [Google Scholar] [CrossRef] [Scilit]
  43. Djaman, K.; Irmak, S. Soil-water extraction patterns and crop, irrigation, and evapotranspiration water-use efficiency of maize under full and limited irrigation and rainfed conditions. Trans. ASABE 2012, 55, 1223–1238. [Google Scholar] [CrossRef] [Scilit]
  44. Dağdelen, N.; Yılmaz, E.; Sezgin, F.; Gürbüz, T. Water-yield relation and water use efficiency of cotton (Gossypium hirsutum L.) and second crop corn (Zea mays L.) in western Turkey. Agric. Water Manag. 2006, 82, 63–85. [Google Scholar] [CrossRef] [Scilit]
  45. Farré, I.; Faci, J.M. Comparative response of maize (Zea mays L.) and sorghum (Sorghum bicolor L. Moench) to deficit irrigation in a Mediterranean environment. Agric. Water Manag. 2006, 83, 135–143. [Google Scholar] [CrossRef] [Scilit]
  46. Ors, S.; Sahin, U.; Kiziloglu, F.M. Yield, quality and irrigation water use of drip-irrigated silage maize with different irrigation techniques. Pak. J. Agric. Sci. 2015, 52, 595–607. [Google Scholar]
  47. Jha, A.K.; Malla, R.; Sharma, M.; Panthi, J.; Lakhankar, T.; Krakauer, N.Y.; Shrestha, M.L. Impact of irrigation method on water use efficiency and productivity of fodder crops in Nepal. Climate 2016, 4, 4. [Google Scholar] [CrossRef] [Scilit]
  48. Cakmakci, T.; Sahin, U. Improving silage maize productivity using recycled wastewater under different irrigation methods. Agric. Water Manag. 2021, 255, 107051. [Google Scholar] [CrossRef] [Scilit]
Figure 1. Layout and field implementation of the irrigation and nitrogen treatments.
Plants 15 02734 g001
Figure 2. Positions of the soil-water probes, measurement zones, and drip emitters within the experimental plots.
Plants 15 02734 g002
Figure 3. Root-zone soil-water dynamics under the irrigation treatments in (a) 2022 and (b) 2023. I1, full irrigation; I2, 50% of I1; I3, 120% of I1; PWP, permanent wilting point; FC, field capacity; Ry, allowable depletion.
Plants 15 02734 g003aPlants 15 02734 g003b
Figure 4. Seasonal variation in canopy cover under the irrigation and nitrogen treatments in 2022. N0, 0; N1, 140; N2, 210; and N3, 280 kg N ha−1; I1, full irrigation; I2, 50% of I1; I3, 120% of I1.
Plants 15 02734 g004
Figure 5. Seasonal variation in canopy cover under the irrigation and nitrogen treatments in 2023. N0, 0; N1, 140; N2, 210; and N3, 280 kg N ha−1; I1, full irrigation; I2, 50% of I1; I3, 120% of I1.
Plants 15 02734 g005
Figure 6. Seasonal variation in leaf area index under the irrigation and nitrogen treatments during the 2022 growing season. N0, 0; N1, 140; N2, 210; and N3, 280 kg N ha−1; I1, full irrigation; I2, 50% of I1; I3, 120% of I1.
Plants 15 02734 g006
Figure 7. Seasonal variation in leaf area index under the irrigation and nitrogen treatments during the 2023 growing season. N0, 0; N1, 140; N2, 210; and N3, 280 kg N ha−1; I1, full irrigation; I2, 50% of I1; I3, 120% of I1.
Plants 15 02734 g007
Table 1. Monthly climatic conditions during the 2022 and 2023 growing seasons and the long-term period (1930–2023).
MayJuneJulyAugustSeptember
2022
Mean Daily Air Temperature (°C)21.926.129.528.024.2
Total precipitation (mm)8.005.000.00.00.0
Mean relative humidity (%)61.169.854.280.465.6
2023
Mean Daily Air Temperature (°C)20.6825.2831.0128.8326.15
Total precipitation (mm)91.027.00.00.06.2
Mean relative humidity (%)74.069.249.579.164.4
Long-term (1930–2023)
Mean daily air temperature (°C)20.625.328.628.425.3
Total precipitation (mm)34.3114.44.316.9
Table 2. Physical and chemical properties of the experimental soil.
Depth
(cm)
Clay
(%)
Silt
(%)
Sand
(%)
Texture ClassCaCO3
(%)
pHEC
(dS m−1)
Bulk Density
(g cm−3)
Field Capacity
(%)
Wilting Point
(%)
0–30324424CL25.68.30.101.3123.510.8
30–60284824CL24.88.30.111.3823.411.1
60–90244036L23.78.40.161.4323.111.7
90–120264826L23.98.30.151.4123.210.8
Table 3. Selected chemical properties of the irrigation water.
pHEC
(dS m−1)
Cations (meq L−1)Anions (meq L−1)Class
Na+K+Ca2+Mg2+CO32−HCO3ClSO42−
7.300.560.490.054.231.85-5.030.531.06C2S1
Table 4. Monthly soil-water balance components for each irrigation treatment in 2022 and 2023 (mm).
TreatmentMonth20222023
IP∆SDPETIP∆SDPET
I1May408−24.9023.11091−2.2098.8
June115530.10150.1105277.80139.8
July13105.60136.61310−12.00119.0
August1010−3.2097.81570−3.00154.0
Total387137.50407.5403118−9.40511.6
I2May408−24.9021.31091−12.3088.7
June63540.60108.65327−27.3052.7
July58019.9077.9670−33.3033.7
August37011.8048.8840−6.2077.8
Total1981347.40258.4214118−79.10252.9
I3May408−24.9028.110915.40106.4
June149544.613209.613727−10.117170.9
July158028.418202.41580−19.922160.1
August124029.610162.61650−5.214173.8
Total4711377.741602.7470118−29.853611.2
I1, full irrigation triggered when 30% of the available soil-water in the 0–0.90 m profile was depleted; I2, deficit irrigation receiving 50% of the I1 amount; I3, excess irrigation receiving 120% of the I1 amount; I, irrigation; P, precipitation; ΔS, change in soil-water storage; DP, deep percolation; ET, crop evapotranspiration.
Table 5. Green forage yield, dry matter yield, water productivity, and irrigation water productivity under the irrigation and nitrogen treatments.
TreatmentGFY (kg ha−1)MeanDMY (kg ha−1)MeanWP (kg m−3)MeanIWP (kg m−3)Mean
IrrigationNitrogen20222023GFY20222023DMY20222023WP20222023IWP
I1N027,65029,50028,575 k10,05010,51010,280 ef6.85.86.3 ı7.17.37.2 ı
N172,100 84,42078,260 g31,55035,10033,325 bd17.716.517.1 f18.620.919.8 ef
N283,50086,70085,100 e33,28038,86036,070 bc20.516.918.7 e21.621.521.5 de
N392,45093,10092,775 c36,60039,91038,255 bc22.718.220.4 d23.923.123.5 d
I2N034,50036,70035,600 j10,08510,05010,068 ef13.414.513.9 g17.417.117.3 fg
N1109,520112,330110,925 a54,69063,36059,025 a42.444.443.4 a55.352.553.9 a
N2105,78096,800101,290 b40,41041,61041,010 b40.938.339.6 b53.445.249.3 b
N389,97078,20084,085 f37,87023,97030,920 bc34.830.932.9 c4.5436.541.0 c
I3N026,40024,80025,600 L888092009040 f4.44.14.2 j5.65.35.4 ı
N161,03057,80059,415 ı18,12014,92016,520 bd10.19.59.8 h13.012.312.6 h
N275,81076,20076,005 h21,25022,65021,950 de12.612.512.5 g16.116.216.2 g
N385,23087,53086,380 d29,14022,80025,970 cd14.114.314.2 g18.118.618.4 fg
Within a column, means followed by different letters differ significantly at p < 0.05. N0, 0; N1, 140; N2, 210; and N3, 280 kg N ha−1; I1, full irrigation; I2, 50% of I1; I3, 120% of I1; GFY, green forage yield; DMY, dry matter yield; WP, water productivity; IWP, irrigation water productivity.
Table 6. Partial-budget analysis of the irrigation and nitrogen treatments in 2022 and 2023.
Treatments
N1I1N1I2N1I3N2I1N2I2N2I3N3I1N3I2N3I3N0I1N0I2N0I3
2022
Variable costs (USD ha−1)7669.067623.657750.8610,258.9510,224.3610,286.1613,903.9513,853.9113,926.535588.195542.795599.97
Total production costs (USD ha−1)7713.077667.577795.0110,307.6410,272.9910,334.9013,959.2313,909.1013,981.865628.435582.955640.23
Green forage yield (kg ha−1)72,100.00109,520.0061,030.0083,500.00105,780.0075,810.0092,450.0089,970.0085,230.0027,650.0034,500.0029,500.00
Production cost (USD kg−1)0.110.070.130.120.100.140.150.150.160.200.160.19
Selling price (USD kg−1)0.360.360.360.360.360.360.360.360.360.360.360.36
Gross production value (USD ha−1)26,075.9539,609.4022,072.3330,198.9238,256.7827,417.7233,435.8032,538.8830,824.5910,000.0012,477.4010,669.08
Gross profit (USD ha−1)18,406.8831,985.7514,321.4719,939.9628,032.4217,131.5619,531.8618,684.9716,898.064411.816934.615069.11
Net profit (USD ha−1)18,362.8831,941.8314,277.3219,891.2727,983.7917,082.8219,476.5818,629.7816,842.744371.576894.455028.85
Relative profit ratio2.384.171.831.932.721.651.401.341.200.781.230.89
2023
Variable costs (USD ha−1)2466.712458.895899.138145.428008.978202.9210,890.2710,741.3010,945.174628.294481.924673.26
Total production costs (USD ha−1)2490.522482.685927.208176.298039.688233.8710,924.5610,775.4110,979.534654.784508.244699.81
Green forage yield (kg ha−1)84,420.00112,330.0057,800.0086,700.0096,800.0076,200.0093,100.0078,200.0087,530.0029,500.0036,700.0024,800.00
Production cost (USD kg−1)0.030.020.100.090.080.110.120.140.130.160.120.19
Selling price (USD kg−1)0.280.280.280.280.280.280.280.280.280.280.280.28
Gross production value (USD ha−1)23,284.6530,982.7715,942.3523,913.5226,699.2921,017.4225,678.7621,569.0624,142.458136.6710,122.566840.32
Gross profit (USD ha−1)20,817.9428,523.8810,043.2215,768.1018,690.3212,814.5014,788.4910,827.7613,197.283508.385640.642167.05
Net profit (USD ha−1)20,794.1428,500.0810,015.1415,737.2318,659.6212,783.5514,754.2010,793.6513,162.923481.885614.332140.50
Relative profit ratio8.3511.481.691.922.321.551.351.001.200.751.250.46
N0, 0; N1, 140; N2, 210; and N3, 280 kg N ha−1; I1, full irrigation; I2, 50% of I1; I3, 120% of I1. Monetary values are expressed in 2022 or 2023 USD, as applicable. Selling prices were USD 0.36 kg−1 in 2022 and USD 0.28 kg−1 in 2023. The exchange rates used were TRY 16.59 per USD in 2022 and TRY 24.11 per USD in 2023.
Disclaimer/Publisher’s Note: The statements, opinions and data contained in all publications are solely those of the individual author(s) and contributor(s) and not of MDPI and/or the editor(s). MDPI and/or the editor(s) disclaim responsibility for any injury to people or property resulting from any ideas, methods, instructions or products referred to in the content.