

Exploring the Potential of Nitrogen Fertilizer Mixed Application to Improve Crop Yield and Nitrogen Partial Productivity: A Meta-Analysis
 , ,
, ,  ,
,
Abstract
1. Introduction
2. Results
2.1. Statistical Analysis of the Effects of MNF on Crop Yield and PFPN
2.1.1. Data Distribution
2.1.2. Overall Effect
2.2. Analysis of Factors Affecting the Effects of MNF on Crop Yield
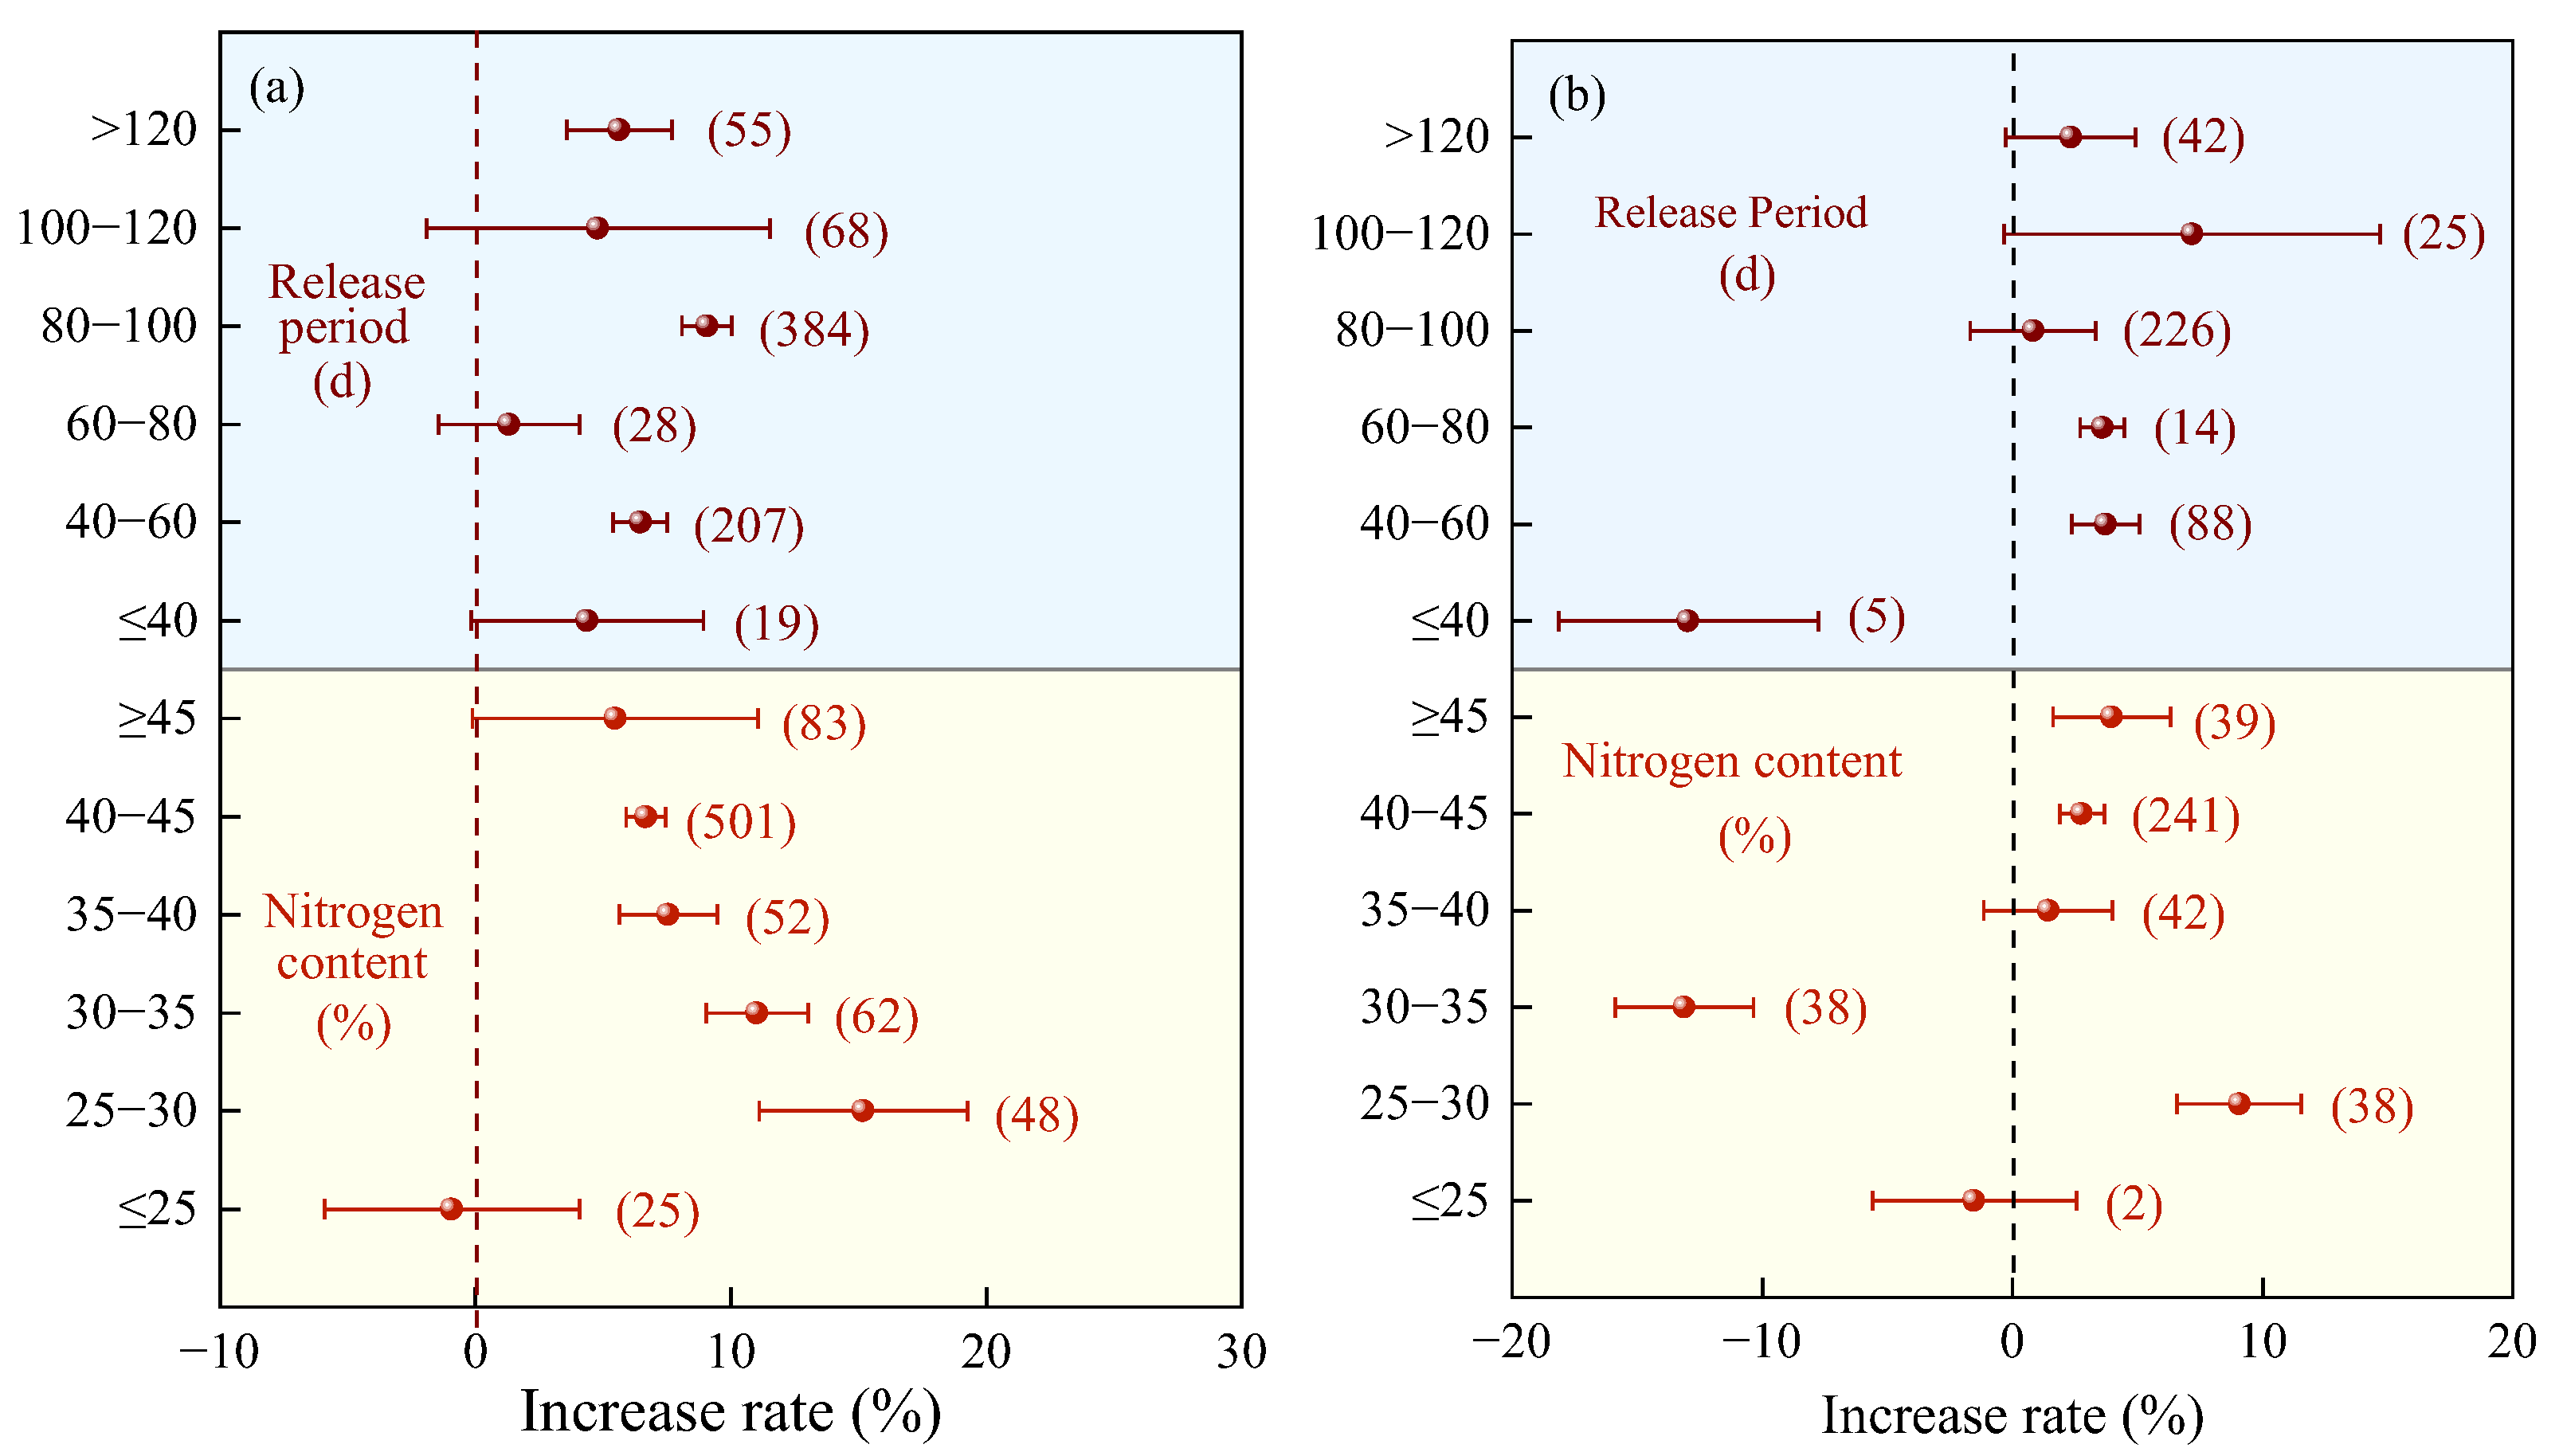
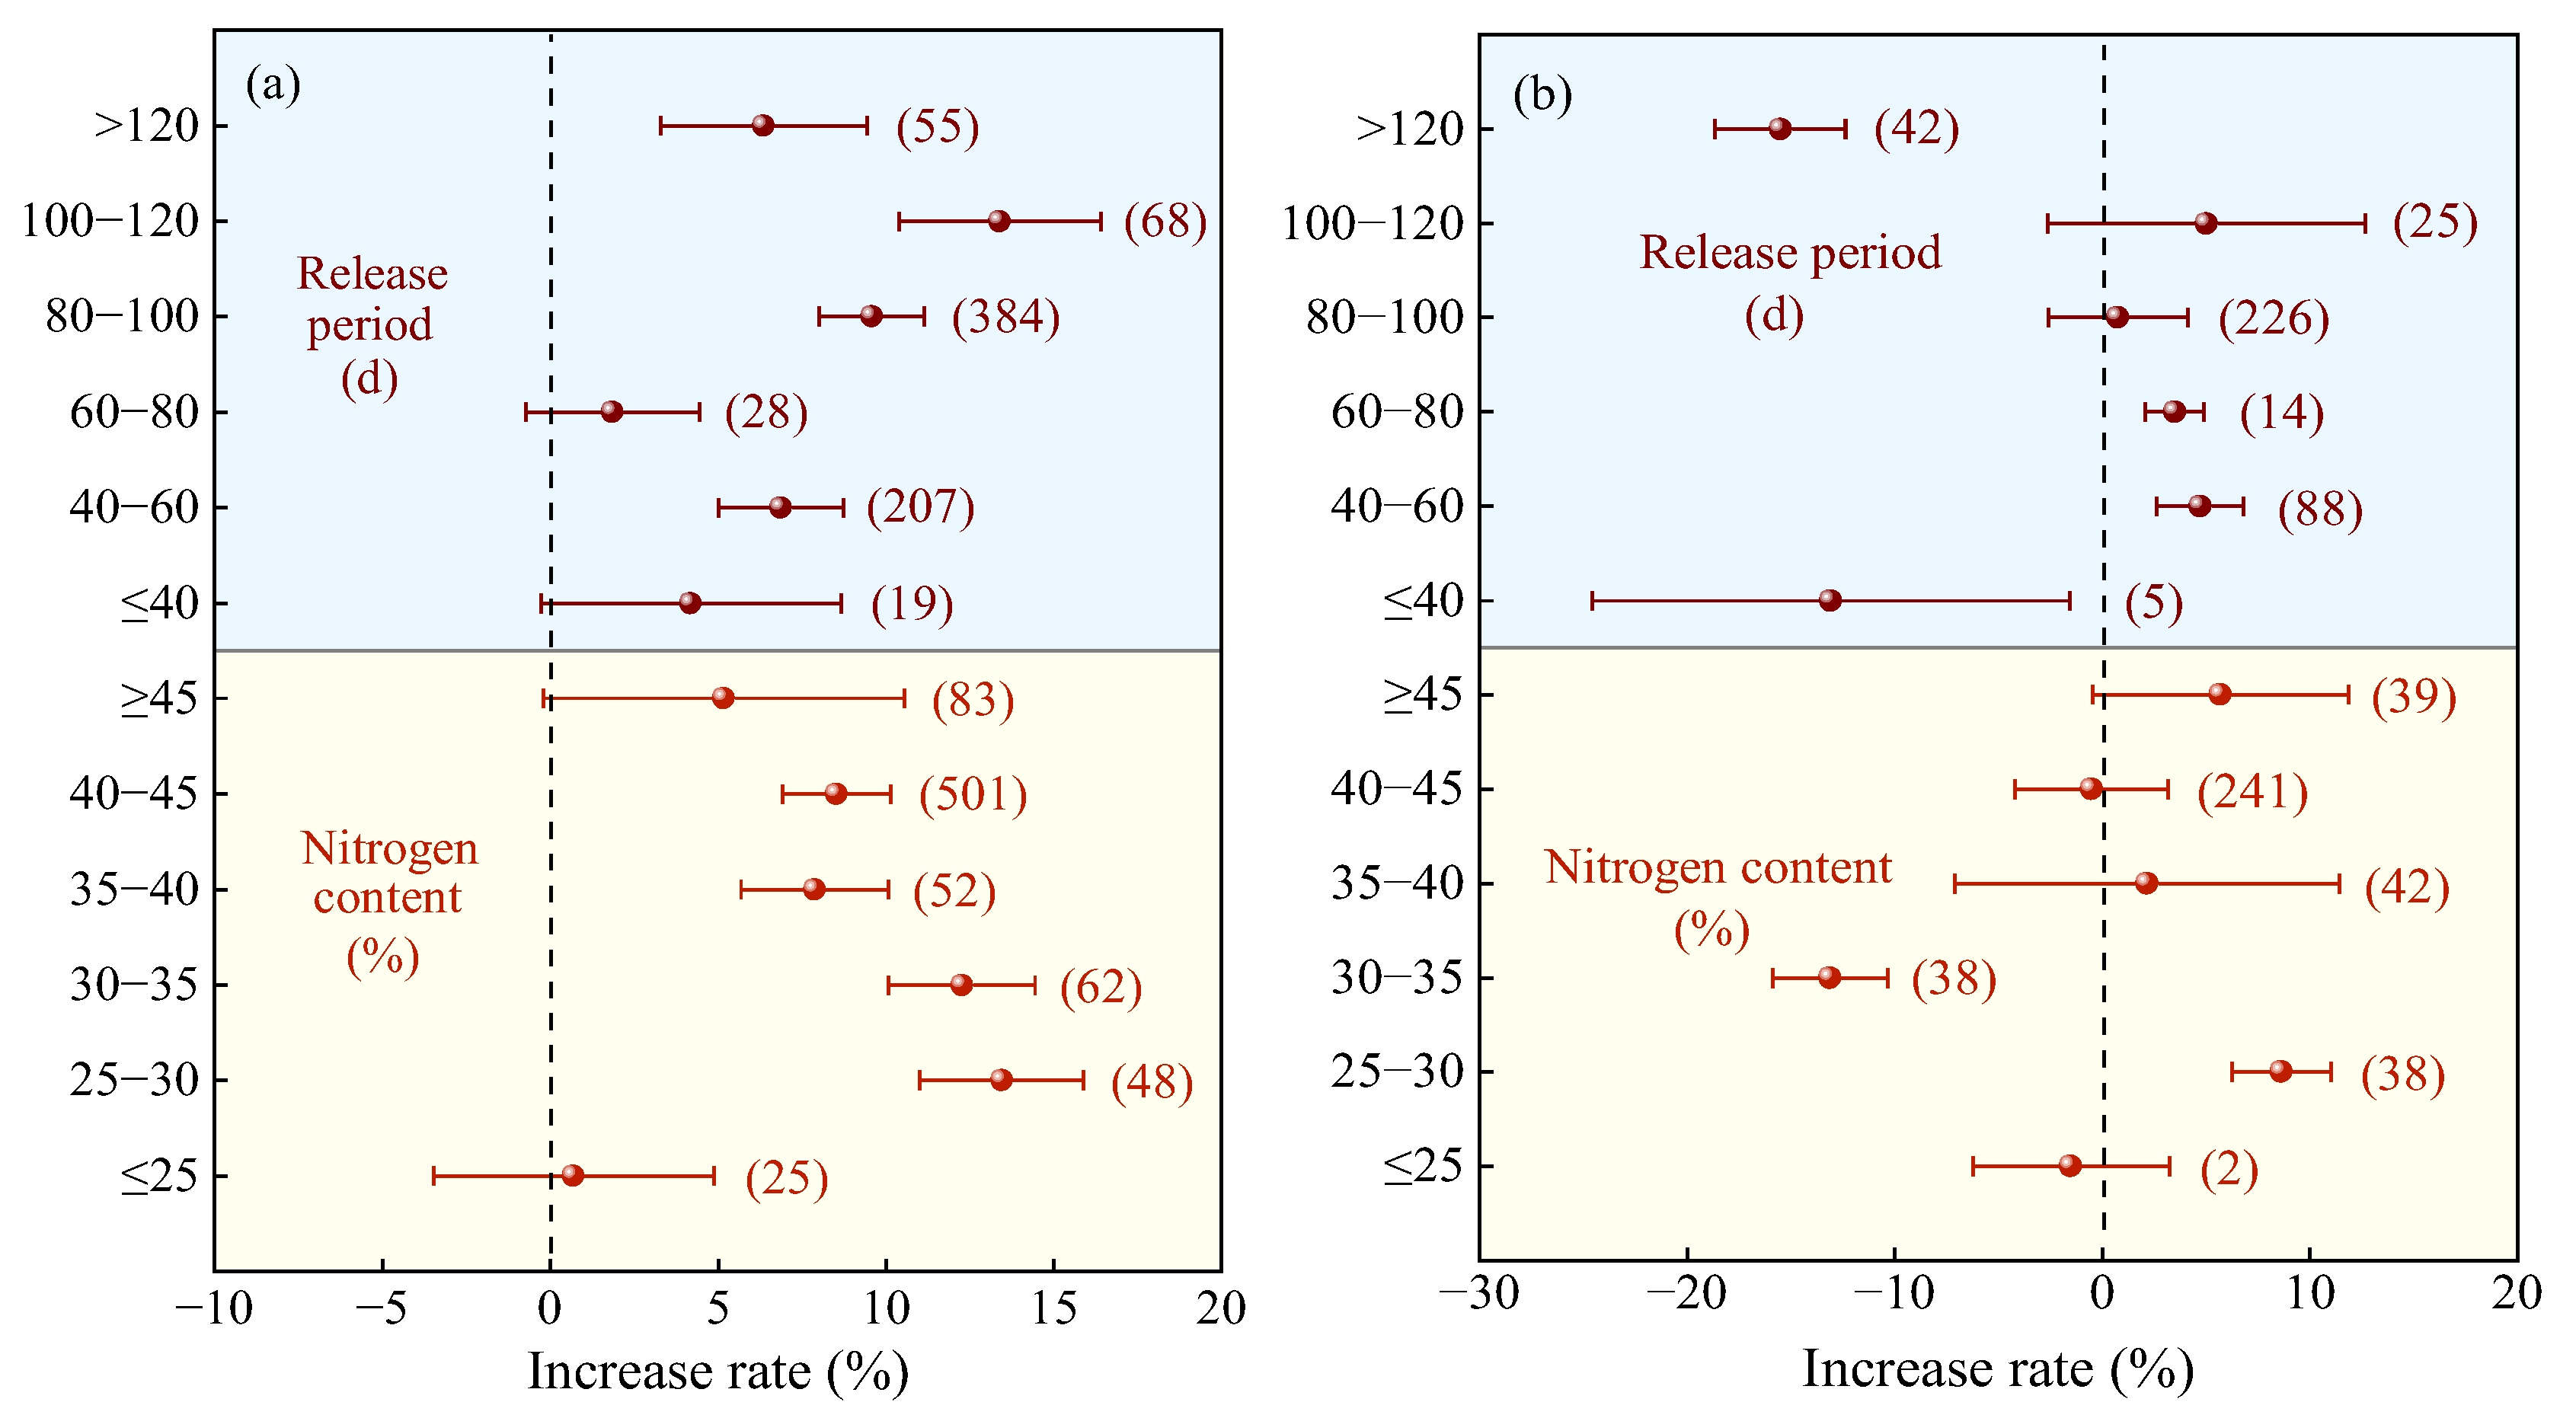
2.2.1. Characteristics of Nitrogen Fertilizer
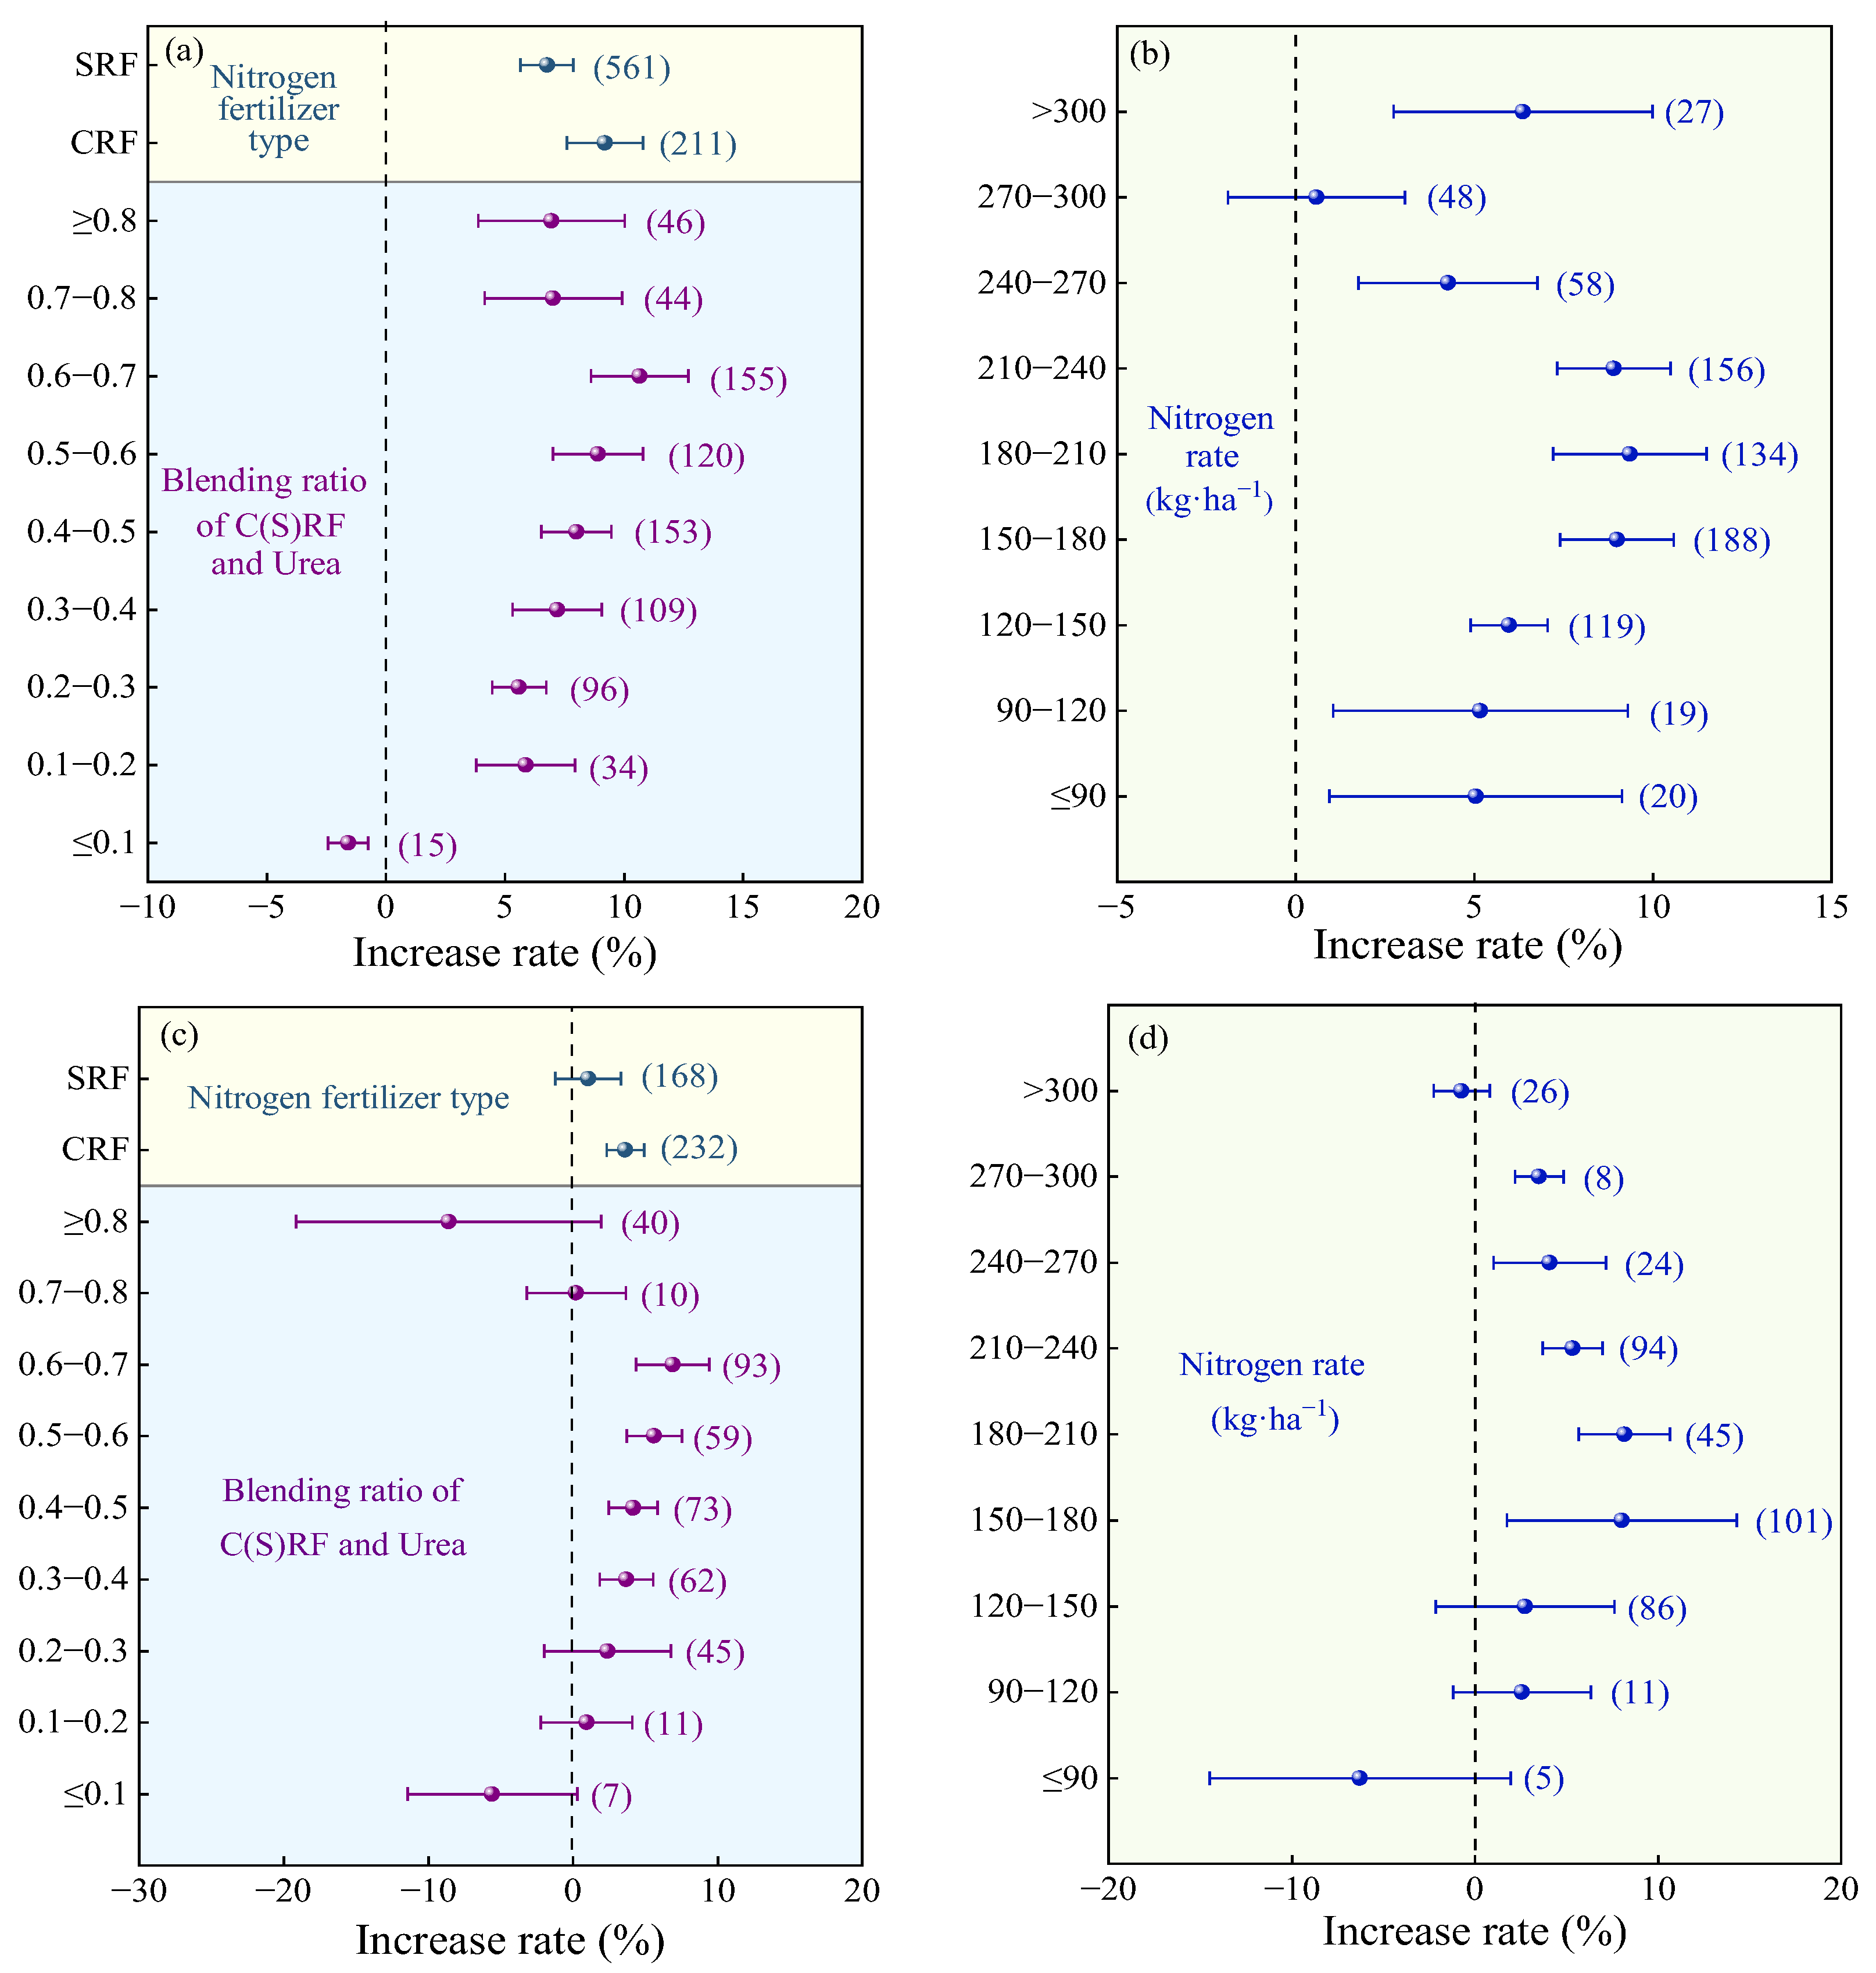
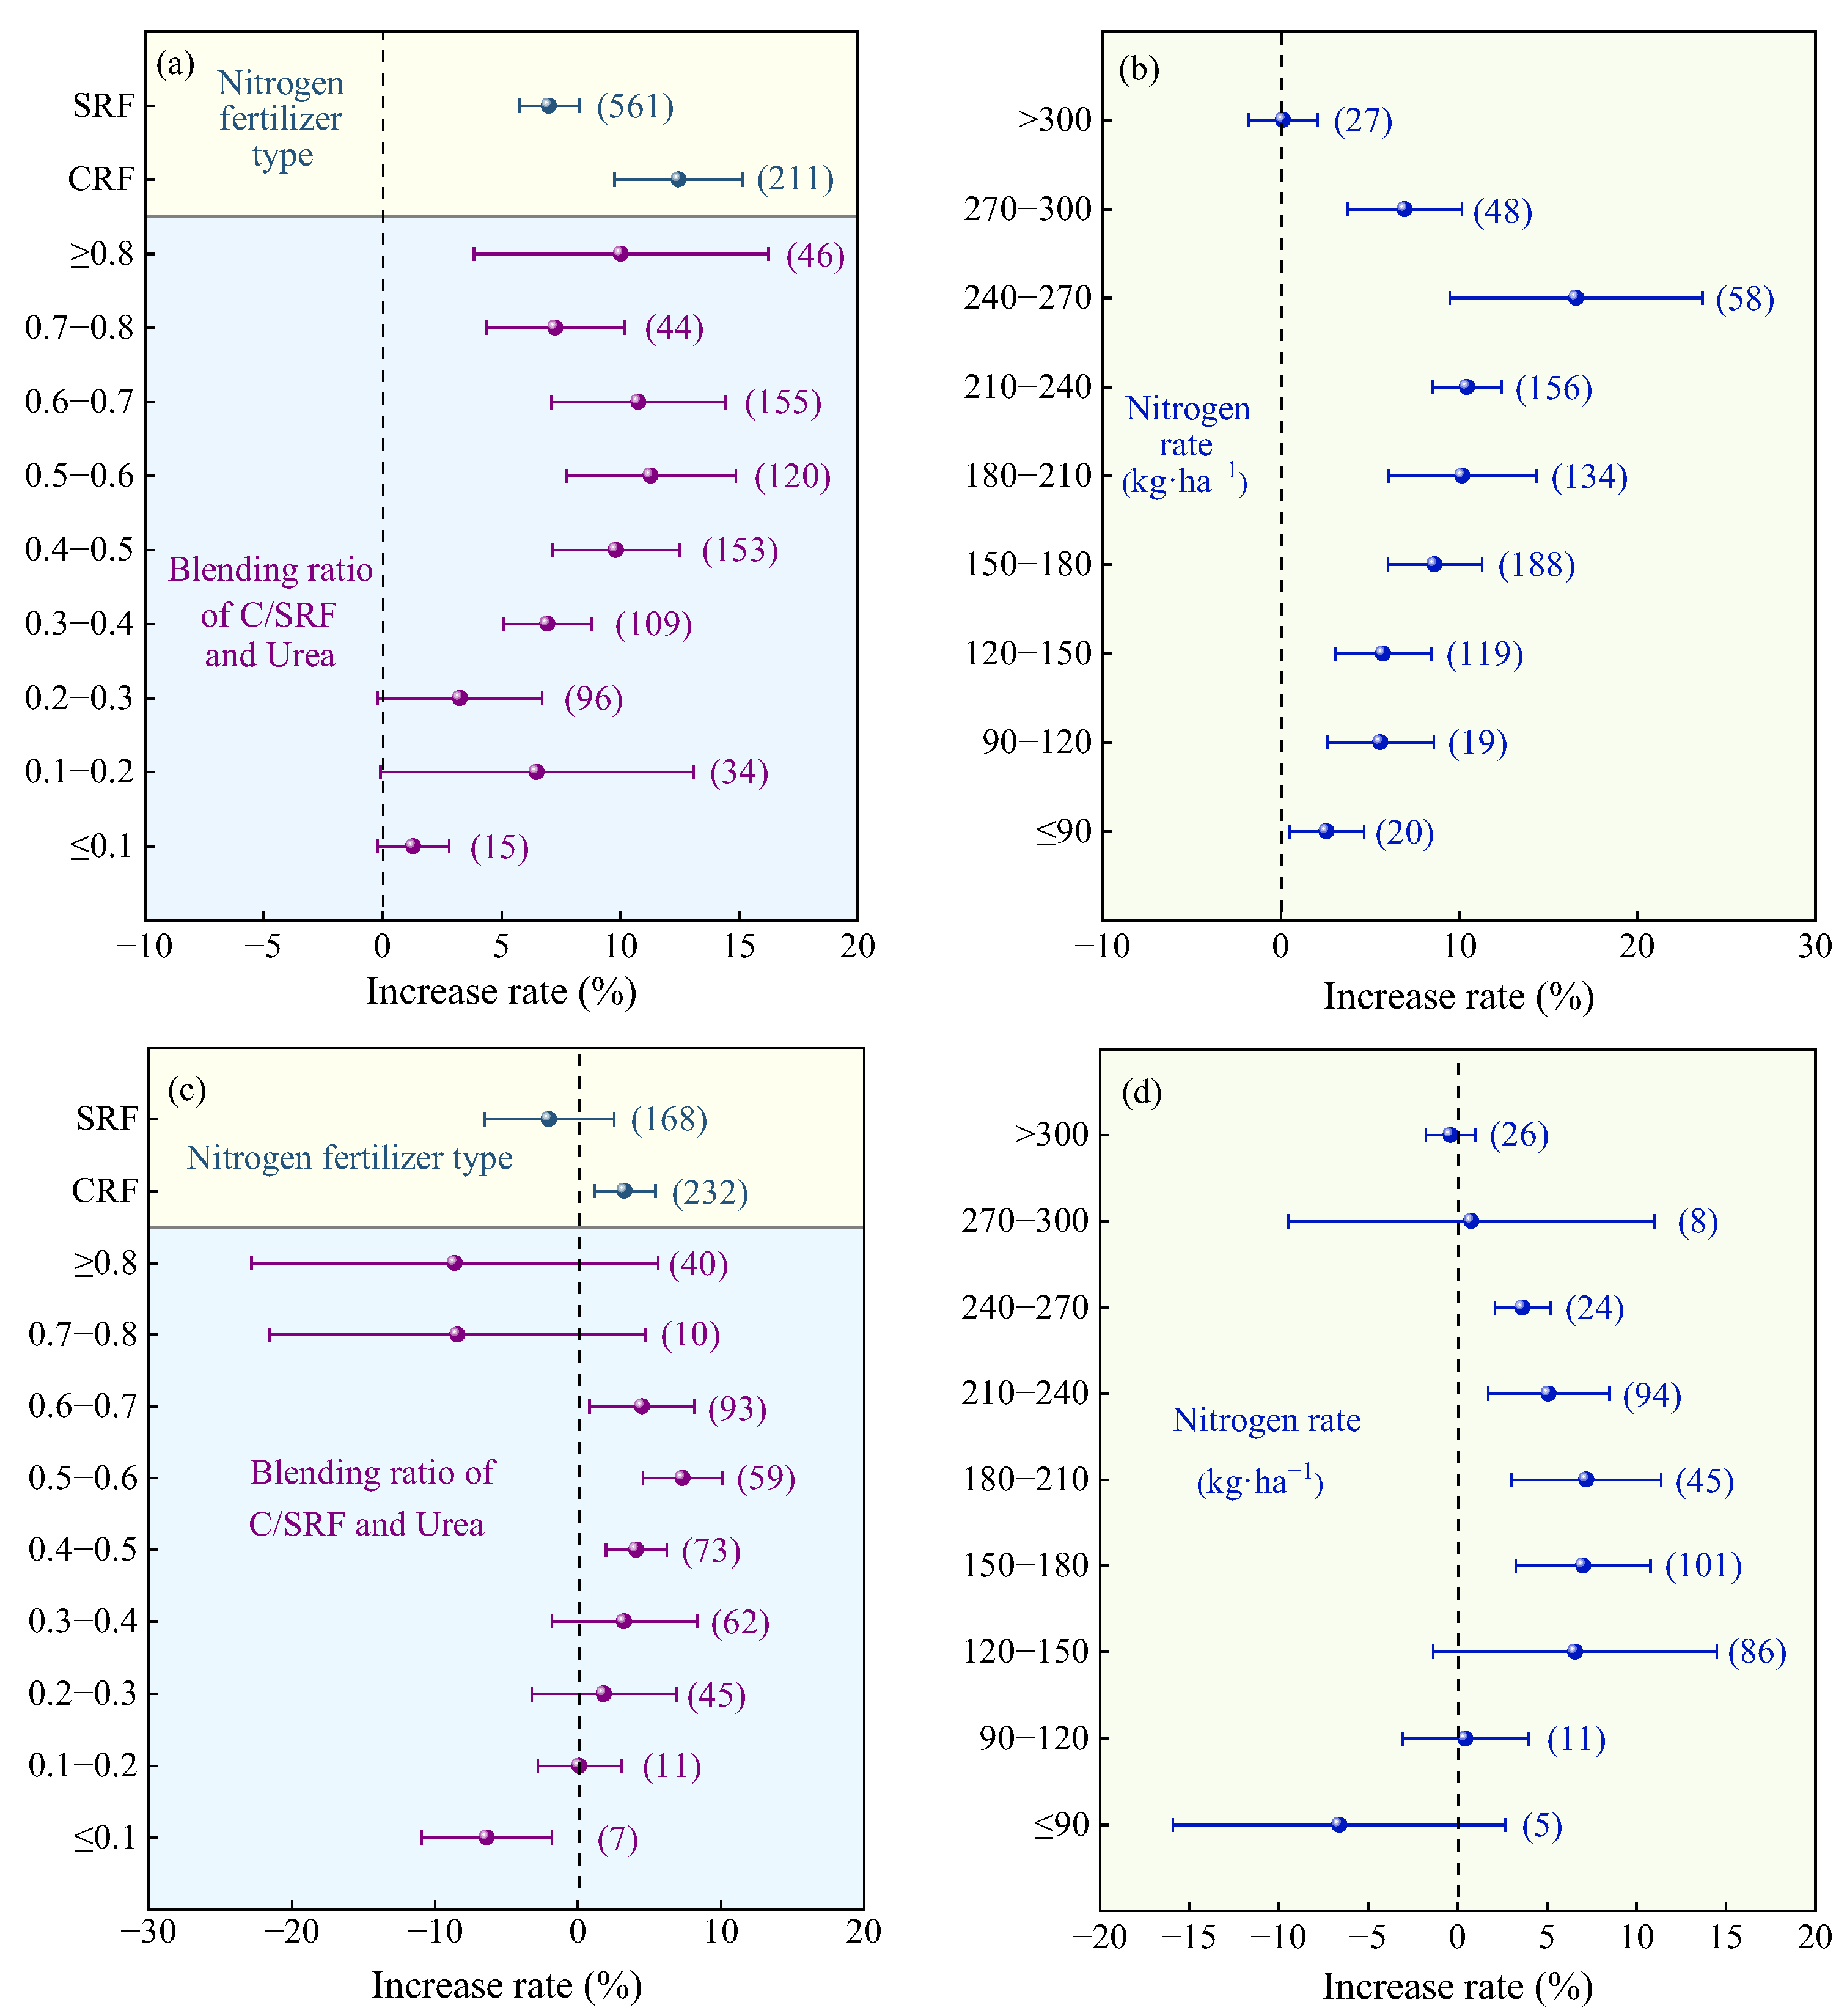
2.2.2. Nitrogen Fertilizer Management
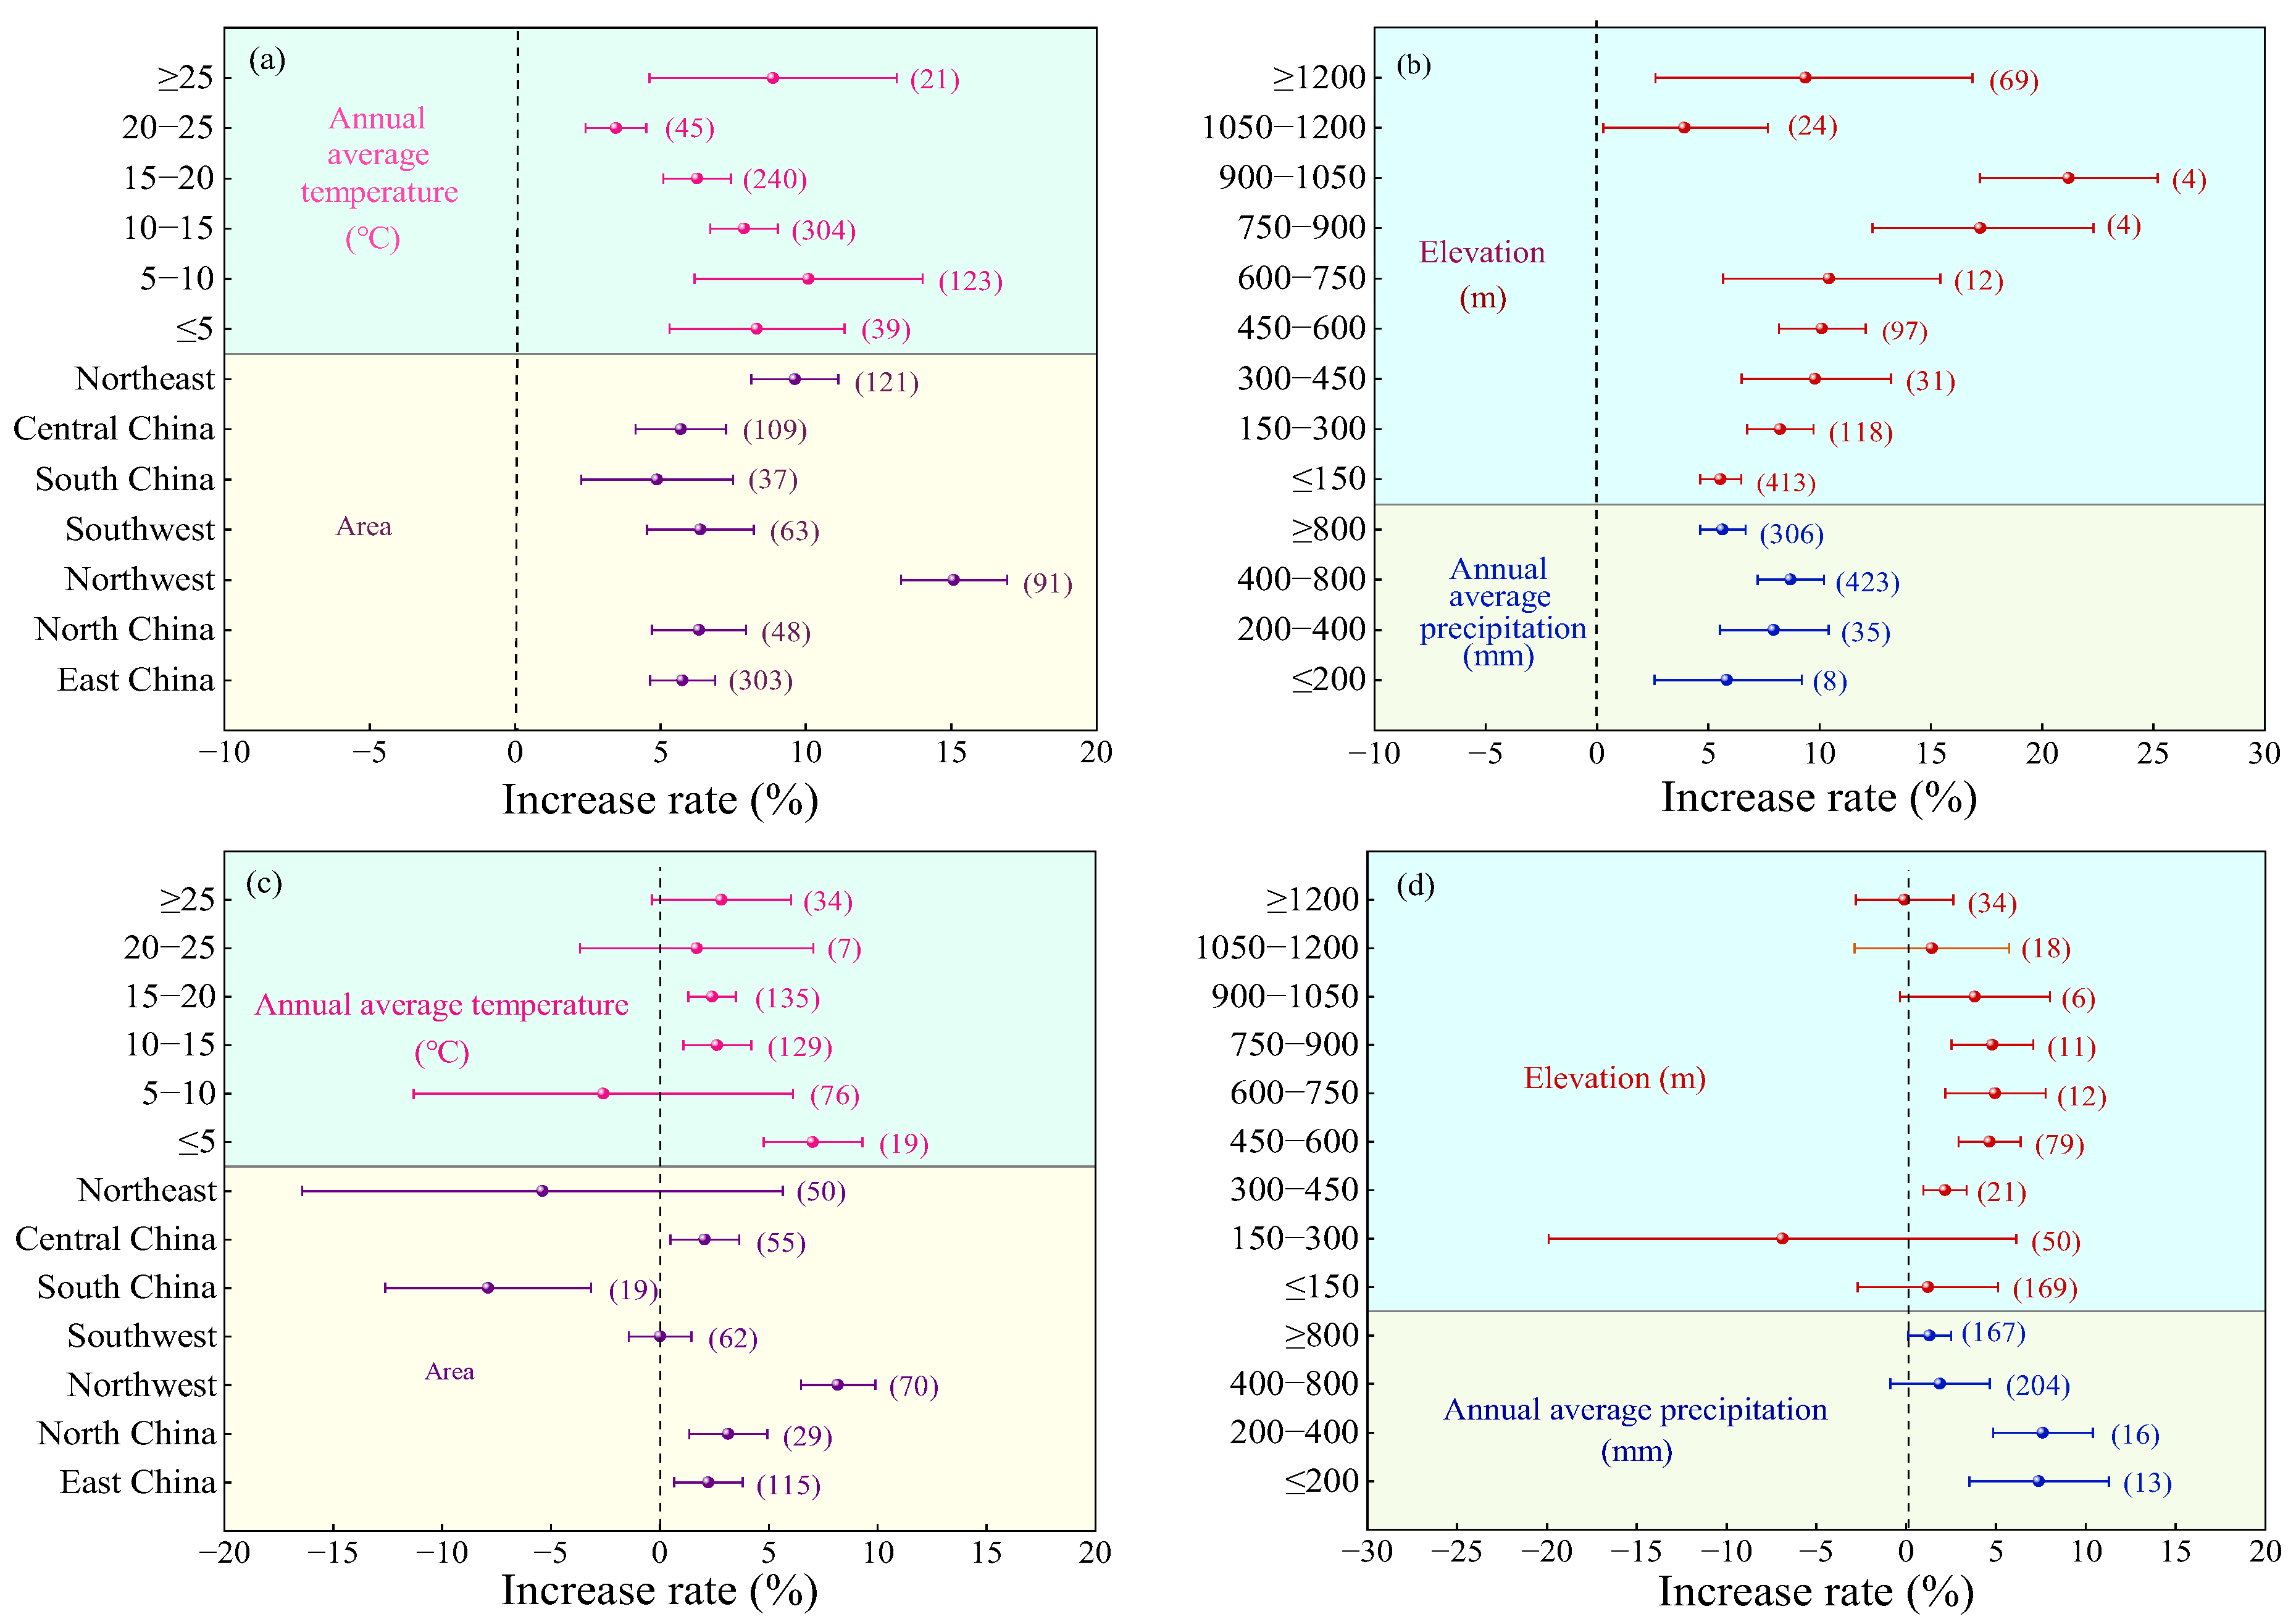
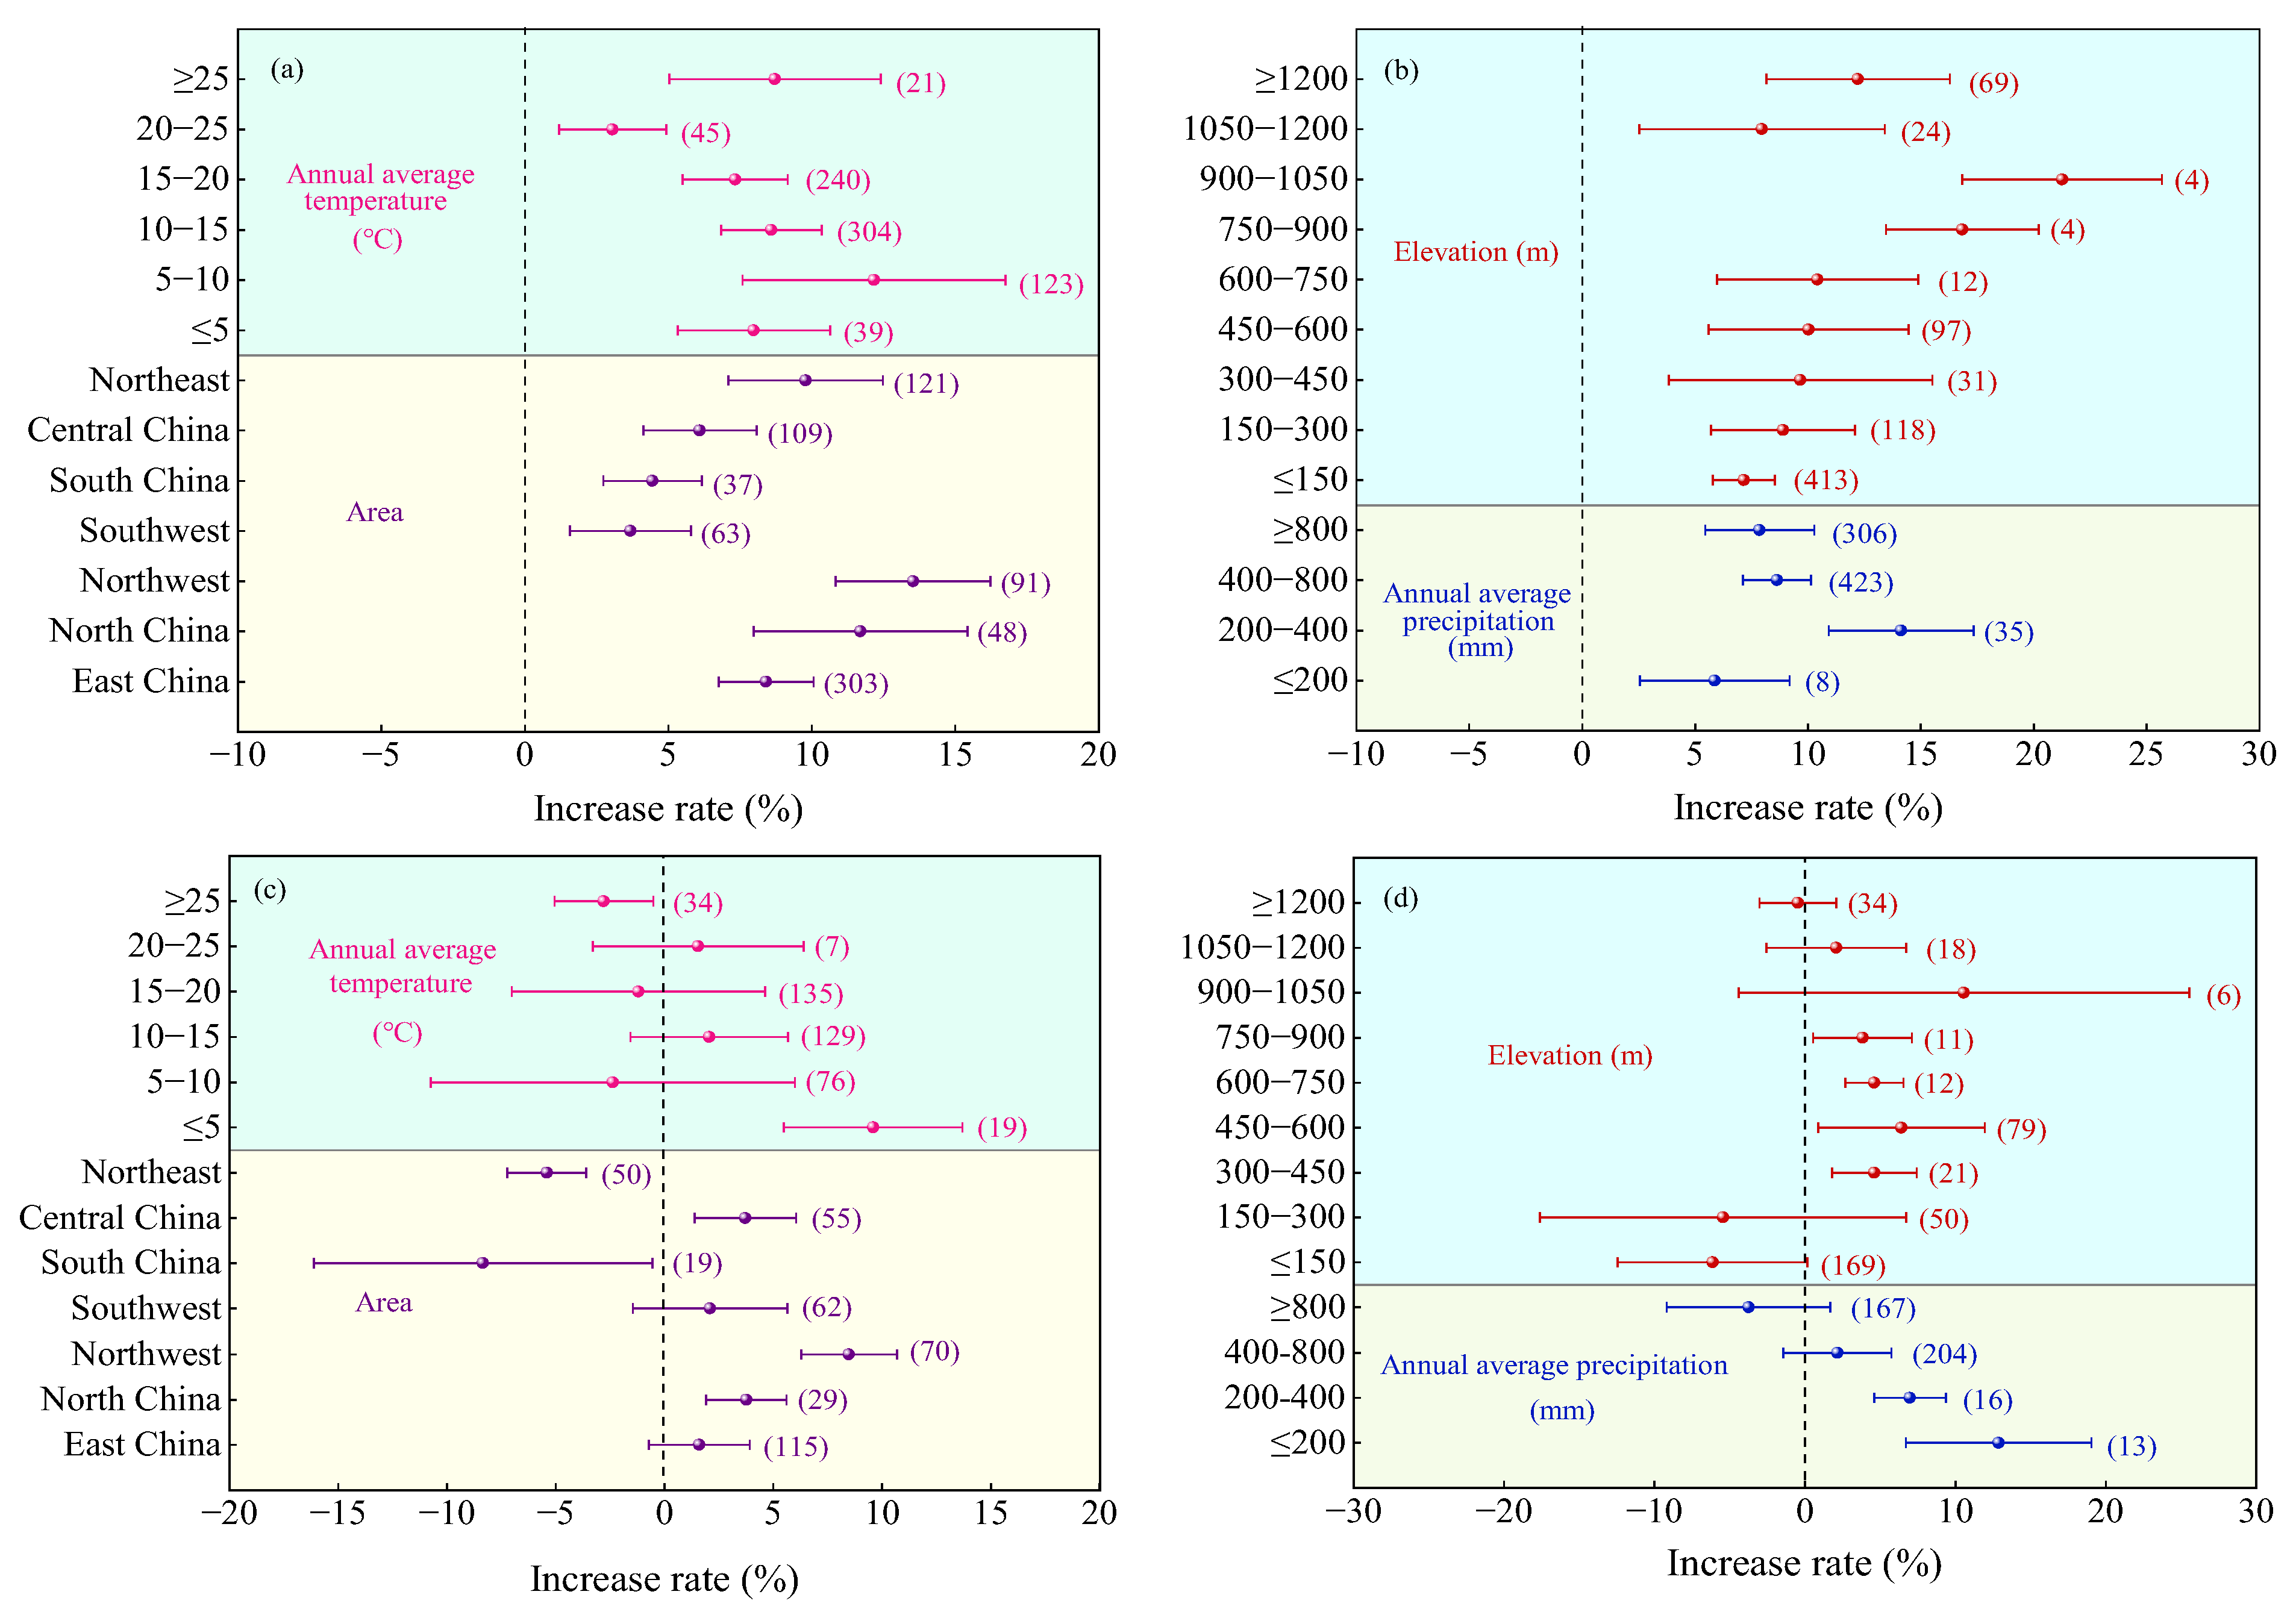
2.2.3. Regional Factor
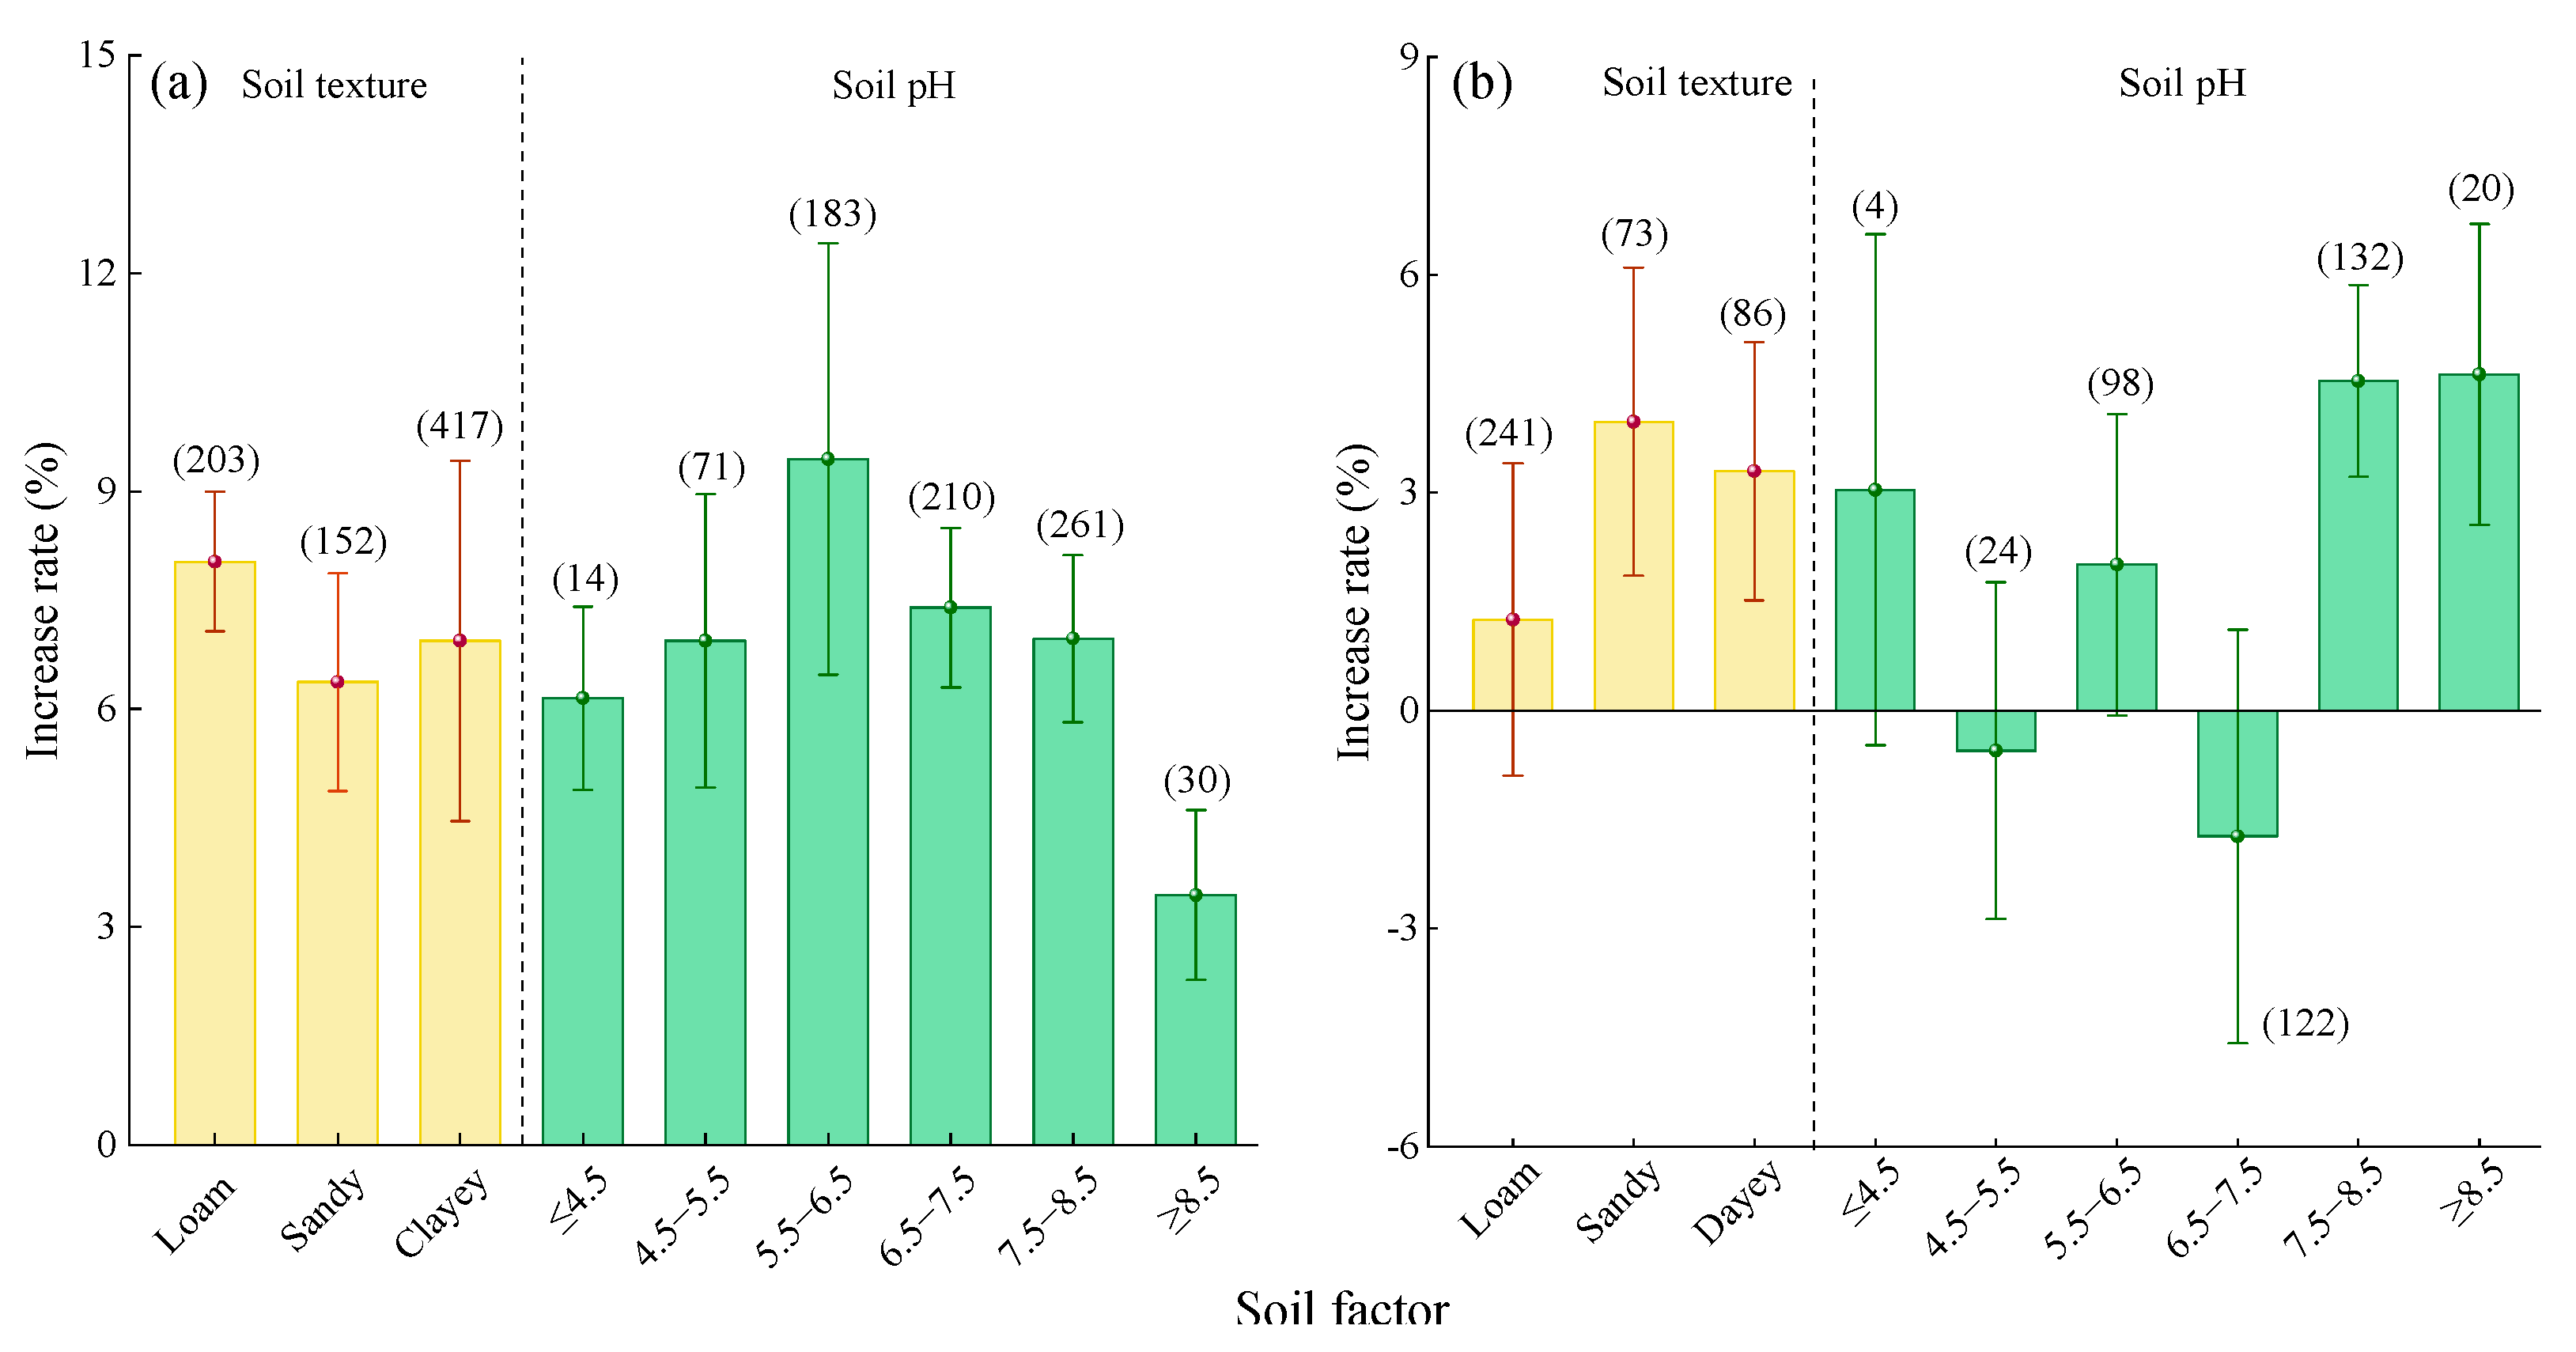
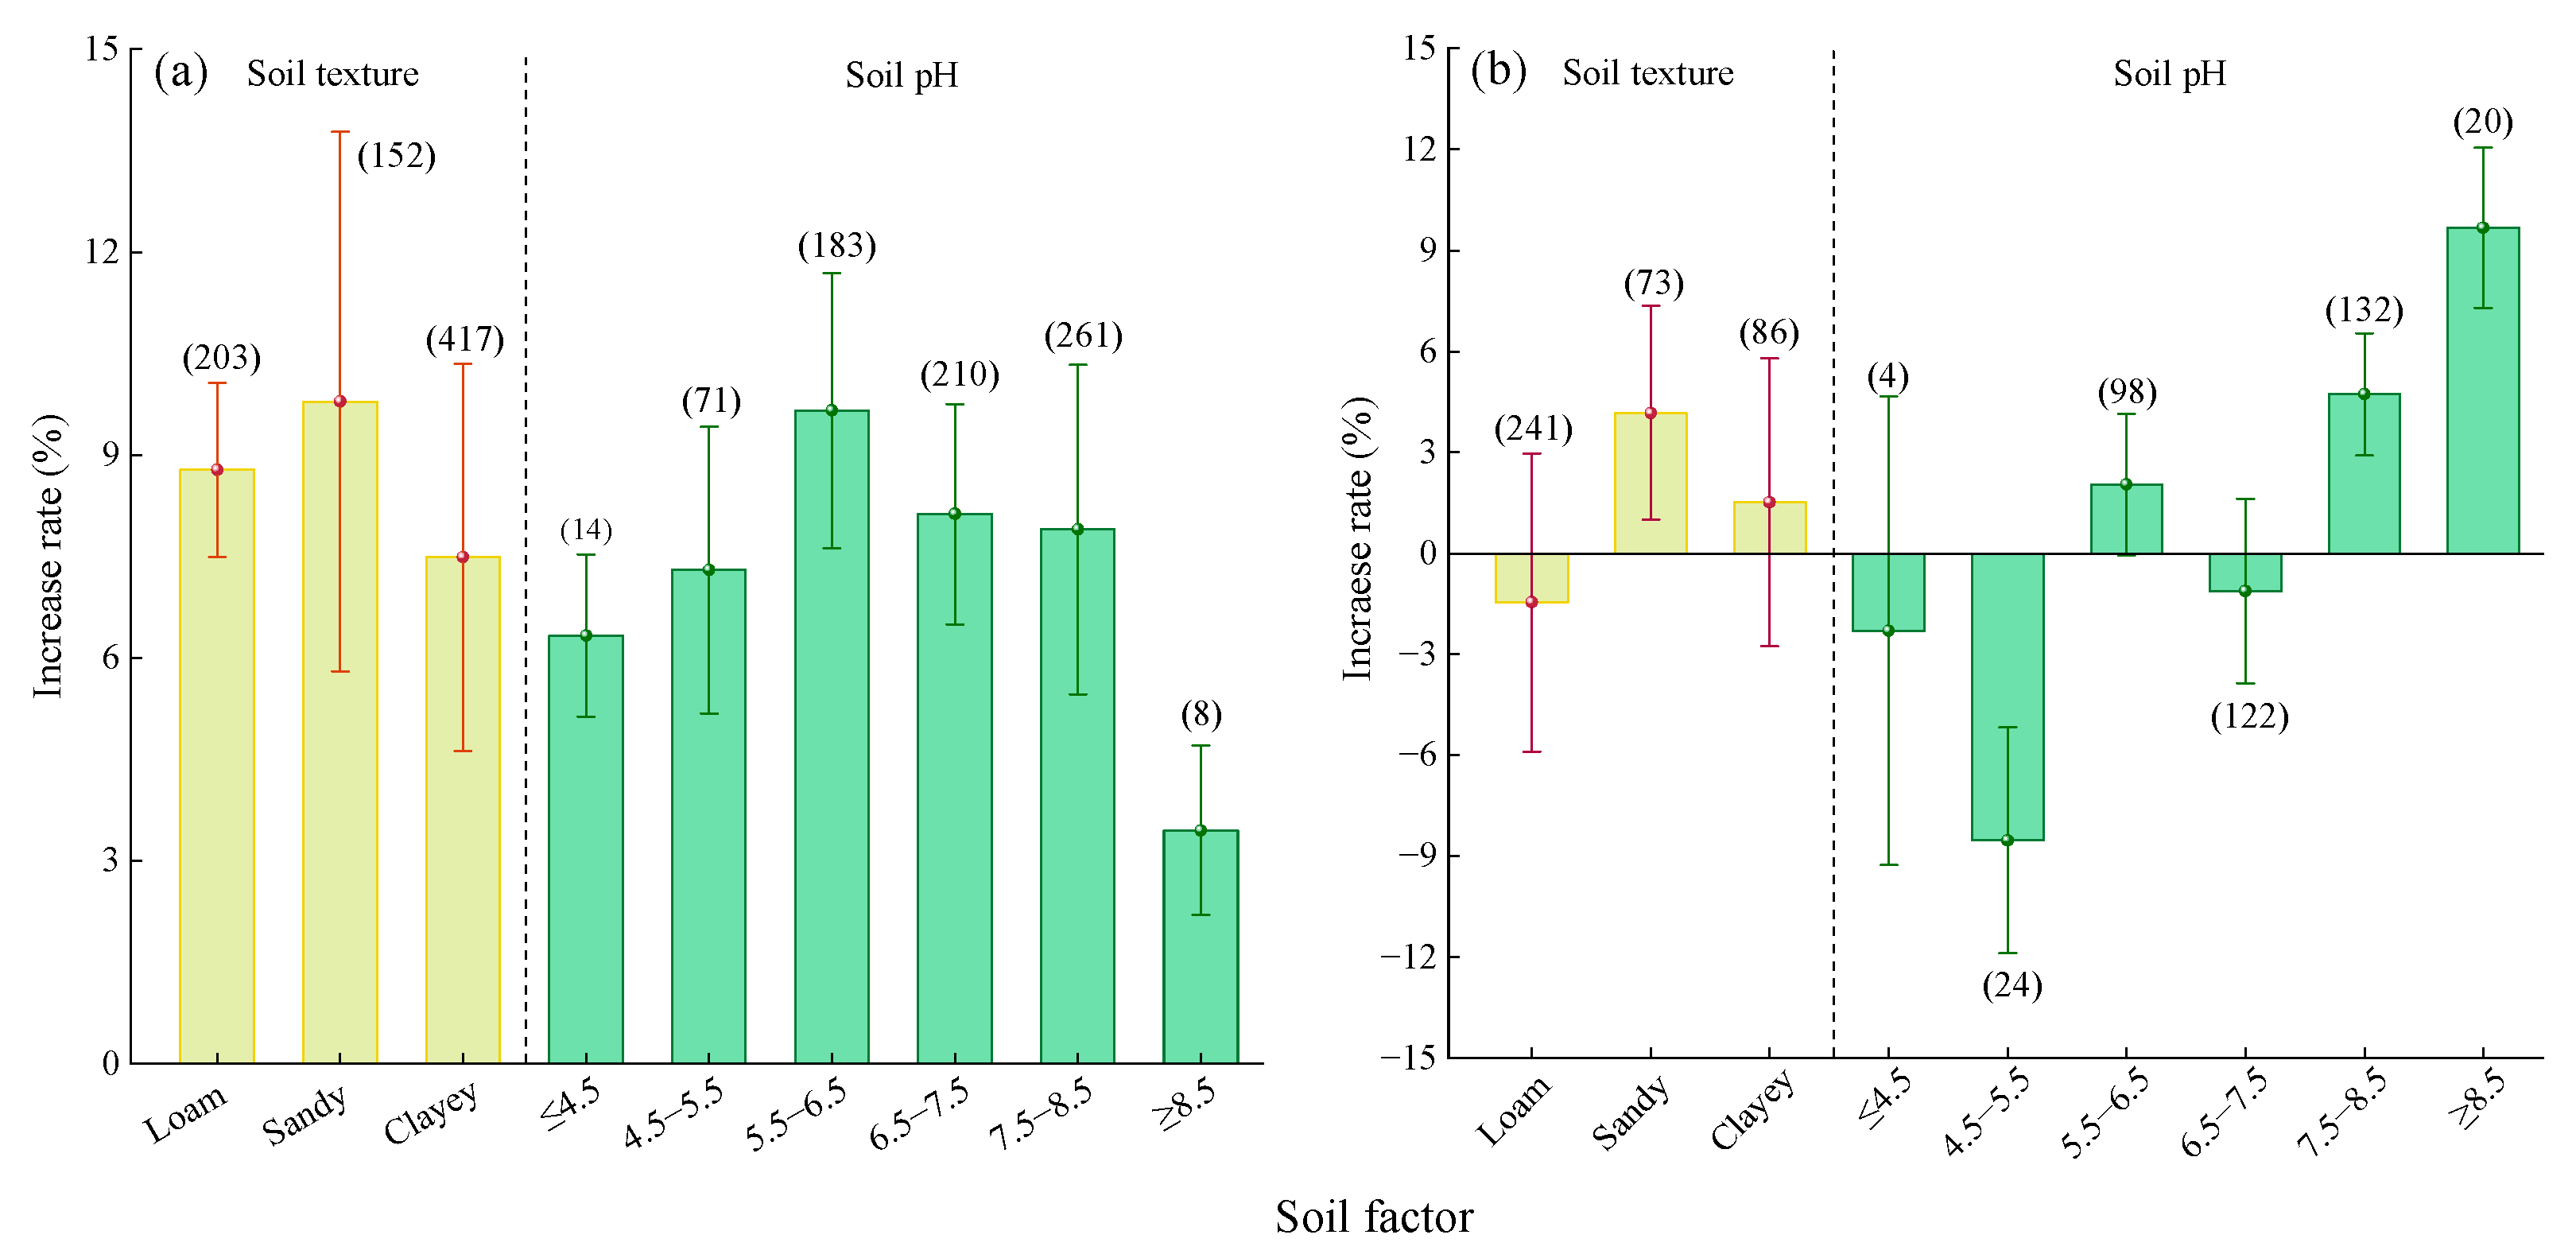
2.2.4. Soil Factor
2.2.5. Crop Type
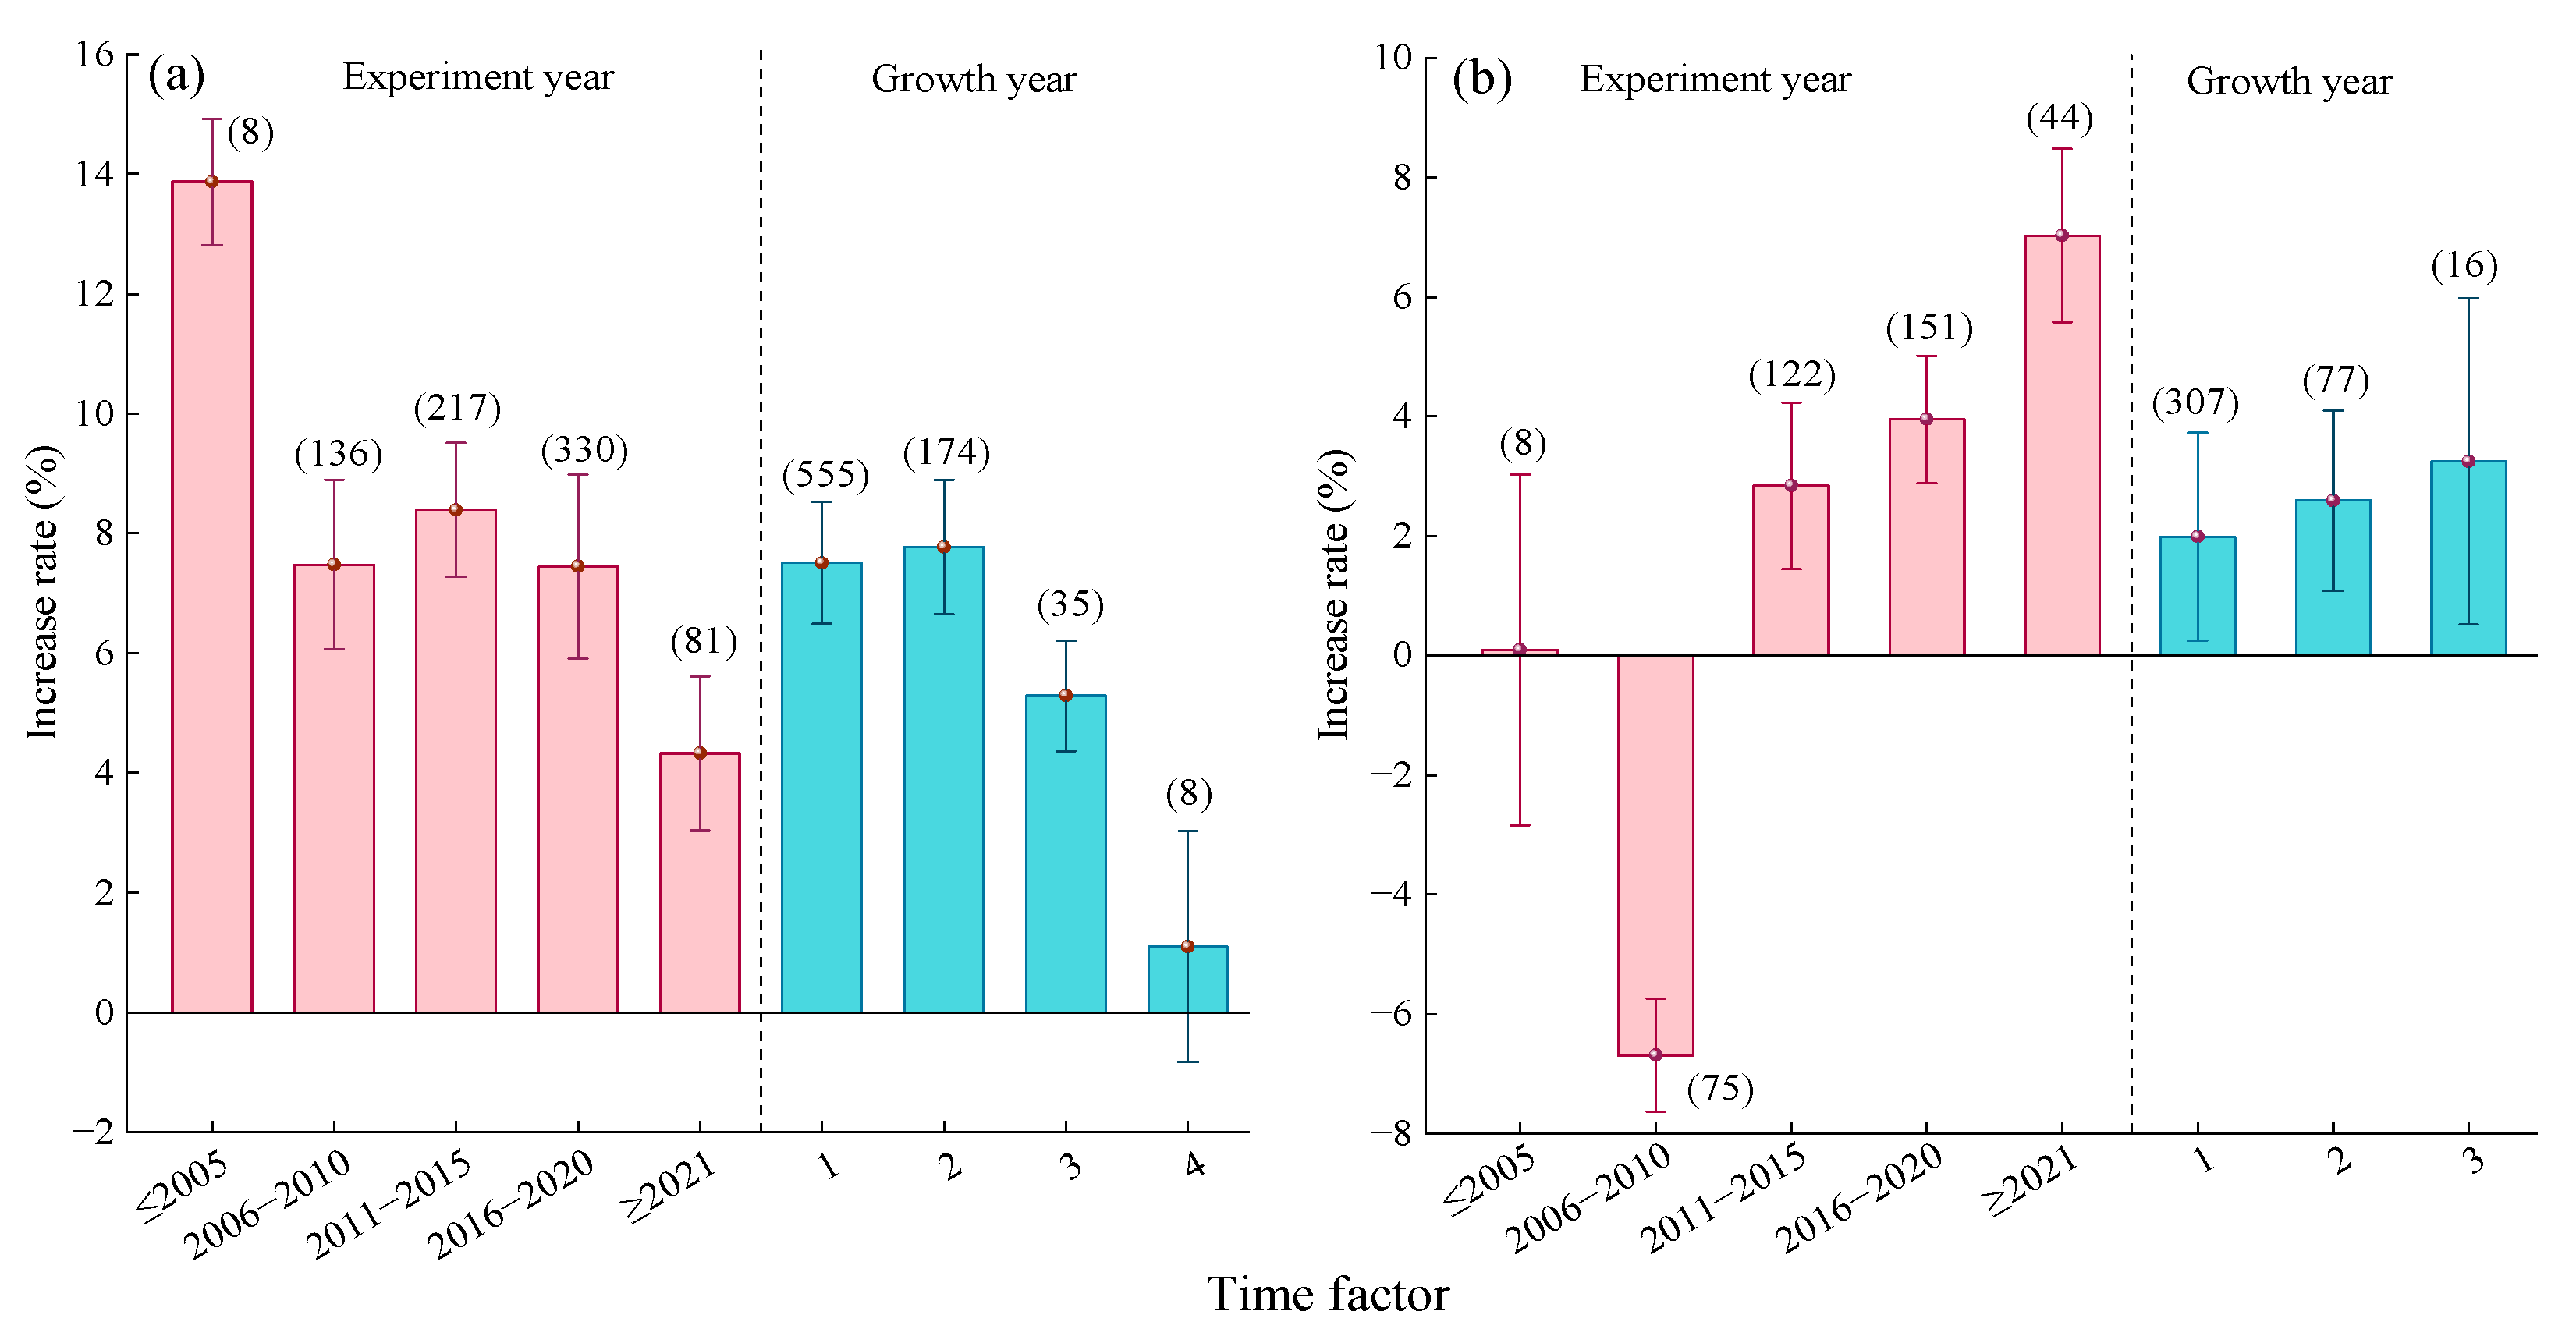
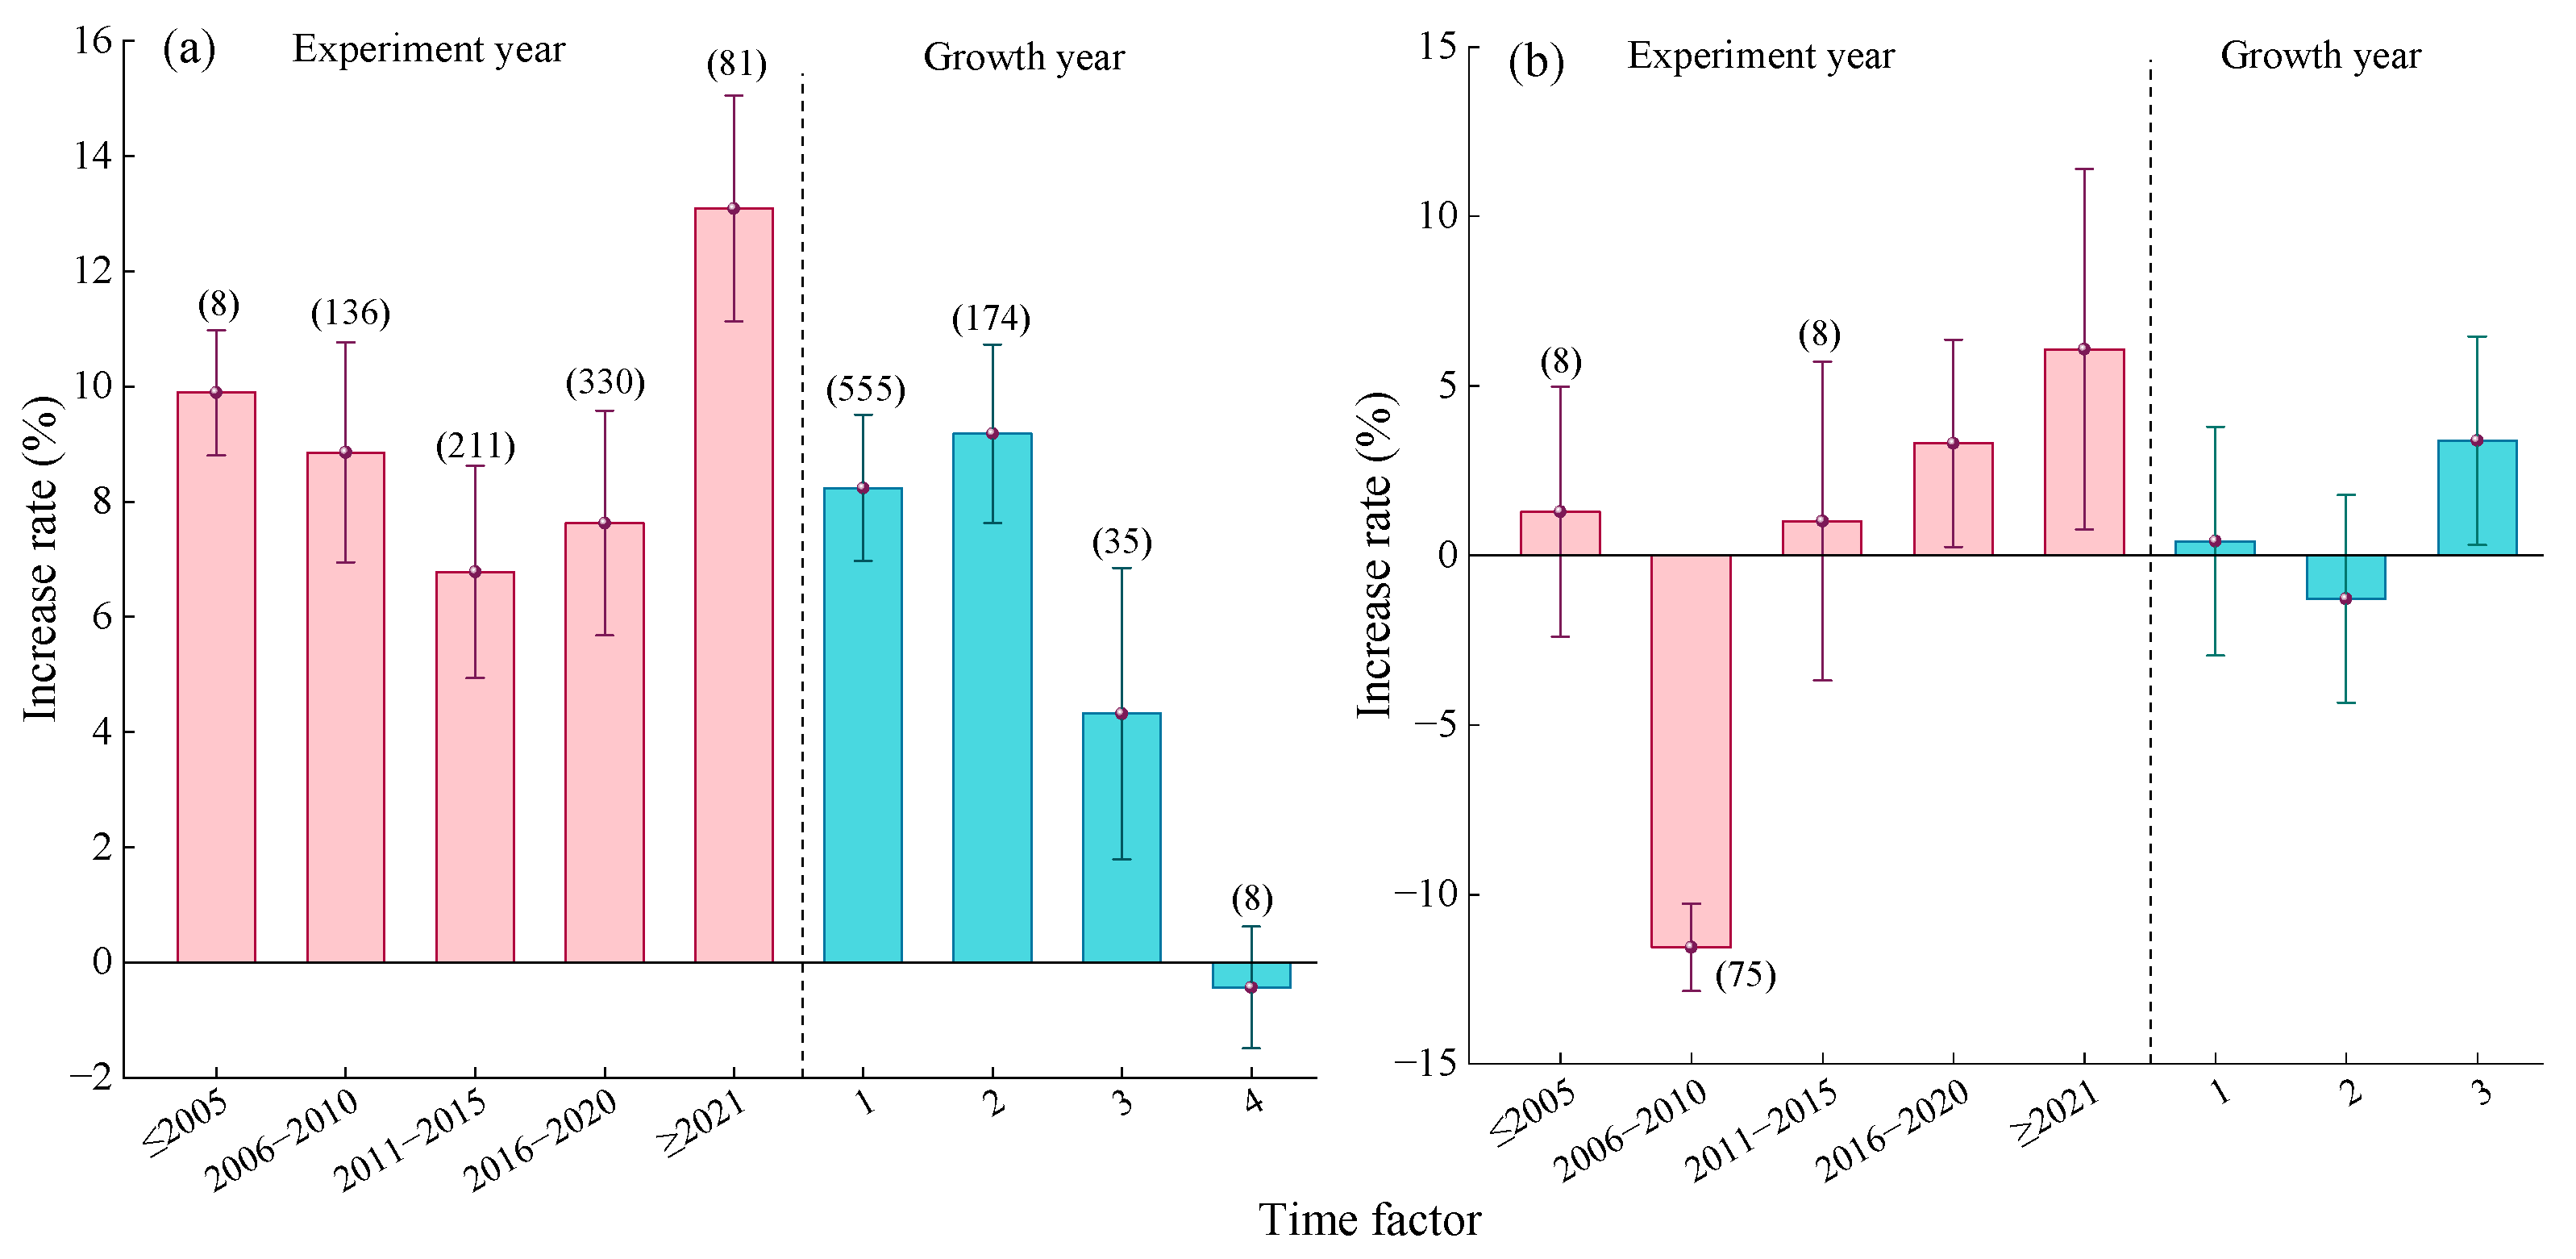
2.2.6. Time Factor
2.3. Analysis of Factors Affecting the Effects of MNF on Crop PFPN
2.3.1. Characteristics of Nitrogen Fertilizer
2.3.2. Nitrogen Fertilizer Management
2.3.3. Regional Factor
2.3.4. Soil Factor
2.3.5. Crop Type
2.3.6. Time Factor
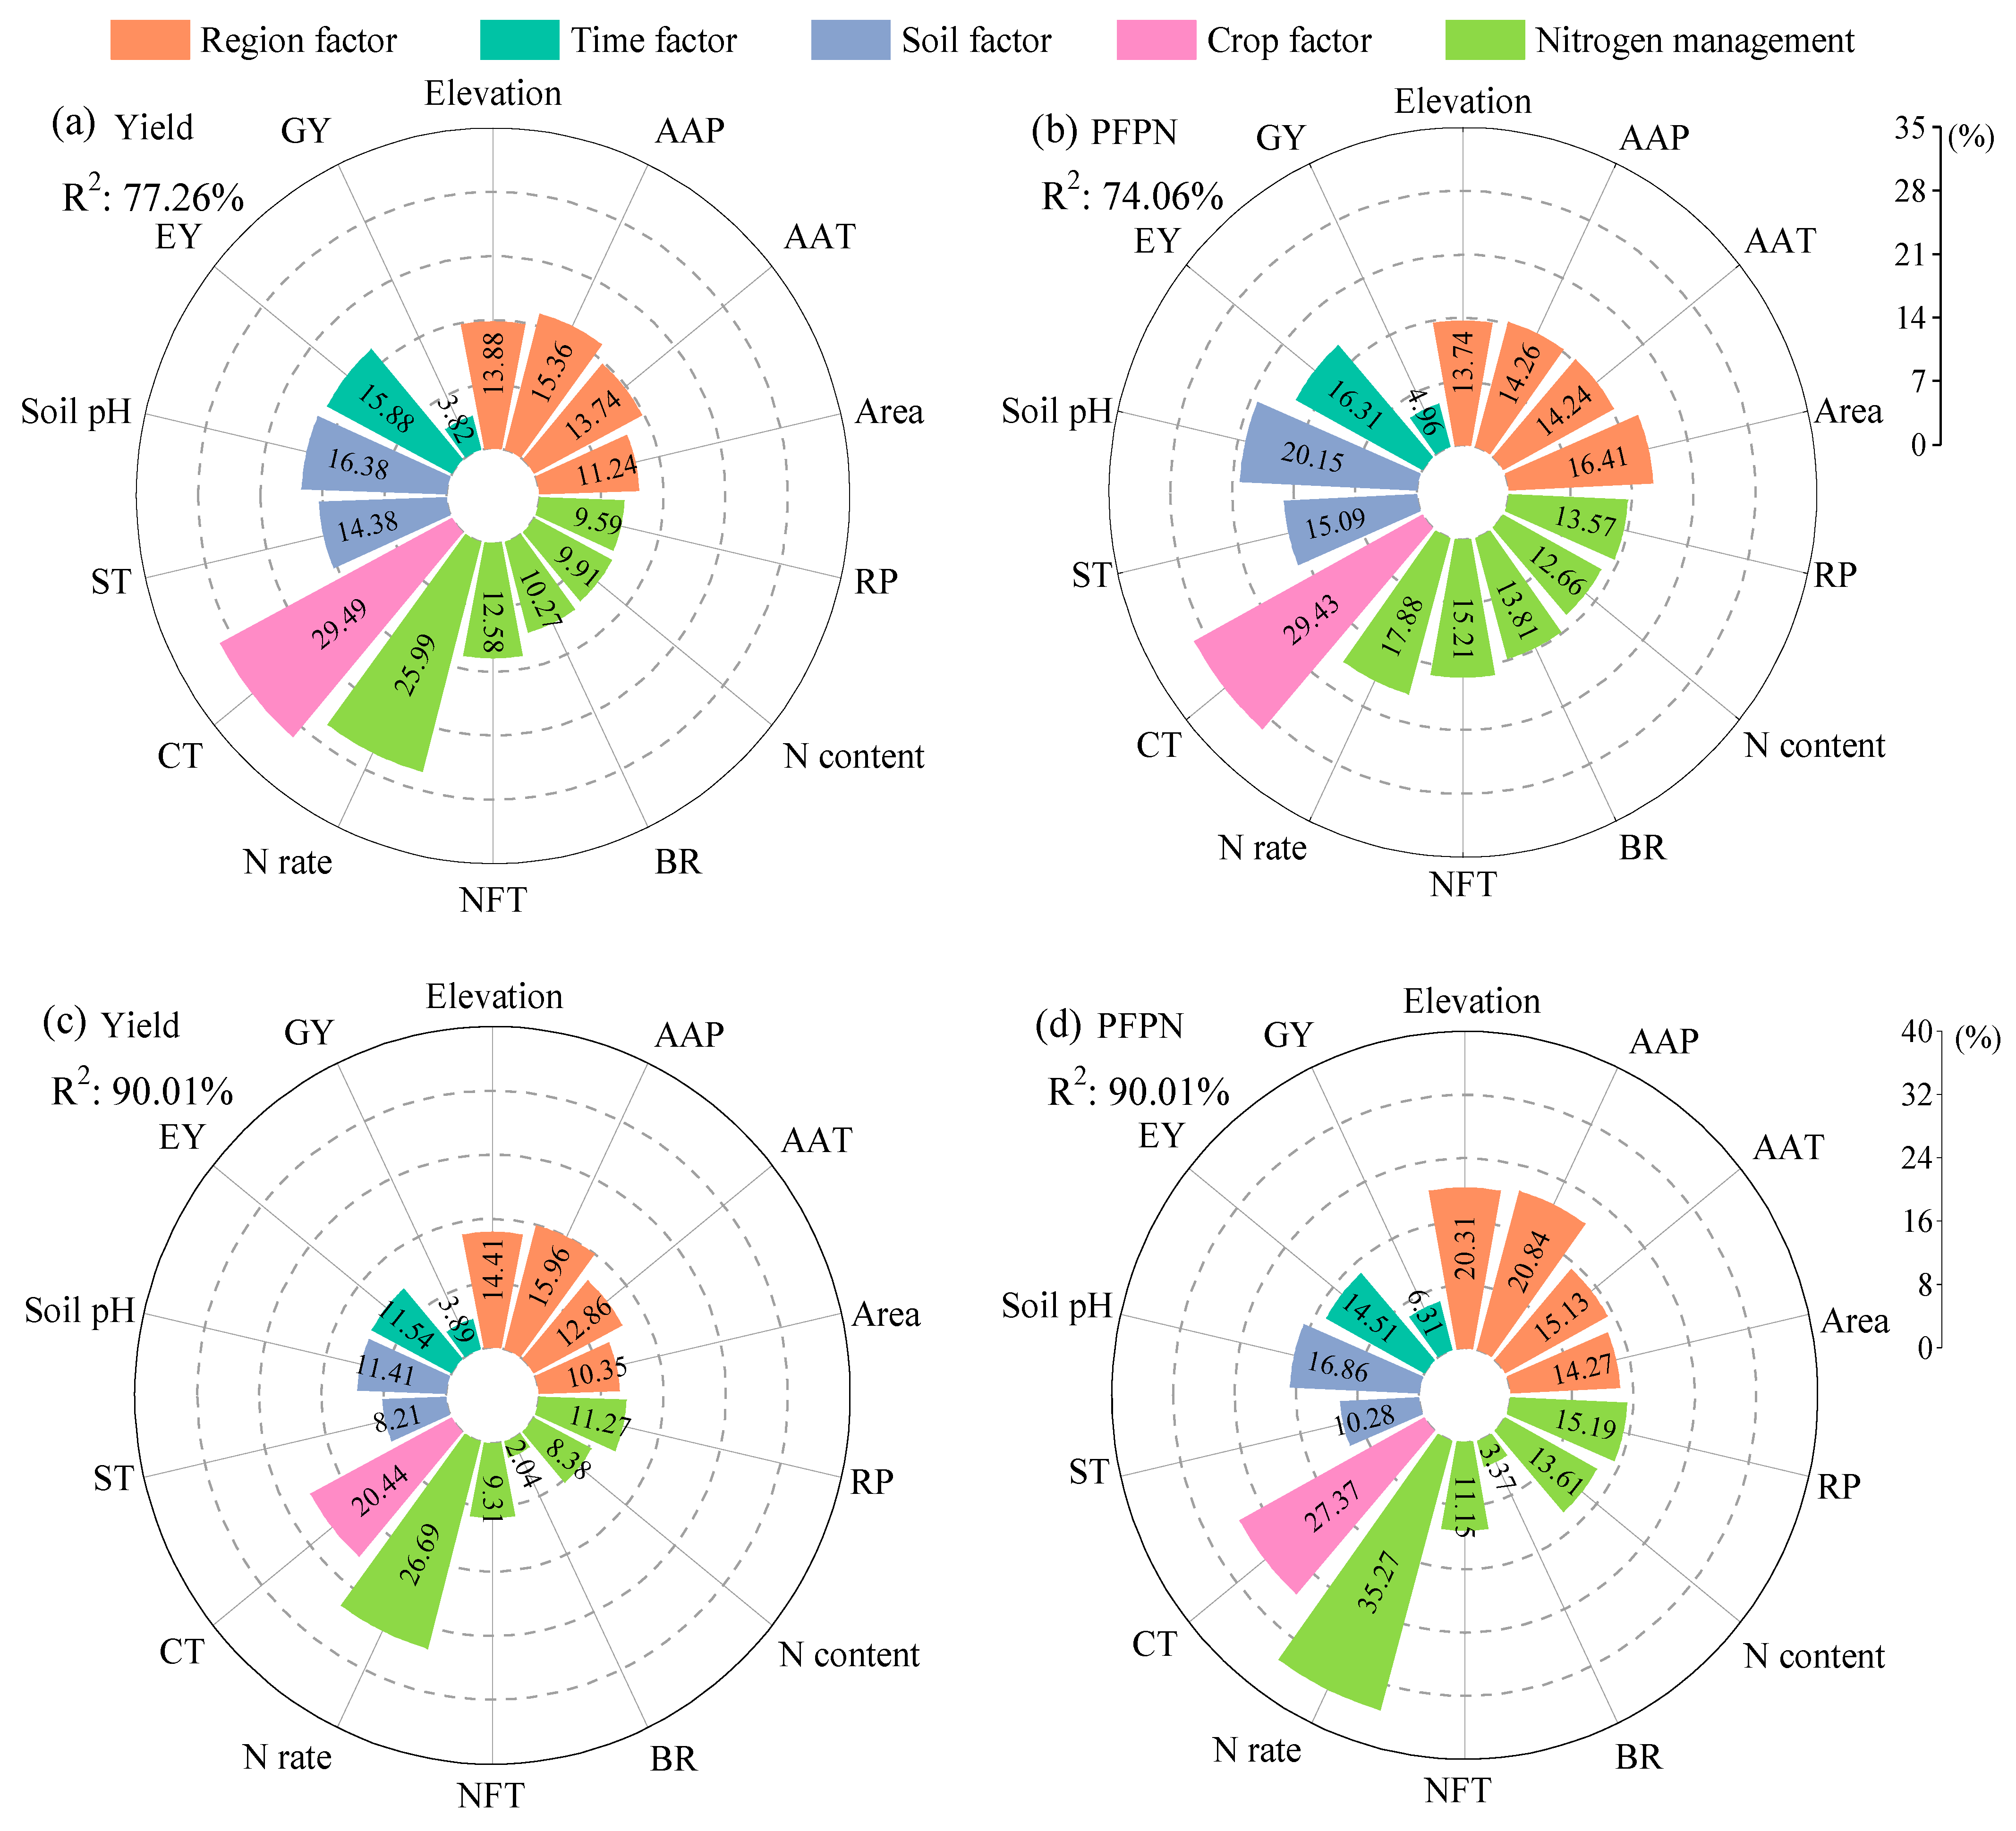
2.4. Analysis of the Importance of Factors Affecting Crop Yield and PFPN Under MNF
3. Discussion
3.1. Effects of MNF on Crop Yield and PFPN
3.2. Factors Affecting the Effects of MNF on Crop Yield and PFPN
3.2.1. Management Factor
3.2.2. Regional Factor
3.2.3. Soil Factor
3.2.4. Crop Type
3.2.5. Time Factor
3.3. Limitations and Future Directions
4. Materials and Methods
4.1. Data Sources and Screening
4.2. Data Classification
4.3. Data Analysis
4.3.1. Calculation of PFPN
4.3.2. Standard Deviation Calculation
4.3.3. Effect Size Calculation
4.3.4. Heterogeneity Test
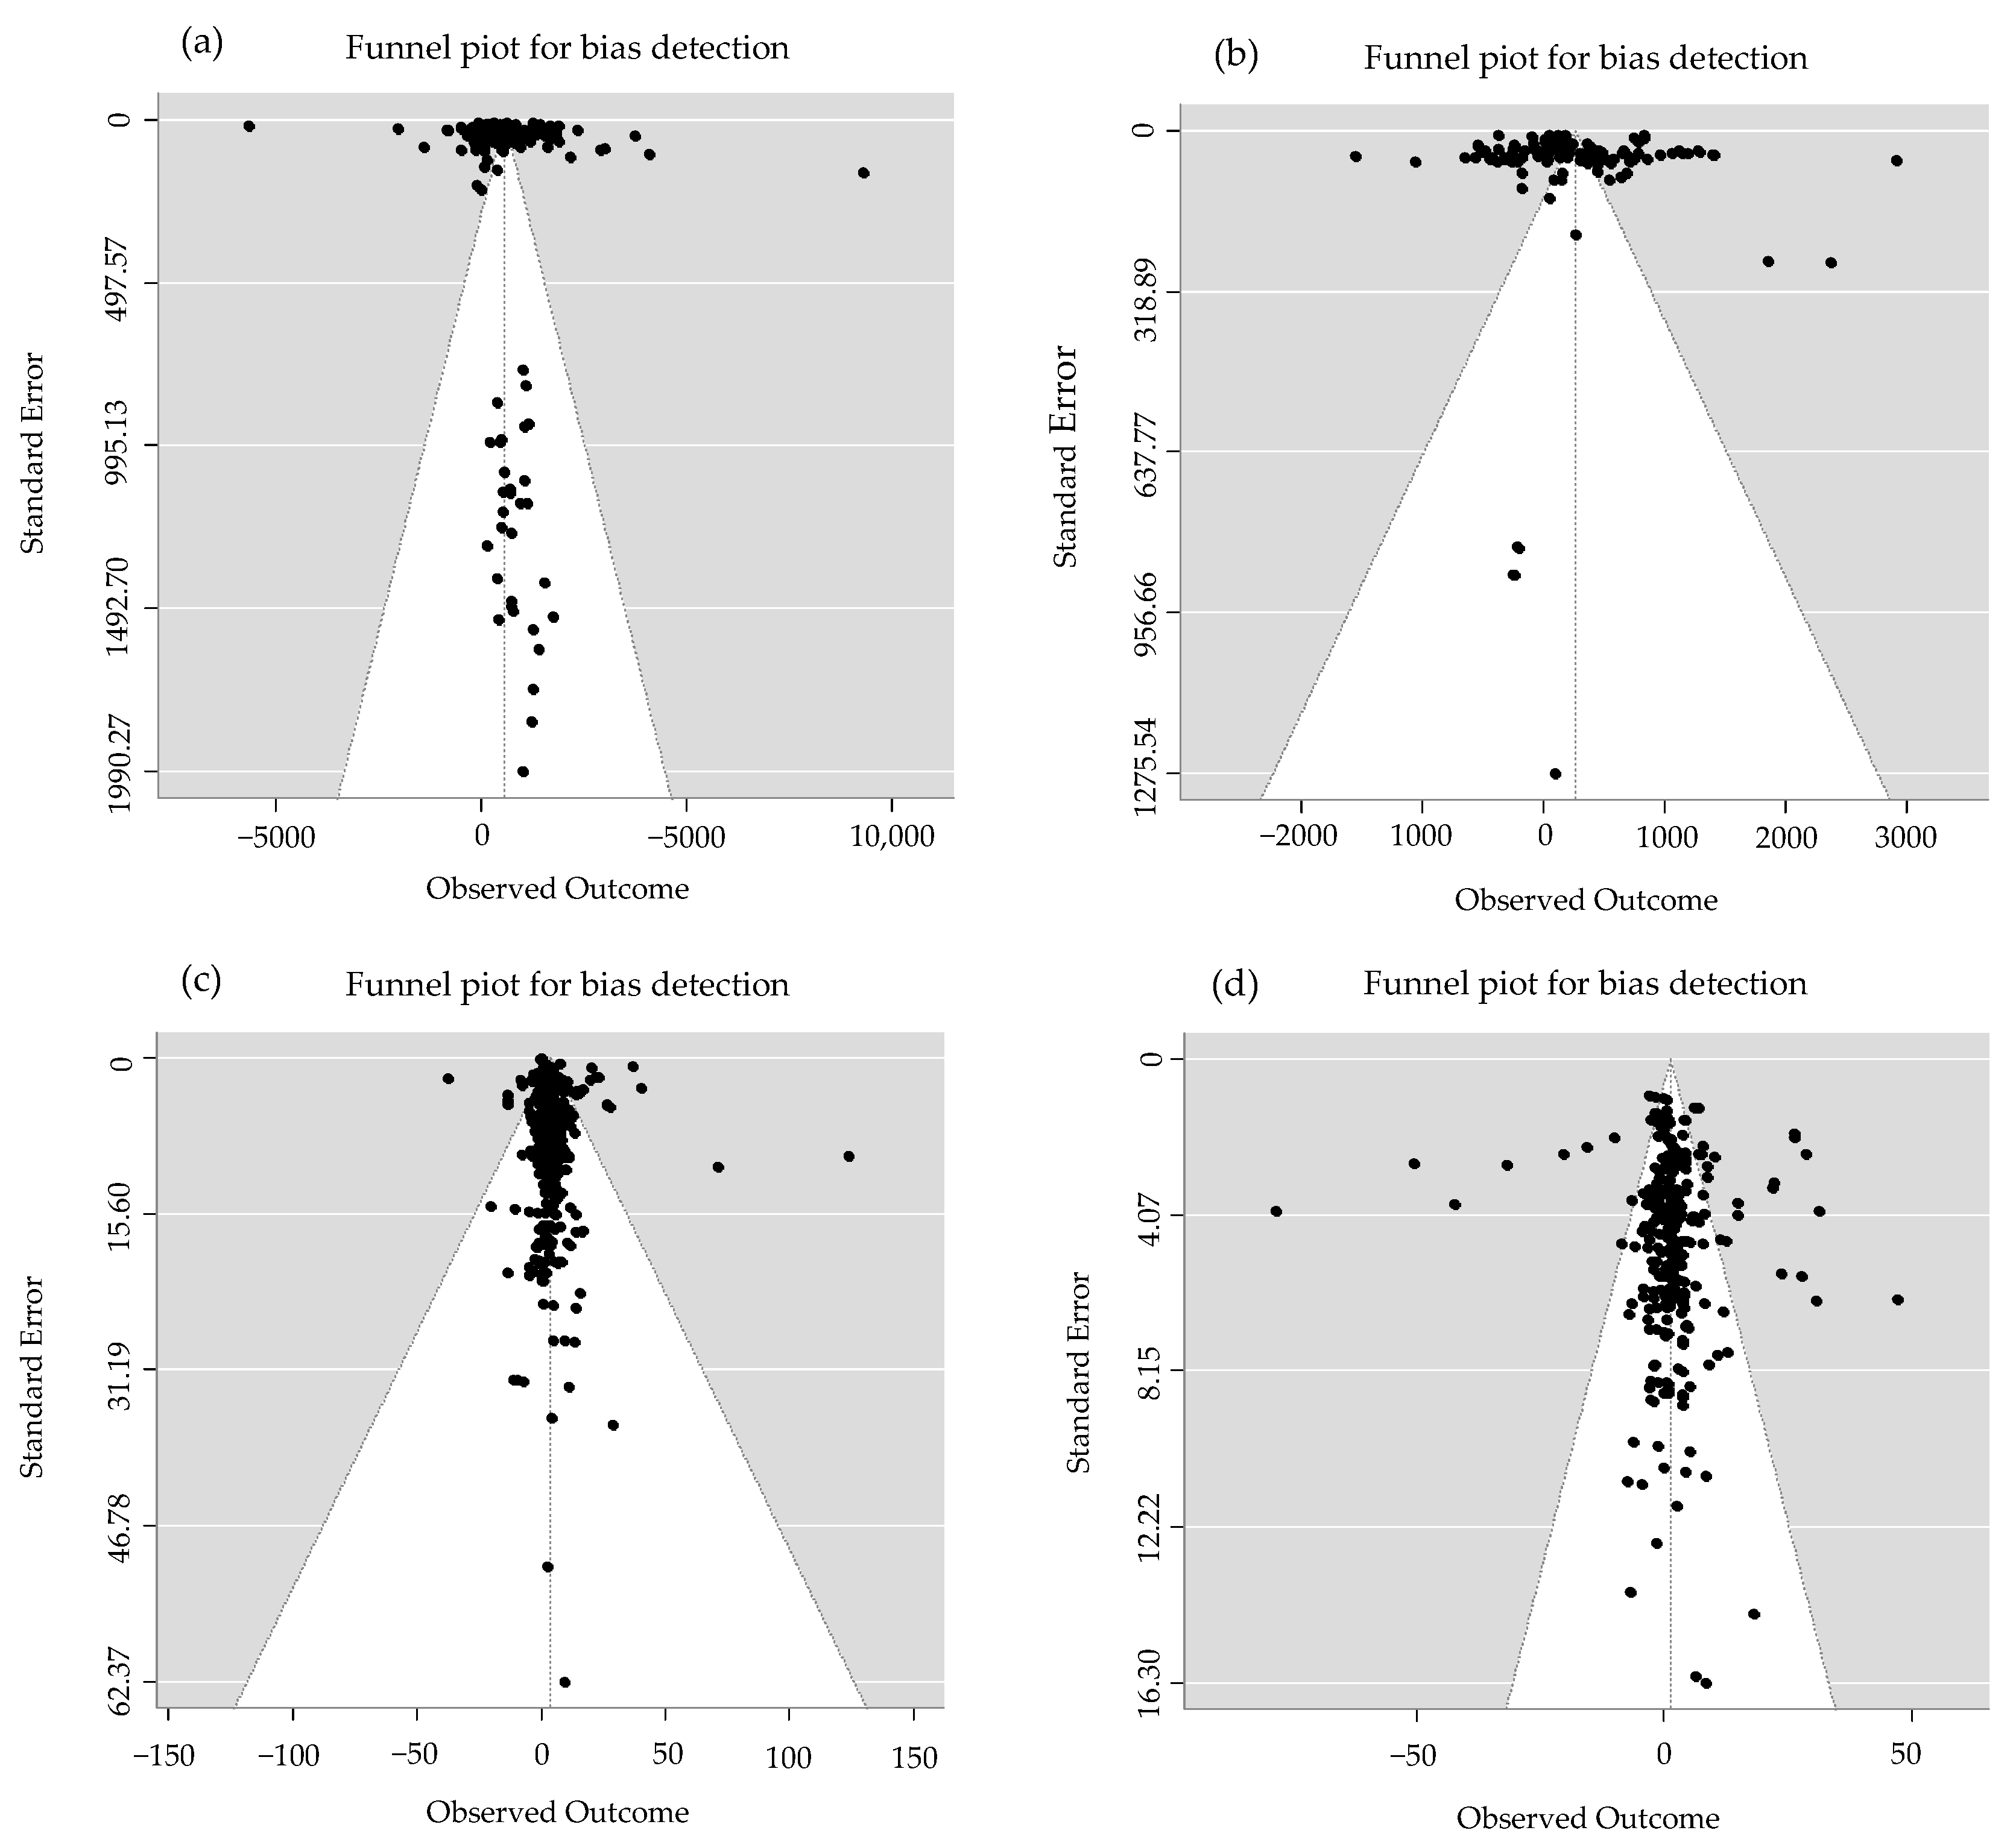
4.3.5. Publication Bias Test
4.3.6. Random Forest Model
4.4. Data Processing
5. Conclusions
Author Contributions
Funding
Data Availability Statement
Acknowledgments
Conflicts of Interest
References
- Cassman, K.G.; Dobermann, A. A nitrogen and the future of agriculture: 20 years on. Ambio 2022, 51, 17–24. [Google Scholar] [CrossRef]
- Rahman, M.S.; Ferdous, J.; Mumu, N.J.; Kamruzzaman, M.; Eckhardt, C.; Zaman, M.; Müller, C.; Jahangir, M.M.R. Crop residues integration with nitrogen rates reduces yield-scaled nitrous oxide emissions and improves maize yield and soil quality. J. Integr. Environ. Sci. 2024, 21, 2310856. [Google Scholar] [CrossRef]
- Gu, B.; Zhang, X.; Lam, S.K.; Yu, Y.; van Grinsven, H.J.M.; Zhang, S.; Wang, X.; Bodirsky, B.L.; Wang, S.; Duan, J.; et al. Cost-effective mitigation of nitrogen pollution from global croplands. Nature 2023, 613, 77–84, Erratum in Nature 2023, 614, E19. [Google Scholar] [CrossRef]
- Tyagi, J.; Ahmad, S.; Malik, M. Nitrogenous fertilizers: Impact on environment sustainability, mitigation strategies, and challenges. Int. J. Environ. Sci. Technol. 2022, 19, 11649–11672. [Google Scholar] [CrossRef]
- van Grinsven, H.J.M.; Ebanyat, P.; Glendining, M.; Gu, B.; Hijbeek, R.; Lam, S.K.; Lassaletta, L.; Mueller, N.D.; Pacheco, F.S.; Quemada, M.; et al. Establishing long-term nitrogen response of global cereals to assess sustainable fertilizer rates. Nat. Food 2022, 3, 122–132. [Google Scholar] [CrossRef] [PubMed]
- Jin, S.; Zhang, B.; Wu, B.; Han, D.; Hu, Y.; Ren, C.; Zhang, C.; Wei, X.; Wu, Y.; Mol, A.P.J.; et al. Decoupling livestock and crop production at the household level in China. Nat. Sustain. 2020, 4, 48–55. [Google Scholar] [CrossRef]
- Abdalla, M.; Hastings, A.; Cheng, K.; Yue, Q.; Chadwick, D.; Espenberg, M.; Truu, J.; Rees, R.M.; Smith, P. A critical review of the impacts of cover crops on nitrogen leaching, net greenhouse gas balance and crop productivity. Glob. Change Biol. 2019, 25, 2375–2392. [Google Scholar] [CrossRef]
- Li, W.; Xu, W.; Yin, G.; Zhang, X.; Zhang, Z.; Xi, B.; Lei, Q.; Zhai, L.; Zhang, Q.; Yang, L.; et al. Critical processes and major factors that drive nitrogen transport from farmland to surface water bodies. Front. Agric. Sci. Eng. 2023, 10, 541–552. [Google Scholar] [CrossRef]
- Jarupula, S.; Rakshit, A.; Patra, A.; Dutta, A.; Tripathi, V.K.; Mohapatra, K.K.; Tiwari, R.; Krishnamoorthi, S. Enhanced efficiency N fertilizers: An effective strategy to improve use efficiency and ecological sustainability. J. Soil Sci. Plant Nutr. 2023, 23, 1472–1488. [Google Scholar] [CrossRef]
- Xie, M.; Duan, H.; Kang, P.; Qiao, Q.; Bai, L. Toward an ecological civilization: China’s progress as documented by the second national general survey of pollution sources. Engineering 2021, 7, 1336–1341. [Google Scholar] [CrossRef]
- Northrup, D.L.; Basso, B.; Wang, M.Q.; Morgan, C.L.S.; Benfey, P.N. Novel technologies for emission reduction complement conservation agriculture to achieve negative emissions from row-crop production. Proc. Nati. Acad. Sci. USA 2021, 118, e2022666118. [Google Scholar] [CrossRef] [PubMed]
- Priya, E.; Sarkar, S.; Maji, P.K. A review on slow-release fertilizer: Nutrient release mechanism and agricultural sustainability. J. Environ. Chem. Eng. 2024, 12, 113211. [Google Scholar] [CrossRef]
- Shanmugavel, D.; Rusyn, I.; Solorzaferia, O.; Kamaraj, S. Sustainable smart fertilizers in agriculture systems: A review on fundamentals to in-field applications. Sci. Total Environ. 2023, 904, 166729. [Google Scholar] [CrossRef] [PubMed]
- Giroto, A.S.; Guimares, G.G.F.; Ribeiro, C. A novel, simple route to produce urea: Urea-formaldehyde composites for controlled release of fertilizers. J. Polym. Environ. 2018, 26, 2448–2458. [Google Scholar] [CrossRef]
- Yang, M.; Zhu, X.; Bai, Y.; Sun, D.; Zou, H.; Fang, Y.; Zhang, Y. Coated controlled-release urea creates a win-win scenario for producing more staple grains and resolving N loss dilemma worldwide. J. Clean. Prod. 2021, 288, 125660. [Google Scholar] [CrossRef]
- Liu, Y.; Stomph, T.J.; Zhang, F.; Li, C.; van der Werf, W. Nitrogen input strategies impact fertilizer nitrogen saving by intercropping: A global meta-analysis. Field Crop Res. 2024, 318, 109607. [Google Scholar] [CrossRef]
- Ali, M.F.; Han, R.; Li, X.; Wang, D. Controlled-release nitrogen combined with ordinary nitrogen fertilizer improved nitrogen uptake and productivity of winter wheat. Front. Plant Sci. 2025, 15, 1504083. [Google Scholar] [CrossRef]
- Liu, X.; Cui, Z.; Hao, T.; Yuan, L.; Zhang, Y.; Gu, B.; Xu, W.; Ying, H.; Zhang, W.; Li, T.; et al. A new approach to holistic nitrogen management in China. Front. Agric. Sci. Eng. 2022, 9, 490–510. [Google Scholar] [CrossRef]
- Thakur, M.P.; van der Putten, W.H.; Wilschut, R.A.; Veen, G.F.; Kardol, P.; van Ruijven, J.; Allan, E.; Roscher, C.; van Kleunen, M.; Bezemer, T.M. Plant-soil feedbacks and temporal dynamics of plant diversity–productivity relationships. Trends Ecol. Evol. 2021, 36, 651–661. [Google Scholar] [CrossRef]
- Kanter, D.R.; Chodos, O.; Nordland, O.; Rutigliano, M.; Winiwarter, W. Gaps and opportunities in nitrogen pollution policies around the world. Nat. Sustain. 2020, 3, 956–963. [Google Scholar] [CrossRef]
- Zhang, L.; Jia, X.; Zhao, Y.; Wang, H.; Peng, B.; Zhang, P.; Zhao, M. Integrated assessment of agronomic, environmental and ecosystem economic benefits of blending use of controlled-release and common urea in wheat production. J. Clean. Prod. 2021, 287, 125572. [Google Scholar] [CrossRef]
- Zhu, N.; Qian, Y.; Song, L.; Yu, Q.; Sheng, H.; Li, Y.; Zhu, X. Regulating leaf photosynthesis and soil microorganisms through controlled-release nitrogen fertilizer can effectively alleviate the stress of elevated ambient ozone on winter wheat. Int. J. Mol. Sci. 2024, 25, 9381. [Google Scholar] [CrossRef]
- Gao, Y.; Song, X.; Liu, K.; Li, T.; Zheng, W.; Wang, Y.; Liu, Z.; Zhang, M.; Chen, Q.; Li, Z.; et al. Mixture of controlled-release and conventional urea fertilizer application changed soil aggregate stability, humic acid molecular composition, and maize nitrogen uptake. Sci. Total Environ. 2021, 789, 147778. [Google Scholar] [CrossRef]
- Wei, Q.; Xu, J.; Liu, Y.; Wang, D.; Chen, S.; Qian, W.; He, M.; Chen, P.; Zhou, X.; Qi, Z. Nitrogen losses from soil as affected by water and fertilizer management under drip irrigation: Development, hotspots and future perspectives. Agric. Water Manag. 2024, 296, 108791. [Google Scholar] [CrossRef]
- Ghafoor, I.; Rahman, M.H.U.; Hasnain, M.U.; Ikram, R.M.; Khan, M.A.; Iqbal, R.; Hussain, M.I.; Sabagh, A.E. Effect of slow-release nitrogenous fertilizers on dry matter accumulation, grain nutritional quality, water productivity and wheat yield under an arid environment. Sci. Rep. 2022, 12, 14783. [Google Scholar] [CrossRef]
- Ren, W.; Li, X.; Liu, T.; Chen, N.; Xin, M.; Qi, Q.; Liu, B. Controlled-release fertilizer improved sunflower yield and nitrogen use efficiency by promoting root growth and water and nitrogen capacity. Ind. Crops Prod. 2025, 226, 120671. [Google Scholar] [CrossRef]
- Timofeeva, A.M.; Galyamova, M.R.; Sedykh, S.E. Plant growth-promoting bacteria of soil: Designing of consortia beneficial for crop production. Microorganisms 2023, 11, 2864. [Google Scholar] [CrossRef] [PubMed]
- Wang, M.; Ge, A.H.; Ma, X.; Wang, X.; Xie, Q.; Wang, L.; Song, X.; Jiang, M.; Yang, W.; Murray, J.D.; et al. Dynamic root microbiome sustains soybean productivity under unbalanced fertilization. Nat. Commun. 2024, 15, 1668. [Google Scholar] [CrossRef] [PubMed]
- Li, H.; Zhu, Y.; Wang, G.; Liu, R.; Huang, D.; Song, M.; Zhang, Y.; Wang, H.; Wang, Y.; Shao, R.; et al. Maize yield increased by matching canopy light and nitrogen distribution via controlled-release urea /urea adjustment. Field Crops Res. 2024, 308, 109284. [Google Scholar] [CrossRef]
- Zheng, C.; Li, C.; Tian, L.; Shen, Z.; Feng, G.; Hou, W.; Liu, F.; Gao, Q.; Wang, Y. Mixture of controlled-release and normal urea to improve maize root development, post-silking plant growth, and grain filling. Eur. J. Agron. 2023, 151, 126994. [Google Scholar] [CrossRef]
- Huang, Y.; Ji, Z.; Zhang, S.; Li, S. Function of hormone signaling in regulating nitrogen-use efficiency in plants. J. Plant Physiol. 2024, 294, 154191. [Google Scholar] [CrossRef]
- Liu, C.; Zhou, T.; Xue, Z.; Wei, C.; Zhu, K.; Ye, M.; Zhang, W.; Zhang, H.; Liu, L.; Wang, Z.; et al. Combining controlled-release and normal urea enhances rice grain quality and starch properties by improving carbohydrate supply and grain filling. Plants 2025, 14, 107. [Google Scholar] [CrossRef]
- Zou, Y.; Zhang, Y.; Cui, J.; Gao, J.; Guo, L.; Zhang, Q. Nitrogen fertilization application strategies improve yield of the rice cultivars with different yield types by regulating phytohormones. Sci. Rep. 2023, 13, 21803. [Google Scholar] [CrossRef]
- Xu, X.; Ma, F.; Zhou, J.; Du, C. Control-released urea improved agricultural production efficiency and reduced the ecological and environmental impact in rice-wheat rotation system: A life-cycle perspective. Field Crops Res. 2022, 278, 108445. [Google Scholar] [CrossRef]
- Guo, Y.; Chen, Y.; Searchinger, T.D.; Zhou, M.; Pan, D.; Yang, J.; Wu, L.; Cui, Z.; Zhang, W.; Zhang, F.; et al. Air quality, nitrogen use efficiency and food security in China are improved by cost-effective agricultural nitrogen management. Food. Nat. 2020, 1, 648–658. [Google Scholar] [CrossRef] [PubMed]
- Bandare, W.B.M.A.C.; Sakai, K.; Anan, M.; Nakamura, S.; Setouchi, H.; Noborio, K.; Kali, T.; Rathnappriya, R.H.K. N2O emissions from controlled-release and conventional N-fertilizers applied to red-yellow soil in Okinawa, Japan. Soil Tillage Res. 2025, 248, 106376. [Google Scholar] [CrossRef]
- Ting, L.; Zhang, H.; Han, Y.; Deng, O.; Tang, X.; Luo, L.; Zeng, J.; Chen, G.; Wang, C.; Gao, X. Regulating CH4, N2O, and NO emissions from an alkaline paddy field under rice-wheat rotation with controlled release N fertilizer. Environ. Sci. Pollut. Res. 2021, 28, 18246–18259. [Google Scholar] [CrossRef]
- Stein, Y.L. The Long-Term Relationship between Microbial Metabolism and Greenhouse Gases. Trends Microbiol. 2020, 28, 500–511. [Google Scholar] [CrossRef] [PubMed]
- Hu, Y.; Zhang, F.; Javed, H.H.; Peng, X.; Chen, H.; Tang, W.; Lai, Y.; Wu, Y. Controlled-release nitrogen mixed with common nitrogen fertilizer can maintain high yield of rapeseed and improve nitrogen utilization efficiency. Plants 2023, 12, 4105. [Google Scholar] [CrossRef]
- Zhang, G.; Liu, S.; Wang, X.; Wang, X.; Zhang, Y.; Zhao, D.; Wen, X.; Han, J.; Liao, Y. Mixed application of controlled-release urea and normal urea can improve crop productivity and reduce the carbon footprint under straw return in winter wheat-summer maize cropping system. Eur. J. Agron. 2023, 151, 127002. [Google Scholar] [CrossRef]
- Farmaha, B.S.; Sims, A.L. The influence of polymer-coated urea and urea fertilizer mixtures on spring wheat protein concentrations and economic returns. Agron. J. 2013, 105, 1328–1334. [Google Scholar] [CrossRef]
- Xue, H.; Zheng, X.; Wei, H.; Yang, J.; Alva, A.; Fan, M.; Zhang, Z. Benefits of controlled-release fertilizers for potato sustainable nitrogen management. Front. Environ. Sci. 2024, 12, 1381054. [Google Scholar] [CrossRef]
- Houlton, B.Z.; Almaraz, M.; Aneja, V.; Austin, A.T.; Bai, E.; Cassman, K.G.; Compton, J.E.; Davidson, E.A.; Erisman, J.W.; Galloway, J.N.; et al. A world of co-benefits: Solving the global nitrogen challenge. Earth’s Future 2019, 7, 865–872. [Google Scholar] [CrossRef]
- Zhang, L.; Jia, X.; Zhao, Y.; Wang, H.; Peng, B.; Zhang, P.; Zhao, M. Spatio-temporal characteristics and driving mechanism of land degradation sensitivity in Northwest China. Sci. Total Environ. 2024, 918, 170403. [Google Scholar] [CrossRef]
- Zou, H.; Ba, C.; Hou, Z.; Guo, N.; Yang, M.; Sun, D. How optimizing application of coated controlled-release urea affects crop yield in China. Agron. J. 2022, 114, 991–999. [Google Scholar] [CrossRef]
- Trinh, T.H.; Kushaari, K.; Shulb, A.S.; Ismail, L.; Azeem, B. Modeling the release of nitrogen from controlled release fertilizer: Constant and decay release. Biosyst. Eng. 2015, 130, 34–42. [Google Scholar] [CrossRef]
- Zhang, G.; Zhao, D.; Liu, S.; Liao, Y.; Han, J. Can controlled-release urea replace the split application of normal urea in China? A meta-analysis based on crop grain yield and nitrogen use efficiency. Field Crops Res. 2022, 275, 108343. [Google Scholar] [CrossRef]
- Yu, Z.; Wang, R.; Yao, Y.; Wang, X.; He, J.; Yang, Y. Effects of controlled-release nitrogen fertilizer at different release stages on rice yield and quality. Agronomy 2024, 14, 1685. [Google Scholar] [CrossRef]
- Fan, Z.; Chen, J.; Zhai, S.; Ding, X.; Zhang, H.; Sun, S.; Tian, X. Optimal blends of controlled-release urea and conventional urea improved nitrogen use efficiency in wheat and maize with reduced nitrogen application. J. Soil Sci. Plant Nutr. 2021, 21, 1103–1111. [Google Scholar] [CrossRef]
- Zhang, S.; Shen, T.; Yang, Y.; Li, Y.C.; Wan, Y.; Zhang, M.; Tang, Y.; Allen, S.C. Controlled-release urea reduced nitrogen leaching and improved nitrogen use efficiency and yield of direct-seeded rice. J. Environ. Manag. 2018, 220, 191–197. [Google Scholar] [CrossRef]
- Liu, H.; Lei, F.; Li, D.; Yang, H.; Luo, W.; Zhu, Z.; Hu, X.; Lin, Q. Evaluation of nitrogen release characteristics and enhanced efficiency of a novel synthetic slow-release nitrogen fertilizer. J. Soil Sci. Plant Nutr. 2023, 23, 5671–5682. [Google Scholar] [CrossRef]
- Jiang, S.; Nnaemeka, E.O.; Zhang, L.; Tang, X.; Du, B. Higher nitrogen application during rice growth increased yield and the biosynthesis of 2-acetyl-1-pyrroline under low light conditions. Field Crops Res. 2023, 293, 108846. [Google Scholar] [CrossRef]
- Zheng, K.; He, J.; Li, H.; Wang, Q.; Li, W. Meta-analysis on maize and wheat yield under subsoiling in Northern China. Trans. Chin. Soc. Agric. Eng. 2015, 31, 7–15. (In Chinese) [Google Scholar]
- Yang, W.; Long, D.; Scanlon, B.R.; Burek, P.; Zhang, C.; Han, Z.; Butler, J.J.; Pan, Y.; Lei, X.; Wada, Y. Human intervention will stabilize groundwater storage across the north China plain. Water Resour. Res. 2022, 58, e2021WR030884. [Google Scholar] [CrossRef]
- Meng, Y.; Ma, W.; Yao, X.; Sun, Y.; Zhong, X.; Huang, S.; Weng, Q.; Liu, Y.; Yuan, J. Study on the response factors of maize yield to nitrogen fertilizer. J. Agric. Sci. Technol. 2023, 25, 153–160. (In Chinese) [Google Scholar] [CrossRef]
- Zhu, Y.; Yin, J.; Ma, Z.; Yang, Y. Effect of organic fertilizer replacing nitrogen fertilizer on major grain yield in China. Environ, Sci. 2025, 46, 478–488. (In Chinese) [Google Scholar] [CrossRef]
- Kyaw, Y.; Nguyen, T.P.L.; Winijkul, E.; Xue, W.; Virdis, S.G.P. The effect of climate variability on cultivated Crops’ yield and farm income in Chiang Mai Province, Thailand. Climate 2023, 11, 204. [Google Scholar] [CrossRef]
- Ishaque, W.; Osman, R.; Hafiza, B.S.; Malghani, S.; Zhao, B.; Xu, M.; Ata-Ul-Karim, S.T. Quantifying the impacts of climate change on wheat phenology, yield, and evapotranspiration under irrigated and rainfed conditions. Agric. Water Manag. 2023, 275, 108017. [Google Scholar] [CrossRef]
- Rezaei, E.E.; Webber, H.; Asseng, S.; Boote, K.; Durand, J.L.; Ewert, F.; Martre, P.; MacCarthy, D.S. Climate change impacts on crop yields. Nat. Rev. Earth Environ. 2023, 4, 831–846. [Google Scholar] [CrossRef]
- Jiang, Z.; Yang, S.; Chen, X.; Pang, Q.; Xu, Y.; Qi, S.; Yu, W.; Dai, H. Controlled release urea improves rice production and reduces environmental pollution: A research based on meta-analysis and machine learning. Environ. Sci. Pollut. Res. 2022, 29, 3587–3599. [Google Scholar] [CrossRef]
- Qin, W.; Niu, L.; You, Y.; Cui, S.; Chen, C.; Li, Z. Effects of conservation tillage and straw mulching on crop yield, water use efficiency, carbon sequestration and economic benefits in the Loess Plateau region of China: A meta-analysis. Soil Tillage Res. 2024, 238, 106025. [Google Scholar] [CrossRef]
- Bhandari, A.K.; Baunthiyal, M.; Bisht, V.K.; Kaim, J.C.; Negi, B.S. Baseline information on physico-taxonomical characteristics of Amomum subulatum roxb. cultivars grown in Uttarakhand, India. Natl. Acad. Sci. Lett. 2020, 43, 655–658. [Google Scholar] [CrossRef]
- Zhao, S.; Xu, X.; Qiu, S.; He, P. Response of wheat and maize yields to different tillage practices across China: A meta-analysis. Eur. J. Agron. 2023, 144, 126753. [Google Scholar] [CrossRef]
- Li, G.; Cheng, G.; Lu, W.; Lu, D. Differences of yield and nitrogen use efficiency under different applications of slow release fertilizer in spring maize. J. Int. Agric. 2021, 20, 554–564. [Google Scholar] [CrossRef]
- Feng, J.; Li, F.; Deng, A.; Feng, X.; Fang, F.; Zhang, W. Integrated assessment of the impact of enhanced-efficiency nitrogen fertilizer on N2O emission and crop yield. Agric. Ecosyst. Environ. 2016, 231, 218–228. [Google Scholar] [CrossRef]
- Qiao, Y.; Yue, G.; Mo, X.; Sun, S. Controlled-release urea derived from various coating materials on the impacts of maize production: A meta-analysis. Ind. Crops Prod. 2025, 225, 120485. [Google Scholar] [CrossRef]
- Zhang, Y.; Ren, W.; Zhu, K.; Fu, J.; Wang, W.; Wang, Z.; Gu, J.; Yang, J. Substituting readily available nitrogen fertilizer with controlled-release nitrogen fertilizer improves crop yield and nitrogen uptake while mitigating environmental risks: A global meta-analysis. Field Crops Res. 2024, 306, 109221. [Google Scholar] [CrossRef]
- Linquist, B.A.; Liu, L.; van Kessel, C.; van Groenigen, K.J. Enhanced efficiency nitrogen fertilizers for rice systems: Meta-analysis of yield and nitrogen uptake. Field Crops Res. 2013, 154, 246–254. [Google Scholar] [CrossRef]
- Yuan, J.; Liang, X.; Li, L.; Ye, Y.; Fu, C.; Song, Q. Response of rice yield and nitrogen uptake to enhanced efficiency nitrogen fertilizer in China: A meta-analysis. Sci. Agric. Sin. 2014, 47, 3414–3423. (In Chinese) [Google Scholar] [CrossRef]
- Cordeiro, C.F.; Rodrigues, D.R.; Echer, F.R. Cover crops and controlled-release urea decrease need for mineral nitrogen fertilizer for cotton in sandy soil. Field Crops Res. 2022, 276, 108387. [Google Scholar] [CrossRef]
- Xu, Z.; Li, C.; Zhang, C.; Yu, Y.; van der Werf, W.; Zhang, F. Intercropping maize and soybean increases efficiency of land and fertilizer nitrogen use; a meta-analysis. Field Crops Res. 2020, 246, 107661. [Google Scholar] [CrossRef]
- Yu, Z.; Liu, J.; Kattel, G. Historical nitrogen fertilizer use in China from 1952 to 2018. Earth Syst. Sci. 2022, 14, 5179–5194. [Google Scholar] [CrossRef]
- Dai, Z.; Su, W.; Chen, H.; Barberán, A.; Zhao, H.; Yu, M.; Yu, L.; Brookes, P.C.; Schadt, C.W.; Chang, S.X.; et al. Long-term nitrogen fertilization decreases bacterial diversity and favors the growth of actinobacteria and proteobacteria in agro-ecosystems across the globe. Glob. Chang. Biol. 2018, 24, 3452–3461. [Google Scholar] [CrossRef]
- Tian, X.; Zhang, C.; Ju, X. Crop responses to application of optimum nitrogen fertilizers on soils of various fertilities formed from long-term fertilization regimes. Eur. J. Agron. 2023, 148, 126857. [Google Scholar] [CrossRef]
- Su, N.; Ronga, X.; Xie, G.; Chang, T.; Zhang, Y.; Peng, J.; Luo, G. Effectiveness of a 10-year continuous reduction of controlled-release nitrogen fertilizer on production, nitrogen loss and utilization of double-cropping rice. Sci. Total Environ. 2024, 912, 168857. [Google Scholar] [CrossRef]
- GB/T 23348-2009; Slow-Release Nitrogen Fertilizer. Standardization Administration of the People’s Republic of China: Beijing, China, 2009.
- HG/T 4215-2011; Controlled-release Nitrogen Fertilizer. Ministry of Industry and Information Technology of the People’s Republic of China: Beijing, China, 2011.
- Lü, H.; Wang, X.; Pan, Z.; Zhao, S. Assessment of the crucial factors influencing the responses of ammonia and nitrous oxide emissions to controlled release nitrogen fertilizer: A meta-analysis. J. Int. Agric. 2023, 22, 3549–3559. [Google Scholar] [CrossRef]
- Yang, M.; Guo, N.; Zhang, J.; Hou, Z.; Chen, Z.; Sun, D.; Zou, H. Enhanced-efficiency nitrogen fertilizer provides a reliable option for mitigating global warming potential in agroecosystems worldwide. Sci. Total Environ. 2024, 907, 168080. [Google Scholar] [CrossRef]
- Liu, Y.; Ma, C.; Li, G.; Jiang, Y.; Hou, P.; Xue, L.; Yang, L.; Ding, Y. Lower dose of controlled/slow release fertilizer with higher rice yield and N utilization in paddies: Evidence from a meta-analysis. Field Crops Res. 2023, 294, 108879. [Google Scholar] [CrossRef]
- Zhang, L.; Meng, F.; Zhang, X.; Gao, Q.; Yan, L. Optimum management strategy for improving maize water productivity and partial factor productivity for nitrogen in China: A meta-analysis. Agric. Water Manag. 2024, 303, 109043. [Google Scholar] [CrossRef]


| Index | Treatment | Model | Increase Rate (%) | 95% CI (%) | Effect Size Test | Heterogeneity Test | Publication Test | ||||
|---|---|---|---|---|---|---|---|---|---|---|---|
| LL | UL | Z | P | Q | PQ | ZB | PB | ||||
| Yield | MNF vs. Urea | REM | 7.42 | 6.49 | 8.36 | 16.12 | <0.0001 | 26,544.49 | <0.0001 | 0.54 | 0.59 |
| MNF vs. C/SRF | REM | 2.44 | 1.24 | 3.66 | 4.012 | <0.0001 | 25,579.75 | <0.0001 | 0.84 | 0.40 | |
| PFPN | MNF vs. Urea | REM | 8.20 | 7.22 | 9.87 | 13.17 | <0.0001 | 337,679.9 | <0.0001 | 0.36 | 0.91 |
| MNF vs. C/SRF | REM | 0.24 | −0.63 | 3.20 | 0.16 | 0.8705 | 34,082.89 | <0.0001 | 0.78 | 0.44 | |
| Combination | Treatment Group | Control Group | Number of Studies | Number of Samples |
|---|---|---|---|---|
| MNF vs. Urea | MNF | Urea | 137 (125 in Chinese, 12 in English) | 772 |
| MNF vs. C/SRF | MNF | C/SRF | 94 (90 in Chinese, 4 in English) | 400 |
| Influence Factor | Index | Group | |||||||||
|---|---|---|---|---|---|---|---|---|---|---|---|
| 1 | 2 | 3 | 4 | 5 | 6 | 7 | 8 | 9 | 10 | ||
| Characteristics of nitrogen fertilizer | N content (%) | ≤25 | 25–30 | 30–35 | 35–40 | 40–45 | ≥45 | — | — | — | — |
| RP (d) | ≤40 | 40–60 | 60–80 | 80–100 | 100–120 | >120 | — | — | — | — | |
| Nitrogen fertilizer management | NFT | CRF | SRF | — | — | — | — | — | — | — | — |
| N rate (kg·hm−2) | ≤90 | 90–120 | 120–150 | 150–180 | 180–210 | 210–240 | 240–270 | 270–300 | >300 | — | |
| BR | ≤0.1 | 0.1–0.2 | 0.2–0.3 | 0.3–0.4 | 0.4–0.5 | 0.5–0.6 | 0.6–0.7 | 0.7–0.8 | ≥0.8 | — | |
| Region factor | Area | East China | North China | Northwest | Southwest | South China | Central China | Northeast | — | — | — |
| AAP (mm) | ≤200 | 200–400 | 400–800 | ≥800 | — | — | — | — | — | — | |
| AAT (°C) | ≤5 | 5–10 | 10–15 | 15–20 | 20–25 | ≥25 | — | — | — | — | |
| Elevation (m) | ≤150 | 150–300 | 300–450 | 450–600 | 600–750 | 750–900 | 900–1050 | 1050–1200 | ≥1200 | — | |
| Soil factor | ST | Loam | Sandy | Clay | — | — | — | — | — | — | — |
| Soil pH | <6.5 | 6.5–7.5 | >7.5 | — | — | — | — | — | — | — | |
| Crop type | Crop type | Maize | Rice | Wheat | Cotton | Rapeseed | Tomato | Potato | Scallion | Soybean | Others |
| Time factor | Fertilization period | Base fertilizer + top dressing | — | — | — | — | — | — | — | — | |
| EY | ≤2005 | 2006–2010 | 2011–2015 | 2016–2019 | ≥2020 | — | — | — | — | — | |
| GY | 1 | 2 | 3 | 4 | — | — | — | — | — | — | |
Disclaimer/Publisher’s Note: The statements, opinions and data contained in all publications are solely those of the individual author(s) and contributor(s) and not of MDPI and/or the editor(s). MDPI and/or the editor(s) disclaim responsibility for any injury to people or property resulting from any ideas, methods, instructions or products referred to in the content. |
© 2025 by the authors. Licensee MDPI, Basel, Switzerland. This article is an open access article distributed under the terms and conditions of the Creative Commons Attribution (CC BY) license (https://creativecommons.org/licenses/by/4.0/).
Share and Cite
Duan, Y.; Jiang, Y.; Ling, Y.; Chang, W.; Yin, M.; Kang, Y.; Ma, Y.; Wang, Y.; Qi, G.; Liu, B. Exploring the Potential of Nitrogen Fertilizer Mixed Application to Improve Crop Yield and Nitrogen Partial Productivity: A Meta-Analysis. Plants 2025, 14, 2417. https://doi.org/10.3390/plants14152417
Duan Y, Jiang Y, Ling Y, Chang W, Yin M, Kang Y, Ma Y, Wang Y, Qi G, Liu B. Exploring the Potential of Nitrogen Fertilizer Mixed Application to Improve Crop Yield and Nitrogen Partial Productivity: A Meta-Analysis. Plants. 2025; 14(15):2417. https://doi.org/10.3390/plants14152417
Chicago/Turabian StyleDuan, Yaya, Yuanbo Jiang, Yi Ling, Wenjing Chang, Minhua Yin, Yanxia Kang, Yanlin Ma, Yayu Wang, Guangping Qi, and Bin Liu. 2025. "Exploring the Potential of Nitrogen Fertilizer Mixed Application to Improve Crop Yield and Nitrogen Partial Productivity: A Meta-Analysis" Plants 14, no. 15: 2417. https://doi.org/10.3390/plants14152417
APA StyleDuan, Y., Jiang, Y., Ling, Y., Chang, W., Yin, M., Kang, Y., Ma, Y., Wang, Y., Qi, G., & Liu, B. (2025). Exploring the Potential of Nitrogen Fertilizer Mixed Application to Improve Crop Yield and Nitrogen Partial Productivity: A Meta-Analysis. Plants, 14(15), 2417. https://doi.org/10.3390/plants14152417