
Aboveground Biomass Mapping and Analysis of Spatial Drivers in the Qinghai–Xizang Plateau Permafrost Zone: A Case Study of the Beilu River Basin
 , , ,
, , ,
Abstract
1. Introduction
2. Materials and Methods
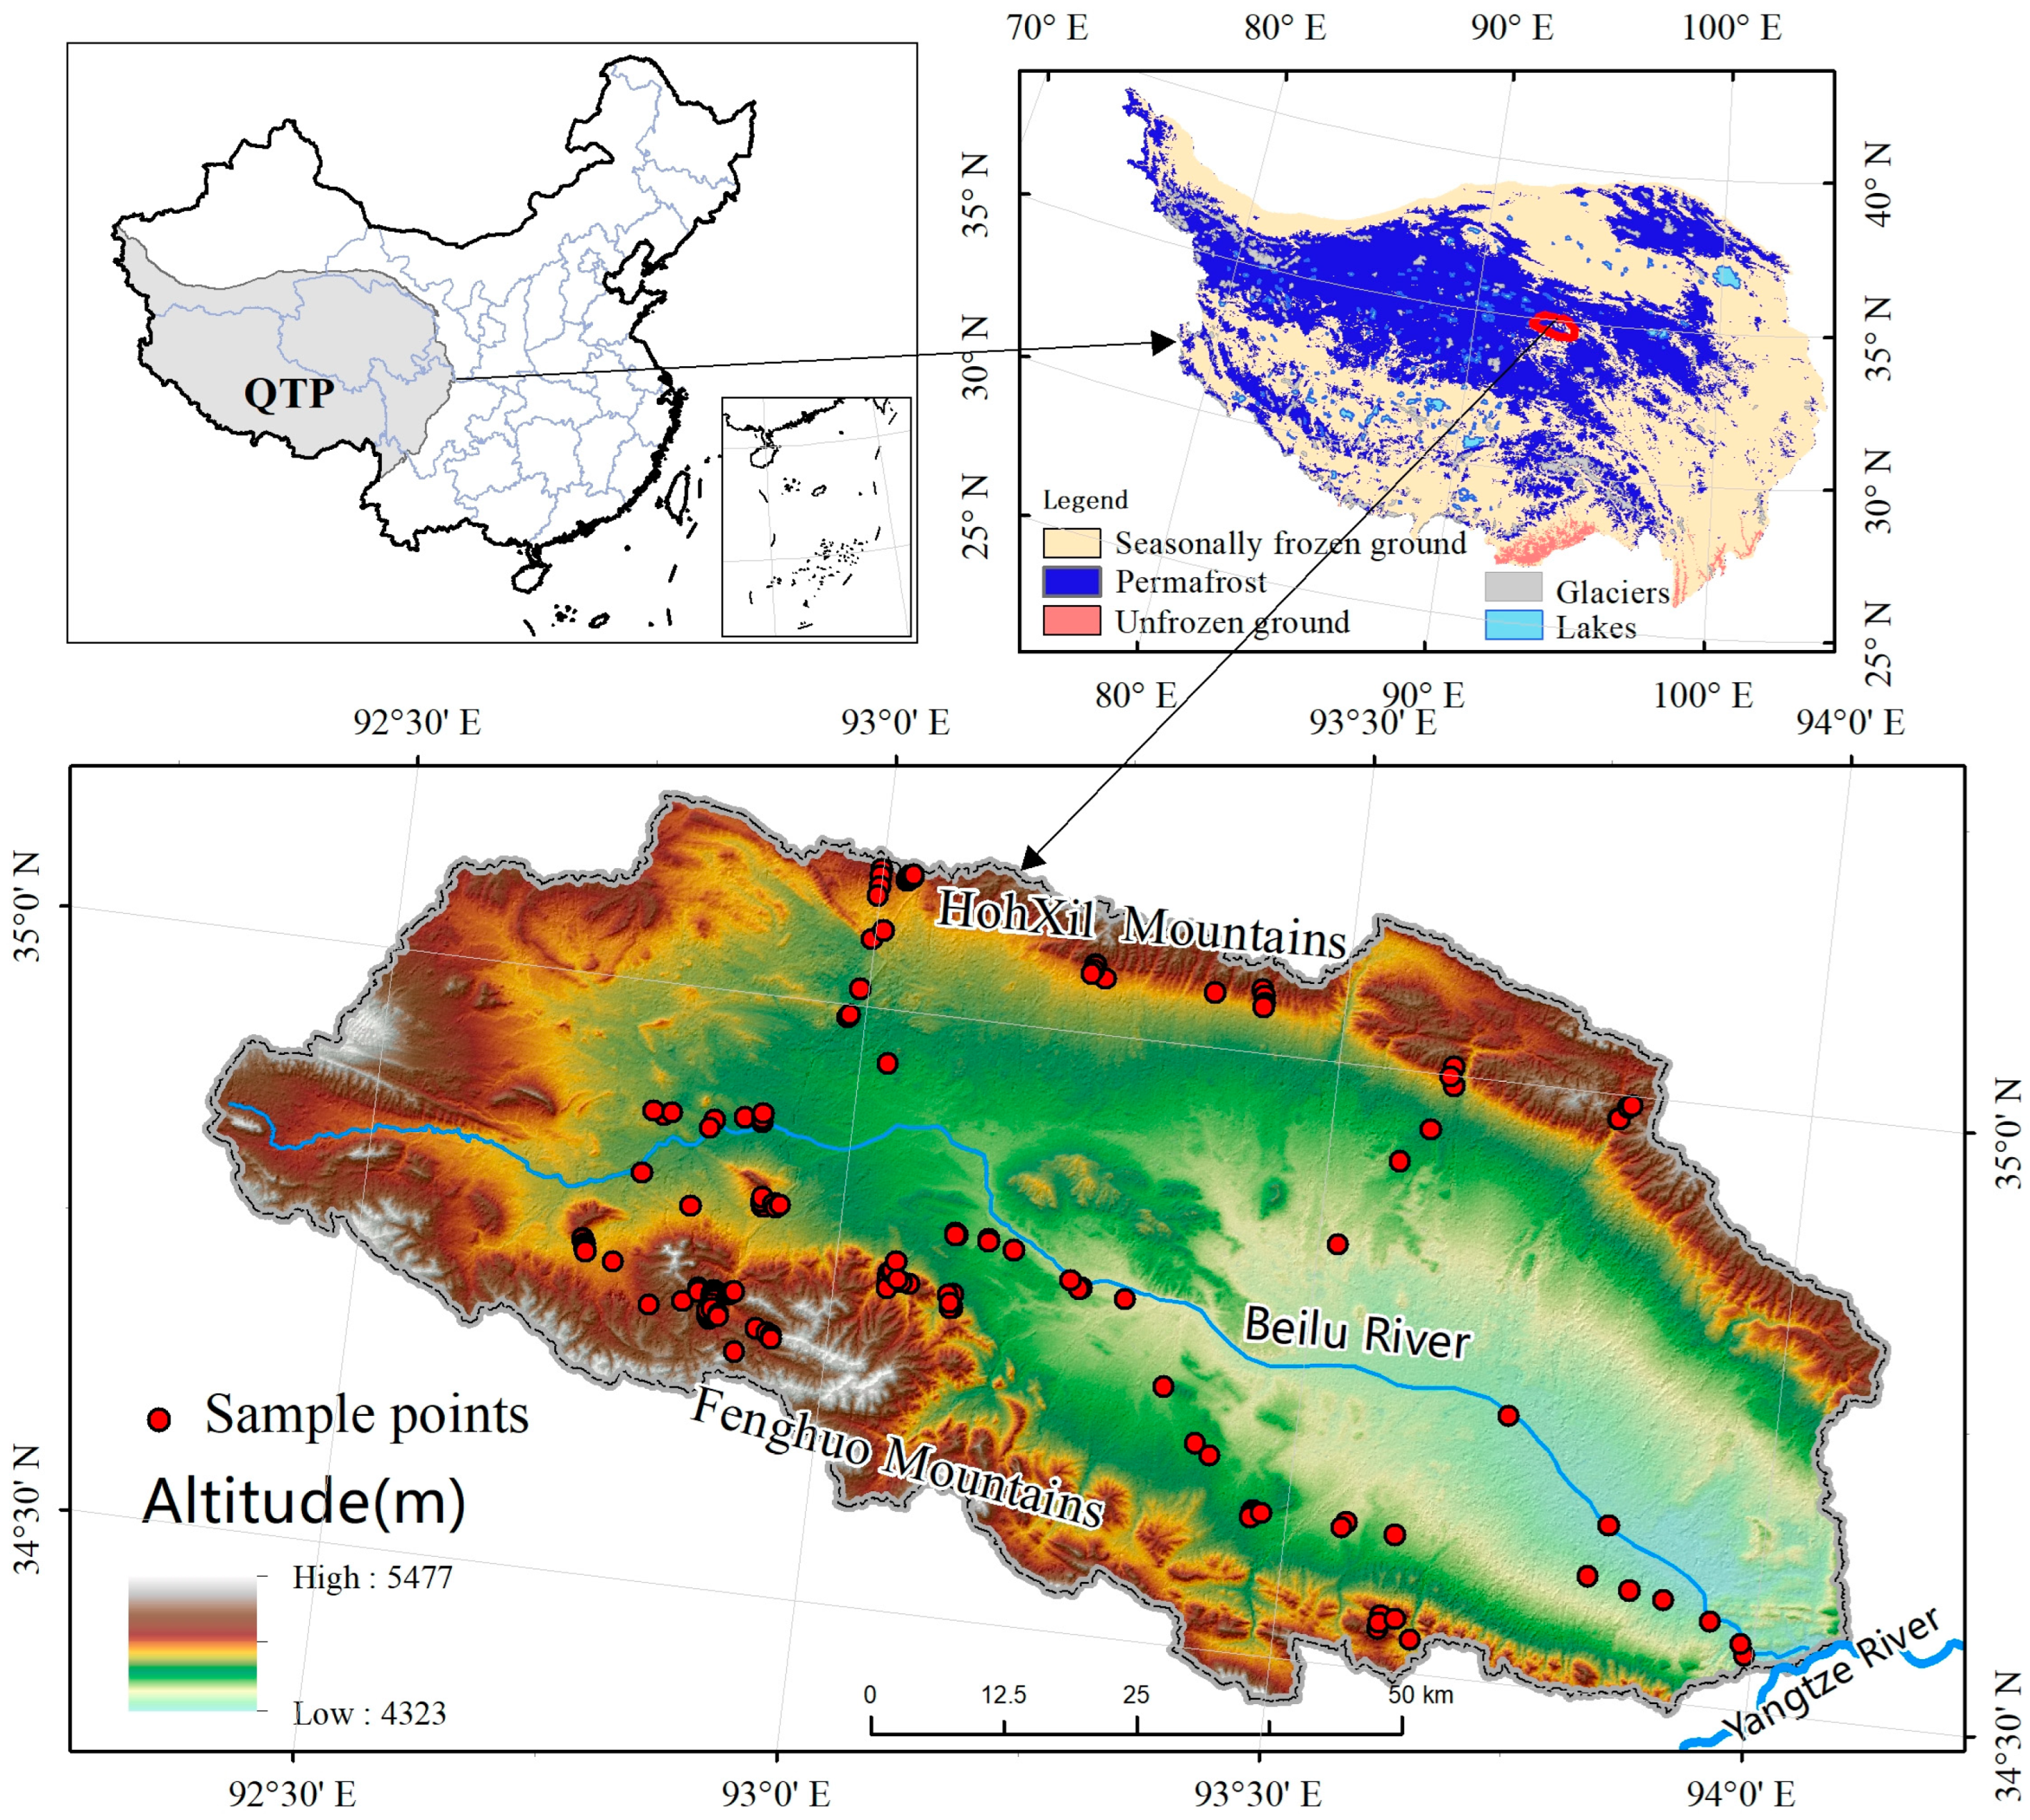
2.1. Study Area
2.2. Data Sources
2.2.1. Collection of AGB Data
2.2.2. Climate Data
2.2.3. Terrain Data
2.2.4. Vegetation Types, Soil Moisture, and Frozen Soil Data
2.3. Methods
2.3.1. Random Forest Model Based on the GEE Platform
- (1)
- Select the optimal combination of Landsat 8 OLI and Sentinel-2 images from June to September 2022 from the GEE platform, based on the criteria for cloud cover and temporal and spatial consistency;
- (2)
- Perform pre-processing operations on the remote sensing images, including atmospheric correction, radiometric correction, and geometric correction, to extract various VIs;
- (3)
- Spatially match the VIs with the field measurements of the AGB to obtain training and validation samples;
- (4)
- Establish a regression model between the AGB and VIs using the RF algorithm and evaluate the model performance using the coefficient of determination (R2) (Equation (1)) and the root mean square error (RMSE) (Equation (2)).
2.3.2. Geodetector
3. Results
3.1. Random Forest Model Development and Validation in GEE
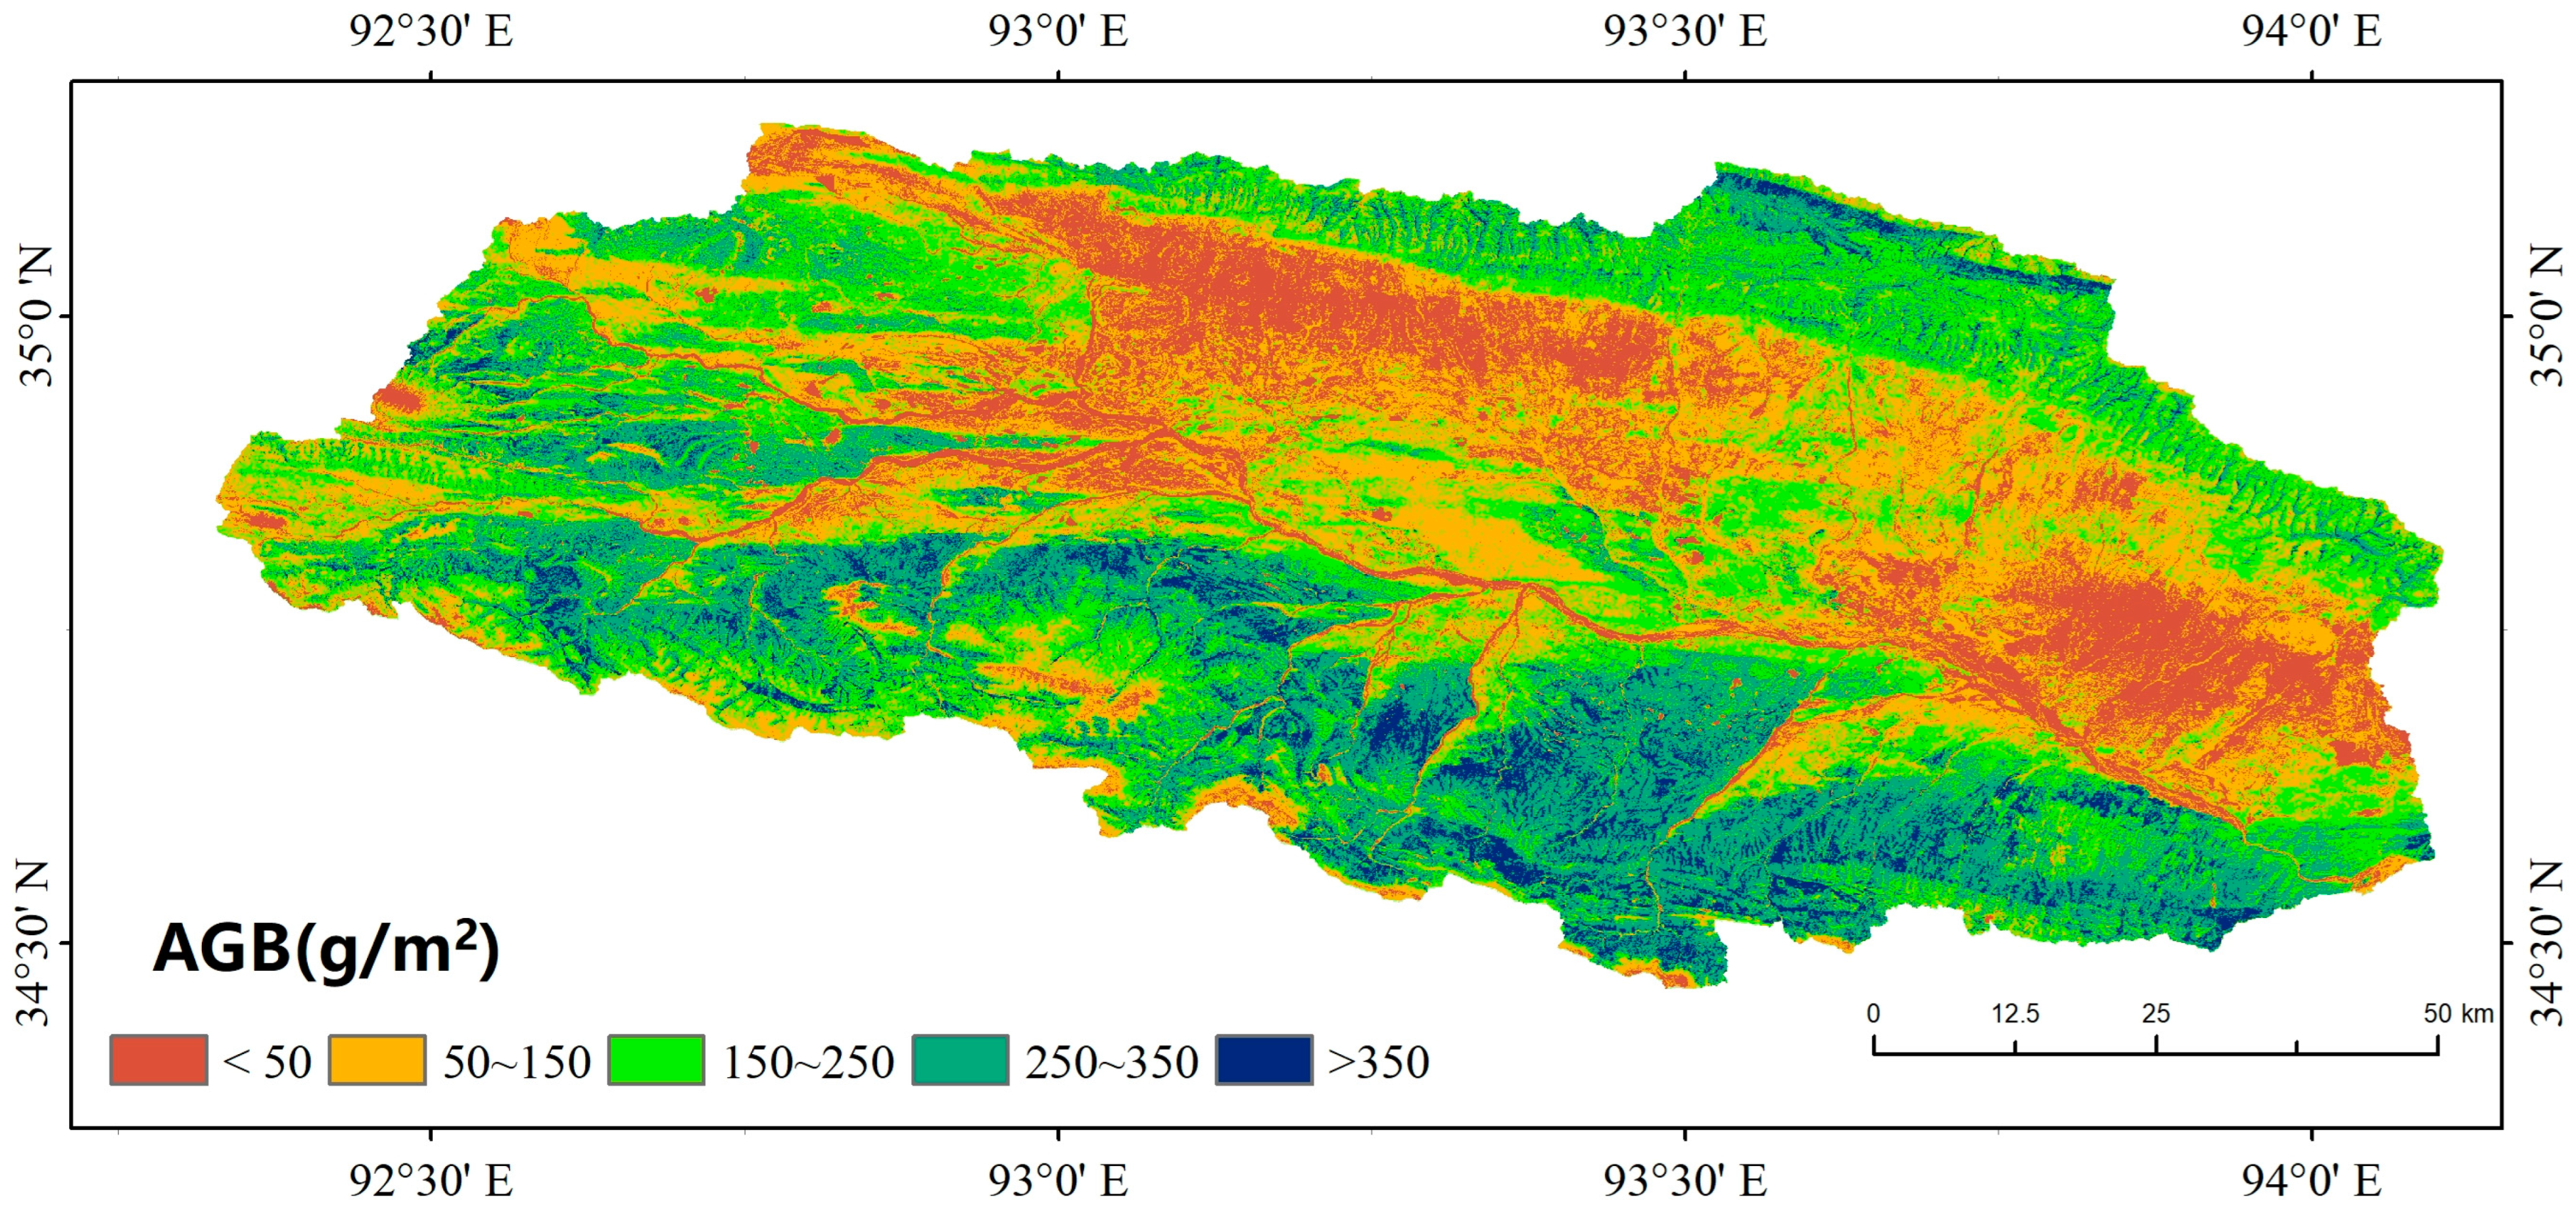
3.2. Spatial Distribution of Grassland AGB in the Beilu River Basin
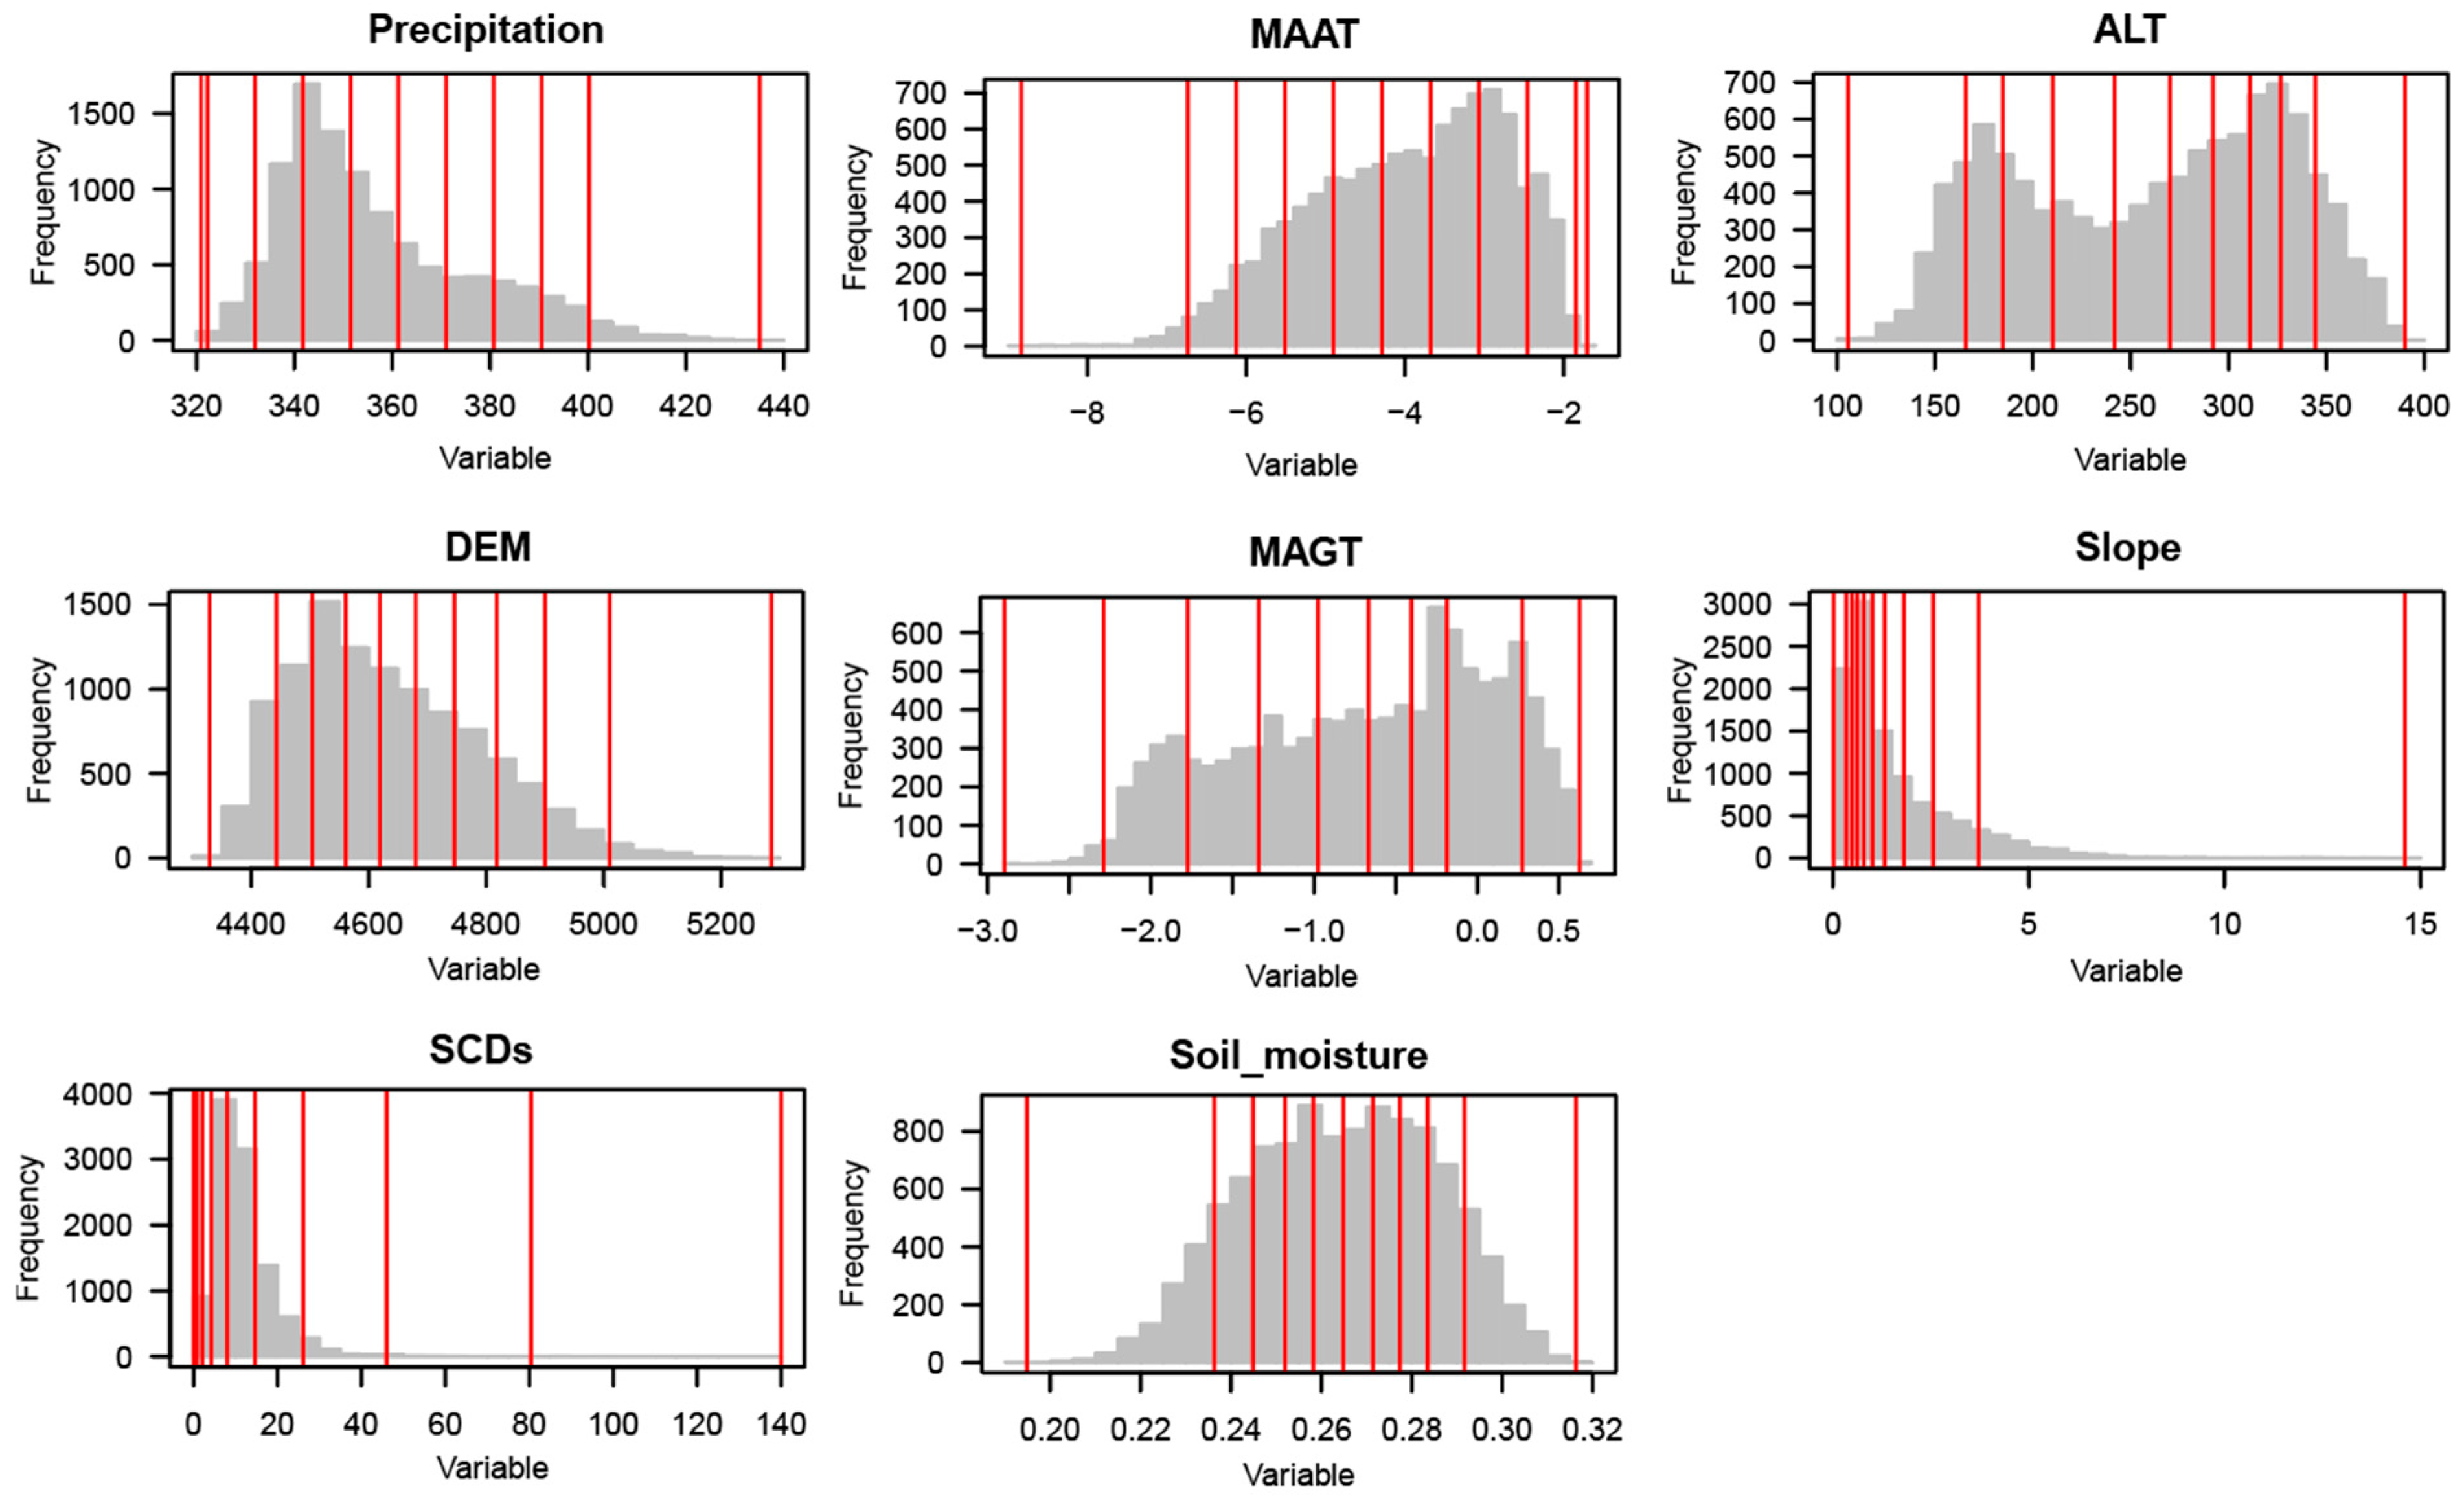
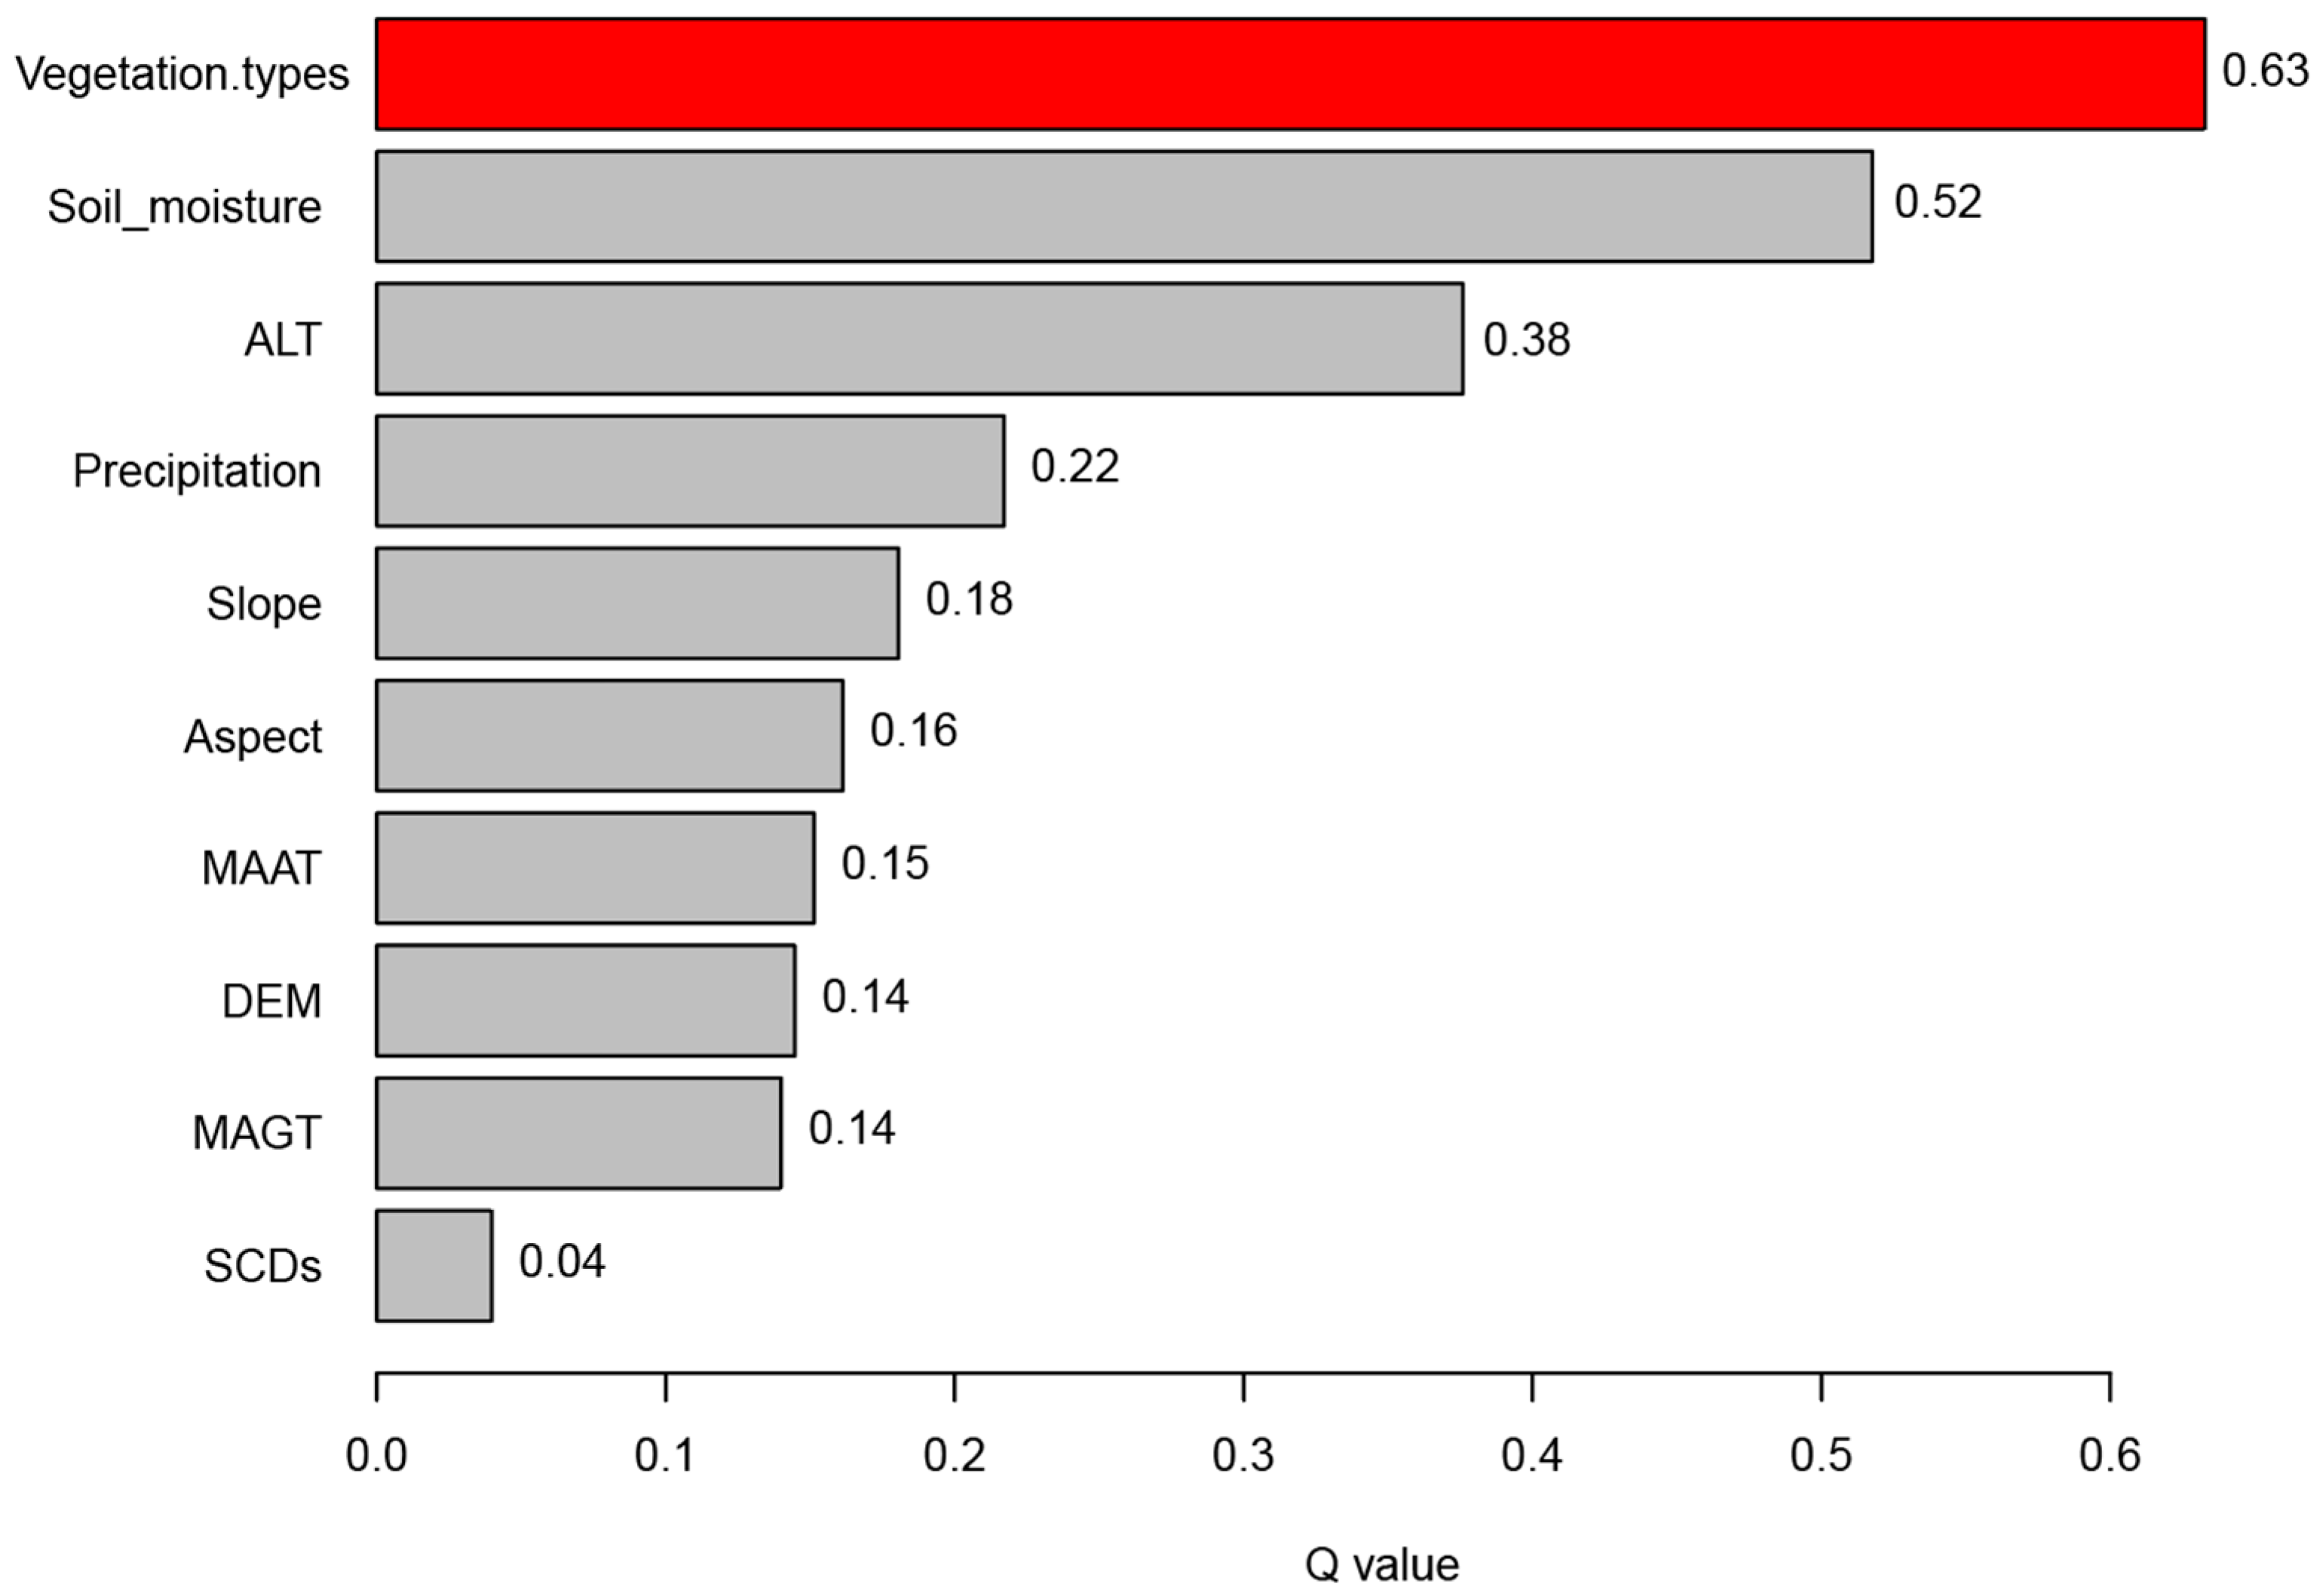
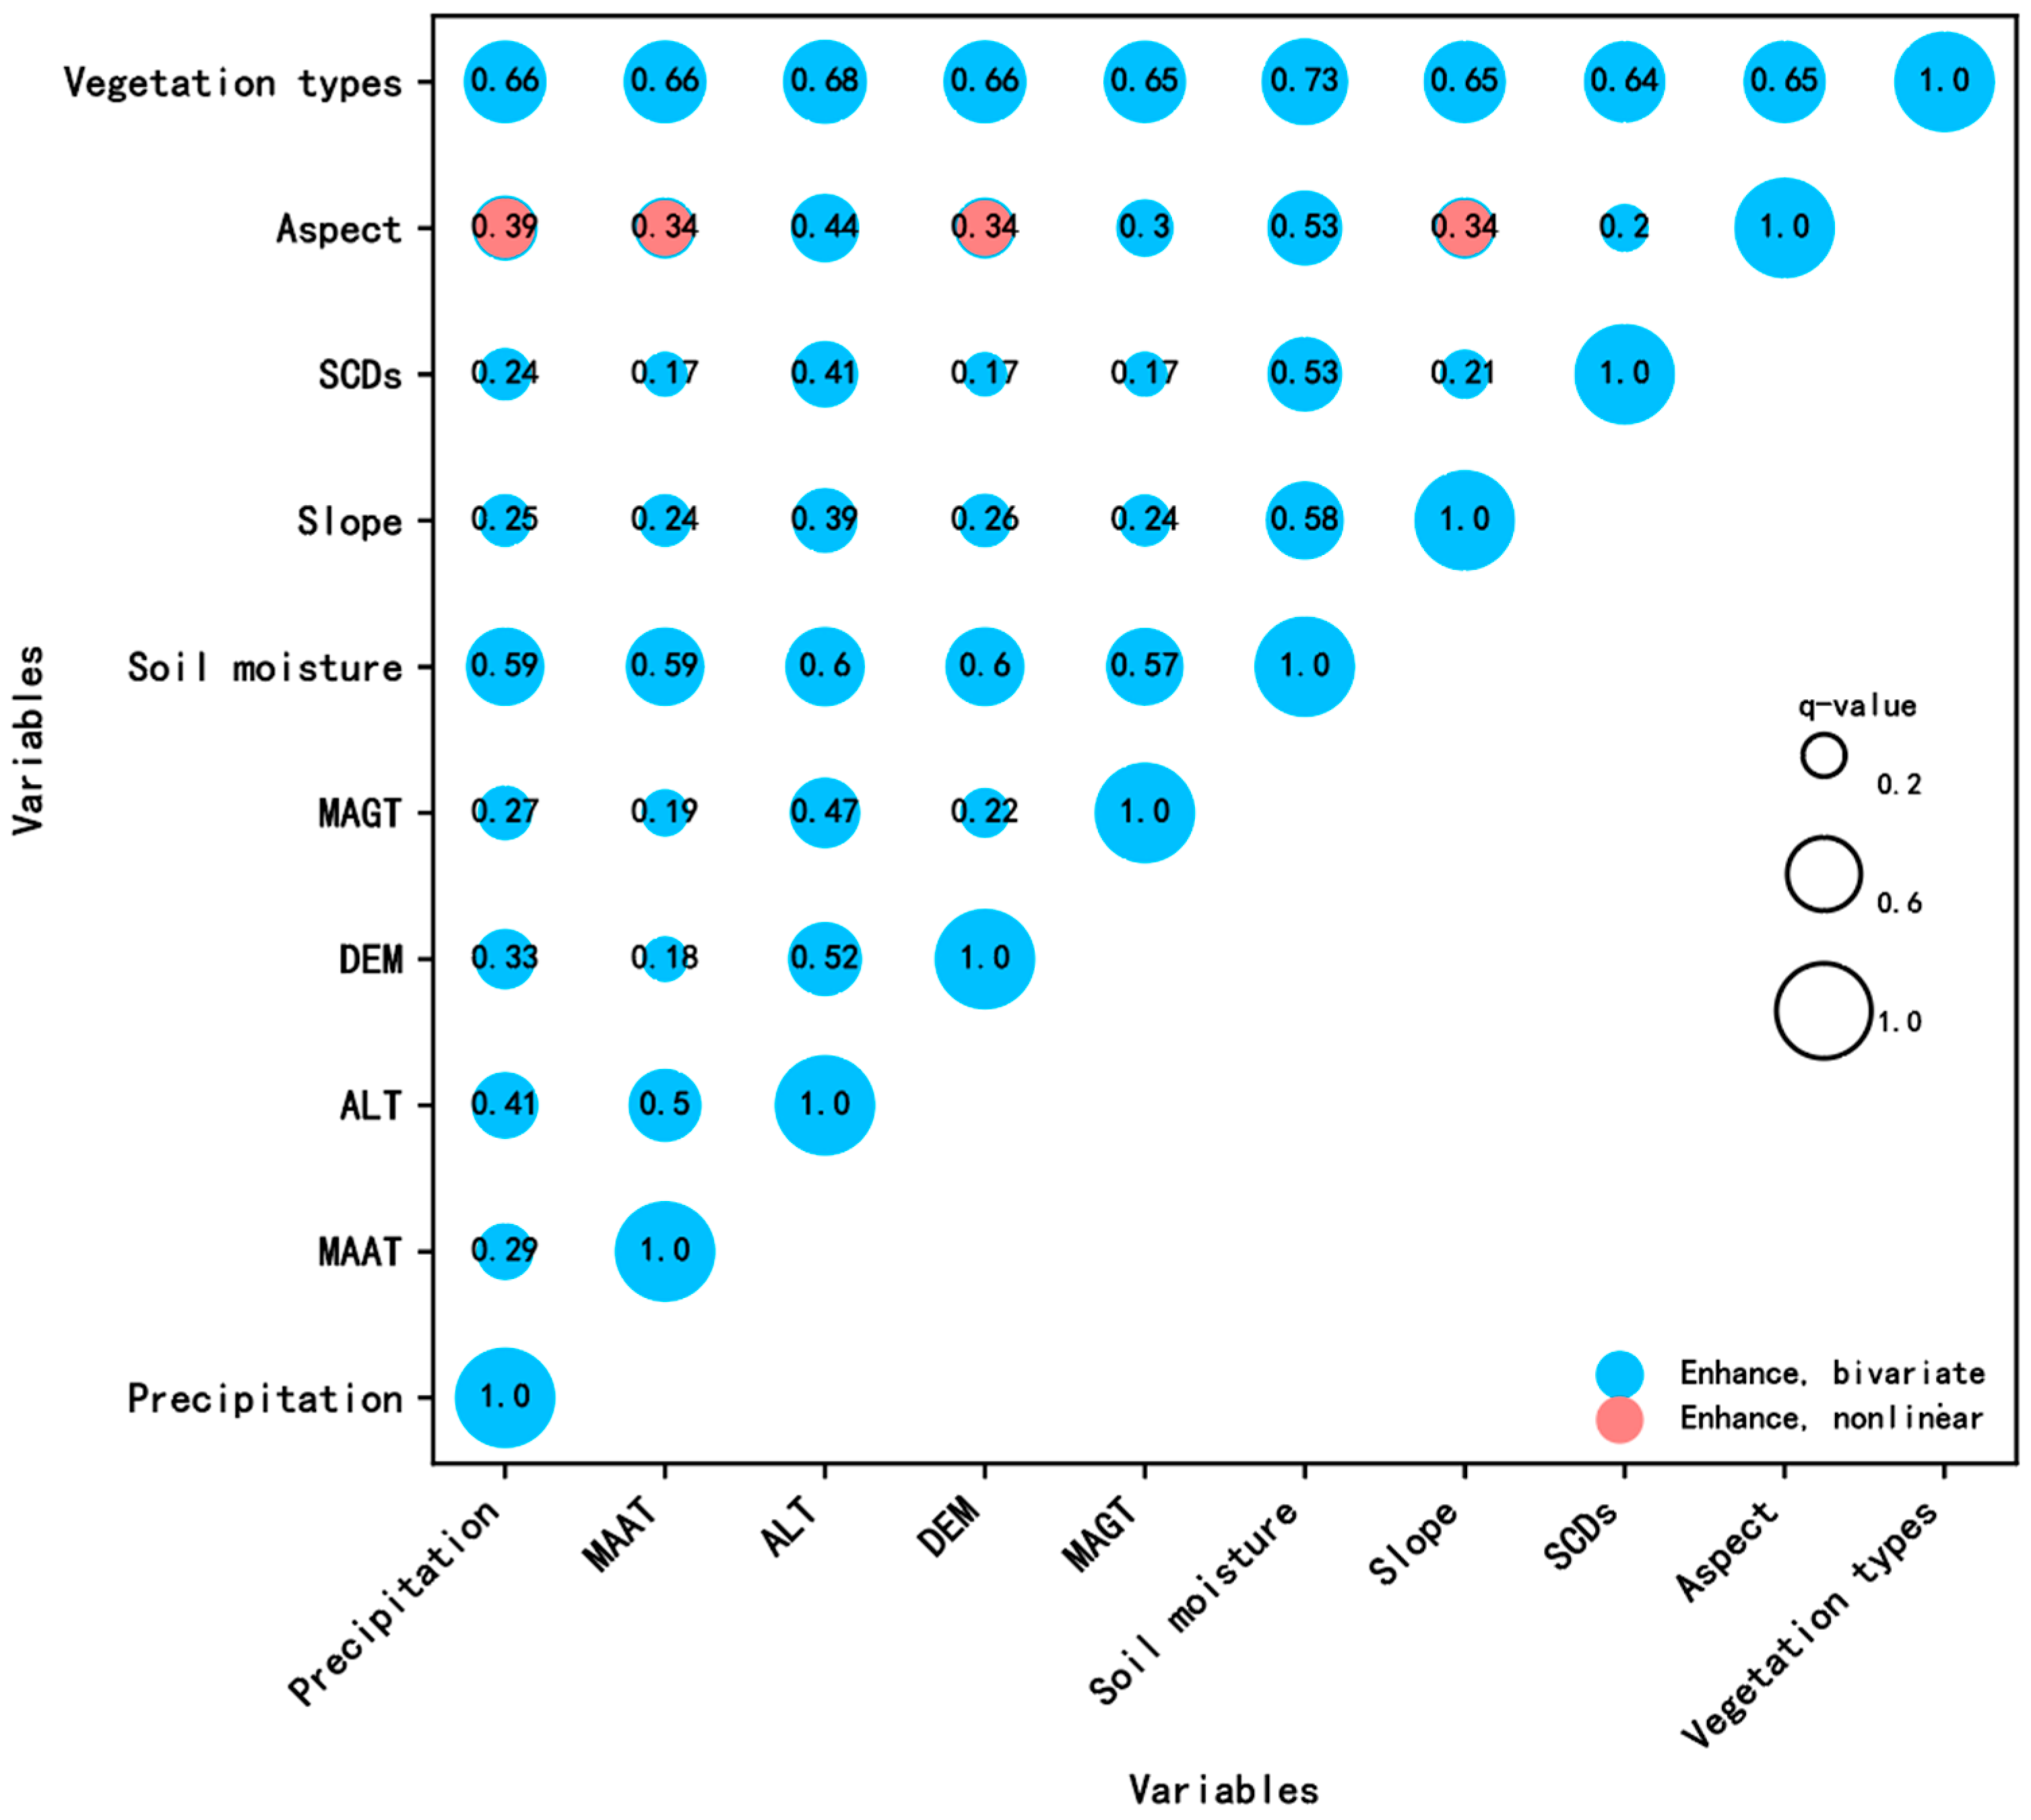
3.3. Driving Factors of Vegetation in the Beilu River Basin Based on the Geodetector Method
4. Discussion
4.1. Comparison between Estimated AGB and the Optimal Vegetation Indices Model
4.2. Driving Factor Analysis of Spatial Patterns in AGB in the Beilu River Basin
5. Conclusions
- (1)
- The RF model incorporating NDVI, EVI, SAVI, DVI, NBR1, and NBR2 demonstrated the highest performance, achieving an R2 value of 0.7956 and an RMSE of 66.47 g/m2. This indicates that SAVI and NBR2 are crucial variables to consider in regards to AGB estimation for alpine grasslands in the Qinghai–Xizang Plateau.
- (2)
- The spatial distribution of AGB in the study area’s alpine grasslands exhibits higher values in the southern regions and lower values in the northern regions. The AGB values for various grassland types within the study area are notably higher than those of similar grasslands in the Qinghai–Xizang Plateau, with alpine meadows reaching an AGB of 285 g/m2 and alpine steppe showing values of 204 g/m2.
- (3)
- Geodetector analysis indicated that grassland type, soil moisture, and active layer thickness (ALT) are more significant factors in explaining the spatial distribution of AGB than are climatic (MAAT, precipitation, and SCDs) and topographic factors. This suggests that these variables should be prioritized in future studies and management strategies to better understand and predict AGB dynamics in alpine grassland ecosystems.
Author Contributions
Funding
Data Availability Statement
Acknowledgments
Conflicts of Interest
References
- Wang, Y.; Lv, W.; Xue, K.; Wang, S.; Zhang, L.; Hu, R.; Zeng, H.; Xu, X.; Li, Y.; Jiang, L.; et al. Grassland changes and adaptive management on the Qinghai–Tibetan Plateau. Nat. Rev. Earth Environ. 2022, 3, 668–683. [Google Scholar] [CrossRef]
- Akiyama, T.; Kawamura, K. Grassland degradation in China: Methods of monitoring, management and restoration. Grassl. Sci. 2007, 53, 1–17. [Google Scholar] [CrossRef]
- CEOS Land Product Validation Subgroup. Available online: https://lpvs.gsfc.nasa.gov/AGB/AGB_home.html (accessed on 10 November 2023).
- John, R.; Chen, J.; Giannico, V.; Park, H.; Xiao, J.; Shirkey, G.; Ouyang, Z.; Shao, C.; Lafortezza, R.; Qi, J. Grassland canopy cover and aboveground biomass in mongolia and inner mongolia: Spatiotemporal estimates and controlling factors. Remote Sens. Environ. 2018, 213, 34–48. [Google Scholar] [CrossRef]
- Xia, J.; Ma, M.; Liang, T.; Wu, C.; Yang, Y.; Zhang, L.; Zhang, Y.; Yuan, W. Estimates of grassland biomass and turnover time on the tibetan plateau. Environ. Res. Lett. 2018, 13, 014020. [Google Scholar] [CrossRef]
- Yu, L.; Zhou, L.; Liu, W.; Zhou, H. Using Remote Sensing and GIS Technologies to Estimate Grass Yield and Livestock Carrying Capacity of Alpine Grasslands in Golog Prefecture, China. Pedosphere 2010, 20, 342–351. [Google Scholar] [CrossRef]
- Anaya, J.; Chuvieco, E.; Palacios-Orueta, A. Aboveground biomass assessment in Colombia: A remote sensing approach. For. Ecol. Manag. 2009, 257, 1237–1246. [Google Scholar] [CrossRef]
- Claverie, M.; Demarez, V.; Duchemin, B.; Hagolle, O.; Ducrot, D.; Maraissicre, C.; Dejoux, J.; Huc, M.; Keravec, P.; Béziat, P.; et al. Maize and sunflower biomass estimation in southwest France using high spatial and temporal resolution remote sensing data. Remote Sens. Environ. 2012, 124, 844–857. [Google Scholar] [CrossRef]
- Punalekar, S.; Verhoef, A.; Quaife, T.; Humphries, D.; Bermingham, L.; Reynolds, C. Application of sentinel-2a data for pasture biomass monitoring using a physically based radiative transfer model. Remote Sens. Environ. 2018, 218, 207–220. [Google Scholar] [CrossRef]
- Forkuor, G.; Zoungrana, J.-B.B.; Dimobe, K.; Ouattara, B.; Vadrevu, K.P.; Tondoh, J.E. Above-ground biomass mapping in west african dryland forest using sentinel-1 and 2 datasets-a case study. Remote Sens. Environ. 2020, 236, 111496. [Google Scholar] [CrossRef]
- Liu, S.; Cheng, F.; Dong, S.; Zhao, H.; Hou, X.; Wu, X. Spatiotemporal dynamics of grassland aboveground biomass on the qinghai-tibet plateau based on validated modis ndvi. Sci. Rep. 2017, 7, 4182. [Google Scholar] [CrossRef] [PubMed]
- Gao, X.; Dong, S.; Li, S.; Xu, Y.; Liu, S.; Zhao, H.; Yeomans, J.; Li, Y.; Shen, H.; Wu, S.; et al. Using the random forest model and validated modis with the field spectrometer measurement promote the accuracy of estimating aboveground biomass and coverage of alpine grasslands on the qinghai-tibetan plateau. Ecol. Indic. 2020, 112, 106114. [Google Scholar] [CrossRef]
- Wang, J.; Xiao, X.; Bajgain, R.; Starks, P.; Steiner, J.; Doughty, R.; Chang, Q. Estimating leaf area index and aboveground biomass of grazing pastures using Sentinel-1, Sentinel-2 and Landsat images. ISPRS J. Photogramm. Remote Sens. 2019, 154, 189–201. [Google Scholar] [CrossRef]
- Li, C.; Zhou, L.; Xu, W. Estimating Aboveground Biomass Using Sentinel-2 MSI Data and Ensemble Algorithms for Grassland in the Shengjin Lake Wetland, China. Remote Sens. 2021, 13, 1595. [Google Scholar] [CrossRef]
- Sibanda, M.; Mutanga, O.; Rouget, M. Comparing the spectral settings of the new generation broad and narrow band sensors in estimating biomass of native grasses grown under different management practices. GISci. Remote Sens. 2016, 53, 614–633. [Google Scholar] [CrossRef]
- Ren, H.; Zhou, G. Estimating green biomass ratio with remote sensing in arid grasslands. Ecol. Indic. 2019, 98, 568–574. [Google Scholar] [CrossRef]
- Xia, J.; Liu, S.; Liang, S.; Chen, Y.; Xu, W.; Yuan, W. Spatio-Temporal Patterns and Climate Variables Controlling of Biomass Carbon Stock of Global Grassland Ecosystems from 1982 to 2006. Remote Sens. 2014, 6, 1783–1802. [Google Scholar] [CrossRef]
- Yang, Y.; Fang, J.; Pan, Y.D.; Ji, C. Aboveground biomass in Tibetan grasslands. J. Arid Environ. 2009, 73, 91–95. [Google Scholar] [CrossRef]
- Mutanga, O.; Skidmore, A.K. Narrow band vegetation indices overcome the saturation problem in biomass estimation. Int. J. Remote Sens. 2004, 25, 3999–4014. [Google Scholar] [CrossRef]
- Zhao, D.; Arshad, M.; Wang, J.; Triantafilis, J. Soil exchangeable cations estimation using vis-nir spectroscopy in different depths: Effects of multiple calibration models and spiking. Comput. Electron. Agric. 2021, 182, 105990. [Google Scholar] [CrossRef]
- Wang, Y.; Wu, G.; Deng, L.; Tang, Z.; Wang, K.; Sun, W.; Shangguan, Z. Prediction of aboveground grassland biomass on the Loess Plateau, China, using a random forest algorithm. Sci. Rep. 2017, 7, 6940. Available online: https://www.nature.com/articles/s41598-017-07197-6.pdf (accessed on 25 October 2023). [CrossRef]
- Yu, R.; Yao, Y.; Wang, Q.; Wan, H.; Xie, Z.; Tang, W.; Zhang, Z.; Yang, J.; Shang, K.; Guo, X.; et al. Satellite-derived estimation of grassland aboveground biomass in the three-river headwaters region of china during 1982–2018. Remote Sens. 2021, 13, 2993. [Google Scholar] [CrossRef]
- Liang, T.; Yang, S.; Feng, Q.; Liu, B.; Zhang, R.; Huang, X.; Xie, H. Multi-factor modeling of above-ground biomass in alpine grassland: A case study in the Three-River Headwaters Region, China. Remote Sens. Environ. 2016, 186, 164–172. [Google Scholar] [CrossRef]
- Yang, Y.; Dou, Y.; An, S. Environmental driving factors affecting plant biomass in natural grassland in the Loess Plateau, China. Ecol. Indic. 2017, 82, 250–259. [Google Scholar] [CrossRef]
- Ge, J.; Hou, M.; Liang, T.; Feng, Q.; Meng, X.; Liu, J.; Bao, X.; Gao, H. Spatiotemporal dynamics of grassland aboveground biomass and its driving factors in North China over the past 20 years. Sci. Total Environ. 2022, 826, 154226. [Google Scholar] [CrossRef]
- Kaveh, N.; Ebrahimi, A.; Asadi, E. Comparative analysis of random forest, exploratory regression, and structural equation modeling for screening key environmental variables in evaluating rangeland above-ground biomas. Ecol. Inform. 2023, 77, 102251. [Google Scholar] [CrossRef]
- Zhang, X.; Sheng, Y.; Li, J.; Wu, J.; Chen, J.; Cao, Y. Changes of alpine ecosystem along the ground temperature of permafrost in the source region of Datong River in the northeastern Qinghai-Tibet Plateau. J. Food Agric. Environ. 2012, 10, 970–976. [Google Scholar]
- Zhou, Z.; Yi, S.; Chen, J.; Ye, B.; Sheng, Y.; Wang, G.; Ding, Y. Responses of alpine grassland to climate warming and permafrost thawing in two basins with different precipitation regimes on the Qinghai-Tibetan Plateaus. Arct. Antarct. Alp. Res. 2015, 47, 125–131. [Google Scholar] [CrossRef]
- Zhang, Y.; Zhou, T.; Shi, P.; Liu, X.; Yu, P.; Luo, H.; Zhou, P.; Xu, Y. Modeling of grassland biomass and evaluation of uncertainties caused by differences in frozen soil type on the Qinghai Plateau. Theor. Appl. Climatol. 2023, 154, 1309–1322. [Google Scholar] [CrossRef]
- Zou, D.; Zhao, L.; Sheng, Y.; Chen, J.; Hu, G.; Wu, T.; Wu, J.; Xie, C.; Wu, X.; Pang, Q.; et al. A new map of permafrost distribution on the Tibetan Plateau. Cryosphere 2017, 11, 2527–2542. [Google Scholar] [CrossRef]
- Xu, Y.; National Earth System Science Data Center, National Science & Technology Infrastructure of China. Annual Mean Temperature Data at 1 km Resolution in China (1982–2022). 2023. Available online: http://www.geodata.cn/data/datadetails.html?dataguid=67669514169502&docid=209 (accessed on 25 August 2023).
- Xu, Y.; National Earth System Science Data Center, National Science & Technology Infrastructure of China. Annual Precipitation Data at 1 km Resolution in China (1982–2022). 2023. Available online: http://www.geodata.cn/data/datadetails.html?dataguid=113786088533256 (accessed on 25 August 2023).
- Li, X.; Li, L.; Shi, F.; Su, W.; Xiao, J.; Li, H. Remote Sensing Monitoring Data Set of Snow Days in Qinghai Province from 2002 to 2021. 2021. Available online: http://www.ncdc.ac.cn/portal/metadata/f4625268-69d4-4210-be1f-c0d1ded375e4 (accessed on 26 August 2023).
- Ran, Y.; Li, X.; Che, T.; Wang, B.; Cheng, G. Current State and Past Changes in Frozen Ground at the Third Pole. National Tibetan Plateau/Third Pole Environment Data Center. 2022. Available online: https://data.tpdc.ac.cn/zh-hans/data/ade493c8-3692-4871-bcb4-a4fabaef04a9 (accessed on 26 August 2023).
- Gamon, J.A.; Field, C.B.; Goulden, M.L.; Griffin, K.L.; Hartley, A.E.; Joel, G.; Penuelas, J.; Valentini, R. Relationships between NDVI, canopy structure, and photosynthesis in three Californian vegetation types. Ecol. Appl. 1995, 5, 28–41. [Google Scholar] [CrossRef]
- Tucker, C.J. Red and photographic infrared linear combinations for monitoring vegetation. Remote Sens. Environ. 1979, 8, 127–150. [Google Scholar] [CrossRef]
- Liu, H.; Huete, A. A feedback based modification of the ndvi to minimize canopy background and atmospheric noise. IEEE Trans. Geosci. Remote Sens. 1995, 33, 457–465. [Google Scholar] [CrossRef]
- Shen, M.; Tang, Y.; Klein, J.; Zhang, P.; Gu, S.; Shimono, A.; Chen, J. Estimation of aboveground biomass using in situ hyperspectral measurements in five major grassland ecosystems on the tibetan plateau. J. Plant Ecol. 2008, 1, 247–257. [Google Scholar] [CrossRef]
- Huete, A.R. A soil-adjusted vegetation index (savi). Remote Sens. Environ. 1988, 25, 295–309. [Google Scholar] [CrossRef]
- Fu, G.; Shen, Z.X. Environmental humidity regulates effects of experimental warming on vegetation index and biomass production in an alpine meadow of the northern tibet. PLoS ONE 2016, 11, e0165643. [Google Scholar] [CrossRef]
- Yan, F.; Wu, B.; Wang, Y. Estimating aboveground biomass in mu us sandy land using landsat spectral derived vegetation indices over the past 30 years. J. Arid Land 2013, 5, 521–530. [Google Scholar] [CrossRef]
- Wang, G.; Liu, S.; Liu, T.; Fu, Z.; Yu, J.; Xue, B. Modelling above-ground biomass based on vegetation indexes: A modified approach for biomass estimation in semi-arid grasslands. Int. J. Remote Sens. 2019, 40, 3835–3854. [Google Scholar] [CrossRef]
- Jordan, C.F. Derivation of leaf-area index from quality of light on the forest floor. Ecology 1969, 50, 663–666. [Google Scholar] [CrossRef]
- Gitelson, A.; Kaufman, Y.; Merzlyak, M. Use of a green channel in remote sensing of global vegetation from EOS-MODIS. Remote Sens. Environ. 1996, 58, 289–298. [Google Scholar] [CrossRef]
- Yawata, K.; Yamamoto, T.; Hashimoto, N.; Ishida, R.; Yoshikawa, H. Mixed model estimation of rice yield based on NDVI and GNDVI using a satellite image. Remote Sens. Agric. Ecosyst. Hydrol. XXI 2019, 11149, 380–385. [Google Scholar]
- Yin, G.; Verger, A.; Descals, A.; Filella, I.; Peñuelas, J. A Broadband Green-Red Vegetation Index for Monitoring Gross Primary Production Phenology. J. Remote Sens. 2022, 2022, 9764982. [Google Scholar] [CrossRef]
- Key, C.; Benson, N. Measuring and remote sensing of burn severity. In Proceedings Joint Fire Science Conference and Workshop; University of Idaho and International Association of Wildland Fire Moscow: Moscow, ID, USA, 1999; Volume 2, p. 284. [Google Scholar]
- Key, C.; Benson, N. Landscape assessment (LA). In FIREMON: Fire Effects Monitoring and Inventory System; USDA Forest Service, Rocky Mountain Research Station: Ogden, UT, USA, 2006; Volume 164, pp. 1–55. Available online: http://gsp.humboldt.edu/OLM/Courses/GSP_216/labs/rmrs_gtr164_13_land_assess.pdf (accessed on 25 November 2023).
- Jin, Z.; Feng, Q.; Wang, R.; Liang, T. A study of grassland aboveground biomass on the Tibetan. Acta Prataculturae Sin. 2022, 31, 1–17. [Google Scholar]
- Zhang, H.; Tang, Z.; Wang, B.; Kan, H.; Sun, Y.; Qin, Y.; Meng, B.; Li, M.; Chen, J.; Lv, Y.; et al. A 250m annual alpine grassland AGB dataset over the Qinghai-Tibetan Plateau (2000–2019) based on in-situ measurements, UAV images, and MODIS Data. Earth Syst. Sci. Data. 2023, 15, 821–846. [Google Scholar] [CrossRef]
- Chen, Z.; Wang, H.; Wang, J.; Shi, H.; Liu, H.; He, J. Estimation on seasonal dynamics of alpine grassland aboveground biomass using phenology camera-derived NDVI. Chin. J. Plant Ecol. 2021, 45, 487–495. [Google Scholar] [CrossRef]
- Zhu, Q.; Chen, H.; Peng, C.; Liu, J.; Piao, S.; He, J.-S.; Wang, S.; Zhao, X.; Zhang, J.; Fang, X.; et al. An early warning signal for grassland degradation on the Qinghai-Tibetan Plateau. Nat. Commun. 2023, 14, 6406. [Google Scholar] [CrossRef]
- Zhang, H.; Tang, Z.; Wang, B.; Meng, B.; Qin, Y.; Sun, Y.; Lv, Y.Y.; Zhang, J.; Yi, S. A non-destructive method for rapid acquisition of grassland aboveground biomass for satellite ground verification using UAV RGB images. Glob. Ecol. Conserv. 2022, 33, e01999. [Google Scholar] [CrossRef]
- Lussem, U.; Bolten, A.; Menne, J.; Gnyp, M.; Schellberg, J.; Bareth, G. Estimating biomass in temperate grassland with high resolution canopy surface models from UAV-based RGB images and vegetation indices, J. Appl. Remote Sens. 2019, 13, 034525. [Google Scholar] [CrossRef]
- Meng, B.; Yi, S.; Liang, T.; Yin, J.; Sun, Y. Modeling alpine grassland above ground biomass based on remote sensing data and machine learning algorithm: A case study in the east of Tibetan Plateau, China. IEEE J. Select. Top. Appl. Earth Obs. Remote Sens. 2020, 13, 2986–2995. [Google Scholar] [CrossRef]
- Zhang, B.; Zhang, L.; Xie, D.; Yin, X.; Liu, C.; Liu, G. Application of Synthetic NDVI Time Series Blended from Landsat and MODIS Data for Grassland Biomass Estimation. Remote Sens. 2016, 8, 10. [Google Scholar] [CrossRef]
- Huete, A.; Justice, C.; Liu, H. Development of vegetation and soil indices for MODIS-EOS. Remote Sens. Environ. 1994, 49, 224–234. [Google Scholar] [CrossRef]
- Jiang, Y.; Tao, J.; Huang, Y.; Zhu, J.; Tian, L.; Zhang, Y. The spatial pattern of grassland aboveground biomass on Xizang Plateau and its climatic controls. J. Plant Ecol. 2015, 8, 30–40. [Google Scholar] [CrossRef]
- Wei, P.; Pan, X.; Xu, L.; Hu, Q.; Zhang, X.; Guo, Y.; Shao, C.; Wang, C.; Li, Q.; Yin, Z. The effects of topography on aboveground biomass and soil moisture at local scale in dryland grassland ecosystem, China. Ecol. Indic. 2019, 105, 107–115. [Google Scholar] [CrossRef]
- Zhang, J.; Fang, S.; Liu, H. Estimation of alpine grassland above-ground biomass and its response to climate on the Qinghai-Tibet Plateau during 2001 to 2019. Glob. Ecol. Conserv. 2022, 35, e02065. [Google Scholar] [CrossRef]
- Zeng, N.; Ren, X.; He, H.; Zhang, L.; Zhao, D.; Ge, R.; Li, P.; Niu, Z. Estimating grassland aboveground biomass on the Tibetan Plateau using a random forest algorithm. Ecol. Indic. 2019, 102, 479–487. [Google Scholar] [CrossRef]
- Yue, G.; Zhao, L.; Wang, Z.; Zhang, L.; Zou, D.; Niu, L.; Zhao, Y.; Qiao, Y. Spatial variation in biomass and its relationships to soil properties in the permafrost regions along the Qinghai-Tibet Railway. Environ. Eng. Sci. 2017, 34, 130–137. [Google Scholar] [CrossRef]
- Mu, C.; Li, L.; Zhang, F.; Li, Y.; Xiao, X.; Zhao, Q.; Zhang, T. Impacts of permafrost on above-and belowground biomass on the northern Qinghai-Tibetan Plateau. Arct. Antarct. Alp. Res. 2018, 50, e1447192. [Google Scholar] [CrossRef]
- Tian, L.; Zhao, L.; Wu, X.; Hu, G.; Fang, H.; Zhao, Y.; Sheng, Y.; Chen, J.; Wu, J.; Li, W.; et al. Variations in soil nutrient availability across Tibetan grassland from the 1980s to 2010s. Geoderma 2019, 338, 197–205. [Google Scholar] [CrossRef]


| Grassland Type | Number of Samples | Vegetation Community | Average Vegetation Cover (%) | Average AGB (g/m2) | Standard Deviation |
|---|---|---|---|---|---|
| Alpine swamp meadow | 22 | Kobresia pygmaea Kobresia littledalei | 77 | 418.9 | 93.13 |
| Alpine meadow | 37 | Kobresia pygmaea Kobresia littledalei | 64 | 313.85 | 85.41 |
| Alpine steppe | 43 | Carex moorcroftii Stipa purpurea Leontopodium pusillum Littledalea racemosa Poa pratensis Androsace tangulashanensis | 35 | 234.82 | 70.95 |
| Alpine desert steppe | 26 | Stipa purpurea Short spike fescue Leontopodium pusillum Poa pratensis Myricaria prostrata | 18 | 106.87 | 56.85 |
| Alpine desert | 12 | Arenaria qinghaiensis Androsace tapete Rhodiola Saussurea tangutica | 1.5 | 27.76 | 15.49 |
| Vegetation Index | Formula | References |
|---|---|---|
| NDVI | [35,36] | |
| EVI | G G = 2.5; = 6; = 7.5; L = 1 | [37,38] |
| SAVI | L = 0.5 | [39,40] |
| DVI | [41,42] | |
| RVI | [16,43] | |
| GNDVI | [44,45] | |
| GRVI | [36,46] | |
| NBR | [47] | |
| NBR2 | [48] |
| Model | VIs | R2 | RMSE |
|---|---|---|---|
| 1 | NDVI | 0.6081 | 87.58 |
| 2 | EVI | 0.6124 | 88.21 |
| 3 | NDVI, EVI | 0.7005 | 79.15 |
| 4 | NDVI, EVI, NBR2 | 0.7202 | 75.02 |
| 5 | NDVI, EVI, SAVI | 0.7156 | 73.5 |
| 6 | NDVI, EVI, SAVI, NBR2 | 0.7546 | 71.84 |
| 7 | NDVI, EVI, SAVI, NBR1, NBR2 | 0.7695 | 68.54 |
| 8 | NDVI, EVI, SAVI, DVI, NBR1, NBR2 | 0.7956 | 66.47 |
| 9 | NDVI, EVI, SAVI, DVI, RVI, NBR1, NBR2 | 0.7787 | 65.47 |
| 10 | NDVI, EVI, SAVI, DVI, RVI, GRVI, NBR1, NBR2 | 0.7584 | 69.32 |
| 11 | NDVI, EVI, SAVI, DVI, RVI, GNDVI, GRVI, NBR1, NBR2 | 0.7285 | 71.64 |
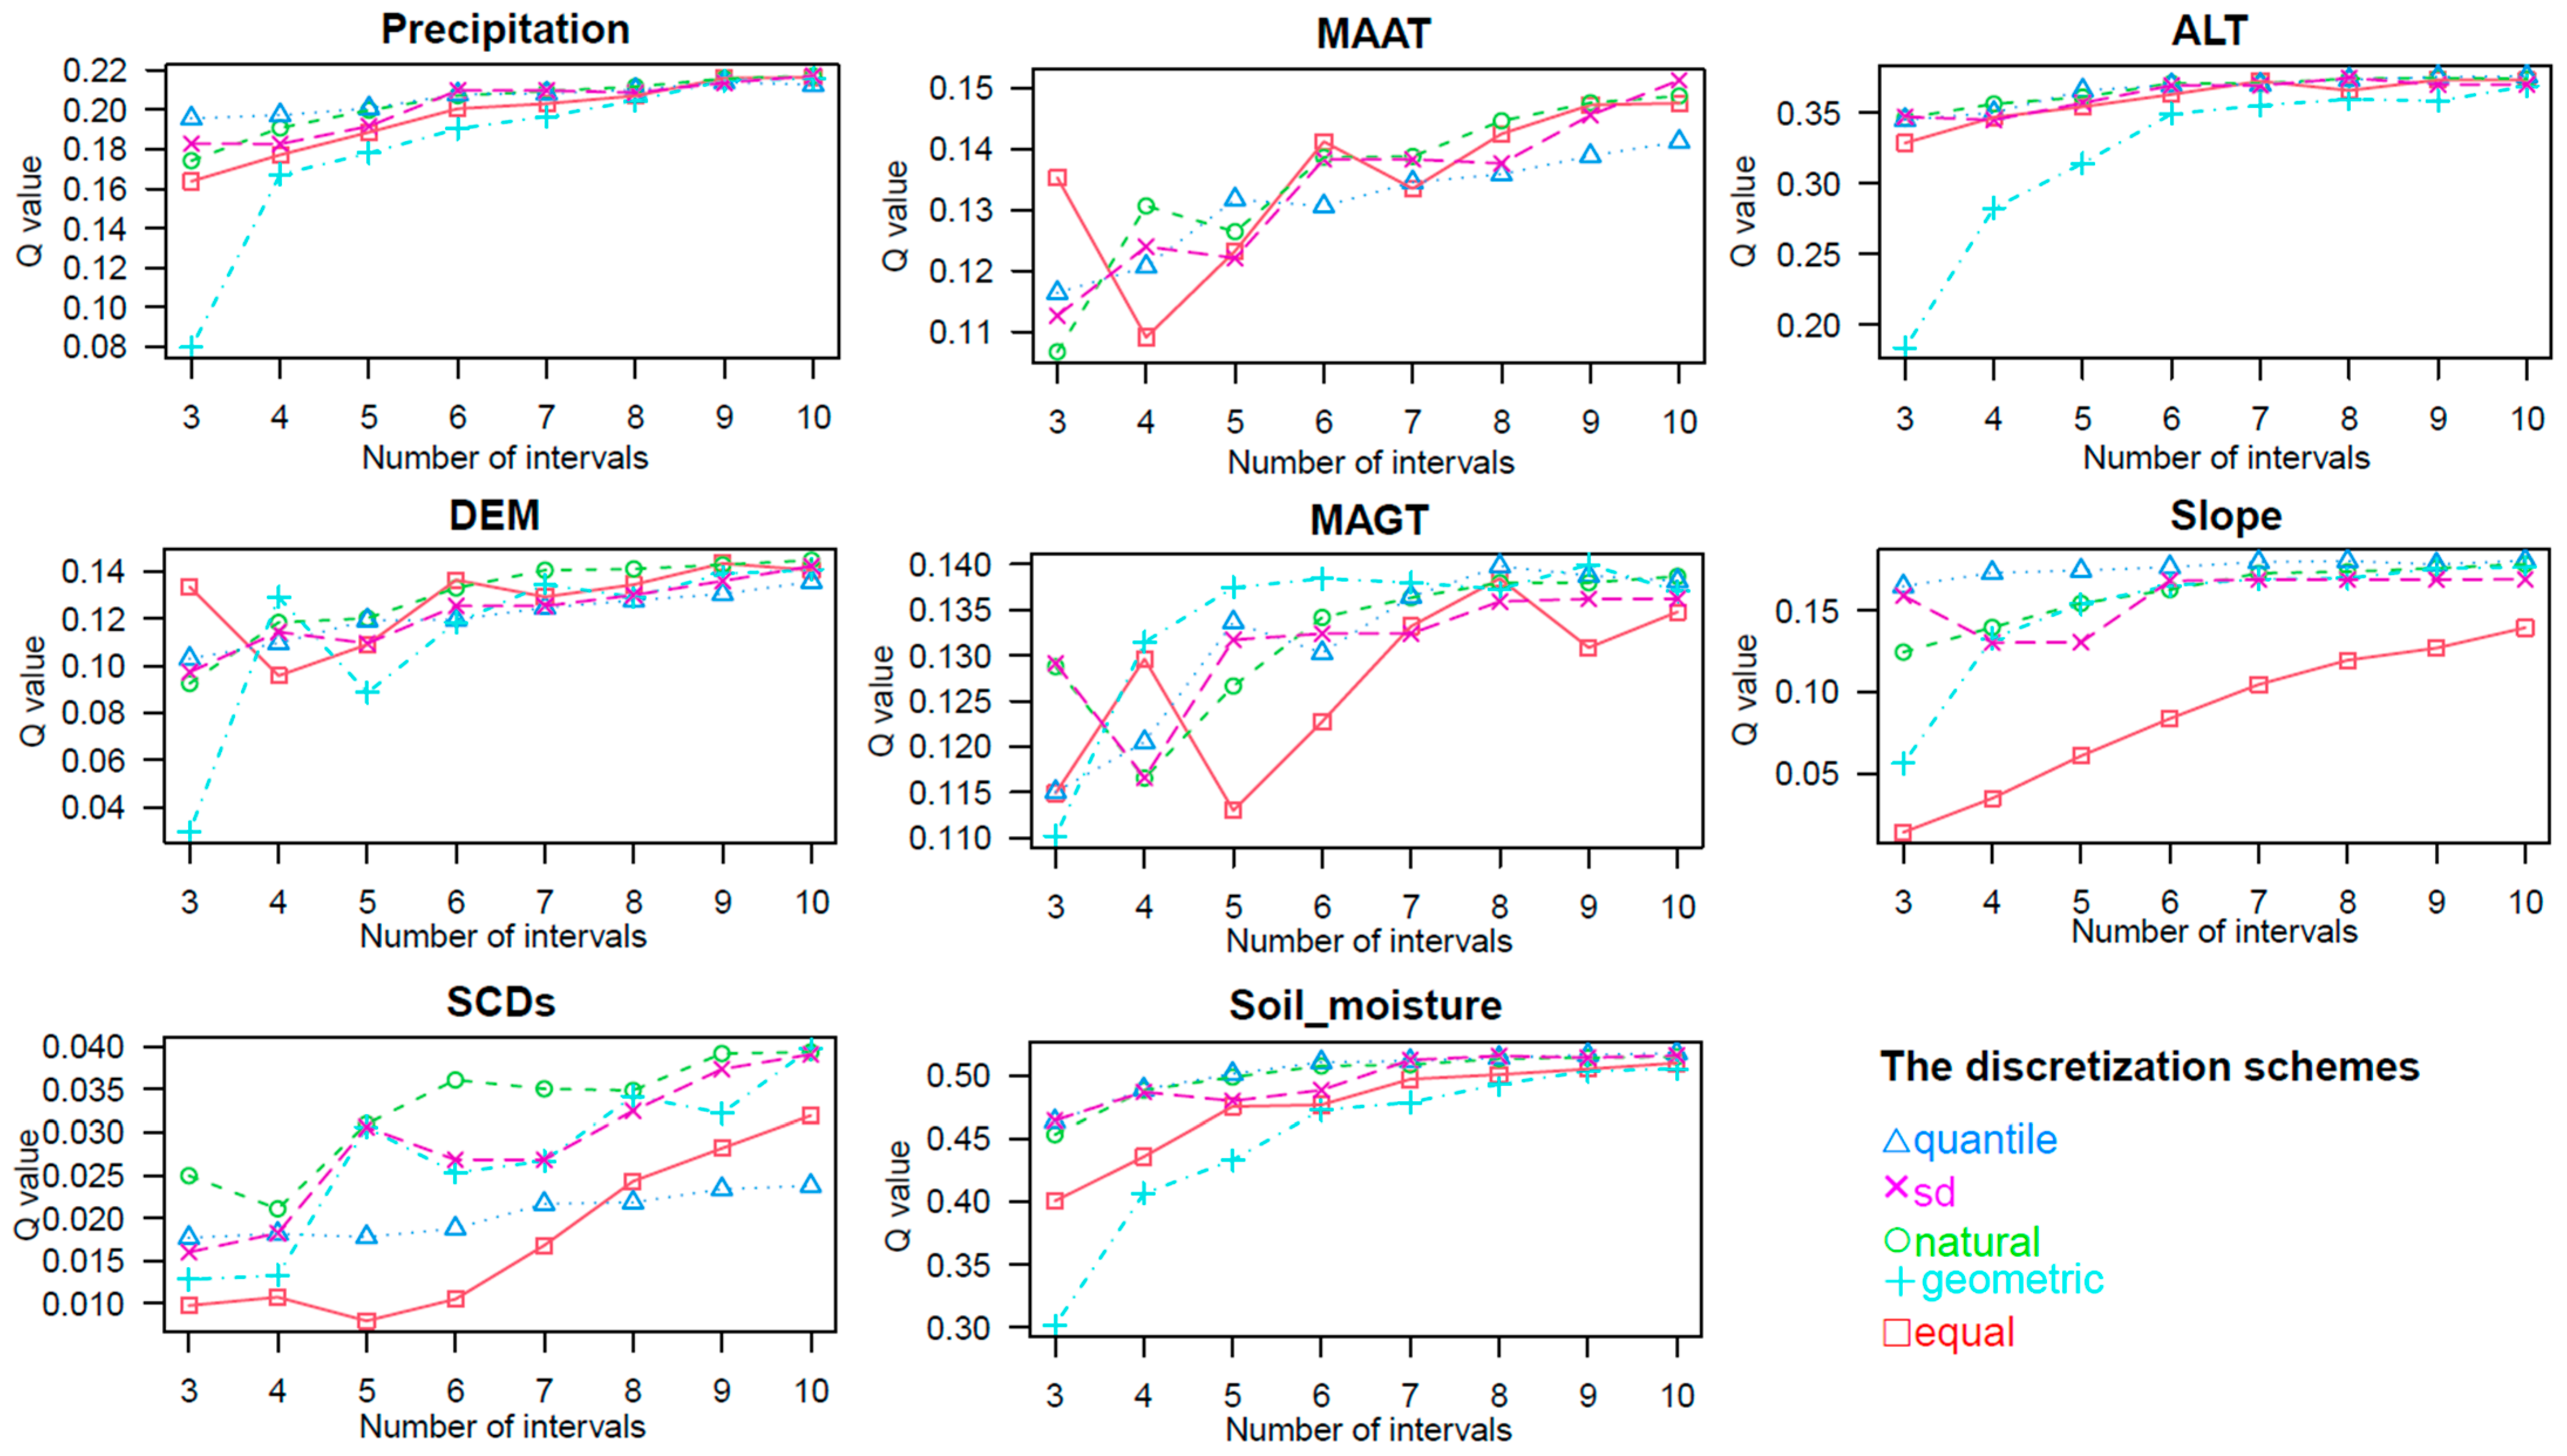
| Variable | Optimal Method | Number of Strata |
|---|---|---|
| Precipitation | sd | 10 |
| MAAT | sd | 10 |
| ALT | quantile | 10 |
| DEM | natural | 10 |
| MAGT | geometric | 9 |
| Soil moisture | quantile | 10 |
| Slope | quantile | 10 |
| SCDs | geometric | 10 |
| Aspect | manual | 8 |
| Vegetation types | manual | 6 |
Disclaimer/Publisher’s Note: The statements, opinions and data contained in all publications are solely those of the individual author(s) and contributor(s) and not of MDPI and/or the editor(s). MDPI and/or the editor(s) disclaim responsibility for any injury to people or property resulting from any ideas, methods, instructions or products referred to in the content. |
© 2024 by the authors. Licensee MDPI, Basel, Switzerland. This article is an open access article distributed under the terms and conditions of the Creative Commons Attribution (CC BY) license (https://creativecommons.org/licenses/by/4.0/).
Share and Cite
Wu, Y.; Zhao, J.; Chen, J.; Zhang, Y.; Yang, B.; Ma, S.; Kang, J.; Zhao, Y.; Miao, Z. Aboveground Biomass Mapping and Analysis of Spatial Drivers in the Qinghai–Xizang Plateau Permafrost Zone: A Case Study of the Beilu River Basin. Plants 2024, 13, 686. https://doi.org/10.3390/plants13050686
Wu Y, Zhao J, Chen J, Zhang Y, Yang B, Ma S, Kang J, Zhao Y, Miao Z. Aboveground Biomass Mapping and Analysis of Spatial Drivers in the Qinghai–Xizang Plateau Permafrost Zone: A Case Study of the Beilu River Basin. Plants. 2024; 13(5):686. https://doi.org/10.3390/plants13050686
Chicago/Turabian StyleWu, Yamin, Jingyi Zhao, Ji Chen, Yaonan Zhang, Bin Yang, Shen Ma, Jianfang Kang, Yanggang Zhao, and Zhenggong Miao. 2024. "Aboveground Biomass Mapping and Analysis of Spatial Drivers in the Qinghai–Xizang Plateau Permafrost Zone: A Case Study of the Beilu River Basin" Plants 13, no. 5: 686. https://doi.org/10.3390/plants13050686
APA StyleWu, Y., Zhao, J., Chen, J., Zhang, Y., Yang, B., Ma, S., Kang, J., Zhao, Y., & Miao, Z. (2024). Aboveground Biomass Mapping and Analysis of Spatial Drivers in the Qinghai–Xizang Plateau Permafrost Zone: A Case Study of the Beilu River Basin. Plants, 13(5), 686. https://doi.org/10.3390/plants13050686