

Characterization of Purple Carrot Germplasm for Antioxidant Capacity and Root Concentration of Anthocyanins, Phenolics, and Carotenoids

 ,
,  , , , and
Abstract
1. Introduction
2. Results
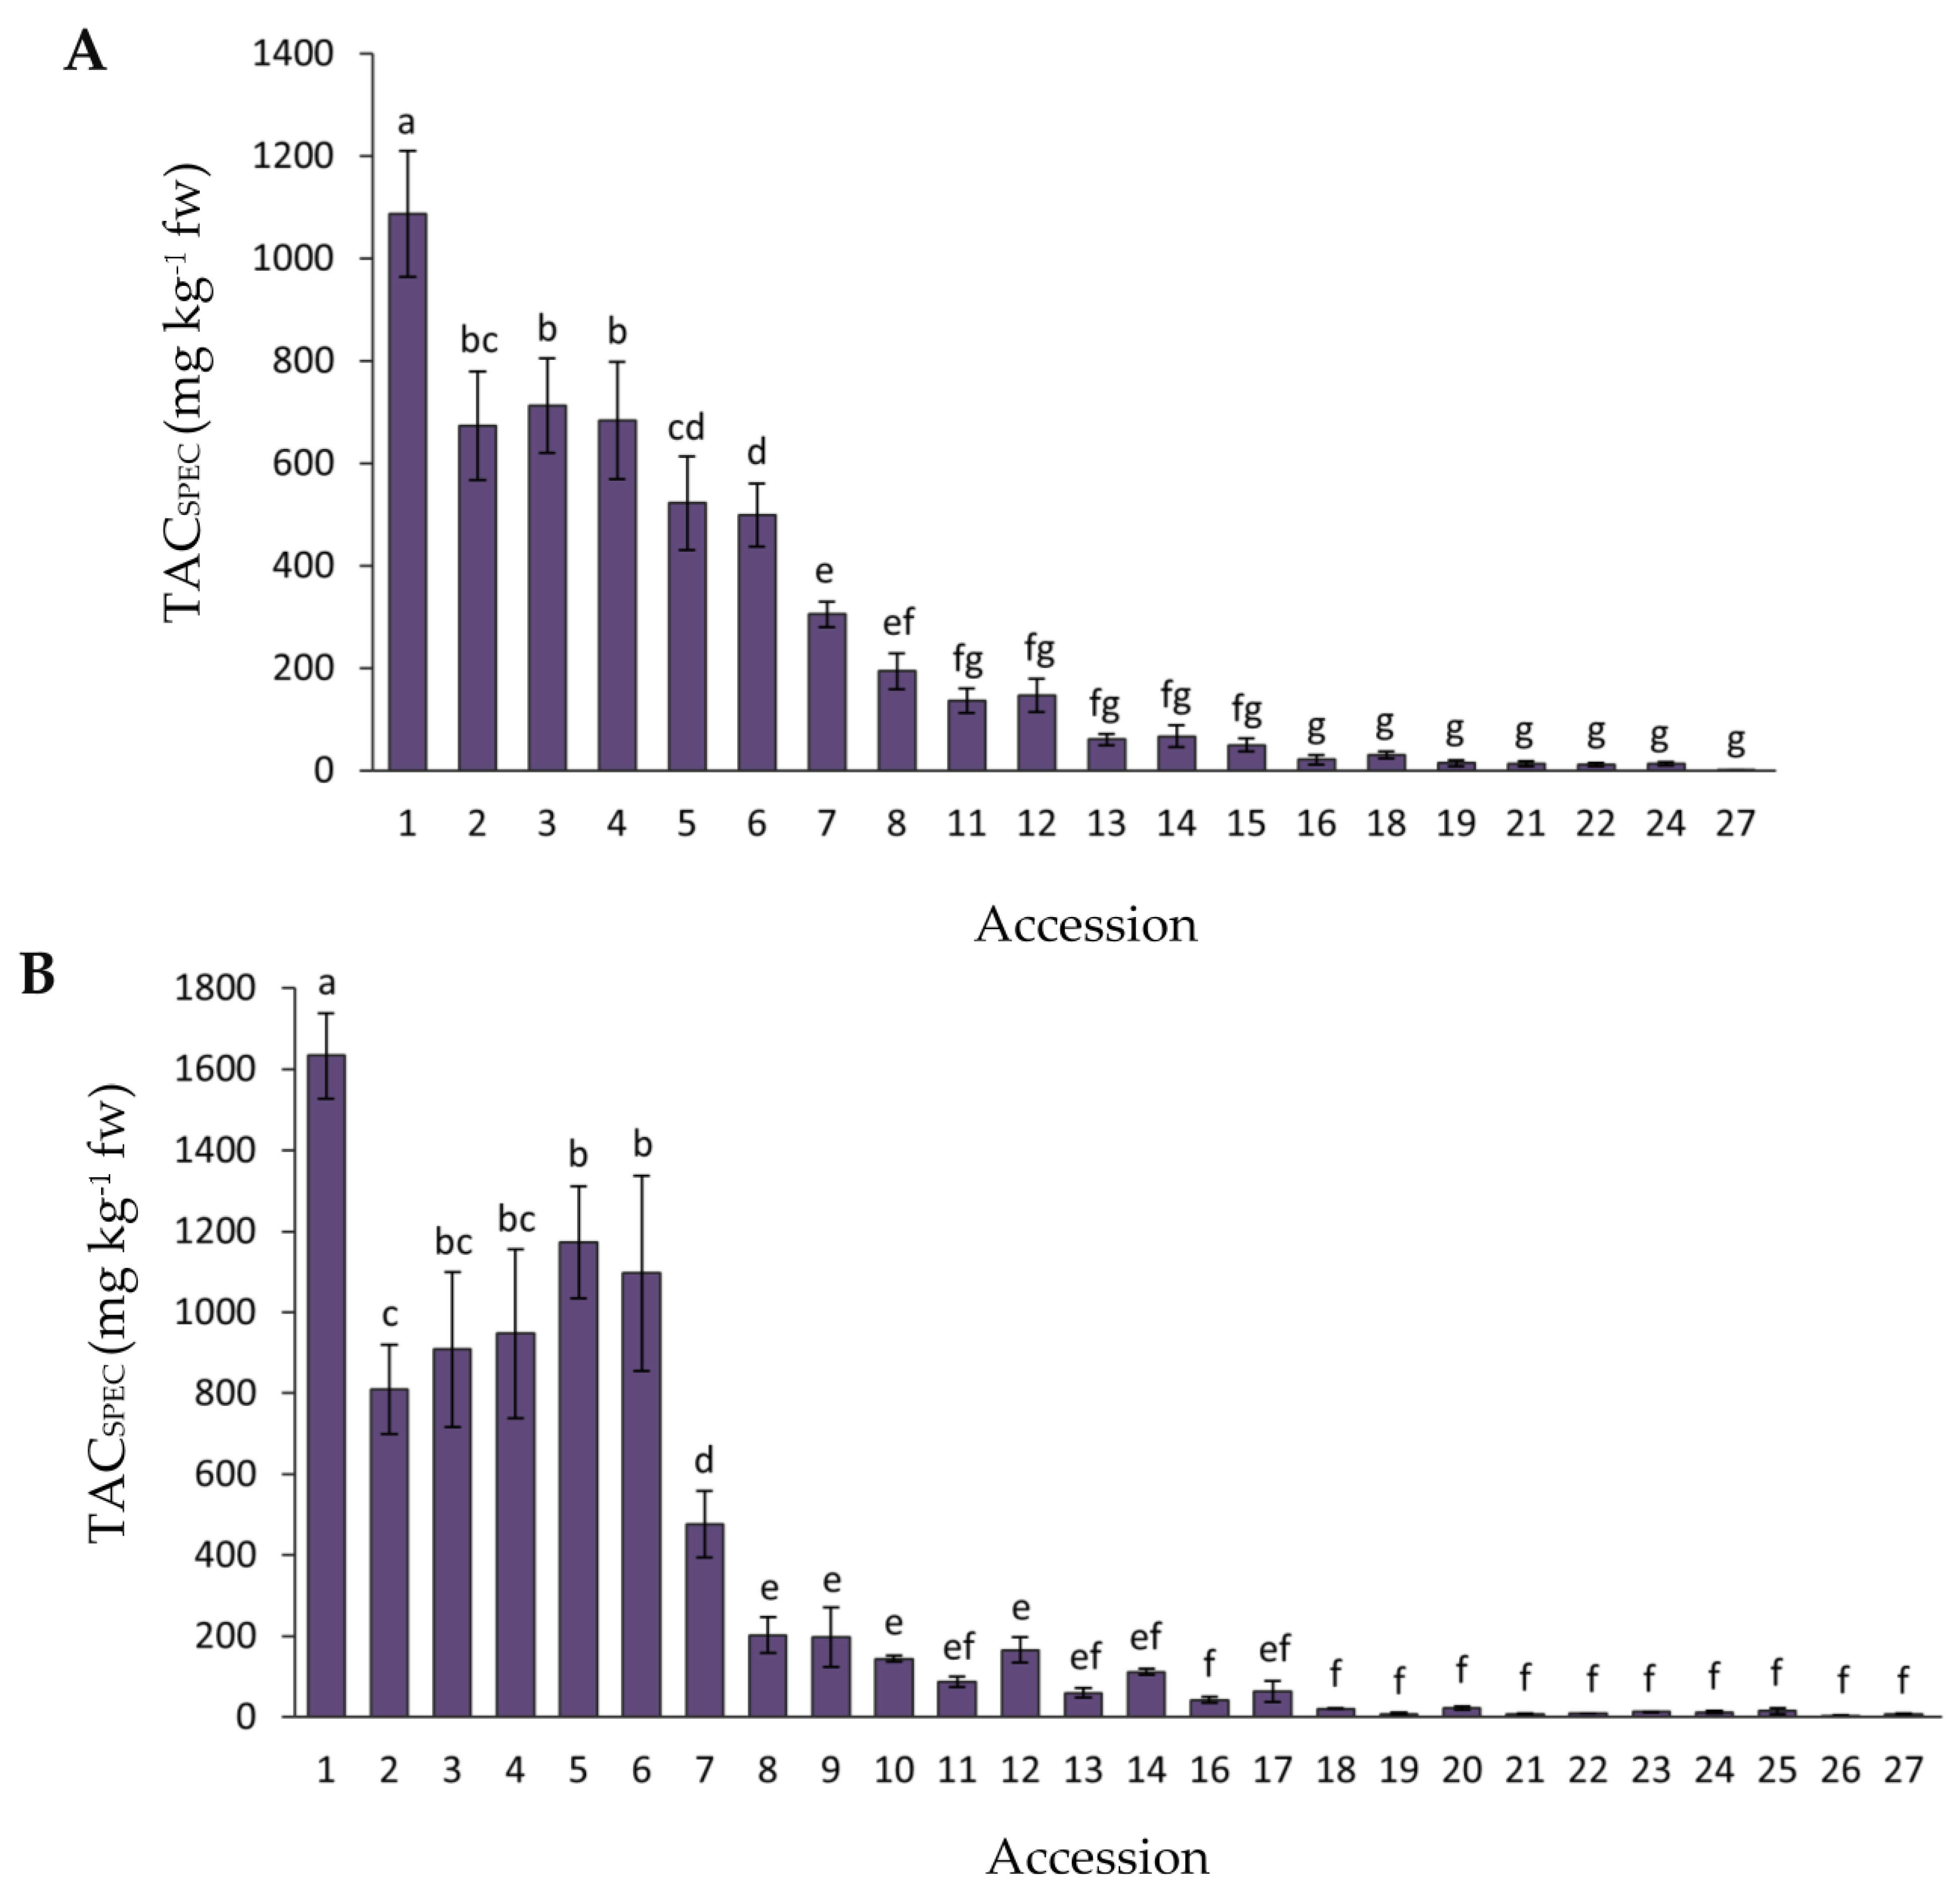
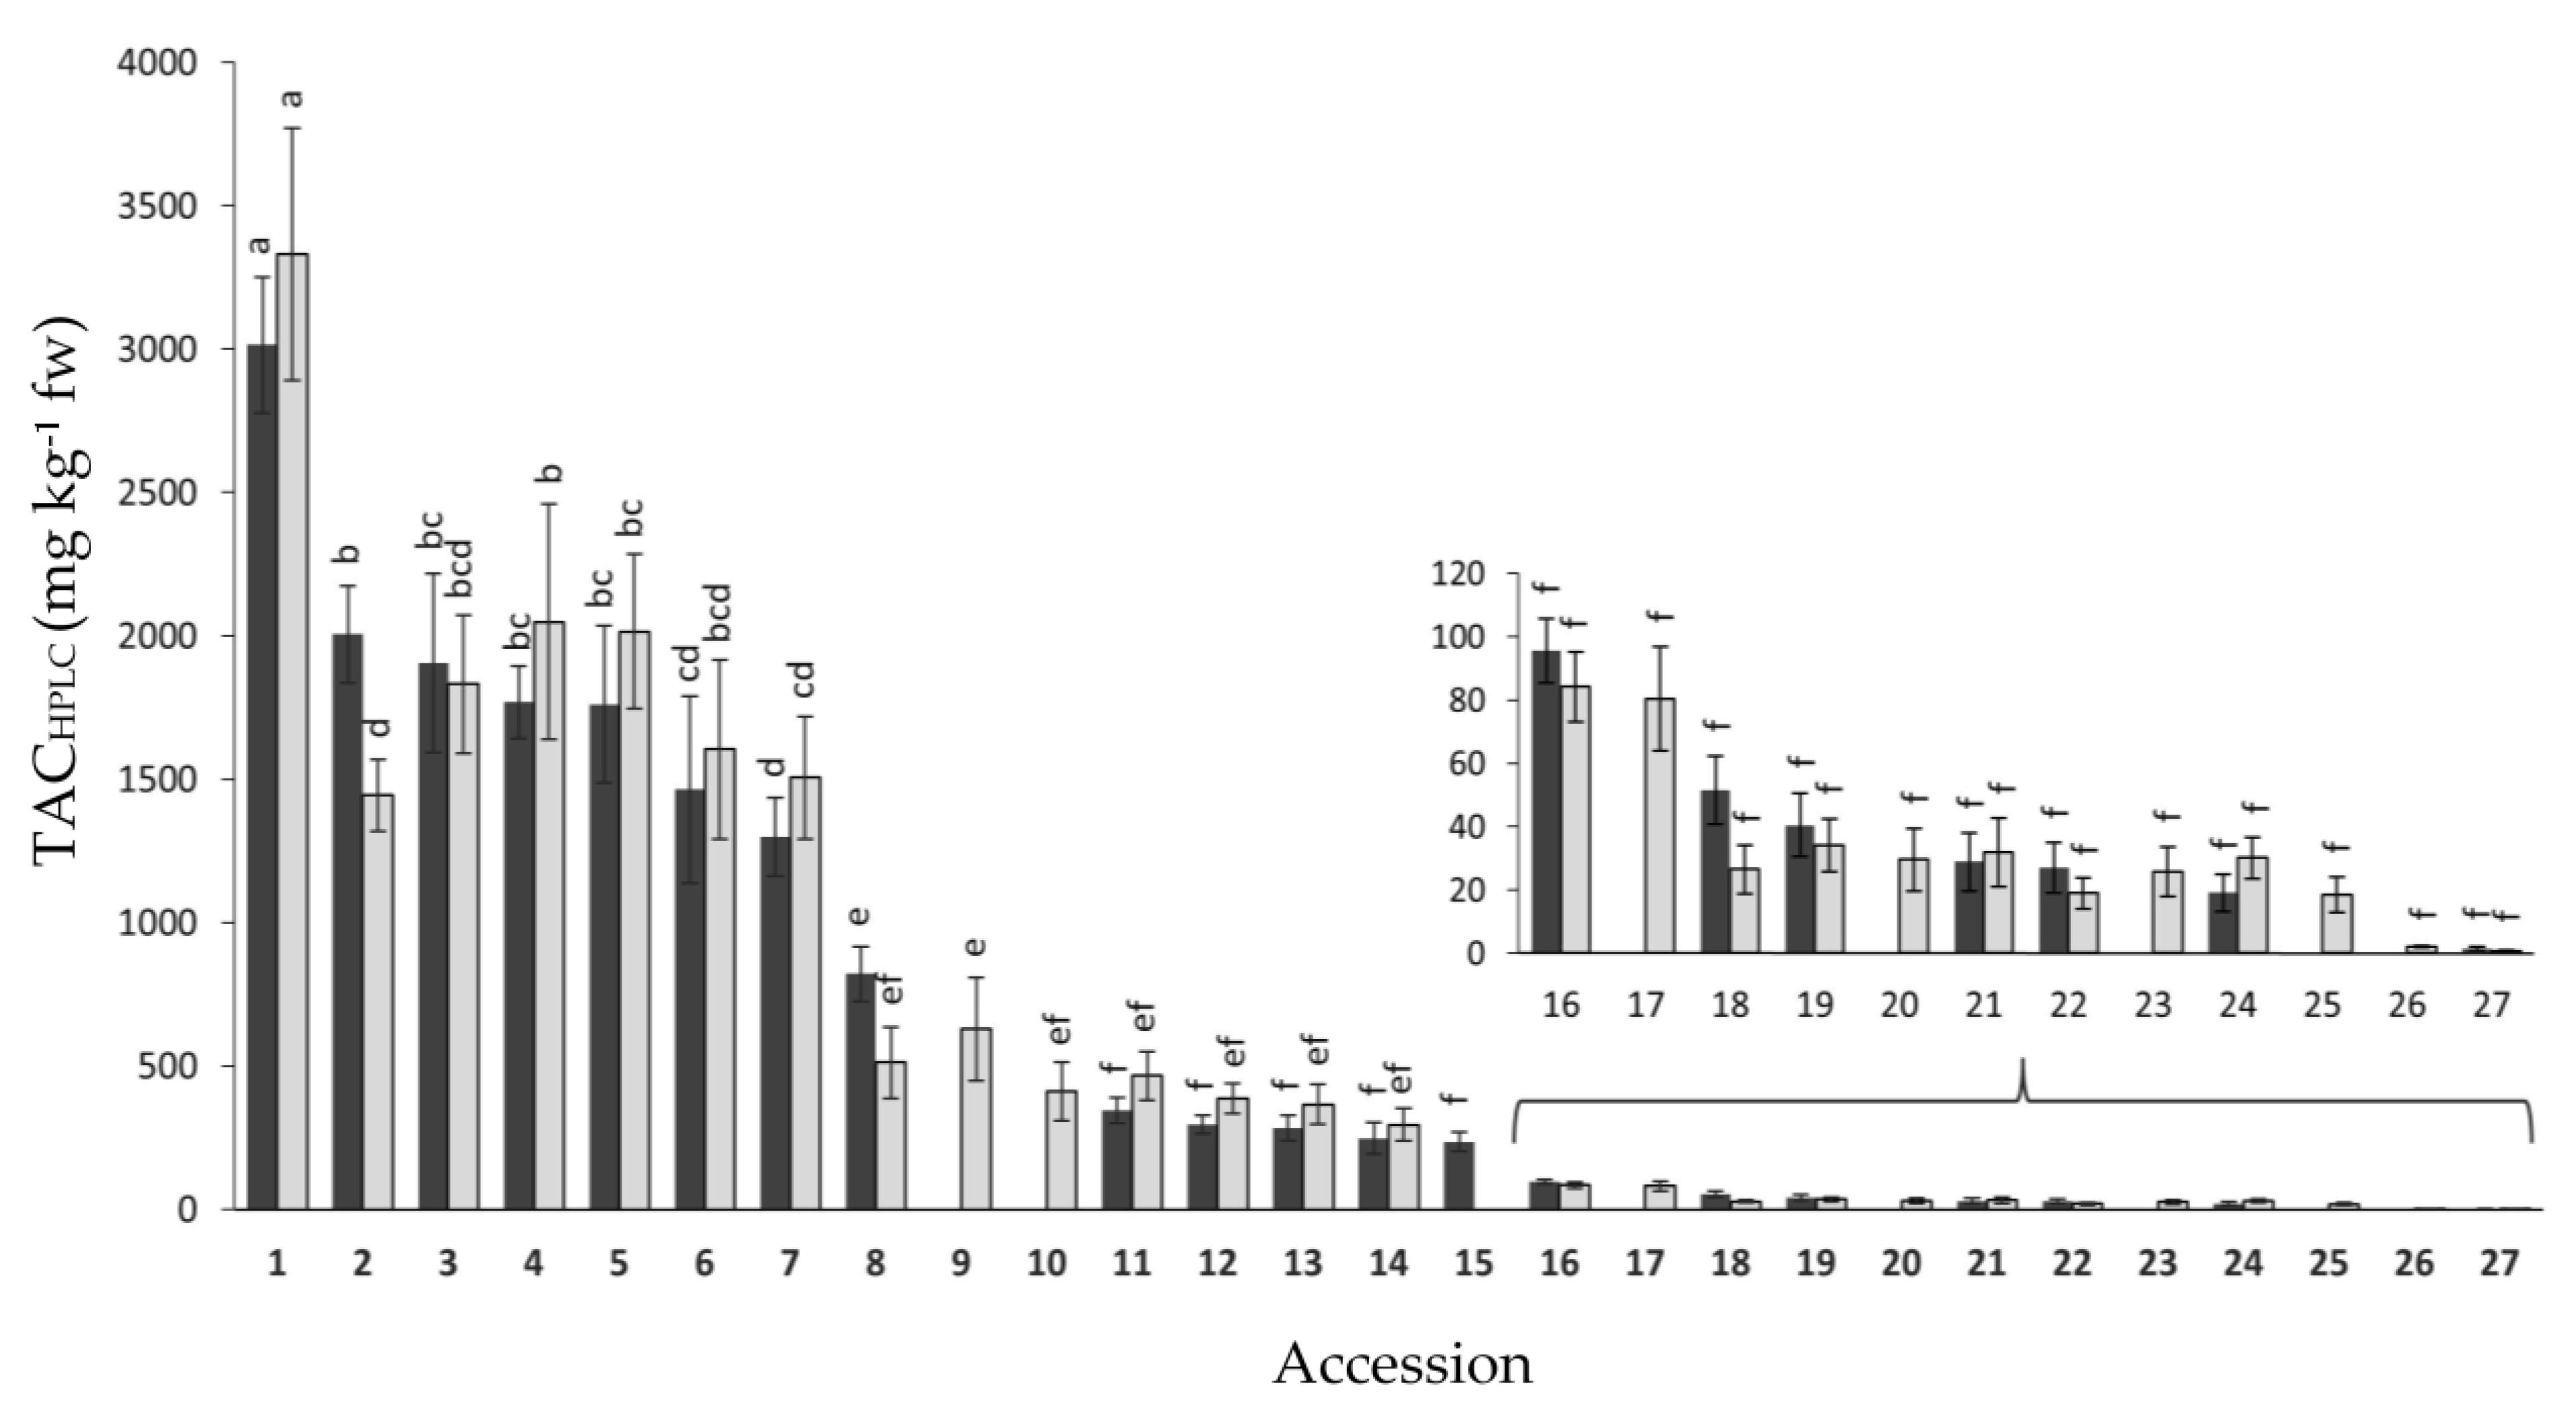
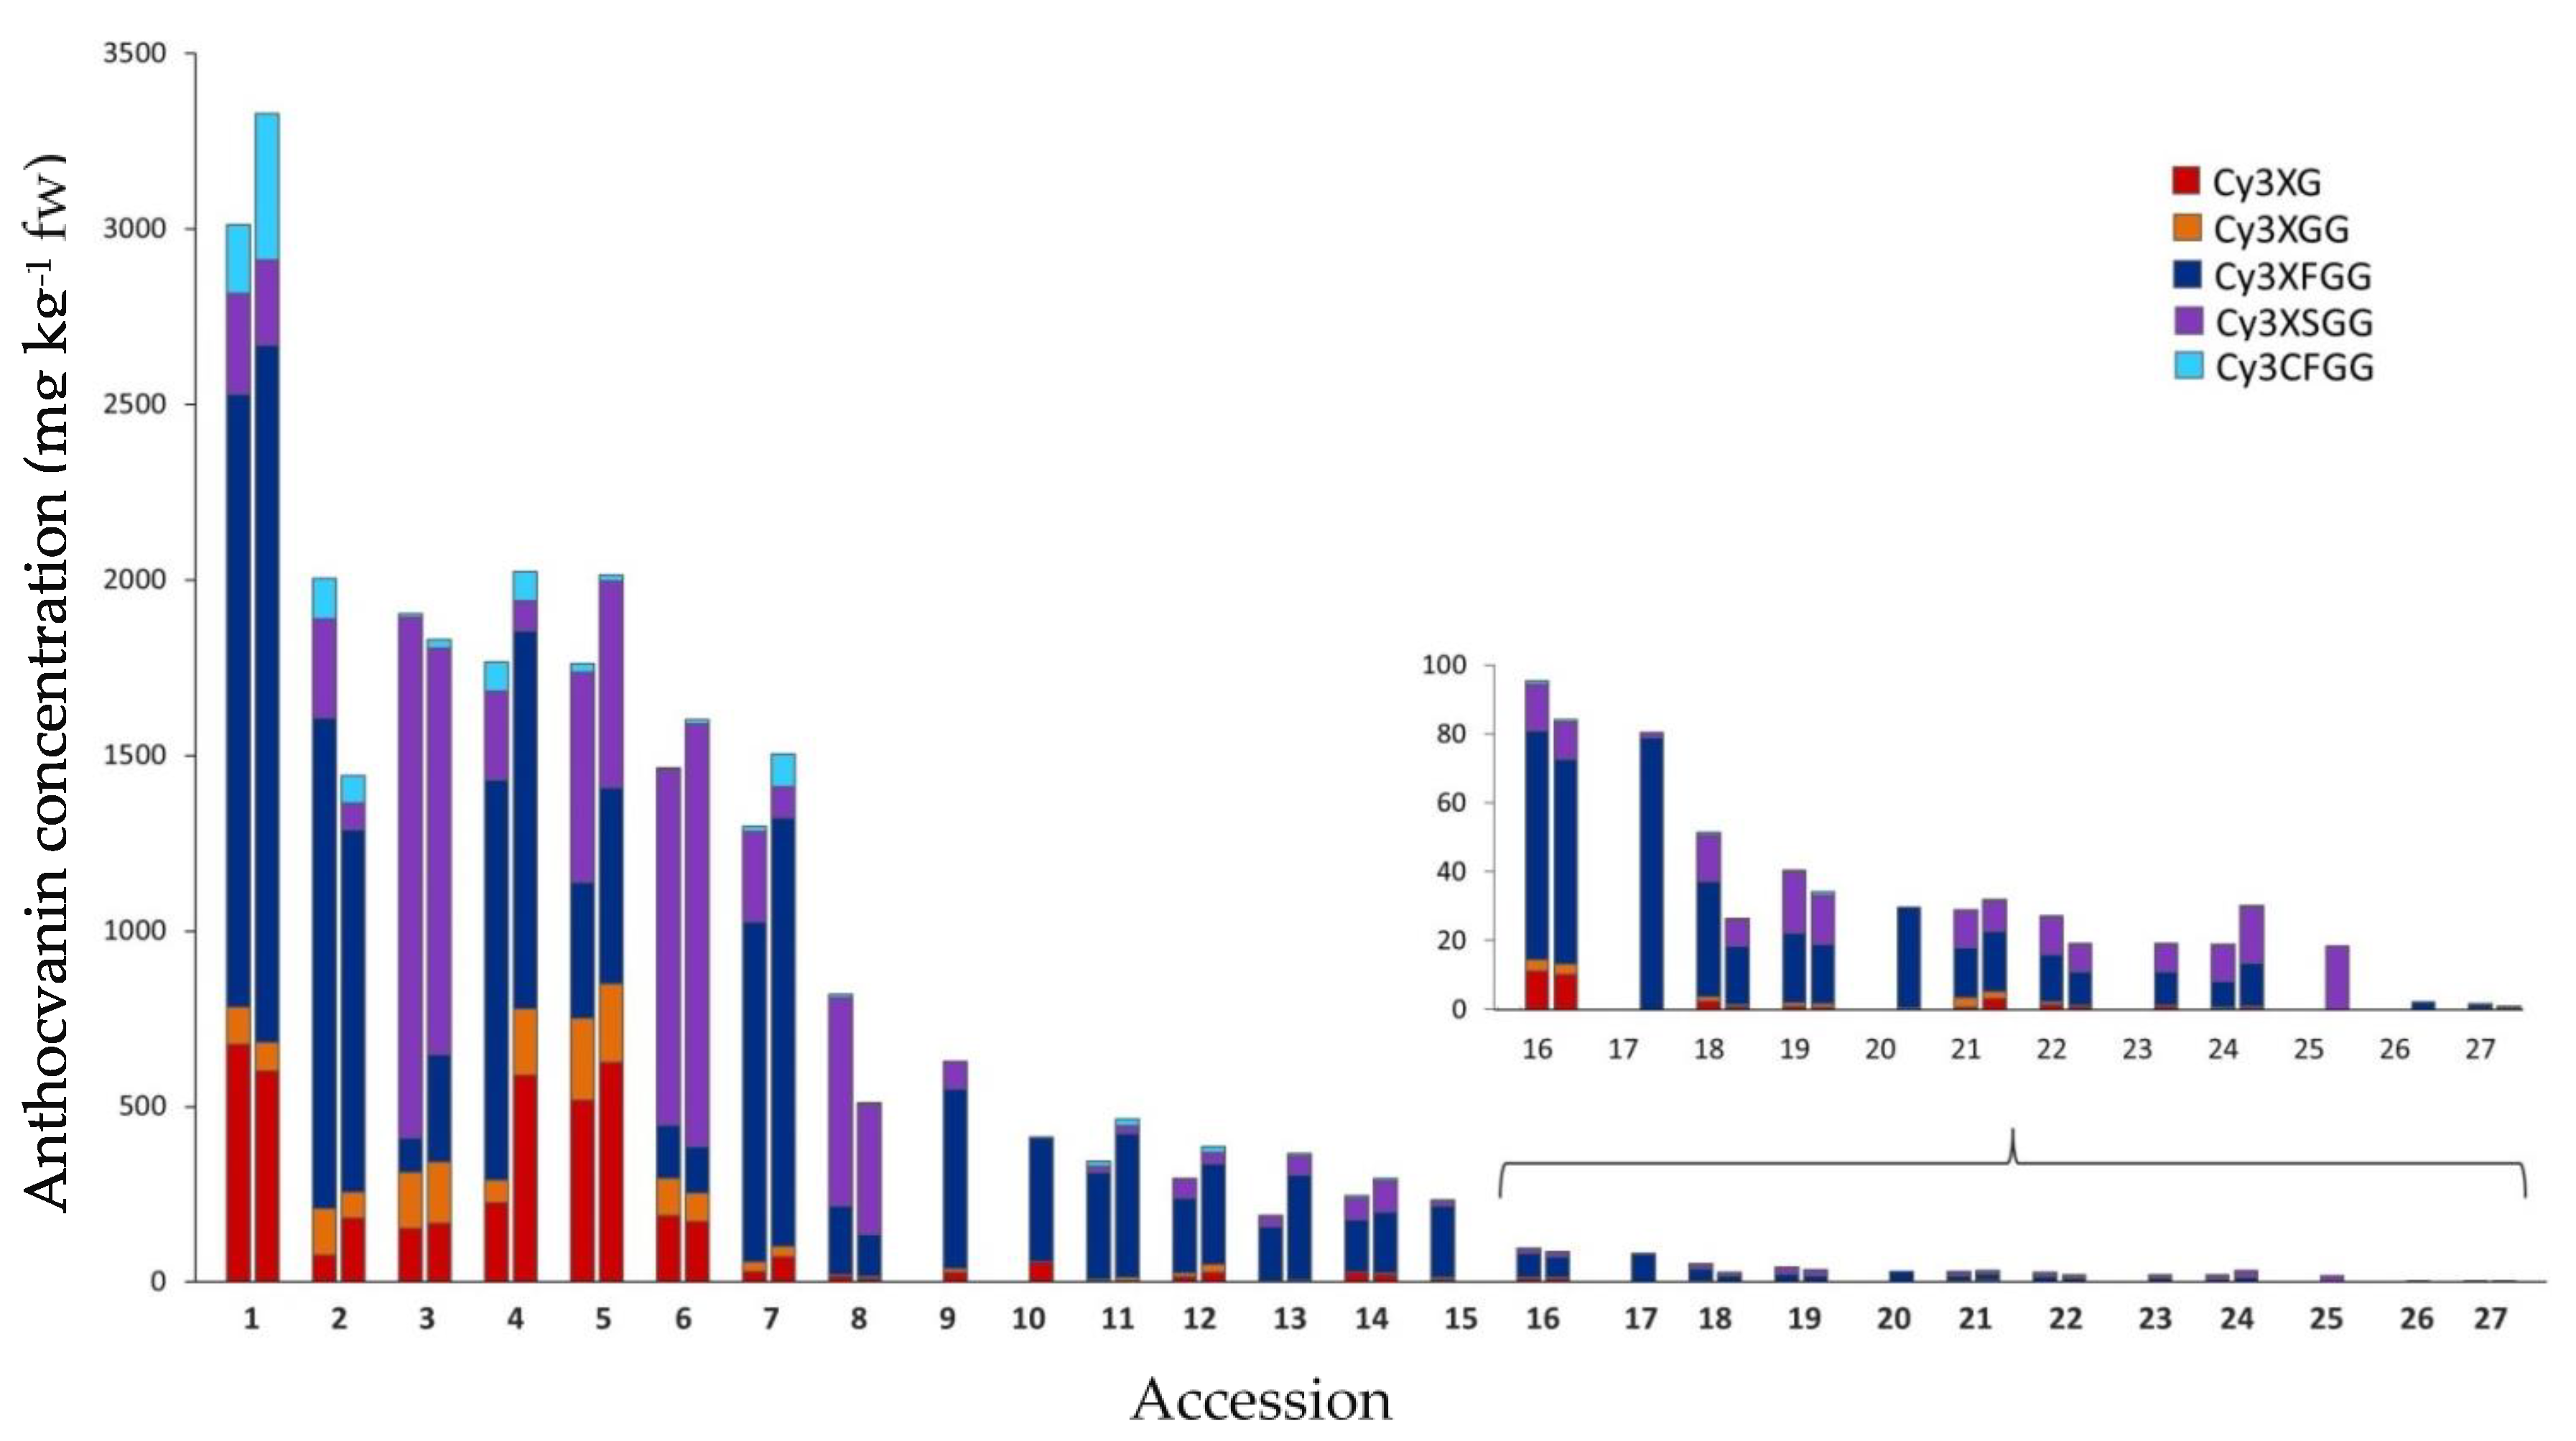
2.1. Variation for Anthocyanin Content and Composition among Carrot Accessions
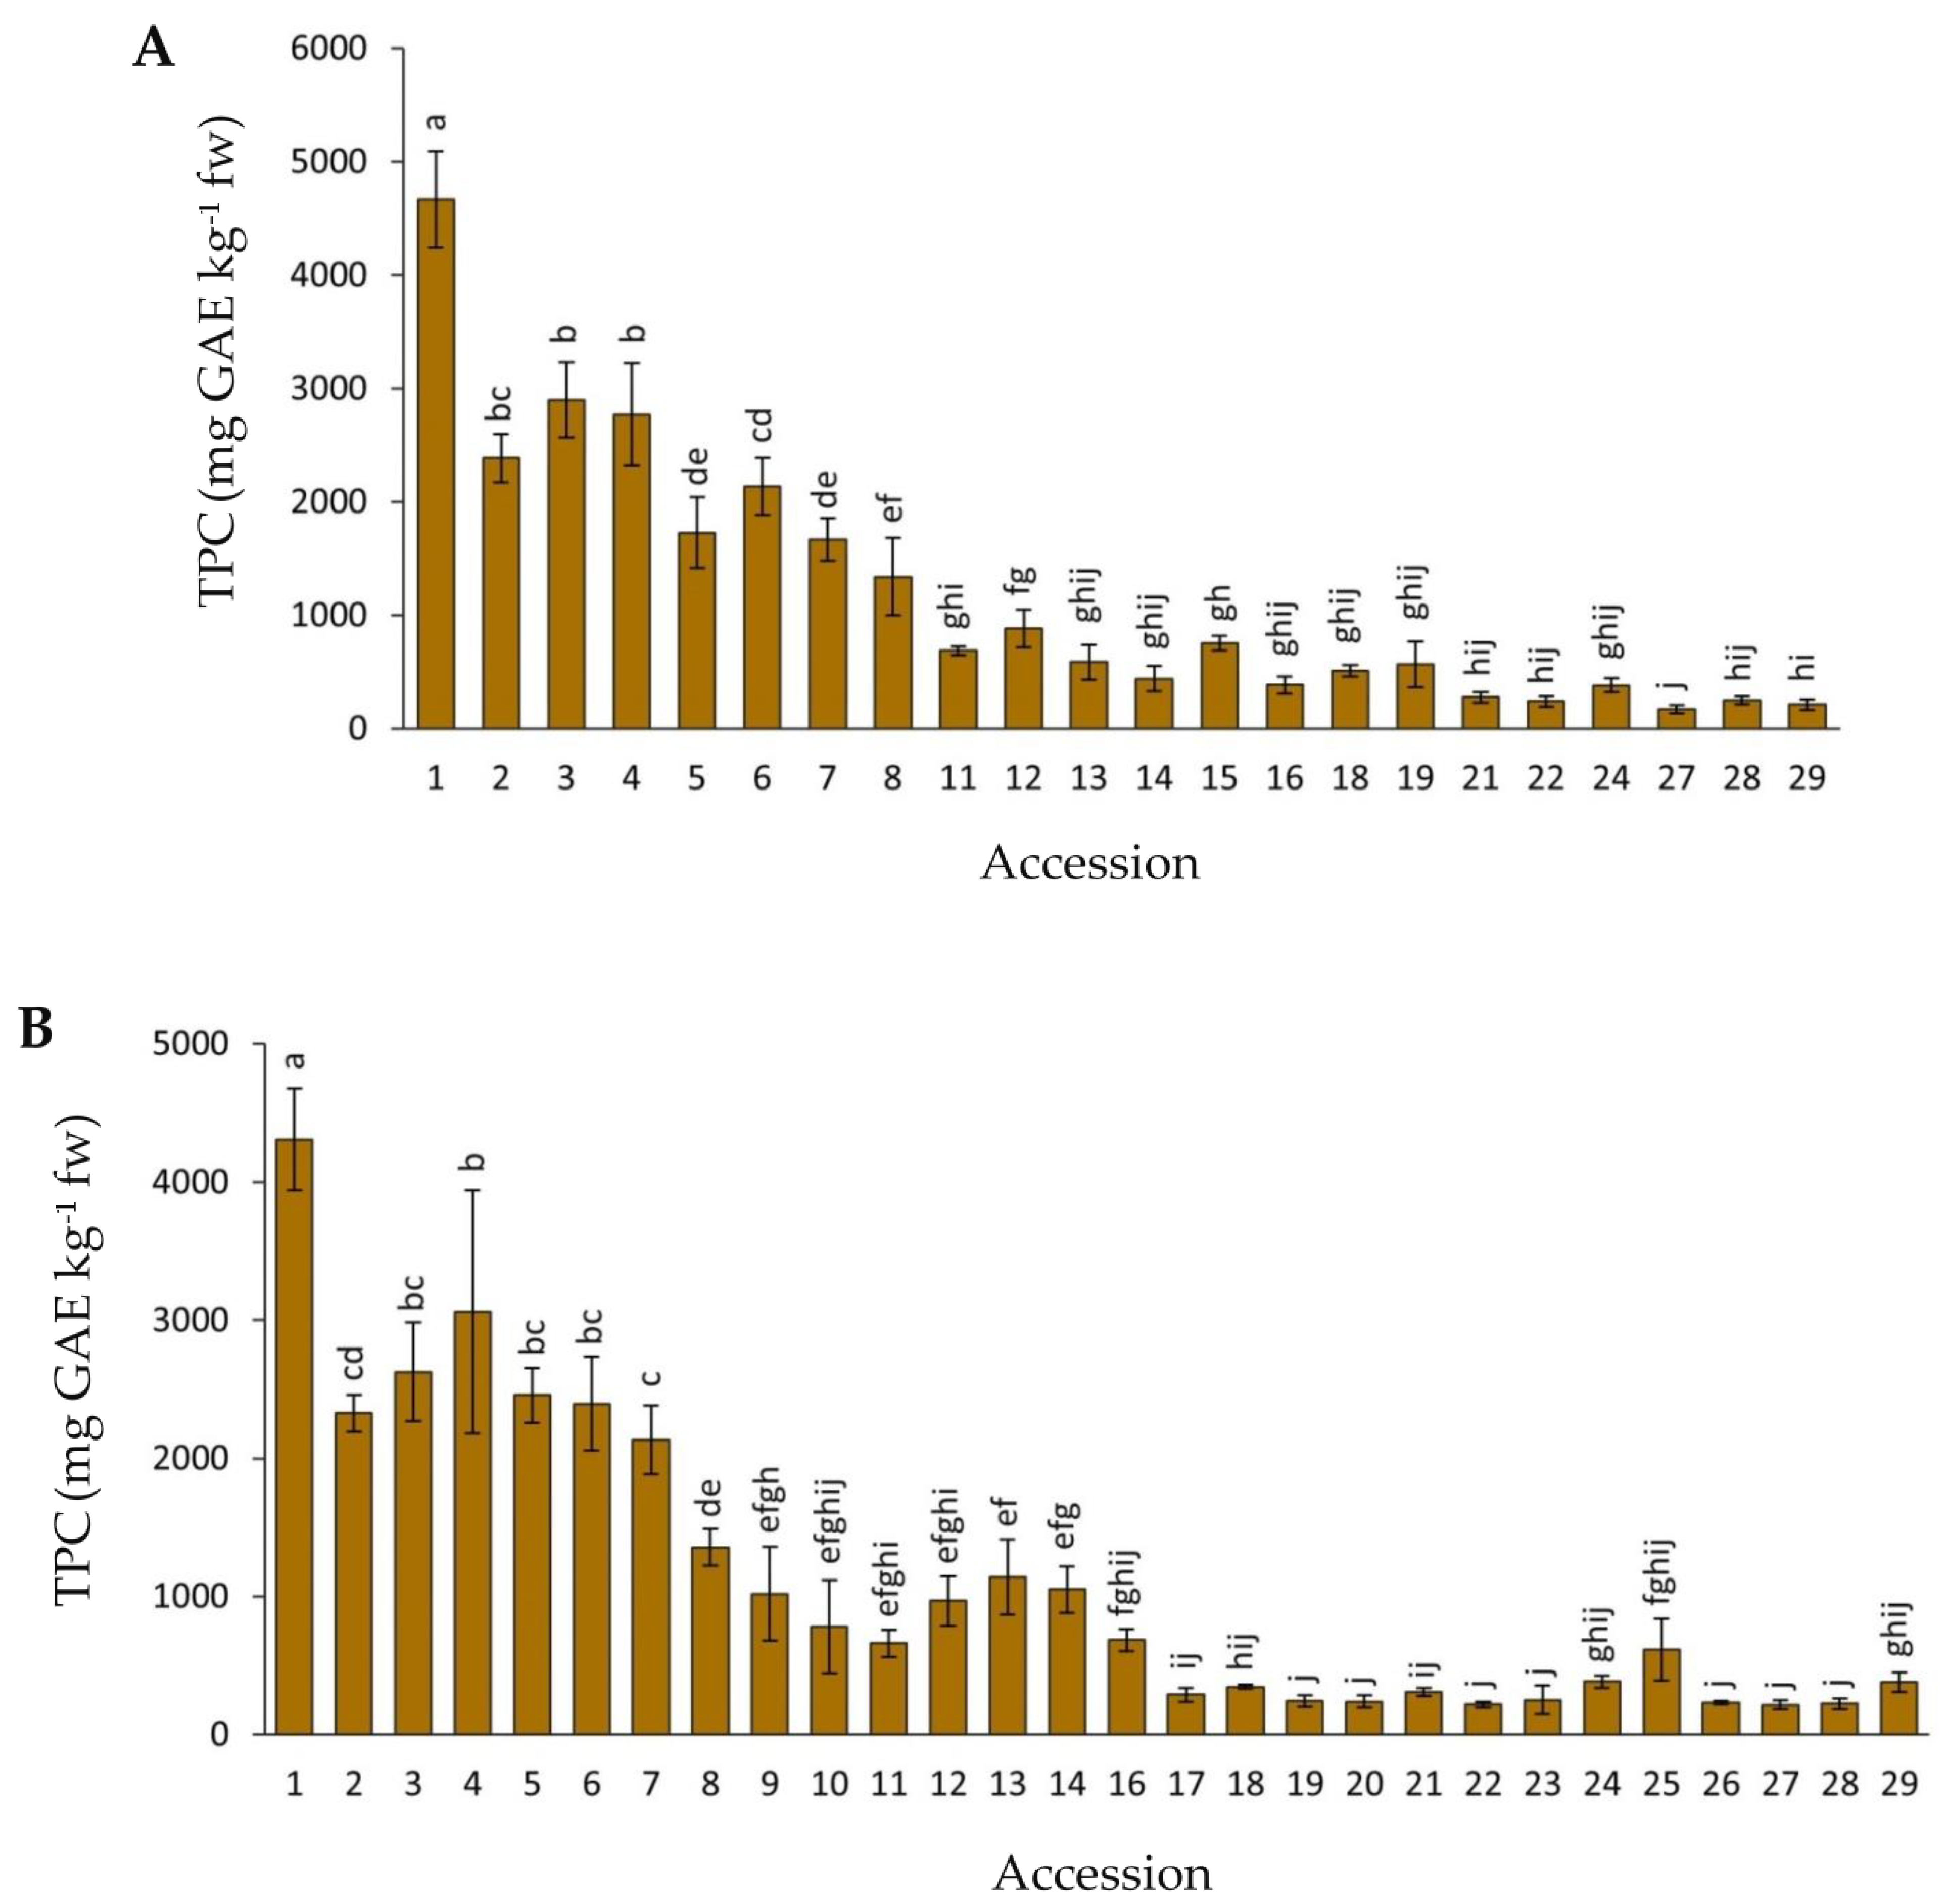
2.2. Variation for Total Phenolic Content
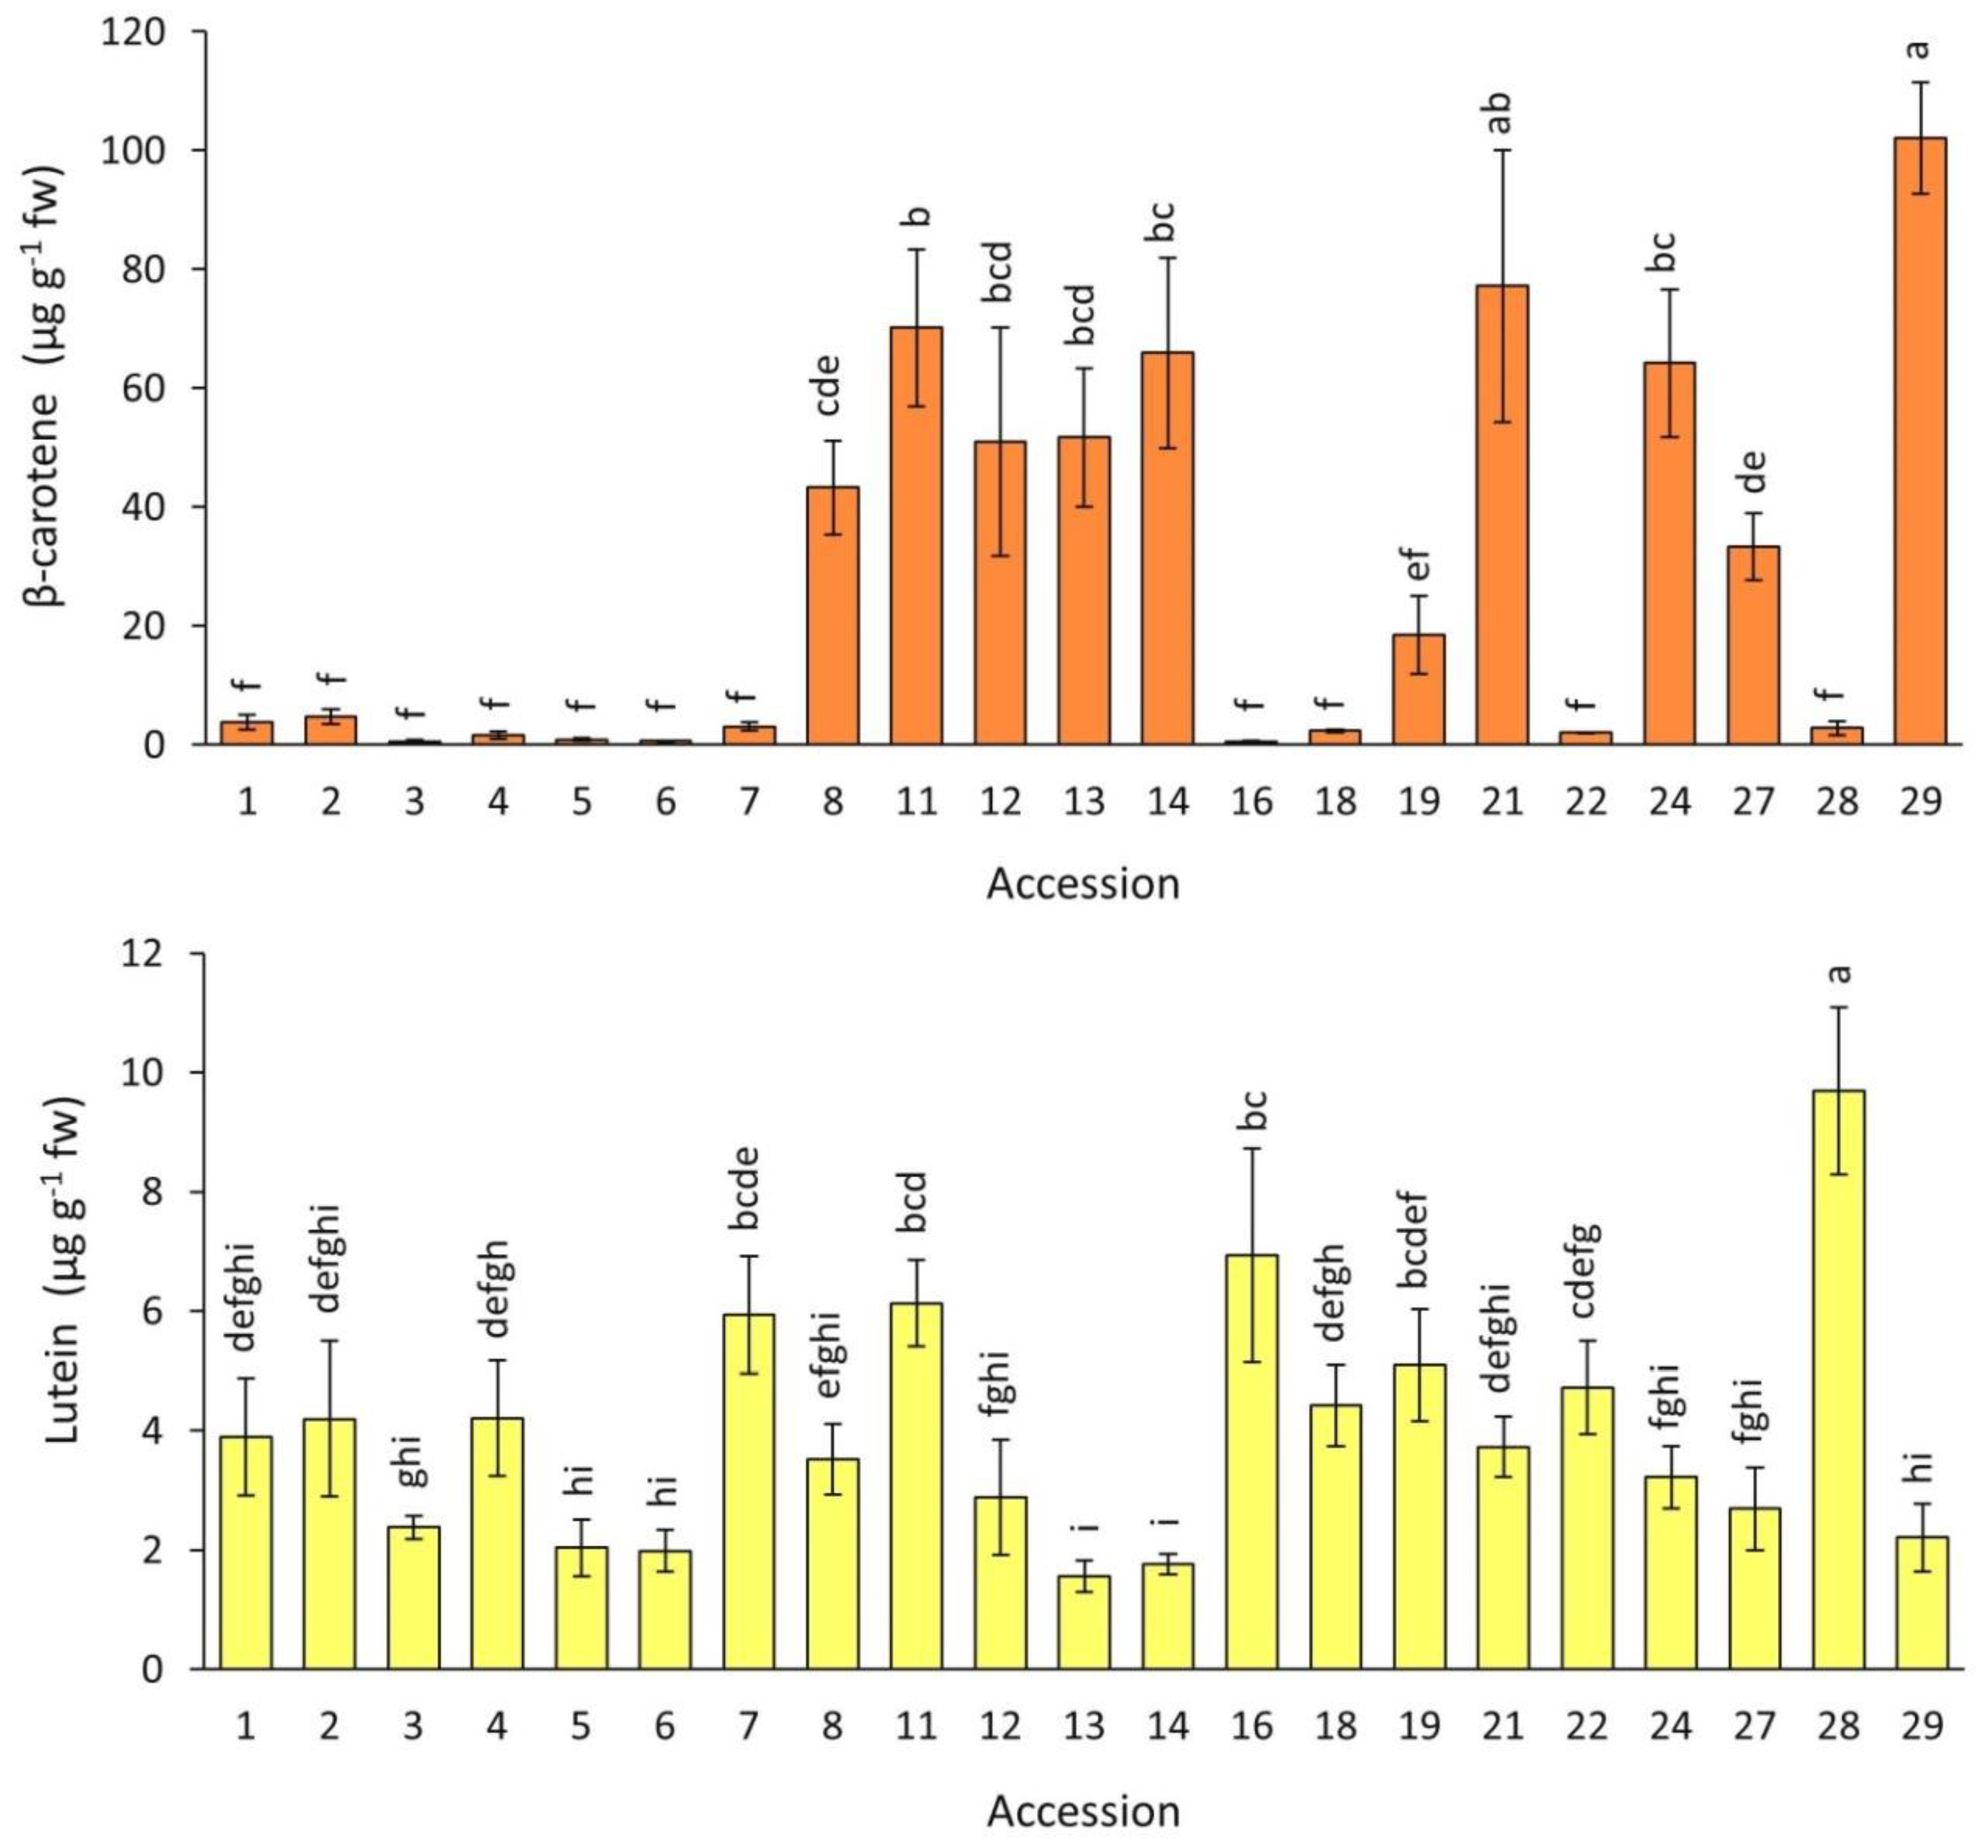
2.3. Carotenoids Content
2.4. Antioxidant Capacity
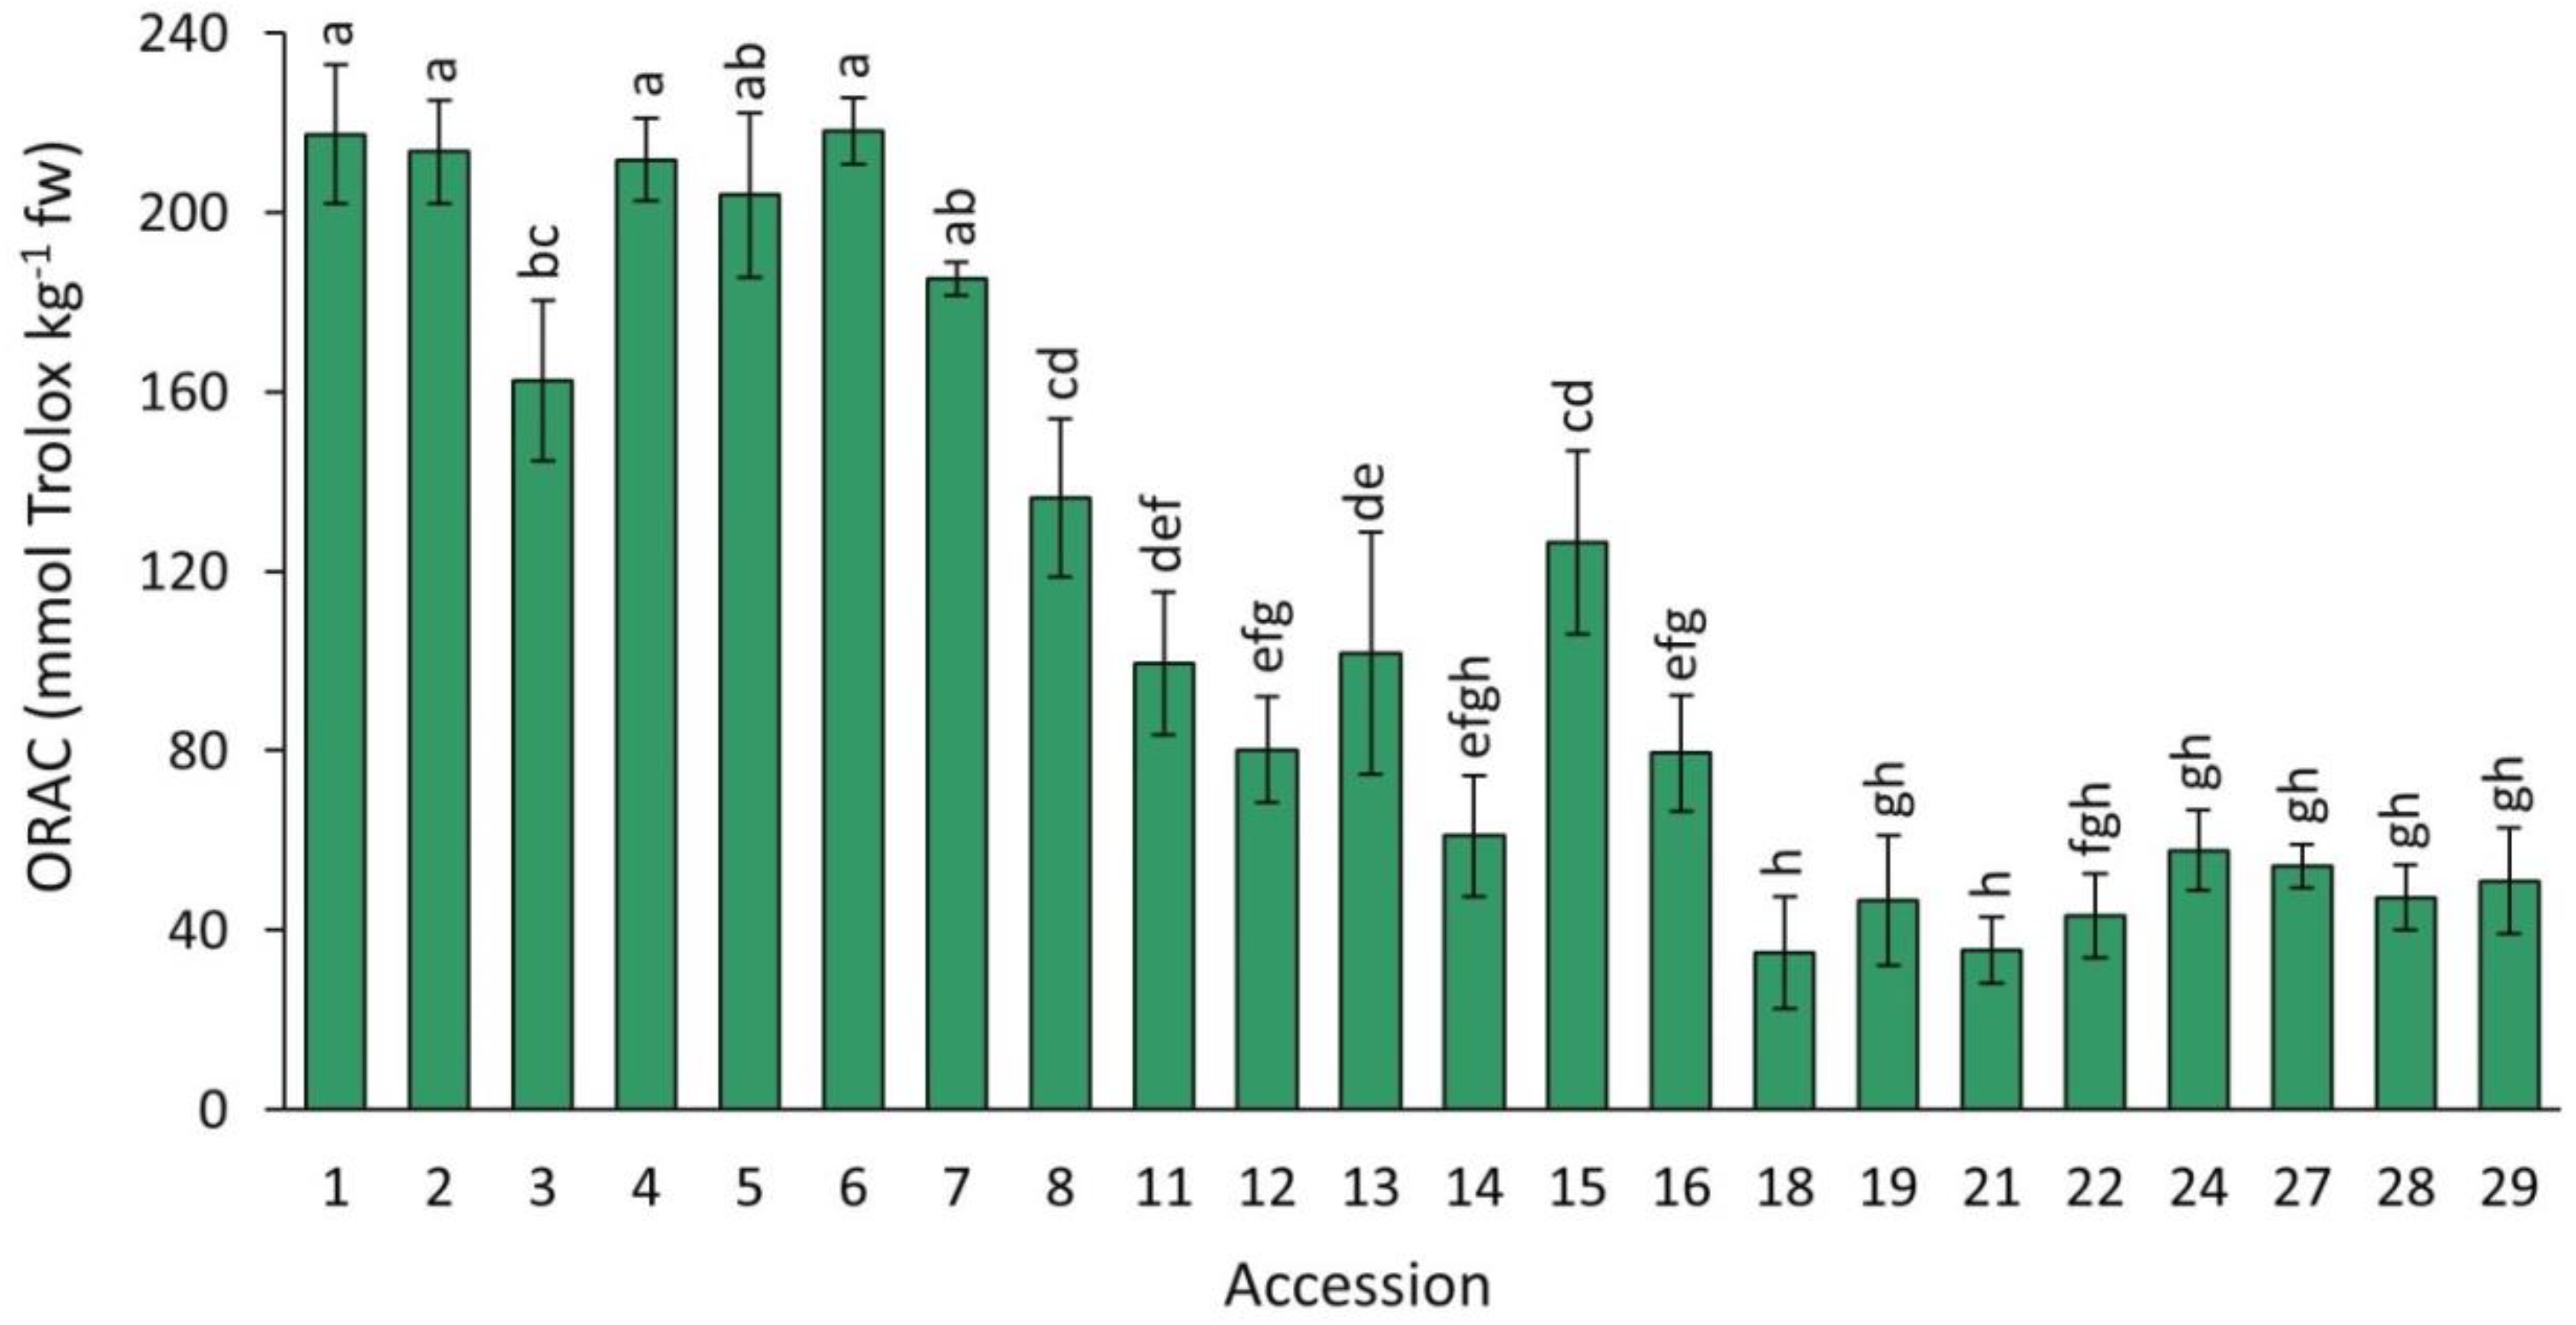
2.4.1. ORAC
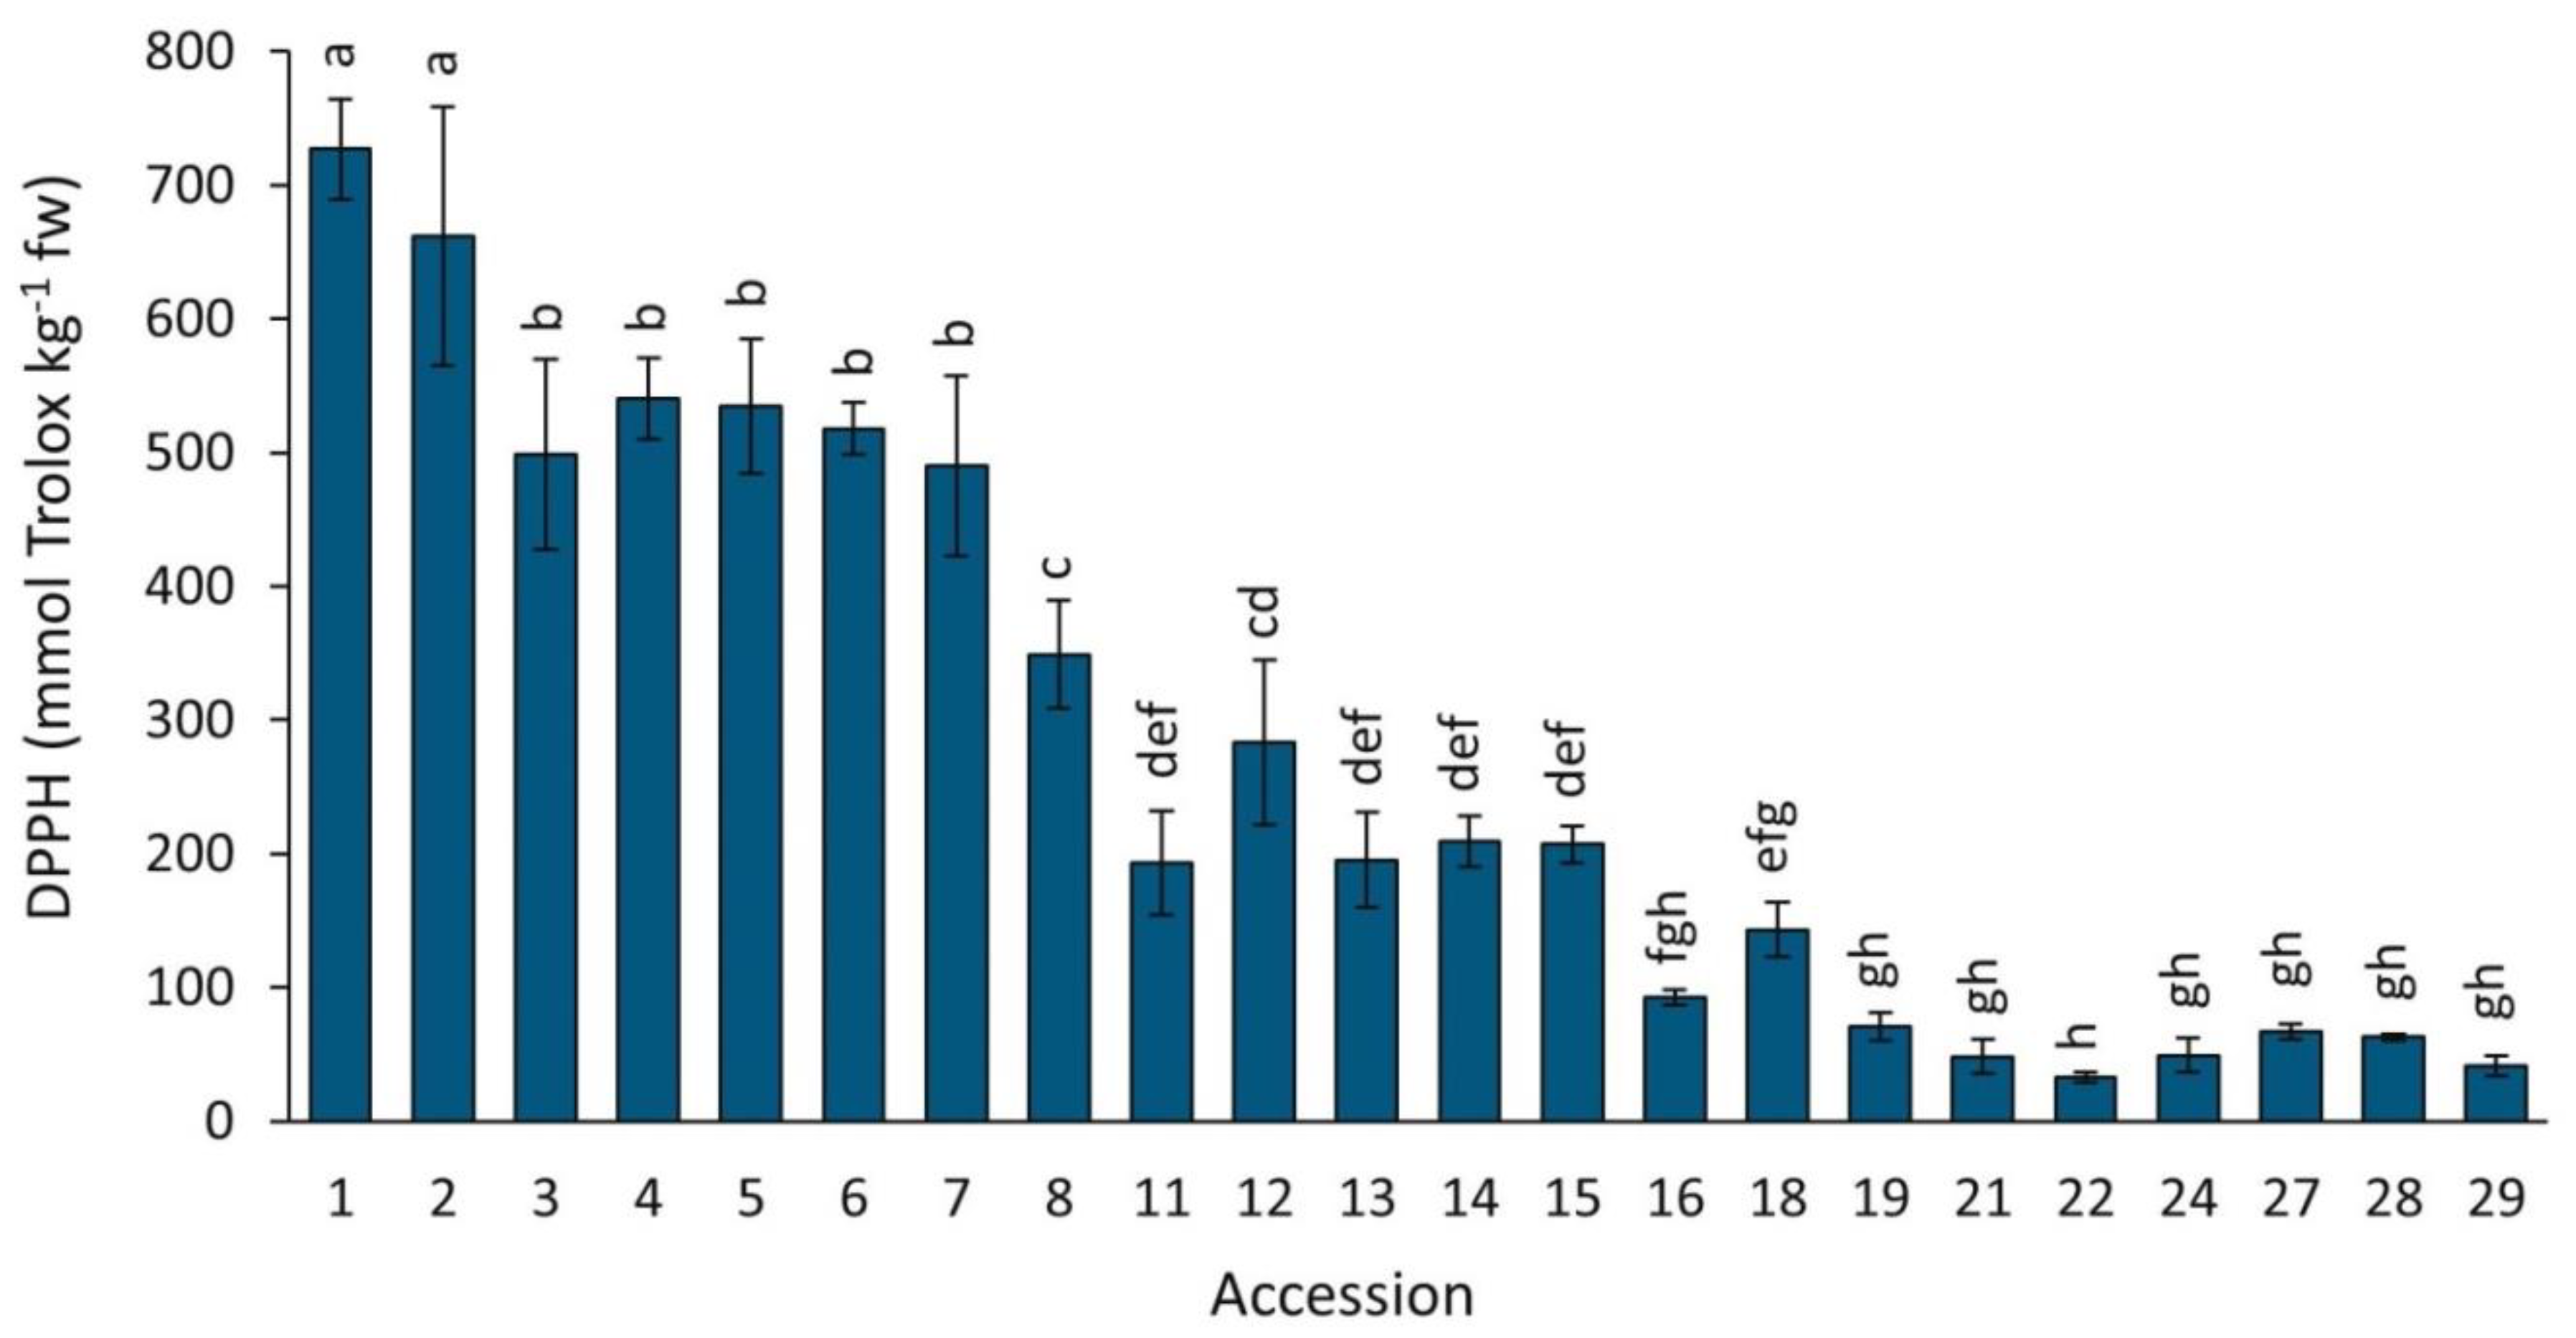
2.4.2. DPPH
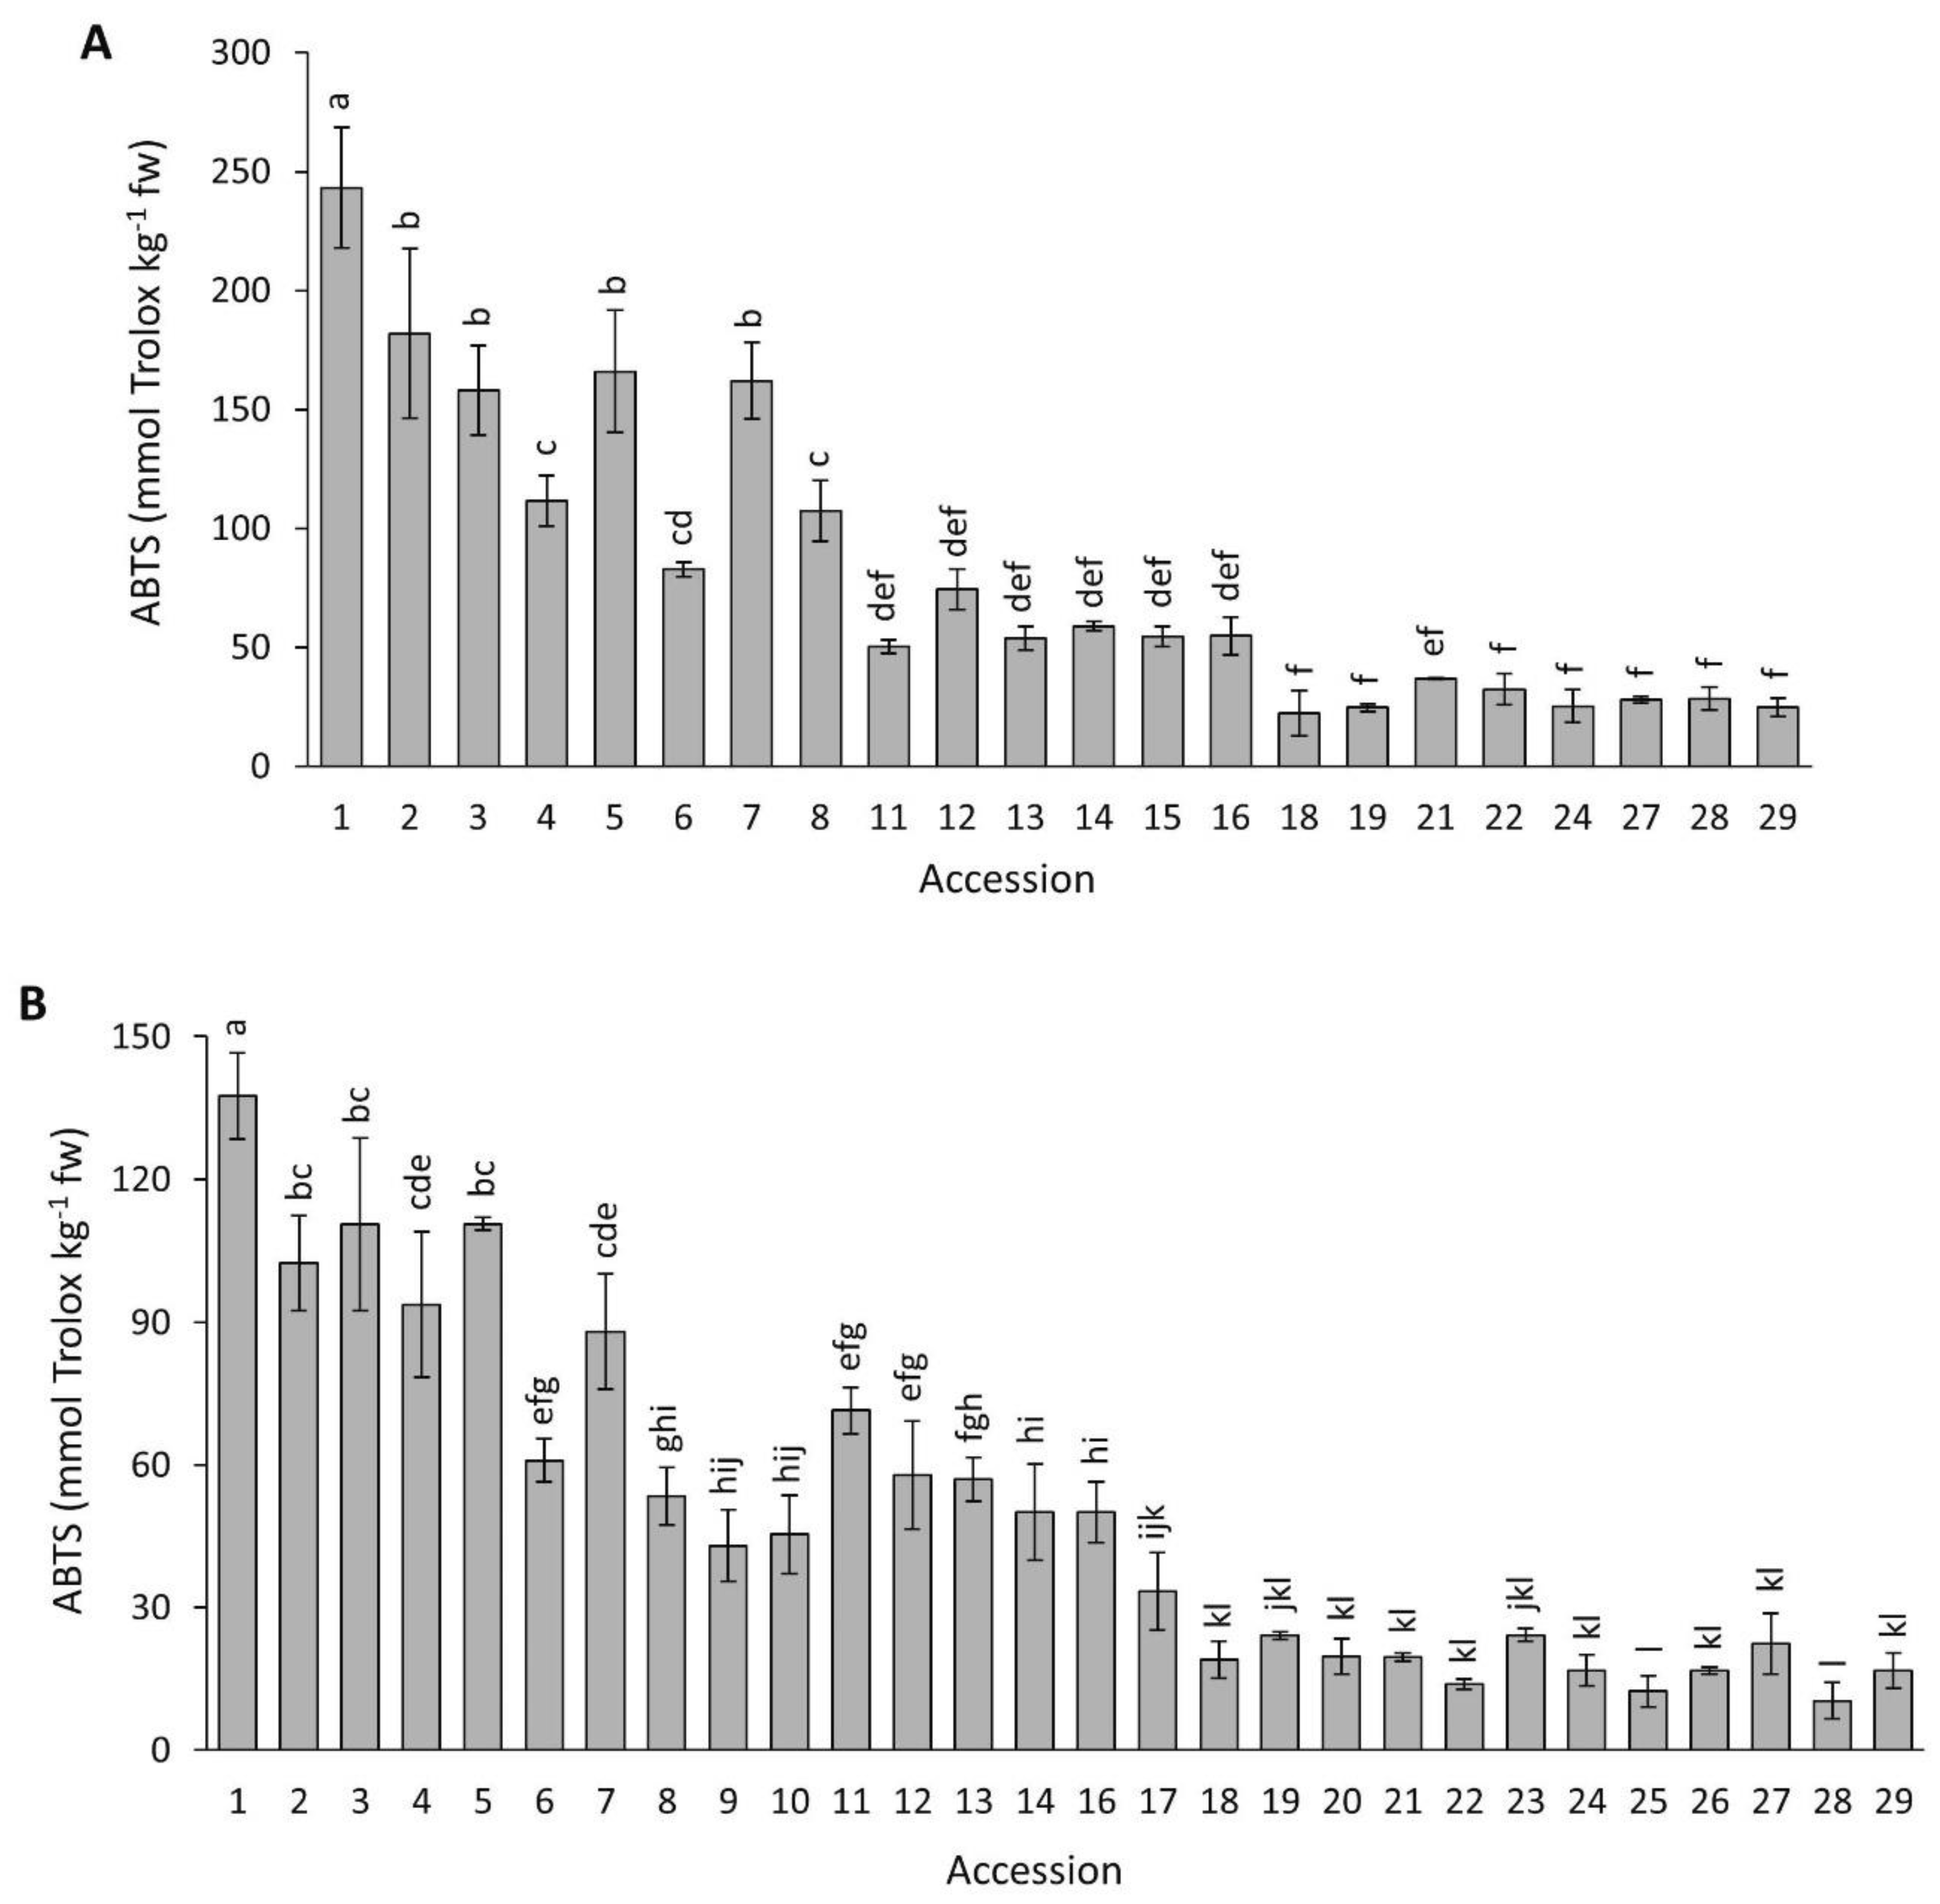
2.4.3. ABTS
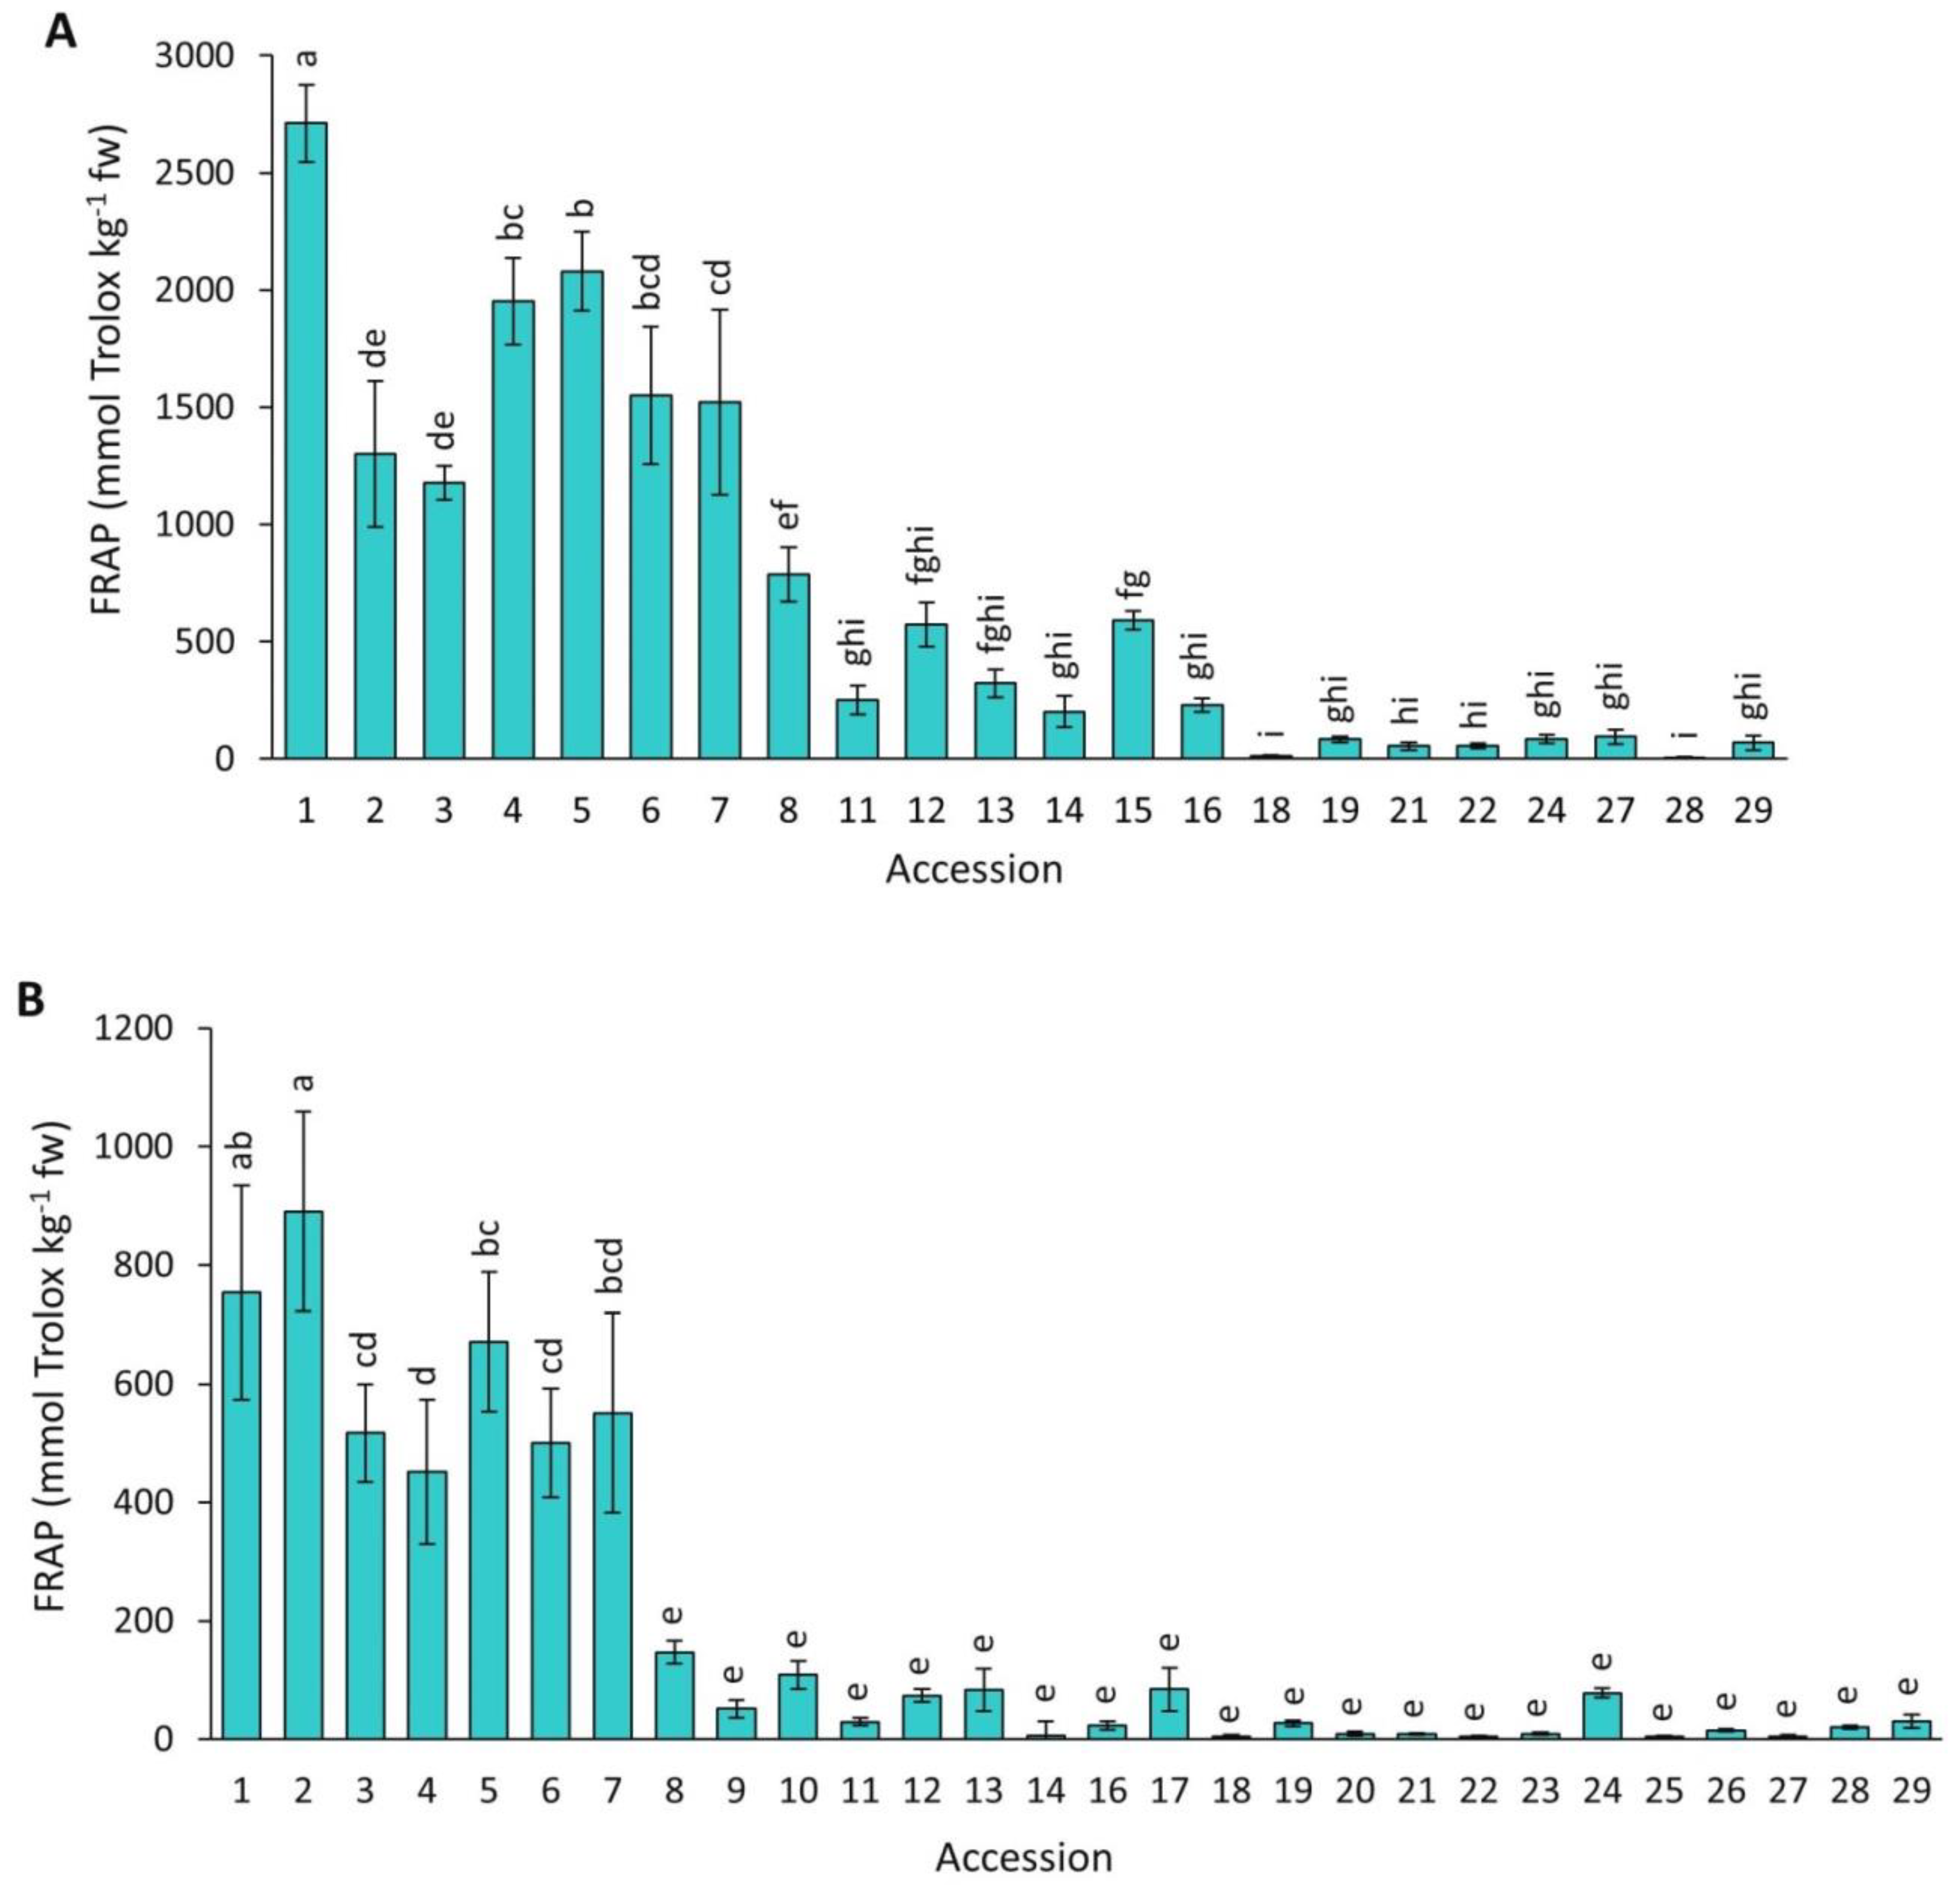
2.4.4. FRAP
2.5. Relationships between Bioactive Compound Content and Antioxidant Capacity
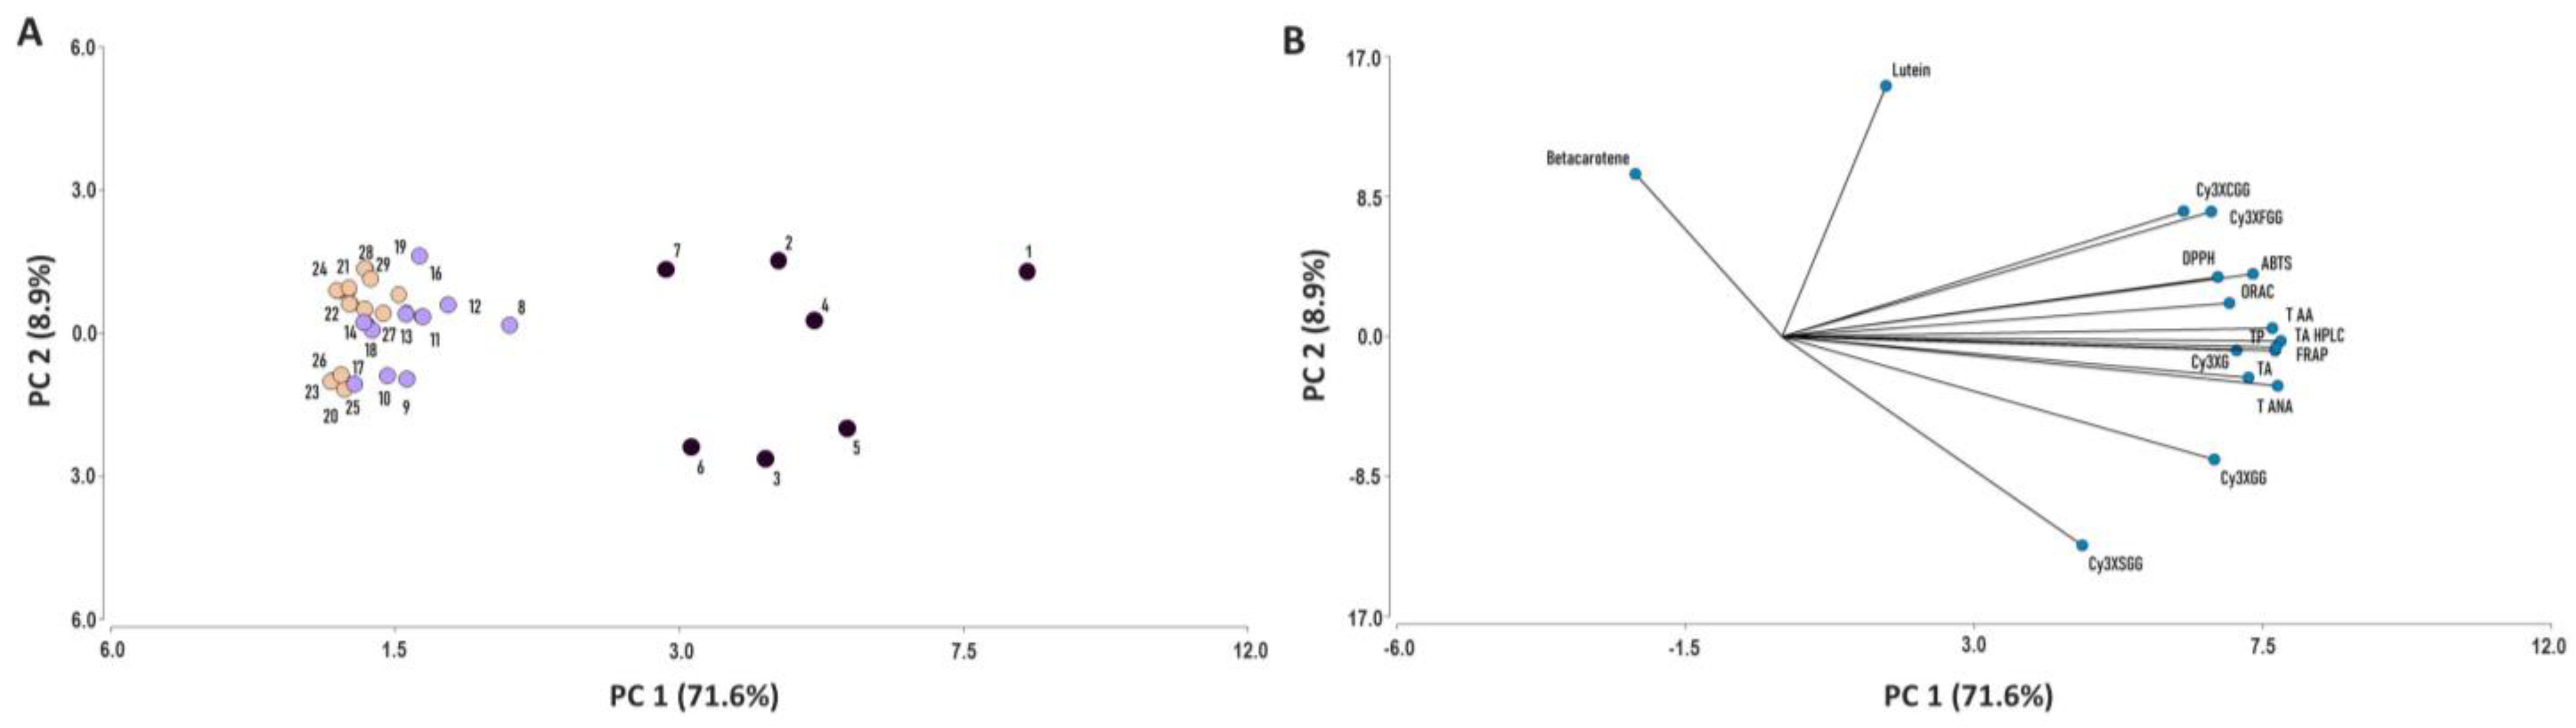
2.6. Principal Component Analysis
3. Discussion
4. Materials and Methods
4.1. Plant Materials and Cultivation Conditions
4.2. Sampling and Extraction of the Hydrophilic Fraction of Carrots
4.3. Spectrophotometric Analyses of Total Anthocyanins and Total Phenolics
4.4. Anthocyanin HLPC-UV-Vis Analysis
4.5. Carotenoids HPLC Analysis
4.6. Antioxidant Capacity
4.7. Data Analysis
4.8. Principal Component Analysis
5. Conclusions
Supplementary Materials
Author Contributions
Funding
Institutional Review Board Statement
Informed Consent Statement
Data Availability Statement
Conflicts of Interest
References
- FAO. 2017. Available online: www.fao.org/statistics (accessed on 17 June 2019).
- Arscott, S.A.; Tanumihardjo, S.A. Carrots of many colors provide basic nutrition and bioavailable phytochemicals acting as a functional food. Compr. Rev. Food Sci. Food Saf. 2010, 9, 223–239. [Google Scholar] [CrossRef]
- Elvira-Torales, L.I.; García-Alonso, J.; Periago-Castón, M.J. Nutritional Importance of Carotenoids and Their Effect on Liver Health: A Review. Antioxidants 2019, 8, 229. [Google Scholar] [CrossRef] [PubMed]
- Gonçalves, A.C.; Nunes, A.R.; Falcão, A.; Alves, G.; Silva, L.R. Dietary effects of anthocyanins in human health: A comprehensive review. Pharmaceuticals 2021, 14, 690. [Google Scholar] [CrossRef] [PubMed]
- Landrum, J.T. (Ed.) Carotenoids. Physical, Chemical, and Biological Functions and Properties; CRC Press: Boca Raton, FL, USA, 2009; p. 568. [Google Scholar]
- Li, B.; Wang, L.; Bai, W.; Chen, W.; Chen, F.; Shu, C. Anthocyanins: Chemistry, Processing and Bioactivity; Springer: Singapore, 2021; p. 443. [Google Scholar]
- Ahmad, T.; Cawood, M.; Iqbal, Q.; Ariño, A.; Batool, A.; Tariq, R.M.S.; Azam, M.; Akhtar, S. Phytochemicals in Daucus carota and their health benefits. Foods 2019, 8, 424. [Google Scholar] [CrossRef]
- Cavagnaro, P.F.; Iorizzo, M. Carrot anthocyanins. Diversity, genetics and genomics. In The Carrot Genome; Simon, P., Iorizzo, M., Grzebelus, D., Baranski, R., Eds.; Springer Nature: Cham, Switzerland, 2019; pp. 261–277. [Google Scholar]
- Prior, R.L.; Wu, X. Anthocyanins: Structural characteristics that result in unique metabolic patterns and biological activities. Free Radic. Res. 2006, 40, 1014–1028. [Google Scholar] [CrossRef]
- Joseph, J.A.; Shukitt-Hale, B.; Casadesus, G. Reversing the deleterious effects of aging on neuronal communication and behavior: Beneficial properties of fruit polyphenolic compounds. Am. J. Clin. Nutr. 2005, 81, 313S–316S. [Google Scholar] [CrossRef]
- Kammerer, D.; Carle, R.; Schieber, A. Quantification of anthocyanins in black carrot extracts (Daucus carota ssp. sativus var. atrorubens Alef.) and evaluation of their color properties. Eur. Food Res. Technol. 2004, 219, 479–486. [Google Scholar] [CrossRef]
- Montilla, E.C.; Arzaba, M.R.; Hillebrand, S.; Winterhalter, P. Anthocyanin composition of black carrot (Daucus carota ssp. sativus var. atrorubens Alef.) cultivars antonina, beta sweet, deep purple, and purple haze. J. Agric. Food Chem. 2011, 59, 3385–3390. [Google Scholar] [CrossRef]
- Algarra, M.; Fernandes, A.; Mateus, N.; de Freitas, V.; da Silva, J.C.G.E.; Casado, J. Anthocyanin profile and antioxidant capacity of black carrots (Daucus carota L. ssp. sativus var. atrorubens Alef.) from Cuevas Bajas, Spain. J. Food Compos. Anal. 2014, 33, 71–76. [Google Scholar] [CrossRef]
- Kurilich, A.C.; Clevidence, B.A.; Britz, S.J.; Simon, P.W.; Novotny, J.A. Plasma and urine responses are lower for acylated vs nonacylated anthocyanins from raw and cooked purple carrots. J. Agric. Food Chem. 2005, 53, 6537–6542. [Google Scholar] [CrossRef]
- Cavagnaro, P.F.; Iorizzo, M.; Yildiz, M.; Senalik, D.; Parsons, J.; Ellison, S.; Simon, P.W. A gene-derived SNP-based high resolution linkage map of carrot including the location of QTLs conditioning root and leaf anthocyanin pigmentation. BMC Genom. 2014, 15, 1118. [Google Scholar] [CrossRef] [PubMed]
- Bannoud, F.; Ellison, S.; Paolinelli, M.; Horejsi, T.; Senalik, D.; Fanzone, M.; Iorizzo, M.; Simon, P.W.; Cavagnaro, P.F. Dissecting the genetic control of root and leaf tissue-specific anthocyanin pigmentation in carrot (Daucus carota L.). Theor. Appl. Genet. 2019, 132, 2485–2507. [Google Scholar] [CrossRef] [PubMed]
- Iorizzo, M.; Curaba, J.; Pottorff, M.; Simon, P.W.; Cavagnaro, P.F. Carrot anthocyanin genetics: Status and perspectives to optimize applications for the food colorant industry. Genes 2020, 11, 906. [Google Scholar] [CrossRef]
- Perez, M.B.; Hamparsomian, M.J.D.P.; Gonzalez, R.E.; Denoya, G.I.; Dominguez, D.L.E.; Barboza, K.; Iorizzo, M.; Simon, P.W.; Vaudagna, S.R.; Cavagnaro, P.F. Physicochemical properties, degradation kinetics, and antioxidant capacity of aqueous anthocyanin-based extracts from purple carrots compared to synthetic and natural food colorants. Food Chem. 2022, 387, 132893. [Google Scholar] [CrossRef]
- Charron, C.S.; Kurilich, A.C.; Clevidence, B.A.; Simon, P.W.; Harrison, D.J.; Britz, S.J.; Baer, D.J.; Novotny, J.A. Bioavailability of anthocyanins from purple carrot juice: Effects of acylation and plant matrix. J. Agric. Food Chem. 2009, 57, 1226–1230. [Google Scholar] [CrossRef] [PubMed]
- Charron, C.S.; Clevidence, B.A.; Britz, S.J.; Novotny, J.A. Effect of dose size on bioavailability of acylated and nonacylated anthocyanins from red cabbage (Brassica oleracea L. var. capitata). J. Agric. Food Chem. 2007, 55, 5354–5362. [Google Scholar] [CrossRef] [PubMed]
- Leja, M.; Kamińska, I.; Kramer, M.; Maksylewicz-Kaul, A.; Kammerer, D.; Carle, R.; Baranski, R. The content of phenolic compounds and radical scavenging activity varies with carrot origin and root color. Plant Foods Hum. Nutr. 2013, 68, 163–170. [Google Scholar] [CrossRef] [PubMed]
- Akhtar, S.; Rauf, A.; Imran, M.; Qamar, M.; Riaz, M.; Mubarak, M.S. Black carrot (Daucus carota L.), dietary and health promoting perspectives of its polyphenols: A review. Trends Food Sci. Technol. 2017, 66, 36–47. [Google Scholar] [CrossRef]
- Sharma, A.; Shahzad, B.; Rehman, A.; Bhardwaj, R.; Landi, M.; Zheng, B. Response of phenylpropanoid pathway and the role of polyphenols in plants under abiotic stress. Molecules 2019, 24, 2452. [Google Scholar] [CrossRef]
- de Rosas, I.; Ponce, M.T.; Malovini, E.; Deis, L.; Cavagnaro, B.; Cavagnaro, P.F. Loss of anthocyanins and modification of the anthocyanin profiles in grape berries of malbec and bonarda grown under high temperature conditions. Plant Sci. 2017, 258, 137–145. [Google Scholar] [CrossRef]
- de Rosas, I.; Deis, L.; Baldo, Y.; Cavagnaro, J.B.; Cavagnaro, P.F. High temperature alters anthocyanin concentration and composition in grape berries of Malbec, Merlot, and Pinot Noir in a cultivar-dependent manner. Plants 2022, 11, 926. [Google Scholar] [CrossRef]
- Yoo, K.S.; Bang, H.; Pike, L.; Patil, B.S.; Lee, E.J. Comparing carotene, anthocyanins, and terpenoid concentrations in selected carrot lines of different colors. Hortic. Environ. Biotechnol. 2020, 61, 385–393. [Google Scholar] [CrossRef]
- Lao, F.; Giusti, M.M. Quantification of purple corn (Zea mays L.) anthocyanins using spectrophotometric and HPLC approaches: Method comparison and correlation. Food Anal. Methods 2016, 9, 1367–1380. [Google Scholar] [CrossRef]
- Lee, J.; Rennaker, C.; Wrolstad, R.E. Correlation of two anthocyanin quantification methods: HPLC and spectrophotometric methods. Food Chem. 2008, 110, 782–786. [Google Scholar] [CrossRef]
- Lee, S.G.; Nam, T.G.; Kim, D.O.; Koo, S.I.; Chun, O.K. Comparison of Analytical Methods for Anthocyanin Quantification in Berries: HPLC and pH Differential Methods. FASEB J. 2012, 26, lb316. [Google Scholar] [CrossRef]
- Wu, X.; Beecher, G.R.; Holden, J.M.; Haytowitz, D.B.; Gebhardt, S.E.; Prior, R.L. Concentrations of anthocyanins in common foods in the United States and estimation of normal consumption. J. Agric. Food Chem. 2006, 54, 4069–4075. [Google Scholar] [CrossRef]
- Ma, J.; Chen, C.; Ma, J.; Ma, W.; Yang, J. Analysis of bioactive compounds and antioxidant capacities in different varieties of carrots. J. Phys. Conf. Ser. 2020, 1549, 32054. [Google Scholar] [CrossRef]
- Huang, D.; Ou, B.; Prior, R.L. The chemistry behind antioxidant capacity assays. J. Agric. Food Chem. 2005, 53, 1841–1856. [Google Scholar] [CrossRef]
- Shahidi, F.; Zhong, Y. Measurement of antioxidant activity. J. Funct. Foods. 2015, 18, 757–781. [Google Scholar] [CrossRef]
- Prior, R.L.; Wu, X.; Schaich, K. Standardized methods for the determination of antioxidant capacity and phenolics in foods and dietary supplements. J. Agric. Food Chem. 2005, 53, 4290–4302. [Google Scholar] [CrossRef]
- Sawa, T.; Akaike, T.; Kida, K.; Fukushima, Y.; Takagi, K.; Maeda, H. Lipid peroxyl radicals from oxidized oils and heme-iron: Implication of a high-fat diet in colon carcinogenesis. Cancer Epidemiol. Biomark. Prev. 1998, 7, 1007–1012. [Google Scholar]
- Perron, N.R.; Brumaghim, J.L. A review of the antioxidant mechanisms of polyphenol compounds related to iron binding. Cell Biochem. Biophys. 2009, 53, 75–100. [Google Scholar] [CrossRef] [PubMed]
- Siti Azima, A.M.; Noriham, A.; Manshoor, N. Anthocyanin content in relation to the antioxidant activity and colour properties of Garcinia mangostana peel, Syzigium cumini and Clitoria ternatea extracts. Int. Food Res. J. 2014, 21, 2369–2375. [Google Scholar]
- Tena, N.; Martín, J.; Asuero, A.G. State of the art of anthocyanins: Antioxidant activity, sources, bioavailability, and therapeutic effect in human health. Antioxidants 2020, 9, 451. [Google Scholar] [CrossRef] [PubMed]
- Curaba, J.; Bostan, H.; Cavagnaro, P.F.; Senalik, D.; Mengist, M.F.; Zhao, Y.; Simon, P.W.; Iorizzo, M. Identification of an SCPL gene controlling anthocyanin acylation in carrot (Daucus carota L.) root. Front. Plant Sci. 2020, 10, 1770. [Google Scholar] [CrossRef] [PubMed]
- Sun, T.; Simon, P.W.; Tanumihardjo, S.A. Antioxidant phytochemicals and antioxidant capacity of biofortified carrots (Daucus carota L.) of various colors. J. Agric. Food Chem. 2009, 57, 4142–4147. [Google Scholar] [CrossRef] [PubMed]
- Singleton, V.L.; Rossi, J.A. Colorimetry of total phenolics with phosphomolybdic-phosphotungstic acid reagents. Am. J. Enol. Vitic. 1965, 16, 144–158. [Google Scholar] [CrossRef]
- Sasongko, S.B.; Djaeni, M.; Utari, F.D. Kinetic of anthocyanin degradation in roselle extract dried with foaming agent at different temperatures. Bull. Chem. React. Eng. Catal. 2019, 14, 320–325. [Google Scholar] [CrossRef]
- Salomon, M.V.; Piccoli, P.; Fontana, A. Simultaneous determination of carotenoids with different polarities in tomato products using a C30 core-shell column based approach. Microchem. J. 2020, 159, 105390. [Google Scholar] [CrossRef]
- Re, R.; Pellegrini, N.; Proteggente, A.; Pannala, A.; Yang, M.; Rice-Evans, C. Antioxidant activity applying an improved ABTS radical cation decolorization assay. Free Radic. Biol. Med. 1999, 26, 1231–1237. [Google Scholar] [CrossRef]
- Thaipong, K.; Boonprakob, U.; Crosby, K.; Cisneros-Zevallos, L.; Byrne, D.H. Comparison of ABTS, DPPH, FRAP, and ORAC assays for estimating antioxidant activity from guava fruit extracts. J. Food Compos. Anal. 2006, 19, 669–675. [Google Scholar] [CrossRef]
- Benzie, I.F.F.; Strain, J.J. The ferric reducing ability of plasma (FRAP) as a measure of "antioxidant power: The FRAP Assay. Anal. Biochem. 1996, 239, 70–76. [Google Scholar] [CrossRef] [PubMed]
- Berli, F.J.; Alonso, R.; Beltrano, J.; Bottini, R. High-altitude solar UV-B and abscisic acid sprays increase grape berry antioxidant capacity. Am. J. Enol. Vitic. 2015, 66, 65–72. [Google Scholar] [CrossRef]
- Locatelli, D.A.; Nazareno, M.A.; Fusari, C.M.; Camargo, A.B. Cooked garlic and antioxidant activity: Correlation with organosulfur compound composition. Food Chem. 2017, 220, 219–224. [Google Scholar] [CrossRef] [PubMed]
- Di Rienzo, J.A.; Casanoves, F.; Balzarini, M.G.; Gonzalez, L.; Tablada, M.; Robledo, C.W. InfoStat Version 2020; InfoStat Transfer Center, FCA, National University of Cordoba: Córdoba, Argentina, 2020; Available online: http://www.infostat.com.ar (accessed on 18 April 2023).


| Reference Number ζ | Plant/Cultivar Name | Accession ID | Genetic Structure | Petiole and Root Olor Phenotype § | Seed Source and Location | Geographic Origin * |
|---|---|---|---|---|---|---|
| 1 | P9547 | PI 167055 | inbred line | P-PPPP | GRIN-USDA, Beltsville, MD, USA | Eregli/Hatay, Turkey |
| 2 | Purple 68 | F1 | P-PPPP | Territorial Seed Company, Cottage Grove, OR, USA | NA | |
| 3 | Pusa asita | OP | P-PPPP | Baker Creek Heirloom Seeds, Mansfield, MO, USA | India | |
| 4 | Night bird | F1 | P-PPPP | Plant World Seeds, Newton Abbot, UK | NA | |
| 5 | INTA43 | OP | P-PPPP | INTA La Consulta, Mendoza, Argentina | NA | |
| 6 | Black nebula | OP | P-PPPW/P-PPWW | Sustainable Seed Company, Chico, CA, USA | NA | |
| 7 | Black carrot | F1 | P-PPPP/P-PPYP | Sedi Seeds Co., Singapore | NA | |
| 8 | B7262 | inbred line | G-PPOO | USDA-ARS, Madison, WI, USA | Turkey | |
| 9 | Dragon | OP | P-PPPP/P-PPPY | Territorial Seed Company, Cottage Grove, OR, USA | NA | |
| 10 | 340 | PI 167143 | OP | P-PPYP | GRIN-USDA, Beltsville, MD, USA | Mersin, Turkey |
| 11 | Purplesnax | F1 | G-PPOO | Territorial Seed Company, Cottage Grove, OR, USA | NA | |
| 12 | Purple carrot | OP | P-PPOO/P-PPYY | Xiangqutao Store, Singapore | NA | |
| 13 | Purple elite | F1 | G-PPOO | Stokes Seeds, Thorold, ON, Canada | NA | |
| 14 | Purple haze | F1 | G-PPOO | Territorial Seed Company, Cottage Grove, OR, USA | NA | |
| 15 | Spanish black | OP | G-PPYY | Magic Garden Seeds, Regensburg, Germany | NA | |
| 16 | Gniff | OP | G-PPYY/G-PPWW | Baker Creek Heirloom Seeds, Missouri, USA | Tessin, Switzerland | |
| 17 | 1540 | PI 223361 | landrace | G-PPYY/G-PPWW | GRIN-USDA, USA | Ardabil, Azerbaijan |
| 18 | Ping Ding | PI 652188 | OP | P-PYYY | GRIN-USDA, USA | China |
| 19 | Homs | BP85682 | OP | P-POOO | USDA-ARS, Wisconsin, USA | Homs, Syria |
| 20 | Havuc | PI 167211 | OP | P-PPYY/P-PYYY | GRIN-USDA, USA | Mersin, Turkey |
| 21 | Purple dragon | OP | P-POOO | Baker Creek Heirloom Seeds, Missouri, USA | NA | |
| 22 | INTA45 | OP | P-PYYY | INTA La Consulta, Mendoza, Argentina | China | |
| 23 | IIHR 189 | PI 652252 | landrace | P-PYYY/P-POOO/P-POOY | GRIN-USDA, USA | Uttar Pradesh, India |
| 24 | INTA44 | inbred line | P-POOO | INTA La Consulta, Mendoza, Argentina | Syria | |
| 25 | Zardak tabur | PI 254552 | landrace | P-PWWW | GRIN-USDA, USA | Kābul, Afghanistan |
| 26 | Nargesi Shiraz | PI 226636 | landrace | P-PWW | GRIN-USDA, USA | Fārs, Iran |
| 27 | Malbec | F1 | P-PRRR/P-PPRR | Stokes Seeds, Canada | NA | |
| 28 | Yellowstone | OP | G-YYYY | Suttons Seeds, Paignton, UK | NA | |
| 29 | Autumn king | OP | G-OOOO | Seed Parade Co., Isleworth, UK | NA |
| Compound | Abbreviation | RT ζ | MW § |
|---|---|---|---|
| Cyanidin-3-(2″-xylose-galactoside) | Cy3XG | 14.0 | 581 |
| Cyanidin-3-(2″-xylose-6-glucose-galactoside) | Cy3XGG | 13.4 | 743 |
| Cyanidin-3-(2″-xylose-6″-sinapoyl-glucose-galactoside) | Cy3XSGG | 14.3 | 949 |
| Cyanidin-3-(2″-xylose-6″-feruloyl-glucose-galactoside) | Cy3XFGG | 14.8 | 919 |
| Cyanidin-3-(2″-xylose-6″-(4-coumaroyl)glucose-galactoside) | Cy3XCGG | 15.2 | 889 |
| TACSPEC | TACHPLC | Cy3XG | Cy3XGG | Cy3XSGG | Cy3XFGG | Cy3XCGG | TAA | TNAA | TPC | ABTS | FRAP | DPPH | ORAC | β-Carotene | Lutein | |
|---|---|---|---|---|---|---|---|---|---|---|---|---|---|---|---|---|
| TACSPEC | 0.96 *** | 0.88 *** | 0.92 *** | 0.89 *** | 0.87 *** | 0.86 *** | 0.96 *** | 0.93 *** | 0.94 *** | 0.89 *** | 0.86 *** | 0.72 *** | 0.85 *** | −0.36 * | −0.04 | |
| TACHPLC | 0.94 *** | 0.89 *** | 0.94 *** | 0.92 *** | 0.91 *** | 0.90 ** | 0.99 *** | 0.94 *** | 0.92 *** | 0.90 *** | 0.88 *** | 0.72 *** | 0.87 *** | −0.38 * | −0.08 | |
| Cy3XG | 0.86 *** | 0.89 *** | 0.88 *** | 0.82 *** | 0.79 *** | 0.76 *** | 0.86 *** | 0.97 *** | 0.80 *** | 0.82 *** | 0.84 *** | 0.66 *** | 0.78 *** | −0.48 *** | −0.16 | |
| Cy3XGG | 0.77 *** | 0.82 *** | 0.84 *** | 0.85 *** | 0.84 *** | 0.81 *** | 0.93 *** | 0.95 *** | 0.88 *** | 0.87 *** | 0.84 *** | 0.65 *** | 0.83 *** | −0.45 *** | −0.07 | |
| Cy3XSGG | 0.77 *** | 0.82 *** | 0.71 *** | 0.82 *** | 0.75 *** | 0.74 *** | 0.91 *** | 0.86 *** | 0.85 *** | 0.82 *** | 0.80 *** | 0.66 *** | 0.77 *** | −0.33 ** | −0.18 | |
| Cy3XFGG | 0.89 *** | 0.94 *** | 0.85 *** | 0.74 *** | 0.67 *** | 0.95 *** | 0.92 *** | 0.84 *** | 0.82 *** | 0.83 **** | 0.81 *** | 0.64 *** | 0.78 *** | −0.23 | −0.01 | |
| Cy3XCGG | 0.76 *** | 0.83 *** | 0.82 *** | 0.88 *** | 0.74 *** | 0.79 *** | 0.91 *** | 0.81 *** | 0.81 *** | 0.80 *** | 0.75 *** | 0.66 *** | 0.73 *** | −0.21 | 0.03 | |
| TAA | 0.94 *** | 0.99 *** | 0.87 *** | 0.81 *** | 0.82 *** | 0.94 *** | 0.82 *** | 0.92 *** | 0.92 *** | 0.90 *** | 0.87 *** | 0.72 *** | 0.87 *** | −0.36 ** | −0.05 | |
| TNAA | 0.87 *** | 0.91 *** | 0.99 *** | 0.89 *** | 0.75 *** | 0.86 *** | 0.85 *** | 0.89 *** | 0.86 *** | 0.88 *** | 0.87 *** | 0.69 *** | 0.82 *** | −0.48 *** | −0.12 | |
| TPC | 0.86 *** | 0.88 *** | 0.82 *** | 0.79 *** | 0.82 *** | 0.79 *** | 0.78 *** | 0.88 *** | 0.84 *** | 0.86 *** | 0.83 *** | 0.66 *** | 0.86 *** | −0.39 * | −0.01 | |
| ABTS | 0.68 *** | 0.71 *** | 0.72 *** | 0.85 *** | 0.73 *** | 0.63 *** | 0.87 *** | 0.70 *** | 0.76 *** | 0.77 *** | 0.87 *** | 0.75 *** | 0.86 *** | −0.36 ** | −0.07 | |
| FRAP | 0.76 *** | 0.79 *** | 0.68 *** | 0.65 *** | 0.59 *** | 0.73 *** | 0.65 *** | 0.79 *** | 0.70 *** | 0.78 *** | 0.64 *** | 0.66 *** | 0.85 *** | −0.43 *** | −0.17 | |
| DPPH | - | - | - | - | - | - | - | - | - | - | - | - | 0.66 *** | −0.23 | 0.01 | |
| ORAC | - | - | - | - | - | - | - | - | - | - | - | - | - | −0.47 *** | −0.06 | |
| β-carotene | - | - | - | - | - | - | - | - | - | - | - | - | - | - | 0.01 | |
| Lutein | - | - | - | - | - | - | - | - | - | - | - | - | - | - | - |
Disclaimer/Publisher’s Note: The statements, opinions and data contained in all publications are solely those of the individual author(s) and contributor(s) and not of MDPI and/or the editor(s). MDPI and/or the editor(s) disclaim responsibility for any injury to people or property resulting from any ideas, methods, instructions or products referred to in the content. |
© 2023 by the authors. Licensee MDPI, Basel, Switzerland. This article is an open access article distributed under the terms and conditions of the Creative Commons Attribution (CC BY) license (https://creativecommons.org/licenses/by/4.0/).
Share and Cite
Pérez, M.B.; Carvajal, S.; Beretta, V.; Bannoud, F.; Fangio, M.F.; Berli, F.; Fontana, A.; Salomón, M.V.; Gonzalez, R.; Valerga, L.; et al. Characterization of Purple Carrot Germplasm for Antioxidant Capacity and Root Concentration of Anthocyanins, Phenolics, and Carotenoids. Plants 2023, 12, 1796. https://doi.org/10.3390/plants12091796
Pérez MB, Carvajal S, Beretta V, Bannoud F, Fangio MF, Berli F, Fontana A, Salomón MV, Gonzalez R, Valerga L, et al. Characterization of Purple Carrot Germplasm for Antioxidant Capacity and Root Concentration of Anthocyanins, Phenolics, and Carotenoids. Plants. 2023; 12(9):1796. https://doi.org/10.3390/plants12091796
Chicago/Turabian StylePérez, María Belén, Sofía Carvajal, Vanesa Beretta, Florencia Bannoud, María Florencia Fangio, Federico Berli, Ariel Fontana, María Victoria Salomón, Roxana Gonzalez, Lucia Valerga, and et al. 2023. "Characterization of Purple Carrot Germplasm for Antioxidant Capacity and Root Concentration of Anthocyanins, Phenolics, and Carotenoids" Plants 12, no. 9: 1796. https://doi.org/10.3390/plants12091796
APA StylePérez, M. B., Carvajal, S., Beretta, V., Bannoud, F., Fangio, M. F., Berli, F., Fontana, A., Salomón, M. V., Gonzalez, R., Valerga, L., Altamirano, J. C., Yildiz, M., Iorizzo, M., Simon, P. W., & Cavagnaro, P. F. (2023). Characterization of Purple Carrot Germplasm for Antioxidant Capacity and Root Concentration of Anthocyanins, Phenolics, and Carotenoids. Plants, 12(9), 1796. https://doi.org/10.3390/plants12091796