
Profiling Walnut Fungal Pathobiome Associated with Walnut Dieback Using Community-Targeted DNA Metabarcoding


Abstract
:1. Introduction
2. Results
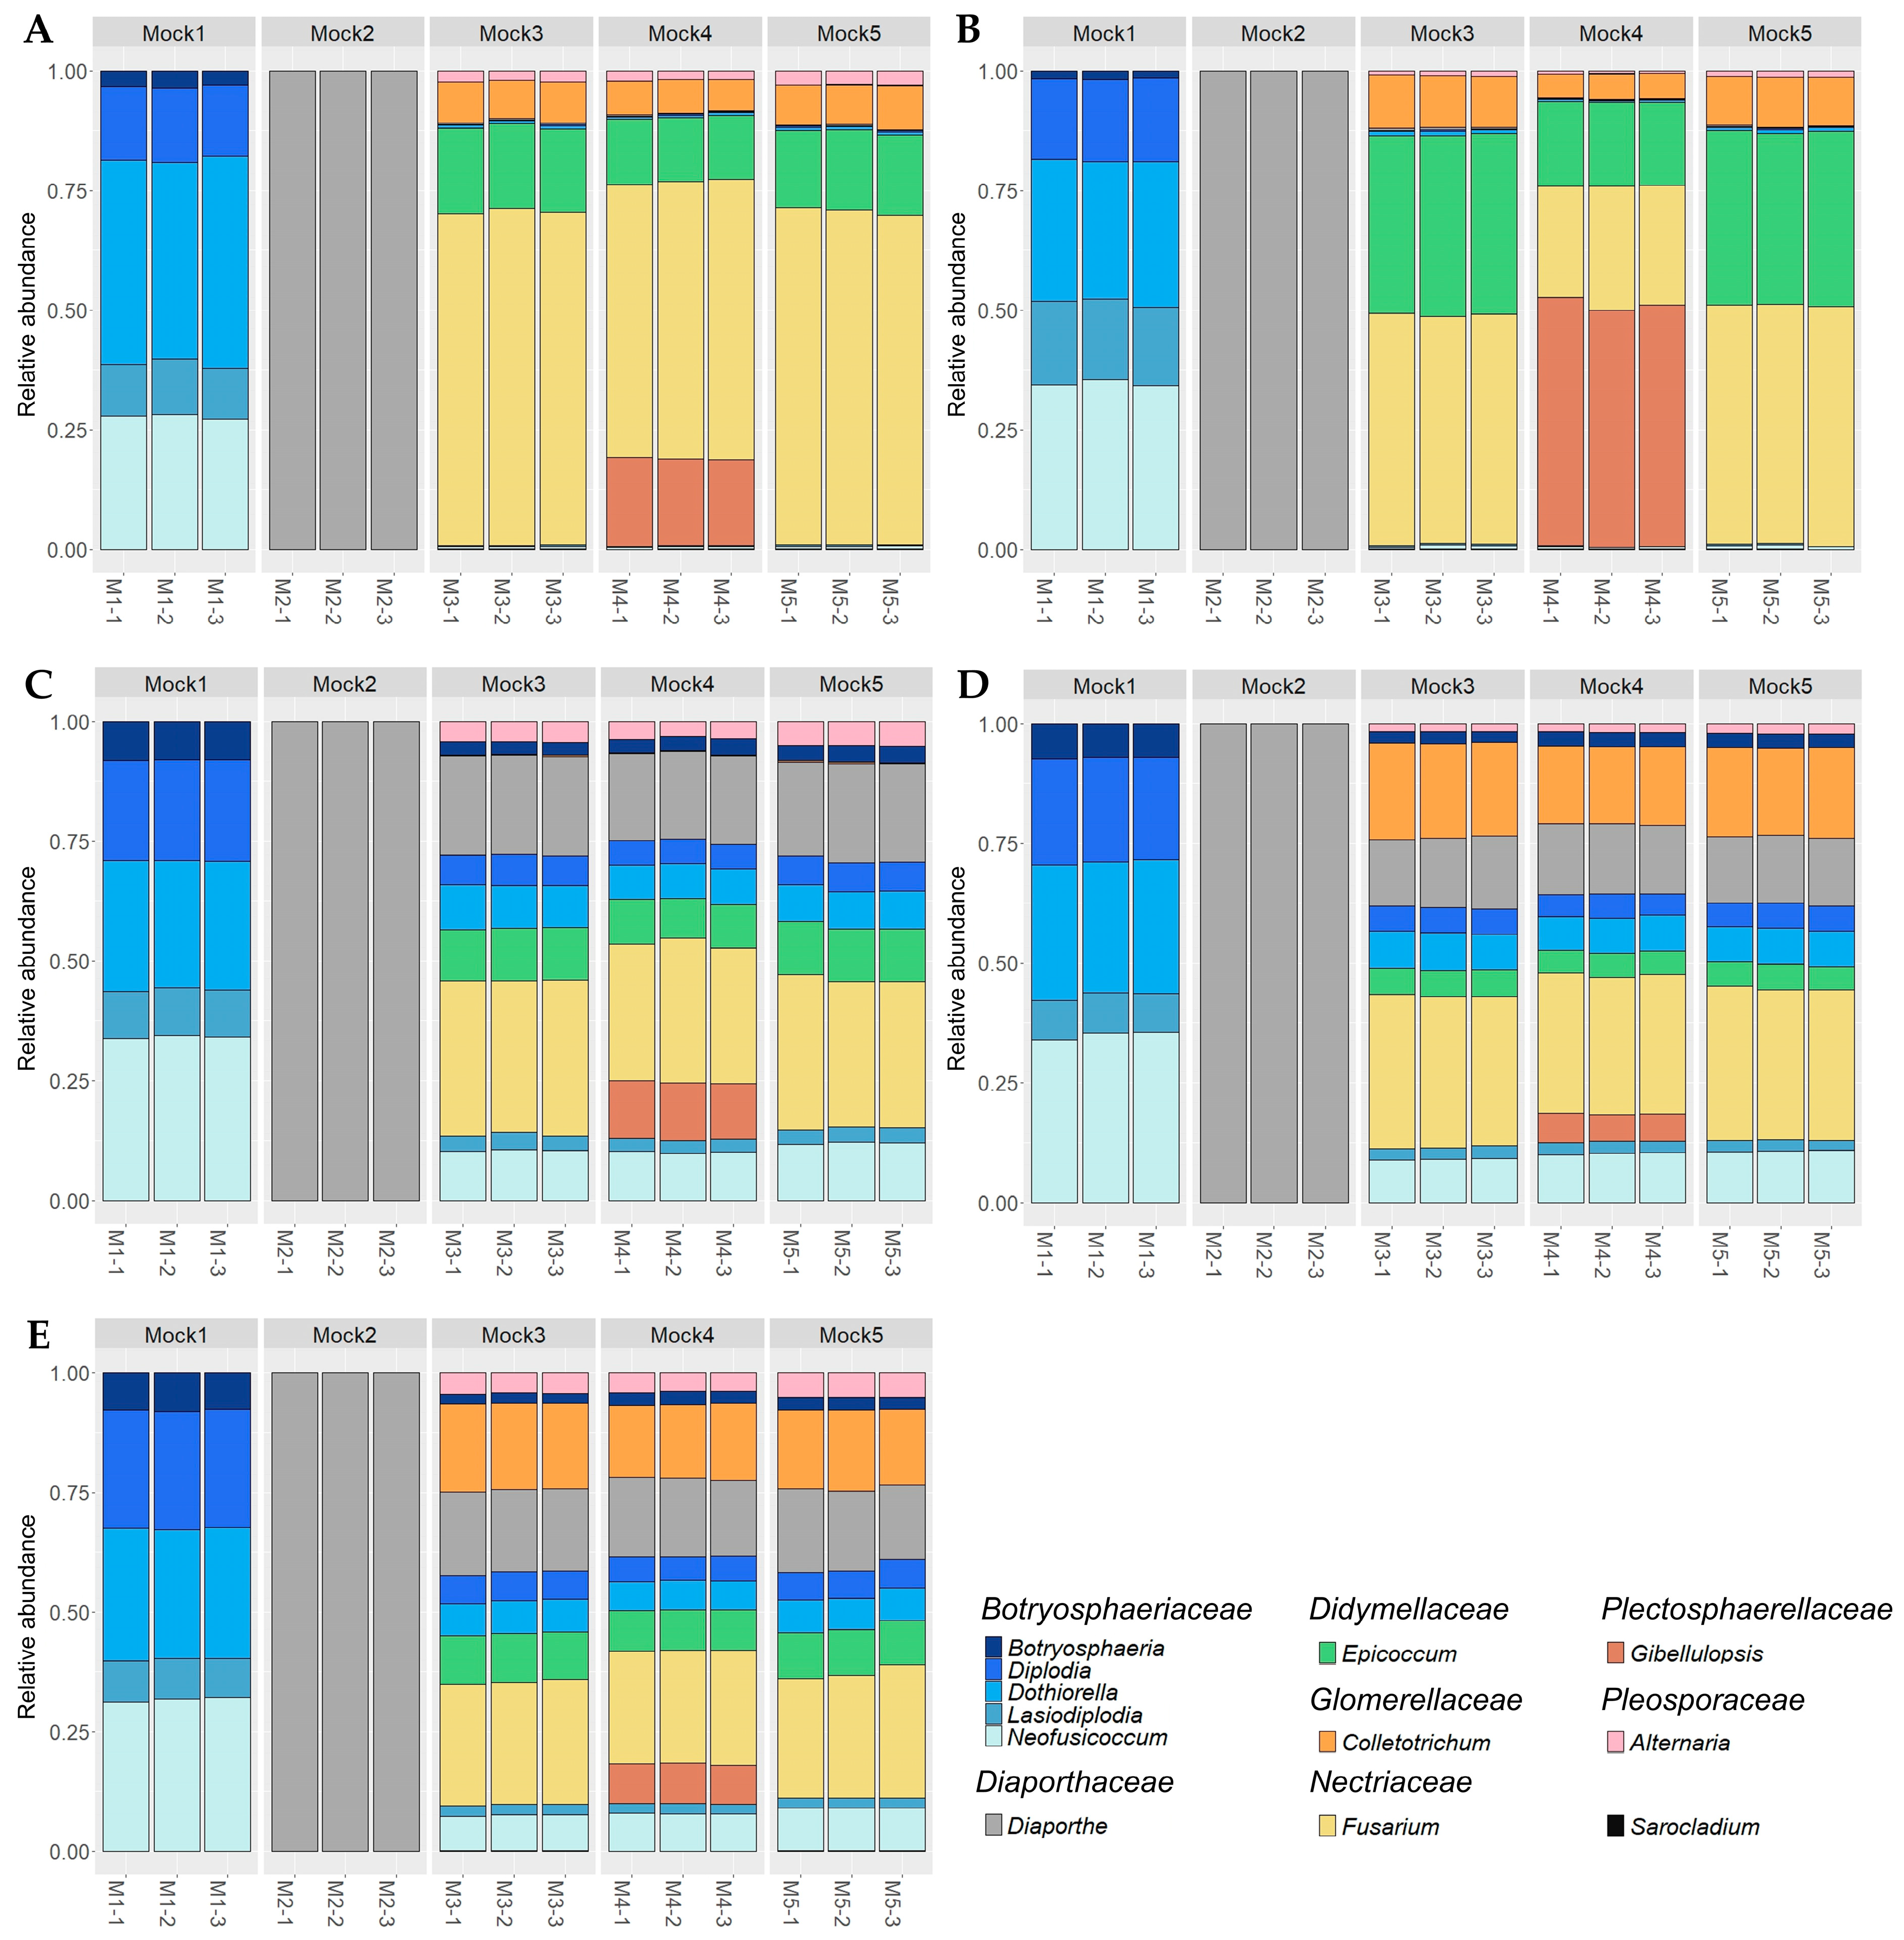
2.1. Analysis of Mock Communities and Identification of the Best Primer Sets
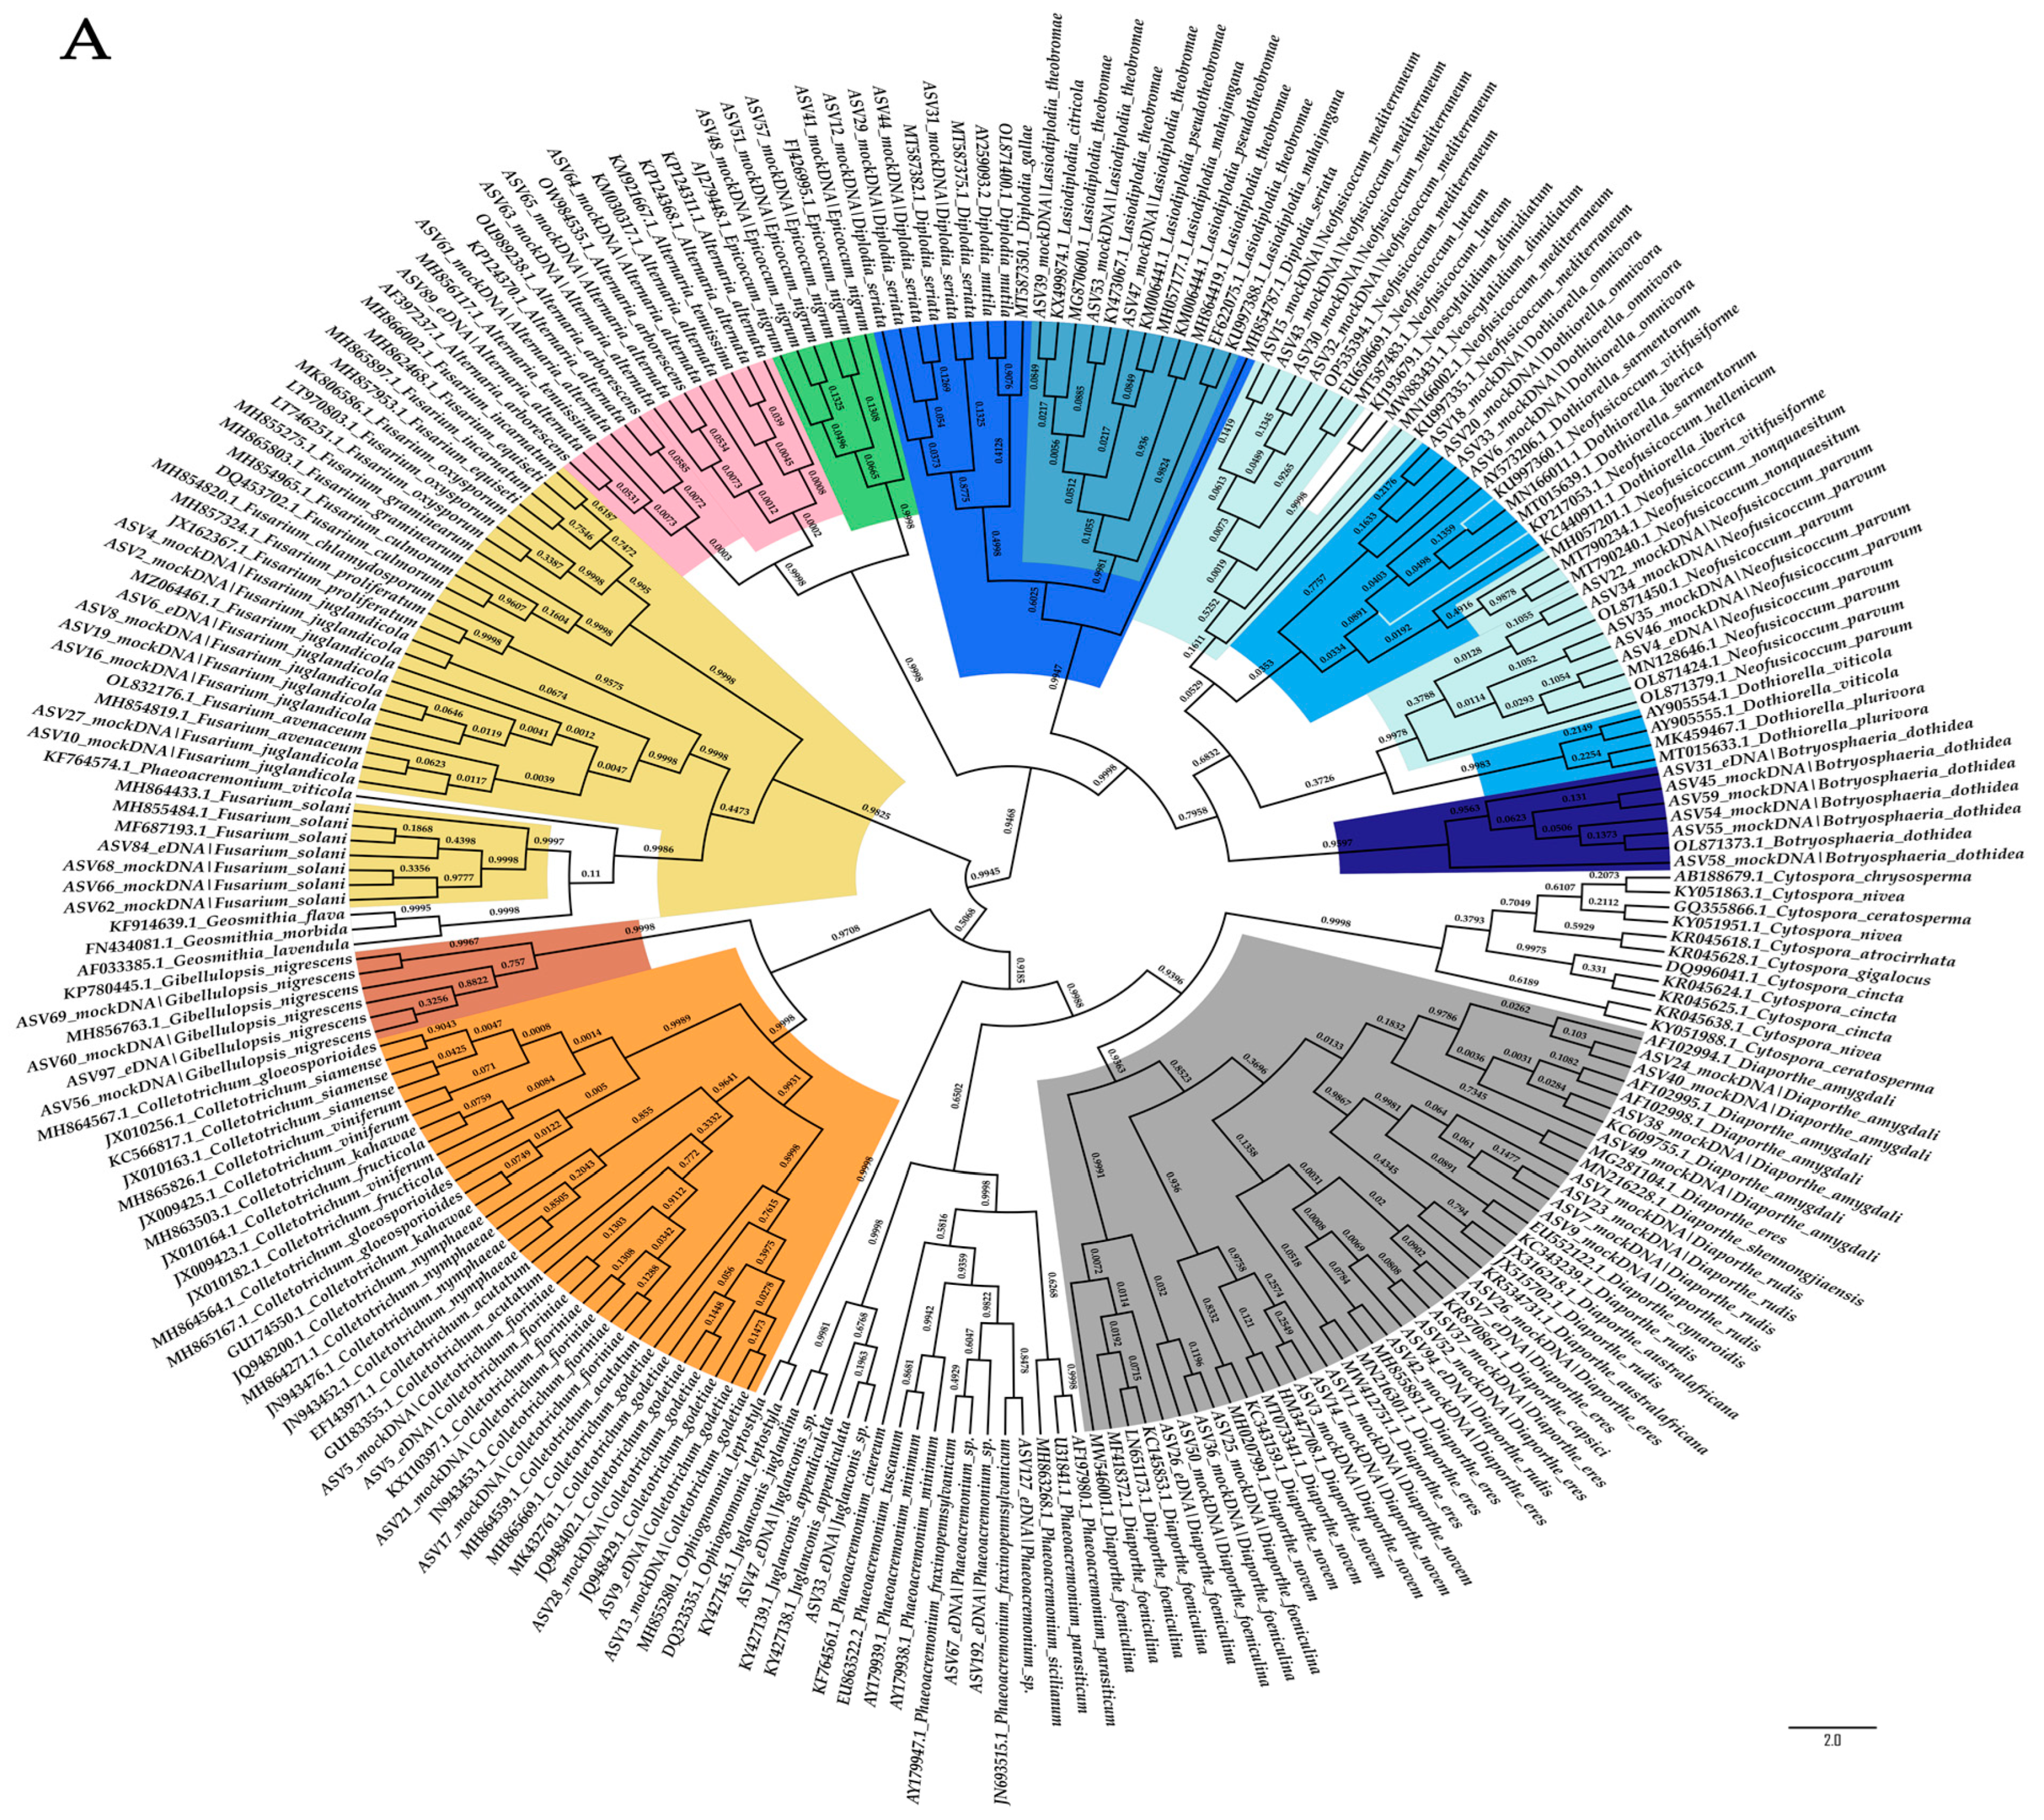
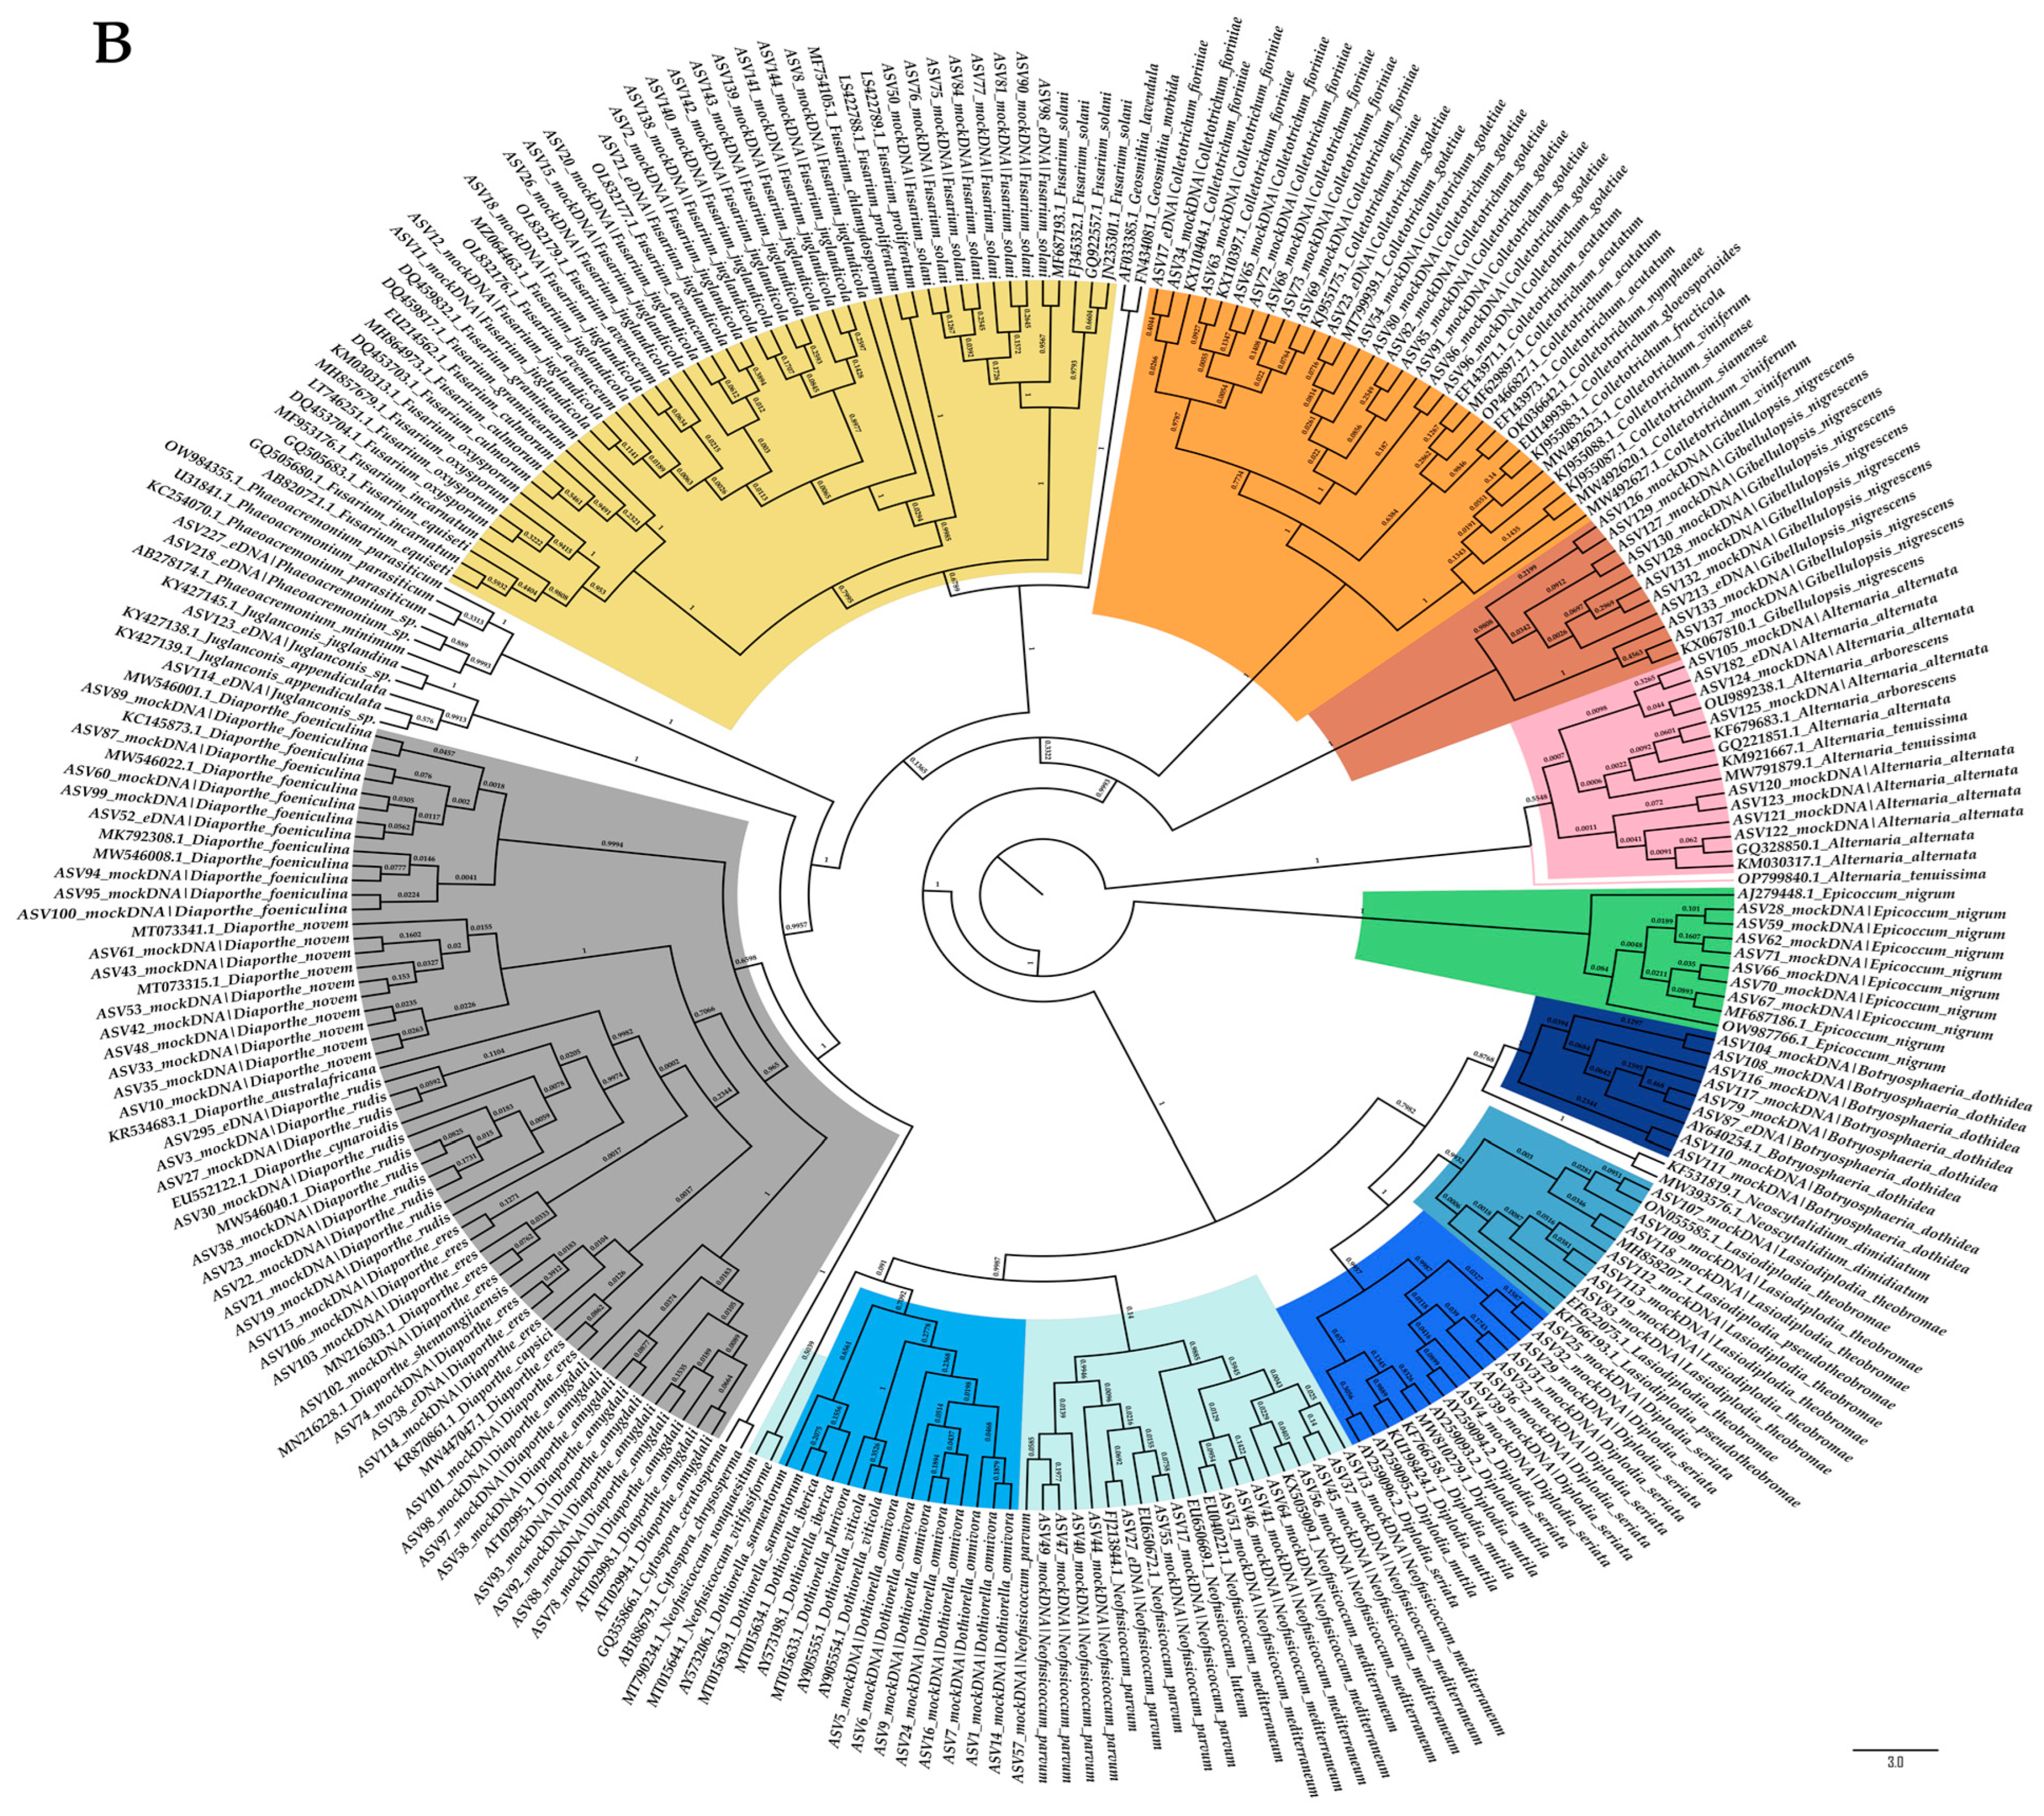
2.2. Evaluation of the Taxonomic-Level Resolution
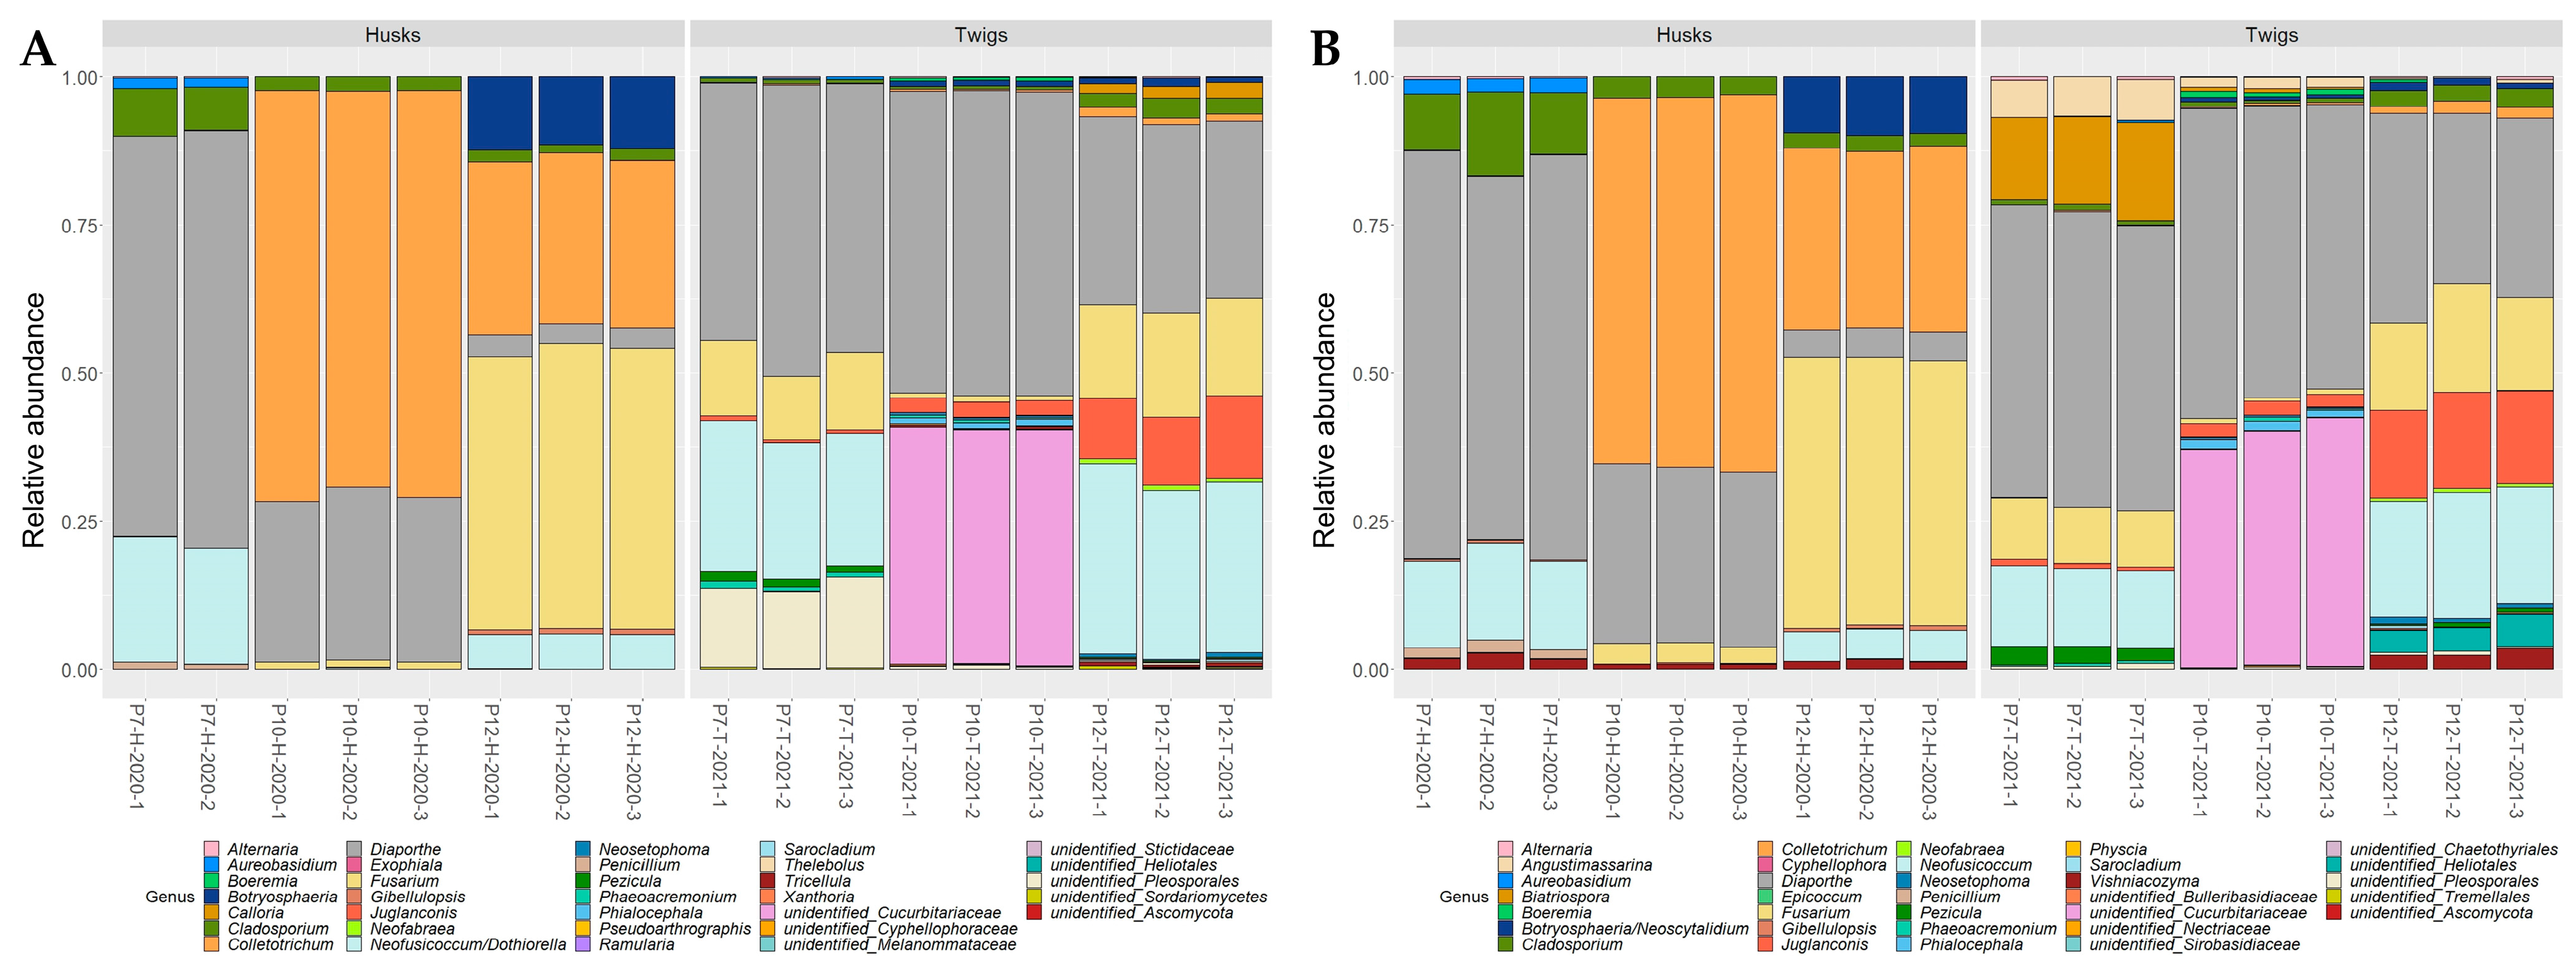
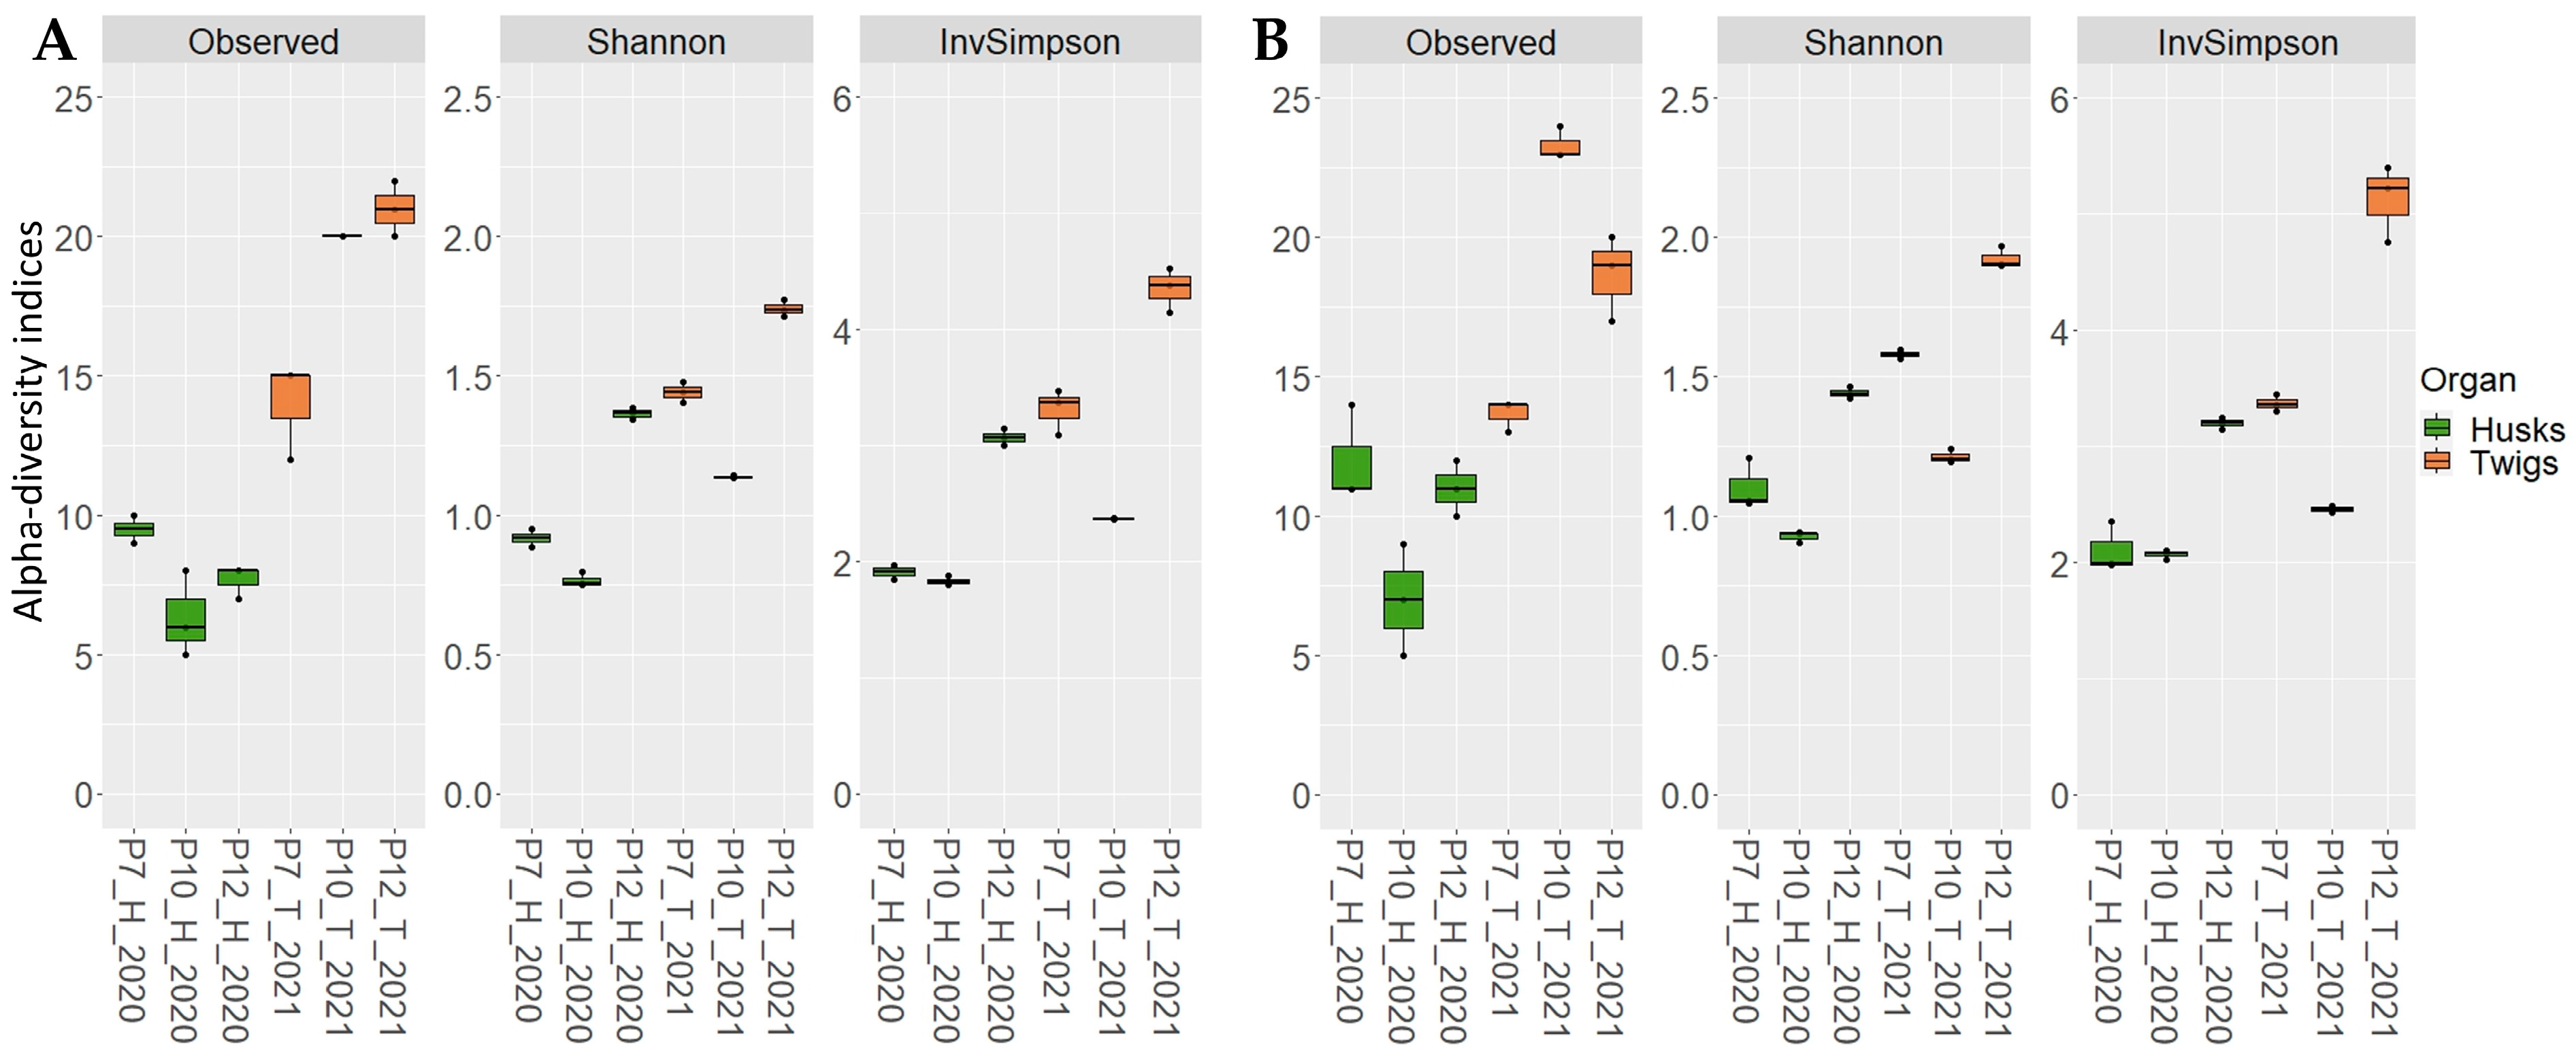
2.3. Application on Environmental Samples
3. Discussion
4. Materials and Methods
4.1. Identification of Primer Sets Targeting Walnut Pathogens
4.2. Fungal Mock Communities
4.3. Sampling and Total DNA Extraction
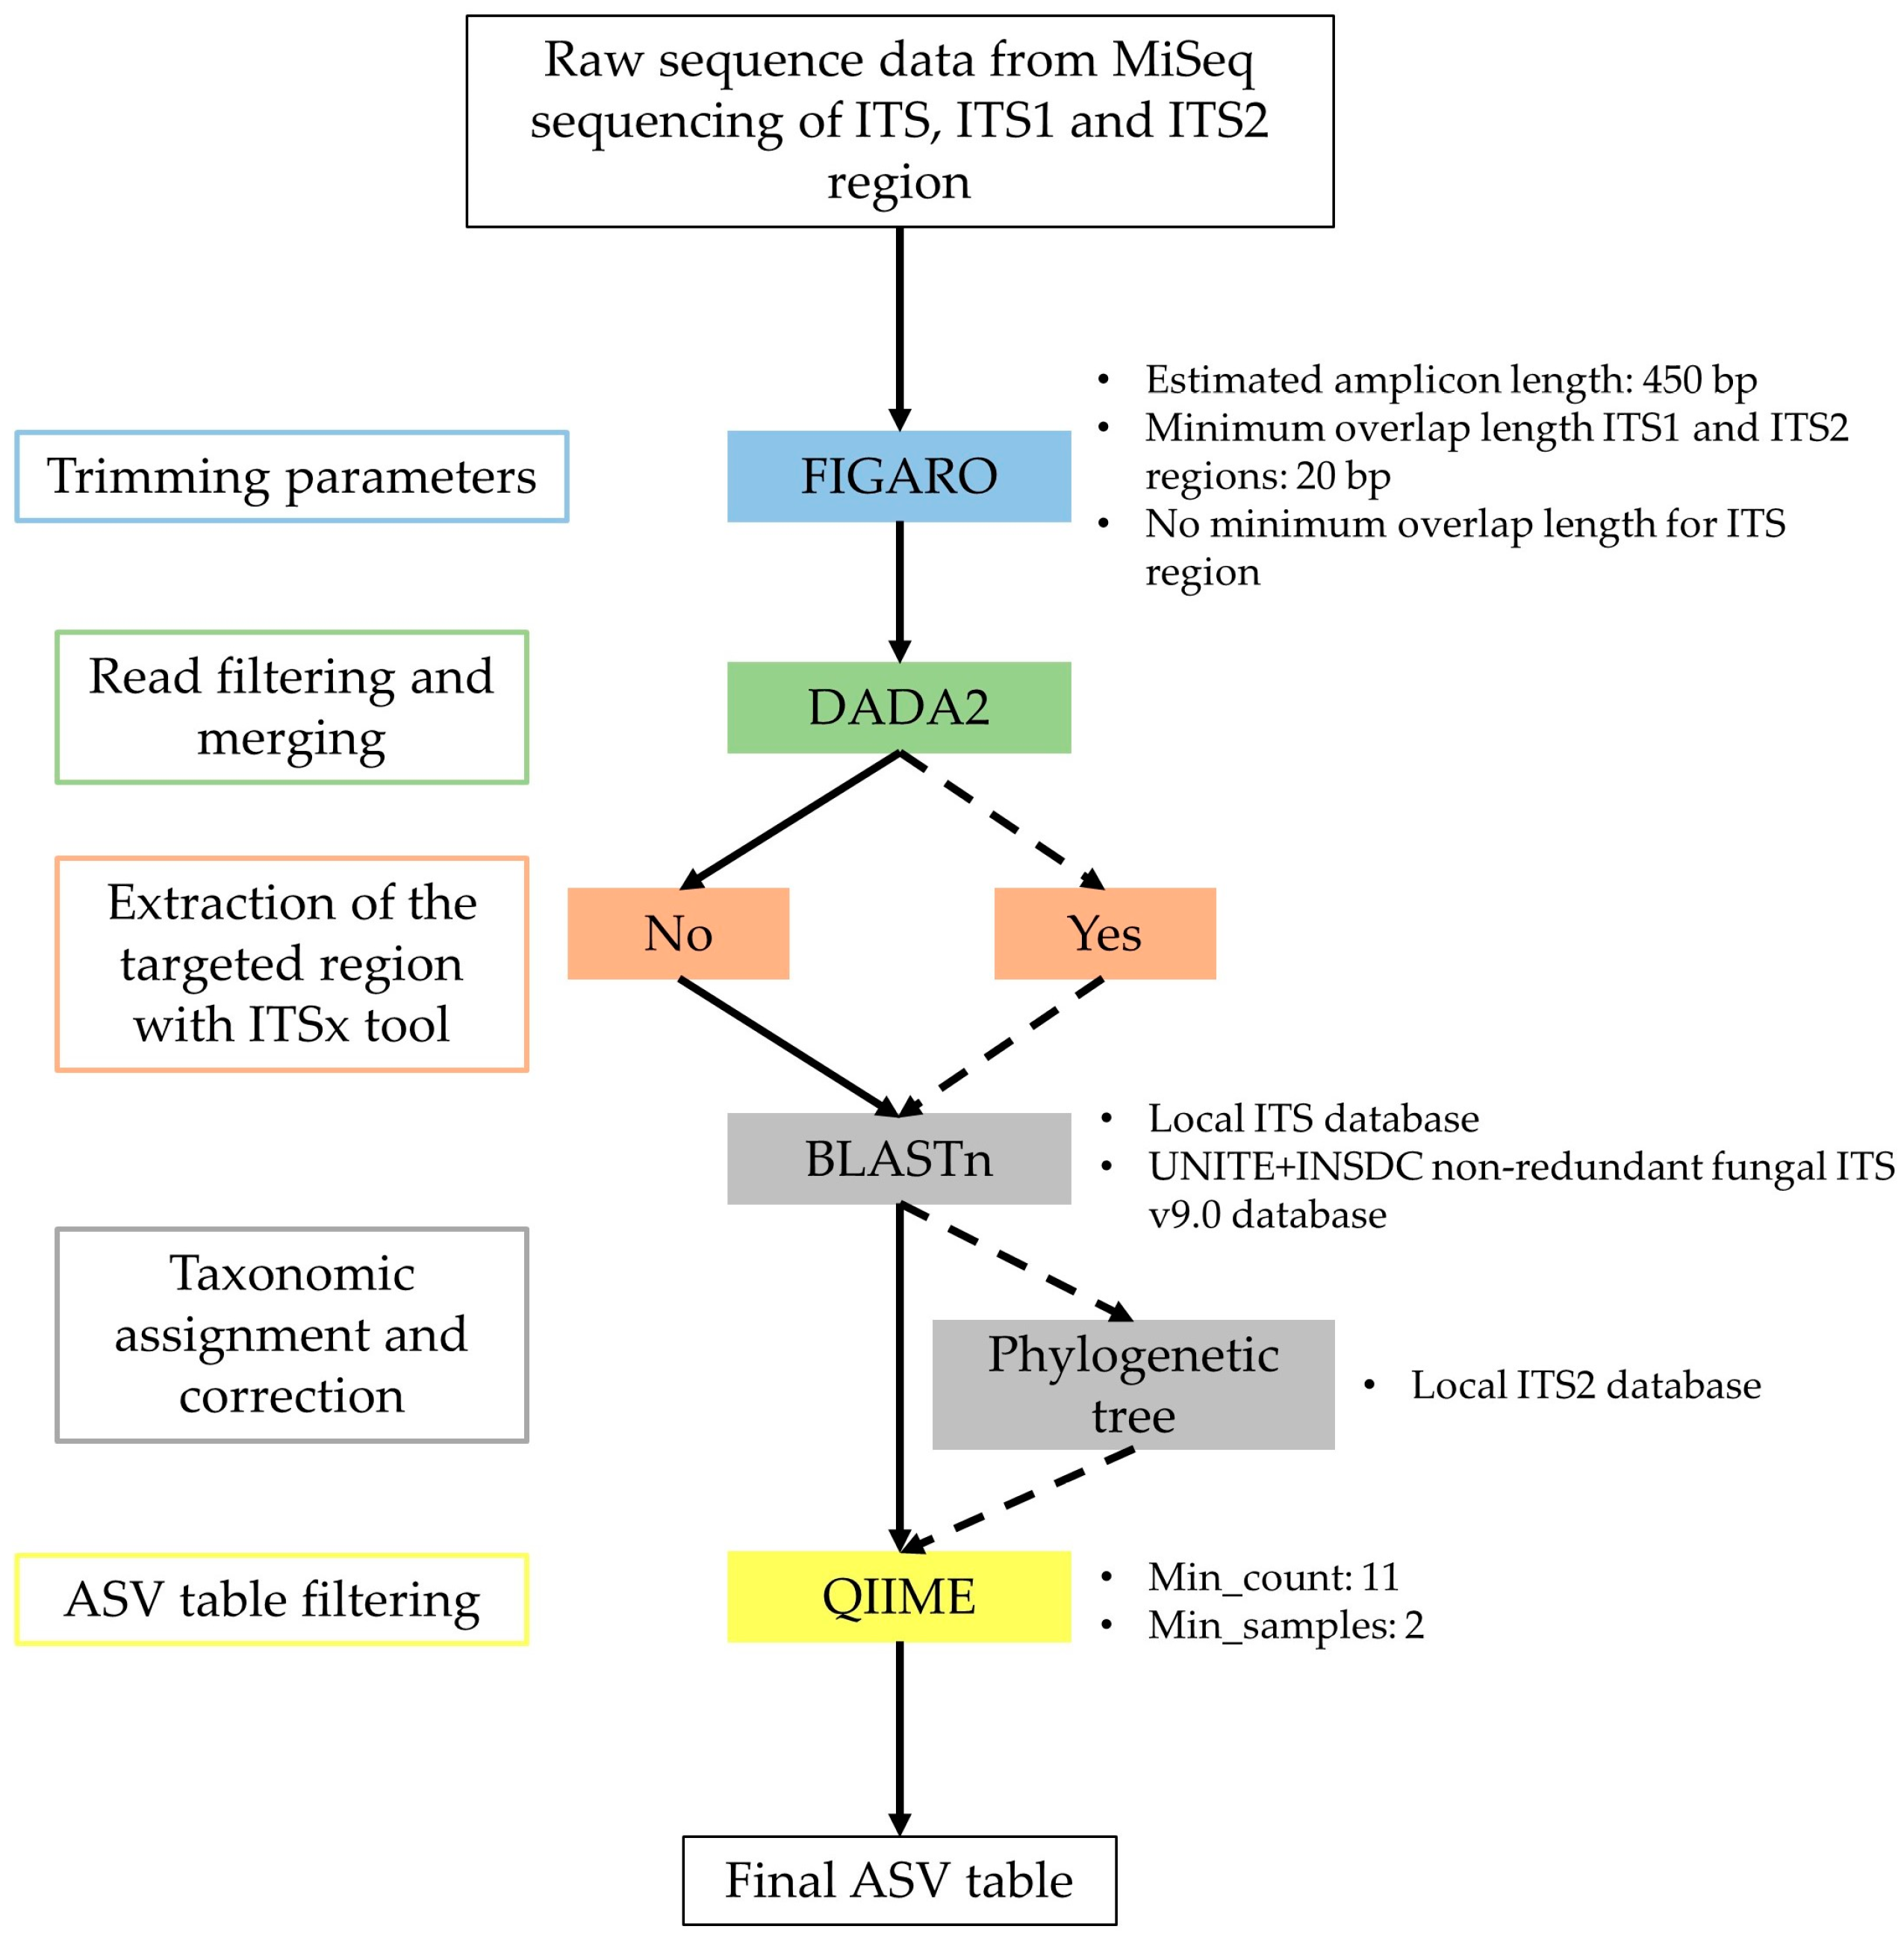
4.4. Illumina MiSeq Sequencing and Sequence Analyses
4.5. Comparative Evaluation of Primer Pairs
4.6. Evaluation of the Taxonomic-Level Resolution
4.7. Statistical Analyses
5. Conclusions
Supplementary Materials
Author Contributions
Funding
Data Availability Statement
Acknowledgments
Conflicts of Interest
References
- FAOSTAT Statistical Database—Production. License: CC BY-NC-SA 3.0 IGO. Available online: https://www.fao.org/faostat/en/#data/QCL (accessed on 1 February 2023).
- Radix, P.; Seigle-Murandi, F.; Charlot, G. Walnut Blight: Development of Fruit Infection in Two Orchards. Crop. Prot. 1994, 13, 629–631. [Google Scholar] [CrossRef]
- Yabaneri, C.; Sevim, A. Endophytic Fungi from the Common Walnut and Their in Vitro Antagonistic Activity against Ophiognomonia leptostyla. Biologia 2023, 78, 361–371. [Google Scholar] [CrossRef]
- Daniels, D.A.; Nix, K.A.; Wadl, P.A.; Vito, L.M.; Wiggins, G.J.; Windham, M.T.; Ownley, B.H.; Lambdin, P.L.; Grant, J.F.; Merten, P.; et al. Thousand Cankers Disease Complex: A Forest Health Issue That Threatens Juglans Species across the U.S. Forests 2016, 7, 260. [Google Scholar] [CrossRef] [Green Version]
- Da Lio, D.; Cobo-Díaz, J.F.; Masson, C.; Chalopin, M.; Kebe, D.; Giraud, M.; Verhaeghe, A.; Nodet, P.; Sarrocco, S.; Le Floch, G.; et al. Combined Metabarcoding and Multi-Locus Approach for Genetic Characterization of Colletotrichum Species Associated with Common Walnut (Juglans regia) Anthracnose in France. Sci. Rep. 2018, 8, 10765. [Google Scholar] [CrossRef] [PubMed] [Green Version]
- Moral, J.; Morgan, D.; Trapero, A.; Michailides, T.J. Ecology and Epidemiology of Diseases of Nut Crops and Olives Caused by Botryosphaeriaceae Fungi in California and Spain. Plant Dis. 2019, 103, 1809–1827. [Google Scholar] [CrossRef] [PubMed] [Green Version]
- López-Moral, A.; Lovera, M.; Raya, M.D.C.; Cortés-Cosano, N.; Arquero, O.; Trapero, A.; Agustí-Brisach, C. Etiology of Branch Dieback and Shoot Blight of English Walnut Caused by Botryosphaeriaceae and Diaporthe Species in Southern Spain. Plant Dis. 2020, 104, 533–550. [Google Scholar] [CrossRef]
- Gusella, G.; Giambra, S.; Conigliaro, G.; Burruano, S.; Polizzi, G. Botryosphaeriaceae Species Causing Canker and Dieback of English Walnut (Juglans regia) in Italy. For. Path. 2021, 51, e12661. [Google Scholar] [CrossRef]
- Yildiz, A.; Benlioglu, S.; Benlioglu, K.; Korkom, Y. Occurrence of Twig Blight and Branch Dieback of Walnut Caused by Botryosphaeriaceae Species in Turkey. J. Plant Dis. Prot. 2022, 129, 687–693. [Google Scholar] [CrossRef]
- Eichmeier, A.; Pecenka, J.; Spetik, M.; Necas, T.; Ondrasek, I.; Armengol, J.; León, M.; Berlanas, C.; Gramaje, D. Fungal Trunk Pathogens Associated with Juglans regia in the Czech Republic. Plant Dis. 2020, 104, 761–771. [Google Scholar] [CrossRef]
- Laloum, Y.; Verhaeghe, A.; Moronvalle, A.; Masson, C.; Hebrard, M.-N.; Picot, A.; Pensec, F.; Belair, M. Projet CARIBOU: Élancer la recherche pour cerner le dépérissement du noyer. Infos. Ctifl. 2022, 386, 48–58. [Google Scholar]
- Moral, J.; Muñoz-Díez, C.; González, N.; Trapero, A.; Michailides, T.J. Characterization and Pathogenicity of Botryosphaeriaceae Species Collected from Olive and Other Hosts in Spain and California. Phytopathology 2010, 100, 1340–1351. [Google Scholar] [CrossRef] [Green Version]
- Michailides, T.J.; Chen, S.; Morgan, D.; Felts, D.; Nouri, M.T.; Puckett, R.; Luna, M.; Hasey, J.; Anderson, K.; Coates, W.; et al. Managing Botryosphaeria/Phomopsis Cankers and Anthracnose Blight of Walnut in California; Walnut Research Reports; California Walnut Board: Folsom, CA, USA, 2013; pp. 325–346. [Google Scholar]
- Azevedo-Nogueira, F.; Rego, C.; Gonçalves, H.M.R.; Fortes, A.M.; Gramaje, D.; Martins-Lopes, P. The Road to Molecular Identification and Detection of Fungal Grapevine Trunk Diseases. Front. Plant Sci. 2022, 13, 960289. [Google Scholar] [CrossRef]
- Bass, D.; Stentiford, G.D.; Wang, H.-C.; Koskella, B.; Tyler, C.R. The Pathobiome in Animal and Plant Diseases. Trends Ecol. Evol. 2019, 34, 996–1008. [Google Scholar] [CrossRef] [Green Version]
- Abdelfattah, A.; Malacrinò, A.; Wisniewski, M.; Cacciola, S.O.; Schena, L. Metabarcoding: A Powerful Tool to Investigate Microbial Communities and Shape Future Plant Protection Strategies. Biol. Control. 2018, 120, 1–10. [Google Scholar] [CrossRef]
- Agler, M.T.; Ruhe, J.; Kroll, S.; Morhenn, C.; Kim, S.-T.; Weigel, D.; Kemen, E.M. Microbial Hub Taxa Link Host and Abiotic Factors to Plant Microbiome Variation. PLoS Biol. 2016, 14, e1002352. [Google Scholar] [CrossRef] [Green Version]
- Busby, P.E.; Peay, K.G.; Newcombe, G. Common Foliar Fungi of Populus Trichocarpa Modify Melampsora Rust Disease Severity. New Phytol. 2016, 209, 1681–1692. [Google Scholar] [CrossRef] [Green Version]
- Cobo-Díaz, J.F.; Baroncelli, R.; Le Floch, G.; Picot, A. A Novel Metabarcoding Approach to Investigate Fusarium Species Composition in Soil and Plant Samples. FEMS Microbiol. Ecol. 2019, 95, fiz084. [Google Scholar] [CrossRef] [PubMed]
- Morales-Cruz, A.; Figueroa-Balderas, R.; García, J.F.; Tran, E.; Rolshausen, P.E.; Baumgartner, K.; Cantu, D. Profiling Grapevine Trunk Pathogens in Planta: A Case for Community-Targeted DNA Metabarcoding. BMC Microbiol. 2018, 18, 214. [Google Scholar] [CrossRef] [PubMed] [Green Version]
- Cobo-Díaz, J.F.; Baroncelli, R.; Le Floch, G.; Picot, A. Combined Metabarcoding and Co-Occurrence Network Analysis to Profile the Bacterial, Fungal and Fusarium Communities and Their Interactions in Maize Stalks. Front. Microbiol. 2019, 10, 261. [Google Scholar] [CrossRef] [PubMed] [Green Version]
- Ruppert, K.M.; Kline, R.J.; Rahman, M.S. Past, Present, and Future Perspectives of Environmental DNA (EDNA) Metabarcoding: A Systematic Review in Methods, Monitoring, and Applications of Global EDNA. Glob. Ecol. Conserv. 2019, 17, e00547. [Google Scholar] [CrossRef]
- Vanga, B.R.; Panda, P.; Shah, A.S.; Thompson, S.; Woolley, R.H.; Ridgway, H.J.; Mundy, D.C.; Bulman, S. DNA Metabarcoding Reveals High Relative Abundance of Trunk Disease Fungi in Grapevines from Marlborough, New Zealand. BMC Microbiol. 2022, 22, 126. [Google Scholar] [CrossRef]
- Chi, W.-C.; Chen, W.; He, C.-C.; Guo, S.-Y.; Cha, H.-J.; Tsang, L.M.; Ho, T.W.; Pang, K.-L. A Highly Diverse Fungal Community Associated with Leaves of the Mangrove Plant Acanthus Ilicifolius var. Xiamenensis Revealed by Isolation and Metabarcoding Analyses. PeerJ 2019, 7, e7293. [Google Scholar] [CrossRef] [Green Version]
- Wang, S.; Tan, Y.; Li, S.; Zhu, T. Structural and Dynamic Analysis of Leaf-Associated Fungal Community of Walnut Leaves Infected by Leaf Spot Disease Based Illumina High-Throughput Sequencing Technology. Pol. J. Microbiol. 2022, 71, 429–441. [Google Scholar] [CrossRef]
- Nilsson, R.H.; Anslan, S.; Bahram, M.; Wurzbacher, C.; Baldrian, P.; Tedersoo, L. Mycobiome Diversity: High-Throughput Sequencing and Identification of Fungi. Nat. Rev. Microbiol. 2019, 17, 95–109. [Google Scholar] [CrossRef]
- Alberdi, A.; Aizpurua, O.; Gilbert, M.T.P.; Bohmann, K. Scrutinizing Key Steps for Reliable Metabarcoding of Environmental Samples. Methods Ecol. Evol. 2018, 9, 134–147. [Google Scholar] [CrossRef] [Green Version]
- Pauvert, C.; Buée, M.; Laval, V.; Edel-Hermann, V.; Fauchery, L.; Gautier, A.; Lesur, I.; Vallance, J.; Vacher, C. Bioinformatics Matters: The Accuracy of Plant and Soil Fungal Community Data Is Highly Dependent on the Metabarcoding Pipeline. Fungal Ecol. 2019, 41, 23–33. [Google Scholar] [CrossRef]
- Tedersoo, L.; Lindahl, B. Fungal Identification Biases in Microbiome Projects. Environ. Microbiol. Rep. 2016, 8, 774–779. [Google Scholar] [CrossRef]
- Nichols, R.V.; Vollmers, C.; Newsom, L.A.; Wang, Y.; Heintzman, P.D.; Leighton, M.; Green, R.E.; Shapiro, B. Minimizing Polymerase Biases in Metabarcoding. Mol. Ecol. Resour. 2018, 18, 927–939. [Google Scholar] [CrossRef] [PubMed] [Green Version]
- Oliver, A.K.; Brown, S.P.; Callaham, M.A.; Jumpponen, A. Polymerase Matters: Non-Proofreading Enzymes Inflate Fungal Community Richness Estimates by up to 15%. Fungal Ecol. 2015, 15, 86–89. [Google Scholar] [CrossRef] [Green Version]
- Smith, D.P.; Peay, K.G. Sequence Depth, Not PCR Replication, Improves Ecological Inference from Next Generation DNA Sequencing. PLoS ONE 2014, 9, e90234. [Google Scholar] [CrossRef] [Green Version]
- Estensmo, E.L.F.; Maurice, S.; Morgado, L.; Martin-Sanchez, P.M.; Skrede, I.; Kauserud, H. The Influence of Intraspecific Sequence Variation during DNA Metabarcoding: A Case Study of Eleven Fungal Species. Mol. Ecol. Resour. 2021, 21, 1141–1148. [Google Scholar] [CrossRef]
- Bazinet, A.L.; Cummings, M.P. A Comparative Evaluation of Sequence Classification Programs. BMC Bioinform. 2012, 13, 92. [Google Scholar] [CrossRef] [PubMed] [Green Version]
- Schoch, C.L.; Seifert, K.A.; Huhndorf, S.; Robert, V.; Spouge, J.L.; Levesque, C.A.; Chen, W.; Fungal Barcoding Consortium; Fungal Barcoding Consortium Author List; Bolchacova, E.; et al. Nuclear Ribosomal Internal Transcribed Spacer (ITS) Region as a Universal DNA Barcode Marker for Fungi. Proc. Natl. Acad. Sci. USA 2012, 109, 6241–6246. [Google Scholar] [CrossRef] [PubMed] [Green Version]
- White, T.J.; Bruns, T.; Lee, S.; Taylor, J. Amplification and Direct Sequencing of Fungal Ribosomal RNA Genes for Phylogenetics. In PCR Protocols: A Guide to Methods and Amplifications; Academic Press: Cambridge, MA, USA, 1990; pp. 315–322. ISBN 978-0-12-372180-8. [Google Scholar]
- Gardes, M.; Bruns, T.D. ITS Primers with Enhanced Specificity for Basidiomycetes—Application to the Identification of Mycorrhizae and Rusts. Mol. Ecol. 1993, 2, 113–118. [Google Scholar] [CrossRef] [PubMed]
- Toju, H.; Tanabe, A.S.; Yamamoto, S.; Sato, H. High-Coverage ITS Primers for the DNA-Based Identification of Ascomycetes and Basidiomycetes in Environmental Samples. PLoS ONE 2012, 7, e40863. [Google Scholar] [CrossRef] [Green Version]
- Turenne, C.Y.; Sanche, S.E.; Hoban, D.J.; Karlowsky, J.A.; Kabani, A.M. Rapid Identification of Fungi by Using the ITS2 Genetic Region and an Automated Fluorescent Capillary Electrophoresis System. J. Clin. Microbiol. 1999, 37, 1846–1851. [Google Scholar] [CrossRef] [Green Version]
- Vancov, T.; Keen, B. Amplification of Soil Fungal Community DNA Using the ITS86F and ITS4 Primers. FEMS Microbiol. Lett. 2009, 296, 91–96. [Google Scholar] [CrossRef] [Green Version]
- Larena, I.; Salazar, O.; González, V.; Julián, M.C.; Rubio, V. Design of a Primer for Ribosomal DNA Internal Transcribed Spacer with Enhanced Specificity for Ascomycetes. J. Biotechnol. 1999, 75, 187–194. [Google Scholar] [CrossRef]
- Ihrmark, K.; Bödeker, I.T.M.; Cruz-Martinez, K.; Friberg, H.; Kubartova, A.; Schenck, J.; Strid, Y.; Stenlid, J.; Brandström-Durling, M.; Clemmensen, K.E.; et al. New Primers to Amplify the Fungal ITS2 Region—Evaluation by 454-Sequencing of Artificial and Natural Communities. FEMS Microbiol. Ecol. 2012, 82, 666–677. [Google Scholar] [CrossRef]
- Oja, J.; Kohout, P.; Tedersoo, L.; Kull, T.; Kõljalg, U. Temporal Patterns of Orchid Mycorrhizal Fungi in Meadows and Forests as Revealed by 454 Pyrosequencing. New Phytol. 2015, 205, 1608–1618. [Google Scholar] [CrossRef]
- Tedersoo, L.; Bahram, M.; Põlme, S.; Kõljalg, U.; Yorou, N.S.; Wijesundera, R.; Ruiz, L.V.; Vasco-Palacios, A.M.; Thu, P.Q.; Suija, A.; et al. Global Diversity and Geography of Soil Fungi. Science 2014, 346, 1256688. [Google Scholar] [CrossRef] [PubMed] [Green Version]
- Taylor, D.L.; Walters, W.A.; Lennon, N.J.; Bochicchio, J.; Krohn, A.; Caporaso, J.G.; Pennanen, T. Accurate Estimation of Fungal Diversity and Abundance through Improved Lineage-Specific Primers Optimized for Illumina Amplicon Sequencing. Appl. Environ. Microbiol. 2016, 82, 7217–7226. [Google Scholar] [CrossRef] [PubMed] [Green Version]
- Nguyen, N.H.; Smith, D.; Peay, K.; Kennedy, P. Parsing Ecological Signal from Noise in next Generation Amplicon Sequencing. New Phytol. 2015, 205, 1389–1393. [Google Scholar] [CrossRef] [PubMed]
- Bakker, M.G. A Fungal Mock Community Control for Amplicon Sequencing Experiments. Mol. Ecol. Resour. 2018, 18, 541–556. [Google Scholar] [CrossRef] [PubMed]
- Yamamoto, N.; Bibby, K. Clustering of Fungal Community Internal Transcribed Spacer Sequence Data Obscures Taxonomic Diversity: Taxonomic Impacts of Clustering Fungal ITS. Environ. Microbiol. 2014, 16, 2491–2500. [Google Scholar] [CrossRef]
- Bjørnsgaard Aas, A.; Davey, M.L.; Kauserud, H. ITS All Right Mama: Investigating the Formation of Chimeric Sequences in the ITS2 Region by DNA Metabarcoding Analyses of Fungal Mock Communities of Different Complexities. Mol. Ecol. Resour. 2017, 17, 730–741. [Google Scholar] [CrossRef]
- Op De Beeck, M.; Lievens, B.; Busschaert, P.; Declerck, S.; Vangronsveld, J.; Colpaert, J.V. Comparison and Validation of Some ITS Primer Pairs Useful for Fungal Metabarcoding Studies. PLoS ONE 2014, 9, e97629. [Google Scholar] [CrossRef] [Green Version]
- Tedersoo, L.; Bahram, M.; Zinger, L.; Nilsson, R.H.; Kennedy, P.G.; Yang, T.; Anslan, S.; Mikryukov, V. Best Practices in Metabarcoding of Fungi: From Experimental Design to Results. Mol. Ecol. 2022, 31, 2769–2795. [Google Scholar] [CrossRef]
- Větrovský, T.; Kolařík, M.; Žifčáková, L.; Zelenka, T.; Baldrian, P. The Rpb2 Gene Represents a Viable Alternative Molecular Marker for the Analysis of Environmental Fungal Communities. Mol. Ecol. Resour. 2016, 16, 388–401. [Google Scholar] [CrossRef]
- Lücking, R.; Aime, M.C.; Robbertse, B.; Miller, A.N.; Ariyawansa, H.A.; Aoki, T.; Cardinali, G.; Crous, P.W.; Druzhinina, I.S.; Geiser, D.M.; et al. Unambiguous Identification of Fungi: Where Do We Stand and How Accurate and Precise Is Fungal DNA Barcoding? IMA Fungus 2020, 11, 14. [Google Scholar] [CrossRef]
- Bokulich, N.A.; Mills, D.A. Improved Selection of Internal Transcribed Spacer-Specific Primers Enables Quantitative, Ultra-High-Throughput Profiling of Fungal Communities. Appl. Environ. Microbiol. 2013, 79, 2519–2526. [Google Scholar] [CrossRef] [PubMed] [Green Version]
- Yang, R.-H.; Su, J.-H.; Shang, J.-J.; Wu, Y.-Y.; Li, Y.; Bao, D.-P.; Yao, Y.-J. Evaluation of the Ribosomal DNA Internal Transcribed Spacer (ITS), Specifically ITS1 and ITS2, for the Analysis of Fungal Diversity by Deep Sequencing. PLoS ONE 2018, 13, e0206428. [Google Scholar] [CrossRef] [PubMed] [Green Version]
- Blaalid, R.; Kumar, S.; Nilsson, R.H.; Abarenkov, K.; Kirk, P.M.; Kauserud, H. ITS1 versus ITS2 as DNA Metabarcodes for Fungi. Mol. Ecol. Resour. 2013, 13, 218–224. [Google Scholar] [CrossRef] [PubMed] [Green Version]
- Wang, X.-C.; Liu, C.; Huang, L.; Bengtsson-Palme, J.; Chen, H.; Zhang, J.-H.; Cai, D.; Li, J.-Q. ITS1: A DNA Barcode Better than ITS2 in Eukaryotes? Mol. Ecol. Resour. 2015, 15, 573–586. [Google Scholar] [CrossRef] [PubMed]
- Bazzicalupo, A.L.; Bálint, M.; Schmitt, I. Comparison of ITS1 and ITS2 RDNA in 454 Sequencing of Hyperdiverse Fungal Communities. Fungal Ecol. 2013, 6, 102–109. [Google Scholar] [CrossRef]
- Nilsson, R.H.; Larsson, K.-H.; Taylor, A.F.S.; Bengtsson-Palme, J.; Jeppesen, T.S.; Schigel, D.; Kennedy, P.; Picard, K.; Glöckner, F.O.; Tedersoo, L.; et al. The UNITE Database for Molecular Identification of Fungi: Handling Dark Taxa and Parallel Taxonomic Classifications. Nucleic Acids Res. 2019, 47, D259–D264. [Google Scholar] [CrossRef]
- del Campo, J.; Kolisko, M.; Boscaro, V.; Santoferrara, L.; Nenarokov, S.; Massana, R.; Guillou, L.; Simpson, A.; Berney, C.; de Vargas, C.; et al. EukRef: Phylogenetic Curation of Ribosomal RNA to Enhance Understanding of Eukaryotic Diversity and Distribution. PLoS Biol. 2018, 16, e2005849. [Google Scholar] [CrossRef] [PubMed] [Green Version]
- Arranz, V.; Pearman, W.S.; Aguirre, J.D.; Liggins, L. MARES, a Replicable Pipeline and Curated Reference Database for Marine Eukaryote Metabarcoding. Sci. Data 2020, 7, 209. [Google Scholar] [CrossRef]
- Porter, T.M.; Hajibabaei, M. Putting COI Metabarcoding in Context: The Utility of Exact Sequence Variants (ESVs) in Biodiversity Analysis. Front. Ecol. Evol. 2020, 8, 248. [Google Scholar] [CrossRef]
- Rué, O.; Coton, M.; Dugat-Bony, E.; Howell, K.; Irlinger, F.; Legras, J.-L.; Loux, V.; Michel, E.; Mounier, J.; Neuvéglise, C.; et al. Comparison of Metabarcoding Taxonomic Markers to Describe Fungal Communities in Fermented Foods. bioRxiv 2023. bioRxiv:13.523754. [Google Scholar] [CrossRef]
- Tedersoo, L.; Anslan, S.; Bahram, M.; Põlme, S.; Riit, T.; Liiv, I.; Kõljalg, U.; Kisand, V.; Nilsson, H.; Hildebrand, F.; et al. Shotgun Metagenomes and Multiple Primer Pair-Barcode Combinations of Amplicons Reveal Biases in Metabarcoding Analyses of Fungi. MycoKeys 2015, 10, 1–43. [Google Scholar] [CrossRef]
- Ehrich, M.; Zoll, S.; Sur, S.; van den Boom, D. A New Method for Accurate Assessment of DNA Quality after Bisulfite Treatment. Nucleic Acids Res. 2007, 35, e29. [Google Scholar] [CrossRef] [PubMed] [Green Version]
- Edwards, J.E.; Hermes, G.D.A.; Kittelmann, S.; Nijsse, B.; Smidt, H. Assessment of the Accuracy of High-Throughput Sequencing of the ITS1 Region of Neocallimastigomycota for Community Composition Analysis. Front. Microbiol. 2019, 10, 2370. [Google Scholar] [CrossRef] [PubMed]
- Lofgren, L.A.; Uehling, J.K.; Branco, S.; Bruns, T.D.; Martin, F.; Kennedy, P.G. Genome-based Estimates of Fungal RDNA Copy Number Variation across Phylogenetic Scales and Ecological Lifestyles. Mol. Ecol. 2019, 28, 721–730. [Google Scholar] [CrossRef] [PubMed]
- Bengtsson-Palme, J.; Ryberg, M.; Hartmann, M.; Branco, S.; Wang, Z.; Godhe, A.; De Wit, P.; Sánchez-García, M.; Ebersberger, I.; de Sousa, F.; et al. Improved Software Detection and Extraction of ITS1 and ITS2 from Ribosomal ITS Sequences of Fungi and Other Eukaryotes for Analysis of Environmental Sequencing Data. Methods Ecol. Evol. 2013, 4, 914–919. [Google Scholar] [CrossRef]
- Tedersoo, L.; Drenkhan, R.; Anslan, S.; Morales-Rodriguez, C.; Cleary, M. High-Throughput Identification and Diagnostics of Pathogens and Pests: Overview and Practical Recommendations. Mol. Ecol. 2018, 19, 47–76. [Google Scholar] [CrossRef] [Green Version]
- Sohrabi, M.; Mohammadi, H.; León, M.; Armengol, J.; Banihashemi, Z. Fungal Pathogens Associated with Branch and Trunk Cankers of Nut Crops in Iran. Eur. J. Plant Pathol. 2020, 157, 327–351. [Google Scholar] [CrossRef]
- Voglmayr, H.; Castlebury, L.A.; Jaklitsch, W.M. Juglanconis Gen. Nov. on Juglandaceae, and the New Family Juglanconidaceae (Diaporthales). Persoonia 2017, 38, 136–155. [Google Scholar] [CrossRef] [Green Version]
- Belisario, A. Cultural Characteristics and Pathogenicity of Melanconium juglandinum. Eur. J. For. Pathol. 1999, 29, 317–322. [Google Scholar] [CrossRef]
- Sayers, E.W.; Cavanaugh, M.; Clark, K.; Pruitt, K.D.; Schoch, C.L.; Sherry, S.T.; Karsch-Mizrachi, I. GenBank. Nucleic Acids Res. 2022, 50, D161–D164. [Google Scholar] [CrossRef]
- National Center for Biotechnology Information. Available online: https://www.ncbi.nlm.nih.gov/ (accessed on 21 May 2021).
- O’Leary, N.A.; Wright, M.W.; Brister, J.R.; Ciufo, S.; Haddad, D.; McVeigh, R.; Rajput, B.; Robbertse, B.; Smith-White, B.; Ako-Adjei, D.; et al. Reference Sequence (RefSeq) Database at NCBI: Current Status, Taxonomic Expansion, and Functional Annotation. Nucleic Acids Res. 2016, 44, D733–D745. [Google Scholar] [CrossRef] [Green Version]
- Kolařík, M.; Hulcr, J.; Tisserat, N.; De Beer, W.; Kostovčík, M.; Kolaříková, Z.; Seybold, S.J.; Rizzo, D.M. Geosmithia Associated with Bark Beetles and Woodborers in the Western USA: Taxonomic Diversity and Vector Specificity. Mycologia 2017, 109, 185–199. [Google Scholar] [CrossRef] [Green Version]
- Montecchio, L.; Fanchin, G.; Simonato, M.; Faccoli, M. First Record of Thousand Cankers Disease Fungal Pathogen Geosmithia Morbida and Walnut Twig Beetle Pityophthorus Juglandis on Juglans regia in Europe. Plant Dis. 2014, 98, 1445. [Google Scholar] [CrossRef]
- Yaghmour, M.A.; Nguyen, T.L.; Roubtsova, T.V.; Hasey, J.K.; Fichtner, E.J.; DeBuse, C.; Seybold, S.J.; Bostock, R.M. First Report of Geosmithia Morbida on English Walnut and Its Paradox Rootstock in California. Plant Dis. 2014, 98, 1441. [Google Scholar] [CrossRef]
- Zhu, Y.F.; Yin, Y.F.; Qu, W.W.; Yang, K.Q. Occurence and Spread of the Pathogens on Walnut (Juglans regia) in Shandong Province, China. In ISHS Acta Horticulturae 1050: VII International Walnut Symposium; ISHS: Leuven, Belgium, 2014; pp. 347–351. [Google Scholar] [CrossRef]
- Chen, S.F.; Morgan, D.P.; Hasey, J.K.; Anderson, K.; Michailides, T.J. Phylogeny, Morphology, Distribution, and Pathogenicity of Botryosphaeriaceae and Diaporthaceae from English Walnut in California. Plant Dis. 2014, 98, 636–652. [Google Scholar] [CrossRef] [Green Version]
- Inderbitzin, P.; Bostock, R.M.; Trouillas, F.P.; Michailides, T.J. A Six Locus Phylogeny Reveals High Species Diversity in Botryosphaeriaceae from California Almond. Mycologia 2010, 102, 1350–1368. [Google Scholar] [CrossRef]
- Gramaje, D.; Agustí-Brisach, C.; Pérez-Sierra, A.; Moralejo, E.; Olmo, D.; Mostert, L.; Damm, U.; Armengol, J. Fungal Trunk Pathogens Associated with Wood Decay of Almond Trees on Mallorca (Spain). Persoonia 2012, 28, 1–13. [Google Scholar] [CrossRef]
- Úrbez-Torres, J.R.; Peduto, F.; Vossen, P.M.; Krueger, W.H.; Gubler, W.D. Olive Twig and Branch Dieback: Etiology, Incidence, and Distribution in California. Plant Dis. 2013, 97, 231–244. [Google Scholar] [CrossRef] [PubMed] [Green Version]
- Carlucci, A.; Raimondo, M.L.; Cibelli, F.; Phillips, A.J.L.; Lops, F. Pleurostomophora Richardsiae, Neofusicoccum Parvum and Phaeoacremonium Aleophilum Associated with a Decline of Olives in Southern Italy. Phytopathol. Mediterr. 2013, 52, 517–527. [Google Scholar]
- López-Moral, A.; del Carmen Raya, M.; Ruiz-Blancas, C.; Medialdea, I.; Lovera, M.; Arquero, O.; Trapero, A.; Agustí-Brisach, C. Aetiology of Branch Dieback, Panicle and Shoot Blight of Pistachio Associated with Fungal Trunk Pathogens in Southern Spain. Plant Pathol. 2020, 69, 1237–1269. [Google Scholar] [CrossRef]
- Jiménez Luna, I.; Besoain, X.; Saa, S.; Peach-Fine, E.; Morales, F.C.; Riquelme, N.; Larach, A.; Morales, J.; Ezcurra, E.; Ashworth, V.E.T.M.; et al. Identity and Pathogenicity of Botryosphaeriaceae and Diaporthaceae from Juglans regia in Chile. Phytopathol. Mediterr. 2022, 61, 79–94. [Google Scholar] [CrossRef]
- Holland, L.A.; Trouillas, F.P.; Nouri, M.T.; Lawrence, D.P.; Crespo, M.; Doll, D.A.; Duncan, R.A.; Holtz, B.A.; Culumber, C.M.; Yaghmour, M.A.; et al. Fungal Pathogens Associated with Canker Diseases of Almond in California. Plant Dis. 2021, 105, 346–360. [Google Scholar] [CrossRef] [PubMed]
- Nouri, M.T.; Lawrence, D.P.; Holland, L.A.; Doll, D.A.; Kallsen, C.E.; Culumber, C.M.; Trouillas, F.P. Identification and Pathogenicity of Fungal Species Associated with Canker Diseases of Pistachio in California. Plant Dis. 2019, 103, 2397–2411. [Google Scholar] [CrossRef] [PubMed]
- Zhang, M.; Zhang, Y.K.; Geng, Y.H.; Zang, R.; Wu, H.Y. First Report of Diplodia Seriata Causing Twig Dieback of English Walnut in China. Plant Dis. 2017, 101, 1036. [Google Scholar] [CrossRef]
- Spies, C.F.J.; Mostert, L.; Carlucci, A.; Moyo, P.; van Jaarsveld, W.J.; du Plessis, I.L.; van Dyk, M.; Halleen, F. Dieback and Decline Pathogens of Olive Trees in South Africa. Persoonia 2020, 45, 196–220. [Google Scholar] [CrossRef]
- Chen, S.F.; Morgan, D.P.; Michailides, T.J. Botryosphaeriaceae and Diaporthaceae Associated with Panicle and Shoot Blight of Pistachio in California, USA. Fungal Divers. 2014, 67, 157–179. [Google Scholar] [CrossRef]
- Chen, S.; Li, G.; Liu, F.; Michailides, T.J. Novel Species of Botryosphaeriaceae Associated with Shoot Blight of Pistachio. Mycologia 2015, 107, 780–792. [Google Scholar] [CrossRef]
- Li, G.; Liu, F.; Li, J.; Liu, Q.; Chen, S. Characterization of Botryosphaeria Dothidea and Lasiodiplodia Pseudotheobromae from English Walnut in China. J. Phytopathol. 2016, 164, 348–353. [Google Scholar] [CrossRef]
- Derviş, S.; Türkölmez, Ş.; Çiftçi, O.; Ulubaş Serçe, Ç.; Dikilitas, M. First Report of Neoscytalidium Dimidiatum Causing Canker, Shoot Blight, and Root Rot of Pistachio in Turkey. Plant Dis. 2019, 103, 1411. [Google Scholar] [CrossRef]
- Güney, İ.G.; Özer, G.; Türkölmez, Ş.; Derviş, S. Canker and Leaf Scorch on Olive (Olea europaea L.) Caused by Neoscytalidium Dimidiatum in Turkey. Crop. Prot. 2022, 157, 105985. [Google Scholar] [CrossRef]
- Derviş, S.; Türkölmez, Ş.; Çiftçi, O.; Ulubaş Serçe, Ç.; Dikilitas, M. First Report of Neoscytalidium Dimidiatum Causing Black Canker and Root Rot of Walnut in Turkey. Plant Dis. 2019, 103, 2129. [Google Scholar] [CrossRef]
- Meng, L.; Yu, C.; Wang, C.; Li, G. First Report of Diaporthe Amygdali Causing Walnut Twig Canker in Shandong Province of China. Plant Dis. 2018, 102, 1859. [Google Scholar] [CrossRef]
- Diogo, E.L.F.; Santos, J.M.; Phillips, A.J.L. Phylogeny, Morphology and Pathogenicity of Diaporthe and Phomopsis Species on Almond in Portugal. Fungal Divers. 2010, 44, 107–115. [Google Scholar] [CrossRef]
- Yang, Q.; Fan, X.-L.; Guarnaccia, V.; Tian, C.-M. High Diversity of Diaporthe Species Associated with Dieback Diseases in China, with Twelve New Species Described. MycoKeys 2018, 39, 97–149. [Google Scholar] [CrossRef] [PubMed] [Green Version]
- Fang, X.; Qin, K.; Li, S.; Han, S.; Zhu, T.; Fang, X.; Qin, K. Whole Genome Sequence of Diaporthe Capsici, a New Pathogen of Walnut Blight. Genomics 2020, 112, 3751–3761. [Google Scholar] [CrossRef] [PubMed]
- Fan, X.; Yang, Q.; Bezerra, J.D.P.; Alvarez, L.V.; Tian, C. Diaporthe from Walnut Tree (Juglans regia) in China, with Insight of the Diaporthe Eres Complex. Mycol. Prog. 2018, 17, 841–853. [Google Scholar] [CrossRef]
- Kanematsu, S.; Minaka, N.; Kobayashi, T.; Kudo, A.; Ohtsu, Y. Molecular Phylogenetic Analysis of Ribosomal DNA Internal Transcribed Spacer Regions and Comparison of Fertility in Phomopsis Isolates from Fruit Trees. J. Gen. Plant Pathol. 2000, 66, 191–201. [Google Scholar] [CrossRef]
- Zhou, H.; Hou, C.-L. Three New Species of Diaporthe from China Based on Morphological Characters and DNA Sequence Data Analyses. Phytotaxa 2019, 422, 157–174. [Google Scholar] [CrossRef]
- He, L.; Li, X.; Gao, Y.; Li, B.; Mu, W.; Liu, F. Characterization and Fungicide Sensitivity of Colletotrichum spp. from Different Hosts in Shandong, China. Plant Dis. 2019, 103, 34–43. [Google Scholar] [CrossRef] [Green Version]
- de Silva, D.D.; Mann, R.C.; Kaur, J.; Ekanayake, P.N.; Sawbridge, T.I.; McKay, S.; Taylor, P.W.J.; Edwards, J. Revisiting the Colletotrichum Species Causing Anthracnose of Almond in Australia. Australas. Plant Pathol. 2021, 50, 267–279. [Google Scholar] [CrossRef]
- López-Moral, A.; Raya-Ortega, M.C.; Agustí-Brisach, C.; Roca, L.F.; Lovera, M.; Luque, F.; Arquero, O.; Trapero, A. Morphological, Pathogenic, and Molecular Characterization of Colletotrichum acutatum Isolates Causing Almond Anthracnose in Spain. Plant Dis. 2017, 101, 2034–2045. [Google Scholar] [CrossRef] [Green Version]
- Mosca, S.; Nicosia, M.G.L.D.; Cacciola, S.O.; Schena, L. Molecular Analysis of Colletotrichum Species in the Carposphere and Phyllosphere of Olive. PLoS ONE 2014, 9, e114031. [Google Scholar] [CrossRef] [PubMed] [Green Version]
- Shivas, R.G.; Tan, Y.P.; Edwards, J.; Dinh, Q.; Maxwell, A.; Andjic, V.; Liberato, J.R.; Anderson, C.; Beasley, D.R.; Bransgrove, K.; et al. Colletotrichum Species in Australia. Australas. Plant Pathol. 2016, 45, 447–464. [Google Scholar] [CrossRef]
- Wei, X.; Yang, S.Q.; Jiang, Z.G.; Cui, M.J.; Deng, J.X.; Zhang, Y. Colletotrichum Juglandis sp. nov. (Ascomycota: Glomerellaceae) Associated with Walnut Leaf Spot in China. Phytotaxa 2022, 556, 256–268. [Google Scholar] [CrossRef]
- Liu, B.; Pavel, J.A.; Hausbeck, M.K.; Feng, C.; Correll, J.C. Phylogenetic Analysis, Vegetative Compatibility, Virulence, and Fungal Filtrates of Leaf Curl Pathogen Colletotrichum Fioriniae from Celery. Phytopathology 2021, 111, 751–760. [Google Scholar] [CrossRef] [PubMed]
- Lichtemberg, P.S.F.; Moral, J.; Morgan, D.P.; Felts, D.G.; Sanders, R.D.; Michailides, T.J. First Report of Anthracnose Caused by Colletotrichum Fioriniae and C. Karstii in California Pistachio Orchards. Plant Dis. 2017, 101, 1320. [Google Scholar] [CrossRef]
- Wang, Q.H.; Li, D.W.; Duan, C.H.; Liu, X.H.; Niu, S.G.; Hou, L.Q.; Wu, X.Q. First Report of Walnut Anthracnose Caused by Colletotrichum Fructicola in China. Plant Dis. 2018, 102, 247. [Google Scholar] [CrossRef]
- Wang, Q.-H.; Fan, K.; Li, D.-W.; Han, C.-M.; Qu, Y.-Y.; Qi, Y.-K.; Wu, X.-Q. Identification, Virulence and Fungicide Sensitivity of Colletotrichum Gloeosporioides s.s. Responsible for Walnut Anthracnose Disease in China. Plant Dis. 2020, 104, 1358–1368. [Google Scholar] [CrossRef]
- Schena, L.; Mosca, S.; Cacciola, S.O.; Faedda, R.; Sanzani, S.M.; Agosteo, G.E.; Sergeeva, V.; Magnano di San Lio, G. Species of the Colletotrichum Gloeosporioides and C. Boninense Complexes Associated with Olive Anthracnose. Plant Pathol. 2014, 63, 437–446. [Google Scholar] [CrossRef]
- Savian, L.G.; Muniz, M.F.B.; Poletto, T.; Maculan, L.G.; Rabuske, J.E.; Blume, E.; Sarzi, J.S. First Report of Colletotrichum Nymphaeae Causing Anthracnose on Juglans regia Fruits in Southern Brazil. Plant Dis. 2019, 103, 3287. [Google Scholar] [CrossRef]
- Varjas, V.; Szilágyi, S.; Lakatos, T. First Report of Colletotrichum Nymphaeae Causing Anthracnose on Almond in Hungary. Plant Dis. 2022, 106, 1527. [Google Scholar] [CrossRef]
- Damm, U.; Cannon, P.F.; Woudenberg, J.H.C.; Crous, P.W. The Colletotrichum acutatum Species Complex. Stud. Mycol. 2012, 73, 37–113. [Google Scholar] [CrossRef] [Green Version]
- Walker, D.M.; Castlebury, L.A.; Rossman, A.Y.; Mejía, L.C.; White, J.F. Phylogeny and Taxonomy of Ophiognomonia (Gnomoniaceae, Diaporthales), Including Twenty-Five New Species in This Highly Diverse Genus. Fungal Divers. 2012, 57, 85–147. [Google Scholar] [CrossRef]
- Belisario, A.; Scotton, M.; Santori, A.; Onofri, S. Variability in the Italian Population of Gnomonia Leptostyla, Homothallism and Resistance of Juglans Species to Anthracnose. For. Pathol. 2008, 38, 129–145. [Google Scholar] [CrossRef]
- Ma, R.; Ye, S.; Zhao, Y.; Michailides, T.J.; Tian, C. New Leaf and Fruit Disease of Juglans regia Caused by Juglanconis Juglandina in Xinjiang, China. For. Path. 2019, 49, e12537. [Google Scholar] [CrossRef]
- Moya-Elizondo, E.A.; Lagos, M.J.; San Martin, J.; Ruiz, B. First Report of Alternaria Alternata and Fusarium spp. Causing Brown Apical Necrosis in Walnut Fruit in Southern Chile. Plant Health Prog. 2021, 22, 573–574. [Google Scholar] [CrossRef]
- Wang, Y.X.; Chen, J.Y.; Xu, X.W.; Li, D.W.; Wang, Q.Z. First Report of Brown Apical Necrosis of Walnut Fruit Caused by Fusarium Avenaceum in Hubei, China. Plant Dis. 2019, 103, 2956. [Google Scholar] [CrossRef]
- Belisario, A.; Maccaroni, M.; Corazza, L.; Balmas, V.; Valier, A. Occurrence and Etiology of Brown Apical Necrosis on Persian (English) Walnut Fruit. Plant Dis. 2002, 86, 599–602. [Google Scholar] [CrossRef] [PubMed] [Green Version]
- Marek, S.M.; Yaghmour, M.A.; Bostock, R.M. Fusarium spp., Cylindrocarpon spp., and Environmental Stress in the Etiology of a Canker Disease of Cold-Stored Fruit and Nut Tree Seedlings in California. Plant Dis. 2013, 97, 259–270. [Google Scholar] [CrossRef] [Green Version]
- Chen, W.; Ntahimpera, N.; Morgan, D.P.; Michailides, T.J. Mycoflora of Pistacia Vera in the Central Valley, California. Mycotaxon 2002, 83, 147–158. [Google Scholar]
- Trabelsi, R.; Sellami, H.; Gharbi, Y.; Krid, S.; Cheffi, M.; Kammoun, S.; Dammak, M.; Mseddi, A.; Gdoura, R.; Triki, M.A. Morphological and Molecular Characterization of Fusarium spp. Associated with Olive Trees Dieback in Tunisia. 3 Biotech 2017, 7, 28. [Google Scholar] [CrossRef] [PubMed] [Green Version]
- Singh, B.; Kalha, C.S.; Razdan, V.K.; Verma, V.S. First Report of Walnut Canker Caused by Fusarium Incarnatum from India. Plant Dis. 2011, 95, 1587. [Google Scholar] [CrossRef] [PubMed]
- Crous, P.W.; Cowan, D.A.; Maggs-Kölling, G.; Yilmaz, N.; Thangavel, R.; Wingfield, M.J.; Noordeloos, M.E.; Dima, B.; Brandrud, T.E.; Jansen, G.M.; et al. Fungal Planet Description Sheets: 1182–1283. Persoonia 2021, 46, 313. [Google Scholar] [CrossRef] [PubMed]
- Crespo, M.; Lawrence, D.P.; Nouri, M.T.; Doll, D.A.; Trouillas, F.P. Characterization of Fusarium and Neocosmospora Species Associated With Crown Rot and Stem Canker of Pistachio Rootstocks in California. Plant Dis. 2019, 103, 1931–1939. [Google Scholar] [CrossRef] [PubMed]
- Chen, W.; Swart, W.J. First Report of Stem Canker of English Walnut Caused by Fusarium Solani in South Africa. Plant Dis. 2000, 84, 592. [Google Scholar] [CrossRef] [PubMed]
- Montecchio, L.; Faccoli, M.; Short, D.P.G.; Fanchin, G.; Geiser, D.M.; Kasson, M.T. First Report of Fusarium Solani Phylogenetic Species 25 Associated With Early Stages of Thousand Cankers Disease on Juglans Nigra and Juglans regia in Italy. Plant Dis. 2015, 99, 1183. [Google Scholar] [CrossRef]
- Teviotdale, B.L.; Viveros, M.; Pryor, B.; Adaskaveg, J.E. First Report of Alternaria Leaf Spot of Almond Caused by Species in the Alternaria Alternata Complex in California. Plant Dis. 2001, 85, 558. [Google Scholar] [CrossRef]
- Ozkilinc, H.; Sarpkaya, K.; Kurt, S.; Can, C.; Polatbilek, H.; Yasar, A.; Sevinc, U.; Uysal, A.; Konukoglu, F. Pathogenicity, Morpho-Species and Mating Types of Alternaria spp. Causing Alternaria Blight in Pistacia spp. in Turkey. Phytoparasitica 2017, 45, 719–728. [Google Scholar] [CrossRef]
- Carlucci, A.; Lops, F.; Cibelli, F.; Raimondo, M.L. Phaeoacremonium Species Associated with Olive Wilt and Decline in Southern Italy. Eur. J. Plant Pathol. 2015, 141, 717–729. [Google Scholar] [CrossRef] [Green Version]
- Raimondo, M.L.; Lops, F.; Carlucci, A. First Report of Phaeoacremonium Oleae and P. Viticola Associated with Olive Trunk Diseases in Italy. Plant Dis. 2021, 106, 331. [Google Scholar] [CrossRef]
- Lawrence, D.P.; Holland, L.A.; Nouri, M.T.; Travadon, R.; Abramians, A.; Michailides, T.J.; Trouillas, F.P. Molecular Phylogeny of Cytospora Species Associated with Canker Diseases of Fruit and Nut Crops in California, with the Descriptions of Ten New Species and One New Combination. IMA Fungus 2018, 9, 333–369. [Google Scholar] [CrossRef]
- Fan, X.L.; Bezerra, J.D.P.; Tian, C.M.; Crous, P.W. Cytospora (Diaporthales) in China. Persoonia 2020, 45, 1–45. [Google Scholar] [CrossRef]
- Fotouhifar, K.-B.; Hedjaroude, G.-A.; Leuchtmann, A. ITS RDNA Phylogeny of Iranian Strains of Cytospora and Associated Teleomorphs. Mycologia 2010, 102, 1369–1382. [Google Scholar] [CrossRef] [PubMed]
- Zhao, S.F.; Guo, K.F.; He, L.; Yiming, A. First Report of Cytospora Nivea Causing Cytospora Canker on Walnut (Juglans regia L.) in the Tianshan Mountains Region of Xinjiang, China. Plant Dis. 2018, 102, 2640. [Google Scholar] [CrossRef]
- Schrader, C.; Schielke, A.; Ellerbroek, L.; Johne, R. PCR Inhibitors—Occurrence, Properties and Removal. J. Appl. Microbiol. 2012, 113, 1014–1026. [Google Scholar] [CrossRef] [PubMed]
- Jahanban-Esfahlan, A.; Ostadrahimi, A.; Tabibiazar, M.; Amarowicz, R. A Comprehensive Review on the Chemical Constituents and Functional Uses of Walnut (Juglans spp.) Husk. Int. J. Mol. Sci. 2019, 20, 3920. [Google Scholar] [CrossRef] [Green Version]
- Sasada, R.; Weinstein, M.; Prem, A.; Jin, M.; Bhasin, J. FIGARO: An Efficient and Objective Tool for Optimizing Microbiome RRNA Gene Trimming Parameters. J. Biomol. Tech. 2020, 31, S2. [Google Scholar]
- Edgar, R.C.; Flyvbjerg, H. Error Filtering, Pair Assembly and Error Correction for Next-Generation Sequencing Reads. Bioinformatics 2015, 31, 3476–3482. [Google Scholar] [CrossRef] [Green Version]
- Callahan, B.J.; McMurdie, P.J.; Rosen, M.J.; Han, A.W.; Johnson, A.J.A.; Holmes, S.P. DADA2: High Resolution Sample Inference from Illumina Amplicon Data. Nat. Methods 2016, 13, 581–583. [Google Scholar] [CrossRef] [Green Version]
- Altschul, S.F.; Gish, W.; Miller, W.; Myers, E.W.; Lipman, D.J. Basic Local Alignment Search Tool. J. Mol. Biol. 1990, 215, 403–410. [Google Scholar] [CrossRef]
- Brown, S.P.; Veach, A.M.; Rigdon-Huss, A.R.; Grond, K.; Lickteig, S.K.; Lothamer, K.; Oliver, A.K.; Jumpponen, A. Scraping the Bottom of the Barrel: Are Rare High Throughput Sequences Artifacts? Fungal Ecol. 2015, 13, 221–225. [Google Scholar] [CrossRef] [Green Version]
- Caporaso, J.G.; Kuczynski, J.; Stombaugh, J.; Bittinger, K.; Bushman, F.D.; Costello, E.K.; Fierer, N.; Peña, A.G.; Goodrich, J.K.; Gordon, J.I.; et al. QIIME Allows Analysis of High-Throughput Community Sequencing Data. Nat. Methods 2010, 7, 335–336. [Google Scholar] [CrossRef] [PubMed] [Green Version]
- McMurdie, P.J.; Holmes, S. Phyloseq: An R Package for Reproducible Interactive Analysis and Graphics of Microbiome Census Data. PLoS ONE 2013, 8, e61217. [Google Scholar] [CrossRef] [PubMed] [Green Version]
- Katoh, K.; Rozewicki, J.; Yamada, K.D. MAFFT Online Service: Multiple Sequence Alignment, Interactive Sequence Choice and Visualization. Brief. Bioinform. 2019, 20, 1160–1166. [Google Scholar] [CrossRef] [Green Version]
- Talavera, G.; Castresana, J. Improvement of Phylogenies after Removing Divergent and Ambiguously Aligned Blocks from Protein Sequence Alignments. Syst. Biol. 2007, 56, 564–577. [Google Scholar] [CrossRef] [Green Version]
- Castresana, J. Selection of Conserved Blocks from Multiple Alignments for Their Use in Phylogenetic Analysis. Mol. Biol. Evol. 2000, 17, 540–552. [Google Scholar] [CrossRef] [Green Version]
- Bouckaert, R.; Vaughan, T.G.; Barido-Sottani, J.; Duchêne, S.; Fourment, M.; Gavryushkina, A.; Heled, J.; Jones, G.; Kühnert, D.; Maio, N.D.; et al. BEAST 2.5: An Advanced Software Platform for Bayesian Evolutionary Analysis. PLoS Comput. Biol. 2019, 15, e1006650. [Google Scholar] [CrossRef] [Green Version]
- Bouckaert, R.R.; Drummond, A.J. BModelTest: Bayesian Phylogenetic Site Model Averaging and Model Comparison. BMC Evol. Biol. 2017, 17, 42. [Google Scholar] [CrossRef] [Green Version]
- Rambaut, A.; Drummond, A.J.; Xie, D.; Baele, G.; Suchard, M.A. Posterior Summarization in Bayesian Phylogenetics Using Tracer 1.7. Syst. Biol. 2018, 67, 901–904. [Google Scholar] [CrossRef] [Green Version]
- Rambaut, A. FigTree. Available online: http://tree.bio.ed.ac.uk/software/figtree/ (accessed on 28 November 2022).


| Fungal Species Included in Mock Communities | Mock1 | Mock2 | Mock3 | Mock4 | Mock5 | ||||||||||||||||||||||||||||
|---|---|---|---|---|---|---|---|---|---|---|---|---|---|---|---|---|---|---|---|---|---|---|---|---|---|---|---|---|---|---|---|---|---|
| ITS | ITS1 | GTAA | GTAAm | Kyo | ITS | ITS1 | GTAA | GTAAm | Kyo | ITS | ITS1 | GTAA | GTAAm | Kyo | ITS | ITS1 | GTAA | GTAAm | Kyo | ITS | ITS1 | GTAA | GTAAm | Kyo | |||||||||
| Botryosphaeria dothidea | |||||||||||||||||||||||||||||||||
| Diplodia seriata | |||||||||||||||||||||||||||||||||
| Dothiorella omnivora | |||||||||||||||||||||||||||||||||
| Lasiodiplodia theobromae | |||||||||||||||||||||||||||||||||
| Neofusicoccum mediterraneum | |||||||||||||||||||||||||||||||||
| N. parvum | |||||||||||||||||||||||||||||||||
| Diaporthe amygdali | |||||||||||||||||||||||||||||||||
| Dia. eres | |||||||||||||||||||||||||||||||||
| Dia. foeniculina | |||||||||||||||||||||||||||||||||
| Dia. novem | |||||||||||||||||||||||||||||||||
| Dia. rudis | |||||||||||||||||||||||||||||||||
| Epicoccum nigrum | |||||||||||||||||||||||||||||||||
| Colletotrichum fioriniae | |||||||||||||||||||||||||||||||||
| C. godetiae | |||||||||||||||||||||||||||||||||
| Fusarium juglandicola | |||||||||||||||||||||||||||||||||
| F. solani | |||||||||||||||||||||||||||||||||
| Gibellulopsis nigrescens | |||||||||||||||||||||||||||||||||
| Alternaria alternata | |||||||||||||||||||||||||||||||||
| Sample (Number of Expected ASVs) | Primer Set | Sensitivity | Precision | Similarity of Composition | Number of Obtained ASVs |
|---|---|---|---|---|---|
| Mock1 (6 ASVs) | ITS | 0.833 b | 0.045 c ± 0.001 | 0.739 c ± 0.016 | 113 ± 3.6 |
| ITS1 | 0.833 b | 0.242 abc ± 0.007 | 0.845 a ± 0.003 | 21.7 ± 0.6 | |
| GTAA | 1 a | 0.500 a | 0.846 ab ± 0.001 | 12 | |
| GTAAm | 1 a | 0.250 ab | 0.820 abc ± 0.002 | 24 | |
| Kyo | 0.833 b | 0.114 bc | 0.814 bc ± 0.004 | 45 | |
| Mock2 (5 ASVs) | ITS | 1 a | 0.099 b ± 0.002 | 1 a | 50.3 ± 1.1 |
| ITS1 | 1 a | 0.341 ac ± 0.014 | 1 a | 14.7 ± 0.6 | |
| GTAA | 1 a | 0.500 a | 1 a | 10 | |
| GTAAm | 1 a | 0.278 abc | 1 a | 18 | |
| Kyo | 1 a | 0.135 bc | 1 a | 37 | |
| Mock3 (17 ASVs) | ITS | 0.941 a | 0.178 ac ± 0.003 | 0.301 c ± 0.007 | 90.7 ± 1.5 |
| ITS1 | 0.804 b ± 0.068 | 0.518 b ± 0.032 | 0.324 ac ± 0.005 | 27.3 ± 0.6 | |
| GTAA | 0.882 ab | 0.454 ab | 0.710 ab ± 0.003 | 34 | |
| GTAAm | 0.941 a | 0.253 abc ± 0.002 | 0.702 abc ± 0.010 | 64.3 ± 0.6 | |
| Kyo | 0.882 ab | 0.115 c | 0.749 b ± 0.005 | 132 | |
| Mock4 (18 ASVs) | ITS | 0.870 b ± 0.032 | 0.154 b ± 0.011 | 0.325 ac ± 0.003 | 103.7 ± 4.9 |
| ITS1 | 0.685 b ± 0.085 | 0.457 a ± 0.056 | 0.292 c ± 0.001 | 28 | |
| GTAA | 0.889 ab | 0.453 a ± 0.015 | 0.707 abc ± 0.006 | 36.3 ± 1.1 | |
| GTAAm | 0.944 a | 0.260 ab ± 0.002 | 0.751 ab ± 0.006 | 66.3 ± 0.6 | |
| Kyo | 0.889 ab | 0.115 b | 0.769 b ± 0.007 | 140.7 ± 0.6 | |
| Mock5 (17 ASVs) | ITS | 0.941 a | 0.178 ac ± 0.007 | 0.312 c ± 0.006 | 91 ± 3.5 |
| ITS1 | 0.706 b ± 0.059 | 0.495 b ± 0.025 | 0.327 ac ± 0.020 | 25.3 ± 3.0 | |
| GTAA | 0.882 ab | 0.454 ab | 0.731 ab ± 0.009 | 34 | |
| GTAAm | 0.941 a | 0.255 abc ± 0.002 | 0.718 abc ± 0.005 | 63.7 ± 0.6 | |
| Kyo | 0.882 ab | 0.117 c ± 0.004 | 0.764 b ± 0.009 | 129.7 ± 4.0 |
| Fungal Species Included in Mock Communities | GTAAm | Kyo | ||||||
|---|---|---|---|---|---|---|---|---|
| w/ | wo/ | w/ | wo/ | |||||
| Genus | Species | Genus | Species | Genus | Species | Genus | Species | |
| Botryosphaeria dothidea | ||||||||
| Diplodia seriata | ||||||||
| Dothiorella omnivora | ||||||||
| Lasiodiplodia theobromae | ||||||||
| Neofusicoccum mediterraneum | ||||||||
| N. parvum | ||||||||
| Diaporthe amygdali | ||||||||
| Dia. eres | ||||||||
| Dia. foeniculina | ||||||||
| Dia. novem | ||||||||
| Dia. rudis | ||||||||
| Epicoccum nigrum | ||||||||
| Colletotrichum fioriniae | ||||||||
| C. godetiae | ||||||||
| Fusarium juglandicola | ||||||||
| F. solani | ||||||||
| Gibellulopsis nigrescens | ||||||||
| Alternaria alternata | ||||||||
| Sample | Primer Set | Sensitivity | Precision | Similarity of Composition | |||||||
|---|---|---|---|---|---|---|---|---|---|---|---|
| Genus | Species | Genus | Species | ||||||||
| w/ | w/o | w/ | w/o | w/ | w/o | w/ | w/o | Genus | Species | ||
| Mock1 | GTAAm | 0.5 a | 0.333 b | 0.167 a | 0 b | 0.143 a | 0.1 ab | 0.053 a | 0 b | 0.820 A ± 0.002 | 0.822 A ± 0.004 |
| Kyo | 0.333 b | 0.5 a | 0.167 a | 0.167 a | 0.049 c | 0.071 bc | 0.025 ab | 0.025 ab | 0.814 B± 0.004 | 0.826 A ± 0.006 | |
| Mock2 | GTAAm | 1 a | 1 a | 0.4 a | 0.4 a | 0.278 a | 0.278 a | 0.133 a | 0.133 a | 1 A | 0.790 A ± 0.004 |
| Kyo | 1 a | 1 a | 0.5 a | 0.6 b | 0.135 b | 0.135 b | 0.059 b | 0.086 ab | 1 A | 0.817 B ± 0.004 | |
| Mock3 | GTAAm | 0.823 a | 0.765 b | 0.235 ab | 0.176 a | 0.228 a ± 0.002 | 0.215 ab ± 0.002 | 0.078 a ± 0.001 | 0.060 bc ± 0.001 | 0.702 A ± 0.010 | 0.655 A ± 0.008 |
| Kyo | 0.765 b | 0.823 a | 0.236 ab | 0.470 b | 0.101 c | 0.108 bc | 0.034 b | 0.065 ac | 0.749 B ± 0.005 | 0.745 B ± 0.001 | |
| Mock4 | GTAAm | 0.833 a | 0.779 b | 0.278 ab | 0.222 a | 0.237 a ± 0.002 | 0.225 ab ± 0.002 | 0.094 a ± 0.001 | 0.076 ab ± 0.001 | 0.751 A ± 0.006 | 0.710 A± 0.003 |
| Kyo | 0.778 b | 0.833 a | 0.245 ab | 0.5 b | 0.102 c | 0.109 bc | 0.039 c | 0.068 bc | 0.769 B ± 0.007 | 0.770 B ± 0.008 | |
| Mock5 | GTAAm | 0.823 a | 0.765 b | 0.235 ab | 0.176 a | 0.229 a | 0.219 ab ± 0.002 | 0.078 a | 0.060 bc ± 0.001 | 0.718 A ± 0.005 | 0.672 A ± 0.004 |
| Kyo | 0.765 b | 0.823 a | 0.235 ab | 0.470 b | 0.103 c ± 0.003 | 0.111 bc ± 0.003 | 0.034 b ± 0.001 | 0.066 ac ± 0.002 | 0.764 B ± 0.009 | 0.765 B ± 0.010 | |
| Classification | Species | Host (Species) | References | |||
|---|---|---|---|---|---|---|
| Walnut (Juglans regia) | Almond (Prunus dulcis) | Pistachio (Pistacia vera) | Olive (Olea europaea) | |||
| Bionectriaceae | Geosmithia flava | X | [76] | |||
| G. lavendula | X | [76] | ||||
| G. morbida | X | [77,78] | ||||
| Botryosphaeriaceae | Botryosphaeria dothidea | X | X | X | X | [11,12,79,80,81,82,83,84,85] |
| Diplodia gallae | X | [70] | ||||
| D. mutila | X | X | X | X | [80,83,84,86,87,88] | |
| D. seriata | X | X | X | X | [7,80,81,82,83,86,87,89,90,91] | |
| Dothiorella iberica | X | X | X | X | [80,83,87,91] | |
| Dot. omnivora | X | [10,70] | ||||
| Dot. plurivora | X | [70] | ||||
| Dot. sarmentorum | X | X | X | [7,70,81,91] | ||
| Dot. viticola | X | X | [70,87] | |||
| Lasiodiplodia citricola | X | X | [70,80,91] | |||
| L. mahajangana | X | X | [70,92] | |||
| L. pseudotheobromae | X | X | [85,93] | |||
| L. theobromae | X | X | X | X | [70,81,83,84,87] | |
| Neofusicoccum hellenicum | X | [92] | ||||
| N. luteum | X | [83,84] | ||||
| N. mediterraneum | X | X | X | X | [7,80,81,83,85,87,88,91] | |
| N. nonquaesitum | X | X | [80,81] | |||
| N. parvum | X | X | X | X | [7,11,80,81,82,84,85,86,87] | |
| N. vitifusiforme | X | X | X | X | [80,83,87,90,91] | |
| Neoscytalidium dimidiatum | X | X | X | X | [80,87,94,95,96] | |
| Diaporthaceae | Diaporthe amygdali | X | X | [7,82,97,98] | ||
| Dia. australafricana | X | X | [86,87] | |||
| Dia. biguttulata | X | [99] | ||||
| Dia. capsici | X | [100] | ||||
| Dia. cynaroidis | X | [86] | ||||
| Dia. eres | X | X | [10,11,87,99] | |||
| Dia. foeniculina | X | X | X | X | [7,11,80,85,90,98] | |
| Dia. juglandicola | X | [101] | ||||
| Dia. novem | X | X | [87], this study | |||
| Dia. rudis | X | X | X | [83,91,102], this study | ||
| Dia. shennongjiaensis | X | [103] | ||||
| Didymellaceae | Epicoccum nigrum | X | X | [11,84] | ||
| Glomerellaceae | Colletotrichum acutatum | X | X | X | X | [104,105,106,107,108] |
| C. fioriniae | X | X | X | X | [5,11,105,107,109,110,111] | |
| C. fructicola | X | [112] | ||||
| C. gloeosporioides | X | X | X | [5,107,109,113,114] | ||
| C. godetiae | X | X | X | [5,11,106,107,109,110] | ||
| C. kahawae | X | X | [109,114] | |||
| C. nymphaeae | X | X | X | [5,109,115,116,117] | ||
| C. siamense | X | X | X | [108,113,114] | ||
| C. viniferum | X | [104] | ||||
| Gnomoniaceae | Ophiognomonia leptostyla | X | [118,119] | |||
| Juglanconidaceae | Juglanconis appendiculata | X | [71] | |||
| J. juglandina | X | [71,120] | ||||
| Nectriaceae | Fusarium avenaceum | X | X | X | [121,122,123,124,125] | |
| F. chlamydosporum | X | X | [125,126] | |||
| F. culmorum | X | X | [121,123,125] | |||
| F. equiseti | X | [125] | ||||
| F. graminearum | X | [123] | ||||
| F. incarnatum | X | X | [123,125,127] | |||
| F. juglandicola | X | [128] | ||||
| F. oxysporum | X | X | X | [121,123,125,126] | ||
| F. proliferatum | X | X | [123,129] | |||
| F. solani | X | X | X | X | [11,124,125,126,130,131] | |
| Plectosphaerellaceae | Gibellulopsis nigrescens | X | [11] | |||
| Pleosporaceae | Alternaria alternata | X | X | X | X | [79,84,121,132,133] |
| A. arborescens | X | X | [132,133] | |||
| A. tenuissima | X | X | X | X | [79,84,130,132,133] | |
| Togniniaceae | Phaeoacremonium cinereum | X | X | [70] | ||
| P. fraxinopennsylvanicum | X | [70] | ||||
| P. italicum | X | X | X | [70,134] | ||
| P. minimum | X | X | X | X | [70,85,90] | |
| P. parasiticum | X | X | X | X | [70,90,134] | |
| P. sicilianum | X | X | [10,134] | |||
| P. tuscanum | X | [70] | ||||
| P. viticola | X | X | X | X | [70,135] | |
| Valsaceae | Cytospora atrocirrhata | X | [136,137] | |||
| Cyt. californica | X | X | X | [87,88,136] | ||
| Cyt. ceratosperma | X | [137] | ||||
| Cyt. chrysosperma | X | [136,138] | ||||
| Cyt. cincta | X | [138] | ||||
| Cyt. gigalocus | X | [136,137] | ||||
| Cyt. joaquinensis | X | X | [88,136] | |||
| Cyt. nivea | X | [139] | ||||
| Cyt. plurivora | X | X | X | X | [87,136] | |
| Barcode | Primer Name | Set Name | Direction | Sequence (5′-3′) | Amplicon Size (bp) | Primer Reference |
|---|---|---|---|---|---|---|
| ITS | ITS1F | ITS | Forward | CTTGGTCATTTAGAGGAAGTAA | 617 | [37] |
| ITS4 | Reverse | TCCTCCGCTTATTGATATGC | [36] | |||
| ITS1 | ITS1F | ITS1 | Forward | CTTGGTCATTTAGAGGAAGTAA | 295 | [37] |
| ITS2 | Reverse | GCTGCGTTCTTCATCGATGC | [36] | |||
| ITS2 | GTAA182f | GTAA | Forward | AAAACTTTCAACAACGGATC | 337 | [20] |
| GTAA526r | Reverse | TYCCTACCTGATCCGAGGTC | [20] | |||
| GTAA182fm | GTAAm | Forward | AAAACTTTYAACAACGGATC | 337 | This study | |
| GTAA526r | Reverse | TYCCTACCTGATCCGAGGTC | [20] | |||
| ITS3 | Kyo | Forward | GCATCGATGAAGAACGCAGC | 342 | [36] | |
| ITS4_KYO1 | Reverse | TCCTCCGCTTWTTGWTWTGC | [38] |
| Classification | Species | Strain No. | DNA Solutions Included in Mocks | ||||
|---|---|---|---|---|---|---|---|
| Mock1 e | Mock2 f | Mock3 g | Mock4 h | Mock5 i | |||
| Plant | |||||||
| Juglandaceae | Juglans regia | - | X | ||||
| Fungi | |||||||
| Botryosphaeriaceae | Botryosphaeria dothidea | P12N1I2_2020 a | X | X | X | X | |
| Diplodia seriata | CBS112555 b | X | X | X | X | ||
| Dothiorella omnivora | CBS140349 b | X | X | X | X | ||
| Lasiodiplodia theobromae | CBS164.96 b | X | X | X | X | ||
| Neofusicoccum mediterraneum | CBS121718 b | X | X | X | X | ||
| N. parvum | P12N1I1_2020 a | X | X | X | X | ||
| Diaporthaceae | Diaporthe amygdali | CBS126679 b | X | X | X | X | |
| Dia. eres | P12N2I3_2020 a | X | X | X | X | ||
| Dia. foeniculina | UBOCC-A-122019 c | X | X | X | X | ||
| Dia. novem | UBOCC-A-122020 c | X | X | X | X | ||
| Dia. rudis | P9N3I1_2020 a | X | X | X | X | ||
| Didymellaceae | Epicoccum nigrum | P12N5I8_2020 a | X | X | X | ||
| Glomerellaceae | Colletotrichum fioriniae | UBOCC-A-122017 c | X | X | X | ||
| C. godetiae | UBOCC-A-122016 c | X | X | X | |||
| Nectriaceae | Fusarium juglandicola | UBOCC-A-119001 d | X | X | X | ||
| F. solani | UBOCC-A-122023 c | X | X | X | |||
| Plectosphaerellaceae | Gibellulopsis nigrescens | UBOCC-A-122024 c | X | ||||
| Pleosporaceae | Alternaria alternata | UBOCC-A-122015 c | X | X | X | ||
Disclaimer/Publisher’s Note: The statements, opinions and data contained in all publications are solely those of the individual author(s) and contributor(s) and not of MDPI and/or the editor(s). MDPI and/or the editor(s) disclaim responsibility for any injury to people or property resulting from any ideas, methods, instructions or products referred to in the content. |
© 2023 by the authors. Licensee MDPI, Basel, Switzerland. This article is an open access article distributed under the terms and conditions of the Creative Commons Attribution (CC BY) license (https://creativecommons.org/licenses/by/4.0/).
Share and Cite
Belair, M.; Pensec, F.; Jany, J.-L.; Le Floch, G.; Picot, A. Profiling Walnut Fungal Pathobiome Associated with Walnut Dieback Using Community-Targeted DNA Metabarcoding. Plants 2023, 12, 2383. https://doi.org/10.3390/plants12122383
Belair M, Pensec F, Jany J-L, Le Floch G, Picot A. Profiling Walnut Fungal Pathobiome Associated with Walnut Dieback Using Community-Targeted DNA Metabarcoding. Plants. 2023; 12(12):2383. https://doi.org/10.3390/plants12122383
Chicago/Turabian StyleBelair, Marie, Flora Pensec, Jean-Luc Jany, Gaétan Le Floch, and Adeline Picot. 2023. "Profiling Walnut Fungal Pathobiome Associated with Walnut Dieback Using Community-Targeted DNA Metabarcoding" Plants 12, no. 12: 2383. https://doi.org/10.3390/plants12122383
APA StyleBelair, M., Pensec, F., Jany, J.-L., Le Floch, G., & Picot, A. (2023). Profiling Walnut Fungal Pathobiome Associated with Walnut Dieback Using Community-Targeted DNA Metabarcoding. Plants, 12(12), 2383. https://doi.org/10.3390/plants12122383