
Analysis of Genetic Diversity and Population Structure in Bitter Gourd (Momordica charantia L.) Using Morphological and SSR Markers

 , ,
, , 
Abstract
:1. Introduction
2. Results
2.1. Performance of Accessions Based on Quantitative Traits
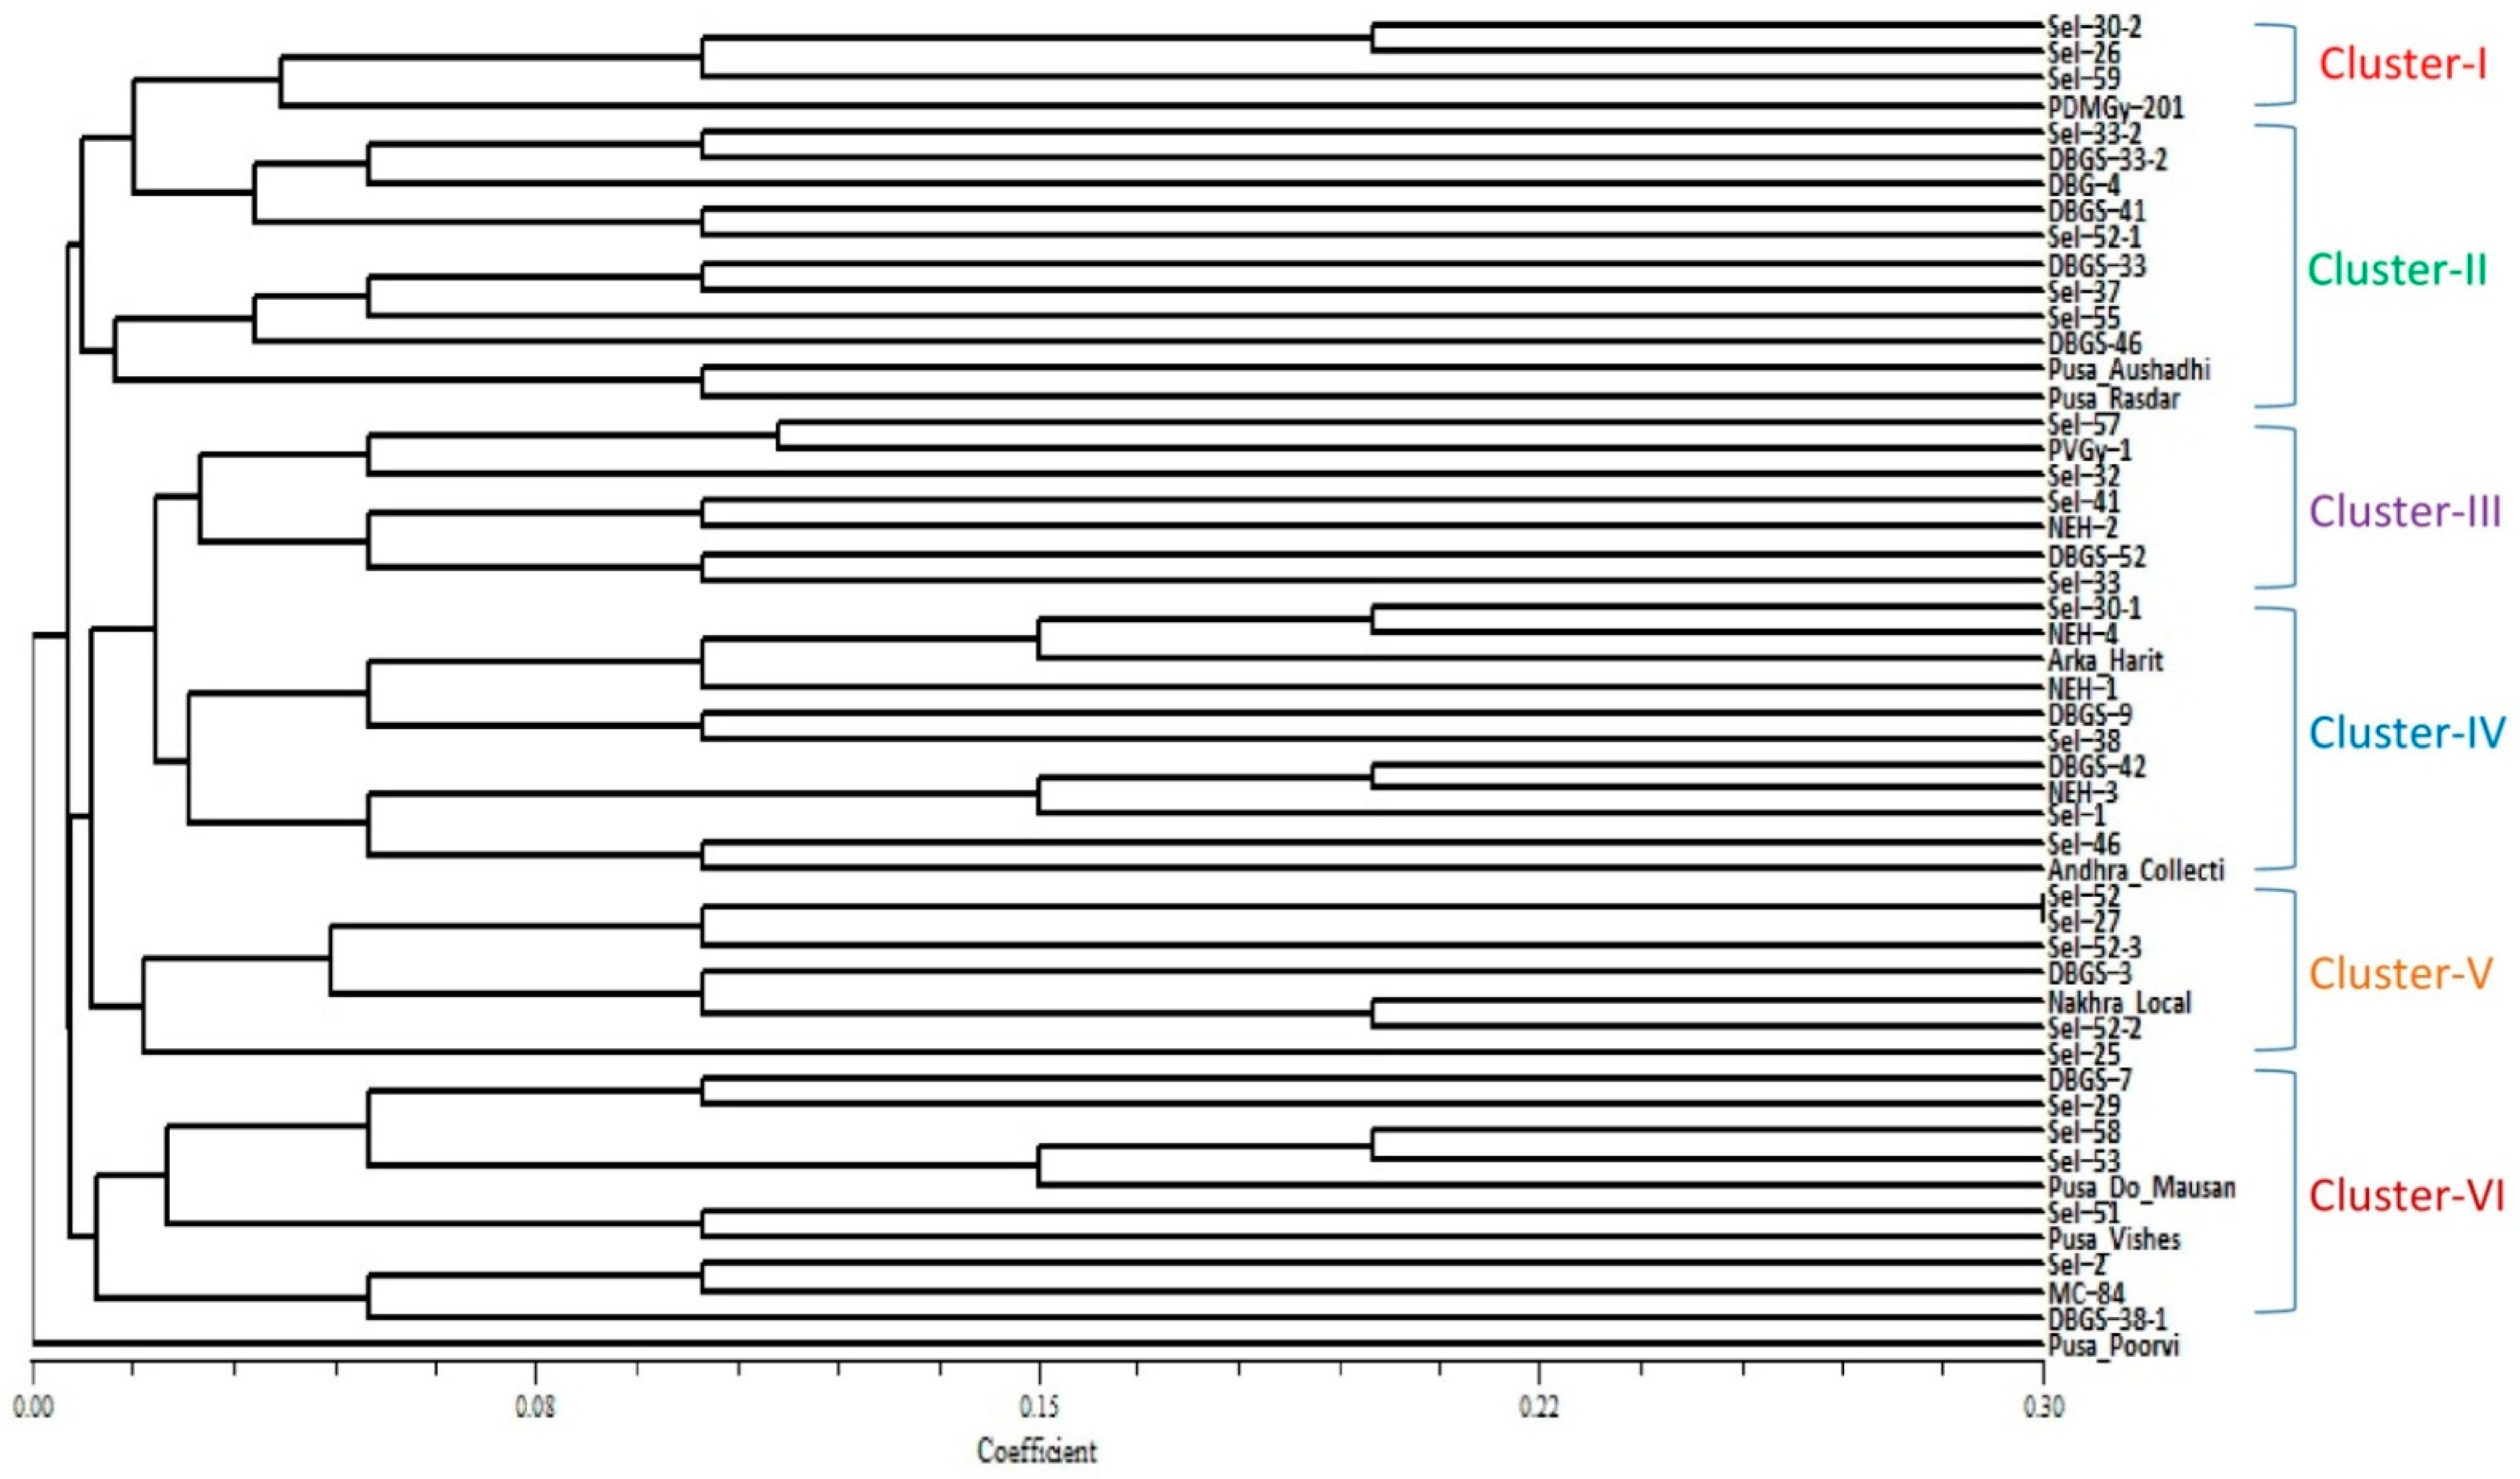
2.2. Clustering Based on Quantitative Traits
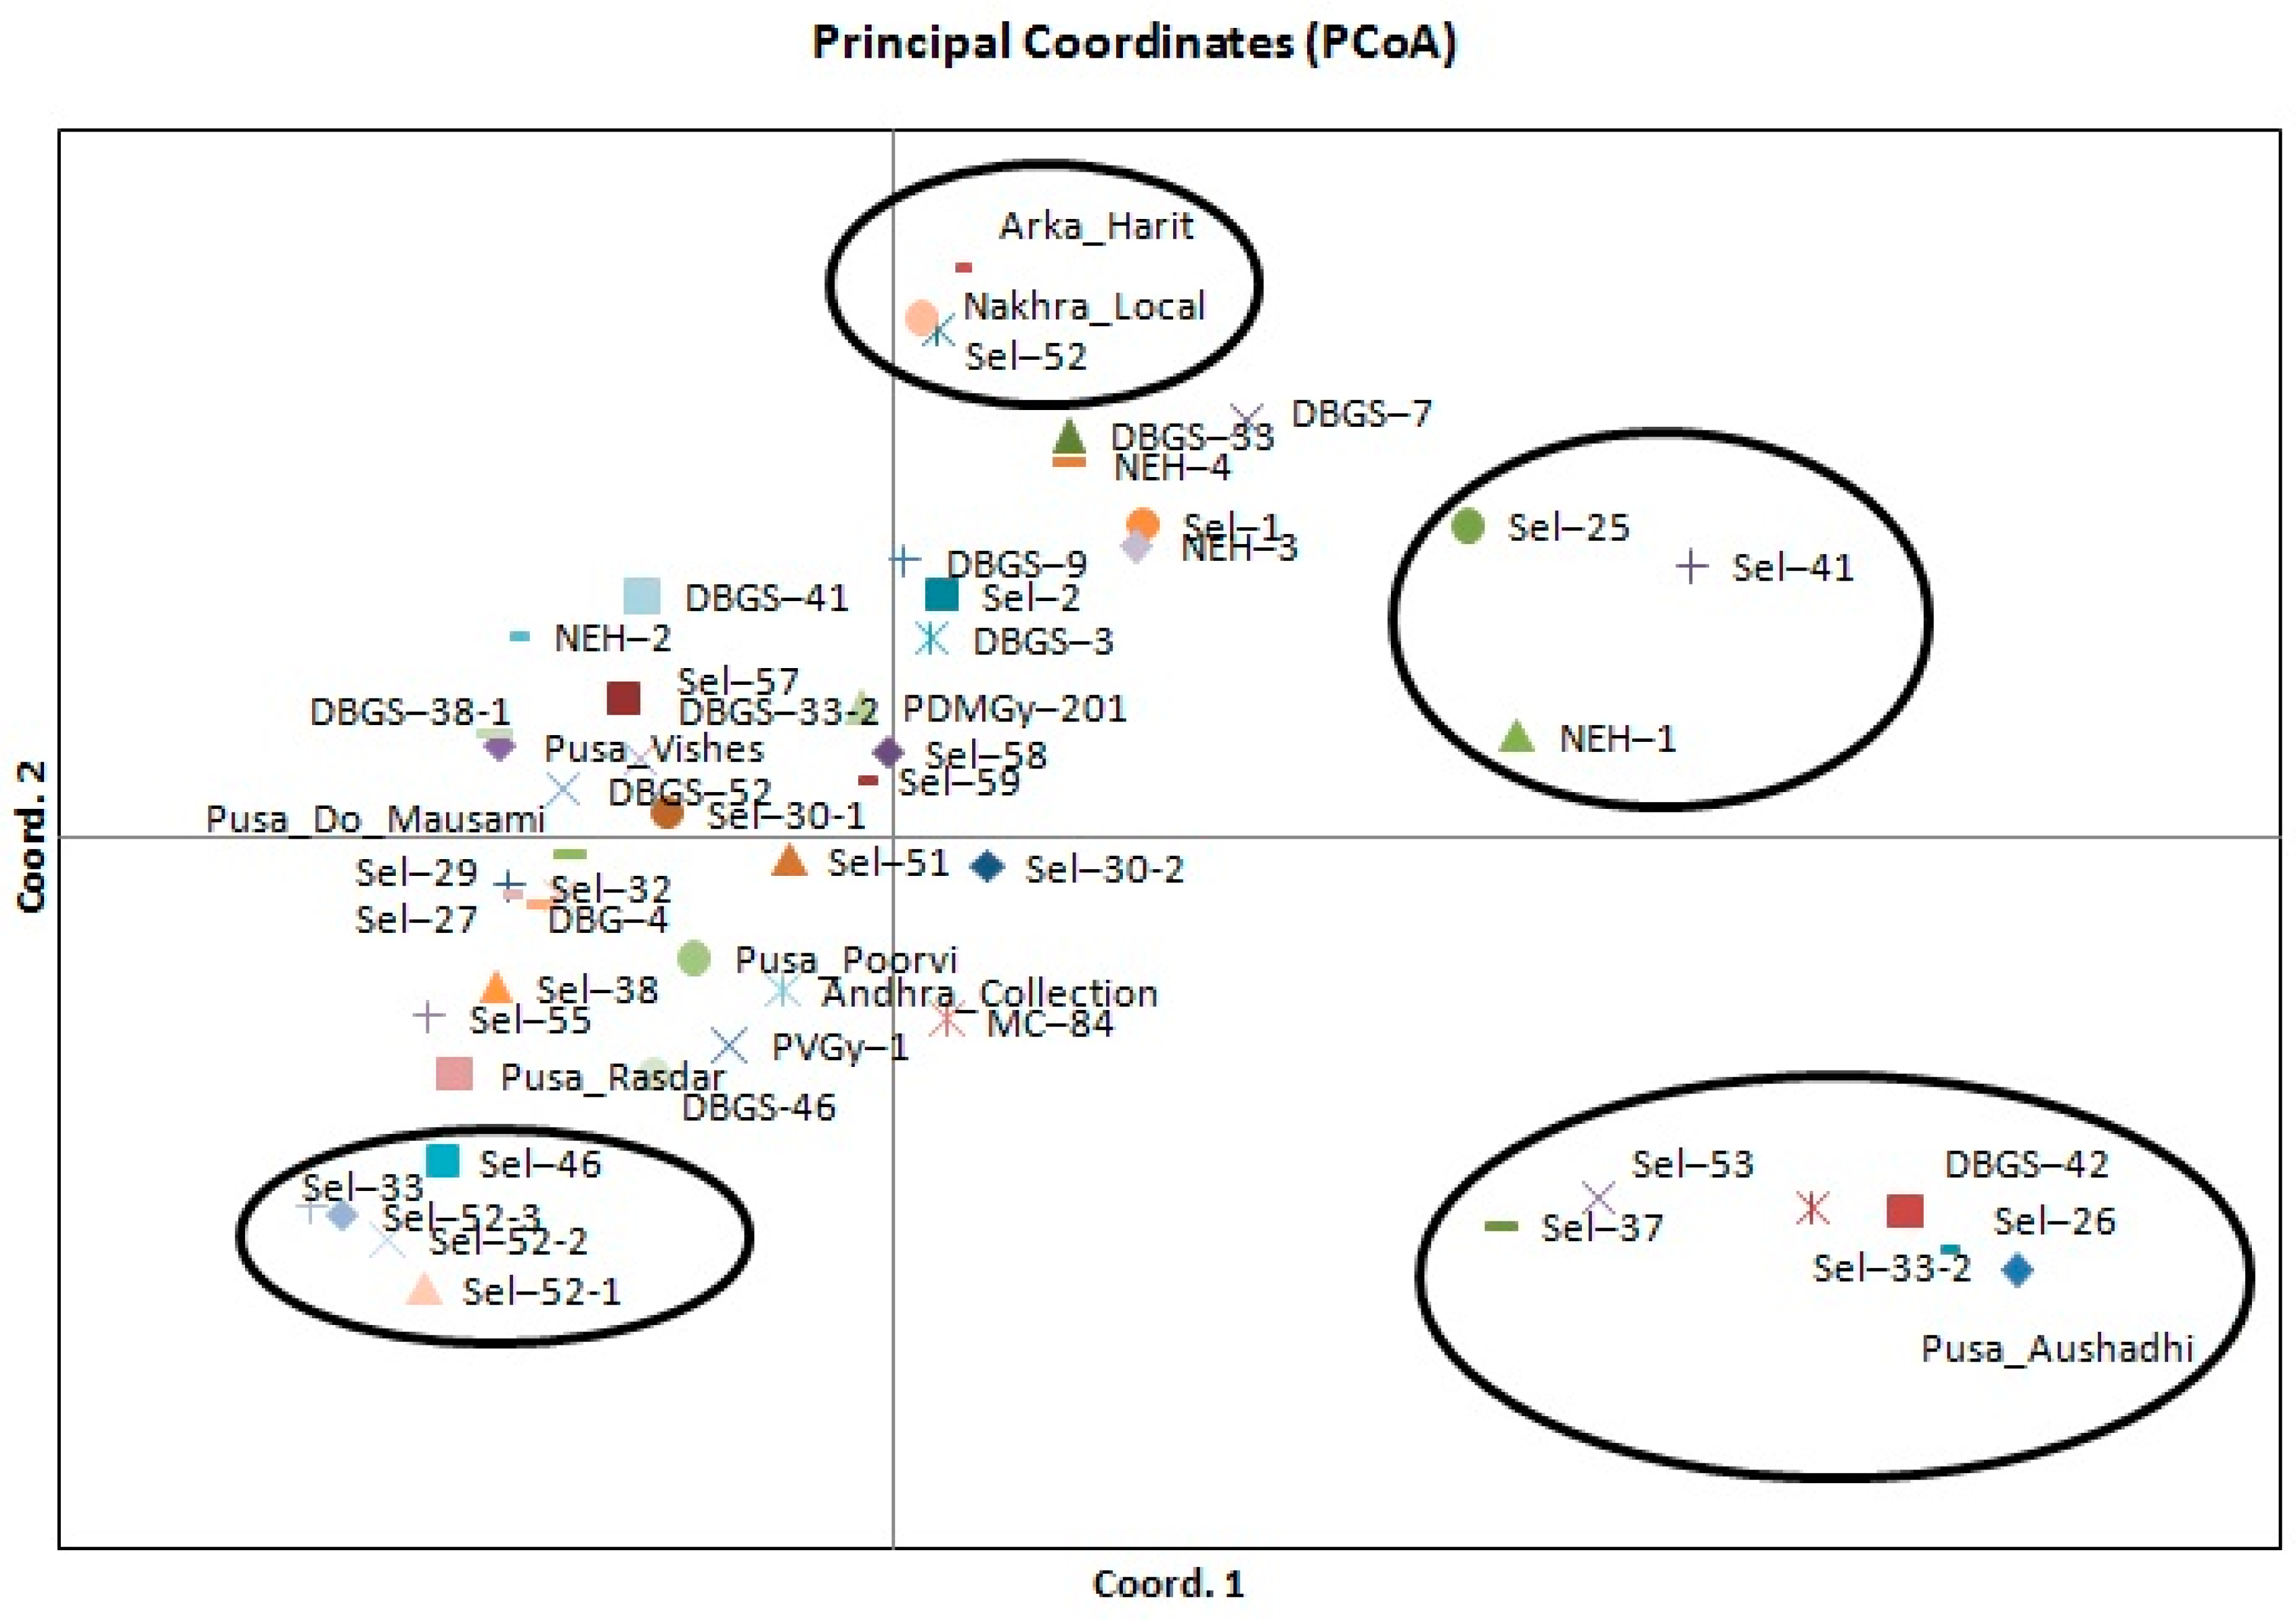
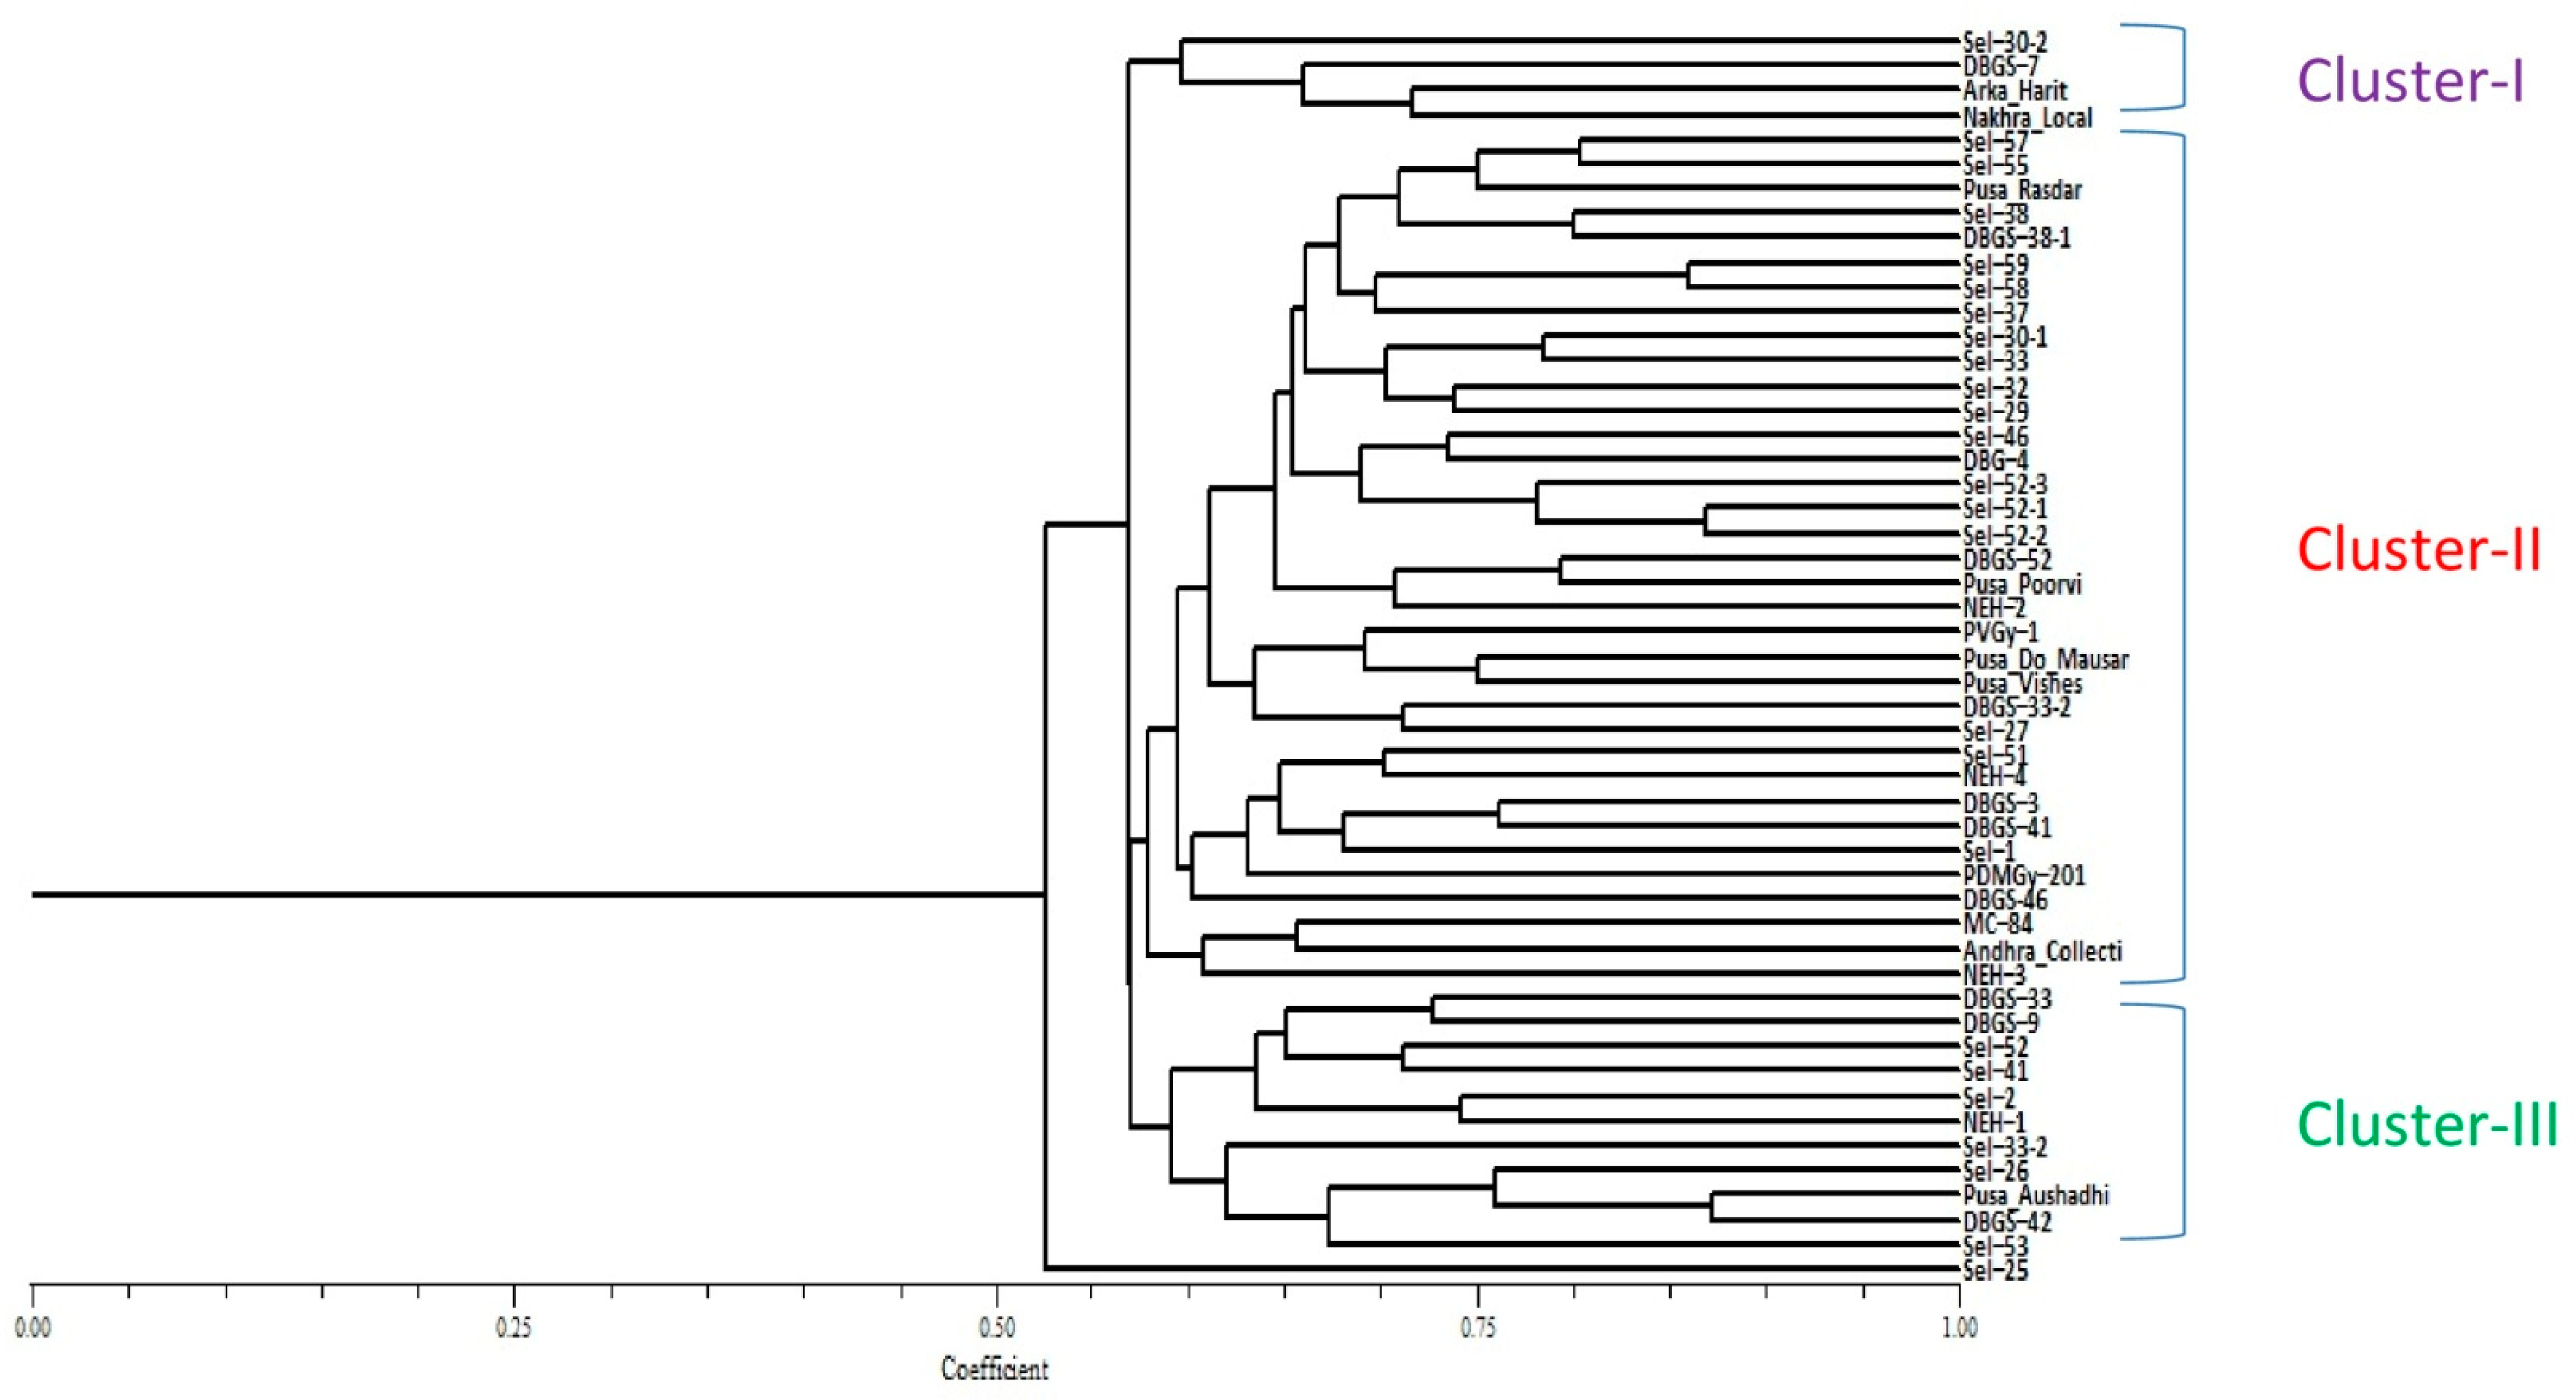
2.3. Genetic Diversity
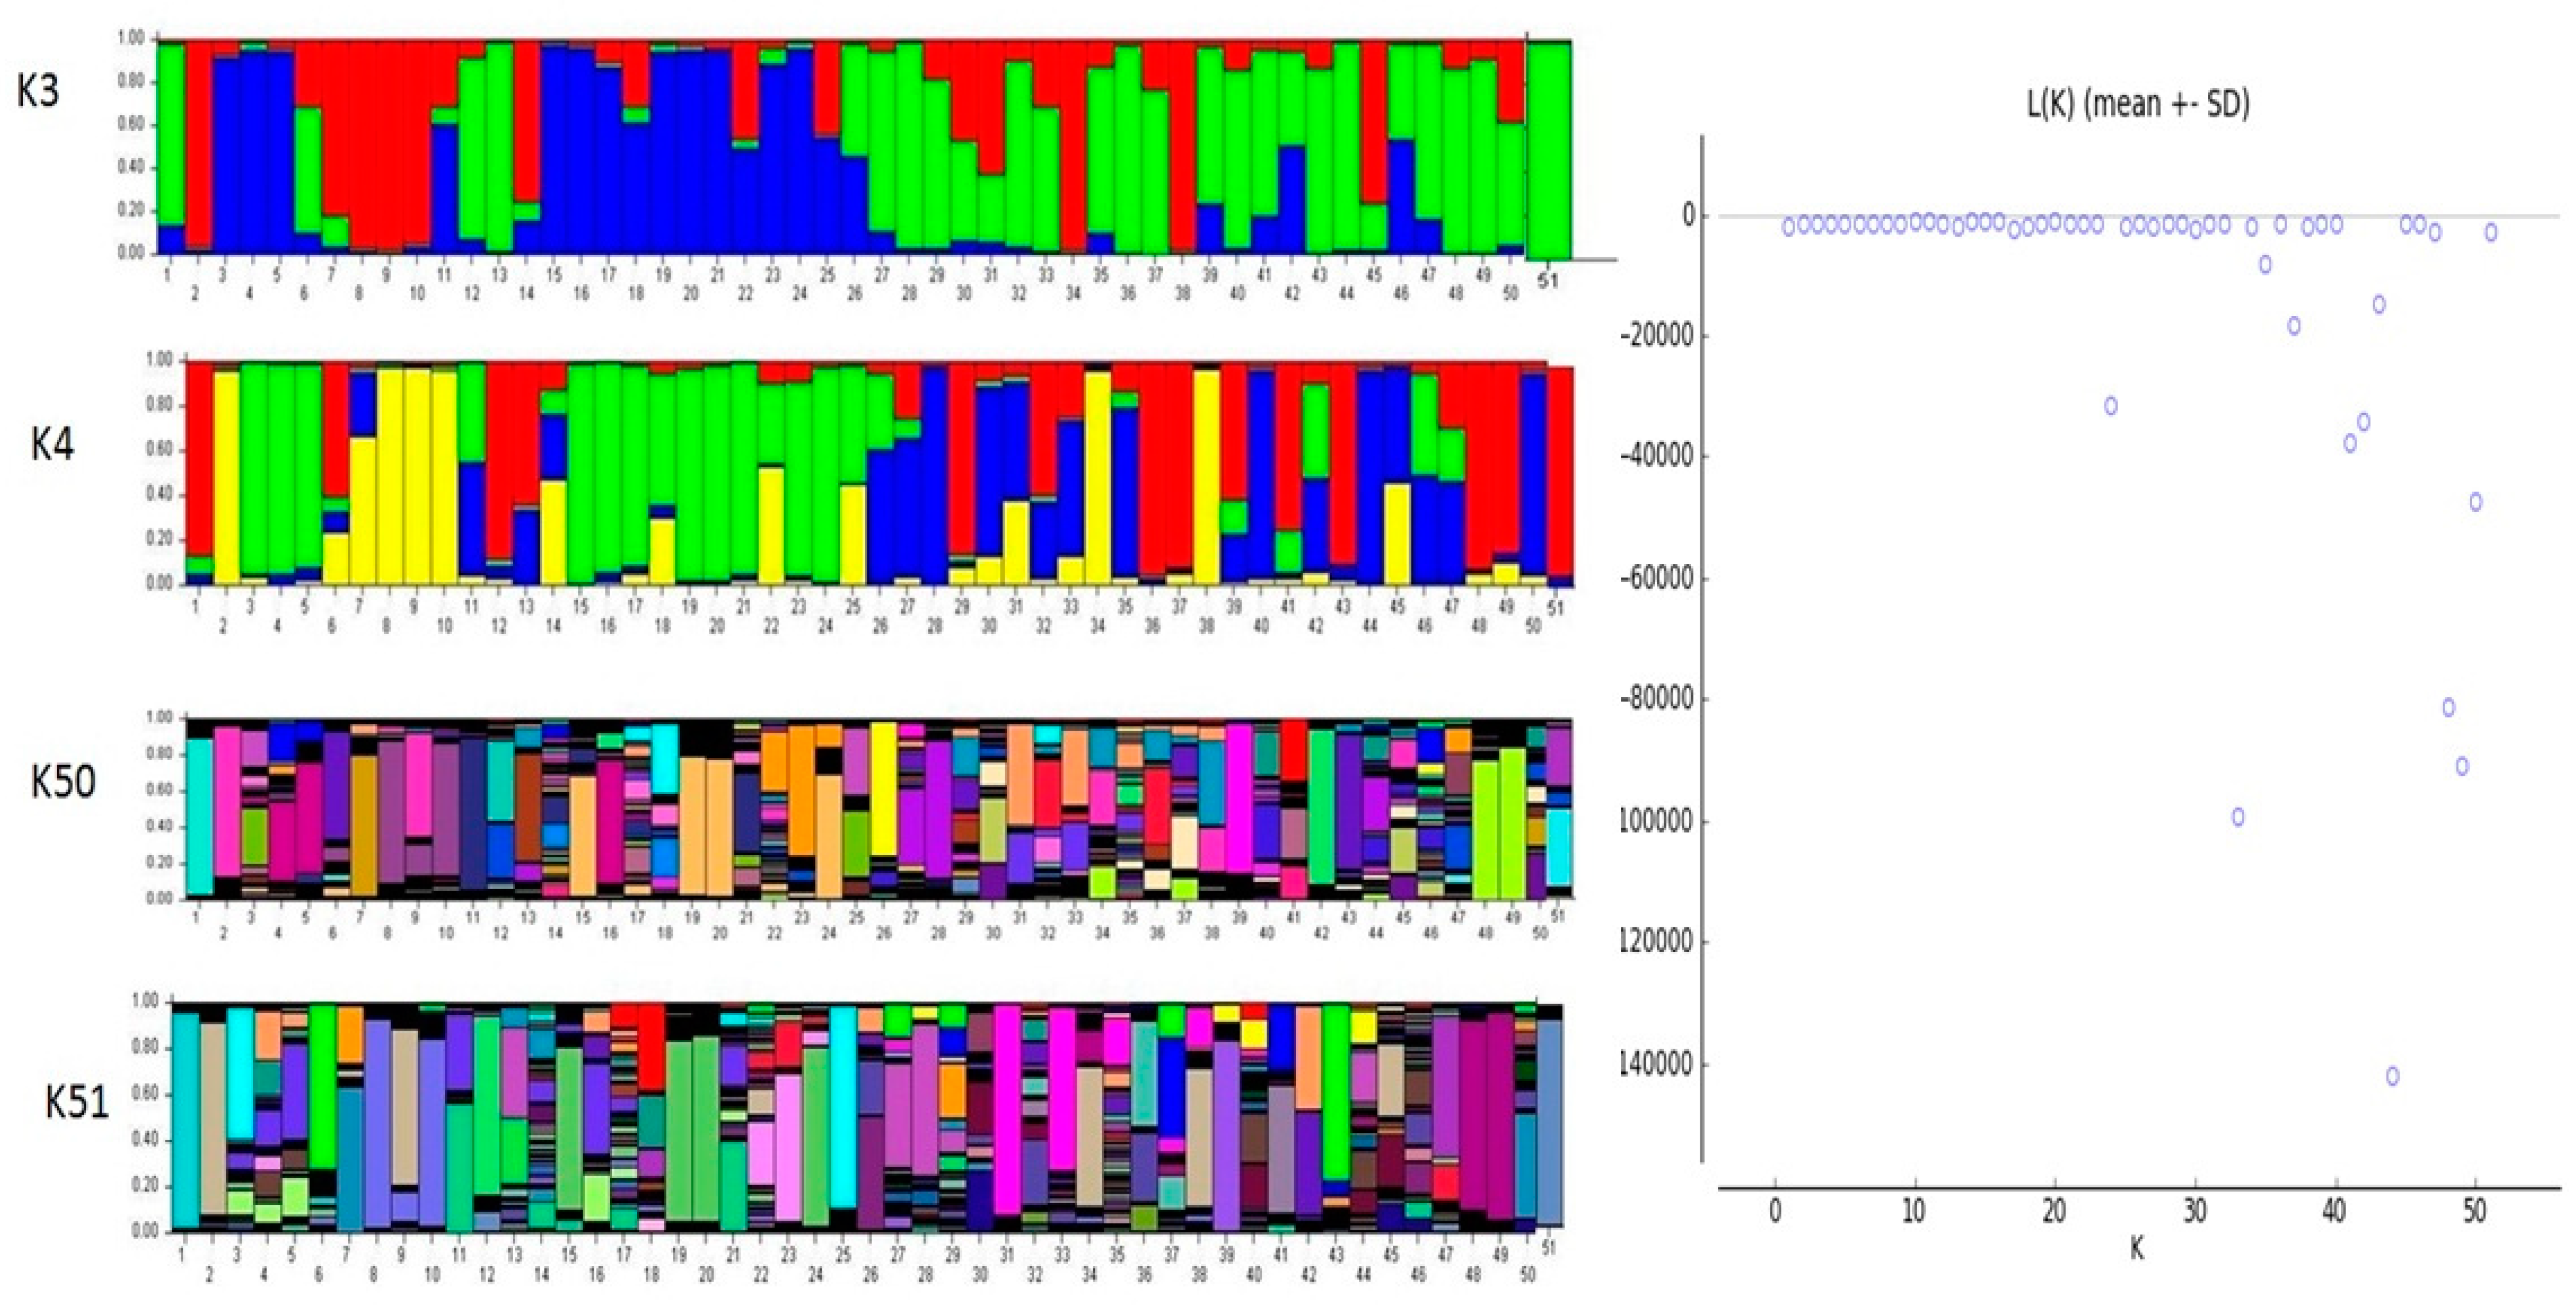
2.4. Genetic Structure Analysis
3. Discussion
4. Materials and Methods
4.1. Plant Material
4.2. Field Evaluation and Data Collection
4.3. DNA Extraction and Quantification
4.4. SSR Array and Genotyping
4.5. Allele Scoring
4.6. Data Analysis
4.7. Population Structure and Genetic Diversity Analysis
5. Conclusions
Author Contributions
Funding
Institutional Review Board Statement
Informed Consent Statement
Data Availability Statement
Acknowledgments
Conflicts of Interest
References
- Behera, T.K. Heterosis in bitter gourd. J. New Seeds 2004, 6, 217–222. [Google Scholar] [CrossRef]
- Alam, S.; Asad, M.; Asdaq, S.M.; Prasad, V.S. Antiulcer activity of methanolic extract of Momordica charantia L. in rats. J. Ethnopharmacol. 2009, 123, 464–469. [Google Scholar] [CrossRef] [PubMed]
- Baynes, J.W. Mechanistic Approach to Diabetes; Ellis Harwood Limited: Chichester, UK, 1995; pp. 203–231. [Google Scholar]
- Welihinda, J.; Karunanayake, E.M.; Sheriff, M.H.; Jayasinghe, K.S. Effect of Momordica charantia on the glucose tolerance in maturity onset diabetes. J. Ethnopharmacol 1986, 17, 277–282. [Google Scholar] [CrossRef]
- Raman, A.; Lau, C. Anti-diabetic properties and phytochemistry of Momordica charantia L. (Cucurbitaceae). Phytomedicine 1996, 2, 349–362. [Google Scholar] [CrossRef]
- Grubben, G.J.H. Tropical Vegetable and Their Genetic Resources; IBPGR: Rome, Italy, 1977; pp. 51–52. [Google Scholar]
- Rao, P.G.; Behera, T.K.; Gaikwad, A.; Munshi, A.D.; Jat, G.S.; Krishnan, B.G. Mapping and QTL analysis of gynoecy and earliness in bitter gourd (Momordica charantia L.) using genotyping-by-sequencing (GBS) technology. Front. Plant Sci. 2018, 9, 1555. [Google Scholar] [CrossRef] [Green Version]
- Behera, T.K.; Dey, S.S.; Sirohi, P.S. DBGy-201 DBGy-202: Two gynoecious lines of bitter gourd (Momordica charantia L.) isolated from an indigenous source. Indian J. Genet. Plant Breed. 2006, 66, 61–62. [Google Scholar]
- Robinson, R.W.; Decker-Walters, D.S. Cucurbits; CAB International: Wallingford, UK, 1997. [Google Scholar]
- Behera, T.K.; Staub, J.E.; Behera, S.; Simon, P.W. Bitter gourd and human health. Med. Arom. Plant Sci. Biotechnol. 2007, 1, 224–226. [Google Scholar]
- Rathod, V.; Behera, T.K.; Munshi, A.D.; Kumar, D.; Jat, G.S.; BoopalaKrishnan, G.; Sharma, N. Pollen viability and in vitro pollen germination studies in Momordica species and their intra and interspecific hybrids. Int. J. Chem. Stud. 2018, 6, 32–40. [Google Scholar]
- Alhariri, A.; Behera, T.K.; Munshi, A.D.; Jat, G.S. Gene action and combining ability analysis for horticultural traits in bitter gourd. Indian J. Hortic. 2020, 77, 484–490. [Google Scholar] [CrossRef]
- Pandey, P.; Ansari, W.A.; Kashyap, S.P.; Bhardwaj, D.R.; Tiwari, S.K.; Singh, B. Genetic diversity of Indian bitter gourd (Momordica charantia) by ISSR and morphological markers. Indian J. Agric. Sci. 2019, 89, 2037–2042. [Google Scholar]
- Rathod, V.; Behera, T.K.; Munshi, A.D.; Jat, G.S.; Vinod; Gaikwad, A.B. Genetic analysis for yield and its attributes in bitter gourd (Momordica charantia L.). Indian J. Agric. Sci. 2021, 91, 68–73. [Google Scholar]
- Rathod, V.; Behera, T.K.; Munshi, A.D.; Vinod; Jat, G.S. Crossability studies among Momordica charantia var. charantia and Momordica charantia var. muricata. Indian J. Agric. Sci. 2019, 89, 1900–1905. [Google Scholar]
- Thormann, C.E.; Camargo, M.E.A.; Osborn, T.C. Comparison of RFLP and RAPD markers to estimating genetic relationships within and among Cruciferous species. Theor. Appl. Genet. 1994, 80, 973–980. [Google Scholar] [CrossRef]
- Mondini, L.; Noorani, A.; Pagnotta, M.A. Assessing plant genetic diversity by molecular tools. Diversity 2009, 1, 19–35. [Google Scholar] [CrossRef] [Green Version]
- Dey, S.S.; Singh, A.K.; Chandel, D.; Behera, T.K. Genetic diversity of bitter gourd (Momordica charantia L.) genotypes revealed by RAPD markers and agronomic traits. Sci. Hortic. 2006, 109, 21–28. [Google Scholar] [CrossRef]
- Singh, A.K.; Behera, T.K.; Chandel, D.; Sharma, P.; Singh, N.K. Assessing genetic relationships among bitter gourd (Momordica charantia L.) accessions using inter-simple sequence repeat (ISSR) markers. J. Hort. Sci. Biotechnol. 2007, 82, 217–222. [Google Scholar] [CrossRef]
- Behera, T.K.; Gaikwad, A.B.; Singh, A.K.; Staub, J.E. Relative efficiency of DNA markers (RAPD, ISSR and AFLP) in detecting genetic diversity of bitter gourd (Momordica charantia L.). J. Sci. Food Agric. 2008, 88, 733–773. [Google Scholar] [CrossRef]
- Behera, T.K.; Gaikwad, A.B.; Saxena, S.; Bharadwaj, C.; Munshi, A.D. Morphological and molecular analyses define the genetic diversity of Asian bitter gourd (Momordica charantia L.). Aust. J. Crop Sci. 2012, 6, 261–267. [Google Scholar]
- Gaikwad, A.B.; Behera, T.K.; Singh, A.K.; Chandel, D.; Karihaloo, J.L.; Staub, J.E. AFLP analysis provides strategies for improvement of bitter gourd (Momordica charantia). HortScience 2008, 43, 127–133. [Google Scholar] [CrossRef] [Green Version]
- Guo, D.; Zhang, J.; Xue, Y.; Hou, X. Isolation and characterization of 10 SSR markers of Momordica charantia (Cucurbitaceae). Am. J. Bot. 2012, 99, e182–e183. [Google Scholar] [CrossRef] [PubMed]
- Saxena, S.; Singh, A.; Archak, S.; Behera, T.K.; John, J.K.; Meshram, S.U.; Gaikwad, A.B. Development of novel simple sequence repeat markers in Bitter Gourd (Momordica charantia L.) through enriched genomic libraries and their utilization in analysis of genetic diversity and cross-species transferability. Appl. Biochem. Biotechnol. 2014, 175, 93–118. [Google Scholar] [CrossRef]
- Cui, J.; Cheng, J.; Nong, D.; Peng, J.; Hu, Y.; He, W.; Zhou, Q.; Dhillon, N.P.S.; Hu, K. Genome-Wide Analysis of Simple Sequence Repeats in Bitter Gourd (Momordica charantia). Front. Plant Sci. 2017, 8, 1103. [Google Scholar] [CrossRef] [PubMed] [Green Version]
- Kumar, S.; Bhardwaj, A.; Kumar, R.; Singh, R.S.; Jain, K.; Singh, P.; Sunny; Sangam, S. Morphological and molecular diversity analysis in bitter gourd. Pharma Innov. 2020, 9, 94–100. [Google Scholar]
- Cui, J.; Yang, Y.; Luo, S.; Wang, L.; Huang, R.; Wen, Q.; Han, X.; Miao, N.; Cheng, J.; Liu, Z.; et al. Whole-genome sequencing provides insights into the genetic diversity and domestication of bitter gourd (Momordica spp.). Hortic. Res. 2020, 7, 85. [Google Scholar] [CrossRef]
- Akkaya, M.S.; Bhagwat, A.A.; Cregan, P.B. Length polymorphisms of simple sequence repeat DNA in soybean. Genetics 1992, 132, 1131–1139. [Google Scholar] [CrossRef] [PubMed]
- Morgante, M.; Olivieri, A.M. PCR-amplified microsatellites as markers in plant genetics. Plant J. 1993, 3, 175–182. [Google Scholar] [CrossRef]
- Peakall, R.; Gilmore, S.; Keys, W.; Morgante, M.; Rafalski, A. Cross-Species amplification of Soybean (Glycine max) simple sequence repeats (SSRs) within the genus and other legume genera: Implications for the transfer ability of SSRs in Plants. Mol. Bio. Evol. 1998, 15, 1275–1287. [Google Scholar] [CrossRef] [Green Version]
- Gupta, P.K.; Balyan, H.S.; Sharma, P.C.; Ramesh, B. Microsatellites in Plants: A New Class of Molecular Markers. Curr. Sci. 1996, 70, 45–54. [Google Scholar]
- Wang, S.-Z.; Pan, L.; Hu, K.; Chen, C.-Y.; Ding, Y. Development and characterization of polymorphic microsatellite markers in Momordica charantia (Cucurbitaceae). Am. J. Bot. 2010, 97, E75–E78. [Google Scholar] [CrossRef]
- Ji, Y.; Luo, Y.; Hou, B.; Wang, W.; Zhao, J.; Yang, L.; Xue, Q.; Ding, X. Development of polymorphic microsatellite loci in Momordica charantia (Cucurbitaceae) and their transferability to other cucurbit species. Sci. Hortic. 2012, 140, 115–118. [Google Scholar] [CrossRef]
- Xu, P.; Wu, X.; Luo, J.; Wang, B.; Liu, Y.; Ehlers, J.D.; Wang, S.; Lu, Z.; Li, G. Partial sequencing of the bottle gourd genome reveals markers useful for phylogenetic analysis and breeding. BMC Genom. 2011, 12, 467. [Google Scholar] [CrossRef] [Green Version]
- Ram, D.; Kumar, S.; Banerjee, M.K.; Kalloo, G. Occurrence, identification and preliminary characterisation of gynoecism in bitter gourd. Indian J. Agric. Sci. 2002, 72, 348–349. [Google Scholar]
- Zhu, L.; Zhu, H.; Li, Y.; Wang, Y.; Wu, X.; Li, J.; Zhang, Z.; Wang, Y.; Hu, J.; Yang, S.; et al. Genome Wide Characterization, Comparative and Genetic Diversity Analysis of Simple Sequence Repeats in Cucurbita Species. Horticulturae 2021, 7, 143. [Google Scholar] [CrossRef]
- Panse, V.G.; Sukhatme, P.V. Statistical Methods for Agricultural Workers; Indian Council of Agricultural Research: New Delhi, India, 1967; 381p. [Google Scholar]
- Mahalanobis, P.C. On the generalised distance in statistics. Proc. Natl. Inst. Sci. India 1936, 2, 49–55. [Google Scholar]
- Liu, K.; Muse, S.V. Power Marker: An integrated analysis environment for genetic marker analysis. Bioinformatics 2005, 21, 21–28. [Google Scholar] [CrossRef] [Green Version]
- Botstein, D.; White, R.L.; Skolnick, M.; Davis, R.W. Construction of a genetic linkage map in man using restriction fragment length polymorphisms. Am. J. Hum. Genet. 1980, 32, 314–331. [Google Scholar]
- Pritchard, J.K.; Stephens, M.; Donnelly, P. Inference of population structure using multilocus genotype data. Genetics 2000, 155, 945–959. [Google Scholar] [CrossRef] [PubMed]
- Tamura, K.; Stecher, G.; Peterson, D.; Filipski, A.; Kumar, S. MEGA6: Molecular evolutionary genetics analysis version 6.0. Mol. Biol. Evol. 2013, 30, 2725–2729. [Google Scholar] [CrossRef] [PubMed] [Green Version]
- Saitou, N.; Nei, M. The neighbor-joining method: A new method for reconstructing phylogenetic trees. Mol. Biol. Evol. 1987, 4, 406–425. [Google Scholar] [PubMed]
- Nei, M. Genetic distance between populations. Am. Nat. 1972, 106, 283–292. [Google Scholar] [CrossRef]
- Nei, M. Analysis of gene diversity in subdivided populations. Proc. Natl. Acad. Sci. USA 1973, 70, 3321–3323. [Google Scholar] [CrossRef] [PubMed] [Green Version]
- Peakall, R.; Smouse, P.E. Gen AlEx 6.5: Genetic analysis in excel. Population genetic software for teaching and research: An update. Bioinformatics 2012, 28, 2537–2539. [Google Scholar] [CrossRef] [PubMed] [Green Version]
- Dhillon, N.P.S.; Sanguansil, S.; Schafleitner, R.; Wang, Y.W.; McCreight, J.D. Diversity Among a Wide Asian Collection of Bitter Gourd Landraces and their Genetic Relationships with Commercial Hybrid Cultivars. J. Am. Soc. Hortic. Sci. 2016, 141, 475–484. [Google Scholar] [CrossRef] [Green Version]


| Succ. No. | Accession Name | DFFFA | NNFFF | DFFH | NFF/P | NMF/P | NF/P | FL (cm) | FD (cm) | AFW (g) | Y/P (g) |
|---|---|---|---|---|---|---|---|---|---|---|---|
| 1. | Sel-30-2 | 54.67 ± 0.6 | 21.00 ± 1.0 | 64.33 ± 3.0 | 29.33 ± 2.0 | 106.33 ± 5.5 | 23.33 ± 2.5 | 8.23 ± 1.0 | 3.63 ± 0.8 | 38.67 ± 6.5 | 891.3 ± 56.7 |
| 2. | Sel-57 | 50.67 ± 0.6 | 13.67 ± 1.5 | 63.67 ± 1.1 | 33.00 ± 2.7 | 123.33 ± 11.4 | 27.00 ± 1.0 | 16.23 ± 0.6 | 4.89 ± 0.4 | 62.00 ± 2.0 | 1736.0 ± 101.7 |
| 3. | DBGS-33 | 48.67 ± 1.2 | 23.00 ± 5.6 | 59.33 ± 4.5 | 25.00 ± 3.6 | 97.67 ± 10.5 | 23.67 ± 4.5 | 10.67 ± 0.4 | 4.14 ± 1.0 | 39.00 ± 1.7 | 923.3 ± 178.9 |
| 4. | DBGS-7 | 59.00 ± 1.0 | 18.33 ± 3.8 | 72.00 ± 3.0 | 23.33 ± 6.5 | 88.33 ± 17.9 | 17.67 ± 5.5 | 8.13 ± 1.0 | 4.88 ± 1.5 | 44.67 ± 4.5 | 772.7 ± 169.1 |
| 5. | Sel-52 | 51.00 ± 2.0 | 18.67 ± 0.6 | 63.00 ± 4.7 | 21.00 ± 4.4 | 81.33 ± 10.7 | 15.33 ± 3.5 | 12.40 ± 0.8 | 4.88 ± 3.0 | 47.00 ± 4.6 | 710.0 ± 93.4 |
| 6. | Sel-30-1 | 55.33 ± 1.5 | 19.33 ± 1.5 | 66.33 ± 2.5 | 25.33 ± 3.2 | 92.33 ± 16.0 | 20.67 ± 3.0 | 9.87 ± 0.3 | 3.78 ± 0.2 | 33.33 ± 4.2 | 684.0 ± 84.0 |
| 7. | Sel-32 | 47.33 ± 2.0 | 13.67 ± 1.5 | 58.00 ± 2.0 | 27.67 ± 2.0 | 95.33 ± 5.0 | 20.67 ± 3.0 | 13.32 ± 0.7 | 4.78 ± 1.0 | 70.46 ± 6.1 | 1696.0 ± 143.6 |
| 8. | Sel-59 | 53.33 ± 1.5 | 15.33 ± 1.1 | 71.33 ± 1.5 | 30.67 ± 1.1 | 117.67 ± 6.5 | 23.33 ± 1.1 | 18.00 ± 1.0 | 4.93 ± 1.3 | 71.33 ± 1.5 | 1663.3 ± 51.0 |
| 9. | Sel-37 | 48.67 ± 2.5 | 13.67 ± 1.5 | 60.00 ± 2.0 | 25.67 ± 1.5 | 88.00 ± 7.5 | 19.33 ± 0.6 | 18.33 ± 0.6 | 5.15 ± 0.8 | 71.67 ± 5.5 | 1385.7 ± 114.6 |
| 10. | Sel-58 | 45.67 ± 3.2 | 15.67 ± 3.5 | 57.00 ± 4.7 | 23.33 ± 5.1 | 94.00 ± 10.8 | 18.33 ± 4.7 | 13.57 ± 0.9 | 5.41 ± 1.0 | 52.00 ± 3.0 | 947.3 ± 173.8 |
| 11. | Sel-2 | 53.00 ± 1.7 | 17.00 ± 2.7 | 64.67 ± 2.5 | 31.33 ± 2.3 | 108.33 ± 8.5 | 26.67 ± 2.0 | 22.23 ± 1.0 | 3.75 ± 0.7 | 55.36 ± 3.5 | 1474.9 ± 122.8 |
| 12. | Sel-51 | 53.67 ± 1.2 | 18.00 ± 1.0 | 63.33 ± 2.0 | 34.00 ± 4.6 | 122.67 ± 14.5 | 28.33 ± 1.5 | 18.83 ± 0.8 | 5.46 ± 0.8 | 69.67 ± 3.5 | 1976.0 ± 186.5 |
| 13. | PVGy-1 | 37.33 ± 2.0 | 4.83 ± 0.8 | 47.67 ± 2.0 | 42.67 ± 5.7 | 0.00 ± 0.0 | 27.00 ± 1.0 | 10.64 ± 0.4 | 4.73 ± 0.8 | 52.05 ± 1.8 | 1406.3 ± 93.4 |
| 14. | Sel-33-2 | 50.00 ± 4.6 | 17.00 ± 2.7 | 61.33 ± 7.0 | 28.67 ± 3.5 | 106.33 ± 12.6 | 21.67 ± 3.0 | 7.77 ± 0.6 | 2.96 ± 0.6 | 45.00 ± 4.0 | 983.0 ± 225.4 |
| 15. | Sel-25 | 47.67 ± 3.2 | 17.33 ± 1.5 | 61.00 ± 3.0 | 41.33 ± 1.5 | 128.67 ± 21.2 | 36.67 ± 2.0 | 6.57 ± 0.3 | 3.46 ± 0.6 | 29.67 ± 2.0 | 1090.7 ± 140.0 |
| 16. | Sel-41 | 50.00 ± 1.7 | 20.00 ± 2.7 | 62.33 ± 4.5 | 27.00 ± 3.6 | 109.00 ± 8.9 | 19.00 ± 2.7 | 12.27 ± 1.0 | 4.49 ± 1.4 | 36.67 ± 2.5 | 697.0 ± 114.5 |
| 17. | Sel-26 | 52.00 ± 2.0 | 20.33 ± 3.5 | 64.33 ± 1.1 | 31.67 ± 3.8 | 117.00 ± 21.4 | 23.33 ± 2.0 | 12.53 ± 0.7 | 3.25 ± 0.2 | 45.33 ± 3.5 | 1054.0 ± 62.4 |
| 18. | NEH-4 | 52.33 ± 1.1 | 18.00 ± 1.0 | 65.33 ± 1.1 | 25.33 ± 0.6 | 101.67 ± 3.2 | 20.67 ± 2.5 | 12.63 ± 0.6 | 3.45 ± 0.4 | 45.33 ± 3.5 | 942.7 ± 185.5 |
| 19. | Pusa Aushadhi | 42.33 ± 1.2 | 10.67 ± 2.5 | 53.67 ± 1.5 | 33.67 ± 4.0 | 14.67 ± 3.5 | 21.67 ± 2.0 | 19.57 ± 2.8 | 4.67 ± 2.3 | 77.67 ± 2.5 | 1684.0 ± 186.0 |
| 20. | DBGS-42 | 52.33 ± 1.2 | 20.00 ± 3.5 | 64.33 ± 2.5 | 29.00 ± 4.4 | 104.00 ± 7.2 | 25.33 ± 4.0 | 10.30 ± 1.0 | 3.70 ± 1.1 | 42.67 ± 3.2 | 1089.4 ± 247.6 |
| 21. | NEH-1 | 51.33 ± 2.5 | 19.00 ± 2.6 | 62.33 ± 2.5 | 25.33 ± 1.1 | 109.33 ± 10.0 | 20.00 ± 3.6 | 10.60 ± 1.2 | 3.76 ± 1.4 | 43.67 ± 4.7 | 868.3 ± 134.4 |
| 22. | Sel-53 | 44.00 ± 1.0 | 22.33 ± 4.0 | 57.33 ± 2.0 | 23.33 ± 4.9 | 91.00 ± 15.6 | 18.33 ± 2.1 | 10.45 ± 0.8 | 4.94 ± 1.0 | 47.67 ± 2.5 | 871.7 ± 81.3 |
| 23. | DBGS-3 | 58.00 ± 3.0 | 26.00 ± 4.4 | 69.33 ± 4.0 | 19.67 ± 4.5 | 75.33 ± 8.0 | 12.00 ± 2.0 | 17.20 ± 3.2 | 4.89 ± 0.5 | 43.00 ± 2.7 | 513.3 ± 64.3 |
| 24. | Sel-1 | 52.33 ± 1.2 | 16.67 ± 1.1 | 63.67 ± 1.5 | 36.67 ± 1.2 | 131.00 ± 12.5 | 30.00 ± 2.0 | 10.96 ± 0.3 | 4.30 ± 0.8 | 52.36 ± 3.2 | 1567.6 ± 73.3 |
| 25. | DBGS-9 | 49.67 ± 0.6 | 21.67 ± 2.5 | 59.33 ± 1.5 | 24.67 ± 2.0 | 100.33 ± 5.5 | 20.00 ± 3.6 | 13.53 ± 0.8 | 5.25 ± 1.3 | 46.00 ± 3.6 | 912.7 ± 105.7 |
| 26. | Arka Harit | 49.67 ± 2.0 | 18.00 ± 1.0 | 61.33 ± 1.5 | 25.33 ± 3.0 | 94.00 ± 12.8 | 19.67 ± 5.7 | 14.33 ± 0.6 | 3.35 ± 0.5 | 41.20 ± 1.0 | 813.6 ± 251.9 |
| 27. | Pusa Do Mausami | 47.33 ± 1.5 | 15.67 ± 1.5 | 60.33 ± 1.5 | 29.00 ± 2.7 | 101.00 ± 3.6 | 18.33 ± 3.0 | 15.50 ± 1.3 | 4.98 ± 1.5 | 77.10 ± 5.8 | 1403.6 ± 163.6 |
| 28. | Pusa Vishes | 50.00 ± 1.0 | 15.67 ± 0.6 | 63.33 ± 1.2 | 23.00 ± 5.6 | 91.33 ± 20.4 | 15.67 ± 5.9 | 13.33 ± 0.6 | 5.13 ± 0.4 | 77.25 ± 7.0 | 1183.5 ± 368.0 |
| 29. | Sel-46 | 54.00 ± 1.7 | 20.00 ± 1.7 | 67.00 ± 2.0 | 21.33 ± 2.3 | 84.33 ± 7.6 | 17.67 ± 1.5 | 13.06 ± 1.5 | 5.18 ± 1.0 | 55.33 ± 3.5 | 974.0 ± 26.0 |
| 30. | Sel-38 | 49.67 ± 2.1 | 16.67 ± 1.5 | 62.33 ± 1.5 | 40.33 ± 3.0 | 139.33 ± 12.0 | 33.33 ± 4.2 | 12.20 ± 0.9 | 3.60 ± 0.6 | 40.00 ± 1.0 | 1335.3 ± 194.3 |
| 31. | DBGS-52 | 50.67 ± 2.0 | 20.67 ± 3.0 | 61.67 ± 2.5 | 20.67 ± 1.5 | 88.67 ± 9.3 | 15.00 ± 2.6 | 7.53 ± 1.3 | 3.21 ± 1.1 | 54.33 ± 4.7 | 810.7 ± 130.0 |
| 32. | MC-84 | 43.33 ± 0.6 | 18.67 ± 2.5 | 52.00 ± 1.0 | 27.33 ± 2.9 | 108.33 ± 8.5 | 23.67 ± 1.5 | 14.67 ± 0.6 | 3.76 ± 0.3 | 52.20 ± 1.0 | 1234.9 ± 73.6 |
| 33. | Pusa Poorvi | 45.33 ± 1.5 | 23.58 ± 2.7 | 60.75 ± 7.2 | 49.00 ± 1.0 | 192.00 ± 21.6 | 42.62 ± 2.7 | 5.00 ± 0.4 | 1.05 ± 0.3 | 20.71 ± 1.5 | 884.5 ± 105.6 |
| 34. | Sel-55 | 42.33 ± 1.6 | 16.00 ± 1.0 | 58.67 ± 0.6 | 20.33 ± 3.5 | 66.67 ± 7.8 | 15.00 ± 2.0 | 9.90 ± 0.4 | 5.15 ± 0.4 | 45.00 ± 3.6 | 673.7 ± 88.7 |
| 35. | NEH-2 | 50.67 ± 2.0 | 19.67 ± 2.0 | 62.00 ± 2.0 | 24.67 ± 1.5 | 94.33 ± 10.6 | 19.00 ± 2.0 | 11.53 ± 0.9 | 4.33 ± 1.3 | 47.67 ± 2.5 | 902.3 ± 48.2 |
| 36. | DBGS-4 | 60.67 ± 3.8 | 22.67 ± 3.5 | 69.00 ± 5.0 | 26.33 ± 2.0 | 116.00 ± 13.2 | 21.33 ± 3.8 | 11.13 ± 1.3 | 4.34 ± 0.4 | 42.33 ± 4.2 | 909.3 ± 218.8 |
| 37. | S-52-3 | 55.33 ± 3.5 | 19.67 ± 1.5 | 67.67 ± 3.0 | 20.67 ± 2.9 | 95.00 ± 12.4 | 15.33 ± 3.2 | 8.70 ± 0.7 | 5.54 ± 0.9 | 37.33 ± 1.5 | 571.3 ± 114.0 |
| 38. | Pusa Rasdar | 41.33 ± 1.5 | 10.67 ± 0.6 | 54.27 ± 2.9 | 24.33 ± 1.5 | 74.00 ± 7.8 | 19.36 ± 0.8 | 9.43 ± 0.9 | 6.38 ± 0.8 | 65.39 ± 2.6 | 1267.0 ± 86.3 |
| 39. | PDMGy-201 | 38.00 ± 2.7 | 5.67 ± 1.1 | 47.33 ± 4.7 | 42.00 ± 4.4 | 0.00 ± 0.0 | 30.00 ± 3.6 | 10.31 ± 0.3 | 5.06 ± 0.6 | 45.33 ± 4.7 | 1359.7 ± 223.0 |
| 40. | DBGS-33-2 | 51.00 ± 4.6 | 23.33 ± 3.0 | 61.33 ± 2.5 | 22.33 ± 5.9 | 92.67 ± 21.8 | 18.00 ± 5.2 | 10.63 ± 0.7 | 4.34 ± 0.3 | 40.67 ± 3.0 | 722.6 ± 164.4 |
| 41. | Andhra Collection | 54.00 ± 3.0 | 16.67 ± 2.0 | 65.00 ± 1.0 | 31.00 ± 1.7 | 123.67 ± 19.8 | 24.67 ± 1.5 | 14.87 ± 0.8 | 3.76 ± 0.8 | 58.57 ± 4.8 | 1449.5 ± 204.7 |
| 42. | Nakhra Local | 51.00 ± 1.7 | 17.33 ± 3.0 | 63.00 ± 2.0 | 19.67 ± 1.5 | 80.33 ± 5.1 | 14.00 ± 2.6 | 12.33 ± 1.5 | 5.75 ± 0.9 | 41.00 ± 4.4 | 579.8 ± 159.0 |
| 43. | Sel-33 | 50.67 ± 2.3 | 19.00 ± 2.0 | 59.33 ± 4.5 | 22.67 ± 2.0 | 90.00 ± 9.5 | 17.33 ± 2.0 | 10.47 ± 0.8 | 5.09 ± 1.0 | 40.00 ± 3.0 | 697.3 ± 132.5 |
| 44. | Sel-27 | 51.00 ± 1.7 | 16.67 ± 2.0 | 62.00 ± 1.0 | 21.00 ± 4.4 | 75.33 ± 19.7 | 15.33 ± 3.2 | 10.53 ± 0.8 | 3.91 ± 0.6 | 44.00 ± 5.0 | 664.7 ± 66.9 |
| 45. | DBGS-38-1 | 52.00 ± 4.3 | 18.67 ± 2.5 | 60.33 ± 3.2 | 53.33 ± 5.5 | 196.00 ± 28.0 | 46.67 ± 7.5 | 6.30 ± 0.6 | 3.65 ± 0.3 | 31.67 ± 4.0 | 1457.7 ± 54.0 |
| 46. | NEH-3 | 52.33 ± 2.0 | 16.67 ± 2.3 | 63.00 ± 2.7 | 24.00 ± 2.0 | 89.00 ± 7.9 | 19.00 ± 2.0 | 12.17 ± 0.8 | 4.77 ± 0.4 | 42.67 ± 23. | 810.7 ± 98.3 |
| 47. | DBGS-41 | 54.67 ± 3.0 | 23.00 ± 3.6 | 66.67 ± 2.5 | 29.00 ± 3.0 | 117.00 ± 14.0 | 22.00 ± 5.2 | 9.90 ± 0.5 | 4.81 ± 0.2 | 40.67 ± 4.6 | 878.7 ± 129.2 |
| 48. | Sel-52-1 | 57.00 ± 6.2 | 14.67 ± 2.5 | 68.67 ± 3.5 | 19.33 ± 3.2 | 86.00 ± 9.6 | 13.67 ± 1.5 | 9.87 ± 1.3 | 5.04 ± 1.5 | 40.67 ± 1.5 | 554.3 ± 43.9 |
| 49. | Sel-52-2 | 53.33 ± 6.7 | 14.33 ± 1.5 | 66.67 ± 4.7 | 19.67 ± 1.2 | 90.00 ± 9.5 | 12.67 ± 1.5 | 10.34 ± 0.8 | 4.76 ± 0.6 | 41.00 ± 3.6 | 515.7 ± 18.9 |
| 50. | Sel-29 | 47.00 ± 4.6 | 23.00 ± 2.0 | 60.33 ± 4.2 | 22.33 ± 2.5 | 92.33 ± 6.0 | 16.00 ± 2.0 | 8.13 ± 1.1 | 4.23 ± 0.8 | 41.67 ± 2.0 | 664.0 ± 52.4 |
| 51. | DBGS-46 | 48.33 ± 4.0 | 26.33 ± 2.5 | 60.67 ± 3.8 | 32.00 ± 5.2 | 121.67 ± 17.2 | 26.33 ± 2.5 | 9.53 ± 0.6 | 4.14 ± 1.0 | 33.67 ± 3.2 | 882.0 ± 49.1 |
| Mean | 50.22 | 17.92 | 61.95 | 28.03 | 98.09 | 21.80 | 11.90 | 4.60 | 48.23 | 1028.06 | |
| CD at 5% | 4.87 | 4.46 | 5.68 | 5.89 | 22.37 | 5.69 | 1.89 | 0.63 | 6.73 | 260.74 | |
| CV (%) | 5.33 | 13.69 | 5.04 | 11.55 | 12.54 | 14.35 | 8.71 | 7.56 | 7.68 | 13.94 |
| S. No. | Primer Name | Primer Sequence | Ta (°C) | Ao | FX | Ge | He | Ho | PIC | F |
|---|---|---|---|---|---|---|---|---|---|---|
| 1 | AVRDC BG-66 | F:AGAGGTCTGCCTCTTCCAAA R:CAAGGAACGCAGAAATCCTA | 50.0 | 5 | 0.38 | 7 | 0.73 | 0.10 | 0.682 | 0.87 |
| 2 | AVRDC BG-2 | F:GAGCACACAGAAAATTGGGT R:TGATCCACTCCCAATCTTAGC | 51.0 | 2 | 0.90 | 3 | 0.19 | 0.02 | 0.174 | 0.90 |
| 3 | AVRDC BG-1 | F:CAAGGAACGCAGAAATCCTA R:GAGGTCTGCCTCTTCCAAAA | 50.0 | 3 | 0.51 | 3 | 0.52 | 0.00 | 0.403 | 1.00 |
| 4 | AVRDC BG-83 | F:TATGCAGGGAAGACTGATGG R:TTTTGCTGGCTAAGGTGTTG | 50.0 | 4 | 0.87 | 6 | 0.25 | 0.08 | 0.233 | 0.69 |
| 5 | AVRDC BG-74 | F:AACACCTTCTGACTCCACCC R:CGTTCAATCCTCTCCTCCTC | 52.0 | 2 | 0.79 | 3 | 0.34 | 0.04 | 0.281 | 0.89 |
| 6 | BG_SSR-8 | F:TTAGCTCGCAGTCGCCAC R:ATT GGC CTCAGCAGCCAG | 52.0 | 2 | 0.98 | 2 | 0.04 | 0.00 | 0.038 | 1.00 |
| 7 | AVRDC BG-95 | F:GTTCTCAATTGCATCCGCTA R:CAGCAACAGCAACAGCAGTA | 50.0 | 3 | 0.59 | 3 | 0.50 | 0.00 | 0.393 | 1.00 |
| 8 | AVRDC BG-7 | F:CAGAATCATTGAGAGTGCCG R:GGCCGTAAGCTCTCACACTC | 52.0 | 3 | 0.83 | 3 | 0.30 | 0.08 | 0.274 | 0.74 |
| 9 | McSSR-20 | F:GGAATTCAGGTGAACCTGACG R:CCAGGAGGAAGAGGAACTGC | 54.0 | 2 | 0.61 | 2 | 0.48 | 0.00 | 0.363 | 1.00 |
| 10 | McSSR-22 | F:CCATGACCGATGTAGCACTCC R:TCGAACCAACCTAAACCAG | 54.0 | 2 | 0.88 | 2 | 0.21 | 0.24 | 0.186 | 0.00 |
| 11 | S13 | F:TTGGTTGTGGTGCTGAGTTC R:GATGTAGGGGTTGGGTTGAT | 58.0 | 4 | 0.65 | 5 | 0.52 | 0.04 | 0.465 | 0.93 |
| 12 | S33 | F:ATTTAGTGGGGCGGGTAGT R:TGGATGAGCATGTTAGGGATC | 58.0 | 3 | 0.57 | 4 | 0.56 | 0.04 | 0.476 | 0.93 |
| 13 | JY 003 | F:GTGGGTGCAATGGGTGTC R:CTGCTGCTGTTGCTTCTTC | 56.0 | 5 | 0.43 | 6 | 0.72 | 0.10 | 0.673 | 0.97 |
| 14 | JY004 | F:GTCAACTGCCATCGGTAC R:AGGGAAGAAGAAGAAGAAG | 56.0 | 4 | 0.57 | 4 | 0.61 | 0.00 | 0.562 | 1.00 |
| 15 | JY006 | F:TTTCCAGAGGAGCAGA R:GCTCAGAACTGGCACA | 56.0 | 3 | 0.45 | 3 | 0.65 | 0.00 | 0.573 | 1.00 |
| 16 | JY009 | F:TAAACAACAAAACCAC R:CTCAGAGTCAGAGCAA | 52.0 | 4 | 0.52 | 5 | 0.60 | 0.10 | 0.529 | 0.98 |
| 17 | JY011 | F:AAGTTGGGTTTACGAGTG R:TGGATGATGTAGGGTTTC | 52.0 | 4 | 0.47 | 7 | 0.64 | 0.10 | 0.572 | 0.85 |
| 18 | S9 | F:TTCCCATTCACAGATCACTCC R:CCACCAAATTCAAGAACCCAC | 58.0 | 3 | 0.66 | 4 | 0.64 | 0.10 | 0.457 | 0.96 |
| 19 | N1 | F:GTCTTCCAGGTTGGGAACAG R:ATCTGGTTCCTCGGGAGATT | 58.0 | 3 | 0.66 | 4 | 0.64 | 0.06 | 0.438 | 0.88 |
| 20 | N6 | F:GGGAATTCTCAAAGAGCCAGA R:TGGCACACTCTGCATGAAAT | 58.0 | 3 | 0.88 | 3 | 0.64 | 0.00 | 0.202 | 1.00 |
| 21 | S12 | F:GACATCCTTCTTGCCTCTTACA R:GAAACGGAACGAAACCTCA | 58.0 | 3 | 0.43 | 4 | 0.61 | 0.04 | 0.526 | 0.94 |
| 22 | JY001 | F:GGCTCAGAACTGGCACAG R:TATCACCCATCCATTCAC | 56.0 | 3 | 0.35 | 4 | 0.67 | 0.10 | 0.593 | 0.97 |
| 23 | JY005 | F:TTTATAGCAAACGGCTCA R:GAACATATCGCAAACCTTA | 56.0 | 3 | 0.42 | 3 | 0.65 | 0.00 | 0.570 | 1.00 |
| 24 | JY008 | F:CTCGAACTTTCTGCTC R:TGAATTGAATTGCTCT | 54.0 | 3 | 0.66 | 4 | 0.47 | 0.10 | 0.384 | 0.96 |
| 25 | N9 | F:ATCCATCCCCACAAGTTGAA R:CCATAAGGATATGTTTGCATGG | 56.0 | 3 | 0.79 | 3 | 0.35 | 0.00 | 0.298 | 1.00 |
| 26 | S18 | F:TATGGGTTTTTTCCCCCTCTT R:CATCCCCACAAGTTGAAGAA | 56.0 | 3 | 0.74 | 4 | 0.42 | 0.10 | 0.381 | 0.95 |
| 27 | S24 | F:GCTCTGCGTTTCATTCTTCA R:TGAACCCTCAGACTCAAACTC | 56.0 | 5 | 0.91 | 8 | 0.76 | 0.08 | 0.721 | 0.90 |
| 28 | S26 | F:GAACGCCCTGTGACTTTAGC R:TTTCGTCTTCCAATGAGCC | 57.0 | 4 | 0.61 | 4 | 0.58 | 0.00 | 0.533 | 1.00 |
| 29 | S20 | F:CCCCTTCTAATCACAACCAA R:GGCCTAATTTCTGCCCTTT | 57.0 | 3 | 0.79 | 3 | 0.36 | 0.00 | 0.322 | 1.00 |
| 30 | S32 | F:CTAAATCACGCAAACCCATC R:GAGCAAAAGACTGAGGAAAACT | 56.0 | 5 | 0.57 | 6 | 0.61 | 0.04 | 0.570 | 0.94 |
| Mean | 54.7 | 3.3 | 0.65 | 4.1 | 0.51 | 0.05 | 0.429 | 0.94 |
| No. | Accessions Name | Source of Collection | Salient Features |
|---|---|---|---|
| 1 | Sel-30-2 | Philippines | Light green, medium-long fruits with discontinuous ridges, medium vine |
| 2 | Sel-57 | China | Dark green, medium-long fruits with smooth tubercles, discontinuous ridges, medium vine |
| 3 | DBGS-33 | West Bengal, India | Dark green, extra-long fruits with discontinuous ridges, medium vine |
| 4 | DBGS-7 | IARI, New Delhi | Whitish green, medium-long fruits with continuous ridges, medium vine |
| 5 | DBGS-52 | West Bengal, India | Dark green, extra-long fruits with discontinuous ridges, medium vine |
| 6 | Sel-30-1 | China | Light green, small fruits with discontinuous ridges, medium vine |
| 7 | Sel-32 | Philippines | Dark green, long fruits with continuous smooth ridges, medium vine |
| 8 | Sel-59 | China | Dark green, extra-long glossy fruits with continuous smooth ridges, vigorous long vine |
| 9 | Sel-37 | Pakistan | Dark green, extra-long fruits with continuous ridges, medium vine |
| 10 | Sel-58 | China | Light green, long fruits with continuous smooth ridges, medium vine |
| 11 | Sel-2 | IARI, New Delhi | Dark green, extra-long fruits with continuous sharp ridges, large long vine |
| 12 | Sel-51 | Taiwan | Light green, extra-long fruits with discontinuous ridges, large long vine |
| 13 | PVGy-1 | IARI, New Delhi | Dark green, medium-long fruits with discontinuous ridges, medium vine |
| 14 | Sel-33-2 | Philippines | Dark green, medium-long fruits with discontinuous ridges, medium vine |
| 15 | Sel-25 | Thailand | Dark green, small ovate fruits with discontinuous ridges, sharp tubercles, short vine |
| 16 | Sel-41 | Bangladesh | Dark green, long fruits with continuous ridges, medium vine |
| 17 | Sel-26 | Thailand | Dark green, long fruits with discontinuous ridges, medium vine |
| 18 | NEH-4 | Manipur, India | Dark green, medium-long fruits with discontinuous ridges, medium vine |
| 19 | Pusa Aushadhi | IARI, New Delhi | Light green, medium-long glossy fruits with continuous narrow ridges, medium vine |
| 20 | DBGS-42 | West Bengal, India | Light green, medium-long fruits with discontinuous ridges, medium vine |
| 21 | NEH-1 | Manipur, India | Dark green, medium-long fruits with discontinuous ridges, medium vine |
| 22 | Sel-53 | Taiwan | Light green, long fruits with continuous smooth ridges, medium vine |
| 23 | DBGS-3 | Odisha, India | White, extra-long fruits with continuous ridges, vigorous vine |
| 24 | Sel-1 | IARI, New Delhi | Whitish green, long fruits with discontinuous ridges, medium vine |
| 25 | DBGS-9 | Odisha, India | Light green, long fruits with continuous ridges, medium vine |
| 26 | Arka Harit | IIHR, Bangluru | Dark green fruits with discontinuous ridges, vigorous long vine |
| 27 | Pusa Do Mausumi | IARI, New Delhi | Fruits glossy, green with continuous ridges, vigorous long vine |
| 28 | Pusa Vishes | IARI, New Delhi | Dark green, long fruits with discontinuous ridges, medium vine |
| 29 | Sel-46 | Taiwan | Dark green, long fruits with continuous smooth ridges, medium vine |
| 30 | Sel-38 | Lao | Green, medium-long fruits with discontinuous ridges, medium vine |
| 31 | DBGS-52 | West Bengal, India | Dark green, small fruits with discontinuous ridges, medium vine |
| 32 | MC-84 | Kerala, India | Dark green, long fruits with discontinuous ridges, medium vine |
| 33 | Pusa Poorvi | IARI, New Delhi | Attractive dark green, small fruits with discontinuous ridges, pointed tubercles, short vine |
| 34 | Sel-52 | Taiwan | Dark green, long fruits with discontinuous ridges, medium vine |
| 35 | NEH-2 | Meghalaya, India | Dark green, medium-long fruits with discontinuous ridges, medium vine |
| 36 | DBGS-4 | IARI, New Delhi | White, long fruits with continuous ridges, medium vine |
| 37 | Sel-52-3 | Taiwan | Pearl white, medium fruits with discontinuous ridges, medium vine |
| 38 | Pusa Rasdar | IARI, New Delhi | Dark green, capsicum shaped, medium with continuous smooth ridges, medium vine |
| 39 | PDMGy-201 | IARI, New Delhi | Dark glossy green, medium fruits with continuous ridges, medium vine |
| 40 | DBGS-33-2 | West Bengal, India | Green, medium fruits with discontinuous ridges, medium vine |
| 41 | Andhra Collection | Andhra Pradesh, India | Dark green, medium-long fruits with discontinuous ridges, medium vine |
| 42 | Nakhra Local | Odisha, India | Medium vine, long, dark green fruits with continuous ridges |
| 43 | Sel-33 | Philippines | Dark green, medium fruits with discontinuous ridges, medium vine |
| 44 | Sel-27 | Taiwan | Dark green, medium-long fruits, pointed tubercles with discontinuous ridges, medium vine |
| 45 | DBGS-38-1 | West Bengal, India | Dark green, small fruits, tubercles presence with discontinuous ridges, medium vine |
| 46 | NEH-3 | Manipur, India | Dark green, medium-long fruits with discontinuous ridges, medium vine |
| 47 | DBGS-41 | West Bengal, India | Green, medium-long fruits with continuous smooth ridges, medium vine |
| 48 | Sel-52-1 | Taiwan | Whitish green, long fruits with continuous ridges, medium vine |
| 49 | Sel-52-2 | Taiwan | White, long fruits with continuous ridges, medium vine |
| 50 | Sel-29 | Philippines | Green, medium fruits with discontinuous ridges, pointed tubercles, medium vine |
| 51 | DBGS-46 | West Bengal, India | Green, long fruits with continuous ridges, medium vine |
Publisher’s Note: MDPI stays neutral with regard to jurisdictional claims in published maps and institutional affiliations. |
© 2021 by the authors. Licensee MDPI, Basel, Switzerland. This article is an open access article distributed under the terms and conditions of the Creative Commons Attribution (CC BY) license (https://creativecommons.org/licenses/by/4.0/).
Share and Cite
Alhariri, A.; Behera, T.K.; Jat, G.S.; Devi, M.B.; Boopalakrishnan, G.; Hemeda, N.F.; Teleb, A.A.; Ismail, E.; Elkordy, A. Analysis of Genetic Diversity and Population Structure in Bitter Gourd (Momordica charantia L.) Using Morphological and SSR Markers. Plants 2021, 10, 1860. https://doi.org/10.3390/plants10091860
Alhariri A, Behera TK, Jat GS, Devi MB, Boopalakrishnan G, Hemeda NF, Teleb AA, Ismail E, Elkordy A. Analysis of Genetic Diversity and Population Structure in Bitter Gourd (Momordica charantia L.) Using Morphological and SSR Markers. Plants. 2021; 10(9):1860. https://doi.org/10.3390/plants10091860
Chicago/Turabian StyleAlhariri, Ahmad, Tusar Kanti Behera, Gograj Singh Jat, Mayanglambam Bilashini Devi, G. Boopalakrishnan, Nada F. Hemeda, Ayaat A. Teleb, E. Ismail, and Ahmed Elkordy. 2021. "Analysis of Genetic Diversity and Population Structure in Bitter Gourd (Momordica charantia L.) Using Morphological and SSR Markers" Plants 10, no. 9: 1860. https://doi.org/10.3390/plants10091860
APA StyleAlhariri, A., Behera, T. K., Jat, G. S., Devi, M. B., Boopalakrishnan, G., Hemeda, N. F., Teleb, A. A., Ismail, E., & Elkordy, A. (2021). Analysis of Genetic Diversity and Population Structure in Bitter Gourd (Momordica charantia L.) Using Morphological and SSR Markers. Plants, 10(9), 1860. https://doi.org/10.3390/plants10091860