Earthquake Risk Assessment for Tehran, Iran
Abstract
1. Introduction
2. Region of Study
2.1. Tectonic Setting
2.2. Active Faulting
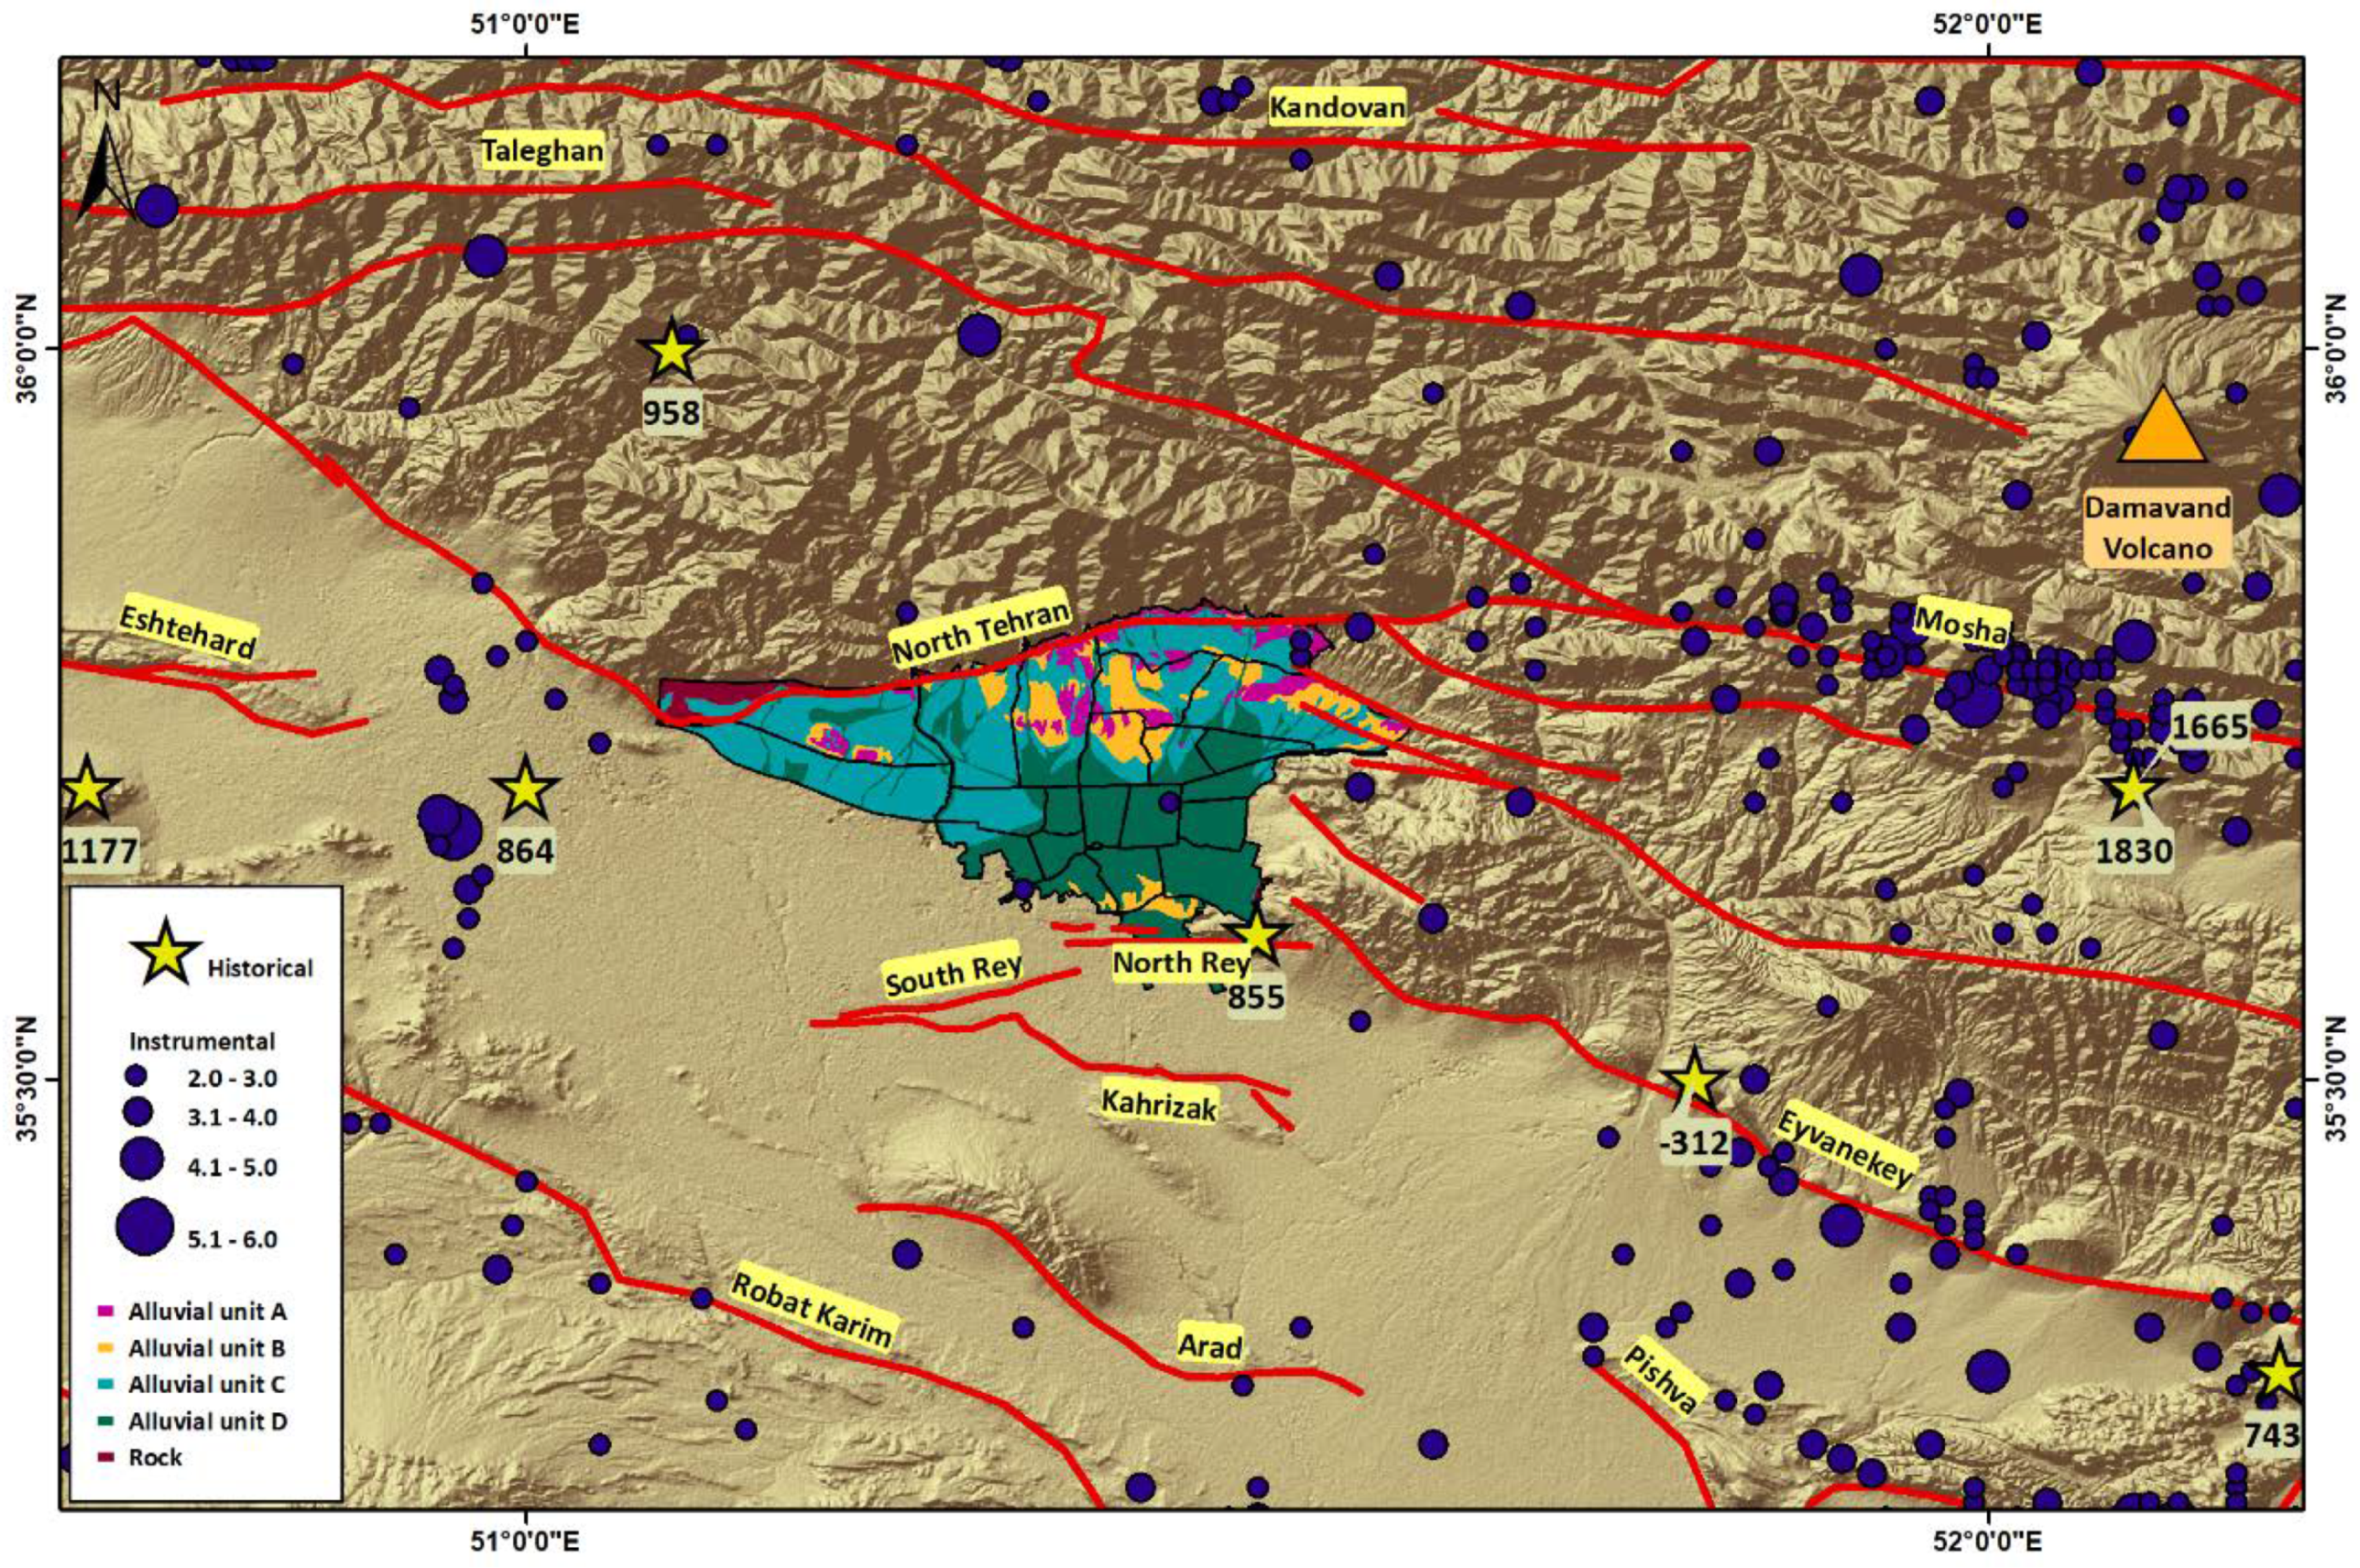
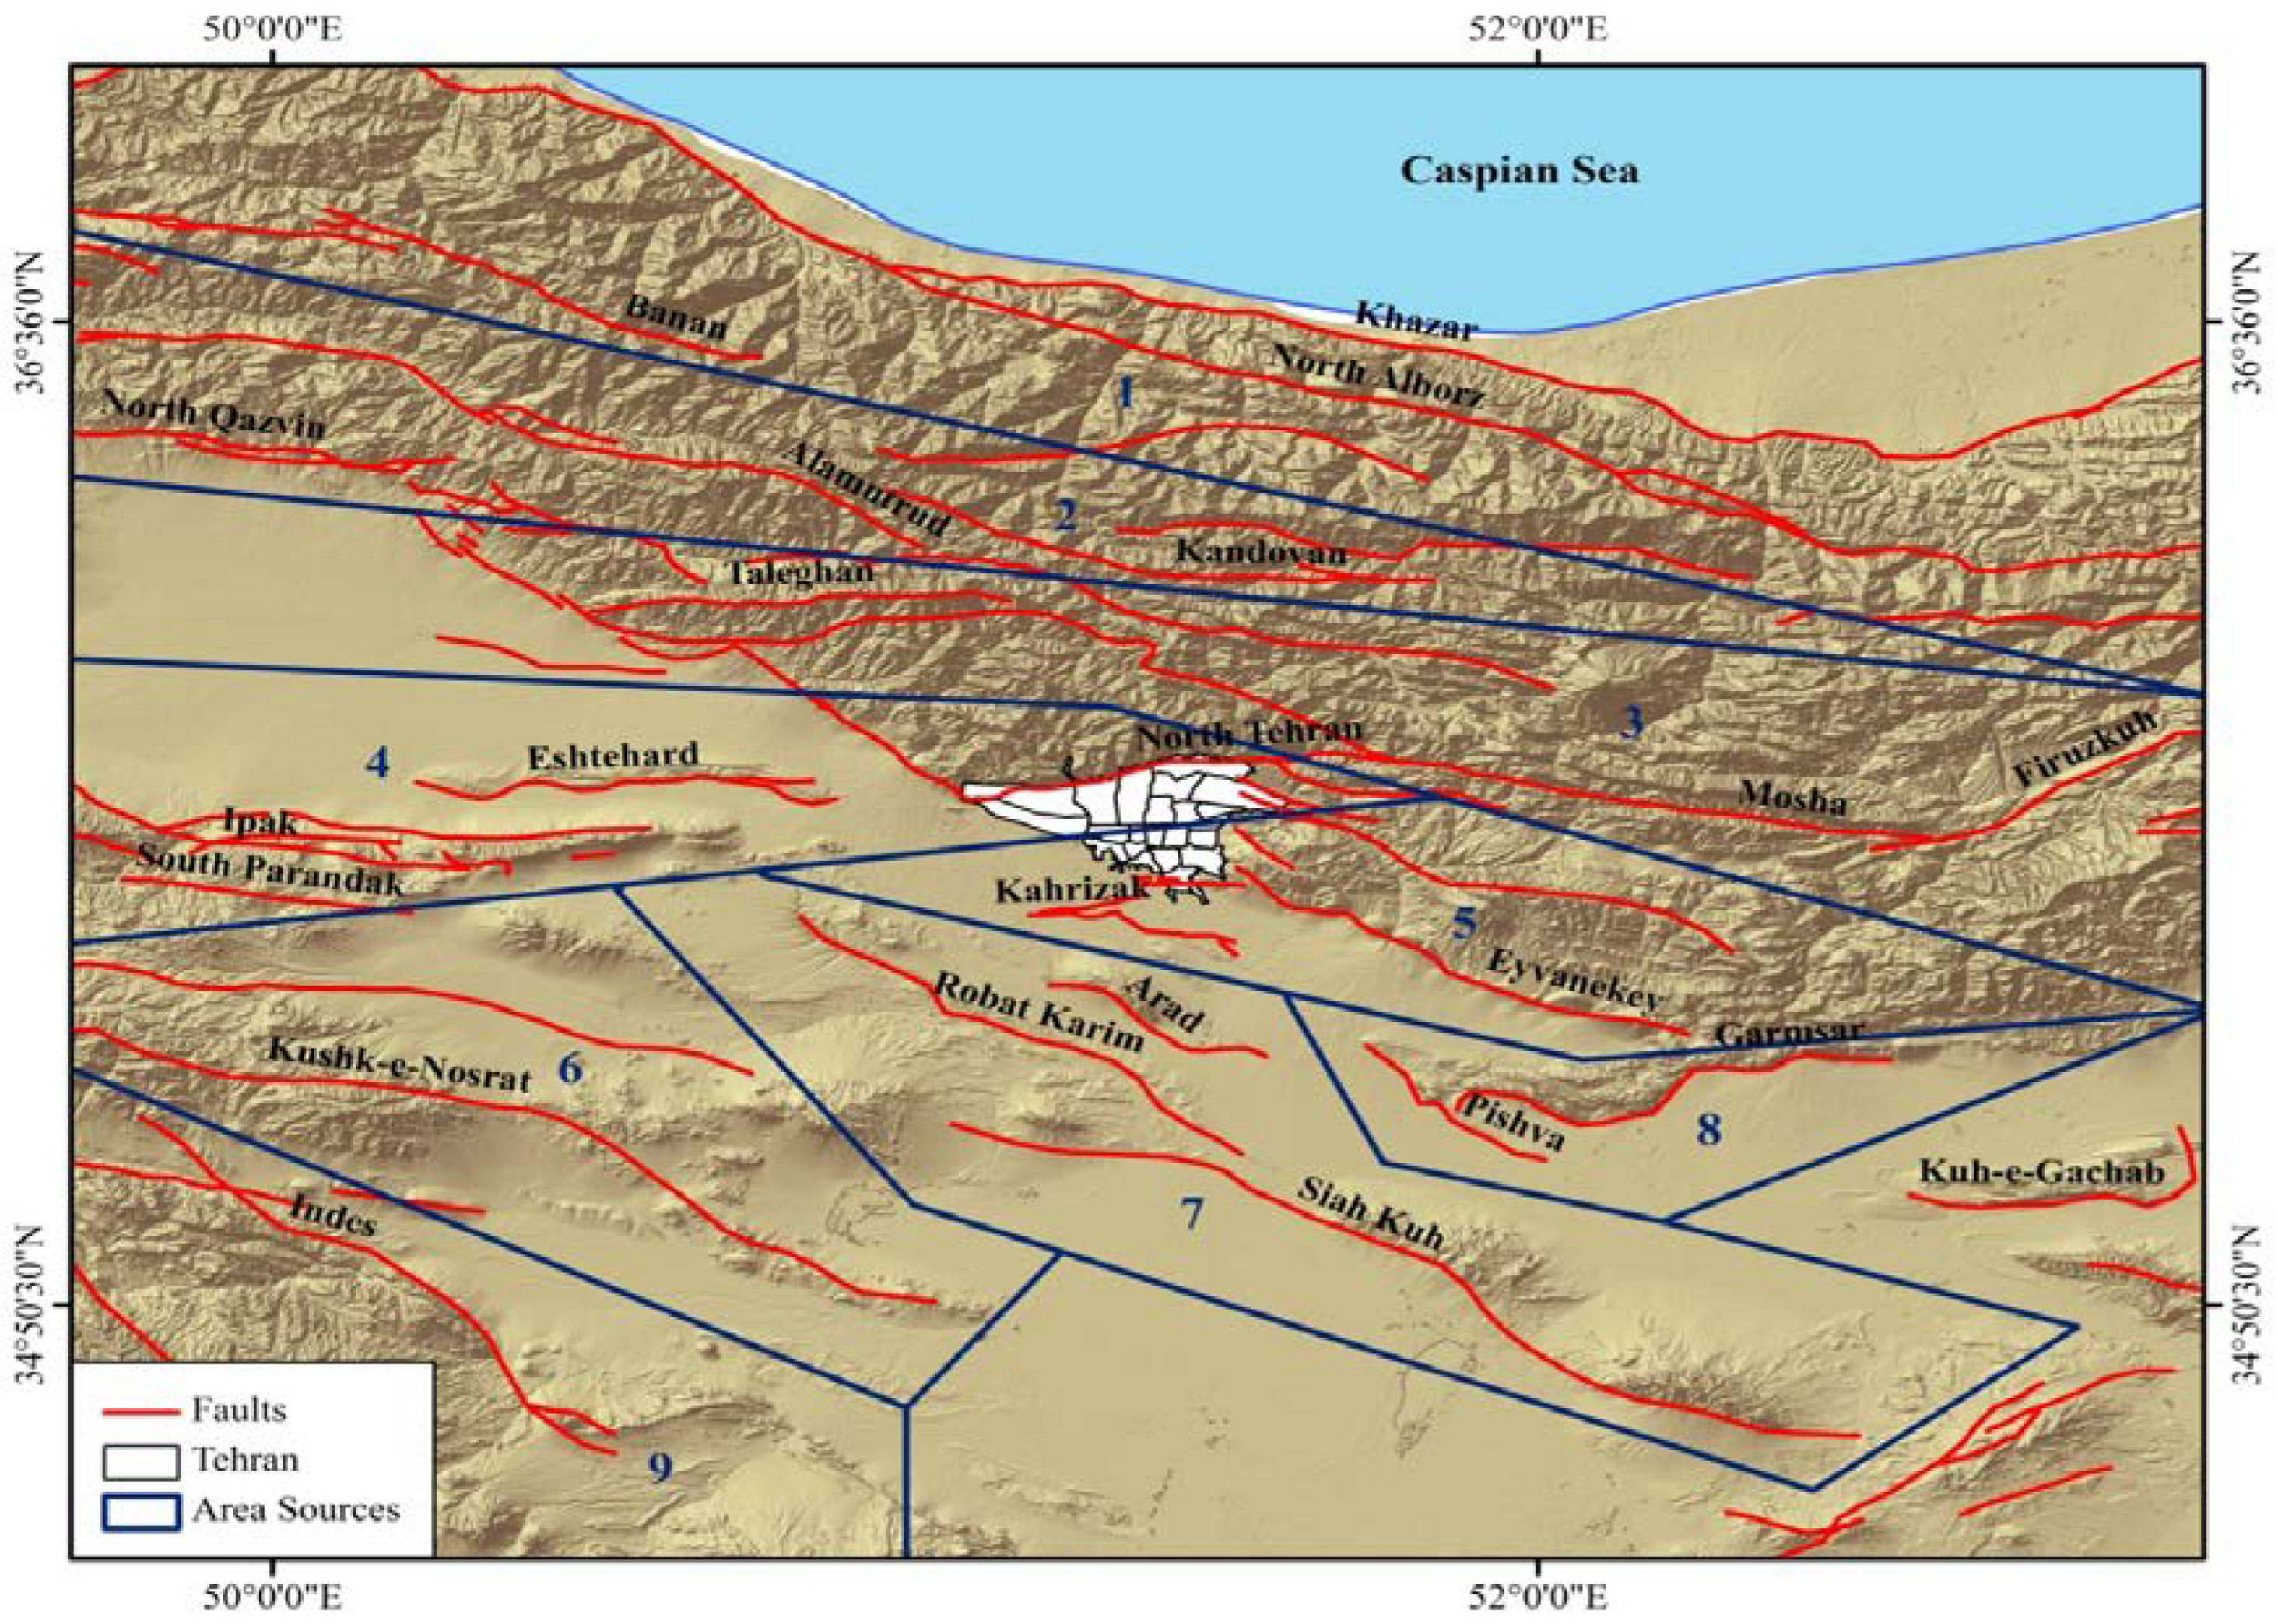
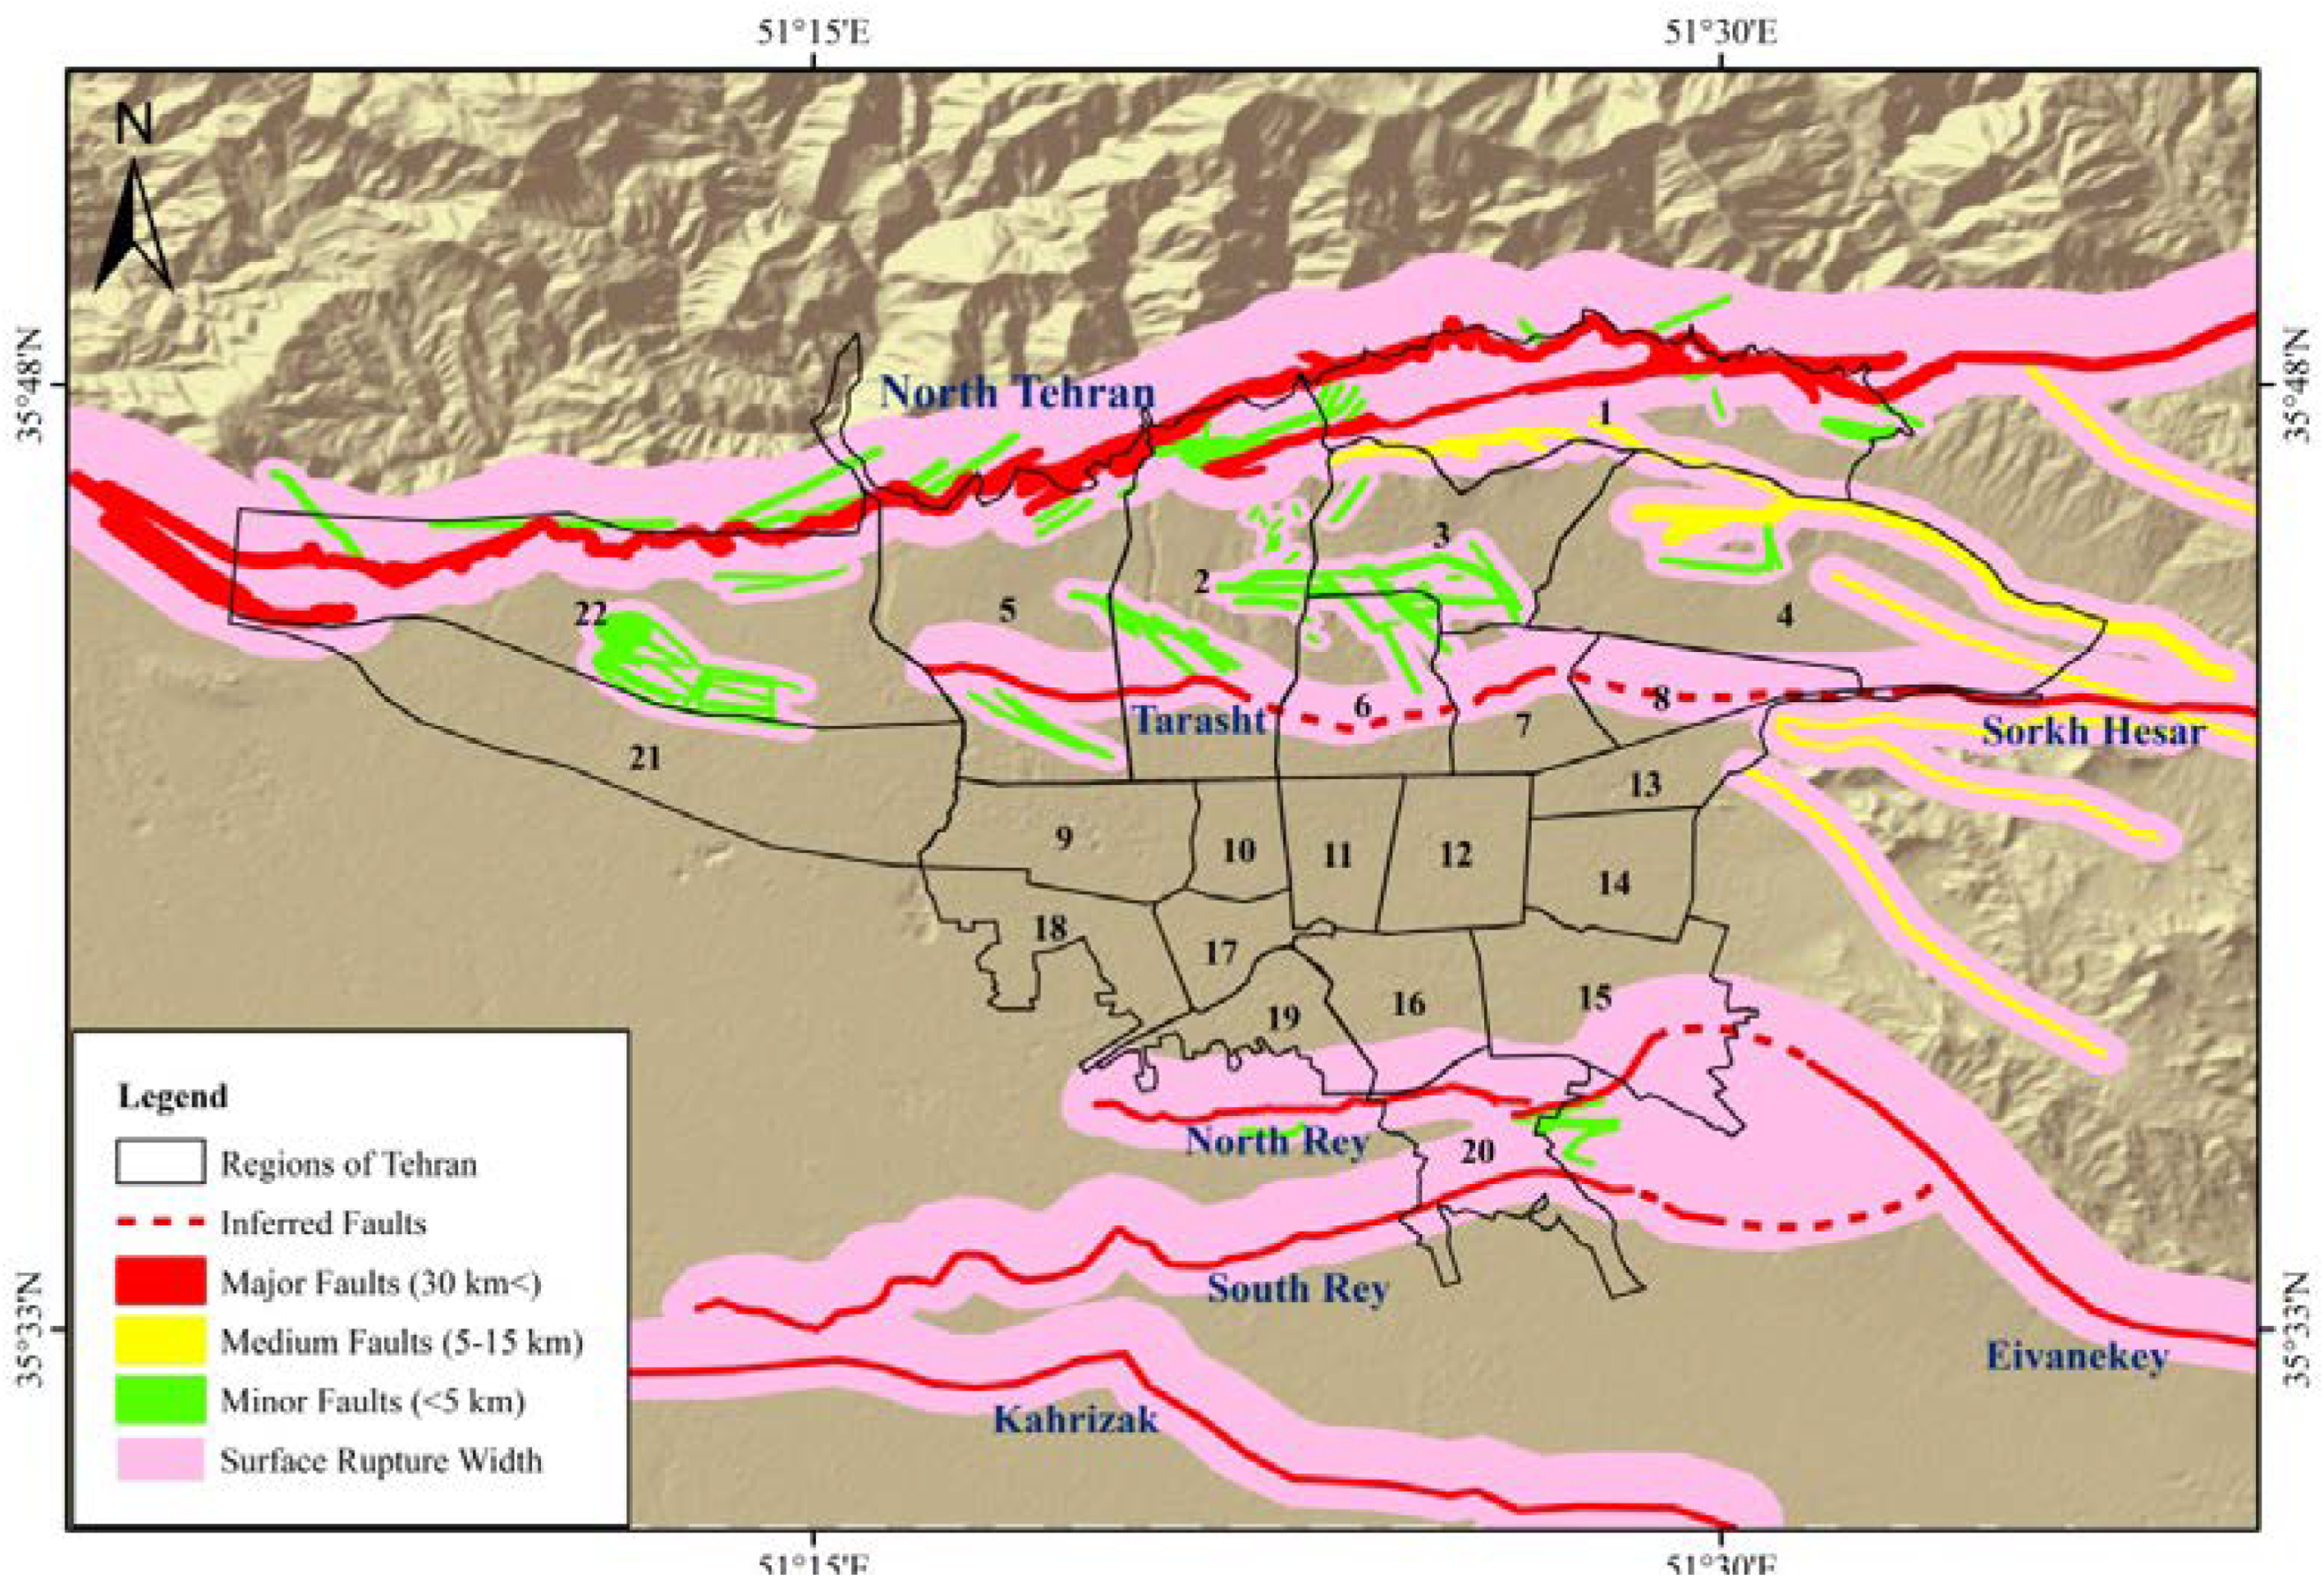
- North Tehran: The most prominent active tectonic structure in Tehran; E–W strike; north-dipping fault surface; length of 175 km with a predominant thrust mechanism along its 110–km western segment, and a predominant left-lateral strike–slip mechanism along its 65-km eastern segment; average slip rate of ~0.3 mm yr−1.
- Mosha: Located at 16–km distance to the north of Tehran; N100° E trending; north-dipping fault surface; a 220–km long, left-lateral oblique reverse fault with dips varying from 35° to 70°; average slip rate of ~0.2 mm yr−1.
- Kahrizak–South Rey–North Rey: A zone located south of Tehran, E–W trending, consisting of Kahrizak, South Rey, and North Rey faults with lengths of 35, 18.5, and 16.5 km, respectively.
- Parchin: Also known as the Eyvanekey fault; situated at the southeast of Tehran; 70 km long; NW–SE strike; has clear ruptures in Quaternary alluvial deposits.
- Pishva: Located southeast of Tehran; ~55 km long; NW-SE (N130° E) trending; reverse mechanism with a lateral component; northeast-dipping fault surface.
- Garmsar: Located southeast of Tehran, bifurcated from the southern section of the Pishva fault; 70-km long; E–W trending; reverse mechanism.
- Taleghan: Located northwest of Tehran; 80-km length; E–W trending; left-lateral strike–slip mechanism with a normal component (occurrence of a kinematical change along the fault from reverse to left-lateral + normal ~1 Ma); minimum horizontal and vertical slip rates of 0.6–1.6 mm yr−1 and ~0.5 mm yr−1, respectively.
- Pardisan: Located in central Tehran; ~12 km long; E-W trending; thrust mechanism; north dipping; minimum uplift and slip-rates of at least 1 mm yr−1.
2.3. Seismicity
2.4. Geological Structure
- Unit A: Also known as the ‘Hezardarreh’ formation, this unit is the oldest deposit in Tehran with a thickness of ~1200 m, forming a long anticline throughout the northeast-east of Tehran. Having a light gray in color and an almost vertical bedding (dip ~90°), this unit is mainly made of conglomerates with a well-developed lime carbonate cementation and is considered to be of the Pliocene–Pleistocene age.
- Unit B: This unit, also known as the ‘Kahrizak’ formation, unconformably overlies on the eroded surfaces of unit A. The thickness of unit B varies from 10 to 60 m, and its bedding is generally horizontal with a maximum dip of 15°. This deposit has a heterogeneous mechanical resistance and changeable porosity and its age is estimated to be ~700,000 years.
- Unit C: Since a considerable part of Tehran has been built on this unit, it is also called as the ‘Tehran’ formation, and includes conglomeratic young alluvial fan deposits. The maximum thickness of this formation is about 60 m, and its age is estimated to be ~50,000 years. Its bedding indicates an almost horizontal slope. Unit C has higher cementation than its underlying and overlying stratigraphic units (B and D formations, respectively).
- Unit D: Known as the ‘Recent’ alluvium, this unit is the youngest stratigraphic unit within the Tehran region and its formation dates back to the Holocene epoch (11,500 years). The thickness of this unit is less than 10 m and its color is gray to dark gray. This unit has an alluvial and fluvial origin, and it composes of poorly consolidated to unconsolidated cementation.
3. Methodology
4. Hazard
4.1. Surface PGA
4.2. Surface Rupture Width
5. Exposure
6. Vulnerability
7. Risk
8. Discussion and Conclusions
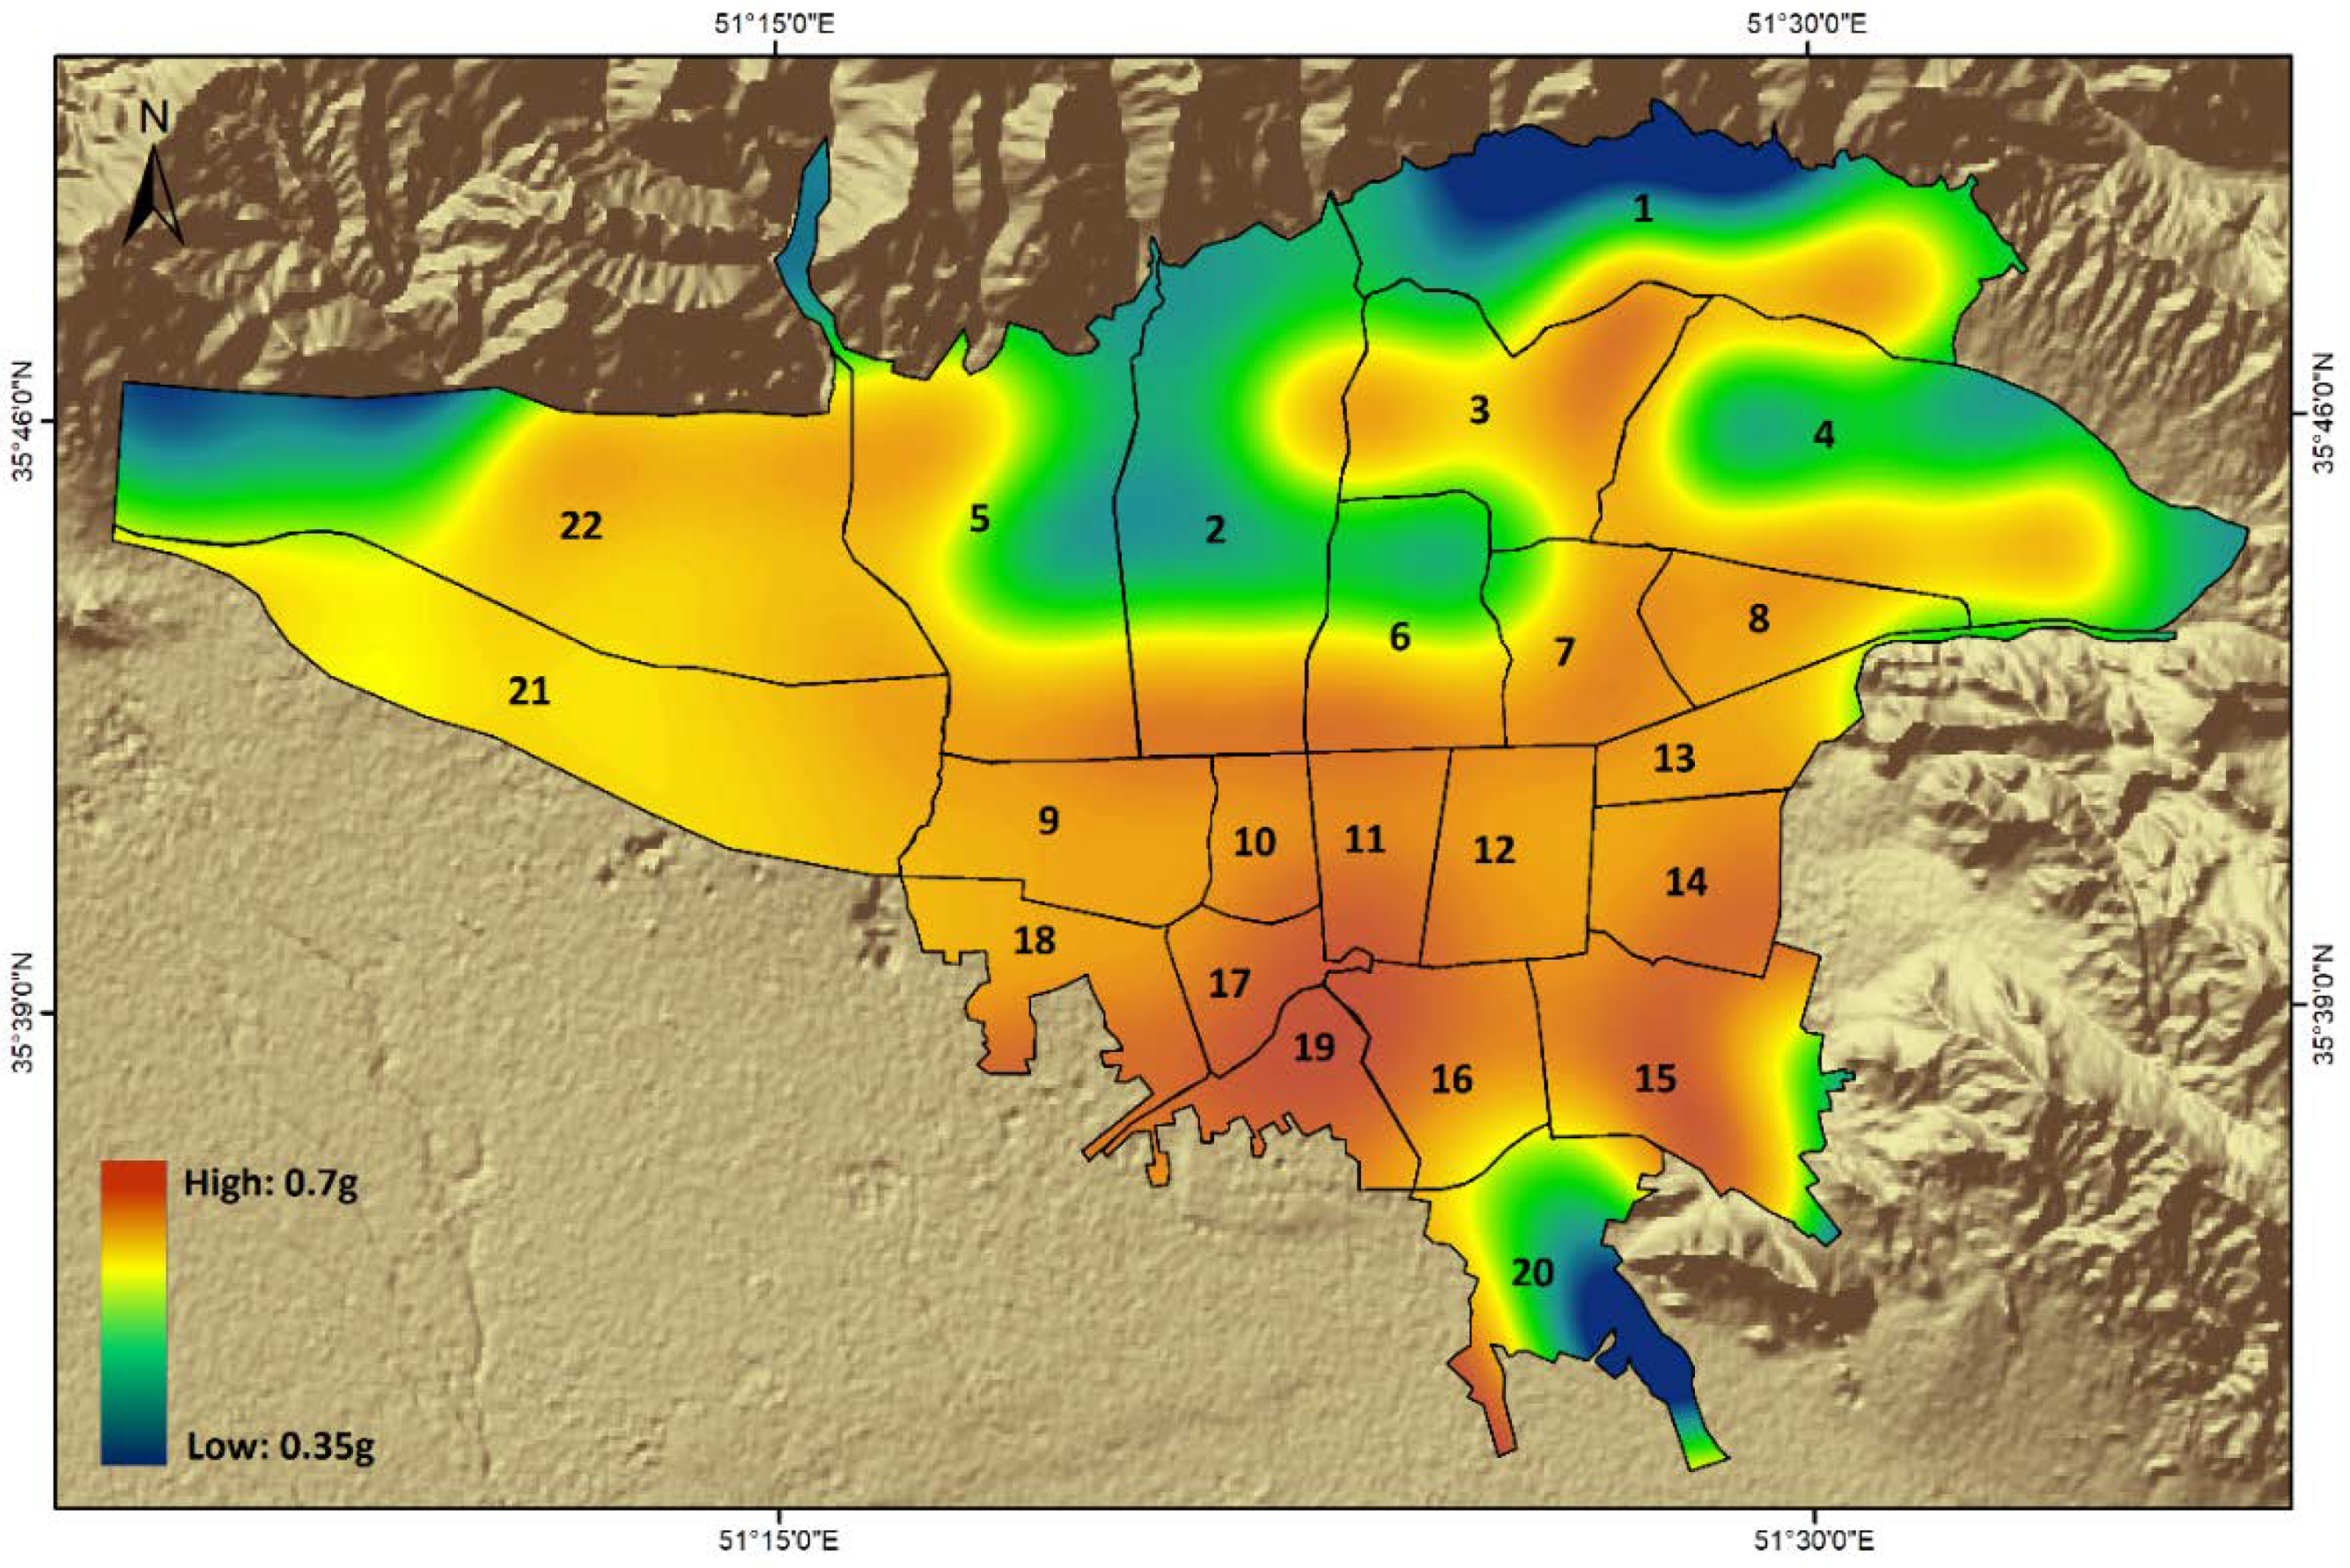
- Based on the hazard maps, northern and southern parts of Tehran are subjected to a high PGA of about 0.5 g on a bedrock level; however, regarding the local site response, the soft, thick soil layers in southern parts of Tehran have the potential of amplifying seismic waves up to twice of the calculated values on the rock. For example, this amount is estimated to be 0.7 g for the southwestern parts of Tehran.
- Experiences of previous earthquakes indicate that some specific phenomena related to near-field earthquakes may also result in large damages especially in urban areas. Such phenomena can occur in the form of surface fault rupture, large cracks, and directivity effects, fling step, fault scarps, etc. With respect to the fact that the northern and southern parts of Tehran embrace several active faults, these regions should be taken into account as high–potential areas for hosting the mentioned phenomena. Therefore, a surface rupture widths map was also prepared for the surrounding and inner-city faults of Tehran using the faults’ geometry. Results indicate that we should expect surface rupture widths of about 2–3, 1.5, and 1 km for the major, medium, and minor faults in Tehran, respectively.
- As mentioned in Section 2 and Section 3, Tehran currently lays on a seismic gap. Regarding that we have applied a time-independent hazard assessment in this study, the duration since the last event is not considered here, so this seismic gap observation in Tehran is not taken into account in our model. Therefore, a future perspective for this study would be an assessment of time-dependent hazard, which considers possible seismic gaps in order to calculate time-dependent conditional probabilities. This would be helpful to arrive at a better understanding of the potential hazard associated with this seismic gap in order to adopt appropriate strategies for earthquake risk reduction.
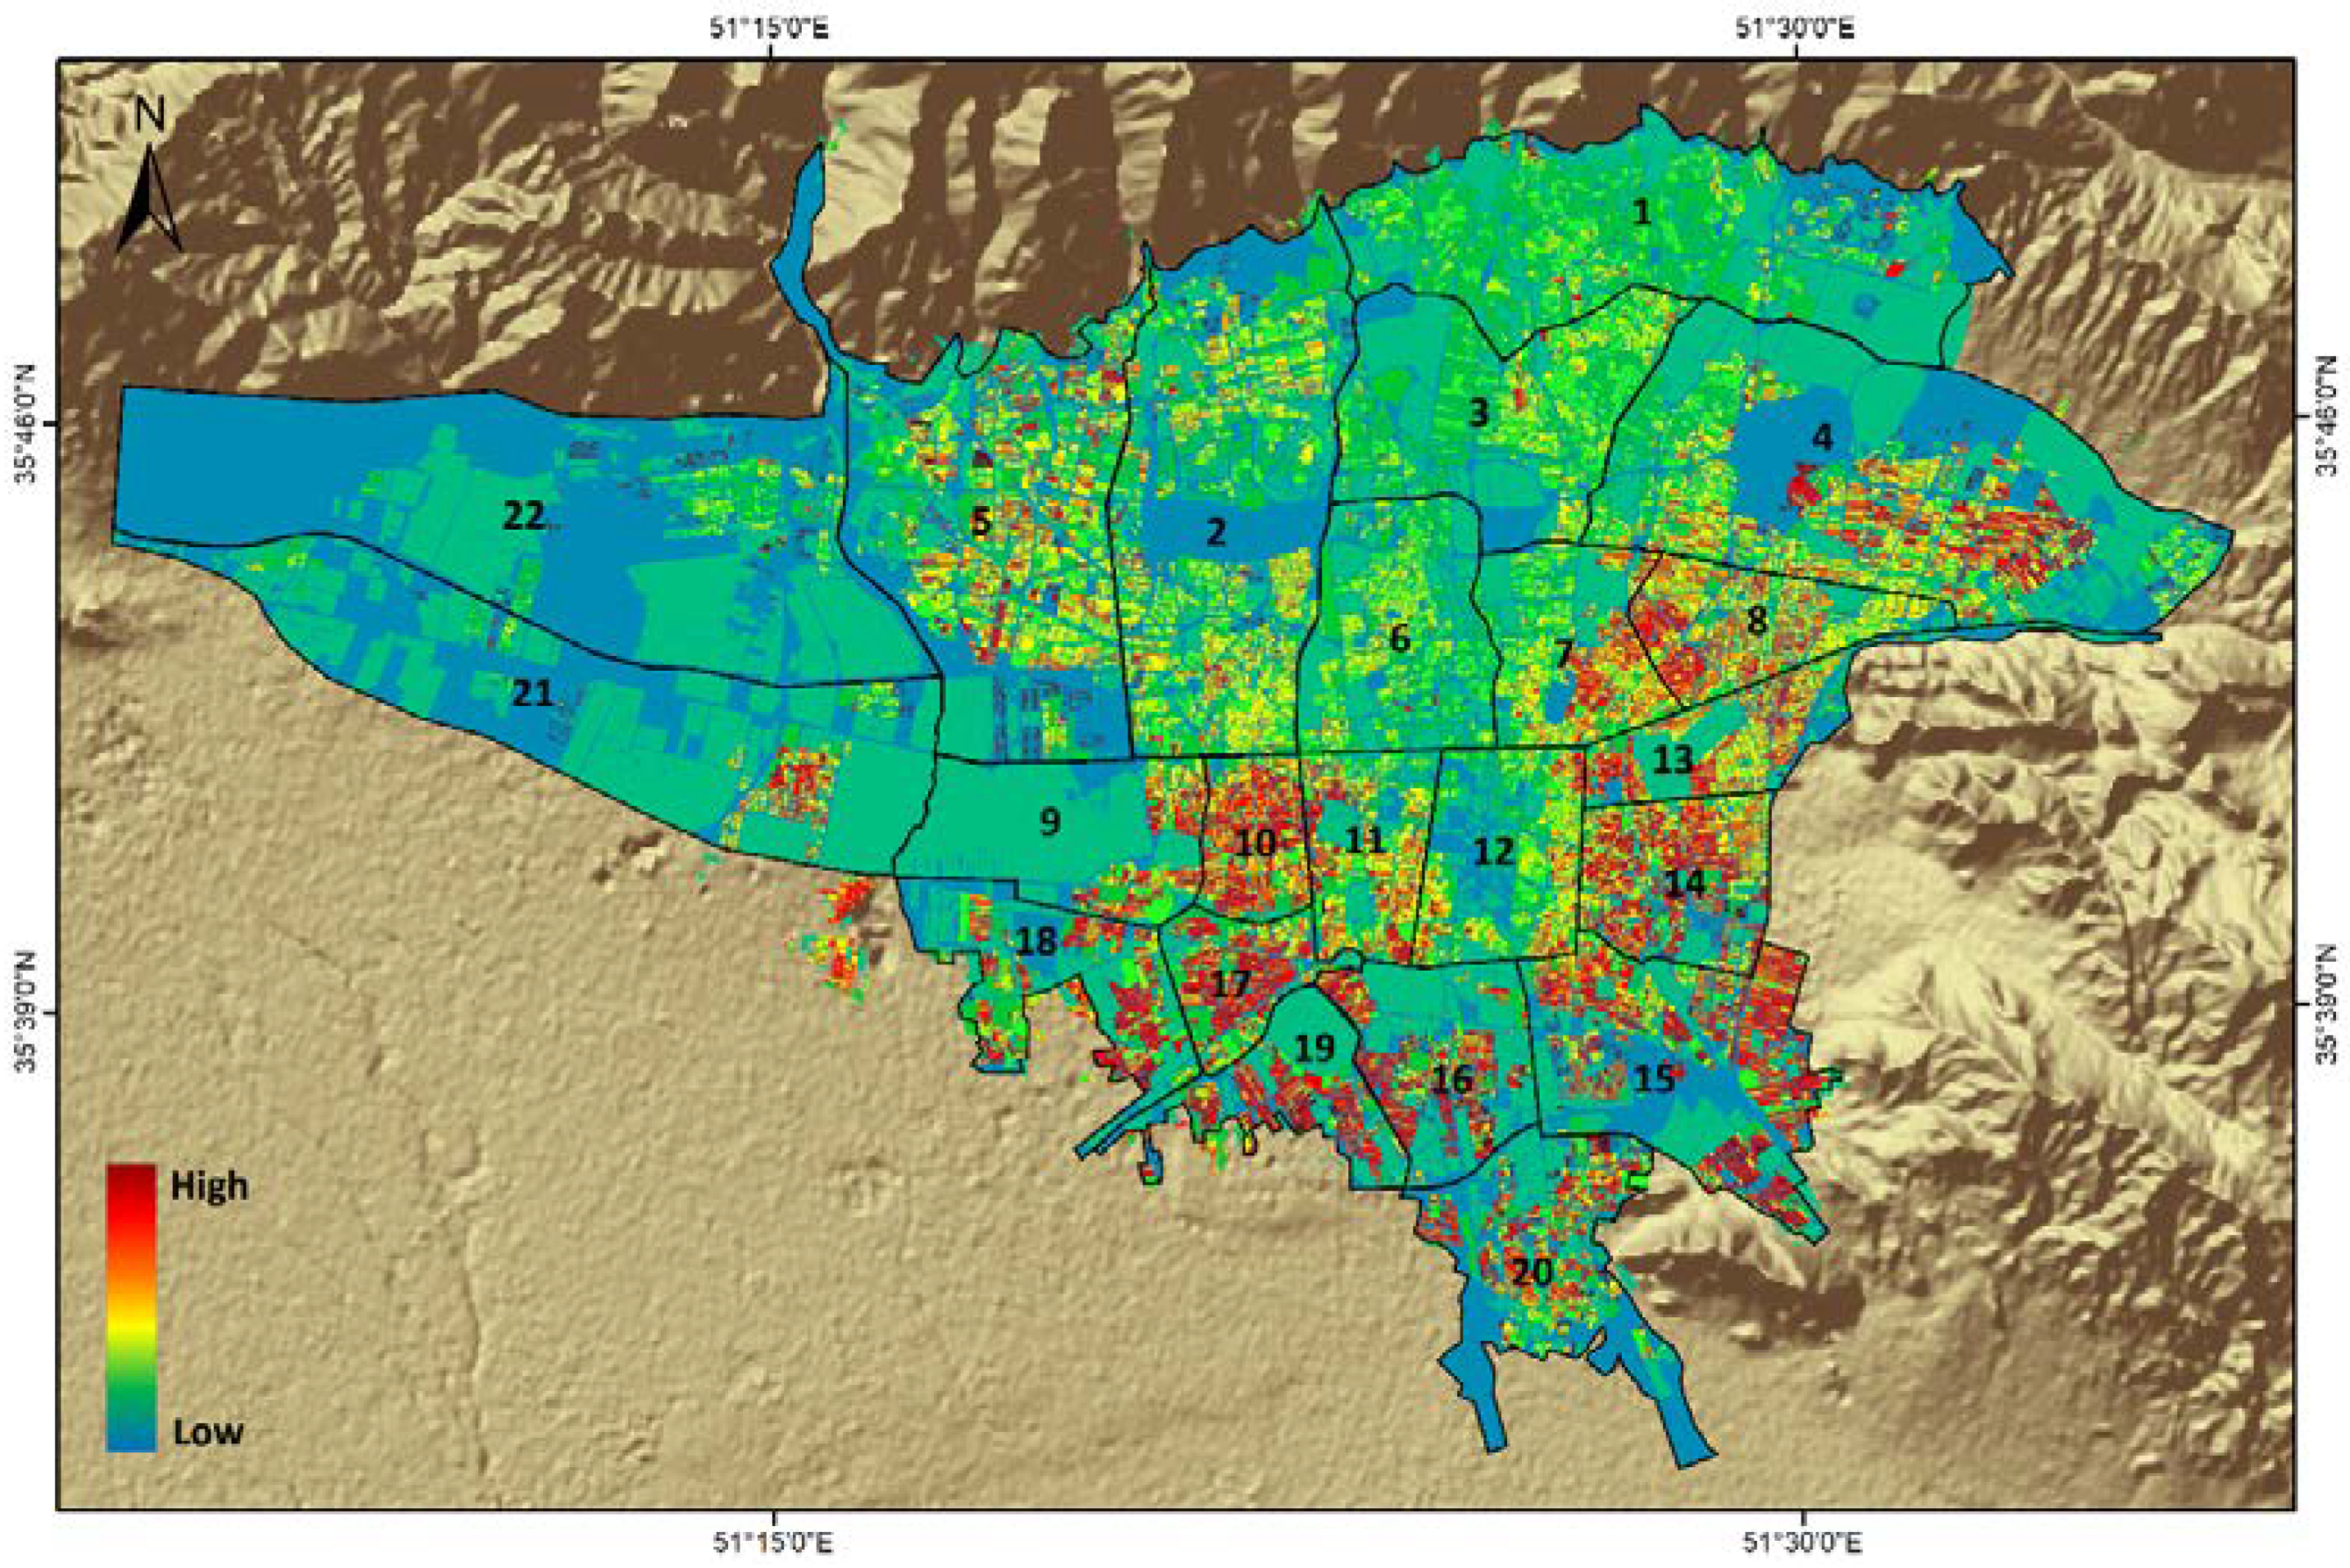
- The population density map (Figure 7) clearly indicates that, of 22 municipality districts of Tehran, eight districts are the most densely populated areas in Tehran. A comparison of this human exposure with the overall physical vulnerability map (Figure 8) reveals that, in some areas, the population is exactly focused at the highest vulnerable places, which should be considered as an urgent issue in future urban development efforts.
- According to the overall physical vulnerability map (Figure 8), 10 out of 22 districts in the megacity of Tehran including districts no. 7, 8, 10, 11, 12, 14, 15, 16, 17, and 20 show a higher vulnerability than other districts. These results are in a good general agreement with some previous studies on the vulnerability of urban fabrics and building loss models in Tehran [91,92,93].
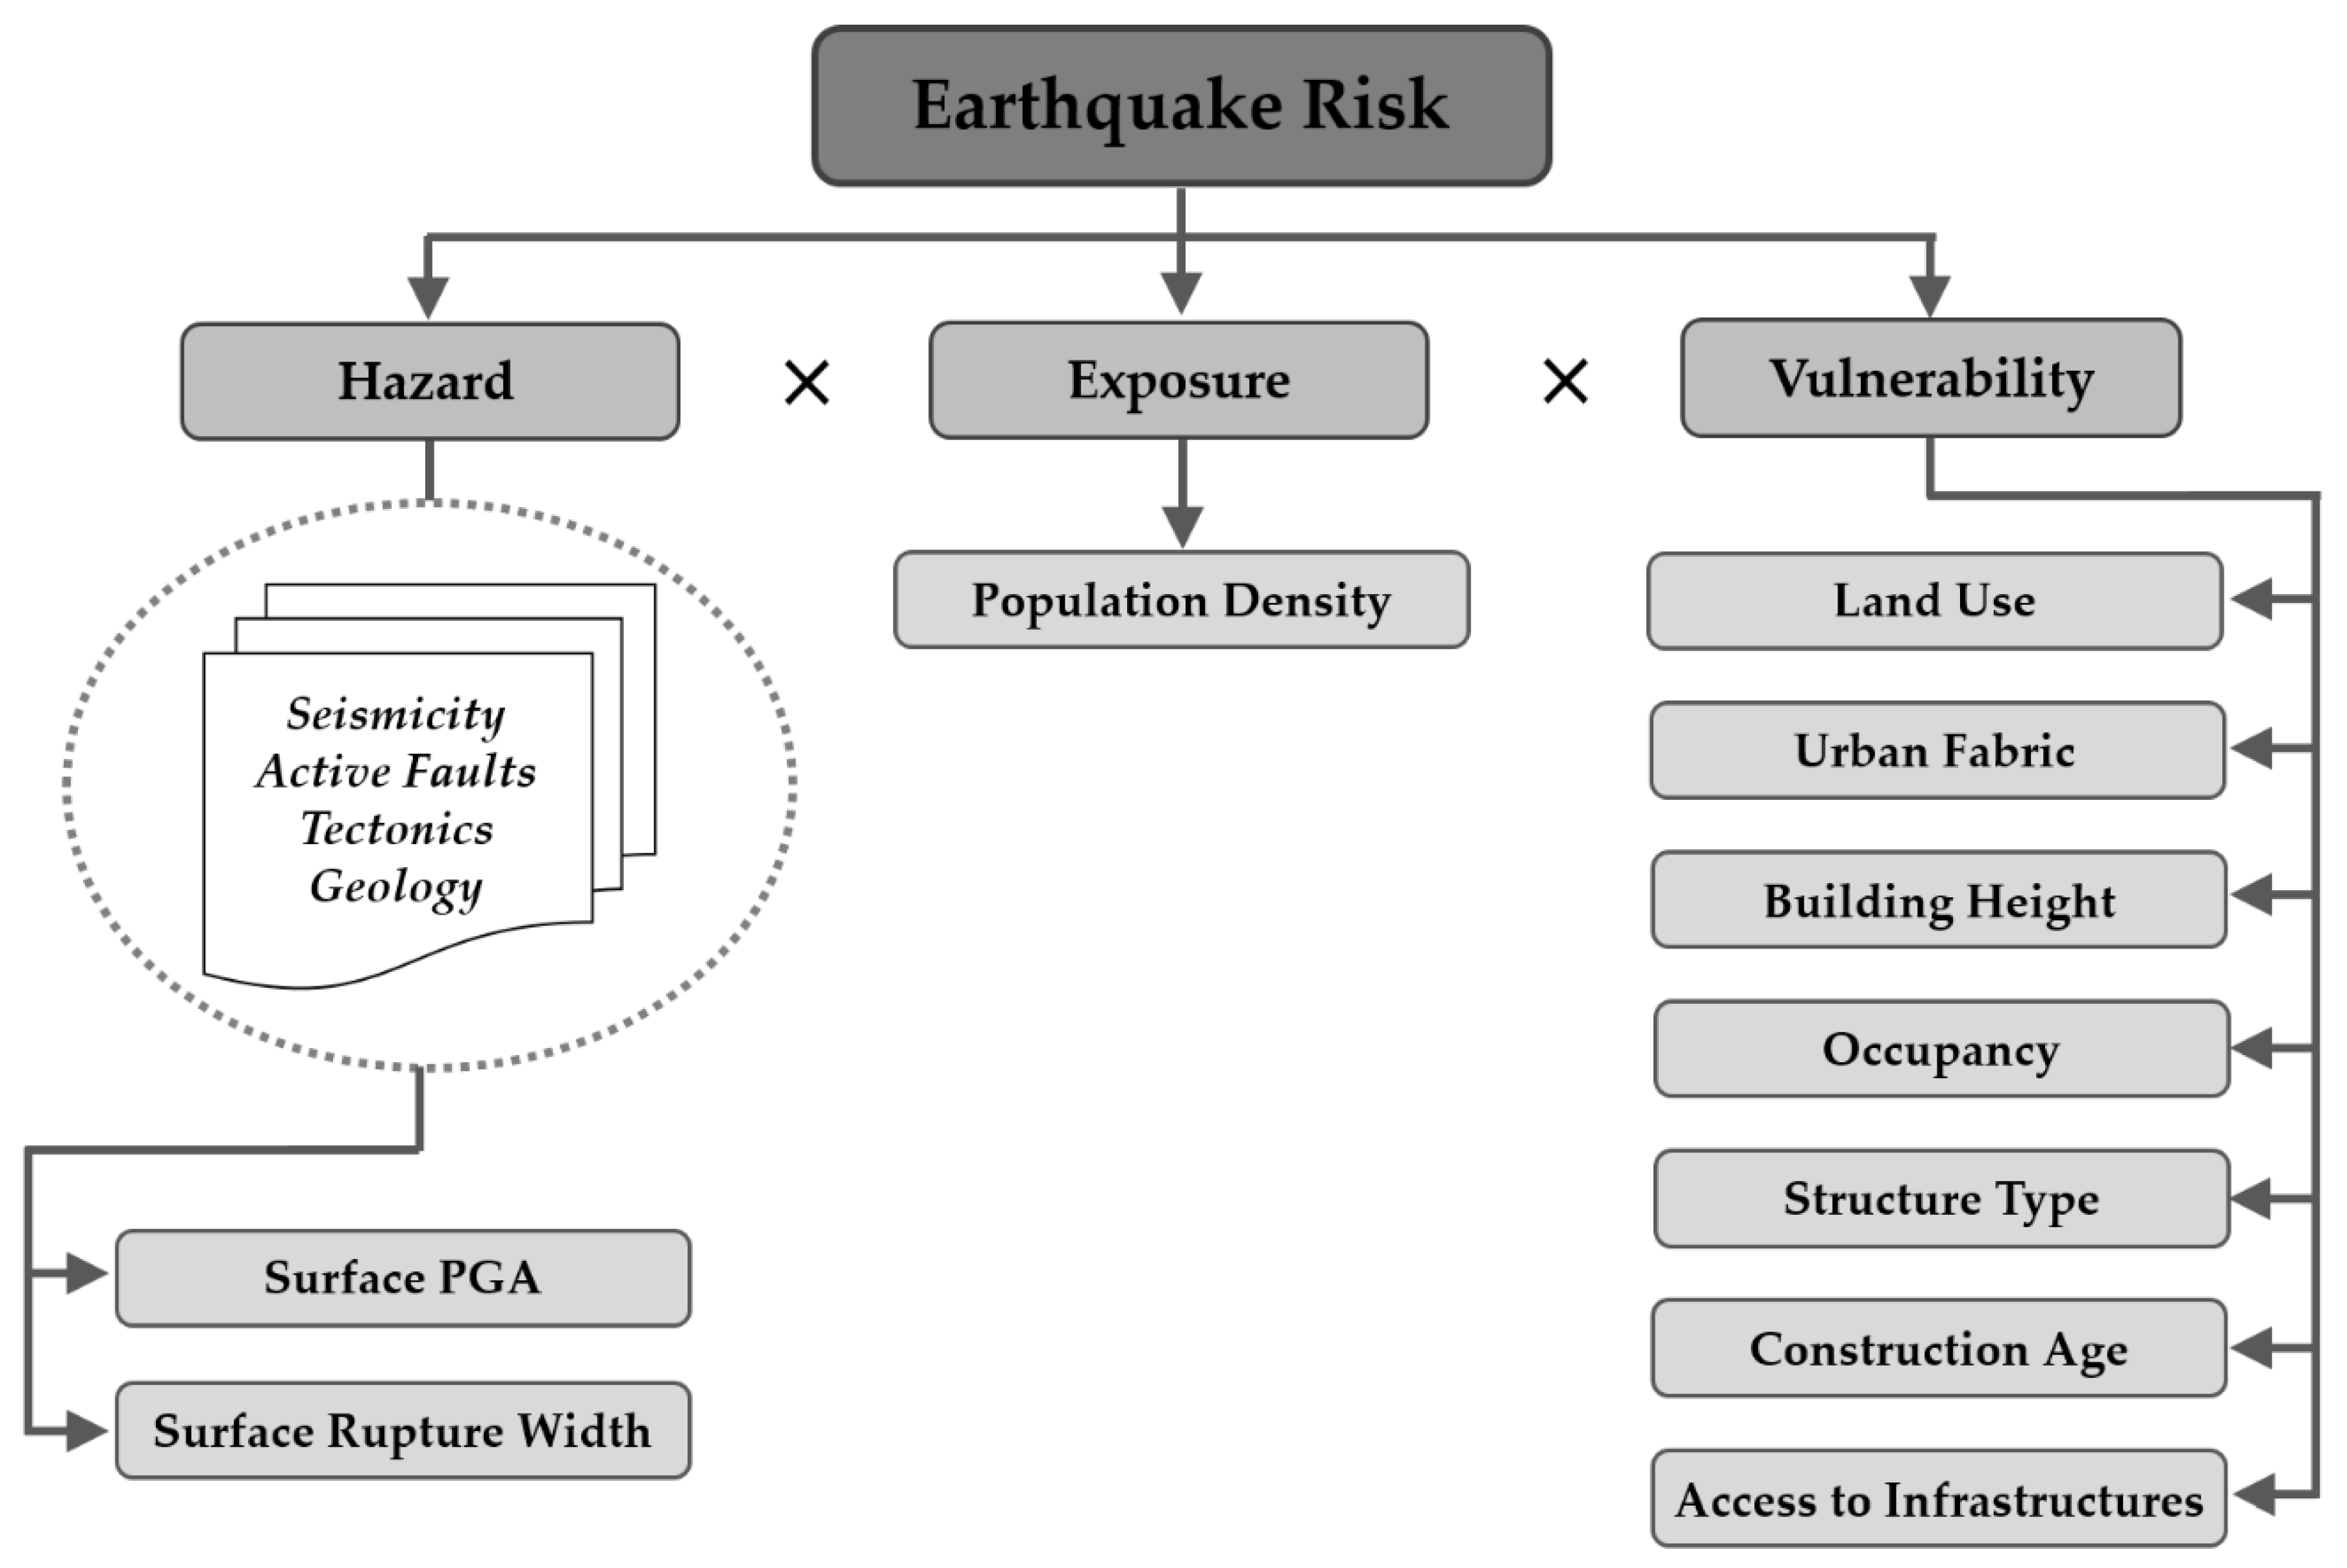
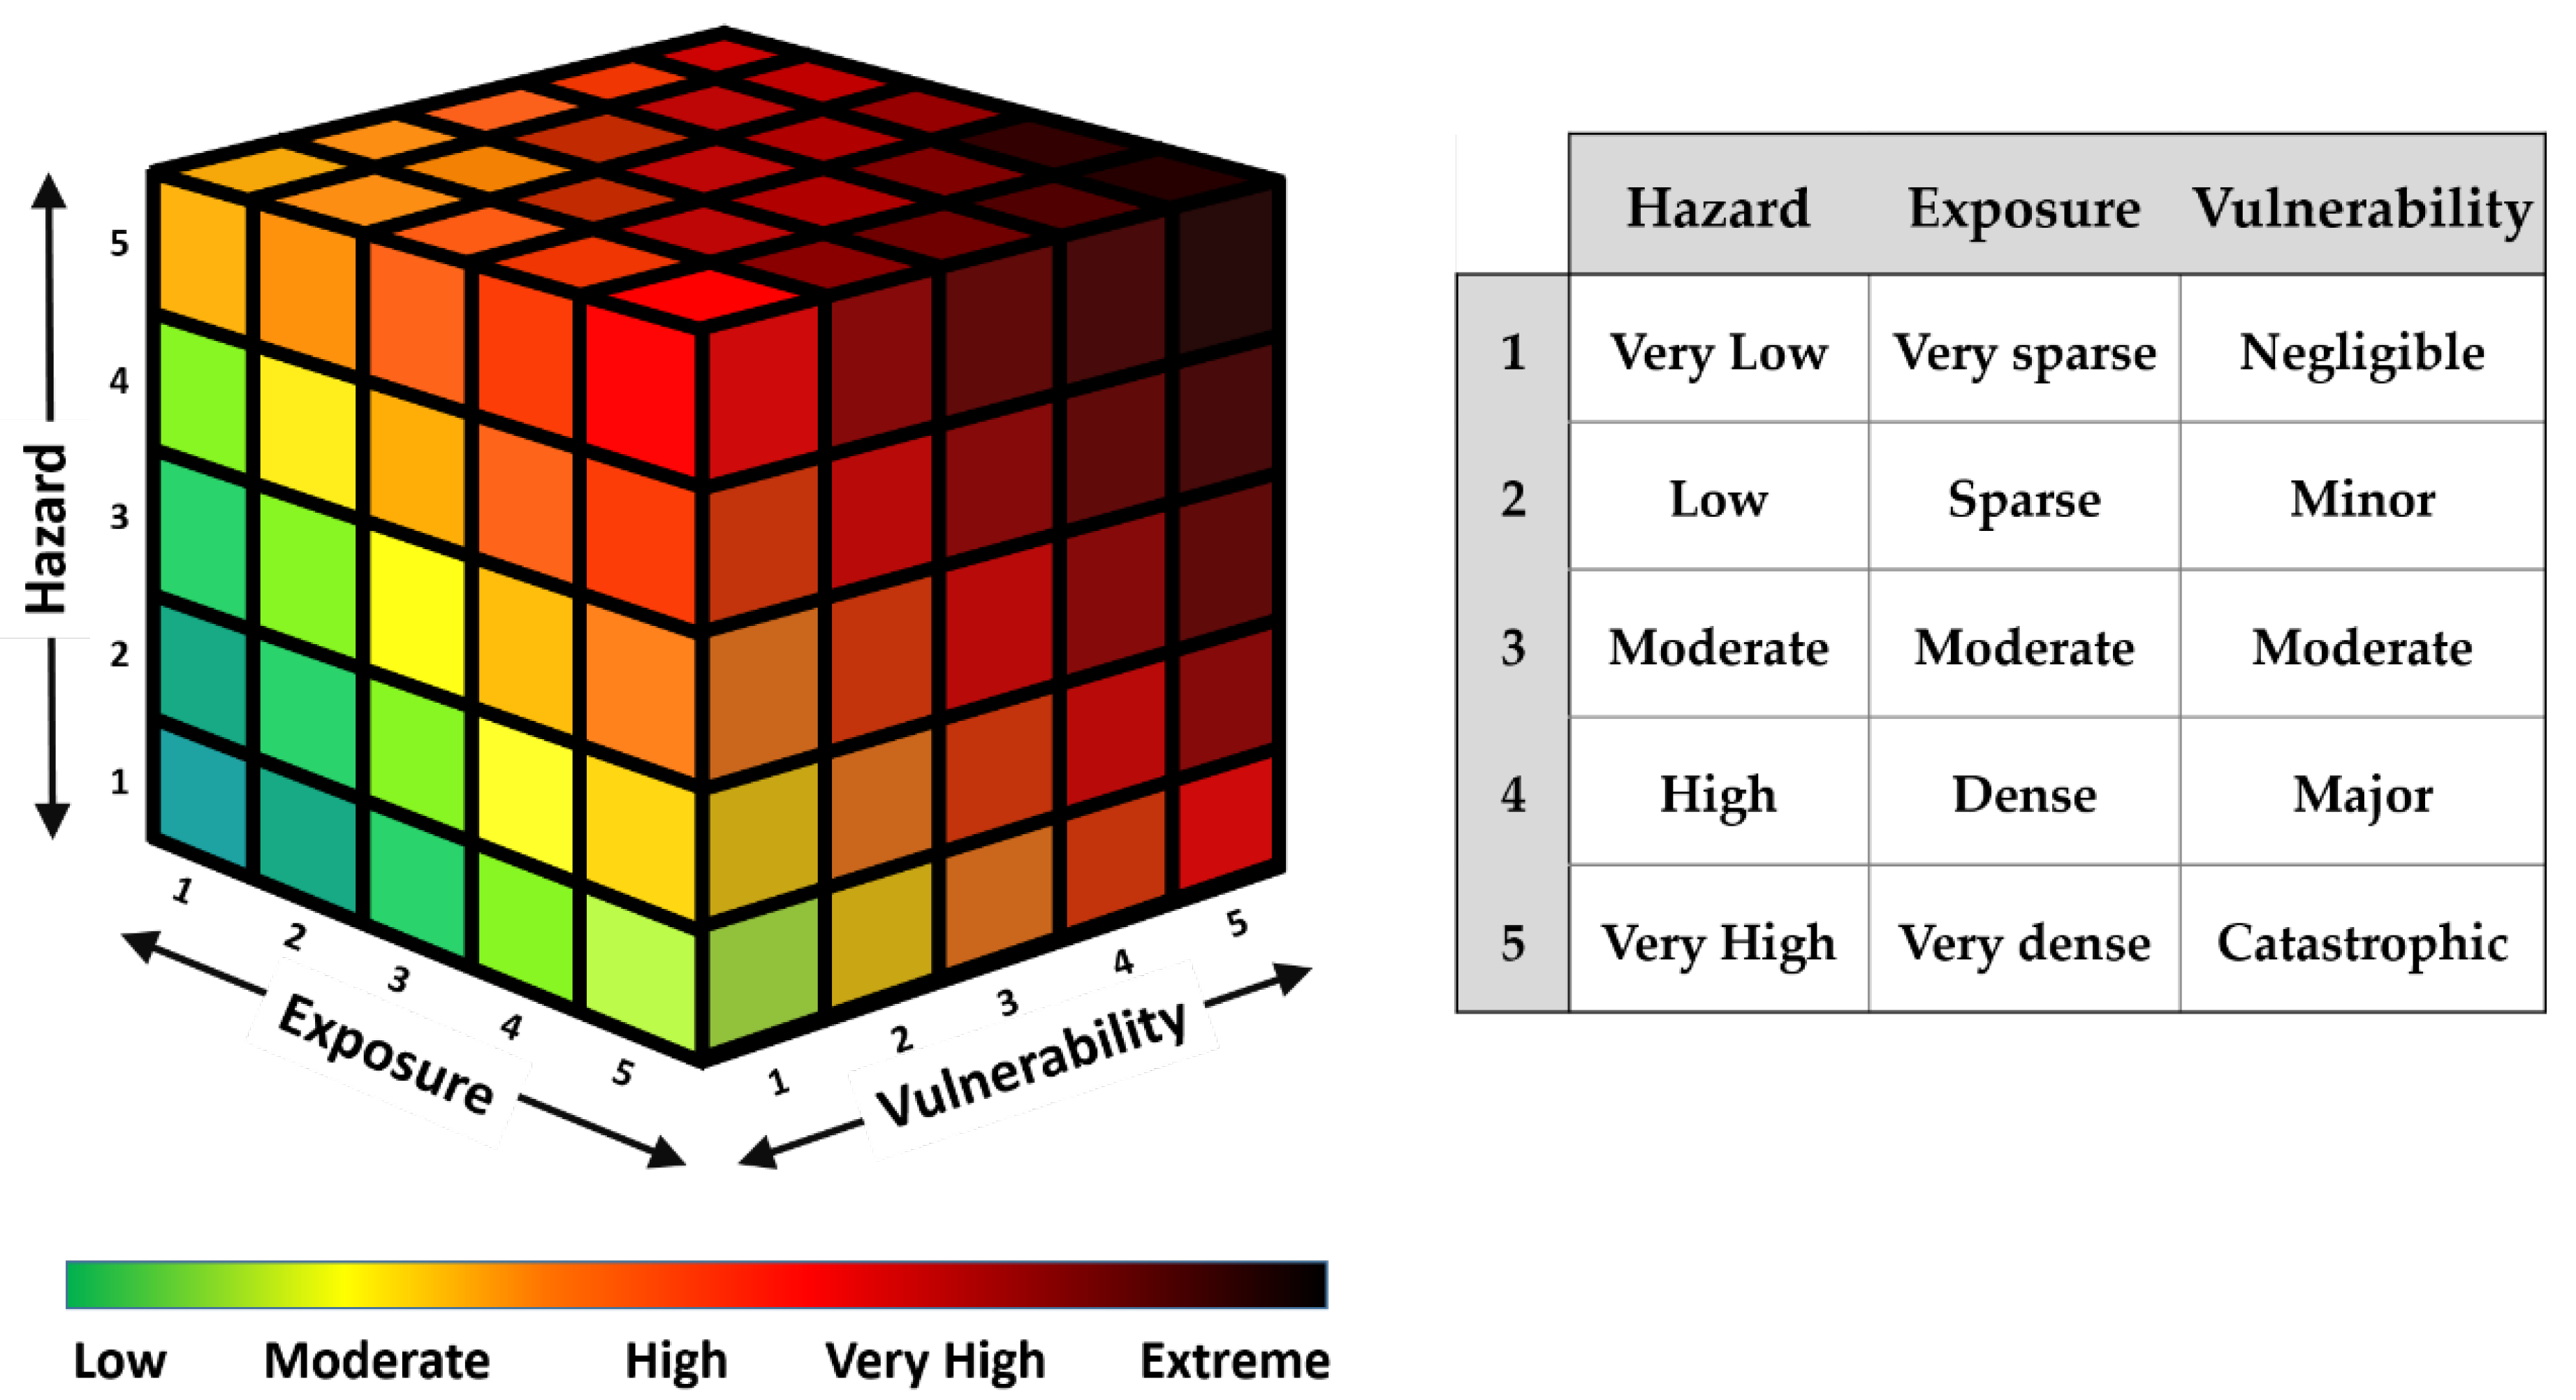
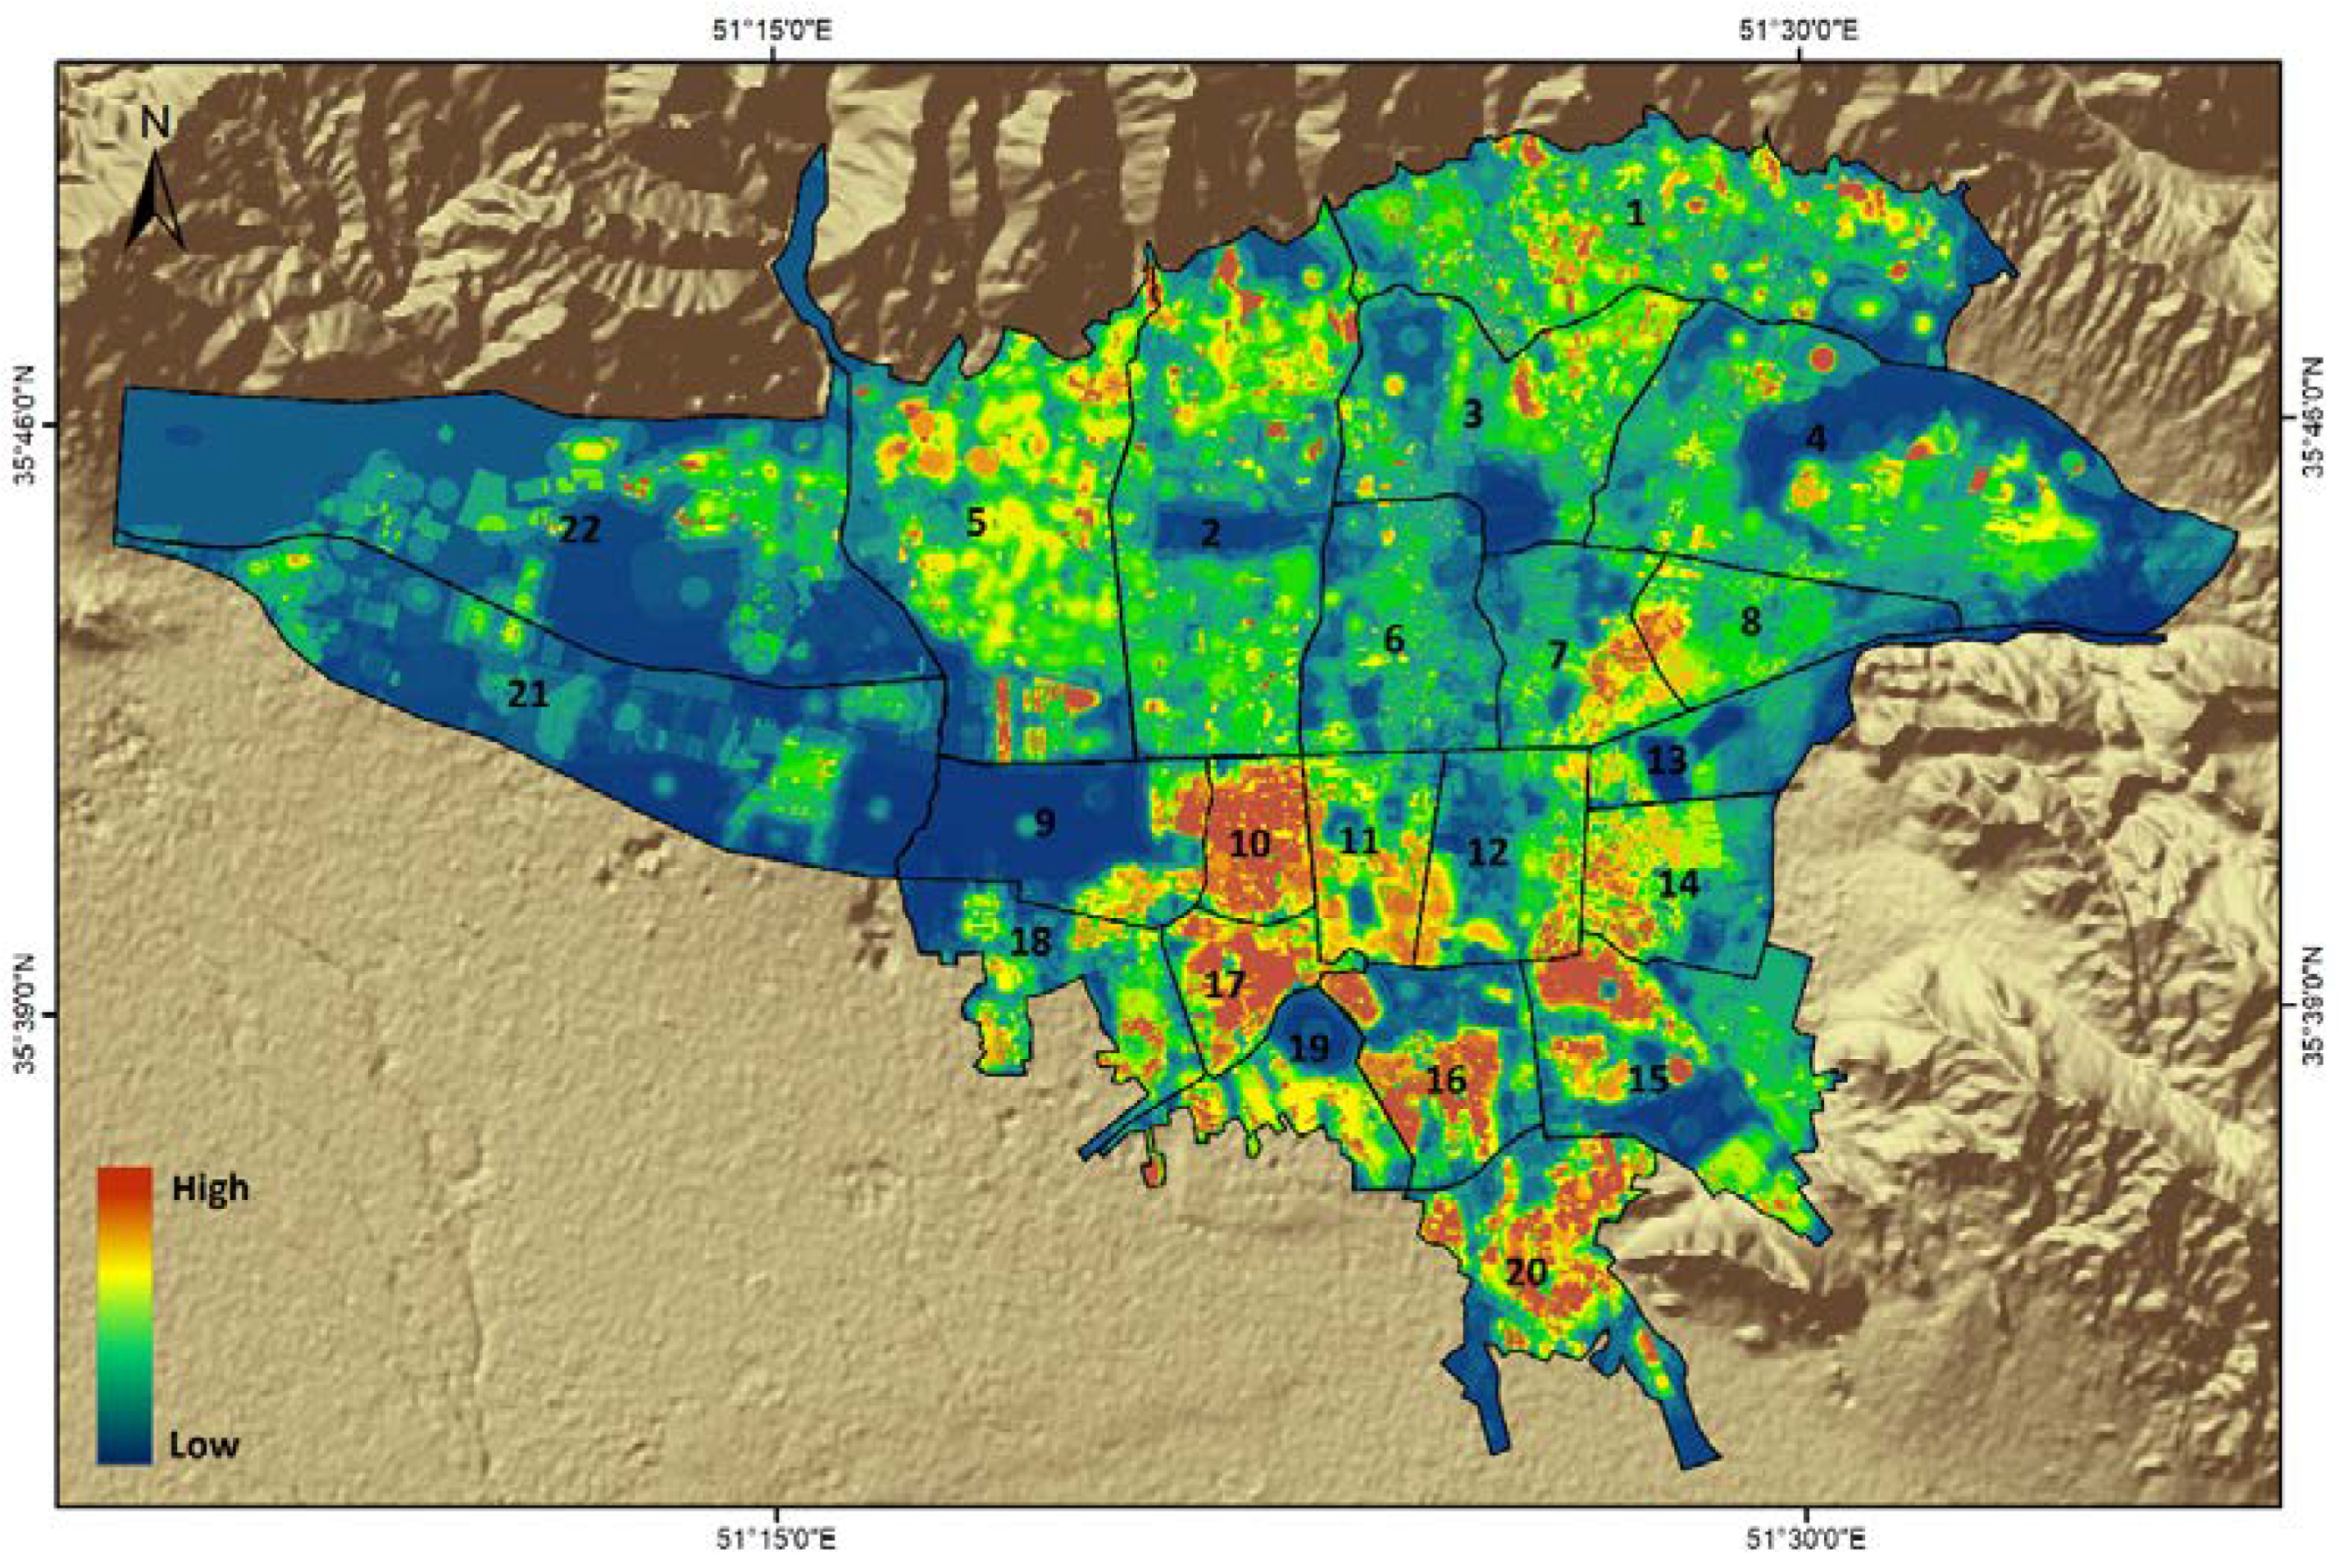
- The overall risk map, which is depicted as a result of the combination of hazard, exposure and vulnerability maps, represents an estimate of risk distribution in Tehran. It generally indicates that the southern half of the city has a higher risk than the northern half. Yet the amount of risk should not be underestimated in other areas, especially the northwest parts (such as district no. 5 and 22) where are home to the North Tehran fault and also under rapid urban expansion and development. A comparison between our study with a previous physical-socioeconomic risk assessment study in Tehran [94] indicates that the previous study [94] ranks districts no. 15, 20, 12, 16, 18, and 11 of Tehran as the top regions in terms of physical risk, while our results suggest that districts no. 10, 17, 20, 16, 15, and 11 contain the highest risk. In general, the results show some similarities, and the discrepancies originate from the difference in input data and the adopted methodologies. For example, in the previous study [94], a scenario-based seismic hazard only corresponding to earthquake occurrence on the Ray fault in south Tehran is considered, while in this study, we have adopted a PSHA analysis considering all surrounding major faults, site response considerations, as well as rupture width zones. Consequently, the results of our study provide a useful basis not only for understanding earthquake risk in Tehran, but also for prioritizing seismic risk reduction measures and increasing resilience in this megacity.
Author Contributions
Funding
Acknowledgments
Conflicts of Interest
References
- Munich Reinsurance Company MunichRe, NatCatSERVICE Analysis Tool, Natural Loss Events 1980–2018. Available online: https://natcatservice.munichre.com/ (accessed on 1 April 2020).
- Swiss Reinsurance Company. SwissRe, Sigma Research. Natural Catastrophes 1990–2018. Available online: https://sigma-explorer.com/ (accessed on 1 April 2020).
- Centre for Research on the Epidemiology of Disasters (CRED). EM-DAT. The International Disaster Database. Available online: https://www.emdat.be/ (accessed on 1 April 2020).
- OECD. Financial Management of Earthquake Risk; Organisation for Economic Co-operation and Development (OECD): Paris, France, 2018. [Google Scholar]
- UNDRR. Sendai Framework for Disaster Risk Reduction 2015–2030; United Nations Office for Disaster Risk Reduction (UNDRR): Geneva, Switzerland, 2015. [Google Scholar]
- UN. Transforming Our World: The 2030 Agenda for Sustainable Development; United Nations (UN): Geneva, Switzerland, 2015. [Google Scholar]
- CRED; UNISDR. Economic Losses, Poverty and Disasters 1998–2017; The Centre for Research on the Epidemiology of Disasters (CRED): Brussels, Belgium, 2018. [Google Scholar]
- Silva, V.; Amo-Oduro, D.; Calderon, A.; Costa, C.; Dabbeek, J.; Despotaki, V.; Martins, L.; Pagani, M.; Rao, A.; Simionato, M.; et al. Development of a global seismic risk model. Earthq. Spectra 2020. [Google Scholar] [CrossRef]
- Silva, V.; Pagani, M.; Schneider, J.; Henshaw, P. Assessing Seismic Hazard and Risk Globally for an Earthquake Resilient World–Contributing Paper to GAR 2019; Global Earthquake Model Foundation: Pavia, Italy, 2019. [Google Scholar]
- Silva, V.; AmoOduro, D.; Calderon, A.; Dabbeek, J.; Despotaki, V.; Martins, L.; Rao, A.; Simionato, M.; Vigano, D.; Yepes, C.; et al. Global Earthquake Model (GEM) Risk Map; Global Earthquake Model Foundation: Pavia, Italy, 2018. [Google Scholar]
- UNDRR. Proposed Updated Terminology on Disaster Risk Reduction: A Technical Review; The United Nations Office for Disaster Risk Reduction (UNDRR): Geneva, Switzerland, 2015. [Google Scholar]
- UN. Open-Ended Intergovernmental Expert Working Group on Indicators and Terminology Relating to Disaster Risk Reduction (OIEWG); United Nations General Assembly: New York, NY, USA, 2016. [Google Scholar]
- UNDRR. Global Assessment Report on Disaster Risk Reduction (GAR) 2019; United Nations Office for Disaster Risk Reduction (UNDRR): Geneva, Switzerland, 2019. [Google Scholar]
- Faravelli, M.; Borzi, B.; Wenzel, H.; Herrmann, M.; Zechar, J. Guidelines for Implementing Real-Time Risk Assessment during Earthquake Emergencies; Network of European Research Infrastructures for Earthquake Risk Assessment and Mitigation (NERA): Zurich, Switzerland, 2014. [Google Scholar]
- PreventionWeb. Available online: https://www.preventionweb.net/risk/disaster-risk (accessed on 1 May 2020).
- Sinadinovski, C.; Edwards, M.; Corby, N.; Milne, M.; Dale, K.; Dhu, T.; Jones, A.; McPherson, A.; Jones, T.; Gray, D.; et al. Earthquake risk. In Natural Hazard Risk in Perth; WA Geoscience Australia: Canberra, Australia, 2005; pp. 143–207. [Google Scholar]
- UNISDR. 2009 UNISDR Terminology on Disaster Risk Reduction; United Nations Office on Disaster Risk Reduction: Geneva, Switzerland, 2009. [Google Scholar]
- Silva, V.; Crowley, H.; Bazzurro, P. Exploring risk-targeted hazard maps for Europe. Earthq. Spectra 2016, 32, 1165–1186. [Google Scholar] [CrossRef]
- Crowley, H.; Rodrigues, D.; Silva, V.; Despotaki, V.; Romao, X.; Castro, M.; Akkar, S.; Hancilar, U.; Pitilakis, K.; Pitilakis, D. Towards a uniform earthquake risk model for Europe. In Proceedings of the 16th European Conference on Earthquake Engineering, Thessaloniki, Greece, 18–21 June 2018. [Google Scholar]
- Crowley, H.; Rodrigues, D.; Silva, V.; Despotaki, V.; Martins, L.; Romão, X.; Castro, J.; Pereira, N.; Pomonis, A.; Lemoine, A.; et al. The European seismic risk model 2020 (ESRM 2020). In Proceedings of the 2nd International Conference on Natural Hazards & Infrastructure, Chania, Crete Island, Greece, 23–26 June 2019. [Google Scholar]
- Crowley, H.; Colombi, M.; Borzi, B.; Faravelli, M.; Onida, M.; Lopez, M.; Polli, D.; Meroni, F.; Pinho, R. A comparison of seismic risk maps for Italy. Bull. Earthq. Eng. 2009, 7, 149–180. [Google Scholar] [CrossRef]
- Silva, V.; Crowley, H.; Varum, H.; Pinho, R. Seismic risk assessment for mainland Portugal. Bull. Earthq. Eng. 2015, 13, 429–457. [Google Scholar] [CrossRef]
- Swiss Seismological Service. Available online: http://www.seismo.ethz.ch/static/webrisktool2016/risktool_EN.html (accessed on 1 April 2020).
- Tyagunov, S.; Stempniewski, L.; Grünthal, G.; Wahlström, R.; Zschau, J. Vulnerability and risk assessment for earthquake prone cities. In Proceedings of the 13th World Conference on Earthquake Engineering (13 WCEE), Vancouver, BC, Canada, 1–6 August 2004. [Google Scholar]
- Marulanda, M.C.; Carreno, M.L.; Cardona, O.D.; Ordaz, M.G.; Barbat, A.H. Probabilistic earthquake risk assessment using CAPRA: Application to the city of Barcelona, Spain. Nat. Hazards 2013, 69, 59–84. [Google Scholar] [CrossRef]
- Karimzadeh, S.; Miyajima, M.; Hassanzadeh, R.; Amiraslanzadeh, R.; Kamel, B. A GIS-based seismic hazard, building vulnerability and human loss assessment for the earthquake scenario in Tabriz. Soil Dyn. Earthq. Eng. 2014, 66, 263–280. [Google Scholar] [CrossRef]
- Sinha, N.; Priyanka, N.; Joshi, P. Using spatial multi-criteria analysis and ranking tool (SMART) in earthquake risk assessment: A case study of Delhi region, India. Geomat. Nat. Hazards Risk 2014, 7, 680–701. [Google Scholar] [CrossRef]
- Pavel, F.; Vacareanu, R. Scenario-based earthquake risk assessment for Bucharest, Romania. Int. J. Disaster Risk Reduct. 2016, 20, 138–144. [Google Scholar] [CrossRef]
- Badawy, A.; Korrat, I.; El-Hadidy, M.; Gaber, H. Update earthquake risk assessment in Cairo, Egypt. J. Seismol. 2017, 21, 571–589. [Google Scholar] [CrossRef]
- Salgado-Gálvez, M.A.; Bernal, G.A.; Zuloaga, D.; Marulanda, M.C.; Cardona, O.-D.; Henao, S. Probabilistic seismic risk assessment in Manizales, Colombia: Quantifying losses for insurance purposes. Int. J. Disaster Risk Sci. 2017, 8, 296–307. [Google Scholar] [CrossRef]
- Giannaraki, G.; Kassaras, I.; Roumelioti, Z.; Kazantzidou-Firtinidou, D.; Ganas, A. Deterministic seismic risk assessment in the city of Aigion (W. Corinth Gulf, Greece) and juxtaposition with real damage due to the 1995 Mw6. 4 earthquake. Bull. Earthq. Eng. 2018, 17, 603–634. [Google Scholar] [CrossRef]
- Hancilar, U.; El-Hussain, I.; Sesetyan, K.; Deif, A.; Cakti, E.; Al-Rawas, G.; Safak, E.; Al-Jabri, K. Earthquake risk assessment for the building inventory of Muscat, Sultanate of Oman. Nat. Hazards 2018, 93, 1419–1434. [Google Scholar] [CrossRef]
- Zhuang, J.; Peng, J.; Zhu, X.; Huang, W. Scenario-based risk assessment of earthquake disaster using slope displacement, PGA, and population density in the guyuan region, China. ISPRS Int. J. Geo-Inf. 2019, 8, 85. [Google Scholar] [CrossRef]
- Shi, Y.; Seeland, K. Using RISKPLAN for Earthquake risk assessment in Sichuan Province, China. Sustainability 2019, 11, 1812. [Google Scholar] [CrossRef]
- Jena, R.; Pradhan, B.; Beydoun, G.; Sofyan, H.; Affan, M. Integrated model for earthquake risk assessment using neural network and analytic hierarchy process: Aceh province, Indonesia. Geosci. Front. 2019. [Google Scholar] [CrossRef]
- Hussain, E.; Elliott, J.R.; Silva, V.; Vilar-Vega, M.; Kane, D. Contrasting seismic risk for Santiago, Chile, from near-field and distant earthquake sources. Nat. Hazards Earth Syst. Sci. 2019. [Google Scholar] [CrossRef]
- Tadjer, K.; Bensaibi, M. Earthquake risk assessment of Blida (Algeria) using GIS. Energy Procedia 2017, 139, 645–650. [Google Scholar] [CrossRef]
- Herrmann, M.; Zechar, J.D.; Wiemer, S. Communicating time-varying seismic risk during an earthquake sequence. Seismol. Res. Lett. 2016, 87, 301–312. [Google Scholar] [CrossRef]
- Gulia, L.; Tormann, T.; Wiemer, S.; Herrmann, M.; Seif, S. Short-term probabilistic earthquake risk assessment considering time-dependent b values. Geophys. Res. Lett. 2016, 43, 1100–1108. [Google Scholar] [CrossRef]
- Zechar, J.D.; Herrmann, M.; van Stiphout, T.; Wiemer, S. Forecasting seismic risk as an earthquake sequence happens. In Earthquake Hazard, Risk and Disasters; Elsevier: Amsterdam, The Netherlands, 2014. [Google Scholar]
- Mili, R.R.; Hosseini, K.A.; Izadkhah, Y.O. Developing a holistic model for earthquake risk assessment and disaster management interventions in urban fabrics. Int. J. Disaster Risk Reduct. 2018, 27, 355–365. [Google Scholar] [CrossRef]
- OpenQuake. Global Earthquake Model (GEM) Foundation. Available online: https://www.globalquakemodel.org/openquake (accessed on 1 April 2020).
- HAZUS-MH. United States Federal Emergency Management Agency (FEMA). Available online: https://www.fema.gov/hazus (accessed on 1 April 2020).
- CAPRA. Comprehensive Approach to Probabilistic Risk Assessment. UNISDR and World Bank. Available online: https://ecapra.org/ (accessed on 1 April 2020).
- INFORM-GRI. Inter-Agency Standing Committee (IASC) and the European Commission. Available online: https://drmkc.jrc.ec.europa.eu/inform-index (accessed on 1 April 2020).
- El Ezz, A.A.; Smirnoff, A.; Nastev, M.; Nollet, M.-J.; McGrath, H. ER2-earthquake: Interactive web-application for urban seismic risk assessment. Int. J. Disaster Risk Reduct. 2019, 34, 326–336. [Google Scholar] [CrossRef]
- EQRM. Earthquake Risk Model; Geoscience Australia: Canberra, Australia, 2005. [Google Scholar]
- Norio, O.; Ye, T.; Kajitani, Y.; Shi, P.; Tatano, H. The 2011 eastern Japan great earthquake disaster: Overview and comments. Int. J. Disaster Risk Sci. 2011, 2, 34–42. [Google Scholar] [CrossRef]
- Şengör, A.; Altiner, D.; Cin, A.; Ustaomer, T.; Hsu, K. Origin and assembly of the Tethyside orogenic collage at the expense of Gondwana Land. Geol. Soc. 1988, 31, 119–181. [Google Scholar] [CrossRef]
- Vernant, P.; Nilforoushan, F.; Hatzfeld, D.; Abbassi, M.; Vigny, C.; Masson, F.; Nankali, H.; Martinod, J.; Ashtiani, A.; Bayer, R.; et al. Present-day crustal deformation and plate kinematics in the Middle East constrained by GPS measurements in Iran and northern Oman. Geophys. J. Int. 2004, 157, 381–398. [Google Scholar] [CrossRef]
- Masson, F.; Lehujeur, M.; Ziegler, Y.; Doubre, C. Strain rate tensor in Iran from a new GPS velocity field. Geophys. J. Int. 2014, 197, 10–21. [Google Scholar] [CrossRef]
- Khorrami, F.; Vernant, P.; Masson, F.; Nilfouroushan, F.; Mousavi, Z.; Nankali, H.; Saadat, S.A.; Walpersdorf, A.; Hosseini, S.; Tavakoli, P.; et al. An up-to-date crustal deformation map of Iran using integrated campaign-mode and permanent GPS velocities. Geophys. J. Int. 2019, 217, 832–843. [Google Scholar] [CrossRef]
- Talebian, M.; Copley, A.; Fattahi, M.; Ghorashi, M.; Jackson, J.; Nazari, H.; Sloan, R.; Walker, R. Active faulting within a megacity: The geometry and slip rate of the Pardisan thrust in central Tehran, Iran. Geophys. J. Int. 2016, 207, 1688–1699. [Google Scholar] [CrossRef]
- Hessami, K.; Jamali, F. Explanatory notes to the map of major active faults of Iran. J. Seismol. Earthq. Eng. 2006, 8, 1–11. [Google Scholar]
- Ambraseys, N.N.; Melville, C.P. A History of Persian Earthquakes; Cambridge University Press: Cambridge, UK, 1982. [Google Scholar]
- Berberian, M.; Yeats, R.S. Patterns of historical earthquake rupture in the Iranian Plateau. Bull. Seismol. Soc. Am. 1999, 89, 120–139. [Google Scholar]
- Ritz, J.F.; Nazari, H.; Balescu, S.; Lamothe, M.; Salamati, R.; Ghassemi, A.; Shafei, A.; Ghorashi, M.; Saidi, A. Paleoearthquakes of the past 30,000 years along the North Tehran Fault (Iran). J. Geophys. Res. Solid Earth 2012, 117. [Google Scholar] [CrossRef]
- Azad, S.S.; Ritz, J.-F.; Abbassi, M.R. Left-lateral active deformation along the Mosha–North Tehran fault system (Iran): Morphotectonics and paleoseismological investigations. Tectonophysics 2011, 497, 1–14. [Google Scholar] [CrossRef]
- Ghassemi, M.R.; Fattahi, M.; Landgraf, A.; Ahmadi, M.; Ballato, P.; Tabatabaei, S.H. Kinematic links between the Eastern Mosha Fault and the North Tehran Fault, Alborz range, northern Iran. Tectonophysics 2014, 622, 81–95. [Google Scholar] [CrossRef]
- Nazari, H.; Ritz, J.-F.; Salamati, R.; Shafei, A.; Ghassemi, A.; Michelot, J.-L.; Massault, M.; Ghorashi, M. Morphological and palaeoseismological analysis along the Taleghan fault (Central Alborz, Iran). Geophys. J. Int. 2009, 178, 1028–1041. [Google Scholar] [CrossRef]
- Nazari, H.; Ritz, J.F.; Salamati, R.; Shahidi, A.; Habibi, H.; Ghorashi, M.; Bavandpur, A.K. Distinguishing between fault scarps and shorelines: The question of the nature of the Kahrizak, North Rey and South Rey features in the Tehran plain (Iran). Terra Nova 2010, 22, 227–237. [Google Scholar] [CrossRef]
- Niri, T.M.; Nazari, H.; Qarashi, M.; Talebian, M. Paleoseimology study on Pishva fault (South Tehran), Iran. In EGU General Assembly Conference Abstracts; European Geosciences Union (EGU): Munich, Germany, 2010; p. 1511. [Google Scholar]
- Zare, M.; Amini, H.; Yazdi, P.; Sesetyan, K.; Demircioglu, M.B.; Kalafat, D.; Erdik, M.; Giardini, D.; Khan, M.A.; Tsereteli, N. Recent developments of the Middle East catalog. J. Seismol. 2014, 18, 749–772. [Google Scholar] [CrossRef]
- Berberian, M.; Yeats, R.S. Tehran: An earthquake time bomb. In Tectonic Evolution, Collision, and Seismicity of Southwest Asia: In Honor of Manuel Berberian’s Forty-Five Years of Research Contributions; The Geological Society of America: Boulder, CO, USA, 2017. [Google Scholar]
- Field, E.H.; Jordan, T.H. Time-dependent renewal-model probabilities when date of last earthquake is unknown. Bull. Seismol. Soc. Am. 2015, 105, 459–463. [Google Scholar] [CrossRef]
- Papanikolaοu, I.D.; Roberts, G.P.; Deligiannakis, G.; Sakellariou, A.; Vassilakis, E. The Sparta Fault, Southern Greece: From segmentation and tectonic geomorphology to seismic hazard mapping and time dependent probabilities. Tectonophysics 2013, 597, 85–105. [Google Scholar] [CrossRef]
- Rieben, H. The geology of the Teheran plain. Am. J. Sci. 1955, 253, 617–639. [Google Scholar] [CrossRef]
- Cornell, C.A. Engineering seismic risk analysis. Bull. Seismol. Soc. Am. 1968, 58, 1583–1606. [Google Scholar]
- McGuire, R.K. Probabilistic seismic hazard analysis and design earthquakes: Closing the loop. Bull. Seismol. Soc. Am. 1995, 85, 1275–1284. [Google Scholar]
- Danciu, L.; Şeşetyan, K.; Demircioglu, M.; Gülen, L.; Zare, M.; Basili, R.; Elias, A.; Adamia, S.; Tsereteli, N.; Yalçın, H.; et al. The 2014 earthquake model of the Middle East: Seismogenic sources. Bull. Earthq. Eng. 2018, 16, 3465–3496. [Google Scholar] [CrossRef]
- Kijko, A.; Sellevoll, M.A. Estimation of earthquake hazard parameters from incomplete data files. Part II. Incorporation of magnitude heterogeneity. Bull. Seismol. Soc. Am. 1992, 82, 120–134. [Google Scholar]
- Kijko, A.; Sellevoll, M.A. Estimation of earthquake hazard parameters for incomplete and uncertain data files. Nat. Hazards 1990, 3, 1–13. [Google Scholar] [CrossRef]
- Kijko, A.; Smit, A.; Sellevoll, M.A. Estimation of earthquake hazard parameters from incomplete data files. Part III. Incorporation of uncertainty of earthquake-occurrence model. Bull. Seismol. Soc. Am. 2016, 106, 1210–1222. [Google Scholar] [CrossRef]
- Gutenberg, B.; Richter, C.F. Frequency of earthquakes in California. Bull. Seismol. Soc. Am. 1944, 34, 185–188. [Google Scholar]
- Zare, M. Contribution À L’étude Des Mouvements Forts En Iran: Du Catalogue Aux Lois D’atténuation. Ph.D. Thesis, Joseph Fourier University, Grenoble, Rhône-Alpes, France, 1999. [Google Scholar]
- Wells, D.L.; Coppersmith, K.J. New empirical relationships among magnitude, rupture length, rupture width, rupture area, and surface displacement. Bull. Seismol. Soc. Am. 1994, 84, 974–1002. [Google Scholar]
- Ambraseys, N.; Douglas, J.; Sarma, S.; Smit, P. Equations for the estimation of strong ground motions from shallow crustal earthquakes using data from Europe and the Middle East: Horizontal peak ground acceleration and spectral acceleration. Bull. Earthq. Eng. 2005, 3, 1–53. [Google Scholar] [CrossRef]
- Boore, D.M.; Atkinson, G.M. Ground-motion prediction equations for the average horizontal component of PGA, PGV, and 5%-damped PSA at spectral periods between 0.01 s and 10.0 s. Earthq. Spectra 2008, 24, 99–138. [Google Scholar] [CrossRef]
- Akkar, S.; Bommer, J.J. Empirical equations for the prediction of PGA, PGV, and spectral accelerations in Europe, the Mediterranean region, and the Middle East. Seismol. Res. Lett. 2010, 81, 195–206. [Google Scholar] [CrossRef]
- Gholipour, Y.; Bozorgnia, Y.; Rahnama, M.; Berberian, M.; Shojataheri, J. Probabilistic seismic hazard analysis, phase I–greater Tehran regions. In Final Report; Faculty of Engineering, University of Tehran: Tehran, Iran, 2008. [Google Scholar]
- Zare, M. Construction and Earthquake hazard in North Tabriz Fault and earthquake fault width in Iran. J. Seismol. Earthq. Eng. 2001, 2, 46–57. [Google Scholar]
- Teran, O.J.; Fletcher, J.M.; Oskin, M.E.; Rockwell, T.K.; Hudnut, K.W.; Spelz, R.M.; Akciz, S.O.; Hernandez-Flores, A.P.; Morelan, A.E. Geologic and structural controls on rupture zone fabric: A field-based study of the 2010 Mw 7.2 El Mayor–Cucapah earthquake surface rupture. Geosphere 2015, 11, 899–920. [Google Scholar] [CrossRef]
- Sibson, R.H. Thickness of the seismic slip zone. Bull. Seismol. Soc. Am. 2003, 93, 1169–1178. [Google Scholar] [CrossRef]
- Boncio, P.; Liberi, F.; Caldarella, M.; Nurminen, F.-C. Width of surface rupture zone for thrust earthquakes: Implications for earthquake fault zoning. Nat. Hazards Earth Syst. Sci. 2018, 18. [Google Scholar] [CrossRef]
- Center for International Earth Science Information Network (CIESIN). Gridded Population of the World, Version 4 (GPWv4): Population Count, Revision 11; NASA Socioeconomic Data and Applications Center: Palisades, NY, USA, 2018; Available online: https://doi.org/10.7927/H4JW8BX5 (accessed on 1 April 2020).
- Center for International Earth Science Information Network (CIESIN). Global Rural-Urban Mapping Project, Version 1 (GRUMPv1): Urban Extents Grid; Columbia University: New York, NY, USA, 2011. [Google Scholar]
- Bright, E.A.; Rose, A.N.; Urban, M.L.; McKee, J. LandScan 2017 High-Resolution Global Population Data Set; Oak Ridge National Lab. (ORNL): Oak Ridge, TN, USA, 2018. [Google Scholar]
- Lwin, K.; Murayama, Y. A GIS approach to estimation of building population for micro-spatial analysis. Trans. GIS 2009, 13, 401–414. [Google Scholar] [CrossRef]
- SCI. National Population and Housing Census; Statistical Center of Iran: Tehran, Iran, 2016. [Google Scholar]
- Rules and Regulations of the City; Supreme Council of Planning and Architecture Secretariat, Ministry of Roads and Urban Development: Tehran, Iran, 2006.
- Amini, K.; Hosseini, M.; Jafari, M.K.; Hosseinioun, S. Recognition of vulnerable urban fabrics in earthquake zones: A case study of the Tehran metropolitan area. J. Seismol. Earthq. Eng. 2009, 10, 175–187. [Google Scholar]
- Mansouri, B.; Ghafory-Ashtiany, M.; Amini-Hosseini, K.; Nourjou, R.; Mousavi, M. Building seismic loss model for Tehran. Earthq. Spectra 2010, 26, 153–168. [Google Scholar] [CrossRef]
- Firuzi, E.; Ansari, A.; Hosseini, K.A.; Rashidabadi, M. Probabilistic earthquake loss model for residential buildings in Tehran, Iran to quantify annualized earthquake loss. Bull. Earthq. Eng. 2019, 17, 2383–2406. [Google Scholar] [CrossRef]
- Hajibabaee, M.; Amini-Hosseini, K.; Ghayamghamian, M. Earthquake risk assessment in urban fabrics based on physical, socioeconomic and response capacity parameters (a case study: Tehran city). Nat. Hazards 2014, 74, 2229–2250. [Google Scholar] [CrossRef]


| Zone | LF (km) | LR (km) | Mmin * | Mmax Obs [75,76] | Selected Mmax | β | λMmin | ||
|---|---|---|---|---|---|---|---|---|---|
| 1 | >150 | 55.5 | 4.5 | 7.4 | 7.3 | 7.1 | 7.4 | 2.06 | 0.22 |
| 2 | 120 | 44.4 | 4.5 | 7.6 | 7.1 | 7.0 | 7.6 | 2.07 | 0.07 |
| 3 | 200 | 74 | 4.5 | 7.7 | 7.6 | 7.2 | 7.7 | 2.15 | 0.12 |
| 4 | 110 | 40.7 | 4.5 | 7.2 | 7.0 | 6.9 | 7.2 | 2.12 | 0.19 |
| 5 | 80 | 29.6 | 4.5 | 7.5 | 6.7 | 6.8 | 7.5 | 2.14 | 0.11 |
| 6 | 165 | 61.05 | 4.5 | 5.4 | 7.4 | 7.2 | 7.4 | 2.22 | 0.14 |
| 7 | 90 | 33.3 | 4.5 | 6.4 | 6.9 | 6.8 | 6.9 | 2.33 | 0.11 |
| 8 | 72 | 26.64 | 4.5 | 7.1 | 6.6 | 6.7 | 7.1 | 2.22 | 0.14 |
| 9 | 113 | 41.81 | 4.5 | 6.2 | 7.1 | 7.0 | 7.1 | 2.32 | 0.14 |
| Fault Zones | Fault Length (km) | Surface Rupture Length (Km) | Surface Rupture Width (km) | |
|---|---|---|---|---|
| Major Faults | North Tehran | 130 | 48.1 | 3.0 |
| Sorkhe Hesar-Tarasht | 50 | 18.5 | 2.1 | |
| Eyvanekey-Rey | 100 | 37.0 | 2.7 | |
| Kahrizak-Pishva | 75 | 27.7 | 2.5 | |
| Medium Faults | 5–15 | 3.70 | 1.4 | |
| Minor Faults | <5 | 0.92 | 1.0 | |
| GIS Layers | Classes | Vulnerability Weight * |
|---|---|---|
| Land Use | Vegetation or open areas Low urban density High urban density | 1 2 3 |
| Urban Fabric | Normal Unstable Worn–out | 1 2 3 |
| Building Height | <10 floors 10–20 floors 20 floors < | 1 2 3 |
| Occupancy | Residential Commercial Industrial | 1 2 3 |
| Structure Type (for 10–storey < buildings) | Reinforced concrete Steel or Concrete Semi-steel and masonry | 1 2 3 |
| Construction Age (for 10–storey < buildings) | <20 years 20–40 years 40 years < | 1 2 3 |
| Vicinity to Critical Infrastructures (hospitals and medical centers, highways, and fire stations) | Near (<1 km) Medium (1–2 km) Far (2 km <) | 1 2 3 |
© 2020 by the authors. Licensee MDPI, Basel, Switzerland. This article is an open access article distributed under the terms and conditions of the Creative Commons Attribution (CC BY) license (http://creativecommons.org/licenses/by/4.0/).
Share and Cite
Kamranzad, F.; Memarian, H.; Zare, M. Earthquake Risk Assessment for Tehran, Iran. ISPRS Int. J. Geo-Inf. 2020, 9, 430. https://doi.org/10.3390/ijgi9070430
Kamranzad F, Memarian H, Zare M. Earthquake Risk Assessment for Tehran, Iran. ISPRS International Journal of Geo-Information. 2020; 9(7):430. https://doi.org/10.3390/ijgi9070430
Chicago/Turabian StyleKamranzad, Farnaz, Hossein Memarian, and Mehdi Zare. 2020. "Earthquake Risk Assessment for Tehran, Iran" ISPRS International Journal of Geo-Information 9, no. 7: 430. https://doi.org/10.3390/ijgi9070430
APA StyleKamranzad, F., Memarian, H., & Zare, M. (2020). Earthquake Risk Assessment for Tehran, Iran. ISPRS International Journal of Geo-Information, 9(7), 430. https://doi.org/10.3390/ijgi9070430


