Article

Earth Observation and Artificial Intelligence for Improving Safety to Navigation in Canada Low-Impact Shipping Corridors

Canadian Hydrographic Service, 200 Kent Street, Ottawa, ON K1A 0E6, Canada
*
Author to whom correspondence should be addressed.
ISPRS Int. J. Geo-Inf. 2020, 9(6), 383; https://doi.org/10.3390/ijgi9060383
Submission received: 10 April 2020 / Revised: 30 May 2020 / Accepted: 5 June 2020 / Published: 10 June 2020
(This article belongs to the Special Issue Using GIS to Improve (Public) Safety and Security)

Abstract

:
In 2014, through the World-Class Tanker Safety System (WCTSS) initiative, the Government of Canada launched the Northern Marine Transportation Corridors (NMTC) concept. The corridors were created as a strategic framework to guide Federal investments in marine transportation in the Arctic. With new government investment, under the Oceans Protection Plan (OPP), the corridors initiative, known as the Northern Low-Impact Shipping Corridors, will continue to be developed. Since 2016, the Canadian Hydrographic Service (CHS) has been using the corridors as a key layer in a geographic information system (GIS) model known as the CHS Priority Planning Tool (CPPT). The CPPT helps CHS prioritize its survey and charting efforts in Canada’s key traffic areas. Even with these latest efforts, important gaps in the surveys still need to be filled in order to cover the Canadian waterways. To help further develop the safety to navigation and improve survey mission planning, CHS has also been exploring new technologies within remote sensing. Under the Government Related Initiatives Program (GRIP) of the Canadian Space Agency (CSA), CHS has been investigating the potential use of Earth observation (EO) data to identify potential hazards to navigation that are not currently charted on CHS products. Through visual interpretation of satellite imagery, and automatic detection using artificial intelligence (AI), CHS identified several potential hazards to navigation that had previously gone uncharted. As a result, five notices to mariners (NTMs) were issued and the corresponding updates were applied to the charts. In this study, two AI approaches are explored using deep learning and machine learning techniques: the convolution neural network (CNN) and random forest (RF) classification. The study investigates the effectiveness of the two models in identifying shoals in Sentinel-2 and WorldView-2 satellite imagery. The results show that both CNN and RF models can detect shoals with accuracies ranging between 79 and 94% over two study sites; however, WorldView-2 images deliver results with higher accuracy and lower omission errors. The high processing times of using high-resolution imagery and training a deep learning model may not be necessary in order to quickly scan images for shoals; but training a CNN model with a large training set may lead to faster processing times without the need to train individual images.

1. Introduction

The Government of Canada announced in its budget of 2012, the World-Class Tanker Safety System Initiative (WCTSS), to strengthen Canada’s regime for ship-source oil spill prevention, preparedness and response [1]. Under this initiative, Fisheries and Oceans Canada (DFO), through the Canadian Coast Guard (CCG), the Canadian Hydrographic Service (CHS) and in collaboration with Transport Canada (TC), was responsible for developing the Northern Low-Impact Shipping Corridors initiative. The work on defining navigational corridors is now continuing under the Oceans Protection Plan (OPP). The corridors were created with the following objectives in mind: to improve marine safety, support responsible shipping, protect Canada’s marine environment, and build stronger partnerships with indigenous and coastal communities [2]. In order to meet the objectives, several factors need to be considered when defining the boundaries of the corridors [3]; within the scope of OPP, the Government of Canada is conducting engagement sessions with Northern communities to ensure their needs and concerns are addressed. Under WCTSS and OPP [1,2], new investments were made to increase safety to navigation in the Canadian Arctic, including fitting CCG vessels with multibeam sonar in order to collect more hydrographic surveys [4]. For prioritizing its survey and charting efforts, CHS developed a geographic information system (GIS) model called the CHS Priority Planning Tool (CPPT) [5]. The CPPT encompasses many GIS data layers, including the corridors, to ensure safety to navigation. Even if significant progress has been made under these initiatives, only 13% of the Canadian Arctic is currently considered to be adequately surveyed. Adequate survey coverage of the corridors sits at 31.5%.
CHS has been investing into alternative technologies that could help improve the safety to navigation. Under the Government Related Initiatives Program (GRIP) of the Canadian Space Agency (CSA), CHS has been investigating the potential of Earth Observation (EO) data for different hydrographic applications. The GRIP project goal is threefold: first, evaluate how different remote sensing techniques could help CHS better meet its mandate and objectives; second, test these techniques in Canadian waters to get a realistic assessment of their accuracy, and finally, integrate the techniques which show an adequate level of reliability into CHS’s operations and products [6]. This paper will focus on the development of an automatic approach towards the detection of hazards to navigation. These hazards are any underwater features, referred to as shoals, which ships should avoid. A visual assessment of the waters within the corridors required consulting various satellite images to determine if shoals were present that are currently not charted. An automatic approach in two study sites tested the effectiveness of shoal detection using a random forest (RF) classification machine learning technique, and a convolutional neural network (CNN) classification deep learning technique.
The random forest (RF) classification technique is a machine learning method often used in satellite remote sensing. This approach uses decision trees based on an ensemble learning technique and is less sensitive to noisy datasets and outliers when compared to other methods such as maximum likelihood, complex Wishart and fuzzy C-mean [7]. RF classification is computationally efficient and independent of the number of trees [8,9]. Studies have highlighted successful RF applications in ecological research where incorporated multi-source data improved classification accuracy considerably [9,10,11,12]. Other advantages of using the RF algorithm include the non-parameterization prerequisite of the training data due to variable importance (VI) which shows the contribution of each input parameter on the classification process. The mean decrease in Gini index (MDGI) of each feature is often used as VI and is calculated by averaging its importance in all considered trees [7].
A neural network (NN) is a deep learning technique which can be used to classify satellite imagery. Neural networks are formed by several layers of algorithms which each define specific features or patterns in the data. Unlike other neural network algorithms, the convolutional neural network (CNN) architecture assumes that the inputs are all images which helps to encode other properties of the architecture. It is best known for its adeptness at visual tasks such as image recognition, object detection, and semantic segmentation. In addition, local connections, shared weights, pooling and use of many layers increases the efficiency of the model, reducing the number of parameters required in the network.
Technological advances in computing power and the abundance of archived data have allowed deep learning techniques to rapidly develop. Many remote sensing applications benefited from the advancement of computational models such as convolutional neural network (CNN) and machine learning using random forest (RF) for enhancing land cover and object identification performances. The idea of CNNs was firstly introduced by [13], improved by [14], and refined and simplified by [15] and [16]. Applying various neural network models is proven to be effective in some ocean remote sensing studies. For example, [17] applied a fully convolutional network (FCN) to the colour-infrared images of the Coastwide Reference Monitoring System dataset in order to detect change of surface water. This was done by generating a difference image between two multi-temporal images and determining optimal threshold values using fuzzy entropy. Results indicated that the proposed method was more effective at detecting water change than traditional methods since it could detect changed areas clearly and remove noise. Another study by [18] classified the water quality of inland lakes using Landsat-8 images with CNNs. The study found that the CNN model outperformed other machine learning methods including support vector machine (SVM) and RF.
There have been other studies that have shown the effectiveness of neural network models with land use and land cover (LULC) classification. A study by [19] compared four different methods: multi-resolution and SVM using object-oriented classification; patch-based CNN; FCN using a model proposed by [20]; and an improved FCN model. Results found that the classification accuracy increased, respectively, for each method on seven different experiments. Another example of a study using a CNN model to classify LULC was completed by [21]. Using a combination of Sentinel-2 and Synthetic Aperture Radar (SAR) data, a CNN model was used to perform a pixel-based classification and applied it to an object-based image analysis (OBIA) by labeling each object with the most frequent land cover category of its pixels. The CNN model outperformed both the SVM and RF classifications.
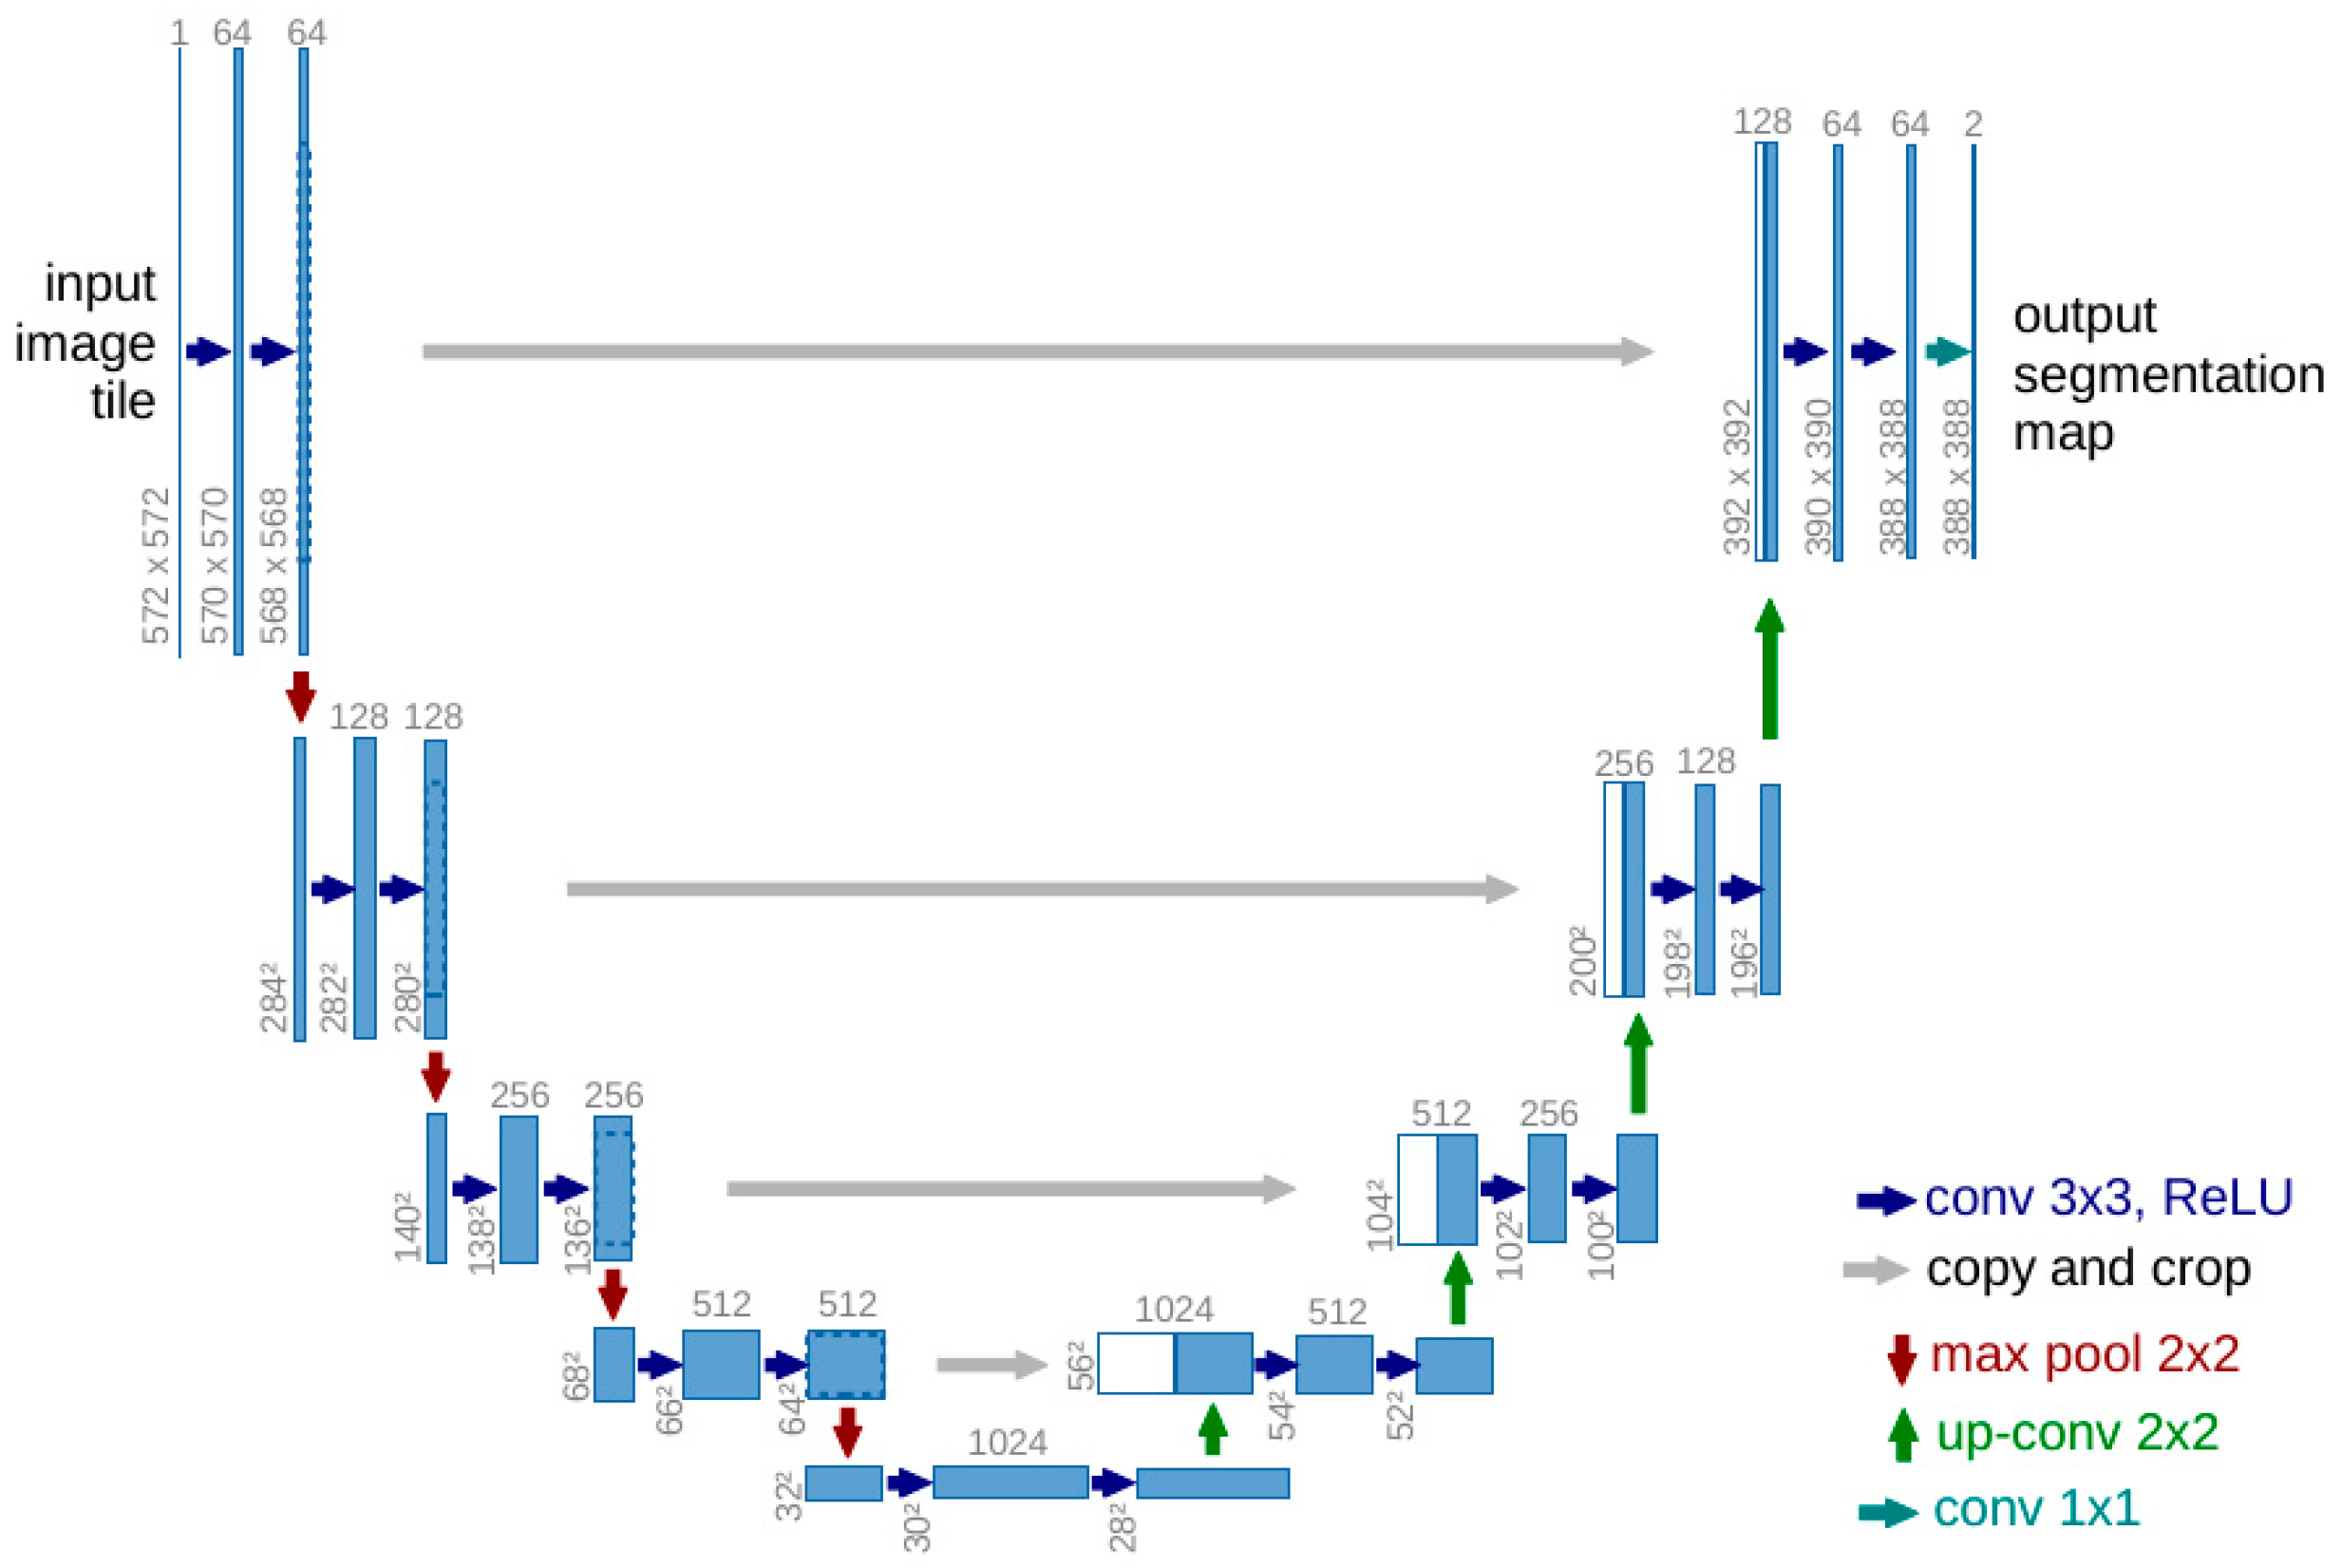
A CNN structure that is commonly used for image segmentation, i.e., pixel-based classification, is a U-Net architecture introduced in 2015 for biomedical image segmentation [22]. U-Net is especially useful when there are low to medium training data present since the algorithm will rotate and mirror image tiles which multiplies the training data by eight. The data can then be further augmented with random 45-degree rotations. The model is structured around convolutional filters and degrades the imagery to different resolutions, allowing detection of structures and textures at different scales [23]. The U-Net algorithm is an encoder-decoder architecture based on FCNs and is trained end-to-end, meaning it accepts an input on one end and produces an output, and is computationally efficient. Although U-Net was designed with classifying bio-medical images in mind, it has been highly effective in classifying satellite images. One study demonstrates this by using U-Net to classify woody vegetation over Queensland, Australia with high-resolution satellite imagery. Less than 0.05% of the area was used for training and the classification produced an overall accuracy of 90% [23]. It has also shown to be effective to classify roads [24] and land cover [25] using satellite imagery.

2. Study Area and Datasets

2.1. Study Area

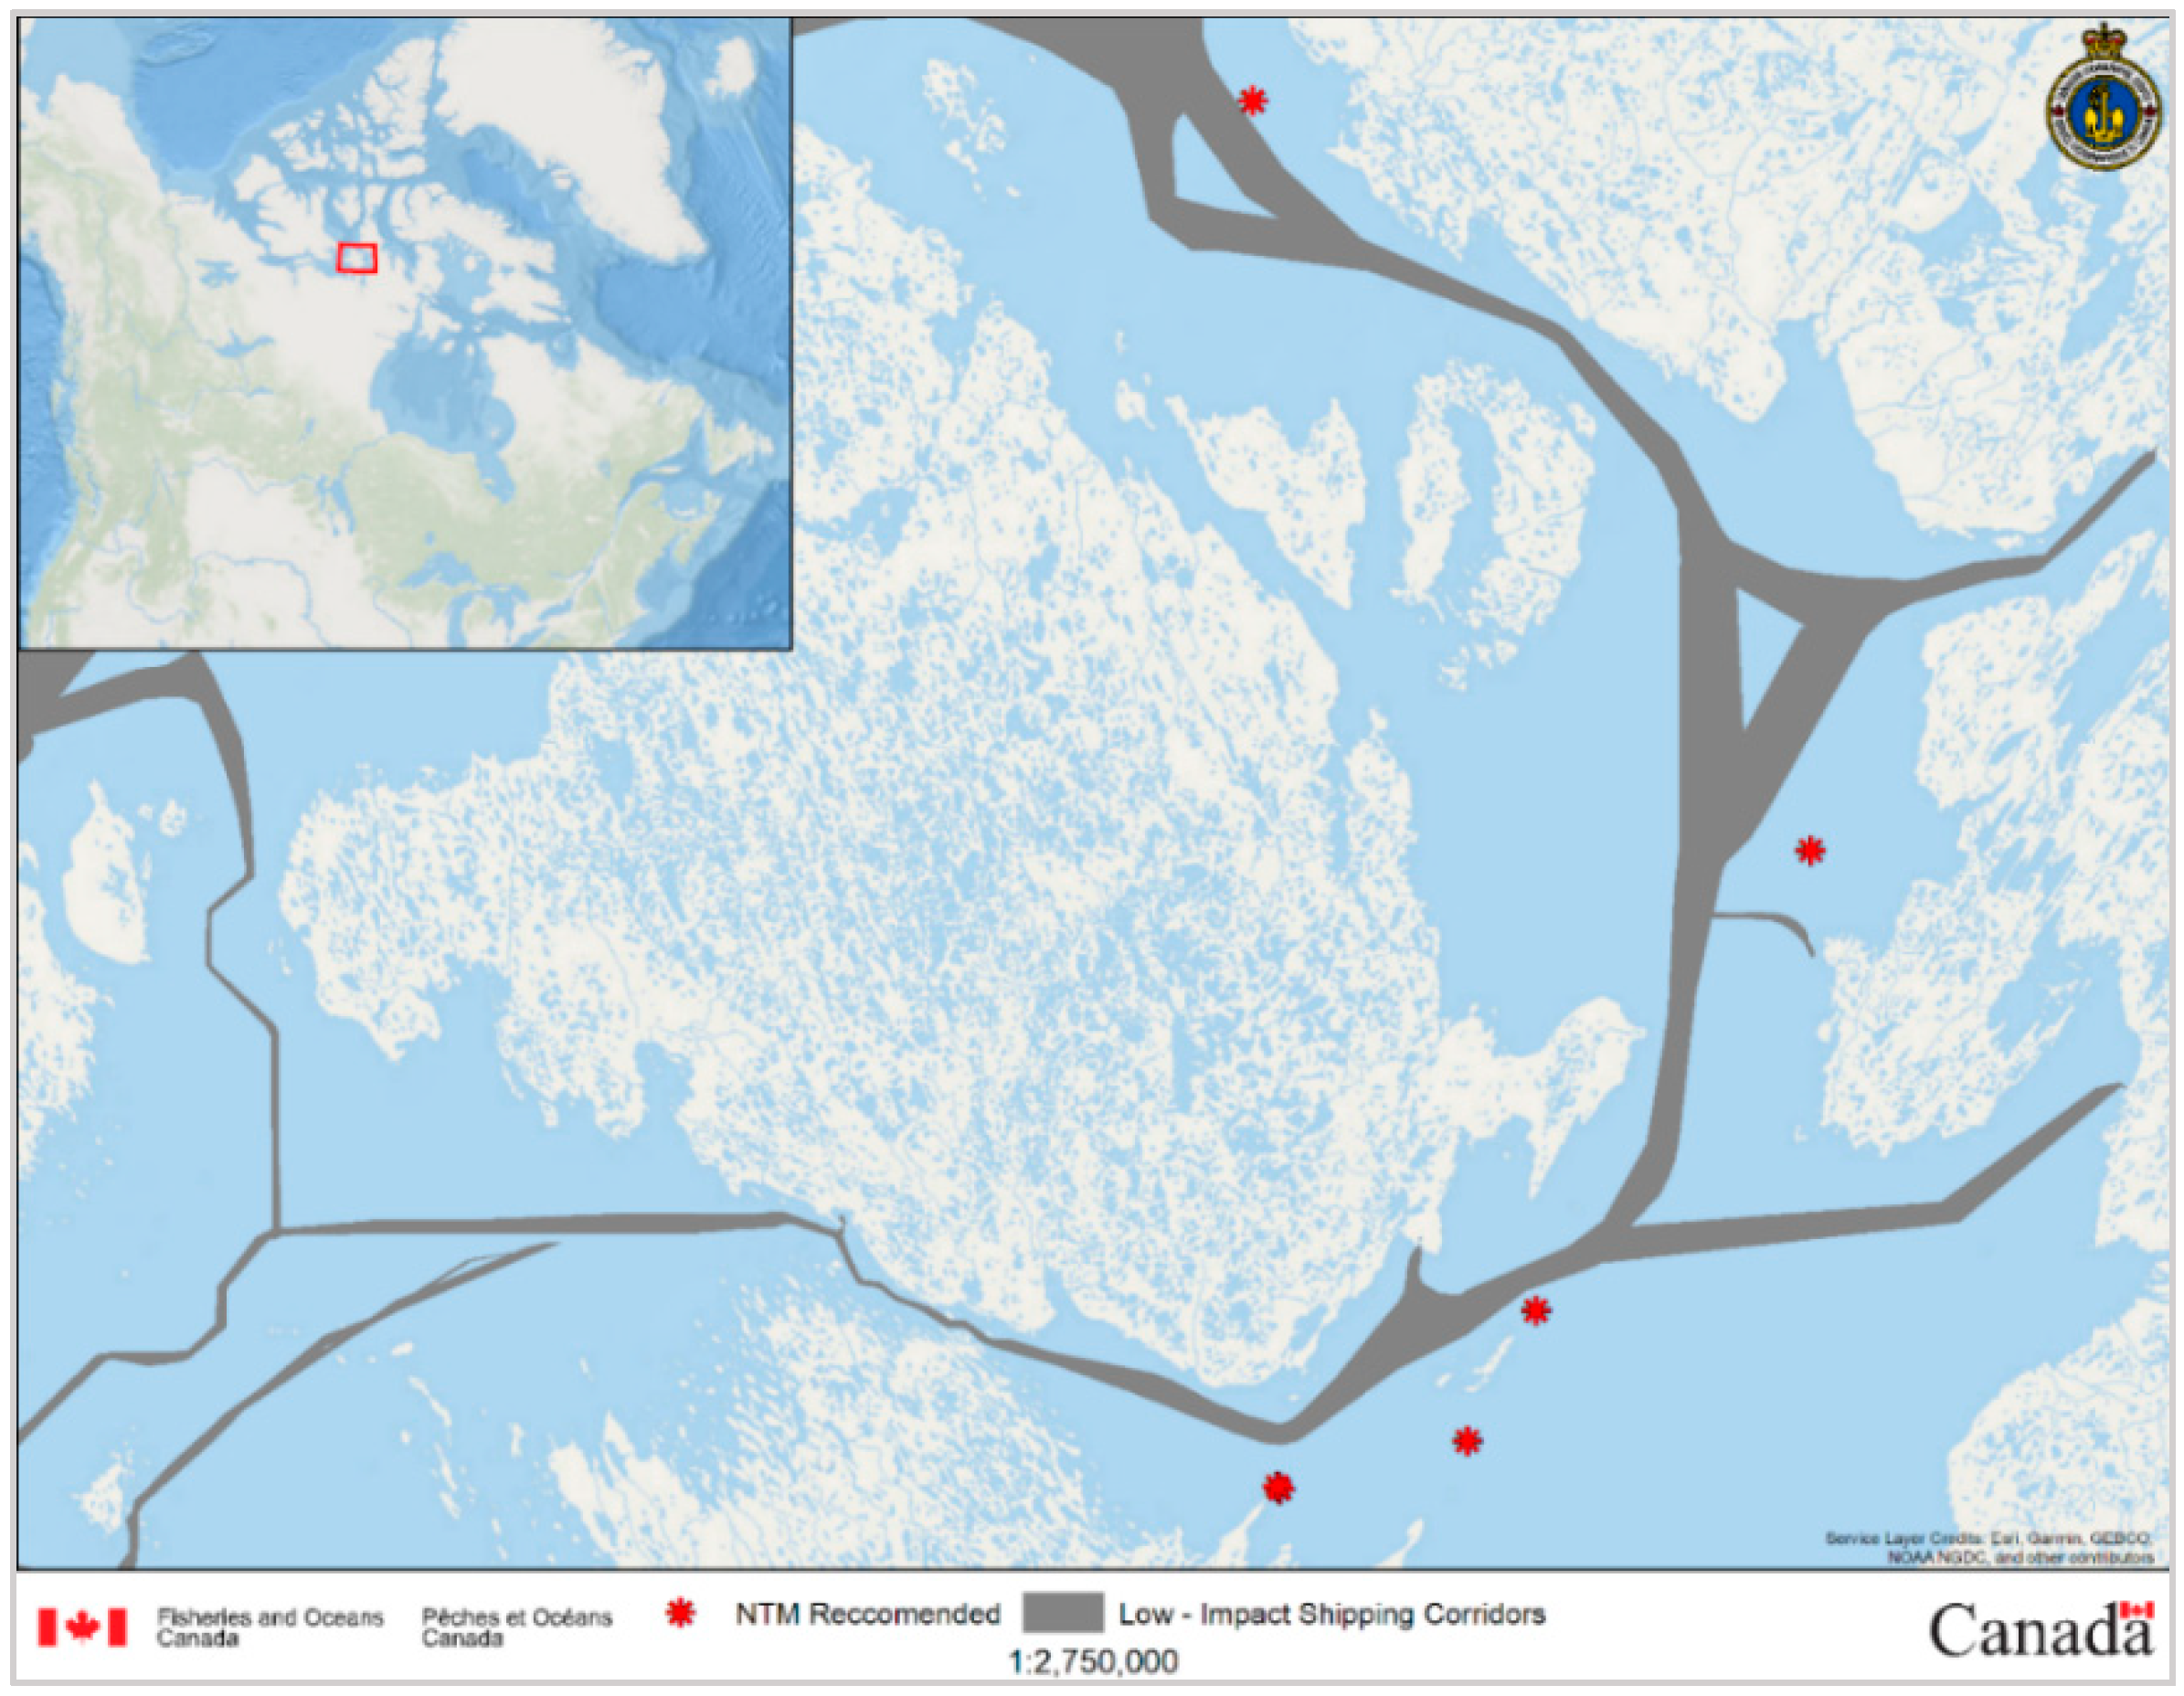
In order to prioritize efforts to scan the full Arctic, and for safety reasons, priority was given to the areas where ships are currently navigating. The Northern Low-Impact Shipping Corridors (Figure 1) were the first areas to be scanned for hazard to navigation.
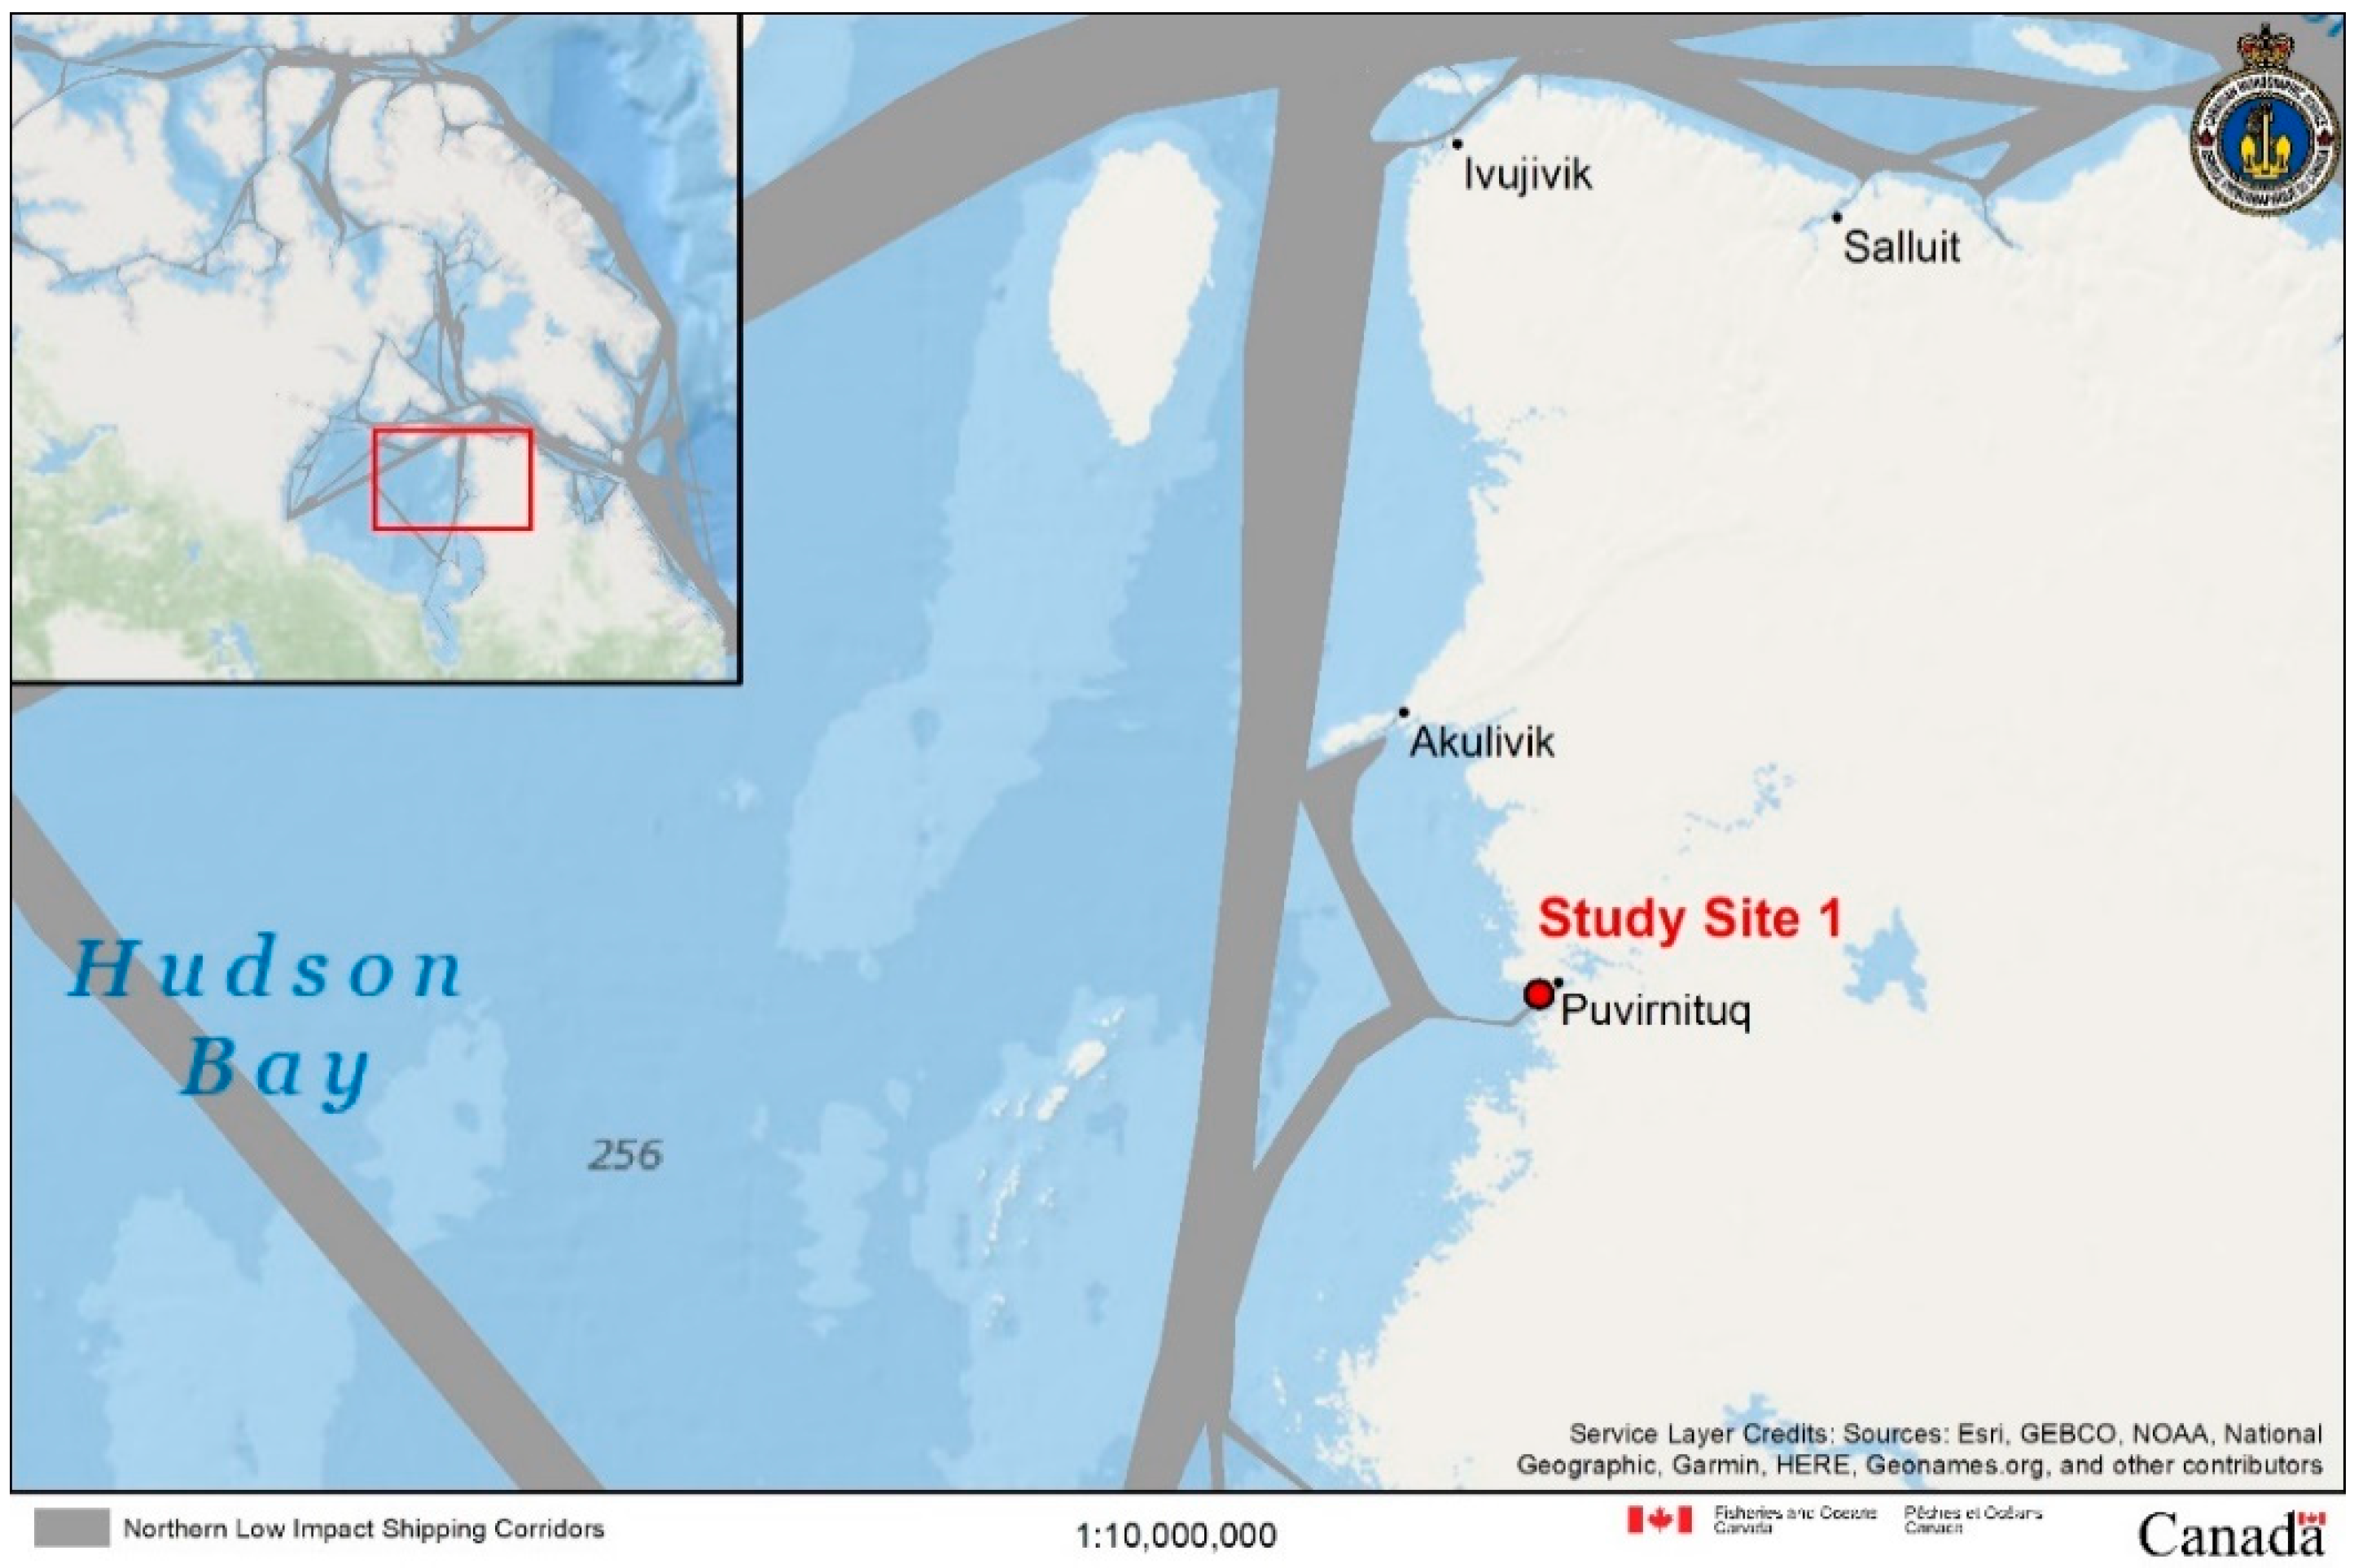
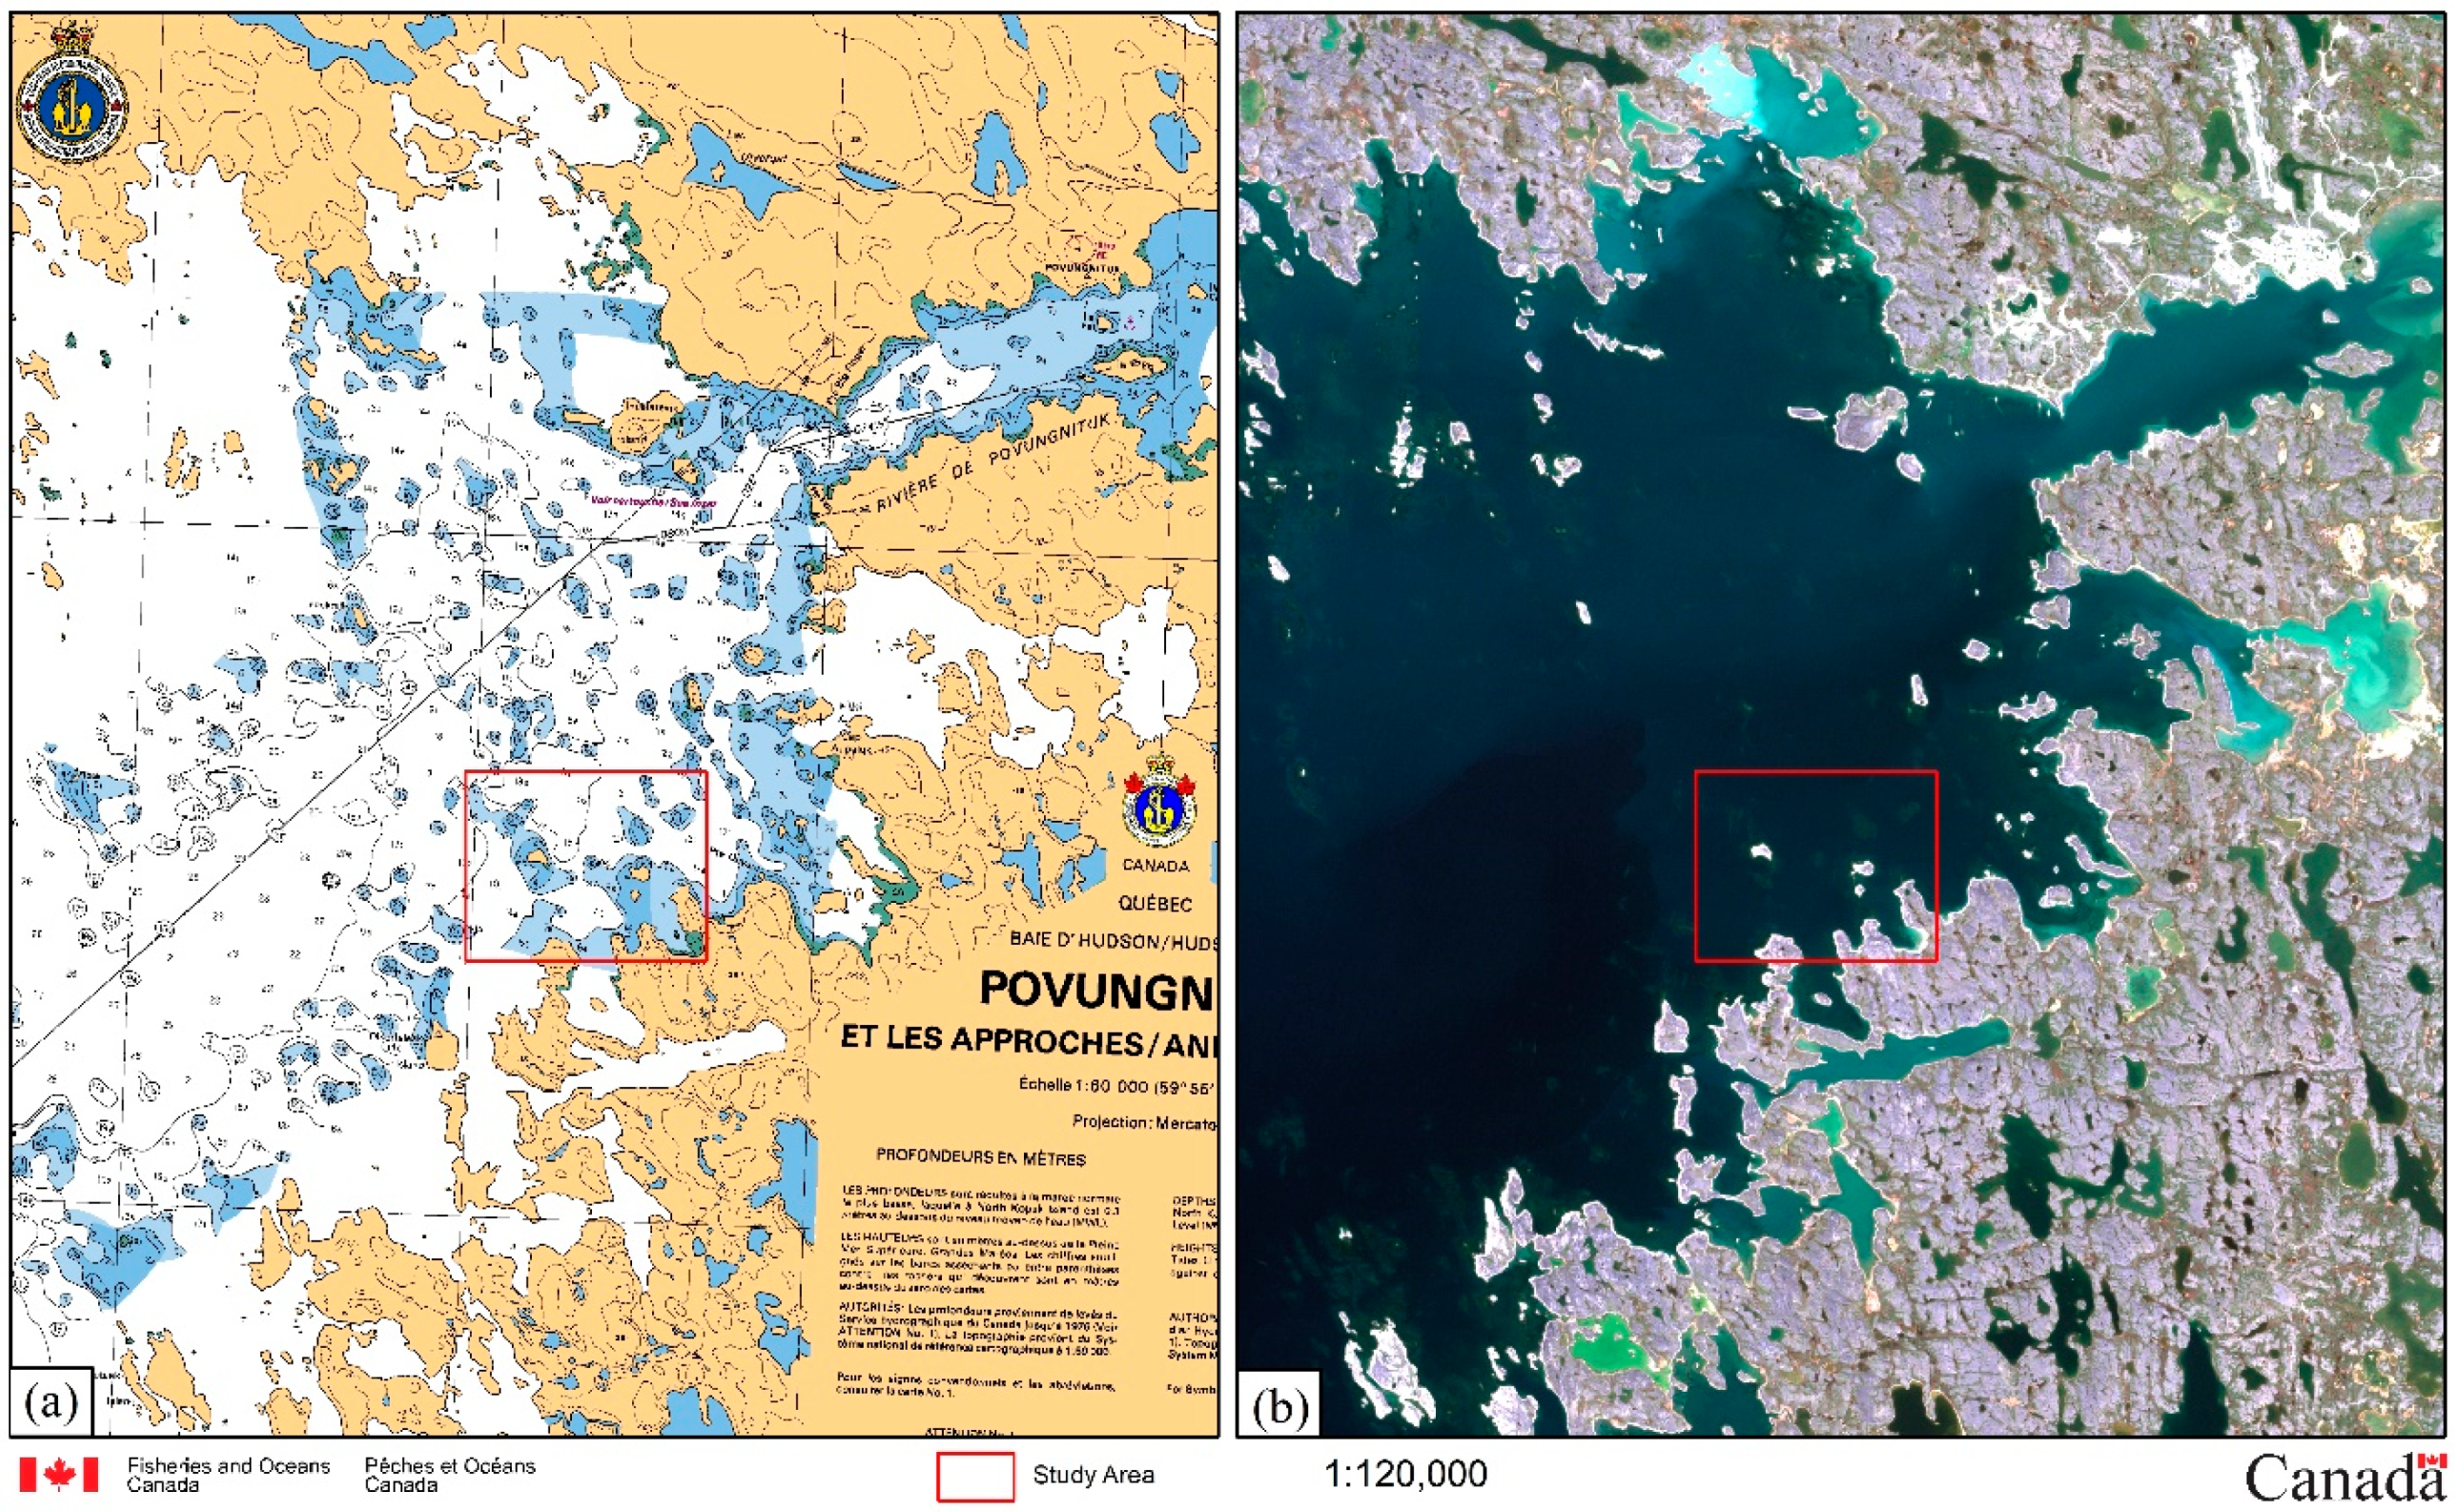
To test the automatic approach, two areas of interest were selected. Study Site 1 is located in Hudson Bay, near Puvirnituq, QC (Figure 2). This site was chosen due to the high number of shoals located in the area.
A large portion of this area in CHS Paper Chart 5510 is shown as white space, meaning there are not enough in situ survey data to complete the chart. Figure 3 outlines shallow areas in blue, which cover only a small portion of the chart. The charted locations of known shoals will be effective in creating the training data for the AI models, in order to help indicate where shoals are likely to be present in areas with missing data, and to assess the accuracy of the model.
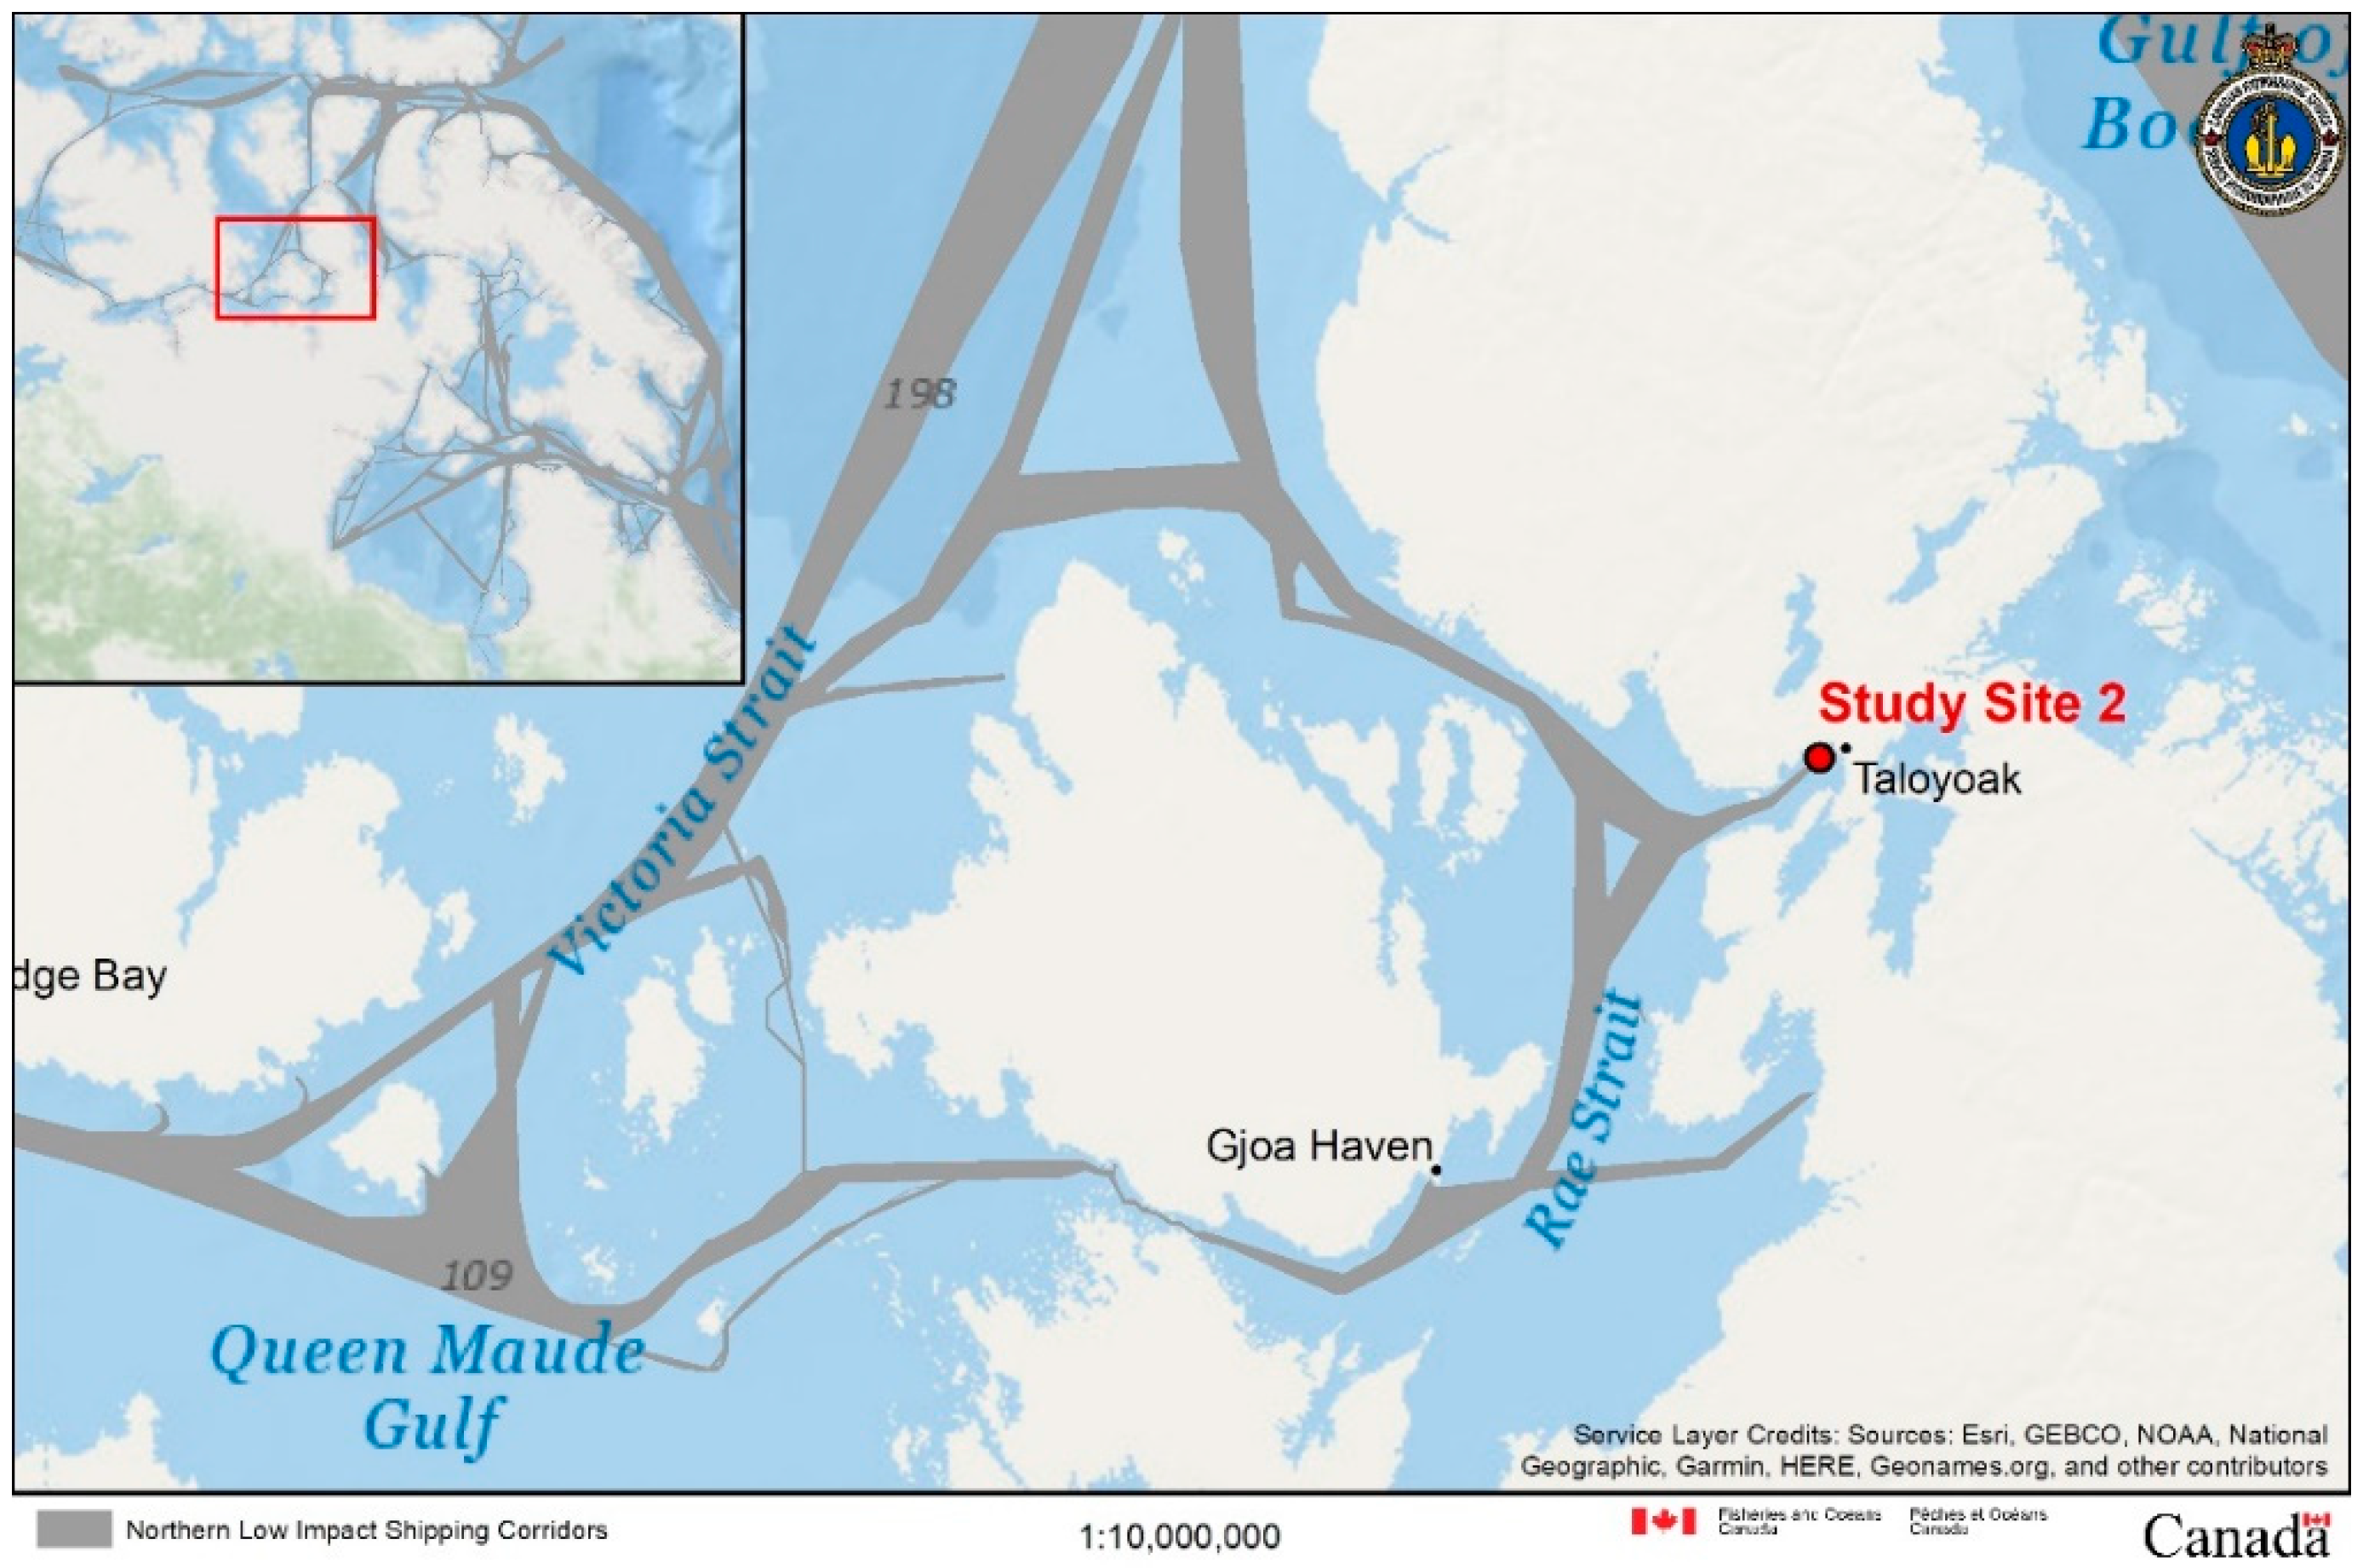
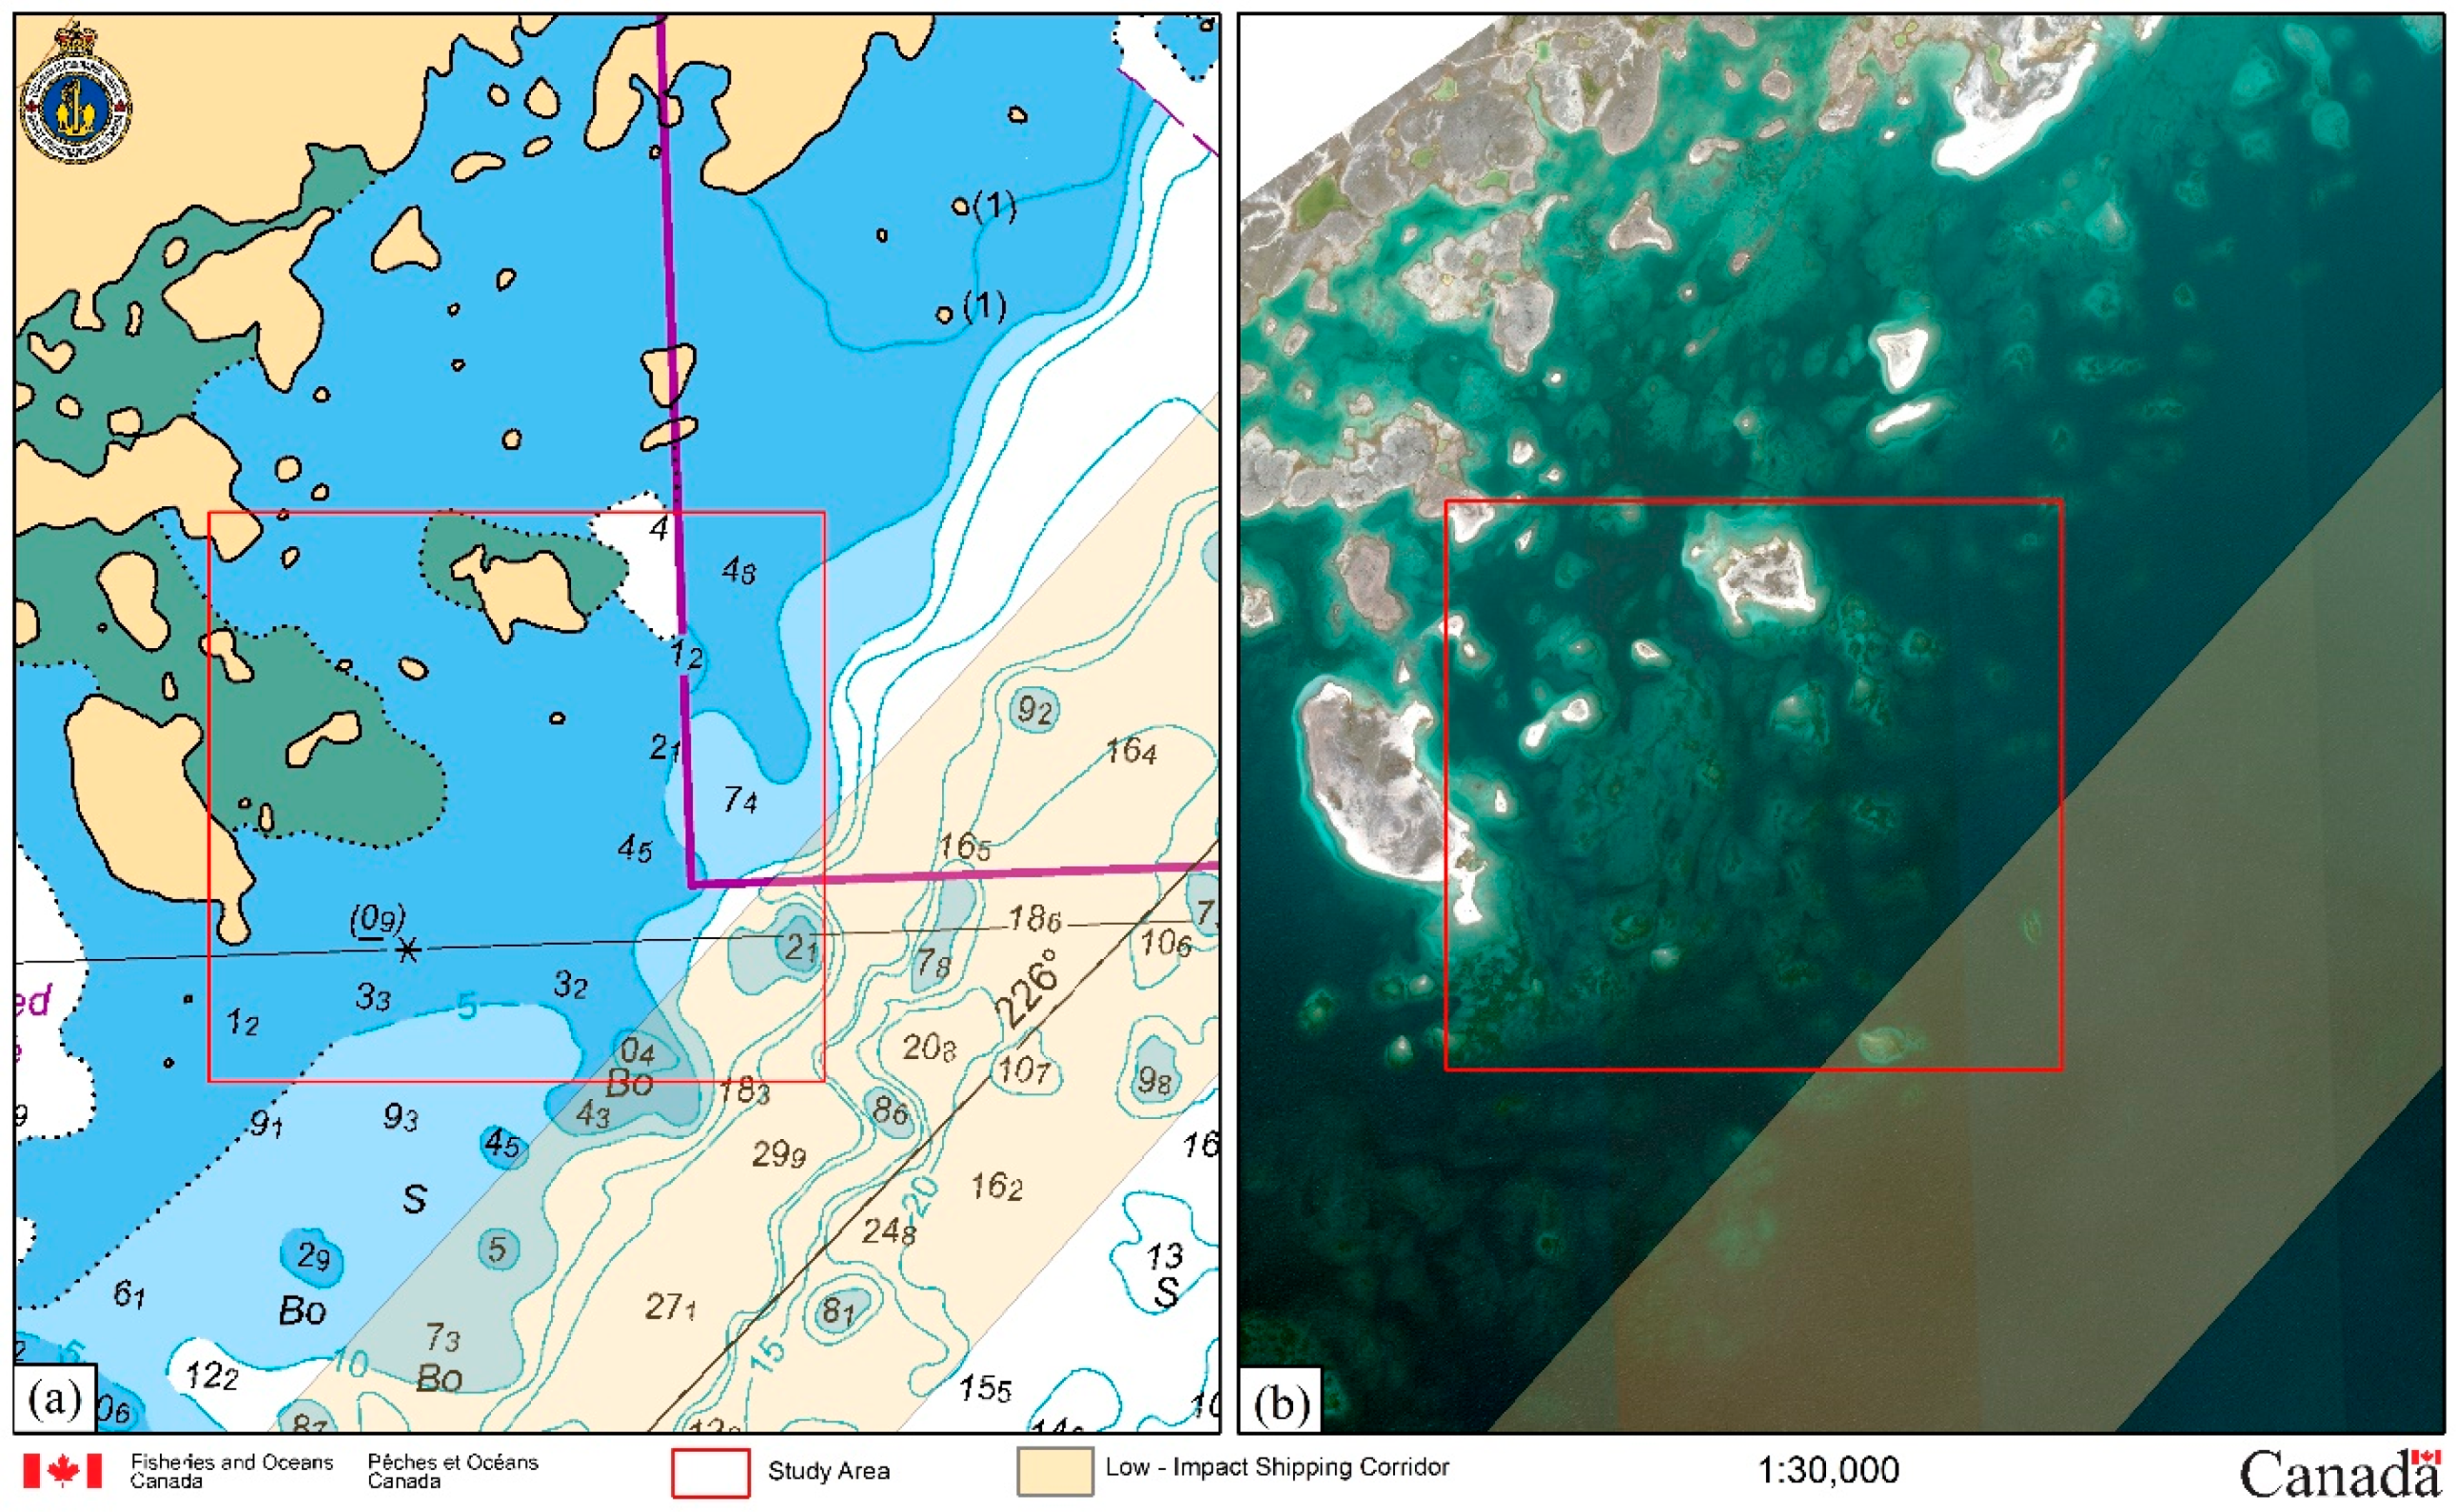
A second site was selected located near Taloyoak, Nunavut (Figure 4). This site was chosen due to the high amount of shoals in the area in addition to its proximity to the corridors (Figure 5). A high-resolution WorldView-2 image was acquired and there are in situ survey data available to validate the training data used.

2.2. Satellite Imagery

To scan the corridors in the Canadian Arctic, CHS utilized Landsat-8, Sentinel-2 and PlanetScope imagery (Table 1). To test automatic detection, WorldView-2 and Sentinel-2 images were used in both sites. These sensors range in swath width, spatial resolution, spectral resolution, and cost. Table 2 provides the list of the images used to test the machine learning approaches.
Landsat-8 imagery was used since it has a medium spatial resolution of 30 m and is free of cost. This sensor covers large areas with a swath width of 185 km. Landsat-8 images were used to scan the Arctic corridors as the coverage it offers fit the scope of the study.
Sentinel-2 was another sensor used to scan the corridors as it is also available for free and has a large swath width of 290 km. It has a higher spatial resolution than Landsat at 10 m, but also has bands available in 20 m and 60 m. TwoSentinel-2 images were also used to test the automatic approach in order to understand how effective using medium resolution imagery would be.
PlanetScope images have a high resolution of 3.6 m and were used to get a more in depth look at hazardous areas while scanning Arctic corridors. This sensor has a much smaller swath width of 24.6 km and therefore many images were purchased and downloaded to cover larger areas.
Two WorldView-2 images were used to test the automatic approach to better understand the capabilities of the models when using extremely high-resolution data. The WorldView-2 sensor has a swath width of 16.4 km and a multispectral resolution of 2 m which can be pan-sharpened to 0.5 m.

3. Methods

The methodology proposed in this paper has two aspects: a visual quality control, and an automatic procedure to manage large quantities of data. Before the automatic approach was finalized, a primary scan for potential hazards to navigation was done within the boundaries of the corridors to mitigate any risks to current vessel traffic. In order to enhance the visual contrast between shoal, land and water, a band ratio approach was used to support the visual interpretation.

3.1. Visual Interpretation

A scan of the corridors was performed through a visual analysis. A combination of Landsat, Sentinel-2, and PlanetScope imagery was acquired within a ten-year time frame, based on coverage and image quality. The scan involved identifying potential hazards to navigation within the corridors that are currently not charted on CHS products. In order to define the analysis performed, the following guidelines were applied as needed:
  • A band ratio, such as green/blue (G/B), was applied to images to enhance the contrast between shoals, land and deep water;
  • Comparison of imagery acquired at various times where a potential hazard was found to avoid commission errors related to ice, cloud, cloud shadow, ship sediment, waves, floating debris, or wildlife; and
  • Consultation of existing CHS products to determine if detected shoals have already been charted.

3.2. Automatic Analysis

Two methods of automatic shoal detection were assessed: pixel-based random forest classification and a convolutional neural network classification. Both methods used the same training samples and accuracy assessment data for the two study areas.

3.2.1. Ground Truth Data Creation

Data were created to train the classifiers and to perform an accuracy assessment. Using the ESRI ArcGIS Desktop software suite, masks of the entire WorldView-2 images were created using the G/B band ratio and near infrared 1 (NIR1) bands in order to define three classes: shoals, deep water and land. A 3 × 3 majority filter was applied to the raster followed by manual editing to ensure the mask correctly represented each class. The mask was then resampled to have a 10 × 10 m resolution in order to match the resolution of the Sentinel-2 images. ESRI’s Create Accuracy Assessment Points tool was leveraged to generate points used for accuracy assessment using equalized stratified random sampling in order to equally assess the accuracies of both RF and CNN classifications. A total of 2000 points were generated for each study site over areas that were not included for training.

3.2.2. Random Forest Classification

A random forest classifier was used as it is a common baseline approach for machine learning and satellite image classification. This study assesses the effectiveness of the RF technique to detect shoals. The analysis was completed using ESRI’s Train Random Trees Classifier and Classify Raster tools in ArcGIS Desktop 10.6. To train the classifier, a portion of the 10 × 10 m ground truth mask was used within the study site and converted to points, producing approximately 10,000 points. To run the training tool, the maximum number of trees was set to 50, maximum tree depth at 30 and the maximum number of samples per class at 1000. The training tool provided an .ecd file to use for the classification tool. A 3 × 3 majority filter was applied to the results to remove noise. A confusion matrix was then produced using the accuracy assessment dataset with ESRI’s Compute Confusion Matrix tool.

3.2.3. Neural Network Classification

Due to the limited training data, a U-Net CNN model was applied to the two study sites. This model is trained on small patches of the image with a classified mask for each one. The model rotates, mirrors, and changes the resolution of each tile. As illustrated in the diagram below (Figure 6), each level of the U-net represents a degrade step with filtering at that level, and then the coarsest scales are upscaled back to the original resolution, with interconnections between images at equivalent scales [23].
To prepare the image and mask tiles, ESRI’s Export Training Data for Deep Learning tool was used. A total of 100 tiles for each site were exported with a patch size of 256 × 256 for the four bands (blue, green, red, and NIR). This patch size was chosen as it was large enough to contain multiple shoals. The tool was run individually on each satellite image and mask over areas where the WorldView-2 and Sentinel-2 images overlapped. The tiles were then organized in corresponding folders for each image and were manually separated into a training folder or test folder. The study sites comprised of all test tiles with one training tile.
The model was run using the Keras Python Deep Learning Library with the backend driver for Tensorflow. In addition to patch size, number of classes and number of bands, there are many parameters which need to be set to run the model. A filter size of 3 and a pooling factor of 2 was chosen based on Ronneberger et al. [22]; a batch size of 2 was selected based on available graphics processing unit (GPU) memory; and 10 epochs were used to train the model as that is where error measurements level off.
The classified test images within the study area were stitched together using ESRI’s Create Mosaic tool. A 3 × 3 majority filter was applied to the final classification and a confusion matrix was produced using the accuracy assessment dataset with ESRI’s Compute Confusion Matrix tool.

4. Results

4.1. Visual Interpretation

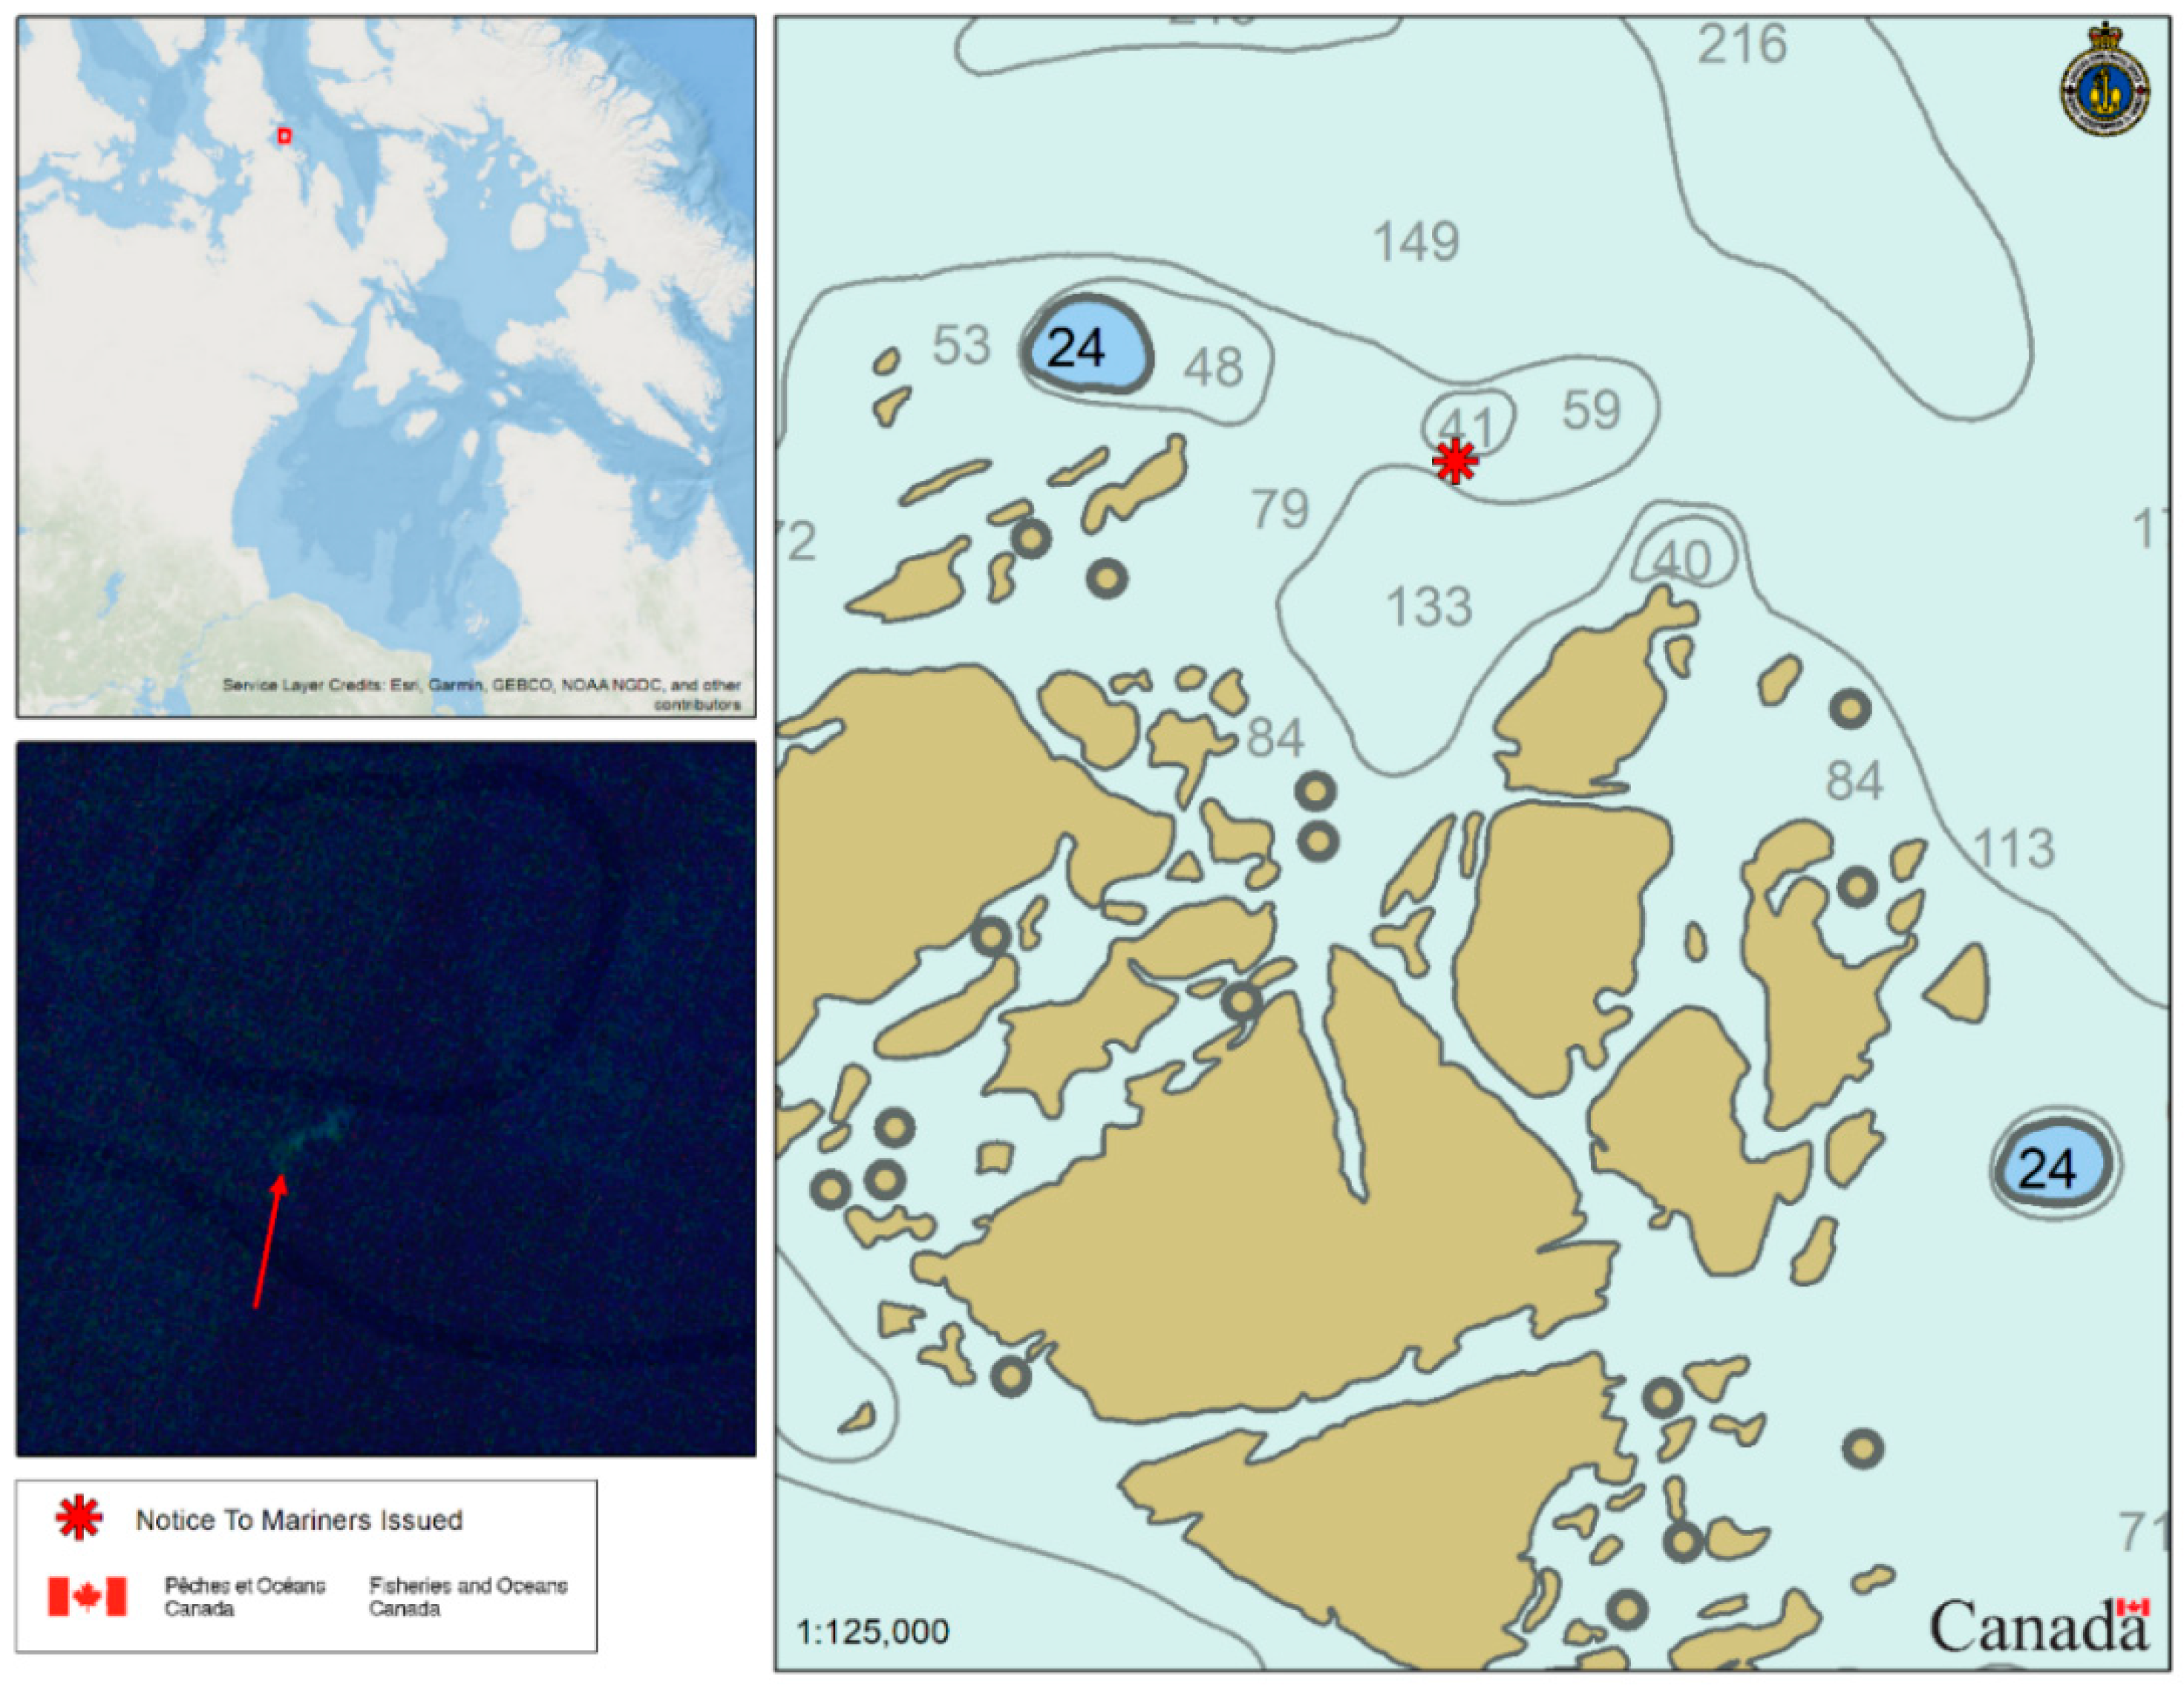
When scanning the corridors for hazards to navigation, five notices to mariners (NTMs) were issued. Figure 7 represents the distribution of the notices that were issued by CHS to chart these shoals. Figure 8 shows an example of an NTM that was issued for an uncharted shoal, which was discovered from a visual scan of Landsat, Sentinel-2 and PlanetScope imagery. The CHS Electronic Navigational Charts (ENC) number CA273274 shows a depth sounding close to the uncharted shoal of 41 m. This shoal represents a hazard to navigation due to its proximity to this depth sounding. Currently, the International Hydrographic Organization (IHO) S-4 standard (specification B424.7) recognizes the use of satellite imagery to chart shoals. “In areas where reliable hydrographic survey data is very limited or non-existent, it may be possible to identify shoal areas by reference to other sources, for example: satellite imagery” [26].
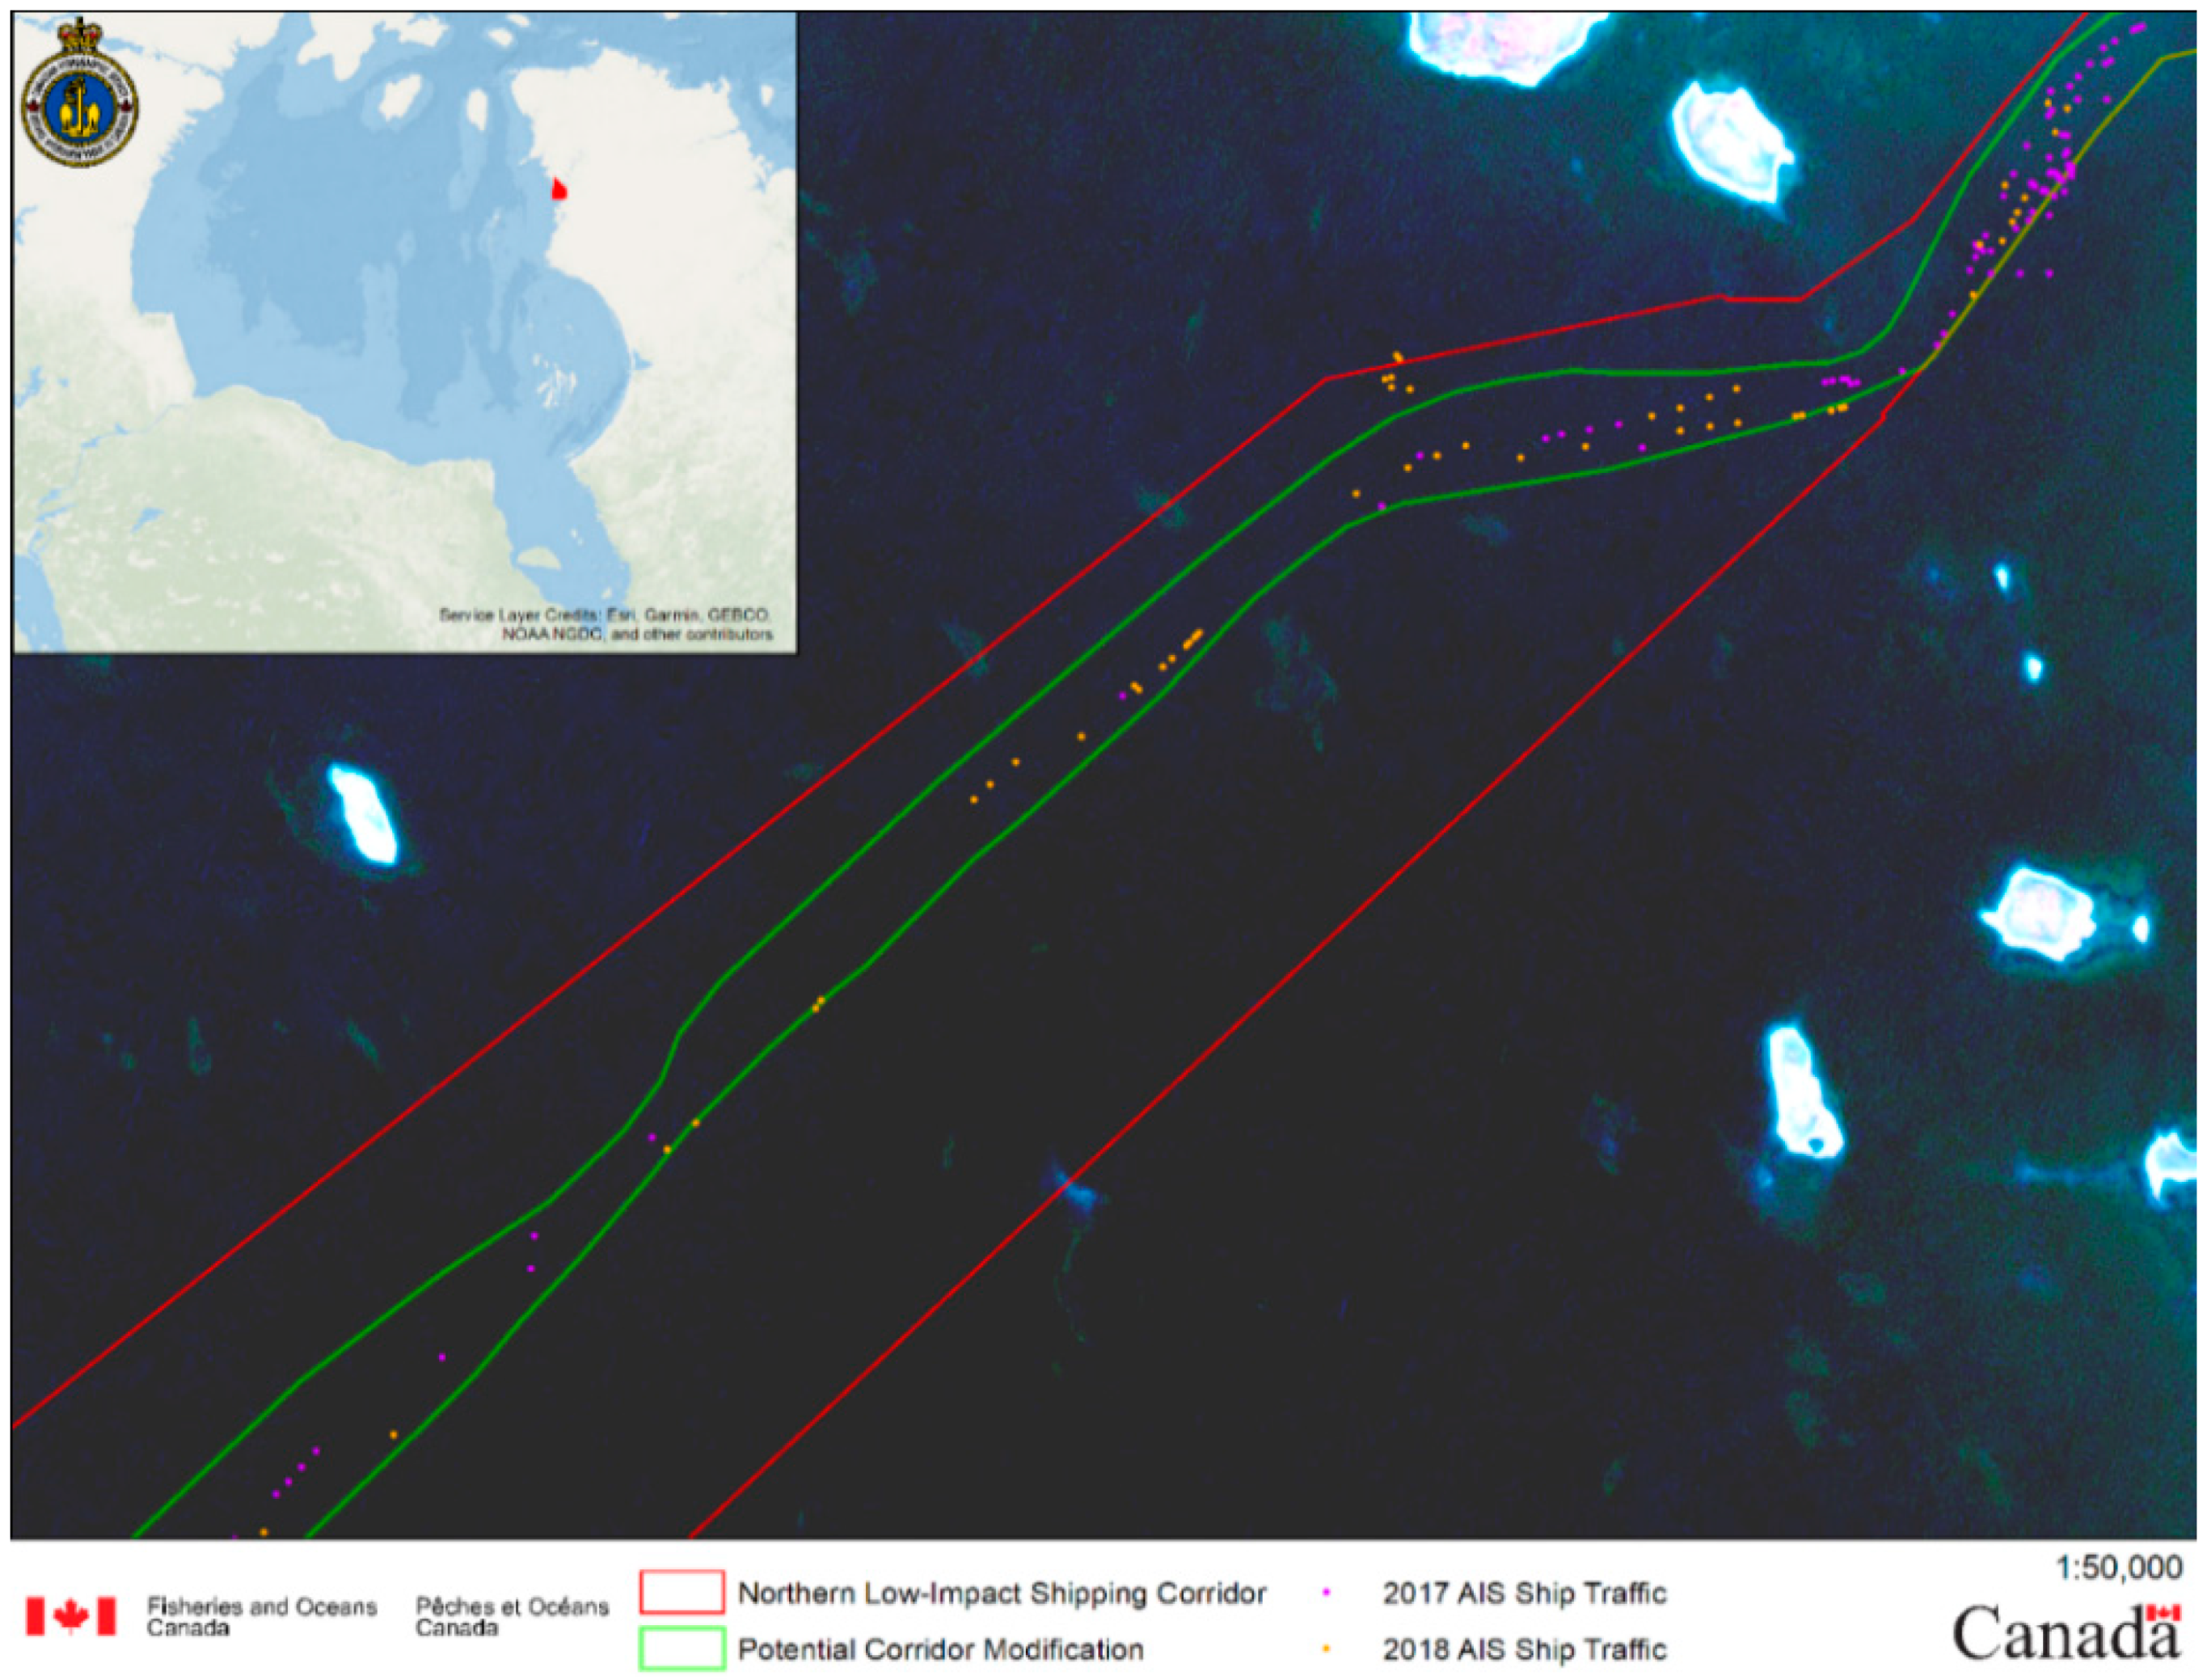
These newly reported shoals also have an impact on the corridors as their boundaries will need to be modified away from the hazards, to ensure safe navigational passage. Figure 9 is an example of a suggested modification to the corridors based on shallow areas and shoals identified from EO data. The red polygon identifies the current corridor and the green polygon represents the new suggested passage that would avoid the shallow waters.

4.2. Automatic Detection

4.2.1. Study Site 1

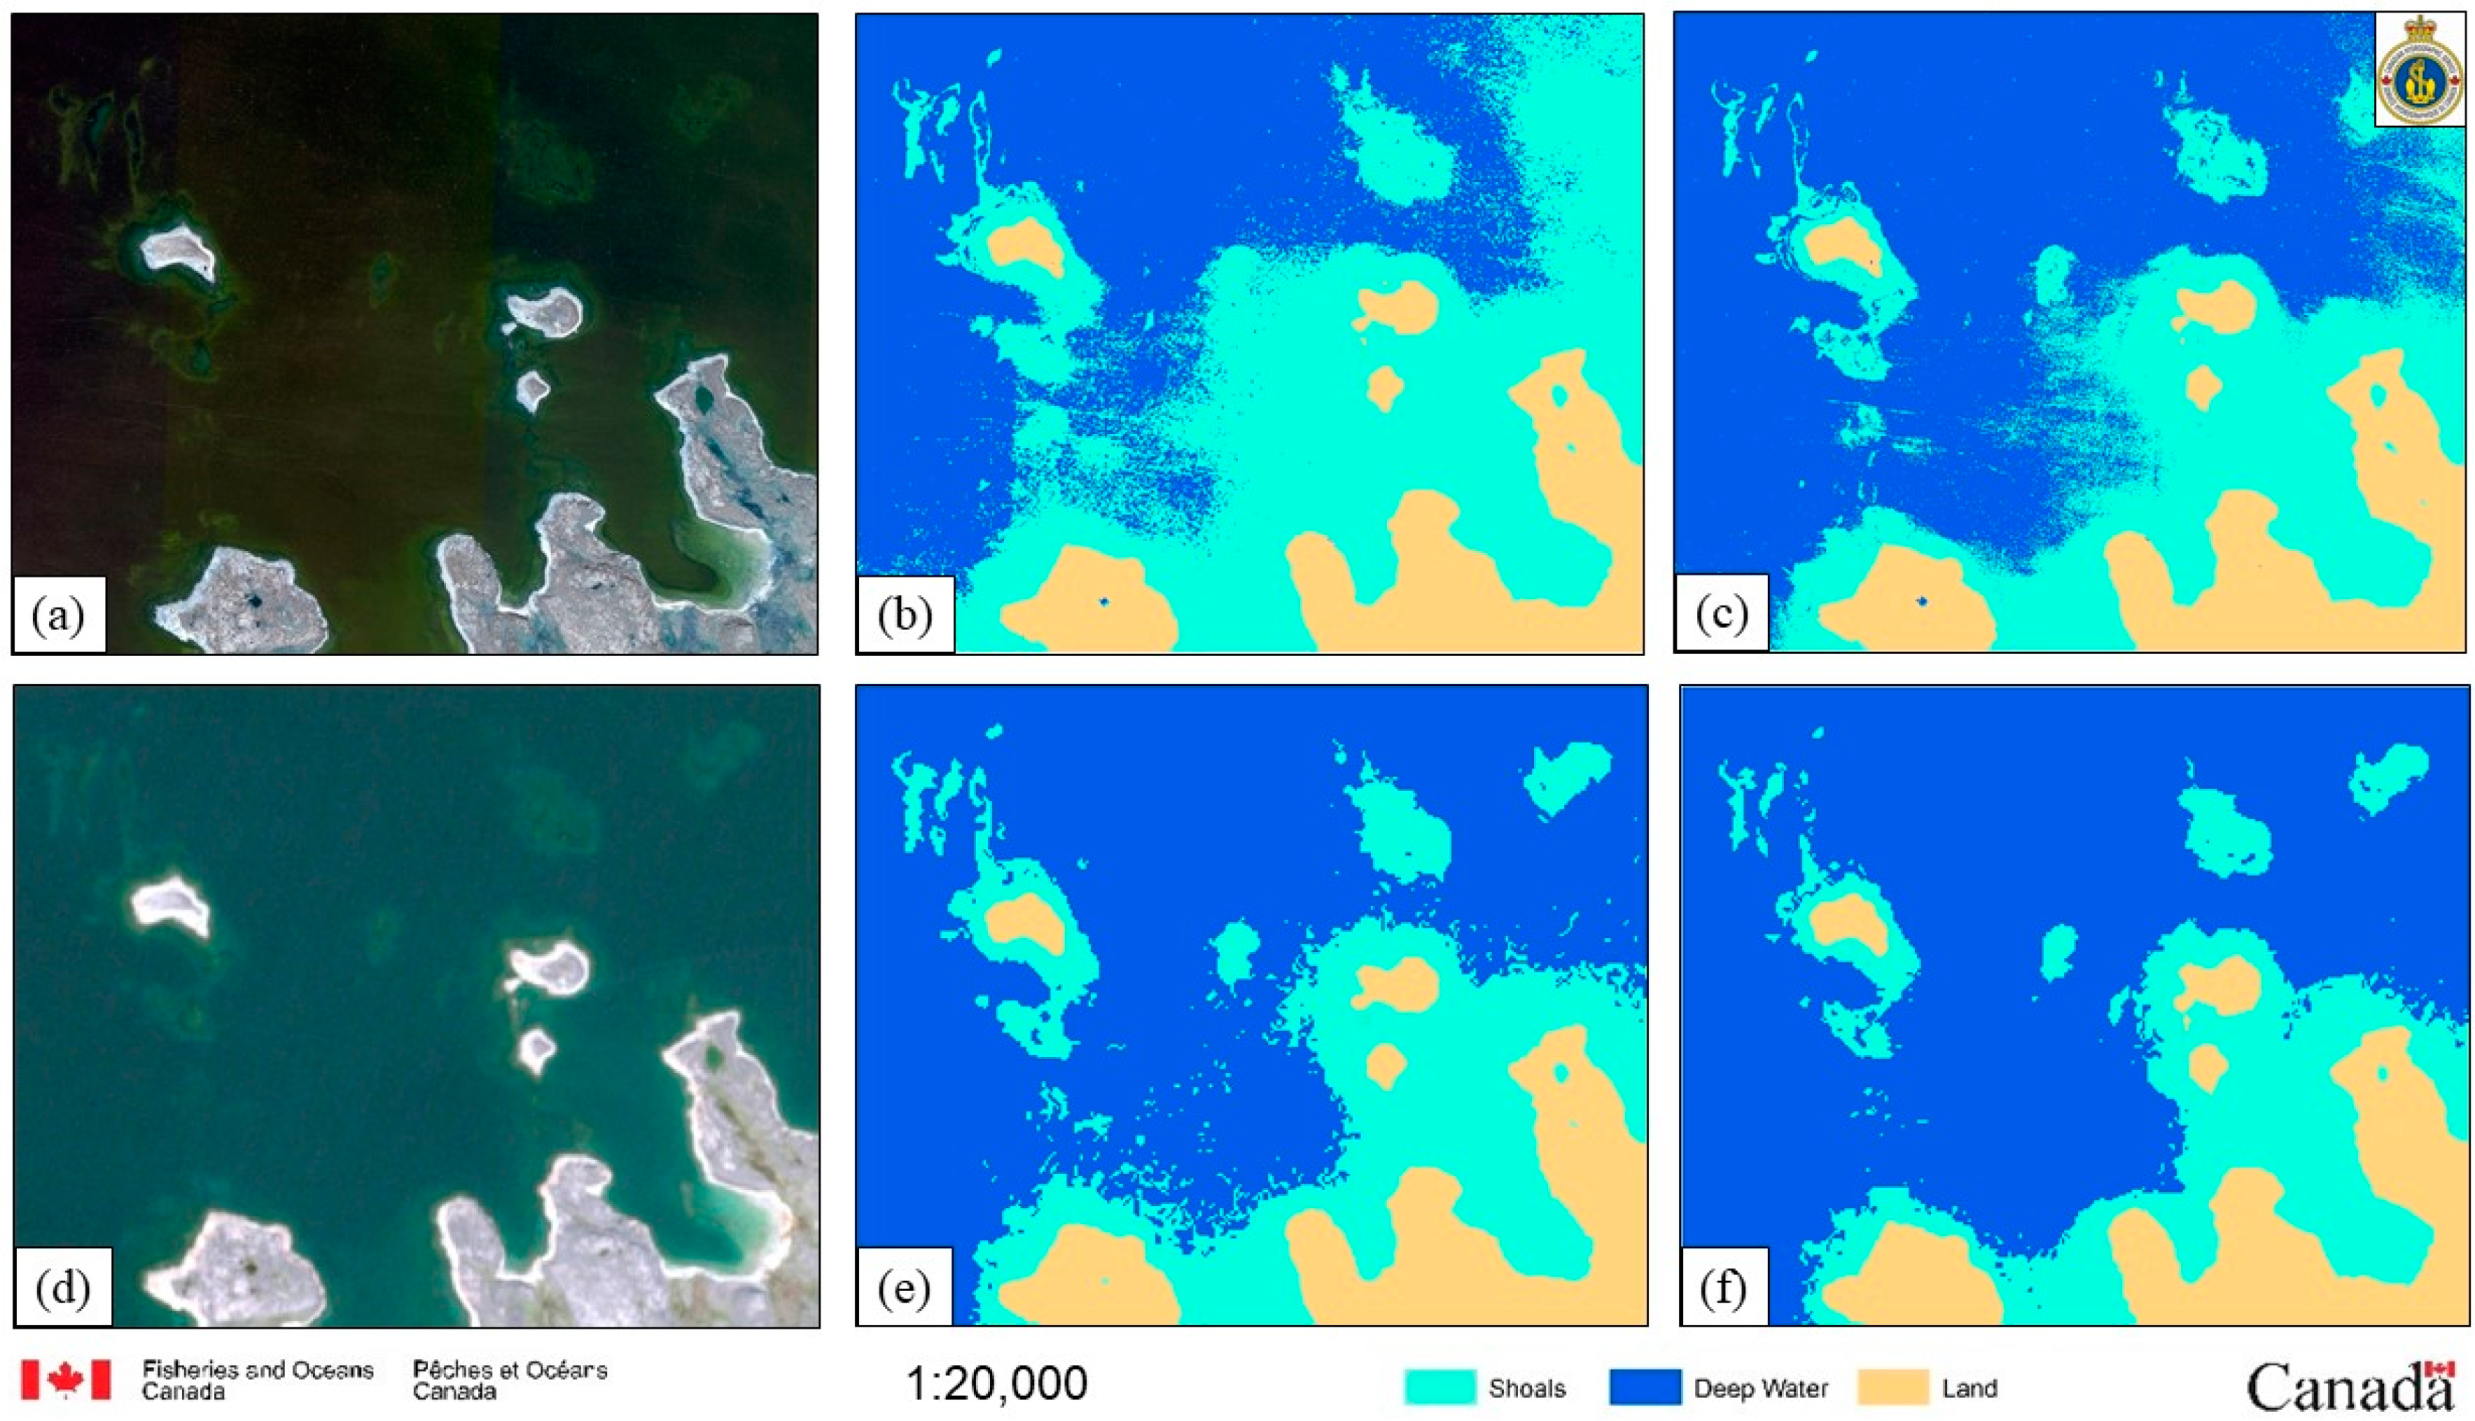
WorldView-2 and Sentinel-2 images were used in Study Site 1, shown in Figure 10a,d, to detect shoals using both CNN and RF classifiers. In this case, each image produces almost identical results for both approaches.
The results of Figure 10 are summarized below in Table 3. Since the purpose of this study is to identify potential hazards to navigation, only the class representing shoals is being assessed for commission and omission error. All results have accuracies between 89–94% which indicate they perform relatively equally. Overall, the WorldView-2 classifications performed slightly better than Sentinel-2 classifications, with an improvement of approximately 5%. The CNN WorldView-2 classification has the highest commission error for the shoals class, indicating that there is more deep water or land being misclassified as shoals. The Sentinel-2 classifications both have higher omission errors indicating that more shoals are being misclassified as deep water or land. The RF WorldView-2 results have low errors and the highest overall accuracy.

4.2.2. Study Site 2

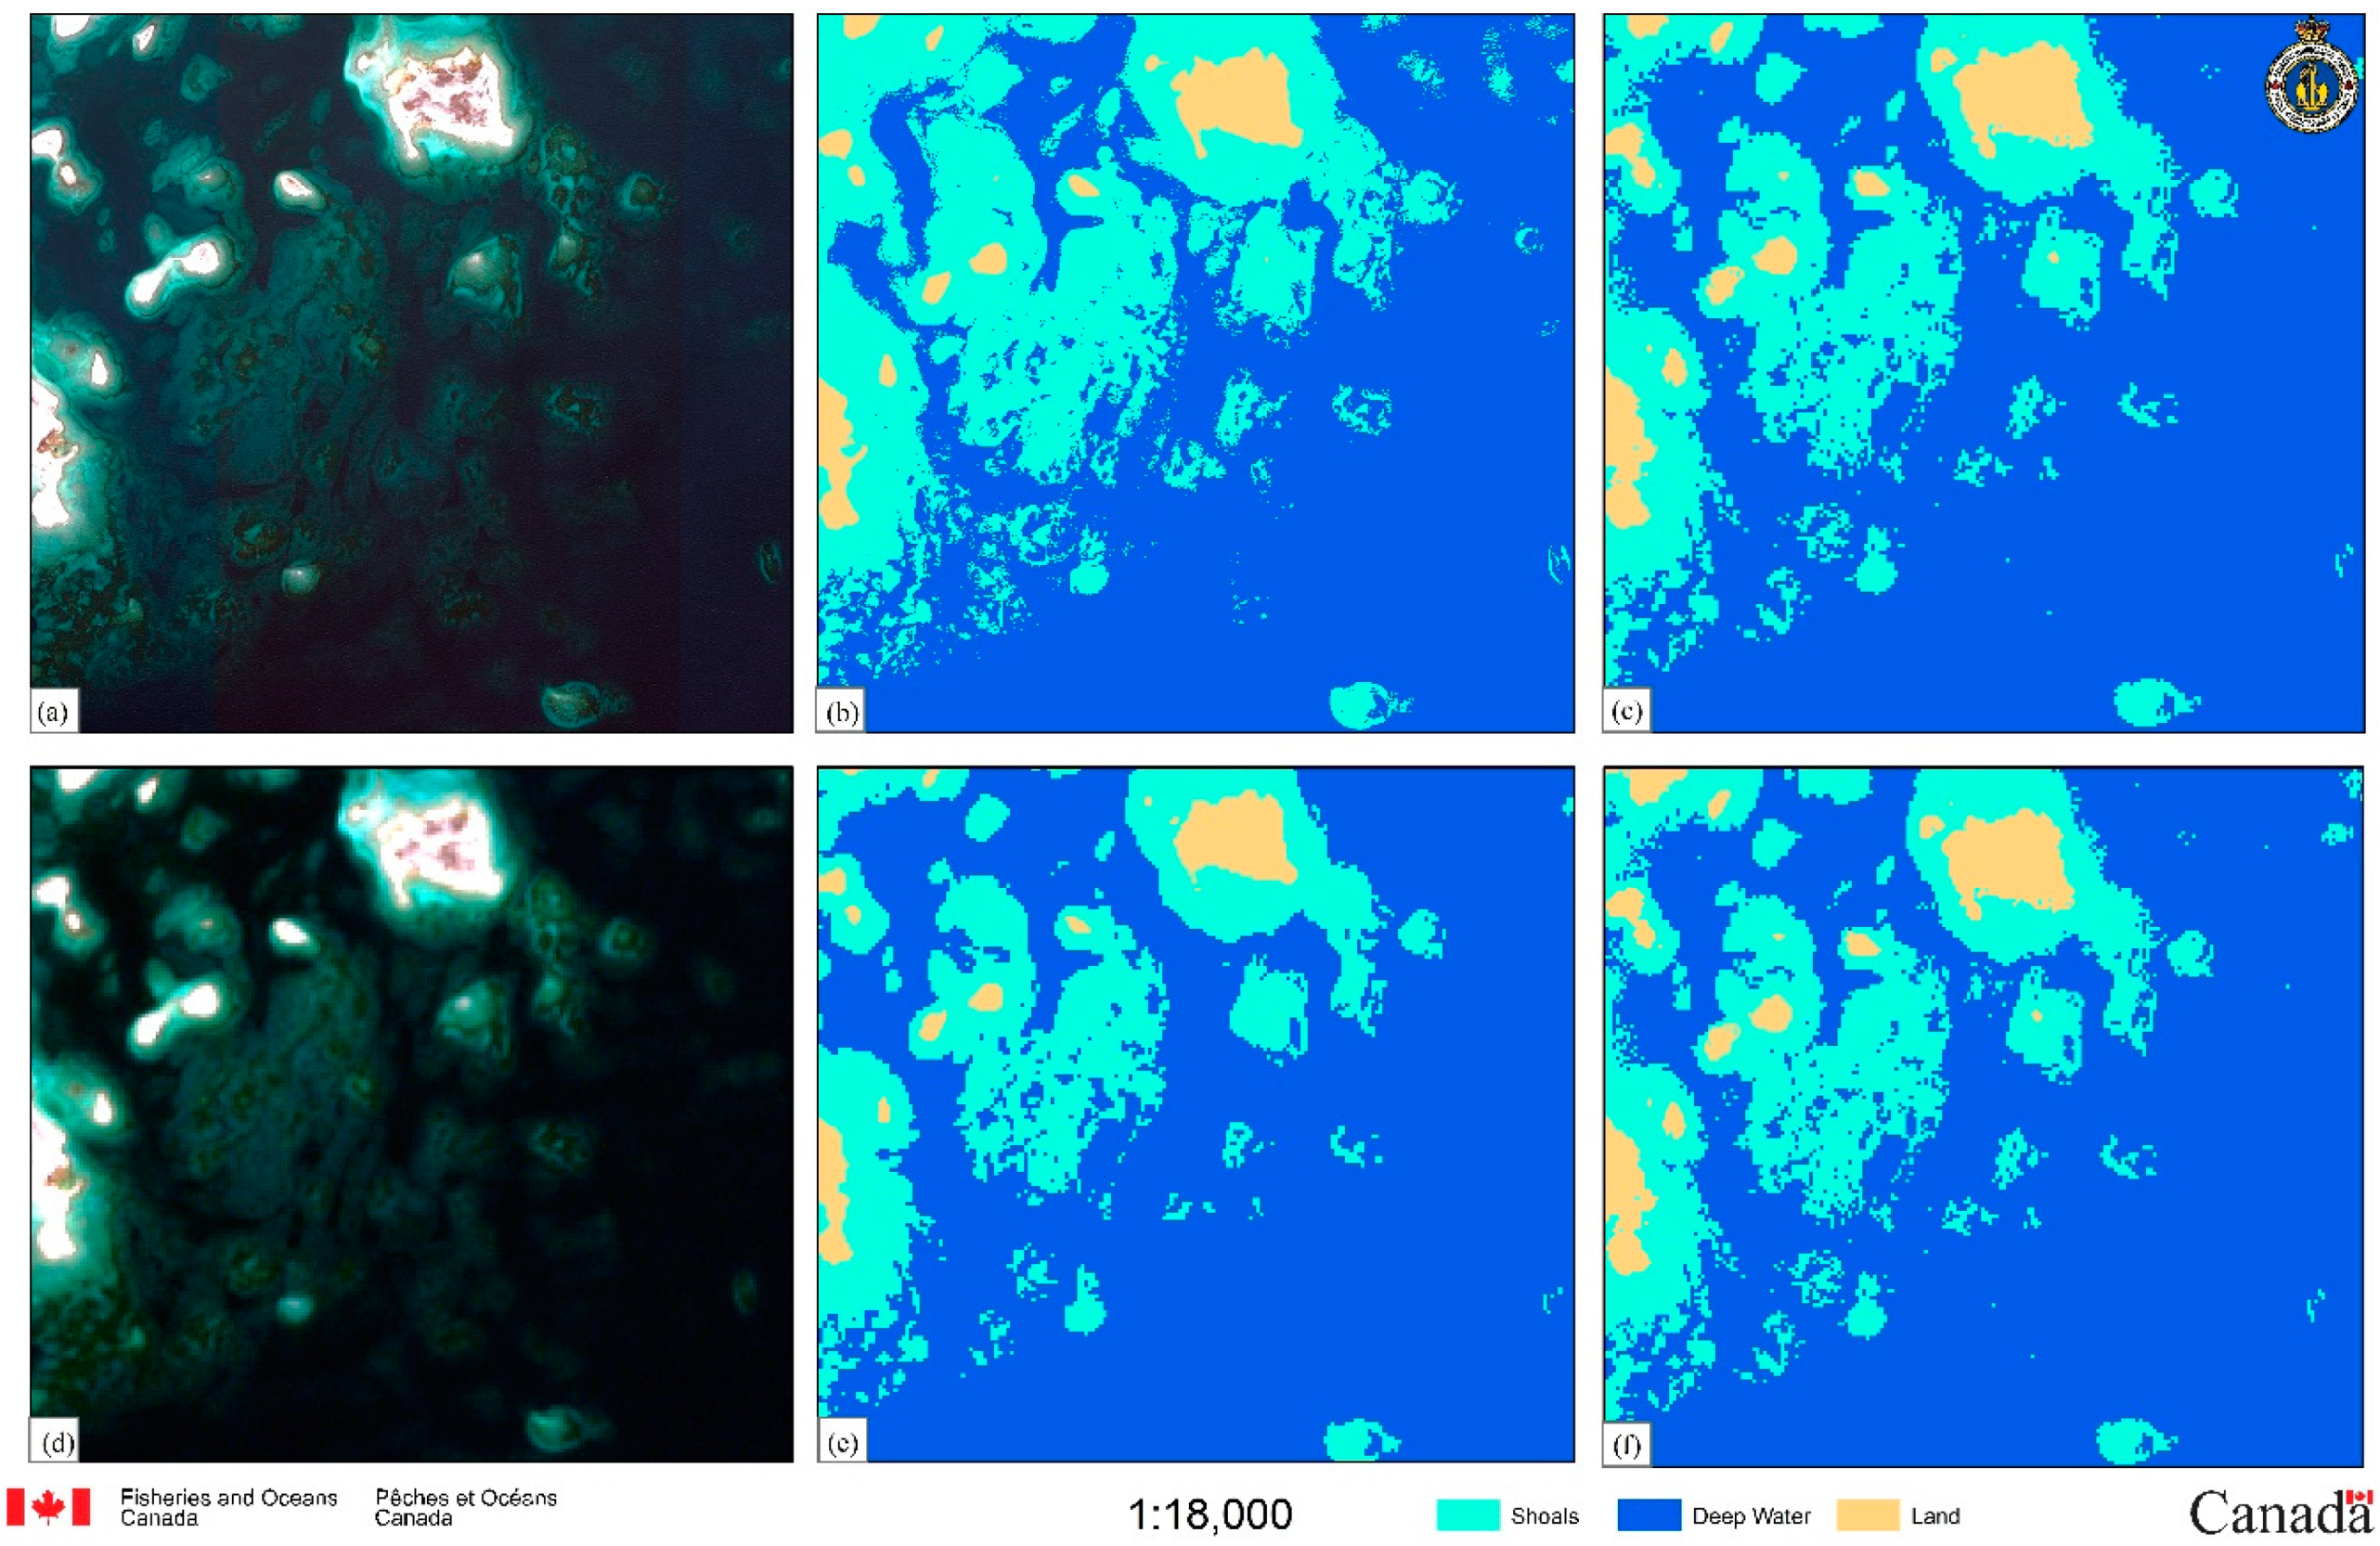
WorldView-2 and Sentinel -2 images were used to assess the automatic detection of shoals in Study Site 2 (Figure 11a,d, respectively). All results successfully outline large, clear shoals that are closest to land, but have difficulty detecting visible shoals in deeper water.
Table 4 summarizes the results of the four classification results. As with the results from Study Site 1, only the class representing shoals is being assessed for commission and omission error. The WorldView-2 RF classification has the highest overall accuracy with a low commission error but high omission error indicating that there are shoals being misclassified as deep water or land. The remaining three results have similar accuracies ranging within 79–82%. Overall, better results were achieved using the high-resolution WorldView-2 image.

5. Discussion

A review of the Northern Low-Impact Shipping Corridors revealed that there were several potential hazards to navigation within the corridors which were not displayed on CHS products. Using satellite imagery to detect hazards is very effective but is also time consuming and requires a large amount of detail-oriented work. An automatic approach for detecting shoals can be used by running a machine learning or deep learning classifier on the imagery, though these methods are not completely accurate and still require the user to train the model.
It appears that the RF model performed approximately 2–3% better than CNN for every classification except for the Sentinel-2 classification of Site 2 which performed slightly worse. Overall, there was little difference and both models seemed to have similar strengths and weaknesses. It seems that a common challenge for all classifiers is identifying shoals located in deeper water where there is less contrast between the features and clear water. All classifiers do an excellent job of identifying land, which is likely due to the NIR band included in the analysis. However, when looking closely at the CNN classifications for Site 2 (Figure 11b,e), there are two very small islands which were misclassified as shoals. In terms of safety to navigation, this error is negligible since either a shoal or land is an obstruction to be avoided.
Since there are no significant differences between the results produced for either classifier, a preferred analysis method and sensor can be identified based on computing time and difficulty. The RF classifier can be quickly and easily run through ESRI’s geoprocessing tools for ArcGIS. This is ideal since it requires no programming knowledge for the user. ESRI now provides deep learning tools for ArcGIS Pro 2.5 which should make deep learning accessible to more users. Unfortunately, there are many bugs in the software, which requires the appropriate framework to be installed and needs a high-end GPU to train the model. Training the CNN model through a Python script is still possible but requires a strong understanding of deep learning and programming, adding complexity to the process. Additionally, preparing the data into classified tiles is very tedious and time consuming, and leaves more room for human error. Overall, using a RF model delivers the same accuracy as CNN, in this case with less data preparation and computing time. Unfortunately, the RF model cannot be trained on multiple images whereas the U-Net CNN model can. The RF model can only be trained on one image which can then be applied to other images of the same sensor. This can lead to reduced accuracy if CHS would like to use the same model to scan many images for shoals.
Over both study sites, the WorldView-2 images deliver results with overall accuracies of approximately 3–5% higher than Sentinel-2 images. It also appears that Sentinel-2 images result in high omission errors for the shoals class. This is likely due to confusion between deep and shallow water by the models. The WorldView-2 images have greater contrast between the classes making classification much clearer; whereas shoals in the Sentinel-2 images are not as clearly defined, particularly in Study Site 1 (Figure 10). Although Study Site 2 also has high omission errors, they appear for both sensors. These errors are due to the shoals in deeper water which are more difficult for the models to identify and not necessarily due to the image resolution. Since this is not a large difference between the sensors, computing time can be used to identify a preferred sensor to identify shoals. Although WorldView-2 will provide a higher level of detail and lower omission error, it is not always required when the purpose is to quickly identify shoal locations over large areas. In this case, shoals are equally visible in Sentinel-2 imagery and therefore the advantages of WorldView-2 may be redundant. Additionally, Sentinel-2 is ideal for this purpose due to its large swath size and its free availability. With a lower resolution, the models can be trained and classified much faster than high-resolution images.
Although using a deep learning model is more complex and time-consuming, it is possible that it could produce much more accurate results with more training samples. Training samples from various locations throughout the Arctic can be collected and used to be able to identify shoals in any image of the same sensor. This may be difficult however because shape, size and colour of shoals vary greatly depending on the site, which is primarily due to water clarity, presence of underwater vegetation, and water depth. For example, the shoals in Study Site 2 are very bright close to shore but difficult to see as depths increase. The shoals also have much more texture in Study Site 2 which may indicate the presence of vegetation. Therefore, a large variety of image tiles must be collected in order to test the trained model on new sites.

6. Conclusions

With remote sensing data becoming more accessible, it is important for hydrographic organizations (HO) to leverage the advantages that are offered with this technology. This is imperative for a country like Canada which has vast navigational waterways. Under the Oceans Protection Plan (OPP) and the World-Class Tanker Safety System (WCTSS) initiatives, CHS has increased its survey efforts in the Arctic. However, traditional surveys in the Arctic are limited by its remote locations, the short ice-free season, harsh weather conditions and its large extent. With only 13% of the Canadian Arctic adequately surveyed, the analysis potential offered by remote sensing techniques are vital for CHS. As defined by the S-4 standards of the International Hydrographic Organization (IHO), the IHO also recognizes the usage of satellite imagery for hydrographic applications. Therefore, different HOs can adopt and implement the usage of remote sensing in hydrography, especially for countries that have challenges surveying their waterways with traditional techniques.
In order to issue Notices to Mariners (NTMs) in a timely matter and ensure safe navigation, the main goal of this project was not to extract water depth values but to map uncharted hazards to navigation. Through future survey missions, CHS will validate these new shoals with traditional survey techniques, or with a more accurate satellite-derived bathymetry (SDB) approach. CHS developed an SDB technique that can extract water depth with an accuracy of approximately 1 m, and based on IHO standards, this meets the Category Zone of Confidence (CATZOC) A2/B requirement [27].
The work done under the Government Related Initiatives Program (GRIP) of the Canadian Space Agency (CSA) helped CHS in accelerating the usage of EO in hydrographic applications. The NTMs issued under this initiative and the modifications done to the Northern Low-Impact Shipping Corridors will help increase the safety to navigation in Canadian waters. Although it is the goal to provide adequate coverage of all Canadian waters, for CHS the corridors initiative provided the framework needed to focus its efforts in key navigation areas.
The next step of this project will be to systematically scan all of Canada’s navigational waterways with EO data. Since waterways are also dynamic, the goal of the AI approach developed will be to schedule annual analyses of Canada’s navigational waters with up to date EO data. Based on the results of this study, there are still important limitations in providing a fully automatic approach using AI. Even if the visual scan of the Northern Low-Impact Shipping Corridors was very effective in identifying potential hazards to navigation, an automatic approach will help guide CHS in becoming more efficient in processing the large quantity of data needed to cover Canada’s navigational areas. Furthermore, as new sensors become available to users, the amount of EO data will also continue to increase.
The automatic approach demonstrated that shoals can be successfully identified using either machine learning or deep learning techniques provided that there is appropriate training data. This research can be continued by developing a larger collection of training data to build a model that can be applied to various images in the Canadian Arctic. Classification approaches may never provide results with 100% accuracy, however, they can help operationalize the usage of EO data. Though more testing is required to refine the automatic approach, these AI models provided a promising starting point towards the modernization and transformation of CHS charting techniques with EO data.

Author Contributions

onceptualization, René Chénier; methodology, René Chénier, Mesha Sagram, Khalid Omari; Validation, Mesha Sagram; writing—original draft preparation, René Chénier; writing—review and editing, Mesha Sagram, Khalid Omari, Adam Jirovec; Supervision, René Chénier; investigation, Adam Jirovec. All authors have read and agreed to the published version of the manuscript.

Funding

This research was funded by the Government Related Initiatives Program of the Canadian Space Agency.

Acknowledgments

The authors would like to extend a thank you to the following technicians that aided in this project: Loretta Abado, Bradley Horner and Mitchell Davidson.

Conflicts of Interest

The authors declare no conflict of interest. (http://creativecommons.org/licenses/by/4.0/).

References

  1. Government of Canada. World-Class Tanker Safety System: New Measures to Strengthen Oil spill Prevention, Preparedness and Response, and the Polluter Pay Principle. 22 December 2015. Available online: https://www.tc.gc.ca/eng/mediaroom/infosheets-menu-7672.html (accessed on 28 August 2019).
  2. Government of Canada. Investments under the Oceans Protection Plan to protect Canada’s Arctic Coast and Water. 27 August 2017. Available online: https://www.canada.ca/en/transport-canada/news/2017/08/investments_undertheoceansprotectionplantoprotectcanadasarcticco.html (accessed on 22 February 2018).
  3. Chénier, R.; Abado, L.; Sabourin, O.; Tardif, L. Northern marine transportation corridors: Creation and analysis of northern marine traffic routes in Canadian waters. Trans. GIS 2017, 21, 1085–1097. [Google Scholar] [CrossRef] [Green Version]
  4. Government of Canada. Harper Government Takes Action to Enhance Marine Safety in the Arctic. 30 July 2017. Available online: https://www.canada.ca/en/news/archive/2015/07/harper-government-takes-action-enhance-marine-safety-arctic.html (accessed on 19 February 2018).
  5. Chénier, R.; Abado, L.; Martin, H. CHS Priority Planning Tool (CPPT)—A GIS Model for Defining Hydrographic Survey and Charting Priorities. ISPRS Int. J. Geo-Inf. 2018, 7, 240. [Google Scholar] [CrossRef] [Green Version]
  6. Chénier, R.; Faucher, M.-A.; Ahola, R.; Jiao, X.; Tardif, L. Remote sensing approach for updating CHS charts. In Proceedings of the Canadian Hydrographic Conference, Halifax, NS, Canada, 16–17 May 2016. [Google Scholar]
  7. Panboonyuen, T.; Jitkajornwanich, K.; Lawawirojwong, S.; Srestasathiern, P.; Vateekul, P. Road segmentation of remotely-sensed images using deep convolutional neural networks with landscape metrics and conditional random fields. Remote Sens. 2017, 9, 680. [Google Scholar] [CrossRef] [Green Version]
  8. Lawrence, R.; Wood, S.; Sheley, R. Mapping invasive plants using hyperspectral imagery and Breiman Cutler classifications (random forest). Remote Sens. Environ. 2006, 100, 356–362. [Google Scholar] [CrossRef]
  9. Rodriguez-Galiano, V.; Ghimire, B.; Rogan, J.; Chica-Olmo, M.; Rigol-Sanchez, J. An assessment of the effectiveness of a random forest classifier for land-cover classification. ISPRS J. Photogramm. Remote Sens. 2012, 67, 93–104. [Google Scholar] [CrossRef]
  10. White, L.; Millard, K.; Banks, S.; Richardson, M.; Pasher, J.; Duffe, J. Moving to the RADARSAT Constellation Mission: Comparing Synthesized Compact Polarimetry and Dual Polarimetry Data with Fully Polarimetric RADARSAT-2 Data for Image Classification of Peatlands. Remote Sens. 2017, 9, 573. [Google Scholar] [CrossRef] [Green Version]
  11. van Beijma, S.; Comber, A.; Lamb, A. Random forest classification of salt marsh vegetation habitats using quad-polarimetric airborne SAR, elevation and optical RS data. Remote Sens. Environ. 2014, 149, 118–129. [Google Scholar] [CrossRef]
  12. Corcoran, J.; Knight, J.; Gallant, A. Influence of Multi-Source and Multi-Temporal Remotely Sensed and Ancillary Data on the Accuracy of Random Forest Classification of Wetlands in Northern Minnesota. Remote Sens. 2013, 5, 3212–3238. [Google Scholar] [CrossRef] [Green Version]
  13. Fukushima, K. Neocognitron: A hierarchical neural network capable of visual pattern recognition. Neural Netw. 1988, 1, 119–130. [Google Scholar] [CrossRef]
  14. LeCun, Y.; Bottou, L.; Bengio, Y.; Haffner, P. Gradient-based learning applied to document recognition. Proc. IEEE 1998, 86, 2278–2323. [Google Scholar] [CrossRef] [Green Version]
  15. Simard, P.; Steinkraus, D.; Platt, J. Best practices for convolutional neural networks applied to visual document analysis. In Proceedings of the 7th International Conference on Document Analysis and Recognition, Edinburgh, UK, 6 August 2003. [Google Scholar]
  16. Ciresan, D.; Meier, J.; Masci, J.; Gambardella, L.; Schmidhuber, J. Flexible, high performance convolutional neural networks for image classification. In Proceedings of the 22nd International Joint Conference on Artificial Intelligence, Manno-Lugano, Switzerland, 19–22 July 2011. [Google Scholar]
  17. Song, A.; Kim, Y.; Kim, Y. Change detection of surface water in remote sensing images based on fully convolutional network. J. Coast. Res. 2019, 91, 426–430. [Google Scholar] [CrossRef]
  18. Pu, F.; Ding, C.; Chao, Z.; Yu, Y.; Xu, X. Water-quality classification of inland lakes using Landsat8 images by convolutional neural networks. Remote Sens. 2019, 11, 1674. [Google Scholar] [CrossRef] [Green Version]
  19. Fu, G.; Lie, C.; Zhou, R.; Sun, T.; Zhang, Q. Classification for high resolution remote sensing imagery using a fully convolutional network. Remote Sens. 2017, 9, 498. [Google Scholar] [CrossRef] [Green Version]
  20. Long, J.; Shelhamer, E.; Darrell, T. Fully Convolutional Networks for Semantic Segmentation. In Proceedings of the Conference on Computer Vision and Pattern Recognition (CVPR), Boston, MA, USA, 7–12 July 2015. [Google Scholar]
  21. Liu, S.; Qi, Z.; Li, X.; Yeh, A.-O. Integration of convolutional neural networks and object-based post-classification refinement for land use and land cover mapping with optical and SAR data. Remote Sens. 2019, 11, 690. [Google Scholar] [CrossRef] [Green Version]
  22. Ronneberger, O.; Fischer, P.; Brox, T. U-Net: Convolutional Networks for Biomedical; Computer Science Department and BIOSS Centre for Biological Signalling Studies, University of Freiburg: Breisgau, Germany, 2015. [Google Scholar]
  23. Flood, N.; Watson, F.; Collett, L. Using a U-net convolutional neural network to map woody vegetation extent from high resolution satellite imagery across Queensland, Australia. Int. J. Appl. Earth Obs. Geoinf. 2019, 82, 101897–101912. [Google Scholar] [CrossRef]
  24. Zhang, Z.; Liu, Q.; Wang, Y. Road Extraction by Deep Residual U-Net. IEEE Geosci. Remote Sens. 2018, 15, 749–753. [Google Scholar] [CrossRef] [Green Version]
  25. Zhang, P.; Ke, Y.; Zhang, Z.; Wang, M.; Li, P.; Zhang, S. Urban Land Use and Land Cover Classification Using Novel Deep Learning Models Based on High Spatial Resolution Satellite Imagery. Sensors 2018, 18, 3717. [Google Scholar] [CrossRef] [PubMed] [Green Version]
  26. International Hydrographic Organization. Regulations of the IHO for International (INT) Charts (S-4), Edition 4.8.0; International Hydrographic Organization: Monaco-Ville, Monaco, 2019. [Google Scholar]
  27. Chénier, R.; Ahola, R.; Sagram, M.; Faucher, M.-A.; Shelat, Y. Consideration of level of confidence within multi-approach satellite-derived bathymetry. Int. J. Geo-Inf. 2019, 8, 48. [Google Scholar] [CrossRef] [Green Version]
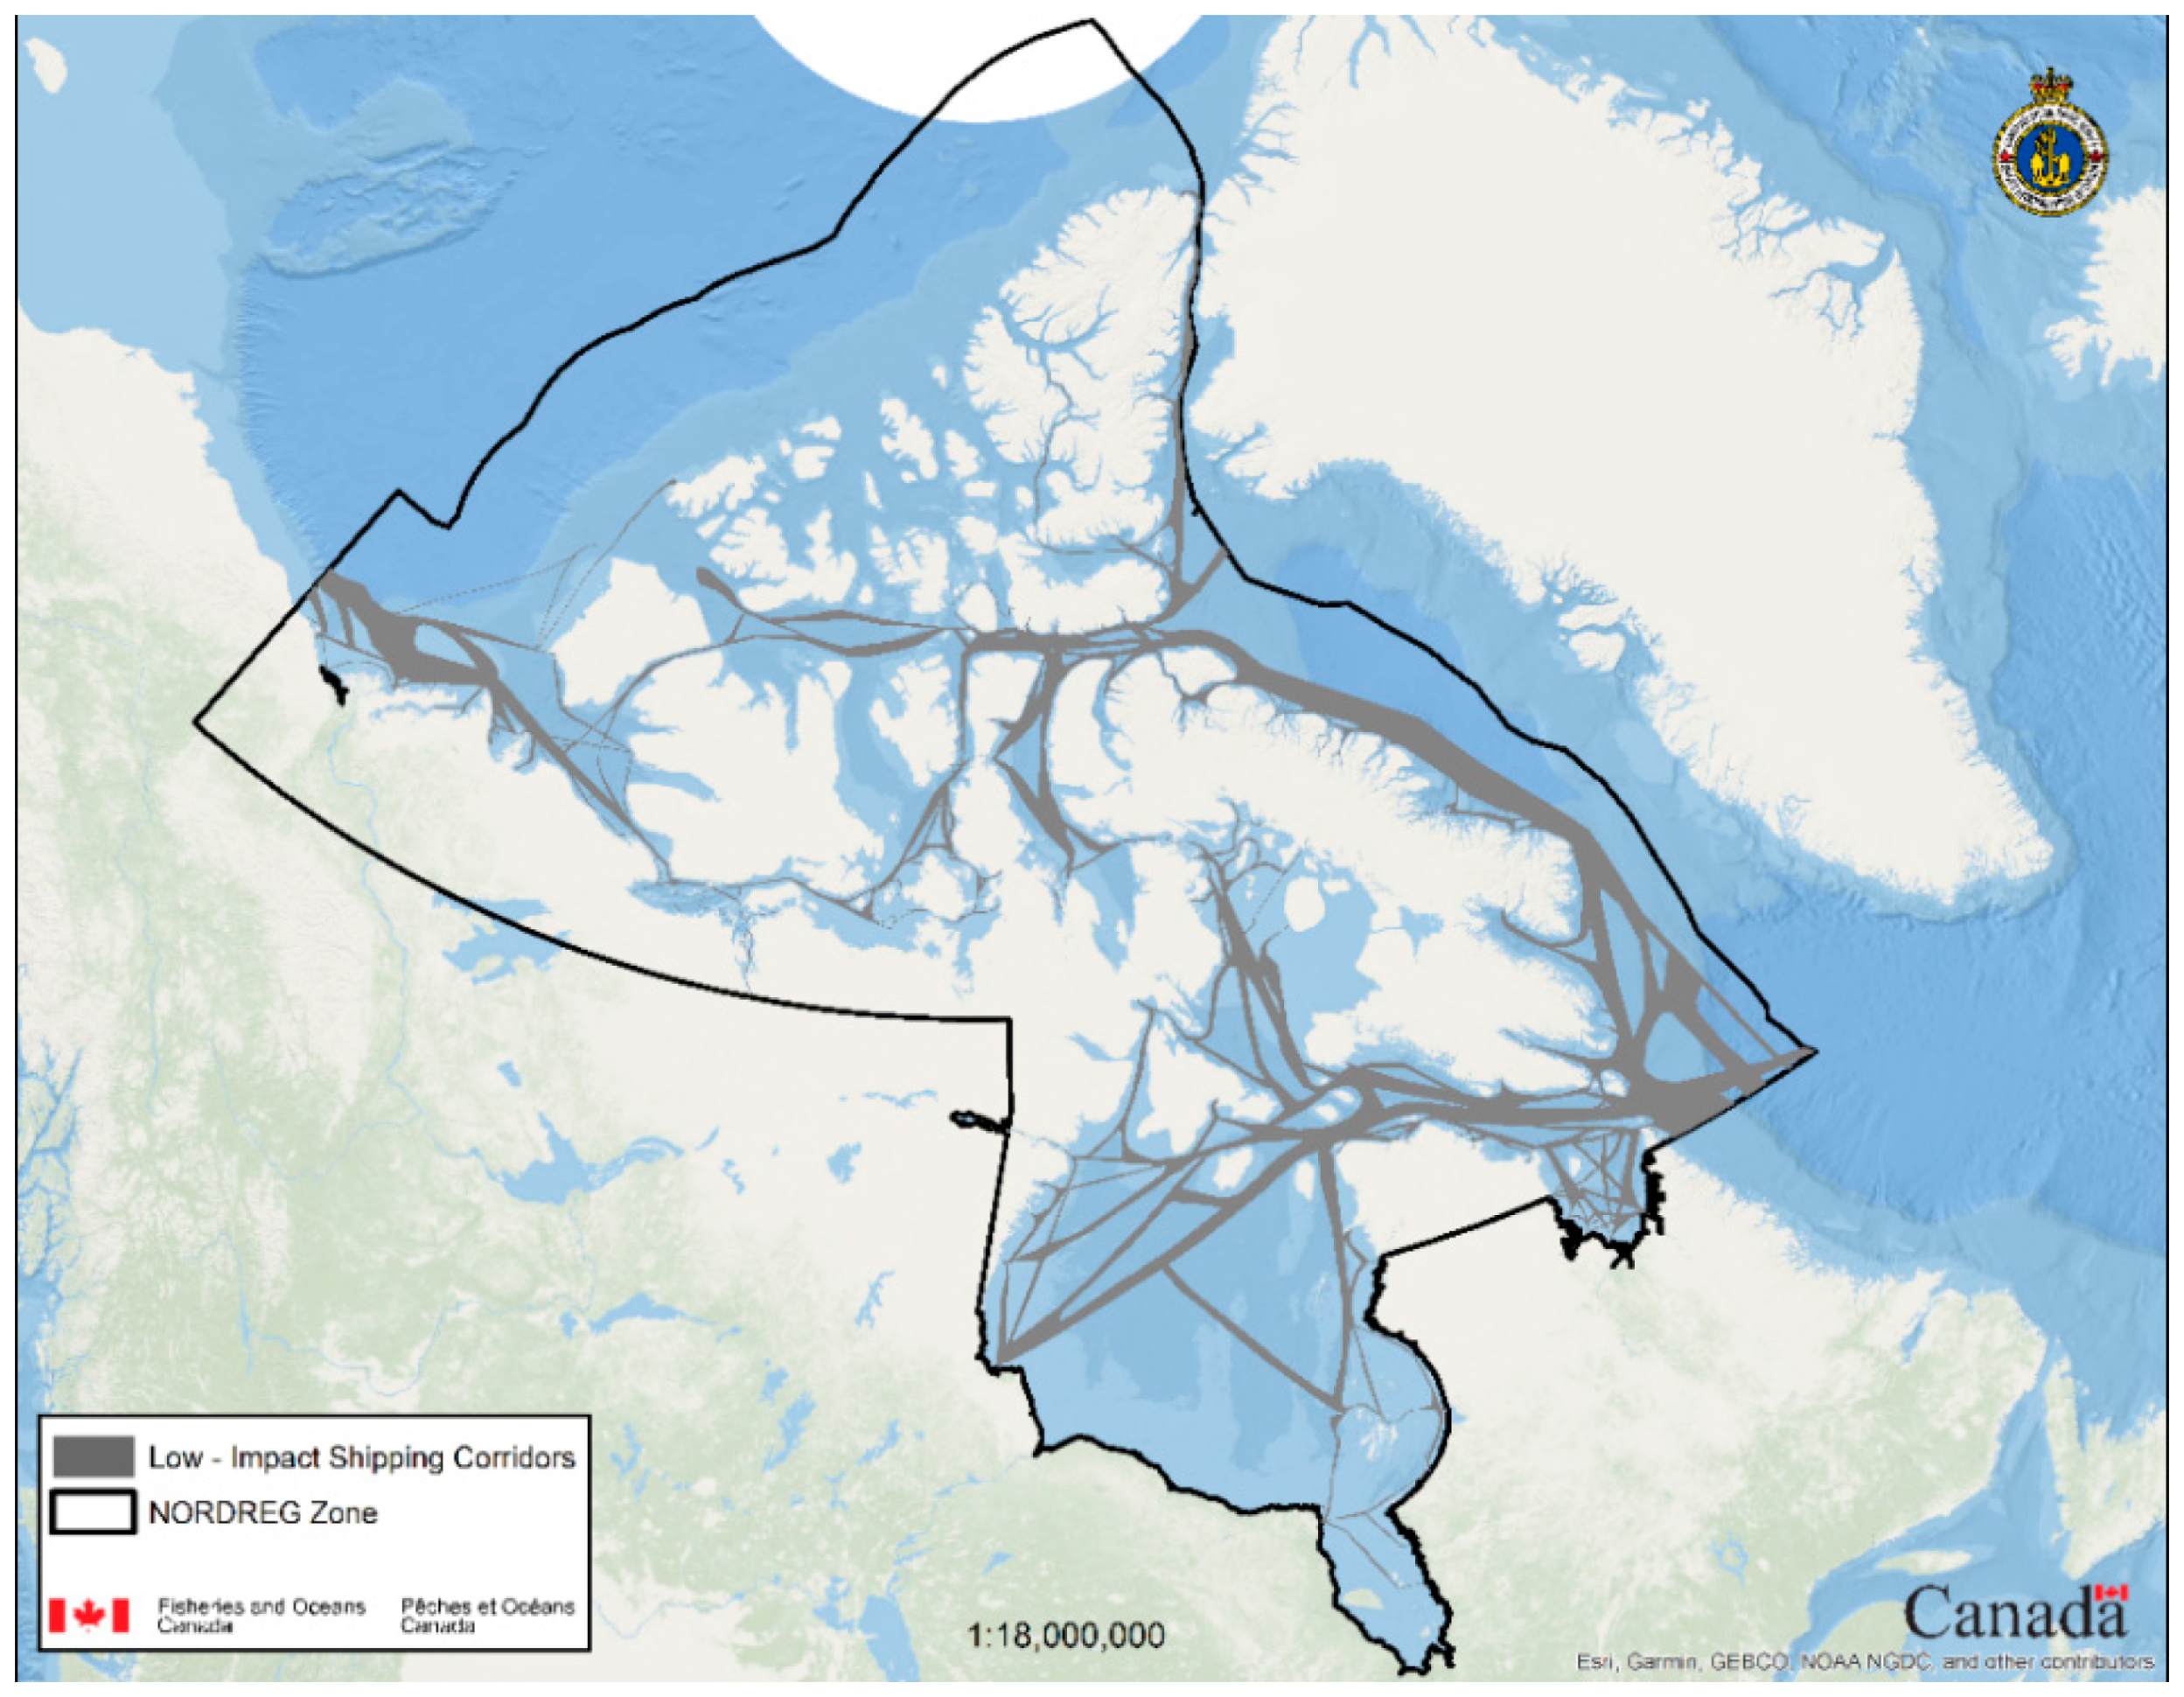
Figure 1. Northern Low-Impact Shipping Corridors within the Northern Canada Vessel Traffic Services Zone (NORDREG Zone).
Ijgi 09 00383 g001
Figure 2. Location of Study Site 1, near Puvirnituq, Quebec.
Ijgi 09 00383 g002
Figure 3. Outline of Study Site 1 in (a) Chart 5510 which indicates a large portion of the area is uncharted (showcased through whitespace on the chart), and (b) a Sentinel-2 image acquired on 21 August 2019 where shallow water is visible within the study area. ©2019, Copernicus.
Ijgi 09 00383 g003
Figure 4. Location of Study Site 2, near Taloyoak, Nunavut.
Ijgi 09 00383 g004
Figure 5. Outline of study site 2 near Taloyoak and the Northern Low-Impact Shipping Corridor in (a) Chart 7701 and (b) a WorldView-2 image acquired on 13 August 2017. ©2017, DigitalGlobe, Inc.
Ijgi 09 00383 g005
Figure 6. The original U-Net architecture [22].
Ijgi 09 00383 g006
Figure 7. Example of notice to mariners (NTMs) issued by Canadian Hydrographic Service (CHS).
Ijgi 09 00383 g007
Figure 8. Example of a notice to mariners issued on CHS electronic navigational charts (ENC) (ENC #CA273274).
Ijgi 09 00383 g008
Figure 9. Location of potential corridor modification due to identified shoals.
Ijgi 09 00383 g009
Figure 10. Automatic detection results with (a) a WorldView-2 image of Study Site 1, (b) CNN deep learning WorldView-2 results, (c) random forest (RF) machine learning WorldView-2 results, (d) a Sentinel-2 image of Study Site 1, (e) CNN deep learning Sentinel results, and (f) RF machine learning Sentinel results. ©2017, DigitalGlobe and 2019, Copernicus.
Ijgi 09 00383 g010
Figure 11. Automatic detection results with (a) a WorldView-2 image of Study Site 2, (b) CNN deep learning WorldView-2 results, (c) RF machine learning WorldView-2 results, (d) a Sentinel-2 image of Study Site 2, (e) CNN deep learning Sentinel results, and (f) RF machine learning Sentinel results. ©2017, DigitalGlobe and 2018, Copernicus.
Ijgi 09 00383 g011
Table 1. Sensors used in the visual shoal detection of the Northern Low-Impact Shipping Corridors.
SensorSwath Width (km)Resolution (m)Bands Used
Landsat 818530 mBlue, Green, Red, NIR
Sentinel-229010 mBlue, Green, Red, NIR
PlanetScope24.63 mBlue, Green, Red, NIR
Table 2. Images used in the convolution neural network model (CNN) and random forest (RF) classification.
Study SiteSensorDateBands Used
1Worlview-221 August 2017Blue, Green, Red, NIR1
1Sentinel-221 August 2019Blue, Green, Red, NIR
2Worlview-213 August 2017Blue, Green, Red, NIR1
2Sentinel-213 August 2018Blue, Green, Red, NIR
Table 3. Study Site 1 results displaying the commission and omission errors of the shoals class and the overall accuracy for the three shoals, deep water, and land classes.
SensorClassifierCommission Error (%)Omission Error (%)Overall Accuracy (%)
WorldView-2Convolutional Neural Network17.361.2192.69
WorldView-2Random Forest5.689.2093.50
Sentinel-2Convolutional Neural Network5.6820.0087.61
Sentinel-2Random Forest2.3130.1489.41
Table 4. Study Site 2 results displaying the commission and omission errors of the shoals class and the overall accuracy for the three shoals, deep water, and land classes.
SensorClassifierCommission Error (%)Omission Error (%)Overall Accuracy (%)
WorldView-2Convolutional Neural Network20.7228.3481.15
WorldView-2Random Forest0.6038.3384.50
Sentinel-2Convolutional Neural Network13.1241.3279.90
Sentinel-2Random Forest15.2241.5779.15