GIS-Based Statistical Analysis of Detecting Fear of Crime with Digital Sketch Maps: A Hungarian Multicity Study

Abstract
1. Introduction
2. Materials and Methods
2.1. Data Collection
2.2. Data Preparation
3. Results
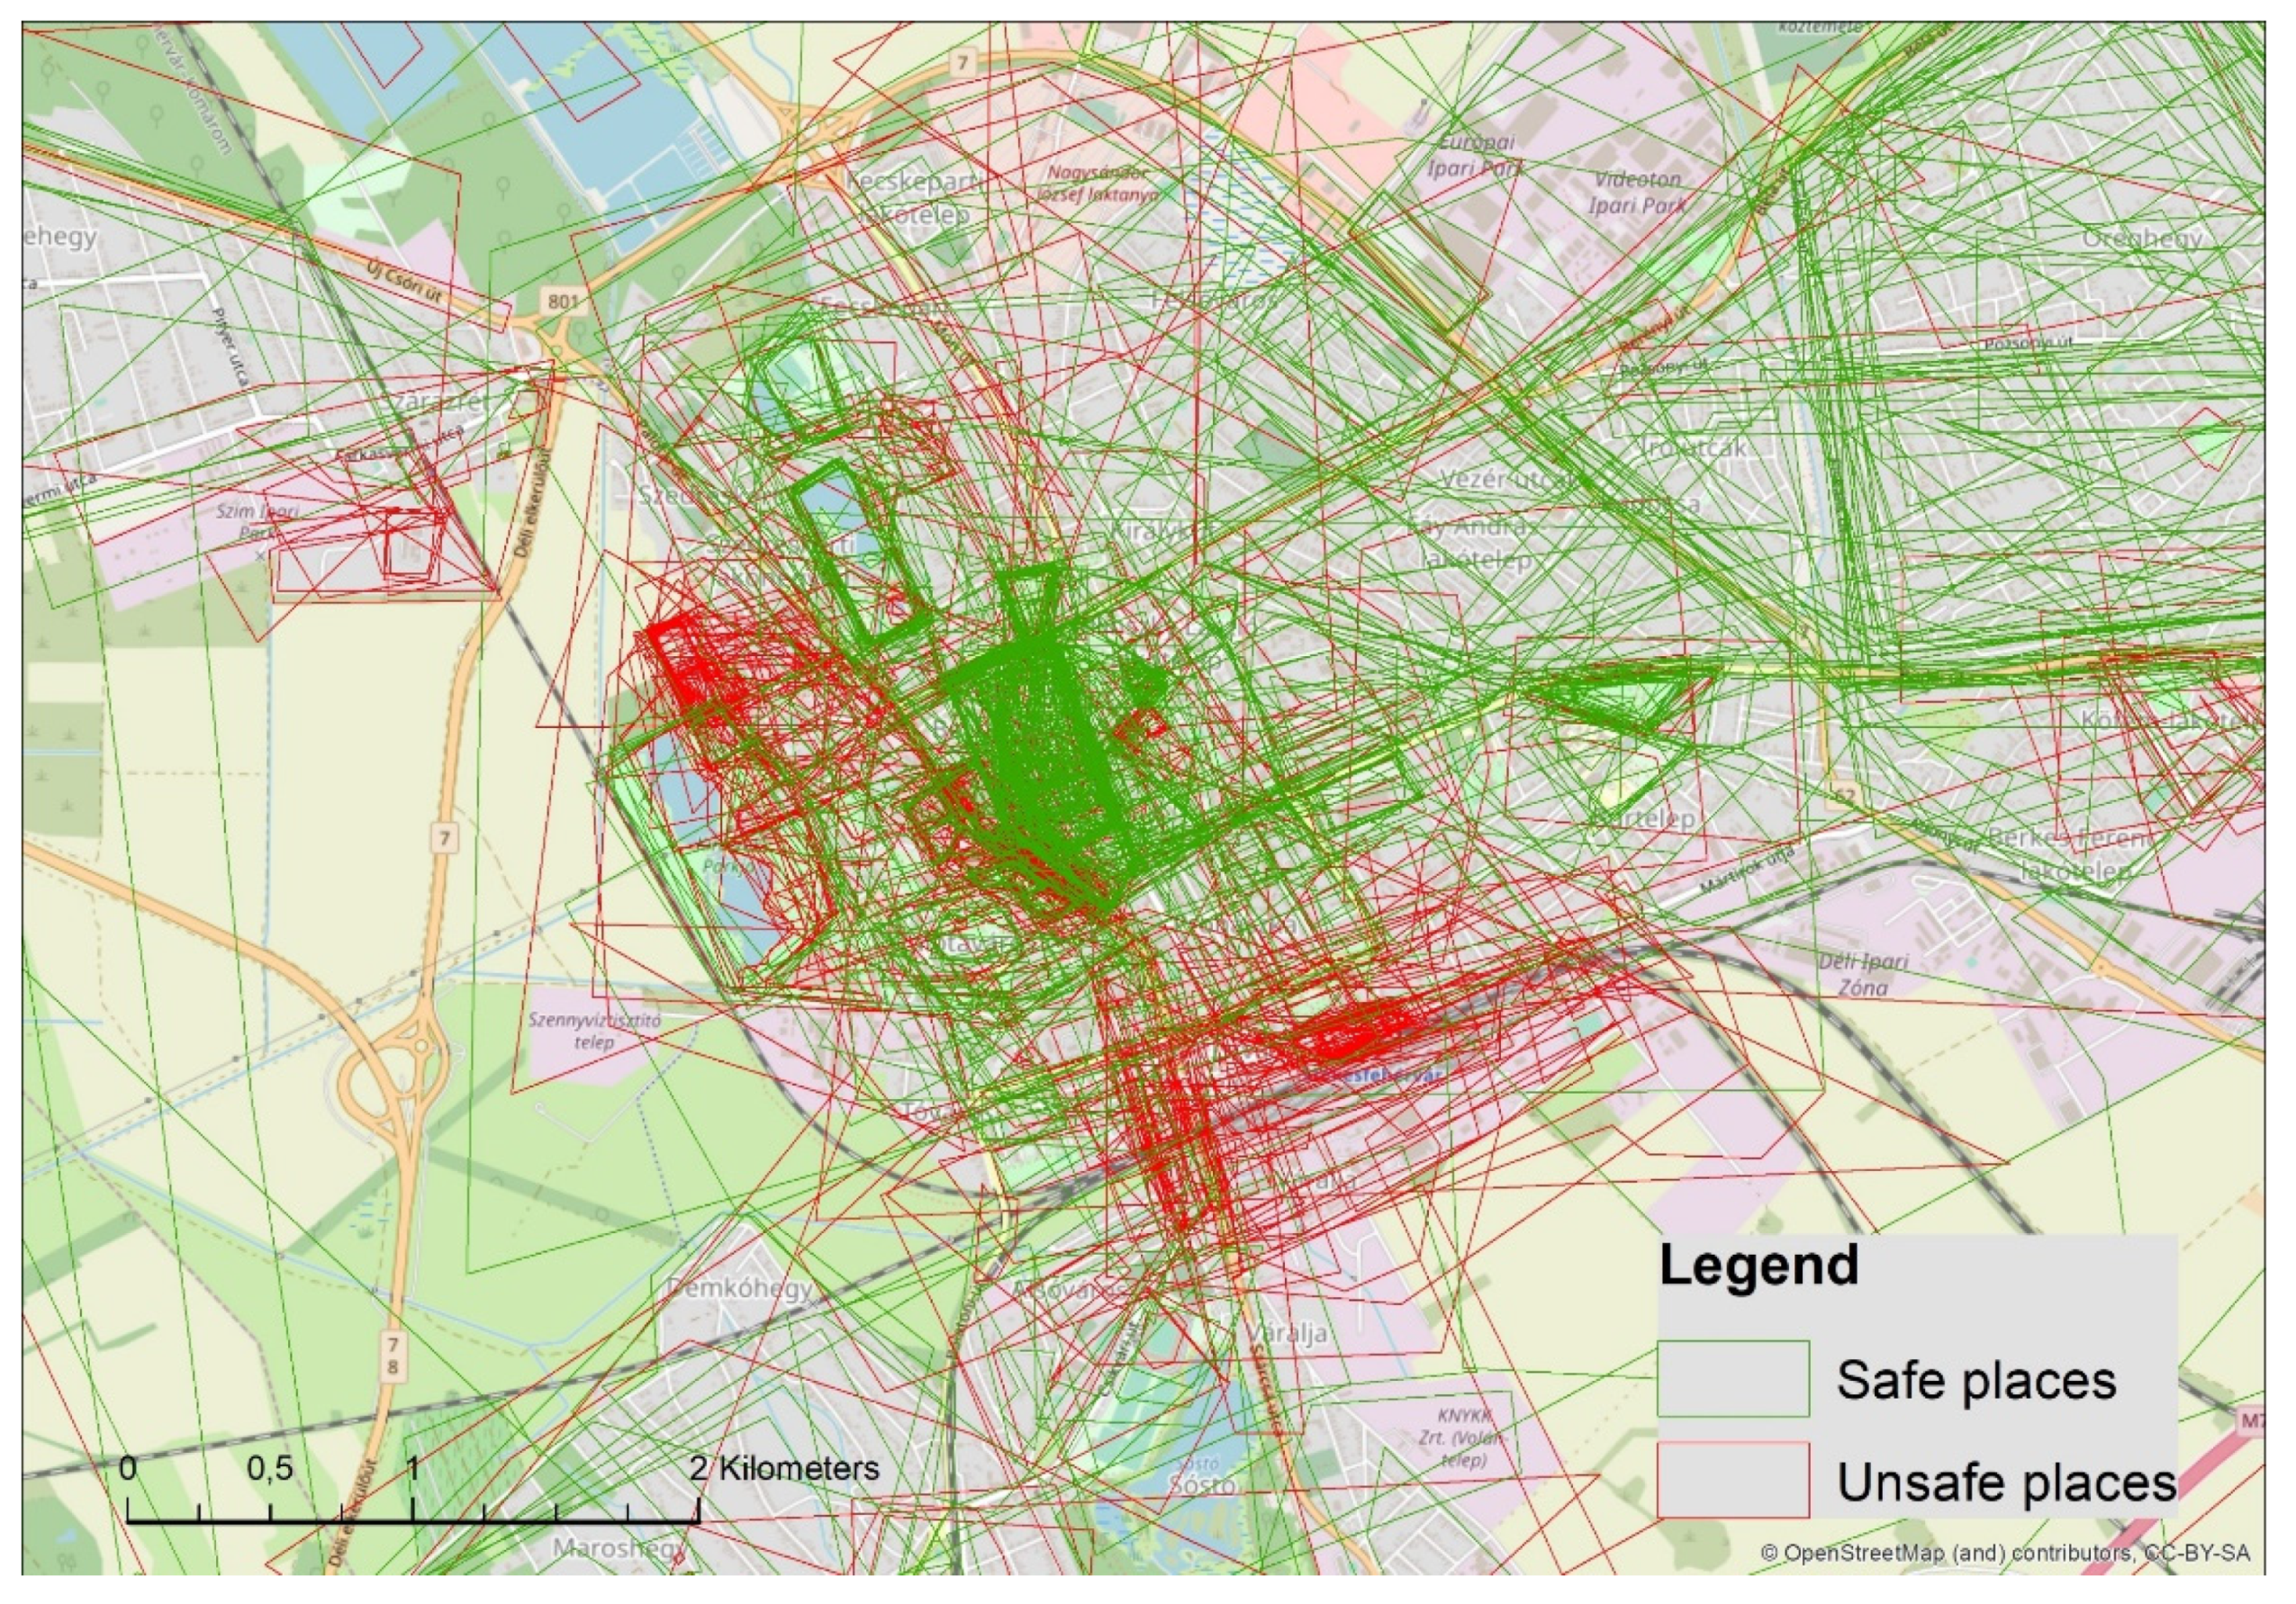
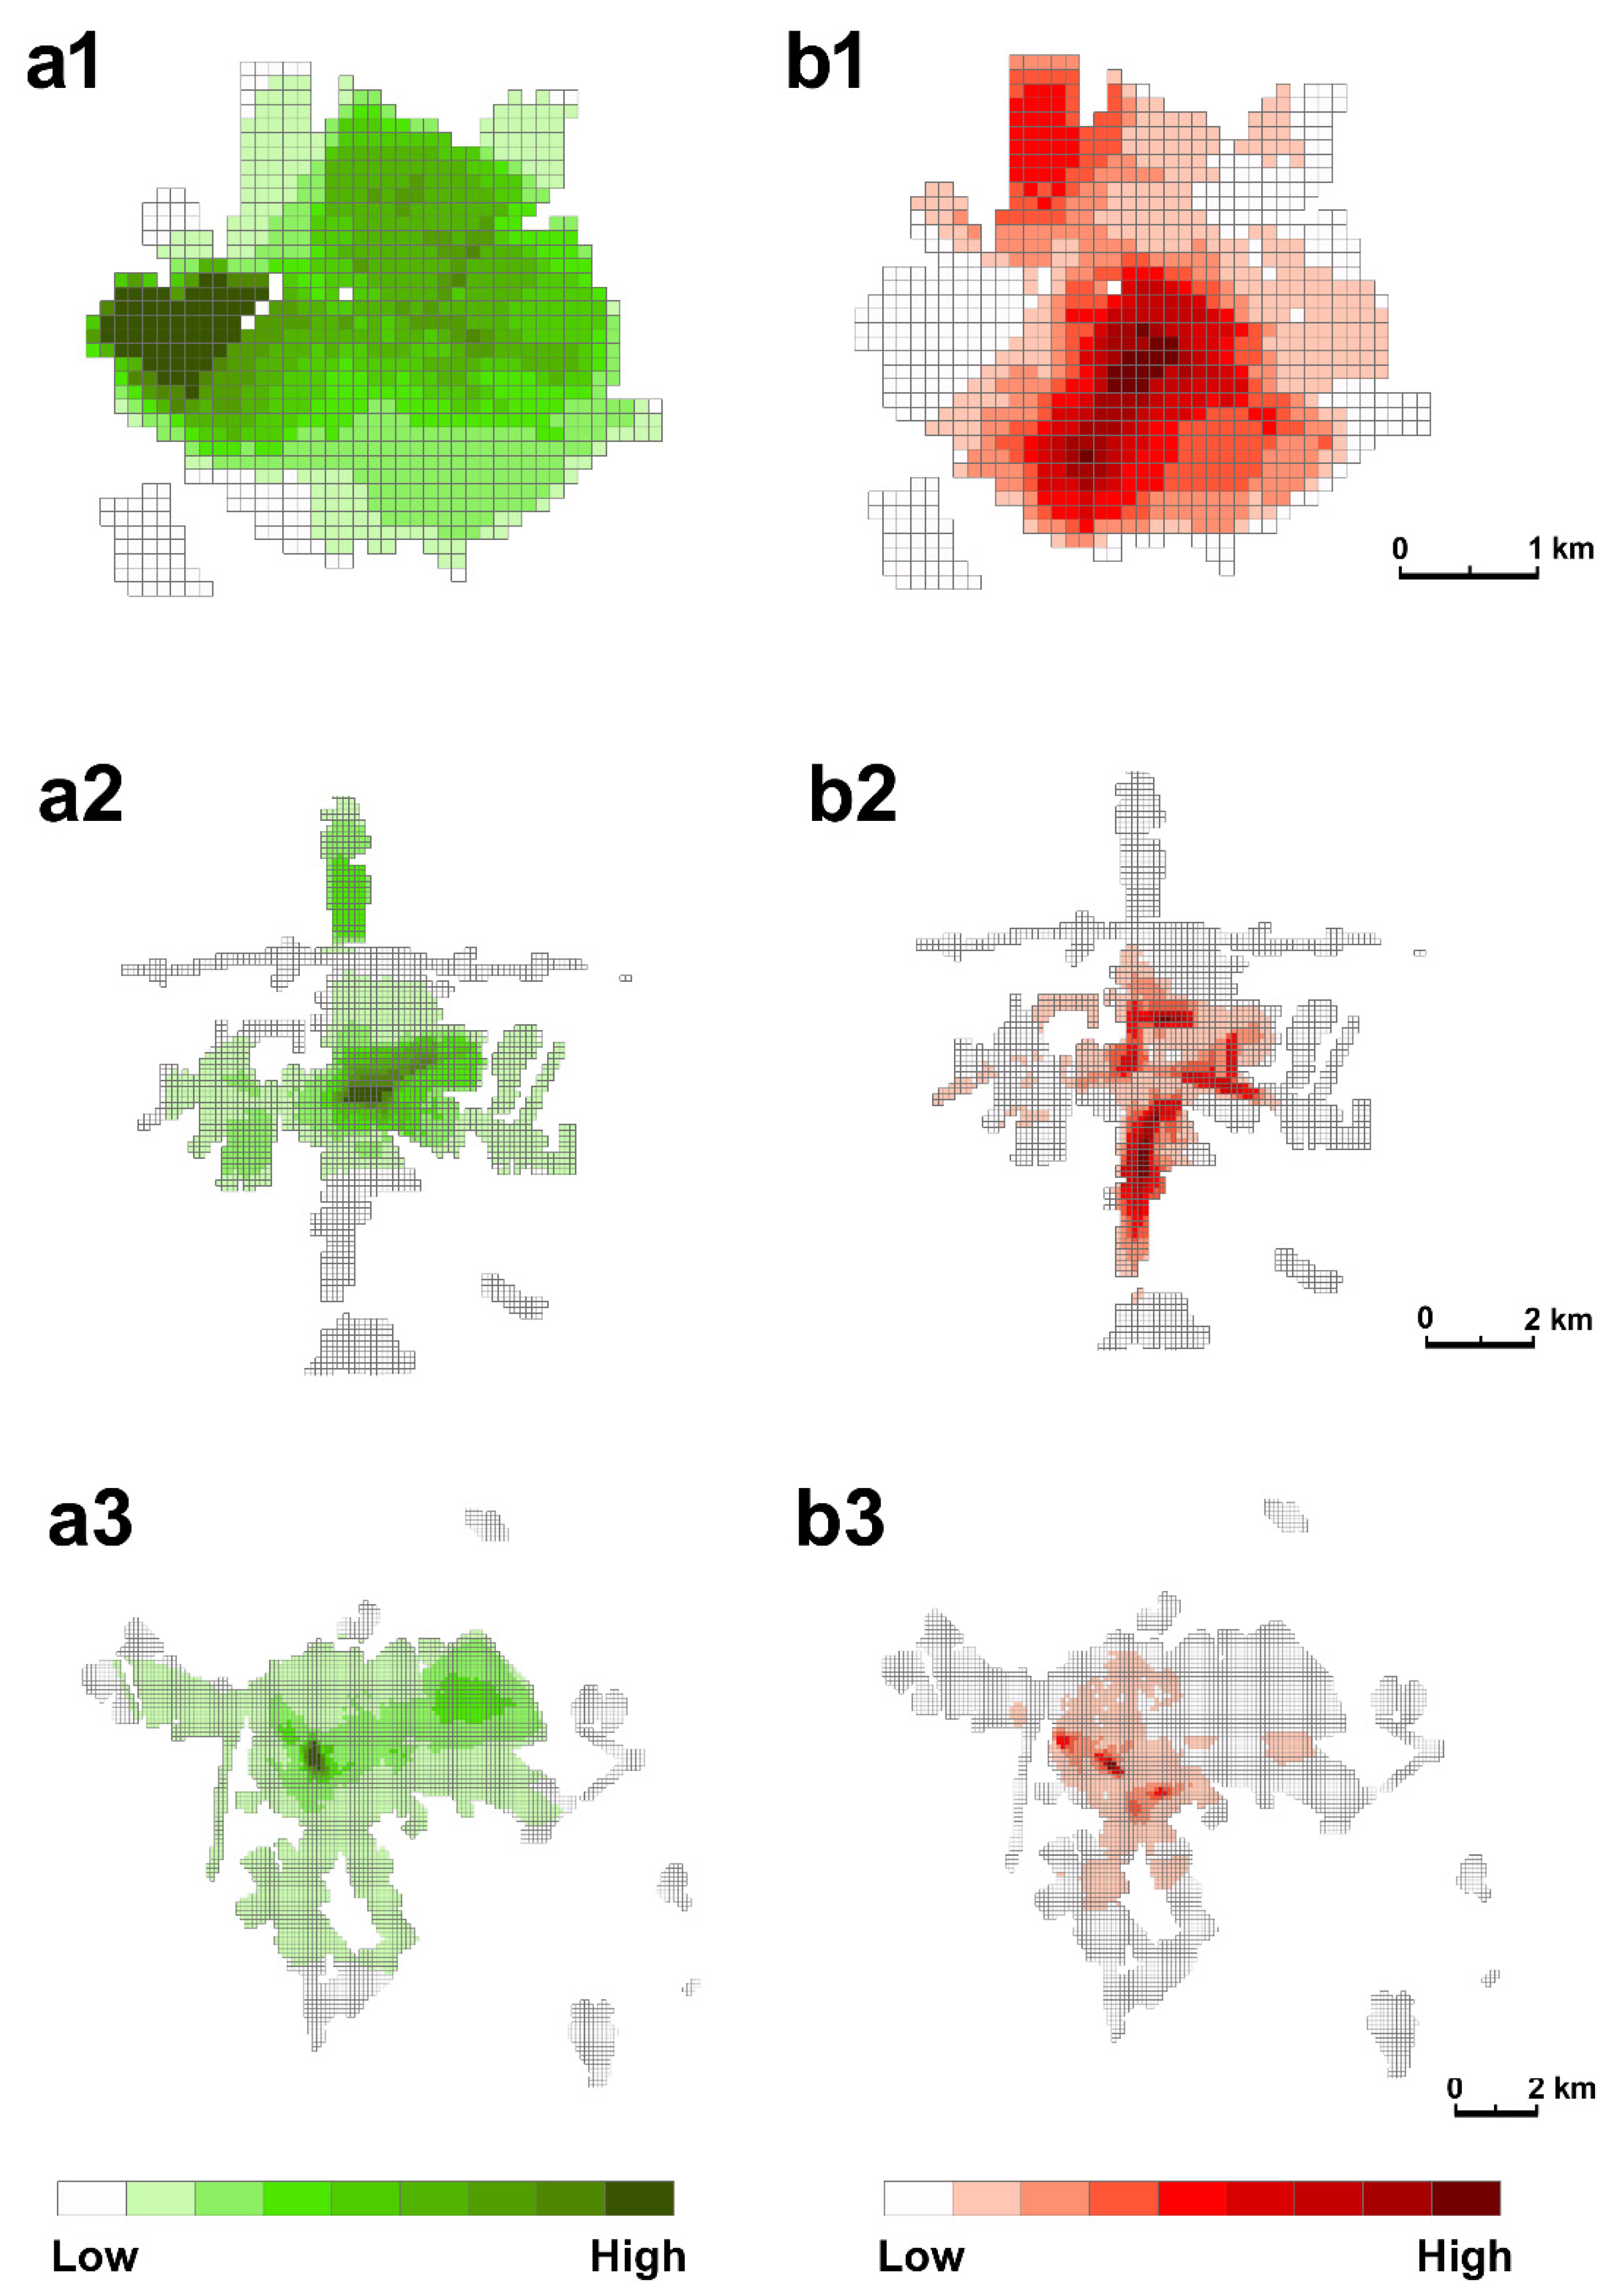
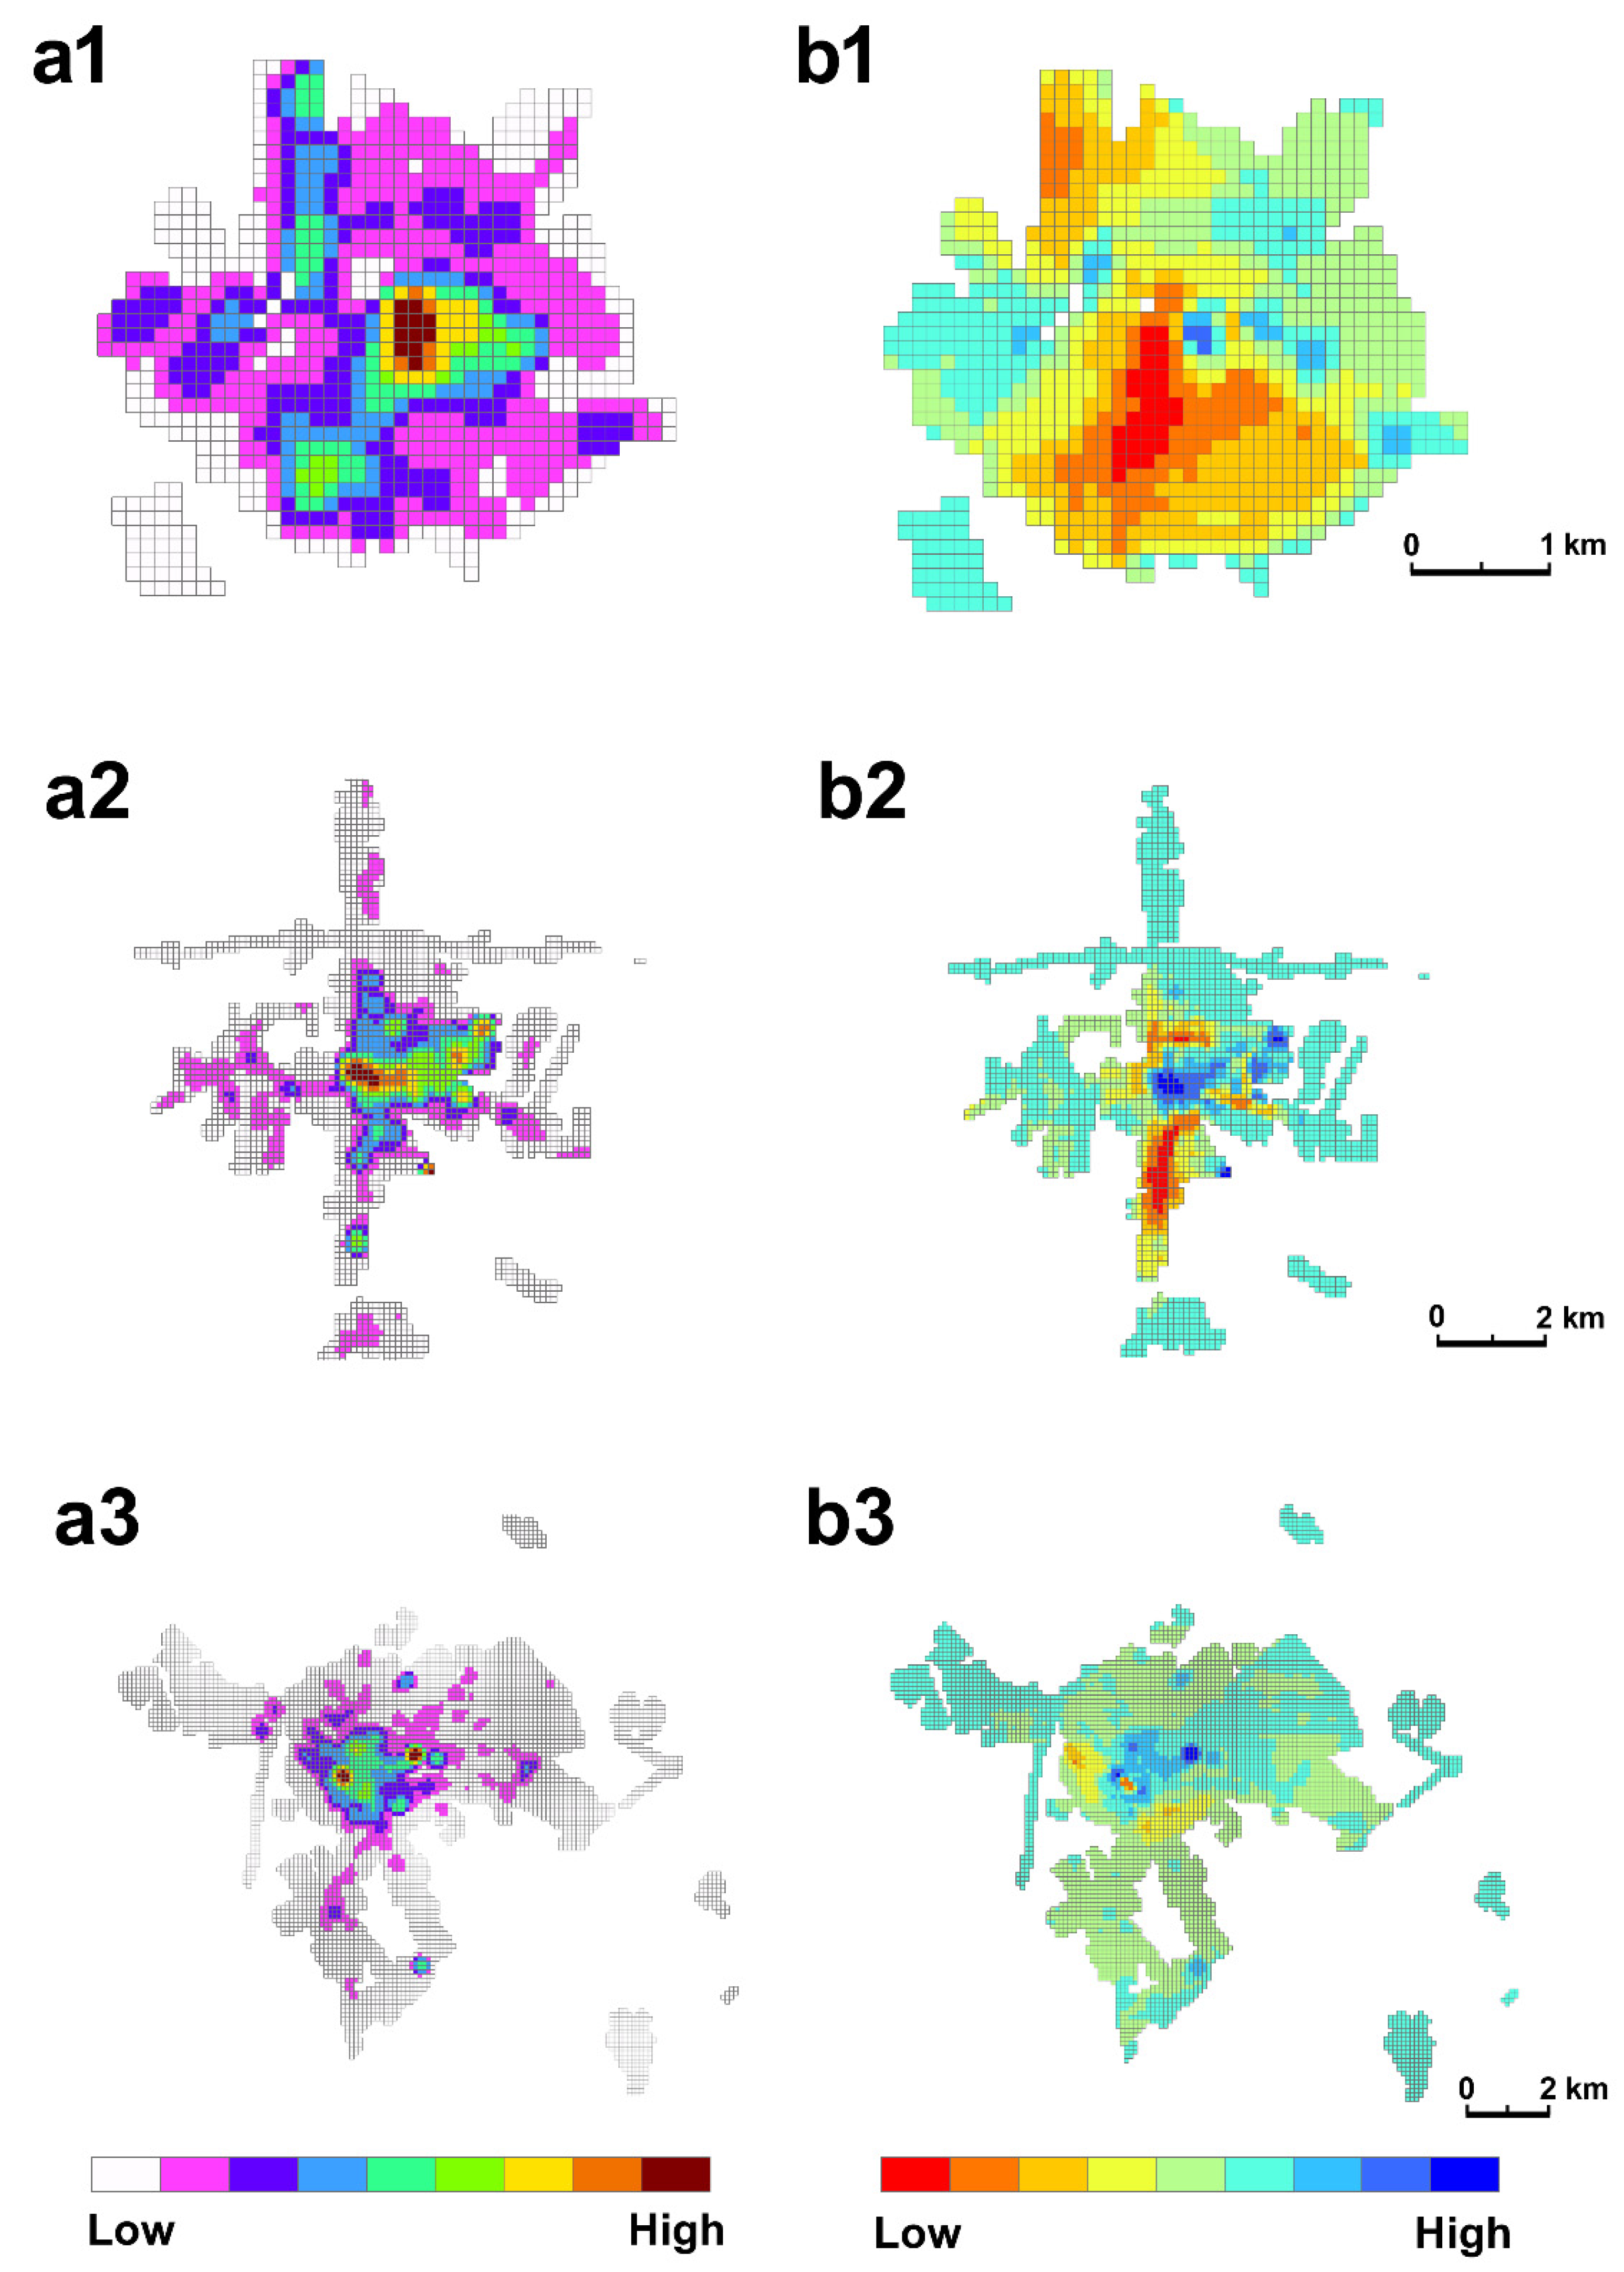
3.1. Spatial Pattern Analysis of the Opinions of People
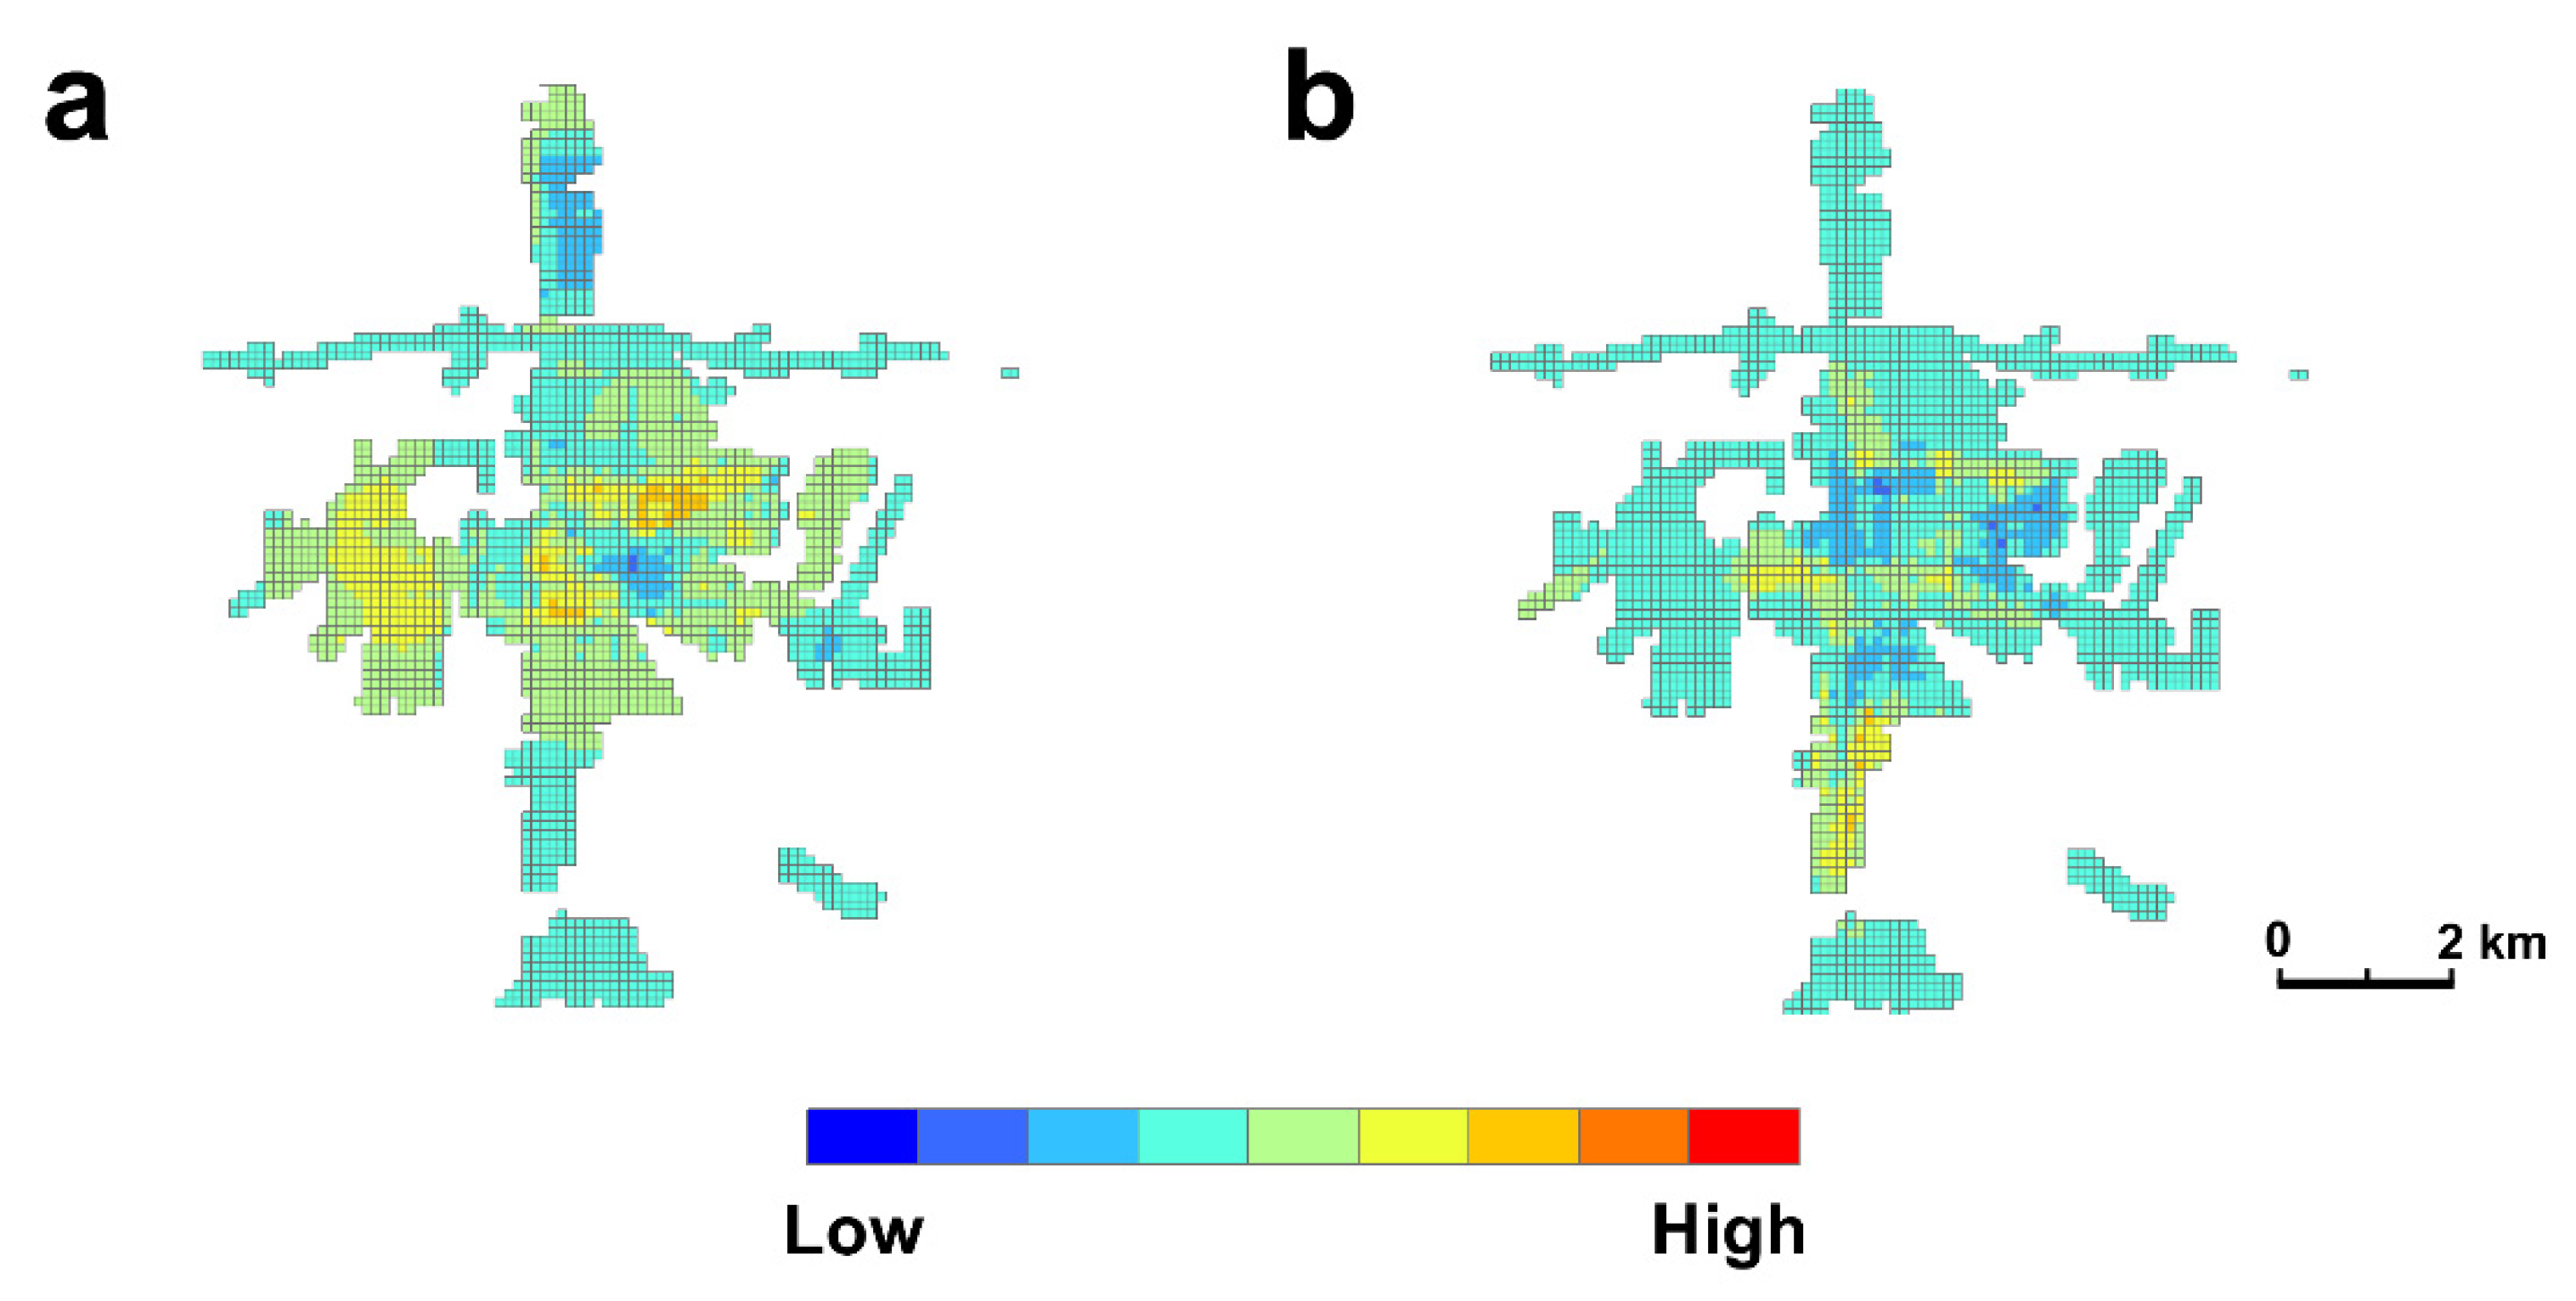
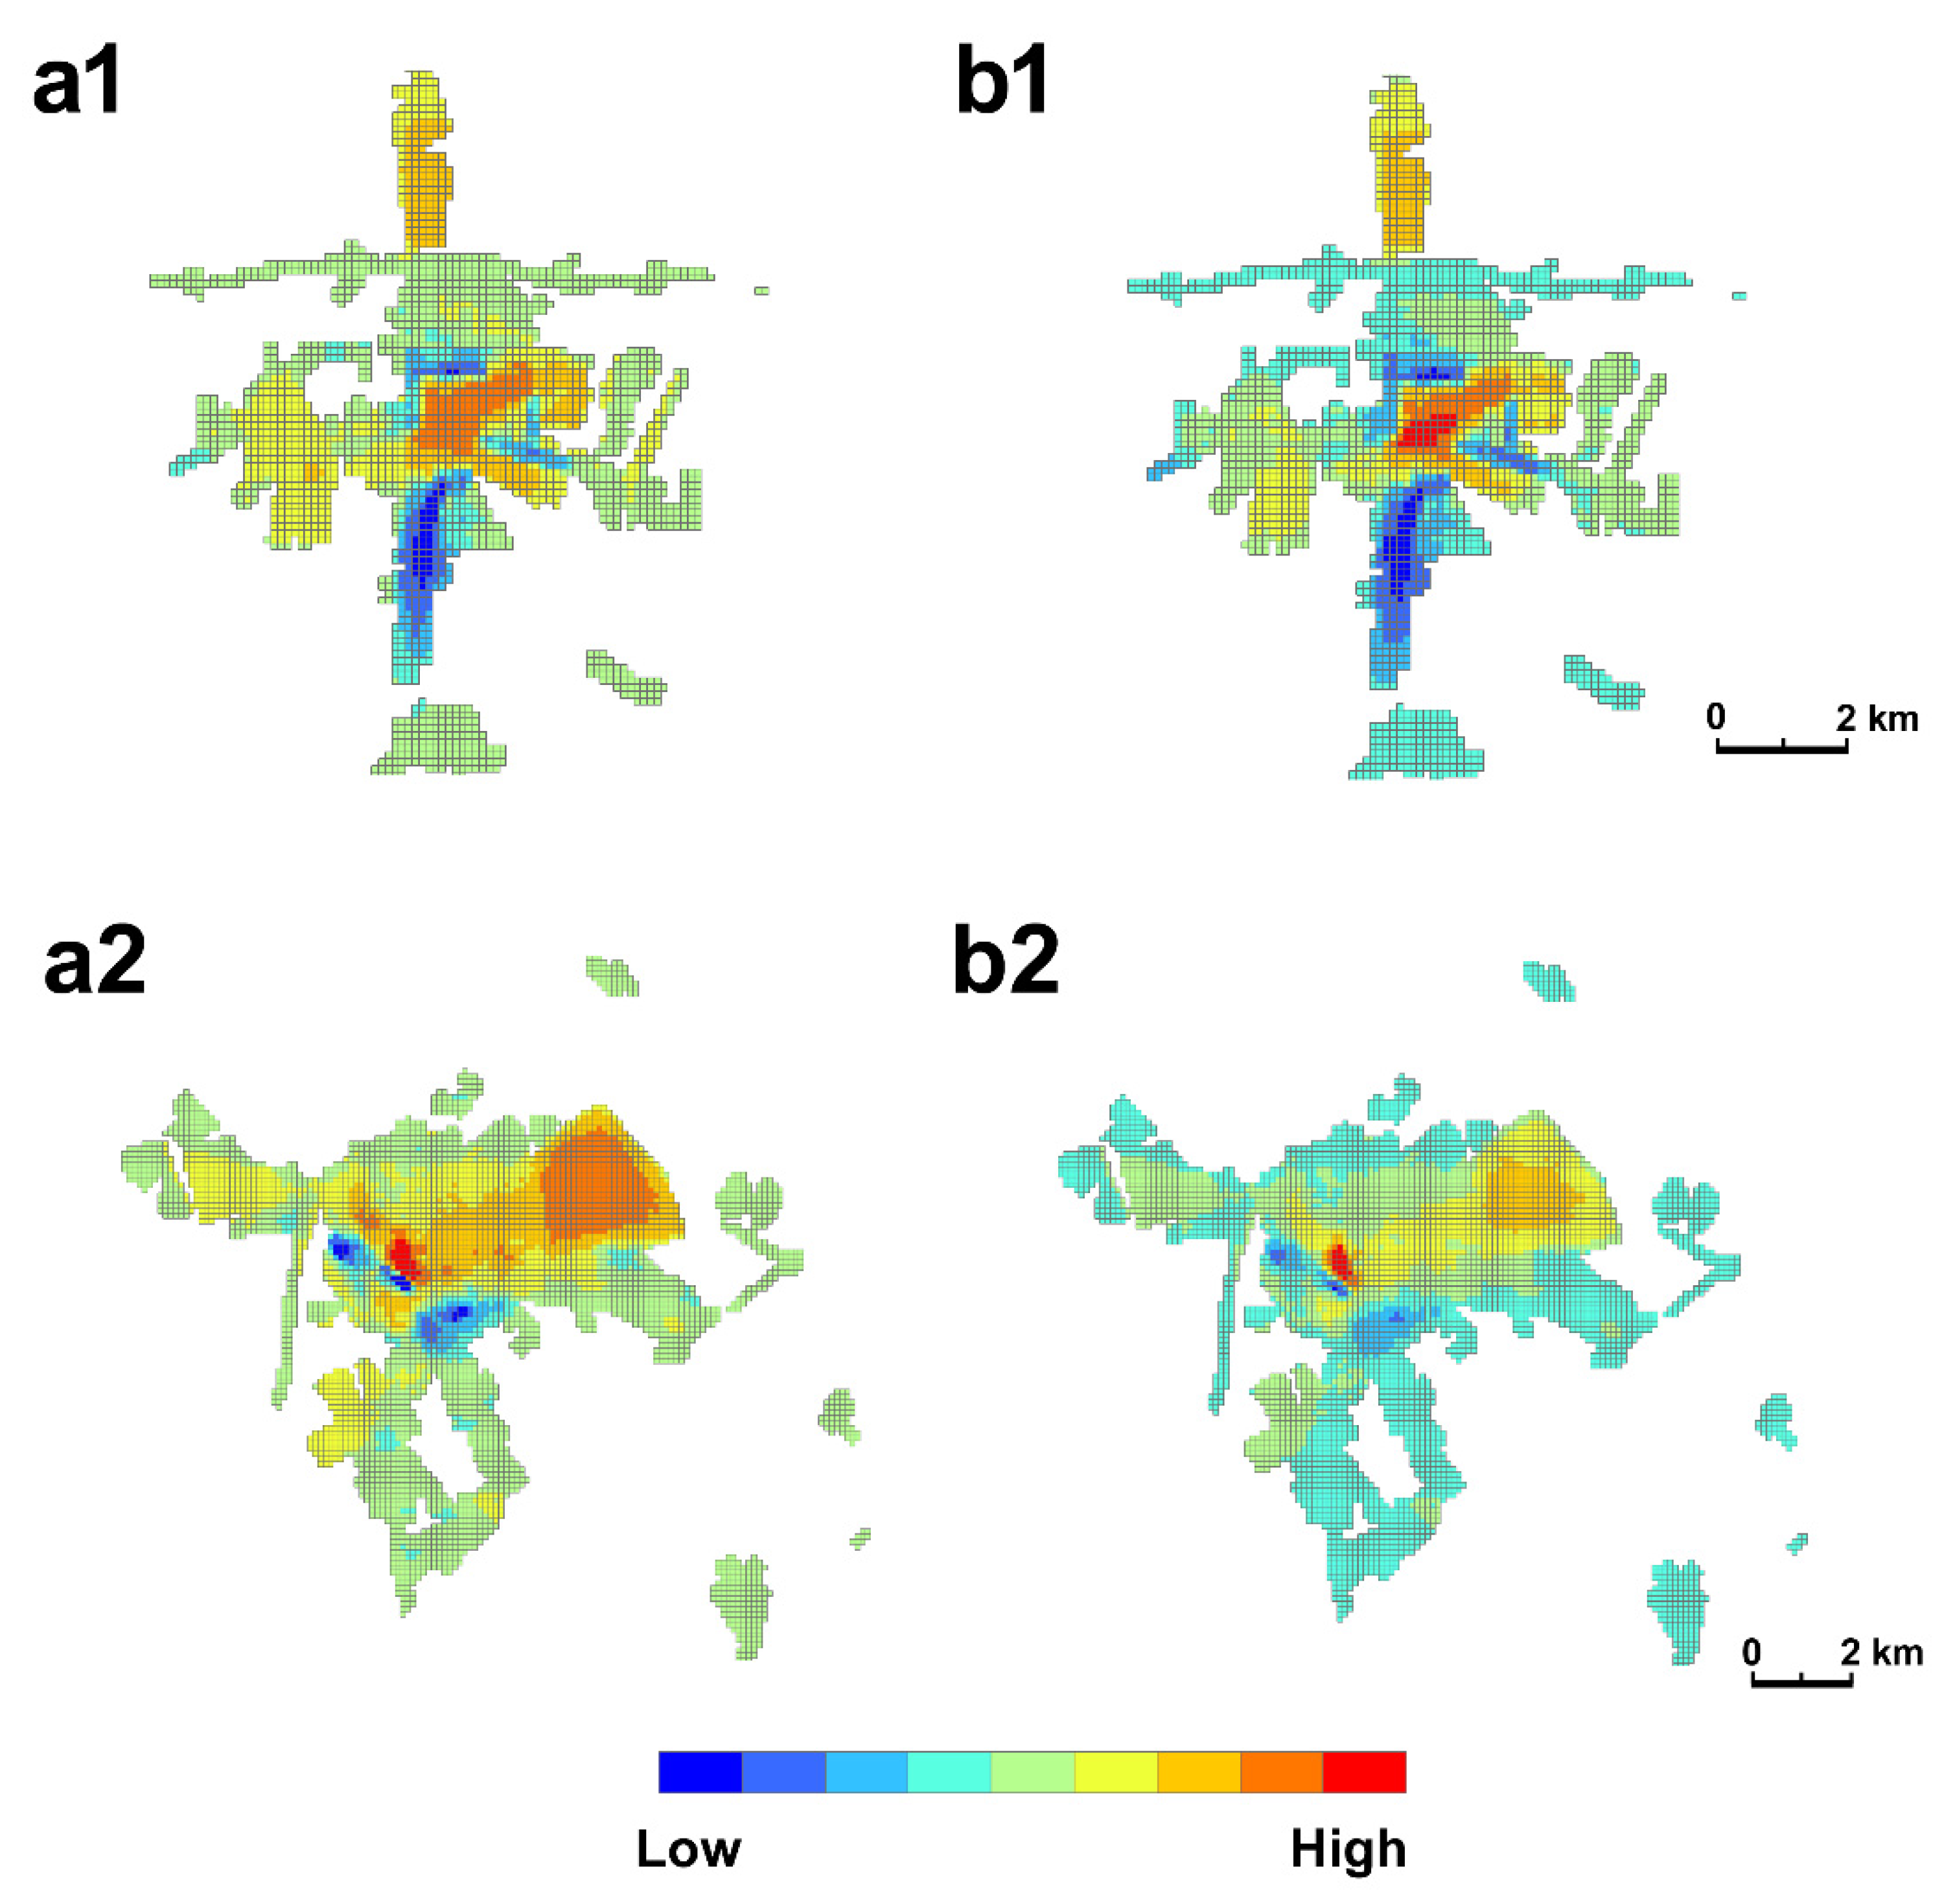
3.2. Comparing Unsafety Patterns with Official Crime Statistics
4. Discussion
5. Conclusions
Author Contributions
Funding
Acknowledgments
Conflicts of Interest
References
- Furstenberg, F.F. Public Reaction to Crime in the Streets. In The Fear of Crime; Routledge: London, UK, 2017; pp. 3–12. [Google Scholar] [CrossRef]
- Zedner, L. Victims. In The Oxford Handbook of Criminology, 2nd ed.; Maguire, M., Morgan, R., Reiner, R., Eds.; Clarendon Press: Oxford, UK, 2002; pp. 577–612. [Google Scholar] [CrossRef]
- Doran, B.J.; Burgess, M.B. Putting Fear of Crime on the Map; Springer: New York, NY, USA, 2012. [Google Scholar] [CrossRef]
- Farrall, S.; Bannister, J.; Ditton, J.; Gilchrist, E. Social psychology and the fear of crime. Br. J. Criminol. 2000, 40, 399–413. [Google Scholar] [CrossRef]
- Ditton, J.; Bannister, J.; Gilchrist, E.; Farrall, S. Afraid or Angry? Recalibrating the “Fear” of Crime. In Fear of Crime; Routledge: London, UK, 2017; pp. 535–551. [Google Scholar] [CrossRef]
- Ferraro, K.F.; LaGrange, R.L. The measurement of fear of crime. Sociol. Inq. 1987, 57, 70–101. [Google Scholar] [CrossRef]
- Gilchrist, E.; Bannister, J.; Ditton, J.; Farrall, S. Women and the ‘Fear of Crime’ Challenging the Accepted Stereotype. Br. J. Criminol. 1998, 38, 283–298. [Google Scholar] [CrossRef]
- Smith, W.R.; Torstensson, M.; Johansson, K. Perceived Risk and Fear of Crime: Gender Differences in Contextual Sensitivity. Int. Rev. Vict. 2001, 8, 159–181. [Google Scholar] [CrossRef]
- Kitchen, P.; Williams, A. Quality of life and perceptions of crime in Saskatoon, Canada. Soc. Indic. Res. 2010, 95, 33–61. [Google Scholar] [CrossRef]
- McIntyre, R.N. Public Safety and Crime. In The Encyclopedia of Crime and Punishment; John Wiley & Sons, Inc.: Hoboken, NJ, USA, 2015. [Google Scholar] [CrossRef]
- Cho, W.; Ho, A.T. Does neighborhood crime matter? A multi-year survey study on perceptions of race, victimization, and public safety. Int. J. Law Crime Justice 2018, 55, 13–26. [Google Scholar] [CrossRef]
- Brantingham, P.L.; Brantingham, P.J. Nodes, paths and edges: Considerations on the complexity of crime and the physical environment. J. Environ. Psychol. 1993, 13, 3–28. [Google Scholar] [CrossRef]
- Sypion-Dutkowska, N.; Leitner, M. Land use influencing the spatial distribution of urban crime: A case study of Szczecin, Poland. ISPRS Int. J. Geo-Inf. 2017, 6, 74. [Google Scholar] [CrossRef]
- Telep, C.W.; Weisburd, D. Crime Concentration at Places. In Oxford Handbook of Environmental Criminology; Bruinsma, G.J.N., Johnson, S.D., Eds.; Oxford University Press: Oxford, UK, 2017. [Google Scholar] [CrossRef]
- Downs, R.M.; Stea, D. Image and Environment: Cognitive Mapping and Spatial Behavior. Am. J. Sociol. 1975, 80, 1027–1028. [Google Scholar] [CrossRef]
- Box, S.; Hale, C.; Andrews, G. Explaining fear of crime. Br. J. Criminol. 1988, 28, 340–356. [Google Scholar] [CrossRef]
- Killias, M.; Clerici, C. Different measures of vulnerability in their relation to different dimensions of fear of crime. Br. J. Criminol. 2000, 40, 437–450. [Google Scholar] [CrossRef]
- Doran, B.J.; Lees, B.G. Using GIS to investigate spatio-temporal links between disorder, crime and the fear of crime. In Proceedings of the Graffiti and Disorder Conference, Brisbane, Australia, 18–19 August 2003. [Google Scholar]
- Nair, G.; Ditton, J.; Phillips, S. Environmental Improvements and the Fear of Crime. In The Fear of Crime; Routledge: London, UK, 2017; pp. 525–531. [Google Scholar] [CrossRef]
- Lederer, D.; Leitner, M. Erfassung der stadtteilspezifischen Kriminalitätsfurcht und Verortung von Kriminalitätsfurchträumen in Linz. In Applied Geographic Information Technology; Strobl, J., Blaschke, T., Griesebner, G., Eds.; Wichmann: Berlin, Germany; Offenbach, Germany, 2012. [Google Scholar]
- Pánek, J.; Ivan, I.; Macková, L. Comparing Residents’ Fear of Crime with Recorded Crime Data—Case Study of Ostrava, Czech Republic. ISPRS Int. J. Geo-Inf. 2019, 8, 401. [Google Scholar] [CrossRef]
- Pődör, A.; Jakobi, Á. Digital Sketch Maps Detecting Places of Fear of Crime. In GIS Ostrava 2018–GIS for Safety & Security; Ivan, I., Caha, J., Burian, J., Eds.; Technical University of Ostrava: Ostrava, Czechia, 2018; pp. 22–32. [Google Scholar]
- Curtis, J.W. Integrating Sketch Maps with GIS to Explore Fear of Crime in the Urban Environment: A Review of the Past and Prospects for the Future. Cartogr. Geogr. Inf. Sci. 2012, 39, 175–186. [Google Scholar] [CrossRef]
- Boschmann, E.E.; Cubbon, E. Sketch Maps and Qualitative GIS: Using Cartographies of Individual Spatial Narratives in Geographic Research. Prof. Geogr. 2013, 66, 236–248. [Google Scholar] [CrossRef]
- Curtis, J.W. Transcribing from the Mind to the Map: Tracing the Evolution of a Concept. Geogr. Rev. 2016, 106, 338–359. [Google Scholar] [CrossRef]
- Ogneva-Himmelberger, Y.; Ross, L.; Caywood, T.; Khananayev, M.; Starr, C. Analyzing the Relationship between Perception of Safety and Reported Crime in an Urban Neighborhood Using GIS and Sketch Maps. ISPRS Int. J. Geo-Inf. 2019, 8, 531. [Google Scholar] [CrossRef]
- Solymosi, R.; Bowers, K.; Fujiyama, T. Mapping fear of crime as a context-dependent everyday experience that varies in space and time. Leg. Criminol. Psychol. 2015, 20, 193–211. [Google Scholar] [CrossRef]
- Kounadi, O.; Ristea, A.; Leitner, M.; Langford, C. Population at risk: Using areal interpolation and Twitter messages to create population models for burglaries and robberies. Cartogr. Geogr. Inf. Sci. 2017, 45, 205–220. [Google Scholar] [CrossRef]
- Pődör, A.; Révész, A.; Rácskai, P.; Sasvár, Z. Measuring Citizens’ Fear of Crime Using a Web Application: A Case Study. Gi_Forum 2016, 2, 123–133. [Google Scholar] [CrossRef][Green Version]
- Lynch, K. The Image of the City; MIT Press: Cambridge MA, USA, 1960. [Google Scholar]
- Gould, P.; White, R. Mental Maps; Rutledge: New York, NY, USA, 1993; p. 93. [Google Scholar] [CrossRef]
- Tversky, B. Cognitive maps, cognitive collages, and spatial mental models. In Spatial Information Theory A Theoretical Basis for GIS, Lecture Notes in Computer Science; Springer: Berlin, Germany, 1993; Volume 716, pp. 14–24. [Google Scholar] [CrossRef]
- Ghioca, S. The cognitive map’s role in urban planning and landscaping: Application to Braila City, Romania. Cinq Cont. 2014, 4, 137–157. [Google Scholar]
- Smiley, S.L. Mental maps, segregation, and everyday life in Dar es Salaam, Tanzania. J. Cult. Geogr. 2013, 30, 215–244. [Google Scholar] [CrossRef]
- Gold, R.J. An Intorduction to Behavioural Geography; University Press: Oxford, UK, 1980. [Google Scholar]
- Milgram, S. Psychological maps of Paris. In The Individual in a Social World: Essays and Experiments; Sabini, J., Silver, M., Eds.; McGraw-Hill: New York, NY, USA, 1992. [Google Scholar]
- Zhang, W.; Ahmad Termida, N.; Susilo, Y.O. What construct one’s familiar area? A quantitative and longitudinal study. Environ. Plan. B Urban. Anal. City Sci. 2019, 46, 322–340. [Google Scholar] [CrossRef]
- Matei, S.; Ball-Rokeach, S.J.; Qiu, J.L. Fear and Misperception of Los Angeles Urban Space. Commun. Res. 2001, 28, 429–463. [Google Scholar] [CrossRef]
- Pődör, A.; Zentai, L.; Gál, E. Digital sketch maps in teaching GIS for law enforcement students. Proc. Int. Cartogr. Assoc. 2019, 2, 102. [Google Scholar] [CrossRef][Green Version]
- Curtis, J.W.; Su, E.; Lowery, B.; Sloane, D.; Hennigan, K.; Curtis, A. The Prospects and Problems of Integrating Sketch Maps with Geographic Information Systems to Understand Environmental Perception: A Case Study of Mapping Youth Fear in Los Angeles Gang Neighborhoods. Environ. Plan. B Plan. Des. 2014, 41, 251–271. [Google Scholar] [CrossRef]
- Pánek, J.; Pászto, V.; Marek, L. Mapping emotions: Spatial distribution of safety perception in the city of Olomouc. In GIS Ostrava 2016–The Rise of Big Spatial Data; Springer Lecture Notes in Geoinformation and Cartography; Springer: Cham, Switzerland, 2016; pp. 211–224. [Google Scholar] [CrossRef]
- Curtis, A.; Curtis, J.W.; Ajayakumar, J.; Jefferis, E.; Mitchell, S. Same space–different perspectives: Comparative analysis of geographic context through sketch maps and spatial video geonarratives. Int. J. Geogr. Inf. Sci. 2018, 33, 1224–1250. [Google Scholar] [CrossRef]
- Zeile, P.; Resch, B.; Exner, J.P.; Sagl, G. Urban Emotions: Benefits and Risks in Using Human Sensory Assessment for the Extraction of Contextual Emotion Information in Urban Planning. In Planning Support Systems and Smart Cities; Geertman, S., Ferreira, J., Jr., Goodspeed, R., Stillwell, J., Eds.; Lecture Notes in Geoinformation and Cartography; Springer: Cham, Switzerland, 2015. [Google Scholar] [CrossRef]
- Kohm, S.A. Spatial Dimensions of Fear in a High-Crime Community: Fear of Crime or Fear of Disorder? Can. J. Criminol. Crim. Justice 2009, 51, 1–30. [Google Scholar] [CrossRef]
- Ceccato, V.A.; Snickars, F. Adapting GIS Technology to the Needs of Local Planning. Environ. Plan. B Plan. Des. 2000, 27, 923–937. [Google Scholar] [CrossRef]
- Lopez, N.; Lukinbeal, C. Comparing Police and Residents’ Perceptions of Crime in a Phoenix Neighborhood using Mental Maps in GIS. Yearb. Assoc. Pac. Coast Geogr. 2010, 72, 33–55. [Google Scholar] [CrossRef]
- Tóth, J. Urbanization and spatial structure in Hungary. GeoJournal 1994, 32, 343–350. [Google Scholar] [CrossRef]
- Hungarian Penal Code. Available online: https://net.jogtar.hu/jogszabaly?docid=A1200100.TV (accessed on 24 February 2020).
- Haberman, C.P. Overlapping hot spots? Examination of the spatial heterogeneity of hot spots of different crime types. Criminol. Public Policy 2017, 16, 633–660. [Google Scholar] [CrossRef]
- Melo, S.N.; Matias, L.F.; Andresen, M.A. Crime concentrations and similarities in spatial crime patterns in a Brazilian context. Appl. Geogr. 2015, 62, 314–324. [Google Scholar] [CrossRef]
- Doran, B.J.; Lees, B.G. Investigating the Spatiotemporal Links between Disorder, Crime, and the Fear of Crime. Prof. Geogr. 2005, 57, 1–12. [Google Scholar] [CrossRef]
- Skogan, W.G. Dimensions of the Dark Figure of Unreported Crime. Crime Delinq. 1977, 23, 41–50. [Google Scholar] [CrossRef]
- Coleman, C.; Moynihan, J. Understanding Crime Data: Haunted by the Dark Figure; Open University Press: Buckingham, UK, 1996; Volume 120. [Google Scholar]
- Curiel, P.R.; Bishop, S.R. Fear of crime: The impact of different distributions of victimisation. Palgrave Commun. 2018, 4. [Google Scholar] [CrossRef]
- Nolan, J.J., III. Establishing the statistical relationship between population size and UCR crime rate: Its impact and implications. J. Crim. Justice 2004, 32, 547–555. [Google Scholar] [CrossRef]


| City | N | Unsafe | Safe | ||
|---|---|---|---|---|---|
| Pearson Corr. | Sig. (2-tailed) | Pearson Corr. | Sig. (2-tailed) | ||
| Balmazújváros | 972 | ,615 ** | ,000 | ,170 ** | ,000 |
| Dunaújváros | 2407 | ,311 ** | ,000 | ,493 ** | ,000 |
| Heves | 735 | ,517 ** | ,000 | ,128 ** | ,001 |
| Keszthely | 1211 | ,349 ** | ,000 | ,510 ** | ,000 |
| Miskolc | 4997 | ,076 ** | ,000 | ,281 ** | ,000 |
| Nagykanizsa | 2637 | ,396 ** | ,000 | ,690 ** | ,000 |
| Nyíregyháza | 6093 | ,428 ** | ,000 | ,341 ** | ,000 |
| Szeged | 6798 | ,353 ** | ,000 | ,631 ** | ,000 |
| Székesfehérvár | 4851 | ,560 ** | ,000 | ,462 ** | ,000 |
| Total | 30701 | ,372 ** | ,000 | ,381 ** | ,000 |
| Normalized Indicator | N | Pearson Correlation Coefficients | |||
|---|---|---|---|---|---|
| Unsafe (Male) | Unsafe (Female) | Safe (Male) | Safe (Female) | ||
| Unsafe (Male) | 30701 | 1 | |||
| Unsafe (Female) | 30701 | ,838 ** | 1 | ||
| Safe (Male) | 30701 | ,098 ** | ,099 ** | 1 | |
| Safe (Female) | 30701 | ,093 ** | ,079 ** | ,839 ** | 1 |
| Variables | Model 1 | Model 2 | Model 3 | Model 4 | Model 5 | Model 6 | Model 7 | Model 8 | Model 9 |
|---|---|---|---|---|---|---|---|---|---|
| CRIMEEVENT | ,092 | ,112 | ,098 | −,236 | ,338 | ||||
| (,000) ** | (,000) ** | (,000) ** | (,000) ** | (,000) ** | |||||
| CITYSIZE | ,106 | ,124 | ,135 | ,061 | ,068 | ||||
| (,000) ** | (,000) ** | (,000) ** | (,000) ** | (,000) ** | |||||
| UM_UF | −,008 | −,001 | −,042 | ,042 | |||||
| (,177) | (,796) | (,000) ** | (,000) ** | ||||||
| SM_SF | ,115 | ,118 | ,005 | ,109 | |||||
| (,000) ** | (,000) ** | (,113) | (,000) ** | ||||||
| SAFE | ,787 | ,875 | |||||||
| (,000) ** | (,000) ** | ||||||||
| UNSAFE | −,537 | −,658 | |||||||
| (,000) ** | (,000) ** | ||||||||
| N | 30701 | 30701 | 30701 | 30701 | 30701 | 30701 | 30701 | 30701 | 30701 |
| ADJ R2 | ,008 | ,011 | ,023 | ,013 | ,037 | ,619 | ,288 | ,674 | ,403 |
| SEE | 21,814 | 21,783 | 21,649 | 21,759 | 21,498 | 13,527 | 18,480 | 12,498 | 16,924 |
| VIF (max) | 1,000 | 1,000 | 1,027 | 1,002 | 1,049 | 1,000 | 1,000 | 1,225 | 1,205 |
© 2020 by the authors. Licensee MDPI, Basel, Switzerland. This article is an open access article distributed under the terms and conditions of the Creative Commons Attribution (CC BY) license (http://creativecommons.org/licenses/by/4.0/).
Share and Cite
Jakobi, Á.; Pődör, A. GIS-Based Statistical Analysis of Detecting Fear of Crime with Digital Sketch Maps: A Hungarian Multicity Study. ISPRS Int. J. Geo-Inf. 2020, 9, 229. https://doi.org/10.3390/ijgi9040229
Jakobi Á, Pődör A. GIS-Based Statistical Analysis of Detecting Fear of Crime with Digital Sketch Maps: A Hungarian Multicity Study. ISPRS International Journal of Geo-Information. 2020; 9(4):229. https://doi.org/10.3390/ijgi9040229
Chicago/Turabian StyleJakobi, Ákos, and Andrea Pődör. 2020. "GIS-Based Statistical Analysis of Detecting Fear of Crime with Digital Sketch Maps: A Hungarian Multicity Study" ISPRS International Journal of Geo-Information 9, no. 4: 229. https://doi.org/10.3390/ijgi9040229
APA StyleJakobi, Á., & Pődör, A. (2020). GIS-Based Statistical Analysis of Detecting Fear of Crime with Digital Sketch Maps: A Hungarian Multicity Study. ISPRS International Journal of Geo-Information, 9(4), 229. https://doi.org/10.3390/ijgi9040229