Location-Based Social Network’s Data Analysis and Spatio-Temporal Modeling for the Mega City of Shanghai, China


Abstract
1. Introduction
2. Related Work
3. Material and Methods
3.1. Data Source
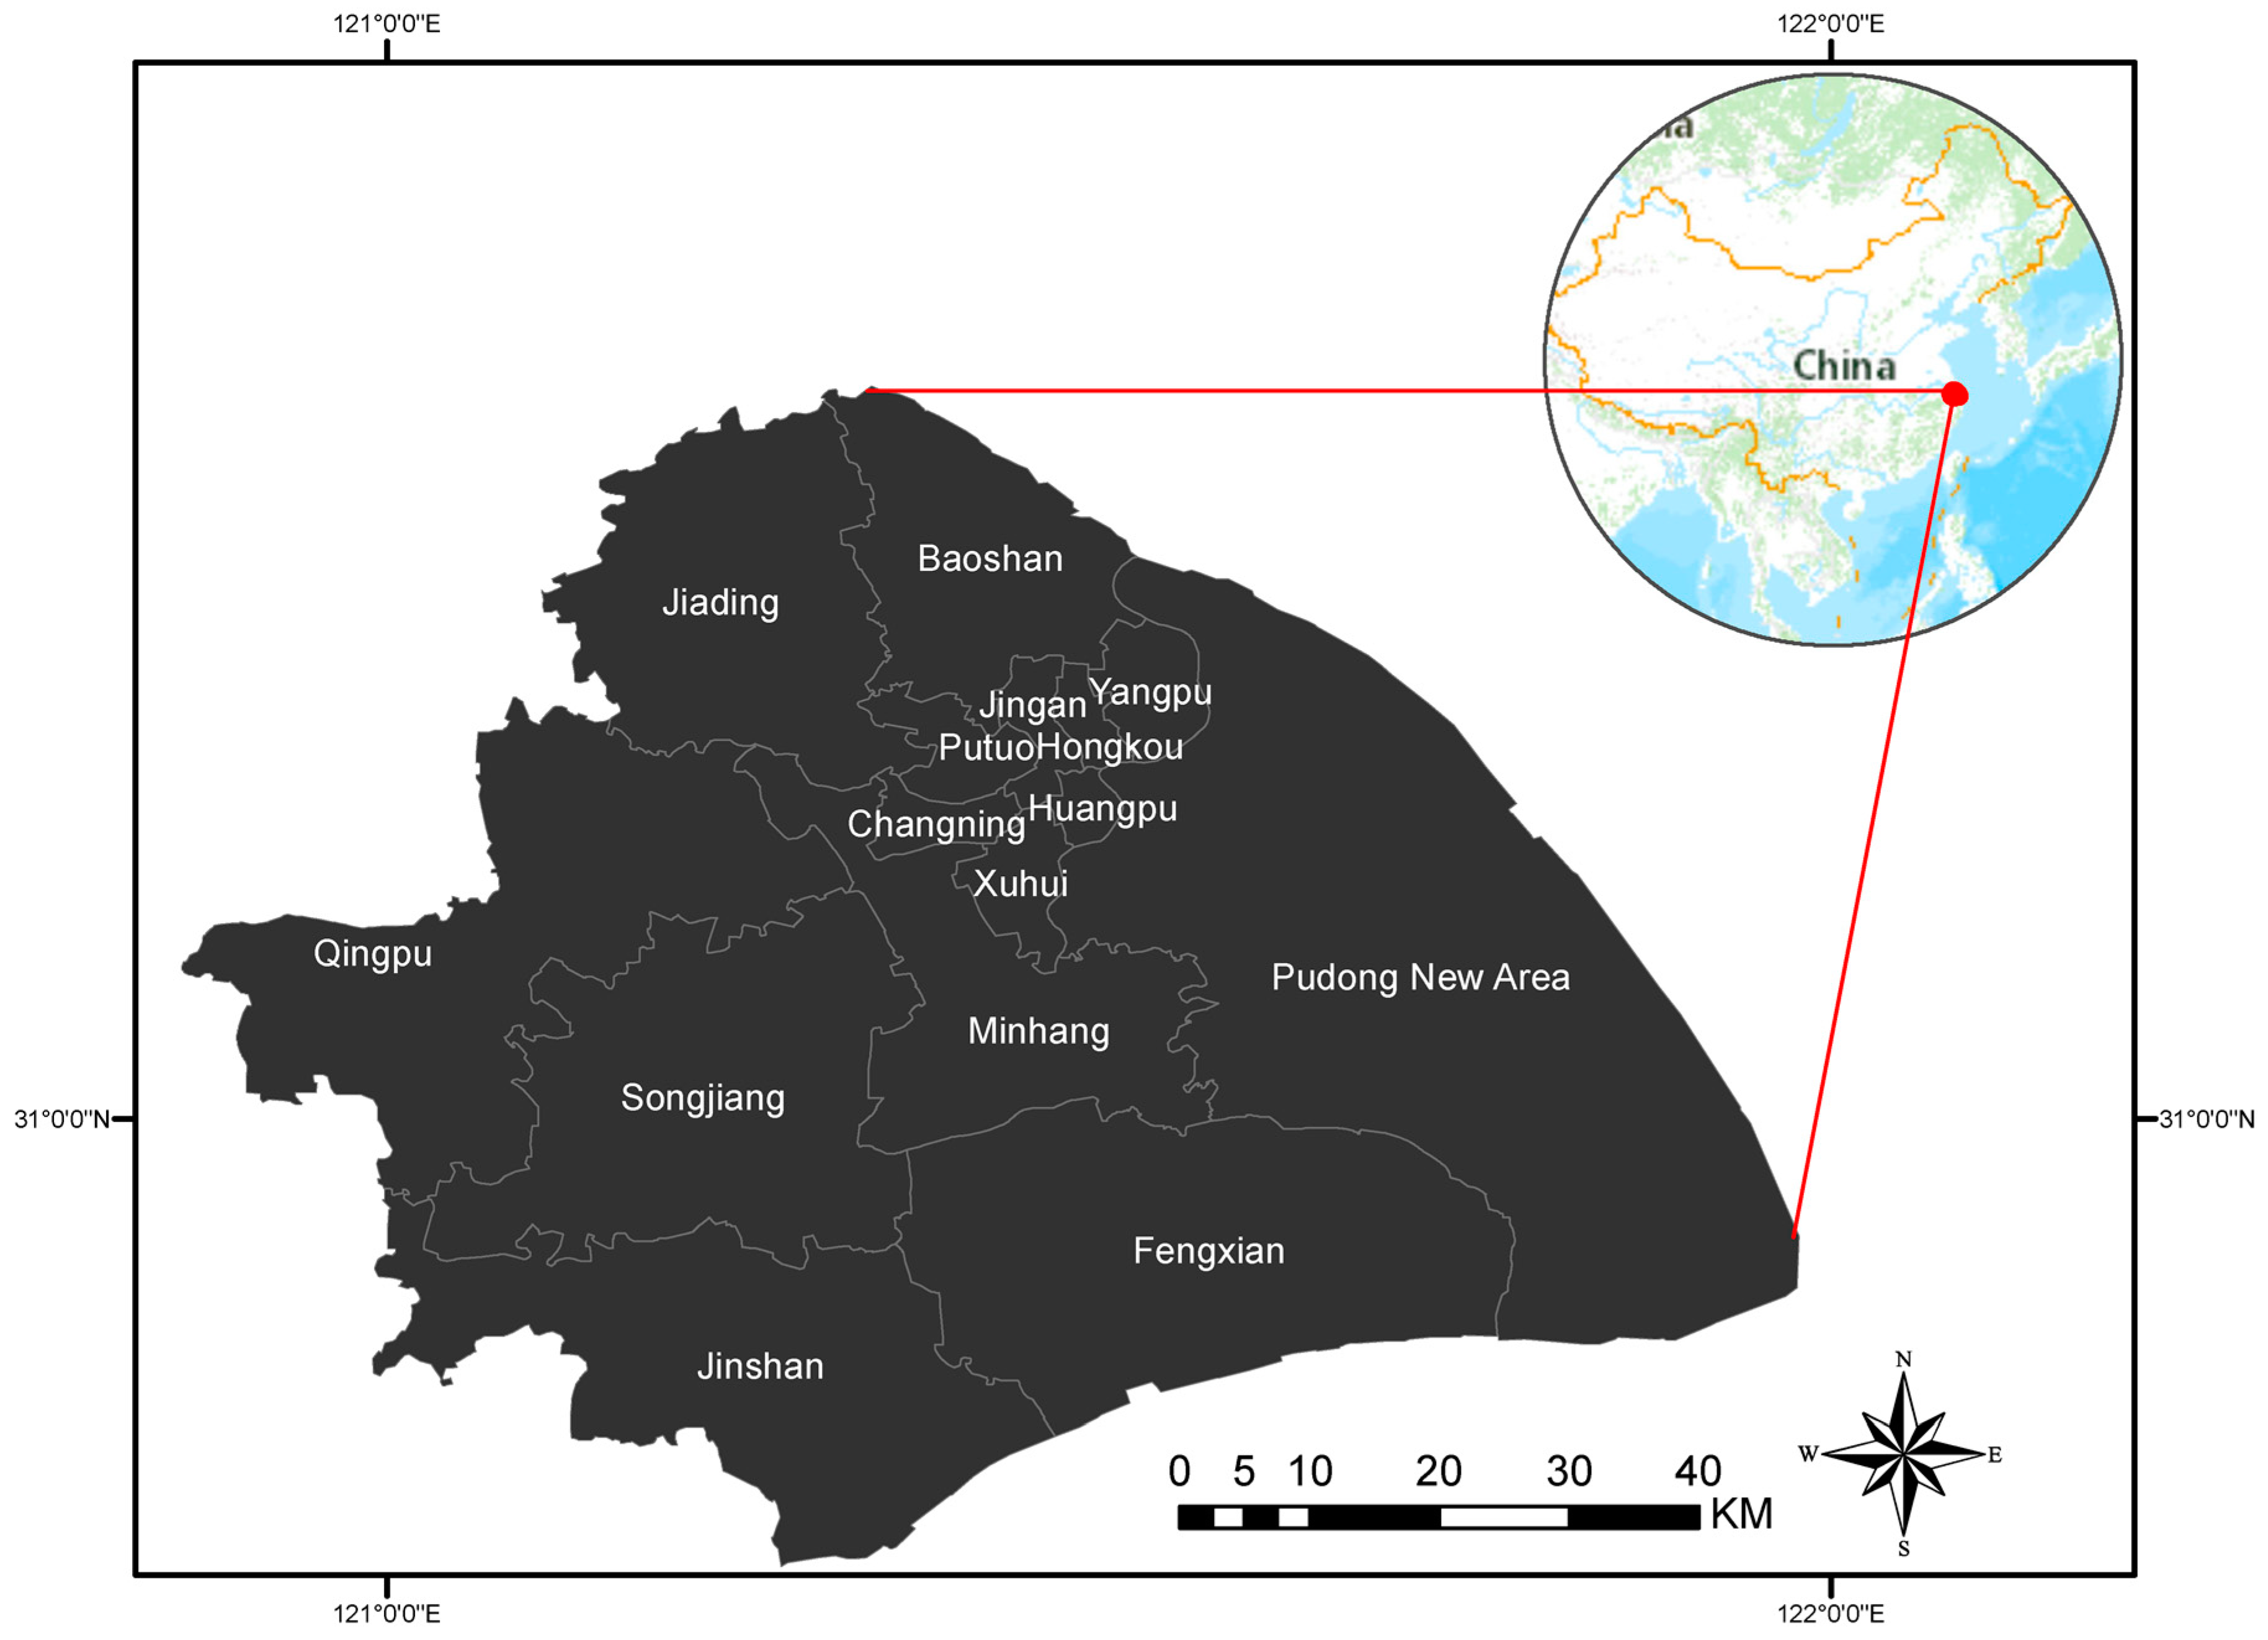
3.2. Study Area
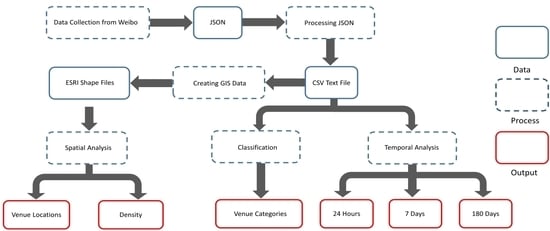
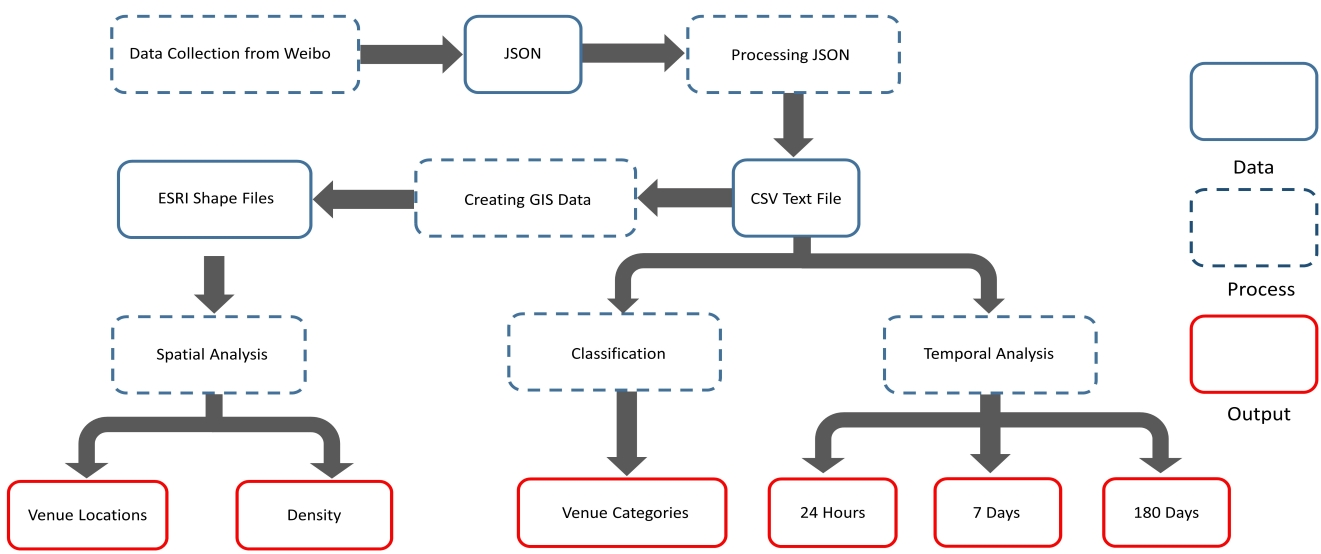
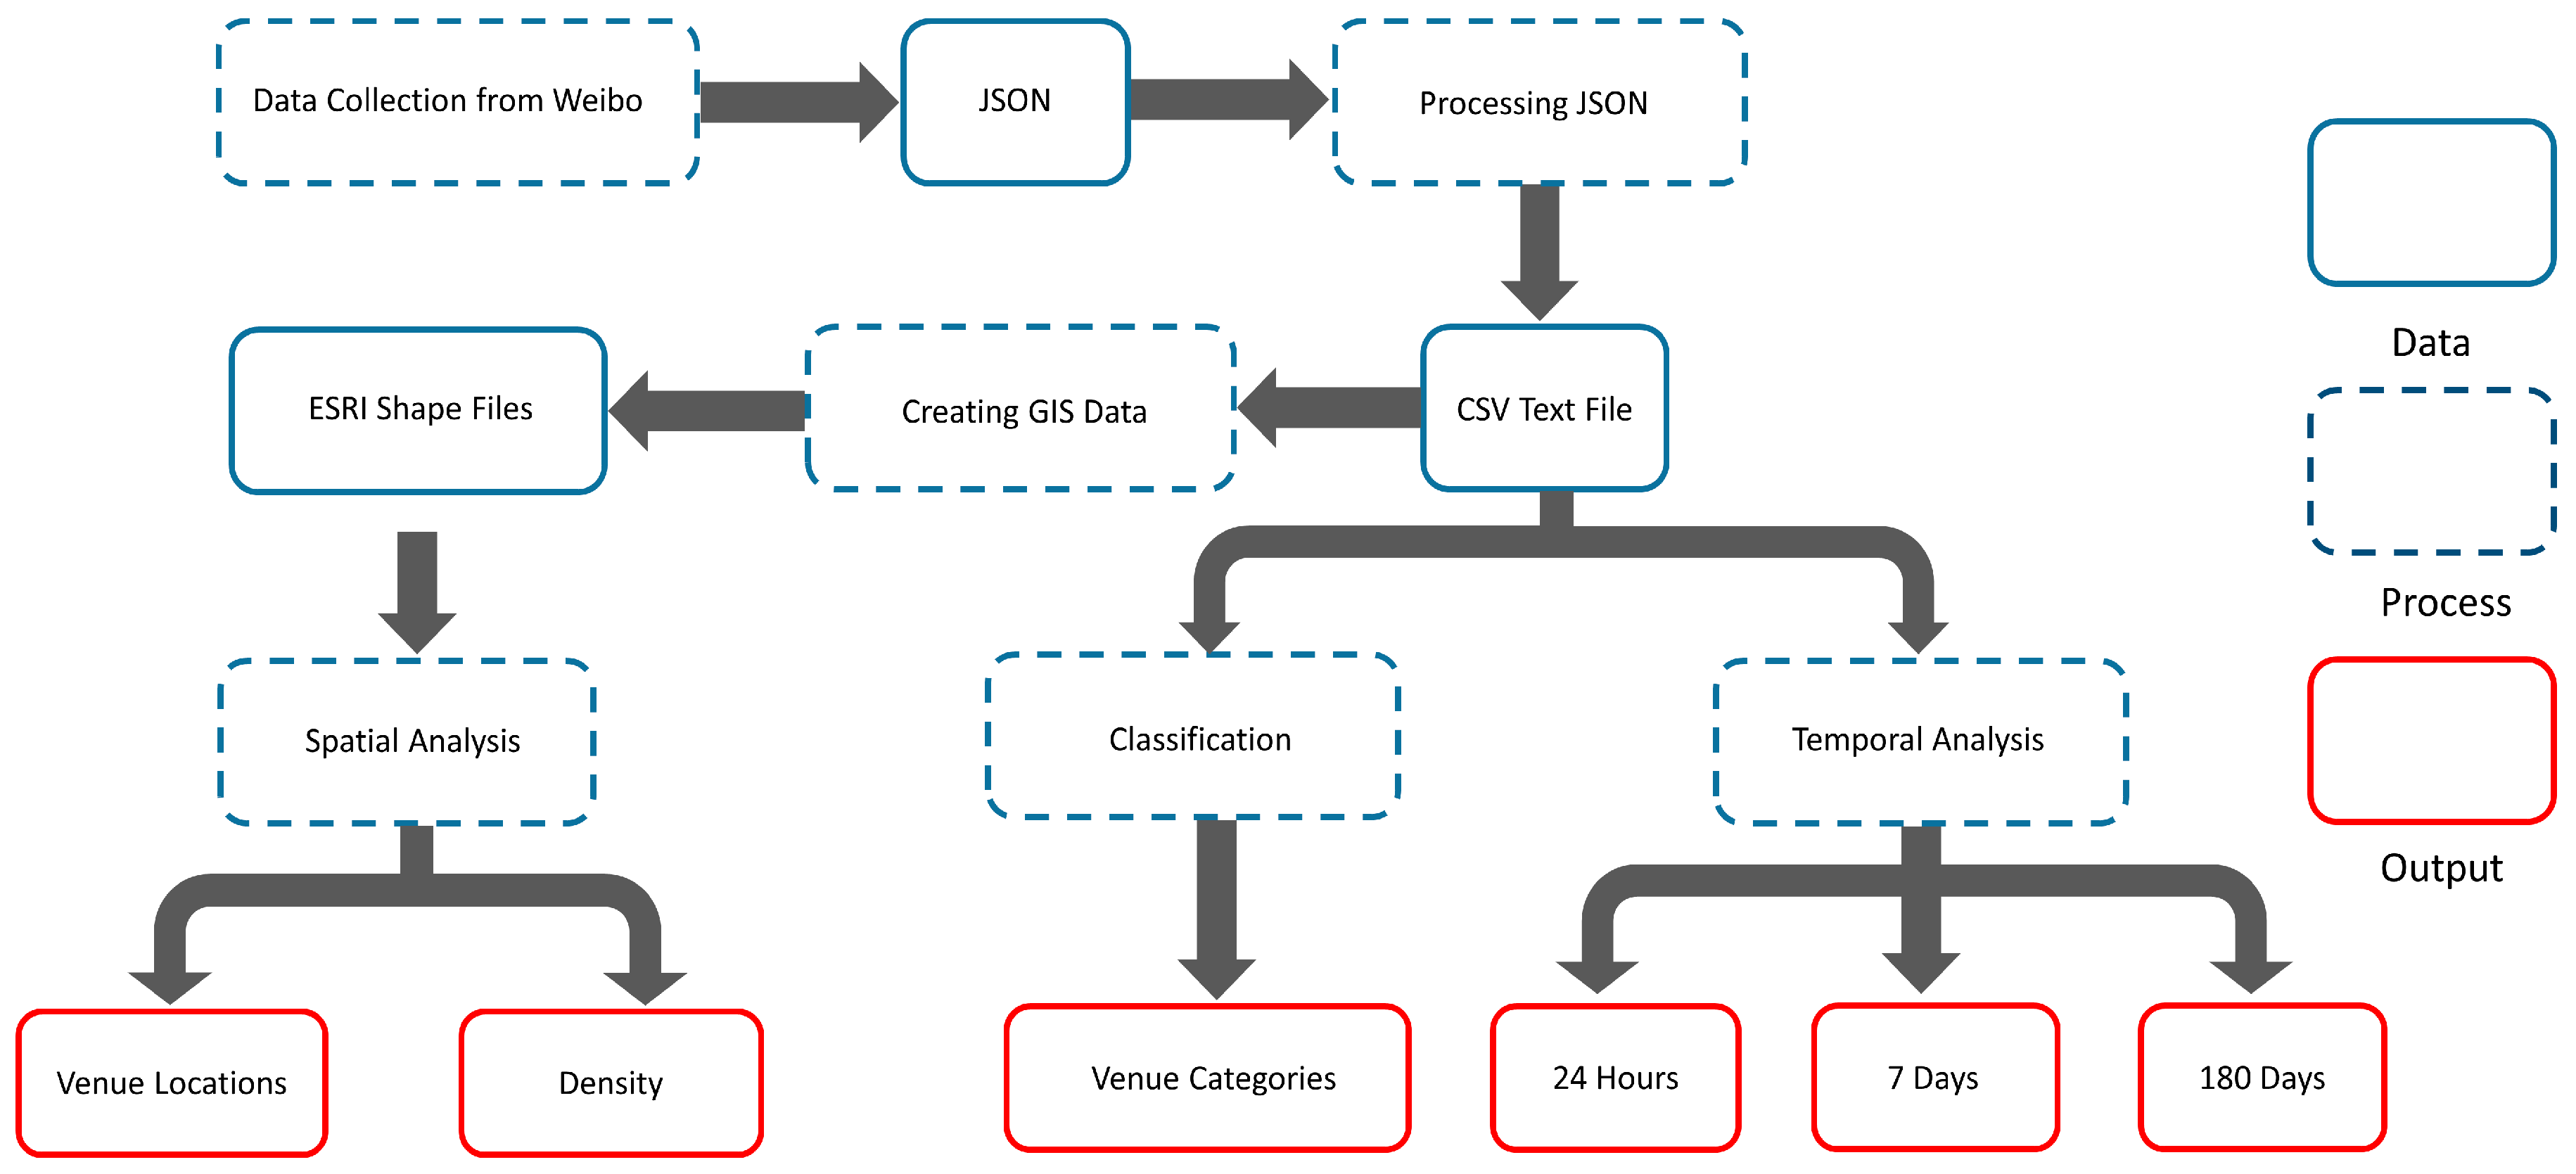
3.3. Methodology
3.3.1. Data Acquisition and Preparation
3.3.2. Temporal Methods
3.3.3. Spatial Methods
4. Results
4.1. Temporal Patterns
4.1.1. Daily Patterns (Hours)
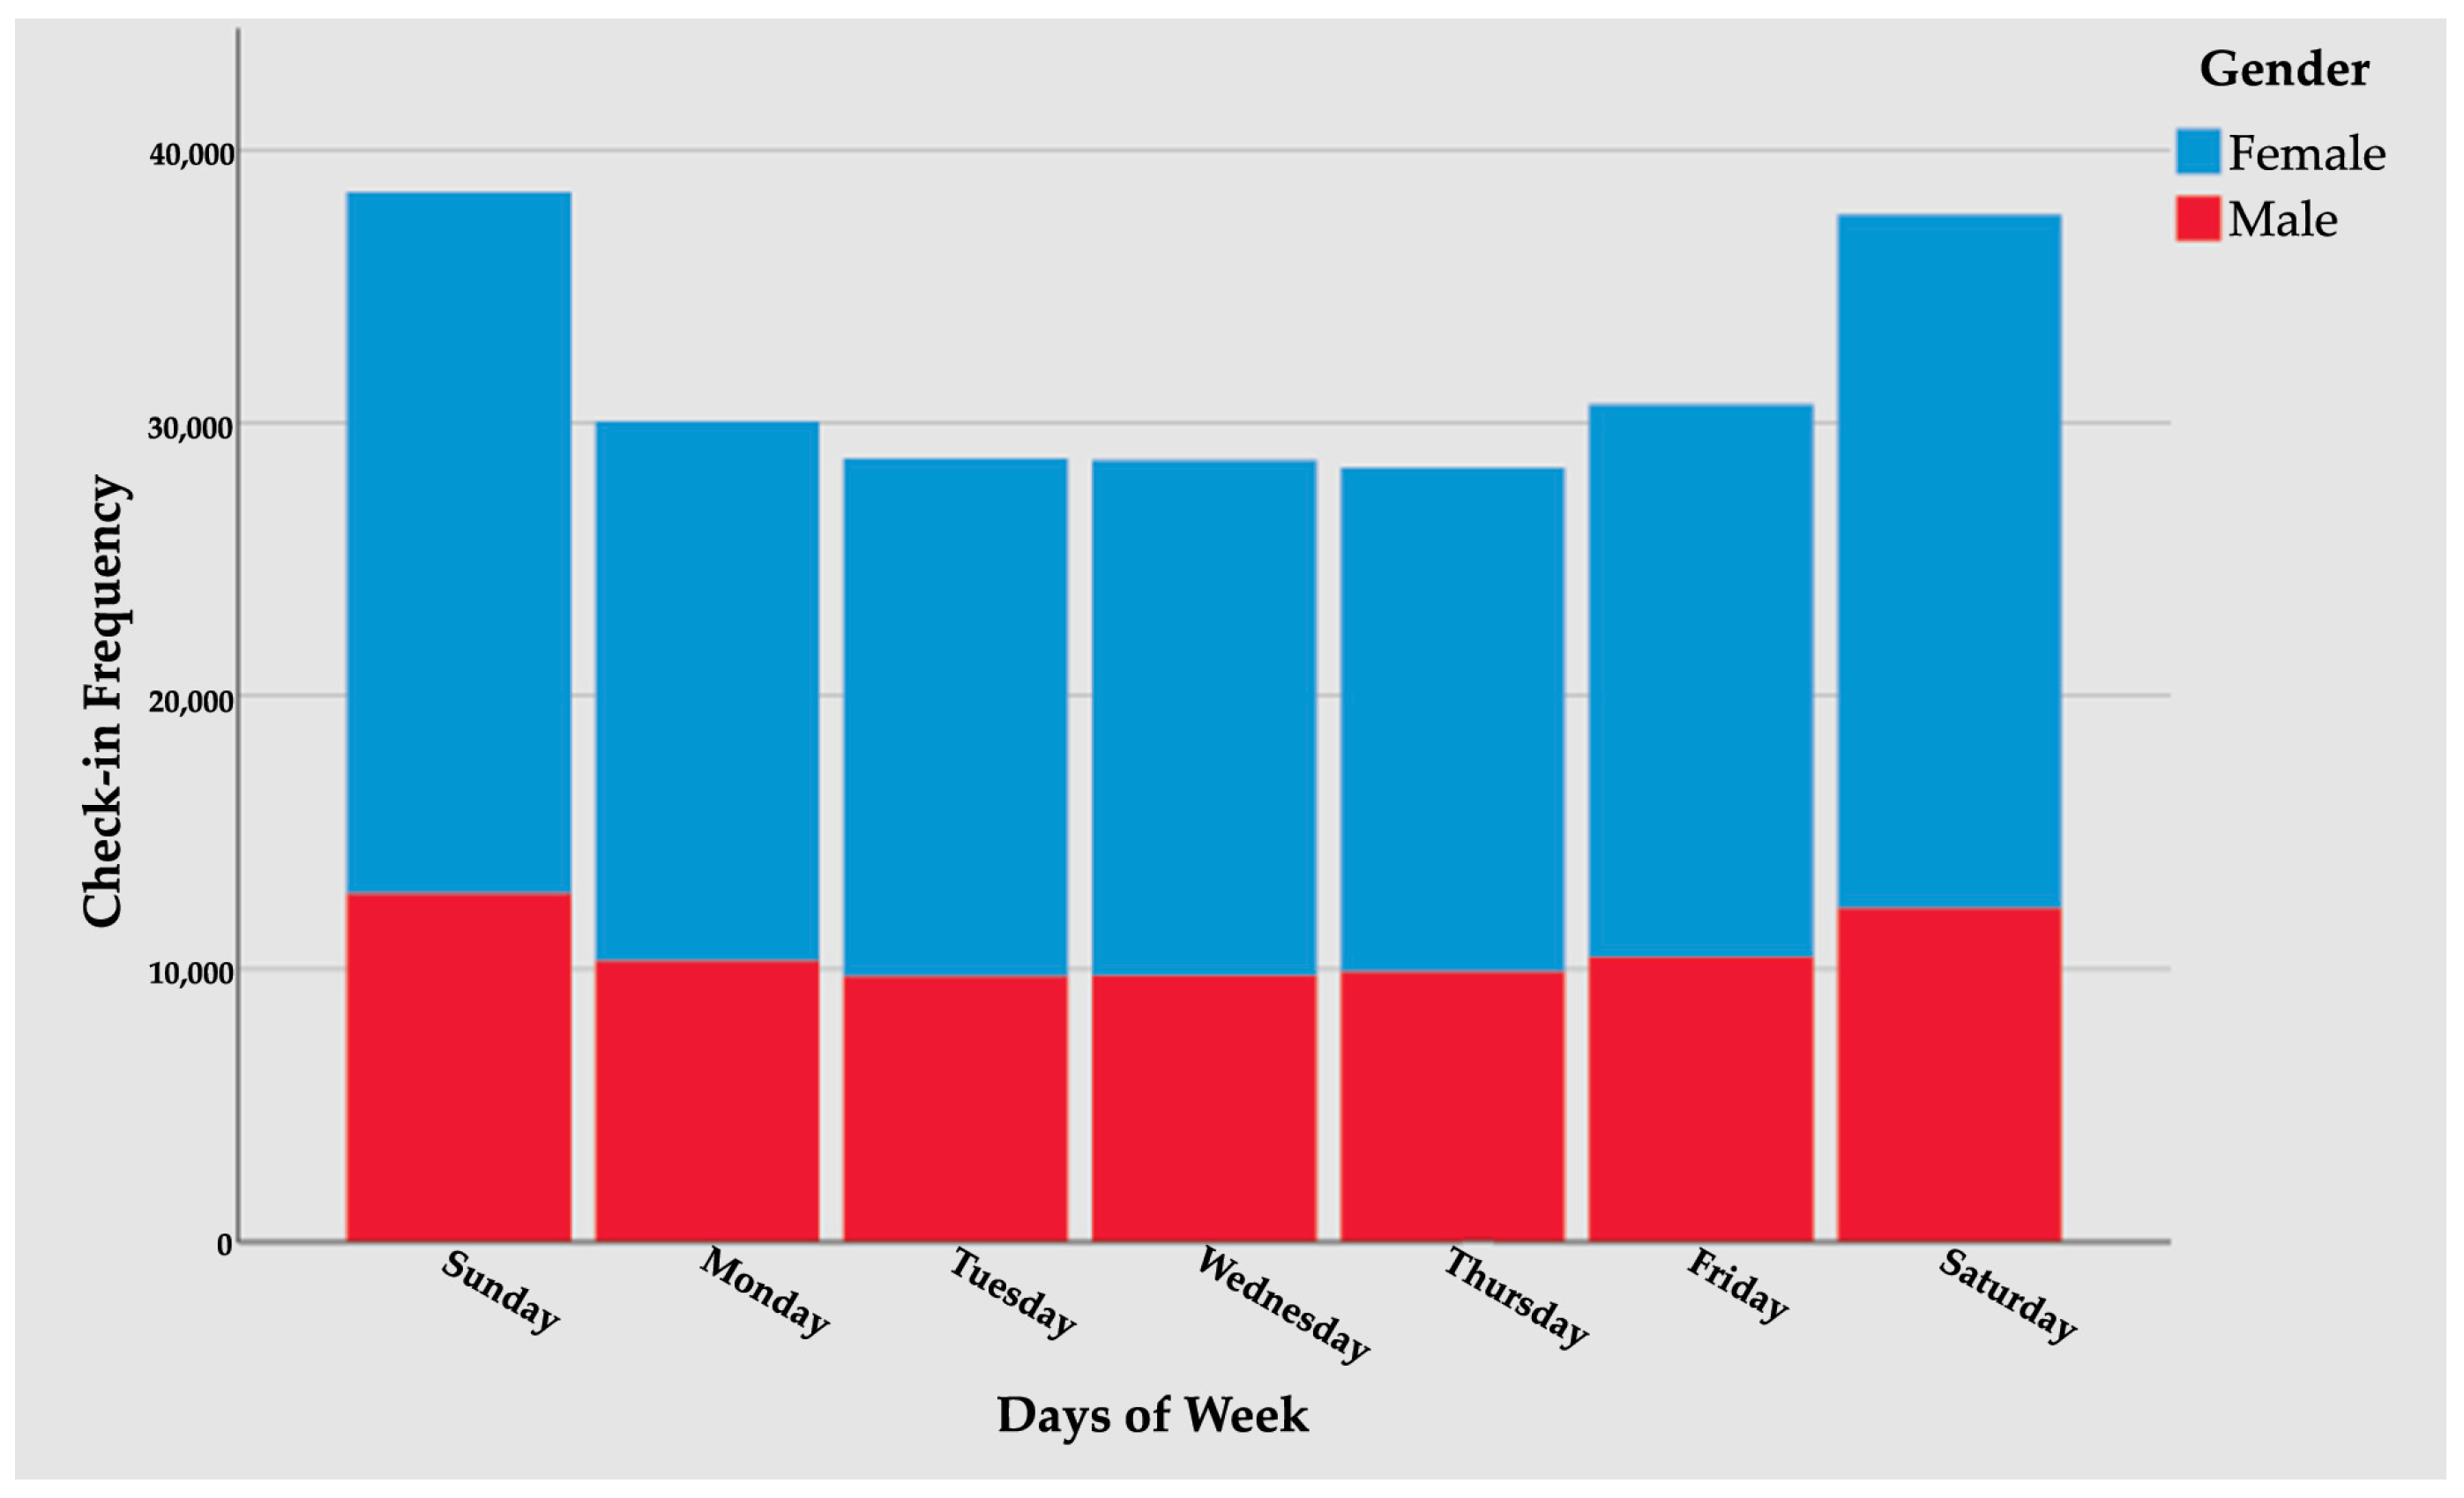
4.1.2. Weekly Patterns (Hours)
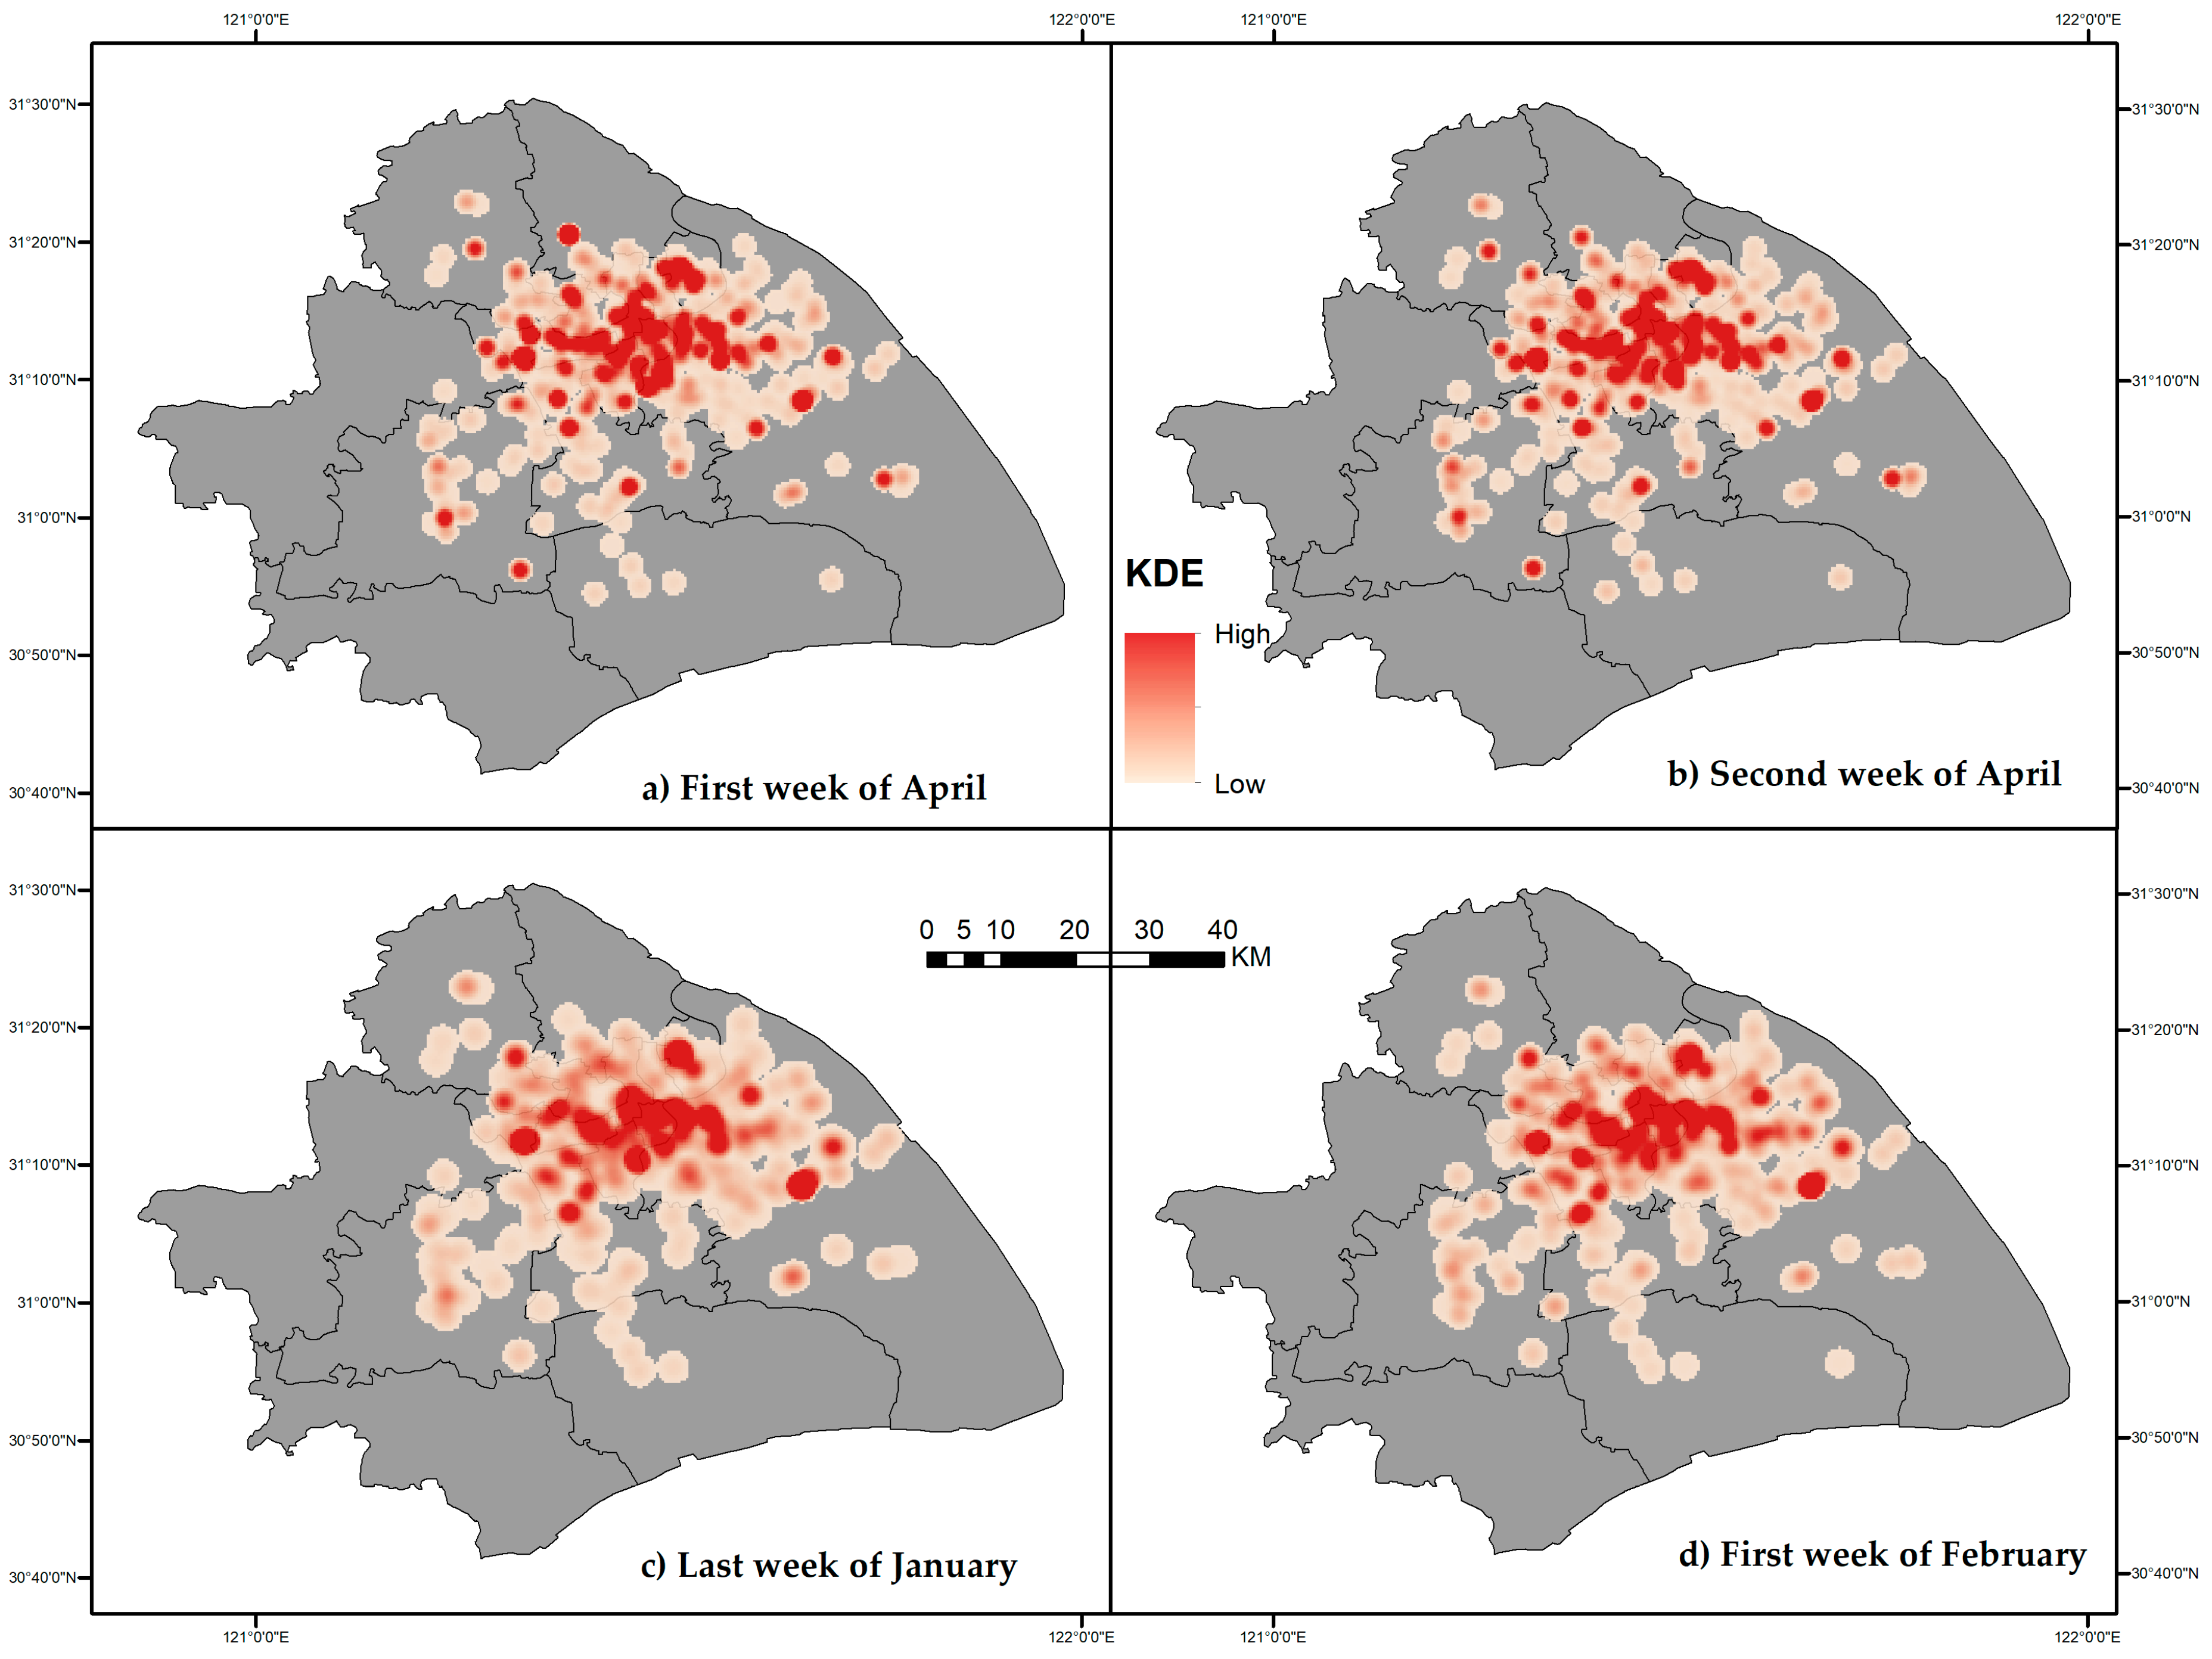
4.1.3. Patterns by Date (180 Days)
4.2. Check-In Venue Categories
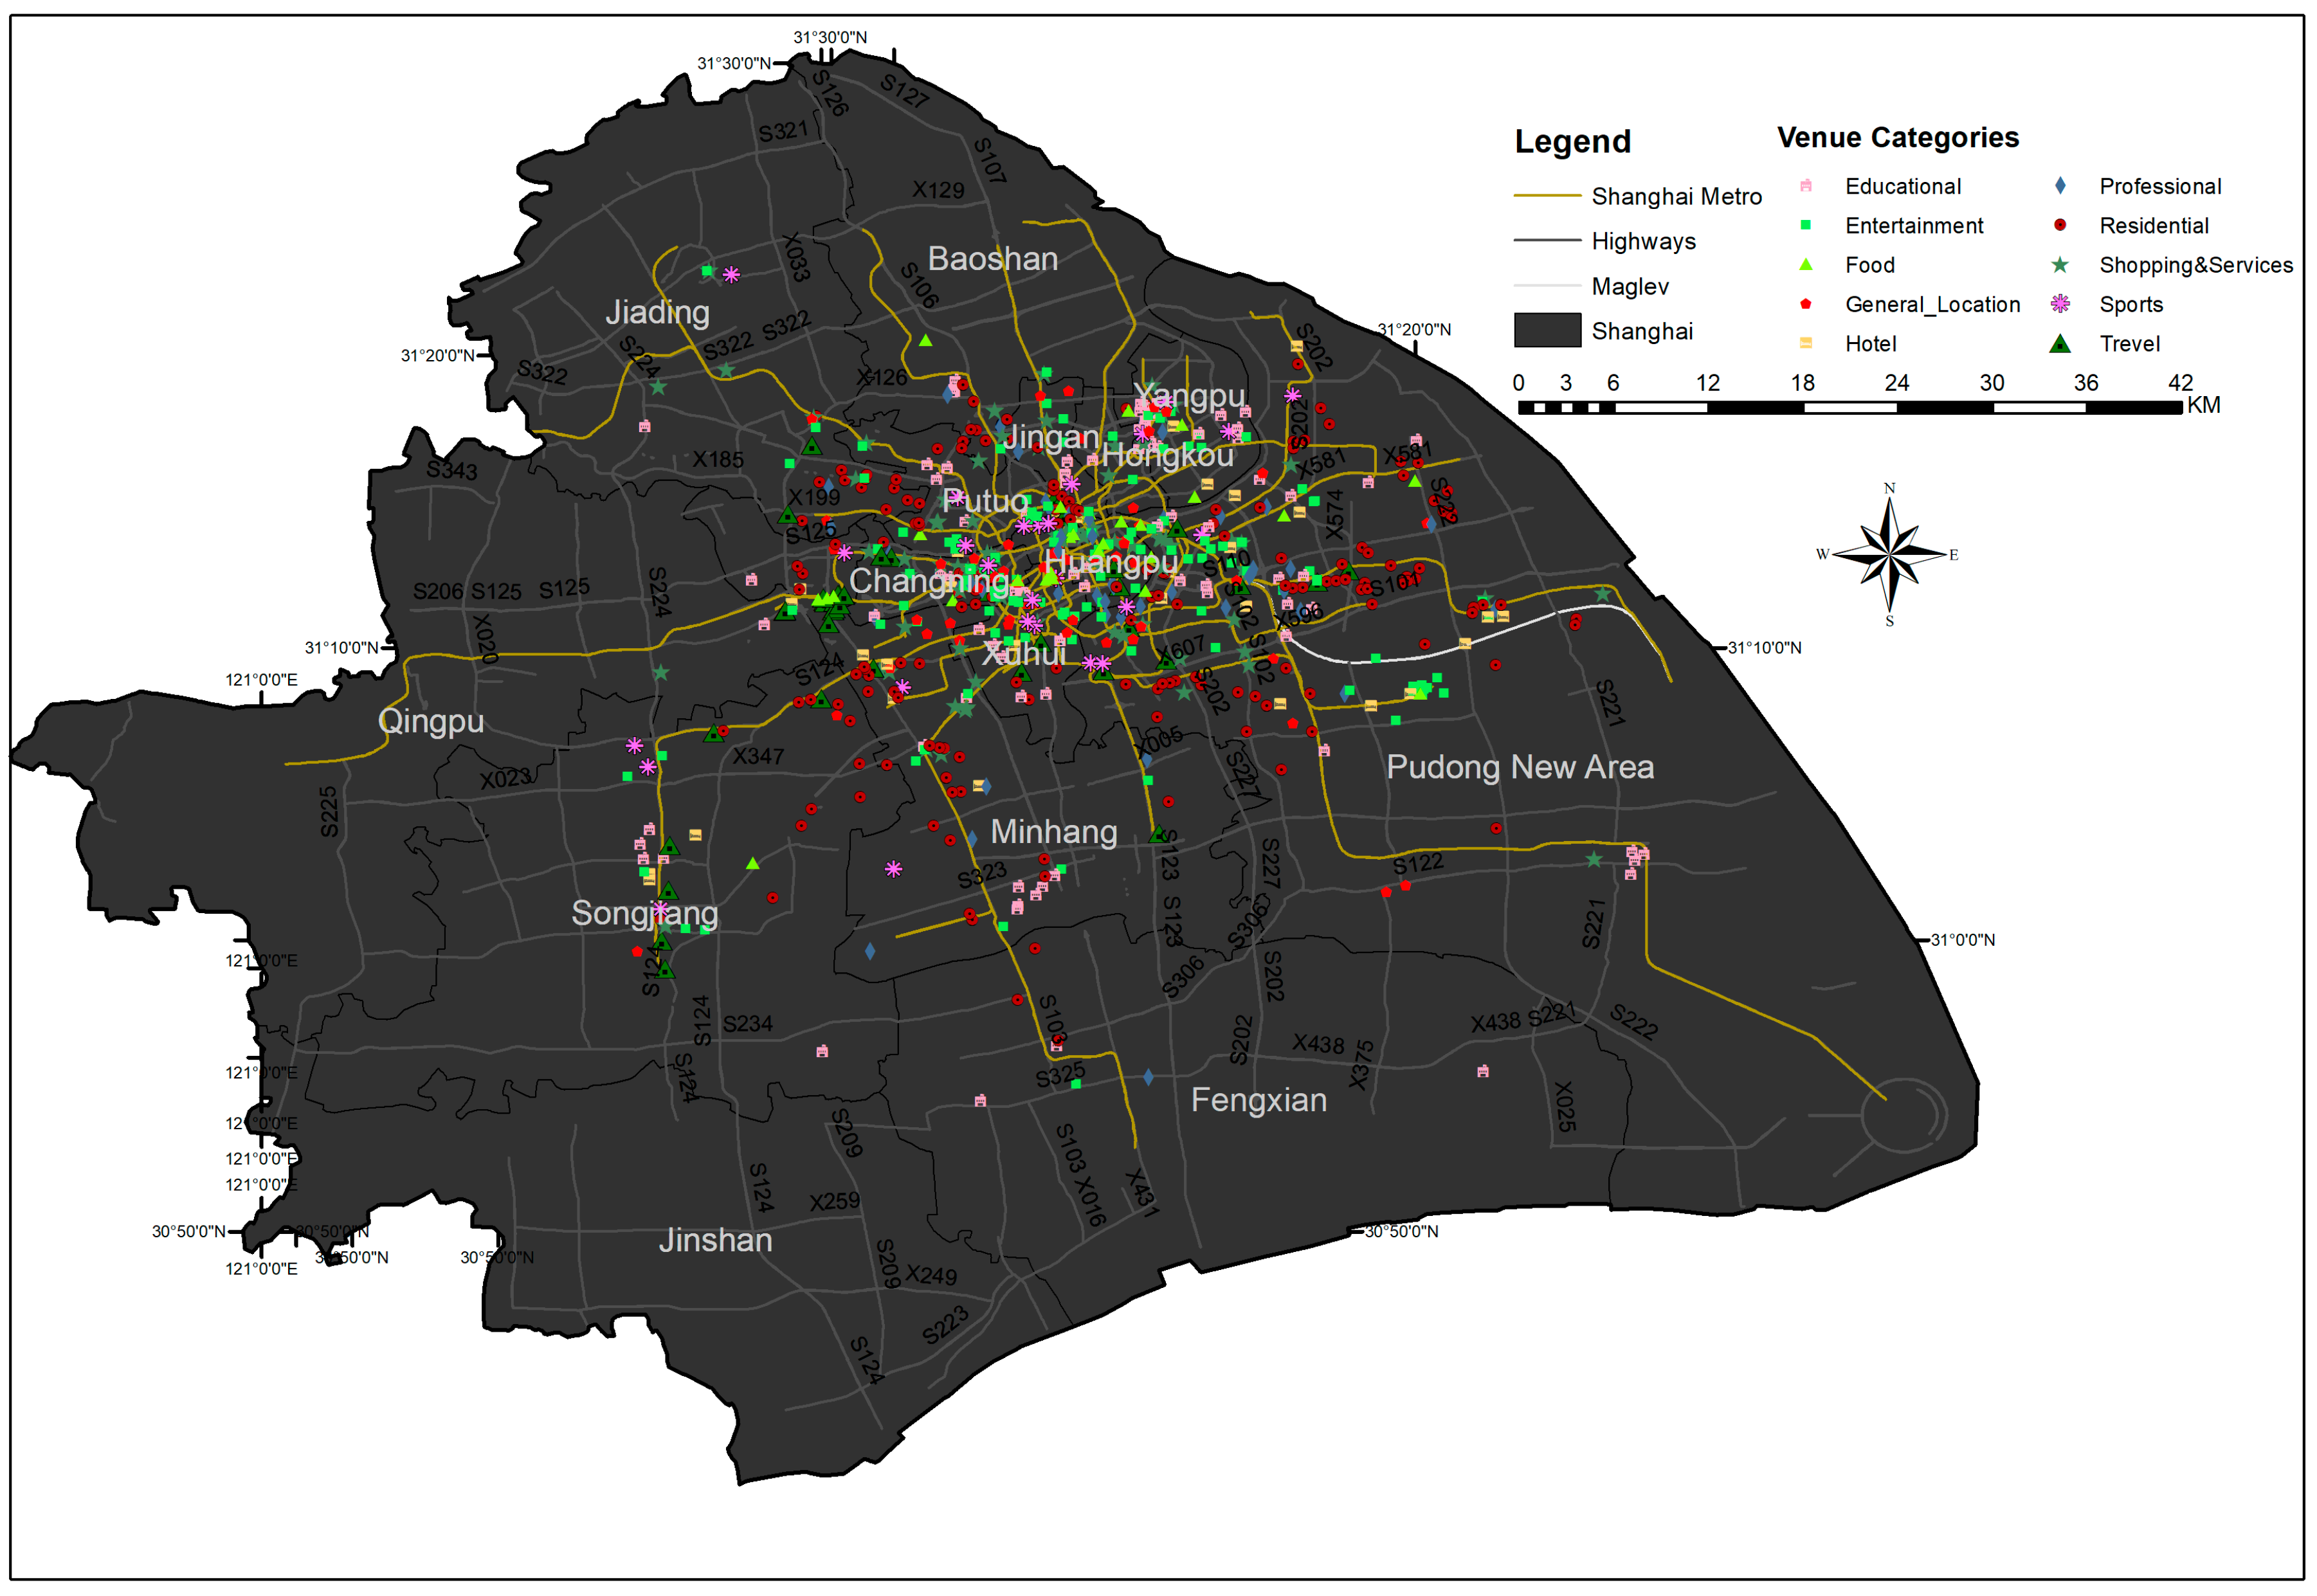
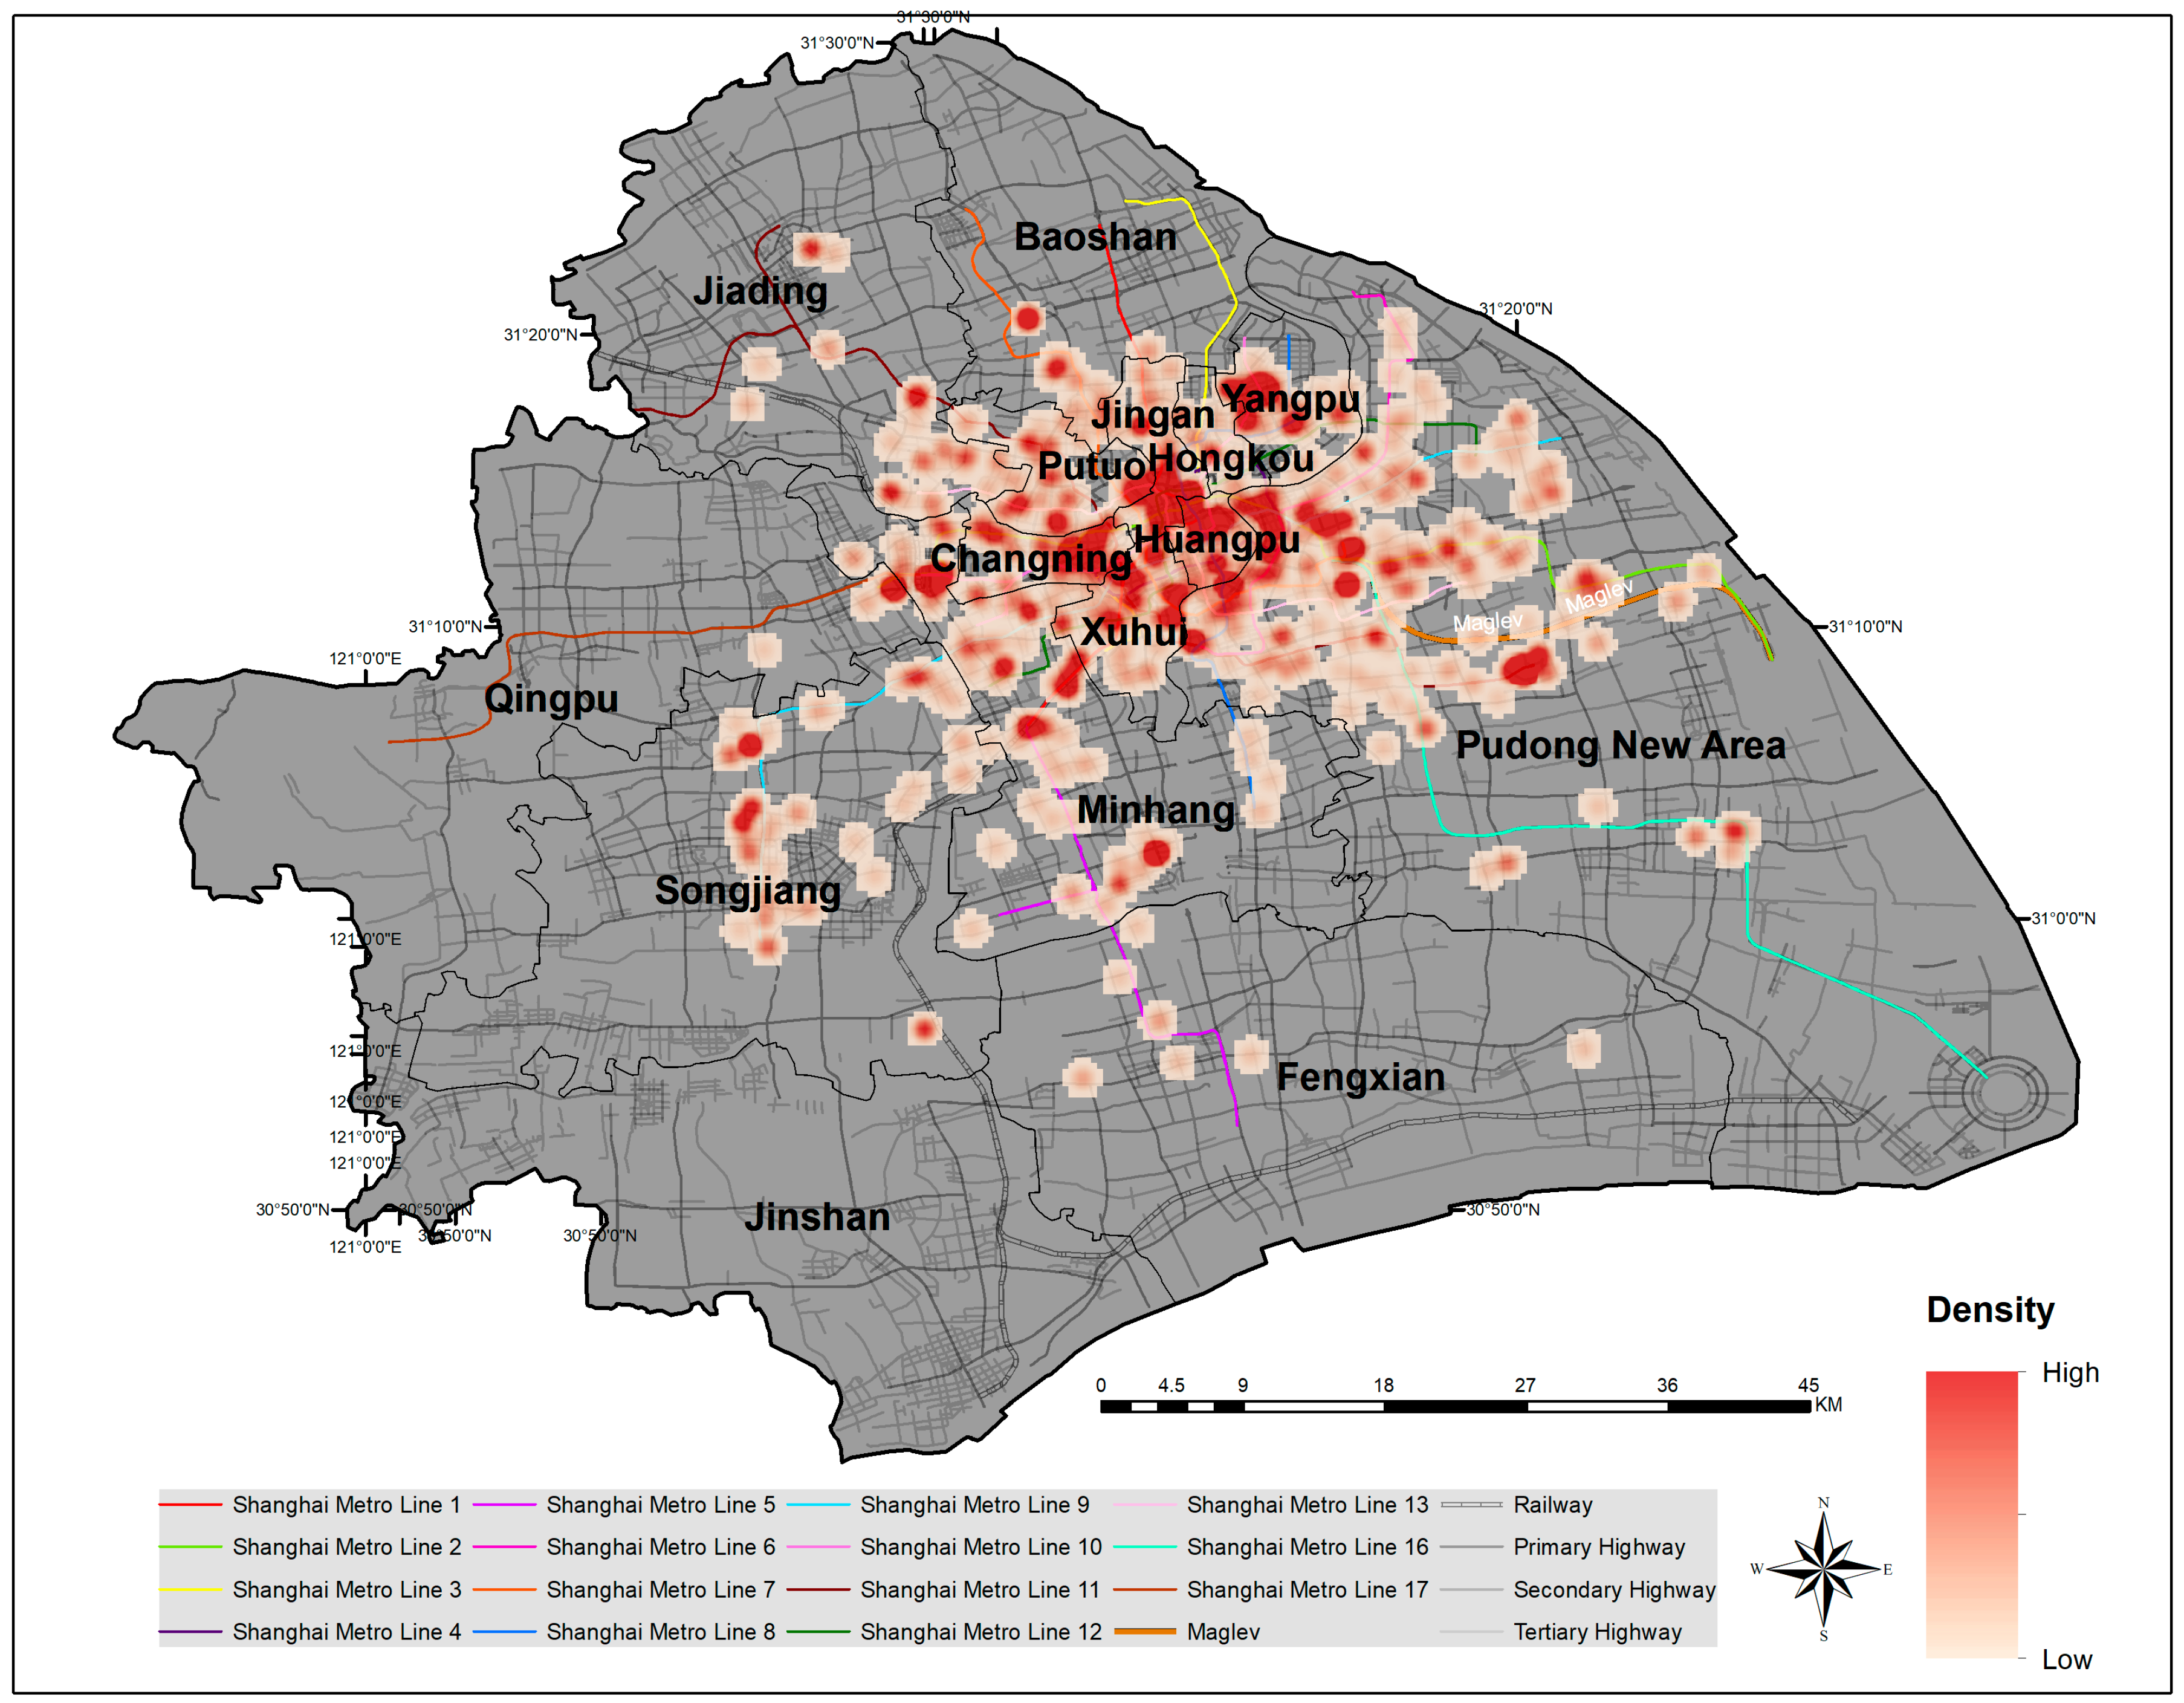
4.3. Spatial Patterns
5. Discussion
6. Conclusions
Author Contributions
Funding
Conflicts of Interest
References
- Singh, R.; Zhang, Y.; Wang, H. Exploring Human Mobility Patterns in Melbourne Using Social Media Data. In Databases Theory and Applications, Proceedings of the Australasian Database Conference, Gold Coast, Australia, 24–27 May 2018; Springer: Berlin/Heidelberg, Germany, 2018; pp. 328–335. [Google Scholar]
- Alrumayyan, N.; Bawazeer, S.; AlJurayyad, R.; Al-Razgan, M. Analyzing User Behaviors: A Study of Tips in Foursquare. In Proceedings of the 5th International Symposium on Data Mining Applications; Springer: Berlin/Heidelberg, Germany, 2018; pp. 153–168. [Google Scholar]
- Todd, A.W.; Campbell, A.L.; Meyer, G.G.; Horner, R.H. The Effects of a Targeted Intervention to Reduce Problem Behaviors: Elementary School Implementation of Check in—Check out. J. Posit. Behav. Interv. 2008, 10, 46–55. [Google Scholar] [CrossRef]
- Zhen, F.; Cao, Y.; Qin, X.; Wang, B. Delineation of an Urban Agglomeration Boundary Based on Sina Weibo Microblog ‘Check-in’ Data: A Case Study of the Yangtze River Delta. Cities 2017, 60, 180–191. [Google Scholar] [CrossRef]
- Facebook. Available online: https://www.facebook.com/ (accessed on 1 April 2019).
- Twitter. Available online: https://twitter.com/ (accessed on 1 June 2019).
- Foursquare. Available online: https://foursquare.com/ (accessed on 1 May 2019).
- Weibo. Available online: http://www.weibo.com (accessed on 11 April 2019).
- Hollenstein, L.; Purves, R. Exploring Place Through User-Generated Content: Using Flickr Tags to Describe City Cores. J. Spat. Inf. Sci. 2010, 2010, 21–48. [Google Scholar]
- Wang, B.; Zhen, F.; Wei, Z.; Guo, S.; Chen, T. A Theoretical Framework and Methodology for Urban Activity Spatial Structure in E-society: Empirical Evidence for Nanjing City, China. Chin. Geogr. Sci. 2015, 25, 672–683. [Google Scholar] [CrossRef]
- Bo, W.; Feng, Z.; Zongcai, W. The Research on Characteristics of Urban Activity Space in Nanjing: An Empirical Analysis Based on Big Data. Hum. Geogr. 2014, 29, 14–21. [Google Scholar]
- Loo, B.P.; Yao, S.; Wu, J. Spatial Point Analysis of Road Crashes in Shanghai: A GIS-Based Network Kernel Density Method. In Proceedings of the 19th International Conference on Geoinformatics, Shanghai, China, 24–26 June 2011; IEEE: Piscataway, NJ, USA, 2011; pp. 1–6. [Google Scholar]
- Long, Y.; Han, H.; Tu, Y.; Shu, X. Evaluating the Effectiveness of Urban Growth Boundaries Using Human Mobility and Activity Records. Cities 2015, 46, 76–84. [Google Scholar] [CrossRef]
- Gu, Z.; Zhang, Y.; Chen, Y.; Chang, X. Analysis of Attraction Features of Tourism Destinations in a Mega-City Based on Check-in Data Mining—A Case Study of ShenZhen, China. ISPRS Int. J. Geo-Inf. 2016, 5, 210. [Google Scholar] [CrossRef]
- Lei, C.; Zhang, A.; Qi, Q.; Su, H.; Wang, J. Spatial-Temporal Analysis of Human Dynamics on Urban Land Use Patterns Using Social Media Data by Gender. ISPRS Int. J. Geo-Inf. 2018, 7, 358. [Google Scholar] [CrossRef]
- Preoţiuc-Pietro, D.; Cohn, T. Mining User Behaviours: A Study of Check-in Patterns in Location Based Social Networks. In Proceedings of the 5th Annual ACM Web Science Conference, Paris, France, 2–4 May 2013; ACM: New York, NY, USA, 2013; pp. 306–315. [Google Scholar]
- Khan, S. Spatial and Temporal Analysis of Water Quality of Ganges System Upto Varanasi by Using GIS and SPSS Tool. Ph.D. Thesis, GB Pant University of Agriculture and Technology, Uttarakhand, India, 2018. [Google Scholar]
- Geenens, G.; Wang, C. Local-Likelihood Transformation Kernel Density Estimation for Positive Random Variables. J. Comput. Graph. Stat. 2018, 27, 822–835. [Google Scholar] [CrossRef]
- OpenStreetMap. Available online: https://www.openstreetmap.org (accessed on 18 April 2019).
- Lohr, S. Big Data is Opening Doors, But Maybe Too Many. New York Times, 23 March 2013. [Google Scholar]
- Chatterjee, P. Big Data: The Greater Good or Invasion of Privacy. The Guardian, 12 March 2013; 12. [Google Scholar]
- Ward, J.S.; Barker, A. Undefined by Data: A Survey of Big Data Definitions. arXiv 2013, arXiv:1309.5821. [Google Scholar]
- Dumbill, E. What is Big Data? An Introduction to the Big Data Landscape. Available online: http://radar.oreilly.com//01/what-is-big-data.html2012 (accessed on 11 May 2019).
- Mayer-Schönberger, V.; Cukier, K. Big Data: A Revolution That Will Transform How We Live, Work, and Think; Houghton Mifflin Harcourt: Boston, MA, USA, 2013. [Google Scholar]
- Miller, H.J.; Goodchild, M.F. Data-Driven Geography. GeoJournal 2015, 80, 449–461. [Google Scholar] [CrossRef]
- Ovadia, S. The Role of Big Data in the Social Sciences. Behav. Soc. Sci. Libr. 2013, 32, 130–134. [Google Scholar] [CrossRef]
- Yanwei, C.; Yue, S.; Zuopeng, X.; Yan, Z.; Ying, Z.; Na, T. Review for Space-time Behavior Research: Theory Frontiers and Application in the Future. Prog. Geogr. 2012, 31, 667–675. [Google Scholar]
- Kwan, M.-P.; Lee, J. Geovisualization of Human Activity Patterns Using 3D GIS: A Time-Geographic Approach. Spat. Integr. Soc. Sci. 2004, 27, 721–744. [Google Scholar]
- Polak, J.; Jones, P. The Acquisition of Pre-trip Information: A Stated Preference Approach. Transp. Res. Part C Emerg. Technol. 1993, 20, 179–198. [Google Scholar] [CrossRef]
- Che, Q.; Duan, X.; Guo, Y.; Wang, L.; Cao, Y. Urban Spatial Expansion Process, Pattern and Mechanism in Yangtze River Delta. Acta Geogr. Sin. 2011, 66, 446–456. [Google Scholar]
- Bo, W.; Feng, Z.; Hao, Z. The Dynamic Changes of Urban Space-time Activity and Activity Zoning Based on Check-in Data in Sina web. Sci. Geogr. Sin. 2015, 35, 151–160. [Google Scholar]
- Hu, Y.; Gao, S.; Janowicz, K.; Yu, B.; Li, W.; Prasad, S. Extracting and Understanding Urban Areas of Interest Using Geotagged Photos. Comput. Environ. Urban Syst. 2015, 54, 240–254. [Google Scholar] [CrossRef]
- Graham, M.; Shelton, T. Geography and The Future of Big Data, Big Data and the Future of Geography. Dialogues Hum. Geogr. 2013, 3, 255–261. [Google Scholar] [CrossRef]
- Kubíček, P.; Konečný, M.; Stachoň, Z.; Shen, J.; Herman, L.; Řezník, T.; Staněk, K.; Štampach, R.; Leitgeb, Š. Population distribution modelling at fine spatio-temporal scale based on mobile phone data. Int. J. Digit. Earth 2019, 12, 1319–1340. [Google Scholar] [CrossRef]
- Gonzalez, M.C.; Hidalgo, C.A.; Barabasi, A.-L. Understanding Individual Human Mobility Patterns. Nature 2008, 453, 779–782. [Google Scholar] [CrossRef] [PubMed]
- Song, C.; Qu, Z.; Blumm, N.; Barabási, A.-L. Limits of Predictability in Human Mobility. Science 2010, 327, 1018–1021. [Google Scholar] [CrossRef] [PubMed]
- Zhu, X. GIS and Urban Mining. Resources 2014, 3, 235–247. [Google Scholar] [CrossRef]
- Yuan, J.; Zheng, Y.; Xie, X. Discovering Regions of Different Functions in a City using Human Mobility and POIs. In Proceedings of the 18th ACM SIGKDD International Conference on Knowledge Discovery and Data Mining, Beijing, China, 22–27 August 2012; ACM: New York, NY, USA, 2012; pp. 186–194. [Google Scholar]
- Wesolowski, A.; Qureshi, T.; Boni, M.F.; Sundsøy, P.R.; Johansson, M.A.; Rasheed, S.B.; Engø-Monsen, K.; Buckee, C.O. Impact of Human Mobility on the Emergence of Dengue Epidemics in Pakistan. Proc. Natl. Acad. Sci. 2015, 112, 11887–11892. [Google Scholar] [CrossRef] [PubMed]
- Pappalardo, L.; Simini, F.; Rinzivillo, S.; Pedreschi, D.; Giannotti, F.; Barabási, A.-L. Returners and Explorers Dichotomy in Human Mobility. Nat. Commun. 2015, 6, 8166. [Google Scholar] [CrossRef]
- Fan, C.; Liu, Y.; Huang, J.; Rong, Z.; Zhou, T. Correlation Between Social Proximity and Mobility Similarity. Sci. Rep. 2017, 7, 11975. [Google Scholar] [CrossRef]
- Cheng, C.; Jain, R.; van den Berg, E. Location Prediction Algorithms for Mobile Wireless Systems. In Wireless Internet Handbook; CRC Press, Inc.: Boca Raton, FL, USA, 2003; pp. 245–263. [Google Scholar]
- Cho, E.; Myers, S.A.; Leskovec, J. Friendship and Mobility: User Movement in Location-Based Social Networks. In Proceedings of the 17th ACM SIGKDD International Conference on Knowledge Discovery and Data Mining, San Diego, CA, USA, 22–27 August 2011; ACM: New York, NY, USA, 2011; pp. 1082–1090. [Google Scholar]
- Gao, H.; Tang, J.; Liu, H. Exploring Social-Historical Ties on Location-Based Social Networks. In Proceedings of the Sixth International AAAI Conference on Weblogs and Social Media, Dublin, Ireland, 4–8 June 2012. [Google Scholar]
- Lindqvist, J.; Cranshaw, J.; Wiese, J.; Hong, J.; Zimmerman, J. I’m the Mayor of My House: Examining Why People Use Foursquare-A Social-Driven Location Sharing Application. In Proceedings of the SIGCHI Conference on Human Factors in Computing Systems, Vancouver, BC, Canada, 7–12 May 2011; ACM: New York, NY, USA, 2011; pp. 2409–2418. [Google Scholar]
- Noulas, A.; Scellato, S.; Mascolo, C.; Pontil, M. An Empirical Study of Geographic User Activity Patterns in Foursquare. In Proceedings of the Fifth international AAAI Conference on Weblogs and Social Media, Barcelona, Spain, 17–21 July 2011. [Google Scholar]
- Scellato, S.; Noulas, A.; Lambiotte, R.; Mascolo, C. Socio-spatial Properties of Online Location-based Social Networks. In Proceedings of the Fifth International AAAI Conference on Weblogs and Social Media, Barcelona, Spain, 17–21 July 2011. [Google Scholar]
- Khan, N.U.; Wan, W.; Yu, S. Spatiotemporal Analysis of Tourists and Residents in Shanghai Based on Location-Based Social Network’s Data from Weibo. ISPRS Int. J. Geo Inf. 2020, 9, 70. [Google Scholar] [CrossRef]
- Zhang, J.-D.; Chow, C.-Y. iGSLR: Personalized Geo-Social Location Recommendation: A Kernel Density Estimation Approach. In Proceedings of the 21st ACM SIGSPATIAL International Conference on Advances in Geographic Information Systems, Orlando, FL, USA, 5–8 November 2013; ACM: New York, NY, USA, 2013; pp. 334–343. [Google Scholar]
- Colombo, G.B.; Chorley, M.J.; Williams, M.J.; Allen, S.M.; Whitaker, R.M. You Are Where You Eat: Foursquare Checkins as Indicators of Human Mobility and Behaviour. In Proceedings of the IEEE International Conference on Pervasive Computing and Communications Workshops, Lugano, Switzerland, 19–23 March 2012; IEEE: Piscataway, NJ, USA, 2012; pp. 217–222. [Google Scholar]
- Li, Y.; Steiner, M.; Wang, L.; Zhang, Z.-L.; Bao, J. Exploring Venue Popularity in Foursquare. In Proceedings of the IEEE INFOCOM, Turin, Italy, 14–19 April 2013; IEEE: Piscataway, NJ, USA, 2013; pp. 3357–3362. [Google Scholar]
- Graham, M.W.; Avery, E.J.; Park, S. The Role of Social Media in Local Government Crisis Communications. Public Relat. Rev. 2015, 41, 386–394. [Google Scholar] [CrossRef]
- Sutton, J.; Palen, L.; Shklovski, I. Backchannels on the Front Lines: Emergent Uses of Social Media in the 2007 California Wildfires. In Proceedings of the Conference on Information Systems for Crisis Response and Management (ISCRAM), Washington, DC, USA, 4–7 May 2008. [Google Scholar]
- Preston, J.; Stelter, B. How Government Officials are Using Twitter for Hurricane Sandy. The New York Times, 2 November 2012. [Google Scholar]
- Lin, S.; Xie, R.; Xie, Q.; Zhao, H.; Chen, Y. Understanding User Activity Patterns of The Swarm APP: A Data-Driven Study. In Proceedings of the ACM International Joint Conference on Pervasive and Ubiquitous Computing and ACM International Symposium on Wearable Computers, Maui, Hawaii, 12–16 September 2017; ACM: New York, NY, USA, 2017; pp. 125–128. [Google Scholar]
- Shi, B.; Zhao, J.; Chen, P.-J. Exploring Urban Tourism Crowding in Shanghai via Crowdsourcing Geospatial Data. Curr. Issues Tour. 2017, 20, 1186–1209. [Google Scholar] [CrossRef]
- Rizwan, M.; Wan, W.; Cervantes, O.; Gwiazdzinski, L. Using Location-based Social Media Data to Observe Check-in Behavior and Gender Difference: Bringing Weibo Data into Play. ISPRS Int. J. Geo Inf. 2018, 7, 196. [Google Scholar] [CrossRef]
- Press Releases. Available online: http://ir.sina.com/ (accessed on 11 May 2019).
- Liu, C.Y.; Chen, J.; Li, H. Linking Migrant Enclave Residence to Employment in Urban China: The Case of Shanghai. J. Urban Aff. 2019, 41, 189–205. [Google Scholar] [CrossRef]
- Xiao, Y.; Wang, D.; Fang, J. Exploring the Disparities in Park Access Through Mobile Phone Data: Evidence from Shanghai, China. Landsc. Urban Plan. 2019, 181, 80–91. [Google Scholar] [CrossRef]
- Zhang, Y.; Li, X.; Wang, A.; Bao, T.; Tian, S. Density and Diversity of OpenStreetMap Road Networks in China. J. Urban Manag. 2015, 4, 135–146. [Google Scholar] [CrossRef]
- Lichman, M.; Smyth, P. Modeling Human Location Data with Mixtures of Kernel Densities. In Proceedings of the 20th ACM SIGKDD International Conference on Knowledge Discovery and Data Mining, New York, NY, USA, 24–27 August 2014; ACM: New York, NY, USA, 2014; pp. 35–44. [Google Scholar]
- Zhang, J.; Wu, L. The Influence of Population Movements on the Urban Relative Humidity of Beijing During the Chinese Spring Festival Holiday. J. Clean. Prod. 2018, 170, 1508–1513. [Google Scholar] [CrossRef]
- Hasan, S.; Zhan, X.; Ukkusuri, S.V. Understanding Urban Human Activity and Mobility Patterns Using Large-Scale Location-Based Data from Online Social Media. In Proceedings of the 2nd ACM SIGKDD International Workshop on Urban Computing, Chicago, IL, USA, 22–27 August 2013; ACM: New York, NY, USA, 2013; p. 6. [Google Scholar]
- Huang, H.; Gartner, G. Current Trends and Challenges in Location-Based Services. ISPRS Int. J. Geo-Inf. 2018, 7, 199. [Google Scholar] [CrossRef]
- Rizwan, M.; Wan, W. Big Data Analysis to Observe Check-in Behavior Using Location-Based Social Media Data. Information 2018, 9, 257. [Google Scholar] [CrossRef]
- Netek, R.; Pour, T.; Slezakova, R.J.O.G. Implementation of Heat Maps in Geographical Information System–Exploratory Study on Traffic Accident Data. Open Geosci. 2018, 10, 367–384. [Google Scholar] [CrossRef]
- Longley, P.A.; Adnan, M. Geo-temporal Twitter Demographics. Int. J. Geogr. Inf. Sci. 2016, 30, 369–389. [Google Scholar] [CrossRef]


| User ID | Date | Time | Gender | Location ID | Latitude | Longitude | Location |
|---|---|---|---|---|---|---|---|
| 18…73 | 6/30/2017 | 22:06:16 | m | B2…93 | 121.323346 | 31.258411 | HSBC_Court |
| 58…96 | 6/30/2017 | 11:11:58 | f | B2…93 | 121.395081 | 31.31339561 | Shanghai_University |
| 31…23 | 6/30/2017 | 18:00:59 | m | B2…9B | 121.58817 | 31.310072 | Golf_Training_Center |
| 51…16 | 6/30/2017 | 19:13:45 | f | B2…9B | 121.345023 | 31.283799 | Baili_Life_Plaza |
| Category | Check-In Venue Example |
|---|---|
| Entertainment | Concert_Hall_Daning_Theatre Cinema_Shanghai_Paragon_Studios Jumbo_KTV_(Guoding_Road) Attractions_Disney_Town_(Disneyland) |
| Educational | Shanghai_Information_Technology_School Shanghai_University_Baoshan_Campus Tongji_University_South_Campus Cao_Yang_Second_Middle_School |
| Food | Tang_Lian_Hot_Spring_Restaurant Starbucks_(Gubei_Store) Fast_Food_McDonald’s_(Hongqiao_Railway_Station) Cafe_COSTA_COFFEE_(Shanghai_Hongqiao_Hub_2) |
| General Location | General_Location_Mark_Bund Shanghai_Nanjing_East_Road Wanda_square Changle_Road |
| Hotel | Asia_Pacific_Marriott_Hotel Three_Star _Yunfeng_Hotel Five_Star _Shanghai_Fujian_Hotel |
| Professional | HSBC_Court_Buildings Ping_An_Bank_Headquarters Hospital_Jinyang_Lot_Hospital Building_ZTE_Corporation_Building |
| Residential | Residential_area_Caojiang_Apartment Residential_area_Fuyou_Jiayuan Residential_area_Yonghe_Sancun Xinli_Greenland_Apartments |
| Shopping & Services | Shopping_Mall_Baili_Life_Plaza Mall_Australia_Square Quyang_Life_Mall Mall_Lotus_International_Plaza |
| Sports | Comprehensive_Gymnasium_Jiading_Sports_Center Sports_venue_Discikat_Karting Playground_Happy_Valley Lushan_Golf_Club |
| Travel | Railway_Station_Nanxiang_North_Station Hongqiao_Airport Yuhong_Road_Subway_Station Line_2_Xujing_East_Bus_Station |
| Category | No. of Locations | % | Average no of Check-Ins | Total no. of Check-Ins | Average no. of Users | Total no. of Users |
|---|---|---|---|---|---|---|
| Educational | 88 | 12% | 319.76 | 28,139 | 233.35 | 20,535 |
| Entertainment | 136 | 19% | 409.90 | 55,747 | 311.71 | 42,393 |
| Food | 27 | 4% | 296.85 | 8015 | 182.59 | 4930 |
| General Location | 55 | 8% | 247.60 | 13,618 | 199.51 | 10,973 |
| Hotel | 30 | 4% | 334.27 | 10,028 | 231.17 | 6935 |
| Professional | 51 | 7% | 225.82 | 11,517 | 162.16 | 8270 |
| Residential | 172 | 24% | 168.19 | 28,928 | 136.67 | 23,508 |
| Shopping & Services | 90 | 12% | 376.92 | 33,923 | 292.00 | 26,280 |
| Sports | 26 | 4% | 568.12 | 14,771 | 432.92 | 11,256 |
| Travel | 47 | 7% | 379.55 | 17,839 | 251.45 | 11,818 |
© 2020 by the authors. Licensee MDPI, Basel, Switzerland. This article is an open access article distributed under the terms and conditions of the Creative Commons Attribution (CC BY) license (http://creativecommons.org/licenses/by/4.0/).
Share and Cite
Khan, N.U.; Wan, W.; Yu, S. Location-Based Social Network’s Data Analysis and Spatio-Temporal Modeling for the Mega City of Shanghai, China. ISPRS Int. J. Geo-Inf. 2020, 9, 76. https://doi.org/10.3390/ijgi9020076
Khan NU, Wan W, Yu S. Location-Based Social Network’s Data Analysis and Spatio-Temporal Modeling for the Mega City of Shanghai, China. ISPRS International Journal of Geo-Information. 2020; 9(2):76. https://doi.org/10.3390/ijgi9020076
Chicago/Turabian StyleKhan, Naimat Ullah, Wanggen Wan, and Shui Yu. 2020. "Location-Based Social Network’s Data Analysis and Spatio-Temporal Modeling for the Mega City of Shanghai, China" ISPRS International Journal of Geo-Information 9, no. 2: 76. https://doi.org/10.3390/ijgi9020076
APA StyleKhan, N. U., Wan, W., & Yu, S. (2020). Location-Based Social Network’s Data Analysis and Spatio-Temporal Modeling for the Mega City of Shanghai, China. ISPRS International Journal of Geo-Information, 9(2), 76. https://doi.org/10.3390/ijgi9020076