Characterizing Tourism Destination Image Using Photos’ Visual Content


1
School of Geography and Environment, Jiangxi Normal University, Nanchang 330022, China
2
Key Laboratory of Poyang Lake Wetland and Watershed Research, Ministry of Education, Jiangxi Normal University, Nanchang 330022, China
*
Author to whom correspondence should be addressed.
ISPRS Int. J. Geo-Inf. 2020, 9(12), 730; https://doi.org/10.3390/ijgi9120730
Submission received: 17 October 2020
/
Revised: 30 November 2020
/
Accepted: 5 December 2020
/
Published: 7 December 2020
Abstract
:“A picture is worth a thousand words”. Analysis of the visual content of tourist photos is an effective way to explore the image of tourist destinations. With the development of computer deep learning and big data mining technology, identifying the content of massive numbers of tourist photos by convolutional neural network (CNN) approaches breaks through the limitations of manual approaches of identifying photos’ visual information, e.g., small sample size, complex identification process, and results deviation. In this study, 531,629 travel photos of Jiangxi were identified as 365 scenes through deep learning technology. Through the latent Dirichlet allocation (LDA) model, five major tourism topics are found and visualized by map. Then, we explored the spatial and temporal distribution characteristics of different tourism scenes based on hot spot analysis technology and the seasonal evaluation index. Our research shows that the visual content mining on travel photos makes it possible to understand the tourism destination image and to reveal the temporal and spatial heterogeneity of the image, thereby providing an important reference for tourism marketing.
1. Introduction
Tourism destination image (TDI) refers to the collection of people’s ideas, thoughts, and impressions of a tourist destination, which plays an important role in the process of tourists choosing a destination, as well as the selection of the appropriate destination marketing strategies [1,2]. A good tourism image enhances the competitiveness of the destination tourism [3], which improves the satisfaction and loyalty of tourists, and benefits the long-term development of tourist destinations. Traditional TDI research tends to rely on questionnaires or interviews to collect data from tourists or volunteers for TDI measurement [1], which are laborious, costly, and time consuming. These methods can be applied to the study of a tourism image on a small spatial scale. However, the tourism image of a destination is usually affected by the spatial distribution of tourism resources [4], and the scenery usually changes seasonally [5]. It is more challenging, yet meaningful, to develop the research framework of the spatial and temporal distribution of the tourism image. It is of great significance for researchers, tourism managers, and destination marketing organizations (DMO) to understand how tourists perceive scenic spots on a regional scale at different places.
Since the emergence of Web 2.0 applications, a massive amount of geo-tagged travel photos have been shared online and especially on social media [2]; the photos describe every scenic spot of a destination. Compared with statistical data, expert consultation, and questionnaire survey, this user-generated content (UGC) provides credible and relatively easy-to-obtain data for tourism image research. Moreover, computer vision technology based on deep learning identifies visual content and the achieved progress over the recent years is obvious [6,7]; its powerful ability in automatic image feature learning and representation has been improved greatly, which makes it possible to study visual images based on massive photo data. This has been widely used in various fields and has led to great success [6,8].
Tourism image research has been conducted since the early 1970s [9] and comprises many related studies to date. With the rapid development of deep learning technology and big data technology, using UGC data to carry out tourism image research has become a new hot spot in tourism research. However, there has been less research on tourism image based on the visual content of massive social media photos, as most of the research focuses on the text content of social media [10,11] or the metadata of photos [8,12,13,14]. Sheng [15] found that the content of online photos is also very important for researchers to understand the destination image. Many studies have confirmed this view. For example, Kim [16] analyzes Seoul’s tourism image by using the visual content of tourists’ photos, and Stepchenkova [17] compares the differences of Peru’s image reflected by DMO photos and UGC photos. However, most studies have focused on analyzing photos of specific countries, cities, or scenic spots. There have been no studies to analyze in detail the tourism image of the province by categorizing the photos posted by tourists at all attractions in the province. Therefore, a well-known problem in past studies is that it does not take into account the spatial and temporal distribution of tourism image.
The purpose of this research is to analyze the tourism image of tourist attractions and explore the temporal and spatial characteristics of different images by analyzing the photos uploaded on SNS by tourists. More concretely, a deep learning approach is used to identify the tourism scenes in the photos of a scenic spot. The approach allows accurate identification of 365 scenes like mountains, lakes, gardens, etc. Furthermore, the latent dirichlet allocation (LDA) model is applied to establish a model according to the set topic to distinguish the classification of tourism image. The hot spots and cold spots distribution maps of various tourism scenes were drawn, and the spatial distribution characteristics of tourism images were revealed through spatial analyses. Calculation of the seasonal intensity index and seasonal change index of each tourism scene through temporal analysis was conducted to explore the low and peak seasons of the scenes. The results take researchers and tourism managers one step closer to a better understanding of scenic spots by exploring underlying tourism spatiotemporal heterogeneity patterns and revealing the impact factors of tourism image.
2. Literature Review
Photography has been inseparable from tourism since its birth. Photographs are an important medium for perceiving the image of a tourist destination, which not only contains an objective description of the tourist destination [18], yet also reflects the subjective feelings of tourists [3,19]. For a long time, many scholars have used photos for research in the field of tourism.
Early scholars mostly focused on using pictures in traditional media, such as postcards [20,21], commercials [22], and guidebooks [23], to explore the image of tourist destinations. The photos on these media are all carefully taken by destination management organizations and commercial photographers. Researchers can only passively respond to these existing photos, which greatly limits the accuracy of the research. Stepchenkova found that there is a significant difference between the image of the destination management organization and the tourism photos shared by tourists [17]. There are also researchers who use visitor-employed photography (VEP) to obtain pictures of tourist destinations [24,25], which assigns cameras to tourists and requires them to photograph attractions according to prescribed research standards. Garrod’s research shows that the content of the photos obtained through VEP and the photos on the postcards are not the same, for example, the presence of water bodies is significantly more likely to be a prominent feature of postcards than it is of tourist photographs [24]. However, obtaining photos is still difficult and costly based on the VEP. The research [24] obtained 164 photos. The research [25] obtained 1748 photos in 24 days. In recent years, with the popularity of smartphones and the booming development of various social media and photo sharing platforms, researchers can obtain pictures of destinations from more channels. Some studies are based on online search engines to collect photographs related to the destination [17,26,27], in which researchers generally use multiple keywords to find the destination’s website, and then download photos from the website. With the popularity of new online communities (Flickr, Twitter, Panoramio, etc.), more and more tourists are willing to share their travel experiences on these social network sites (SNSs). There are millions of travel photos shared by users on the platform. As a result, researchers are paying more and more attention to SNS photos as a source of understanding TDI [18,28,29]. Compared with search engines, there are more photos on SNS, and these photos can be used to objectively reflect the image of tourist destinations.
To explore the valuable information hidden in the photo data for tourism research, researchers have conducted various aspects of work. Most existing studies conducted analyses indirectly on the metadata embedded in photos [2], which fall into four primary categories in the tourism field [2]: application of user-related information (such as photo ID and user ID) in the photo to analyze the portrait of visitors [28]; focus on time information (shooting date and upload date) and estimation of visit duration at a tourist site [14]; analysis of the spatial distribution characteristics of tourist destinations based on geographic information (latitude and longitude) [8]; and selection of the most suitable tag to describe the destination based on the analysis of the text information (title, description, and label) [13]. These studies can effectively filter out useful information from the metadata of tourism photos and provide a novel, reliable, and low-cost research data source for tourism destination image research. However, photo data involves a lot of interesting information apart from metadata [2]. With the development of deep learning technology, new powerful photo mining technologies have emerged, which can be applied directly to the photo rather than the metadata embedded in photos. Using deep learning to analyze the visual content of UGC photos, Zhang has made a lot of attempts in the field of city image [19,30]. He first proposed a framework, which uses street view images to predict the human perception score of an urban image along with six perception indicators: safety, liveliness, boredom, affluence, depression, and beauty [19]. A later study, based on the previous framework, found many inconspicuous yet popular restaurants and beautiful but unpopular outdoor places in Beijing [30]. Besides, there are many studies based on deep learning that analyze city images [16,31,32]. Nevertheless, in the field of tourism, this is the starting era for the deep learning approach, and there are only a few similar studies [28,33].
Thus, tourist photos have always been the key data for tourism research. However, previous studies had some limitations due to the lack of adequate data and efficient methods for quantification of the visual aspects of tourist destinations. In the era of the social network rise, it is an inevitable trend to use deep mining to apply visual image content to tourism research.
3. Materials and Methods
In the following section, we introduce the study area, UGC photo data, and analysis method of photo visual content, including scene classification, topic clustering, spatial analysis, and temporal analysis.
3.1. Study Area and Materials Characteristics
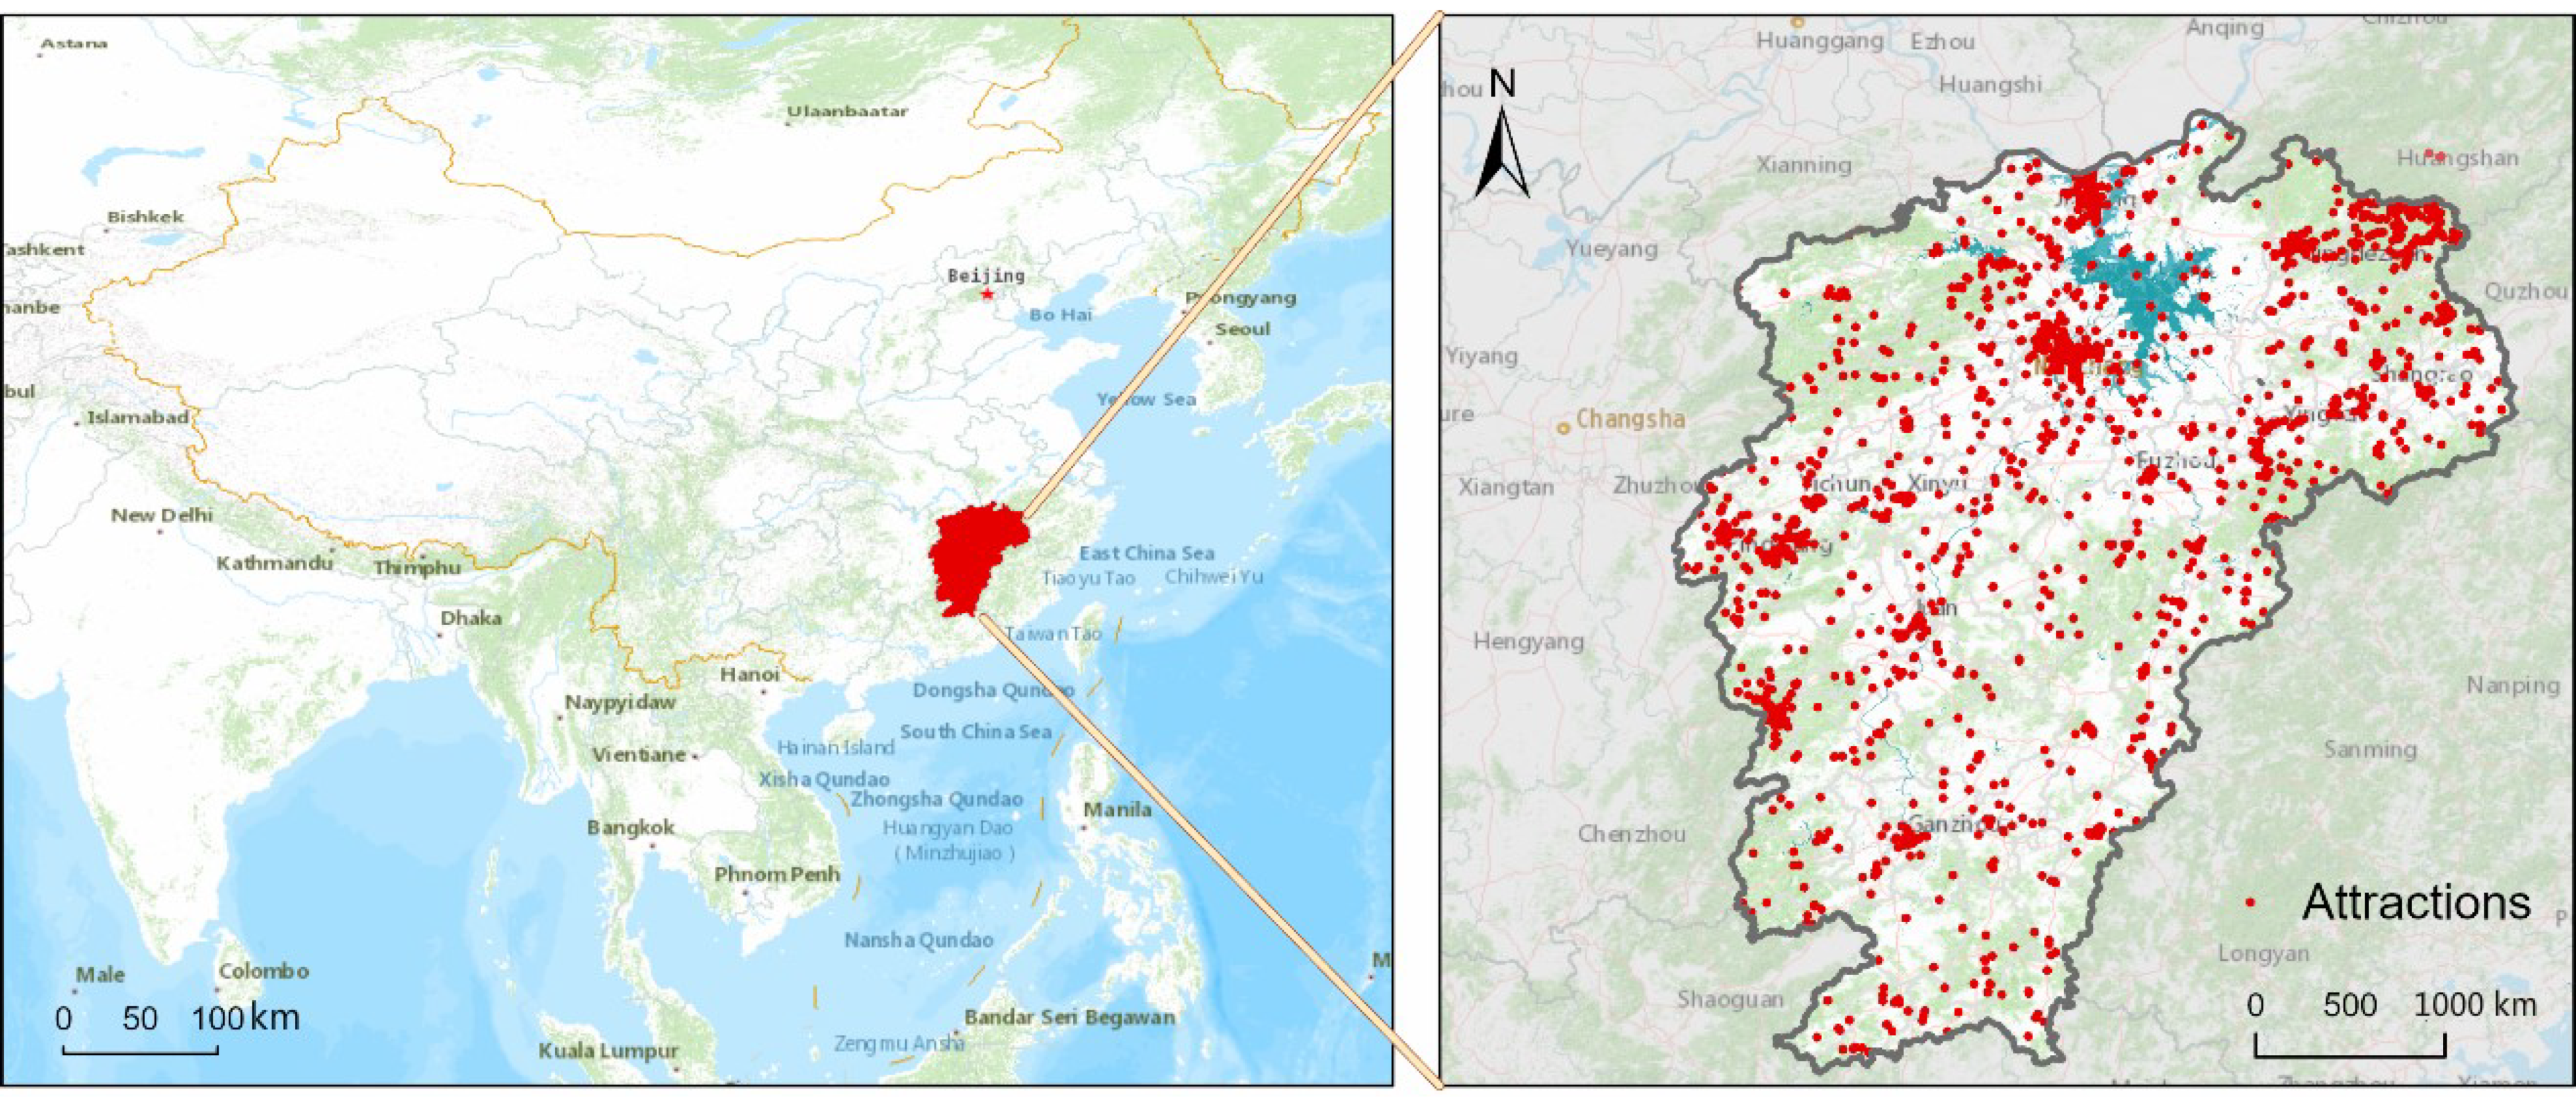
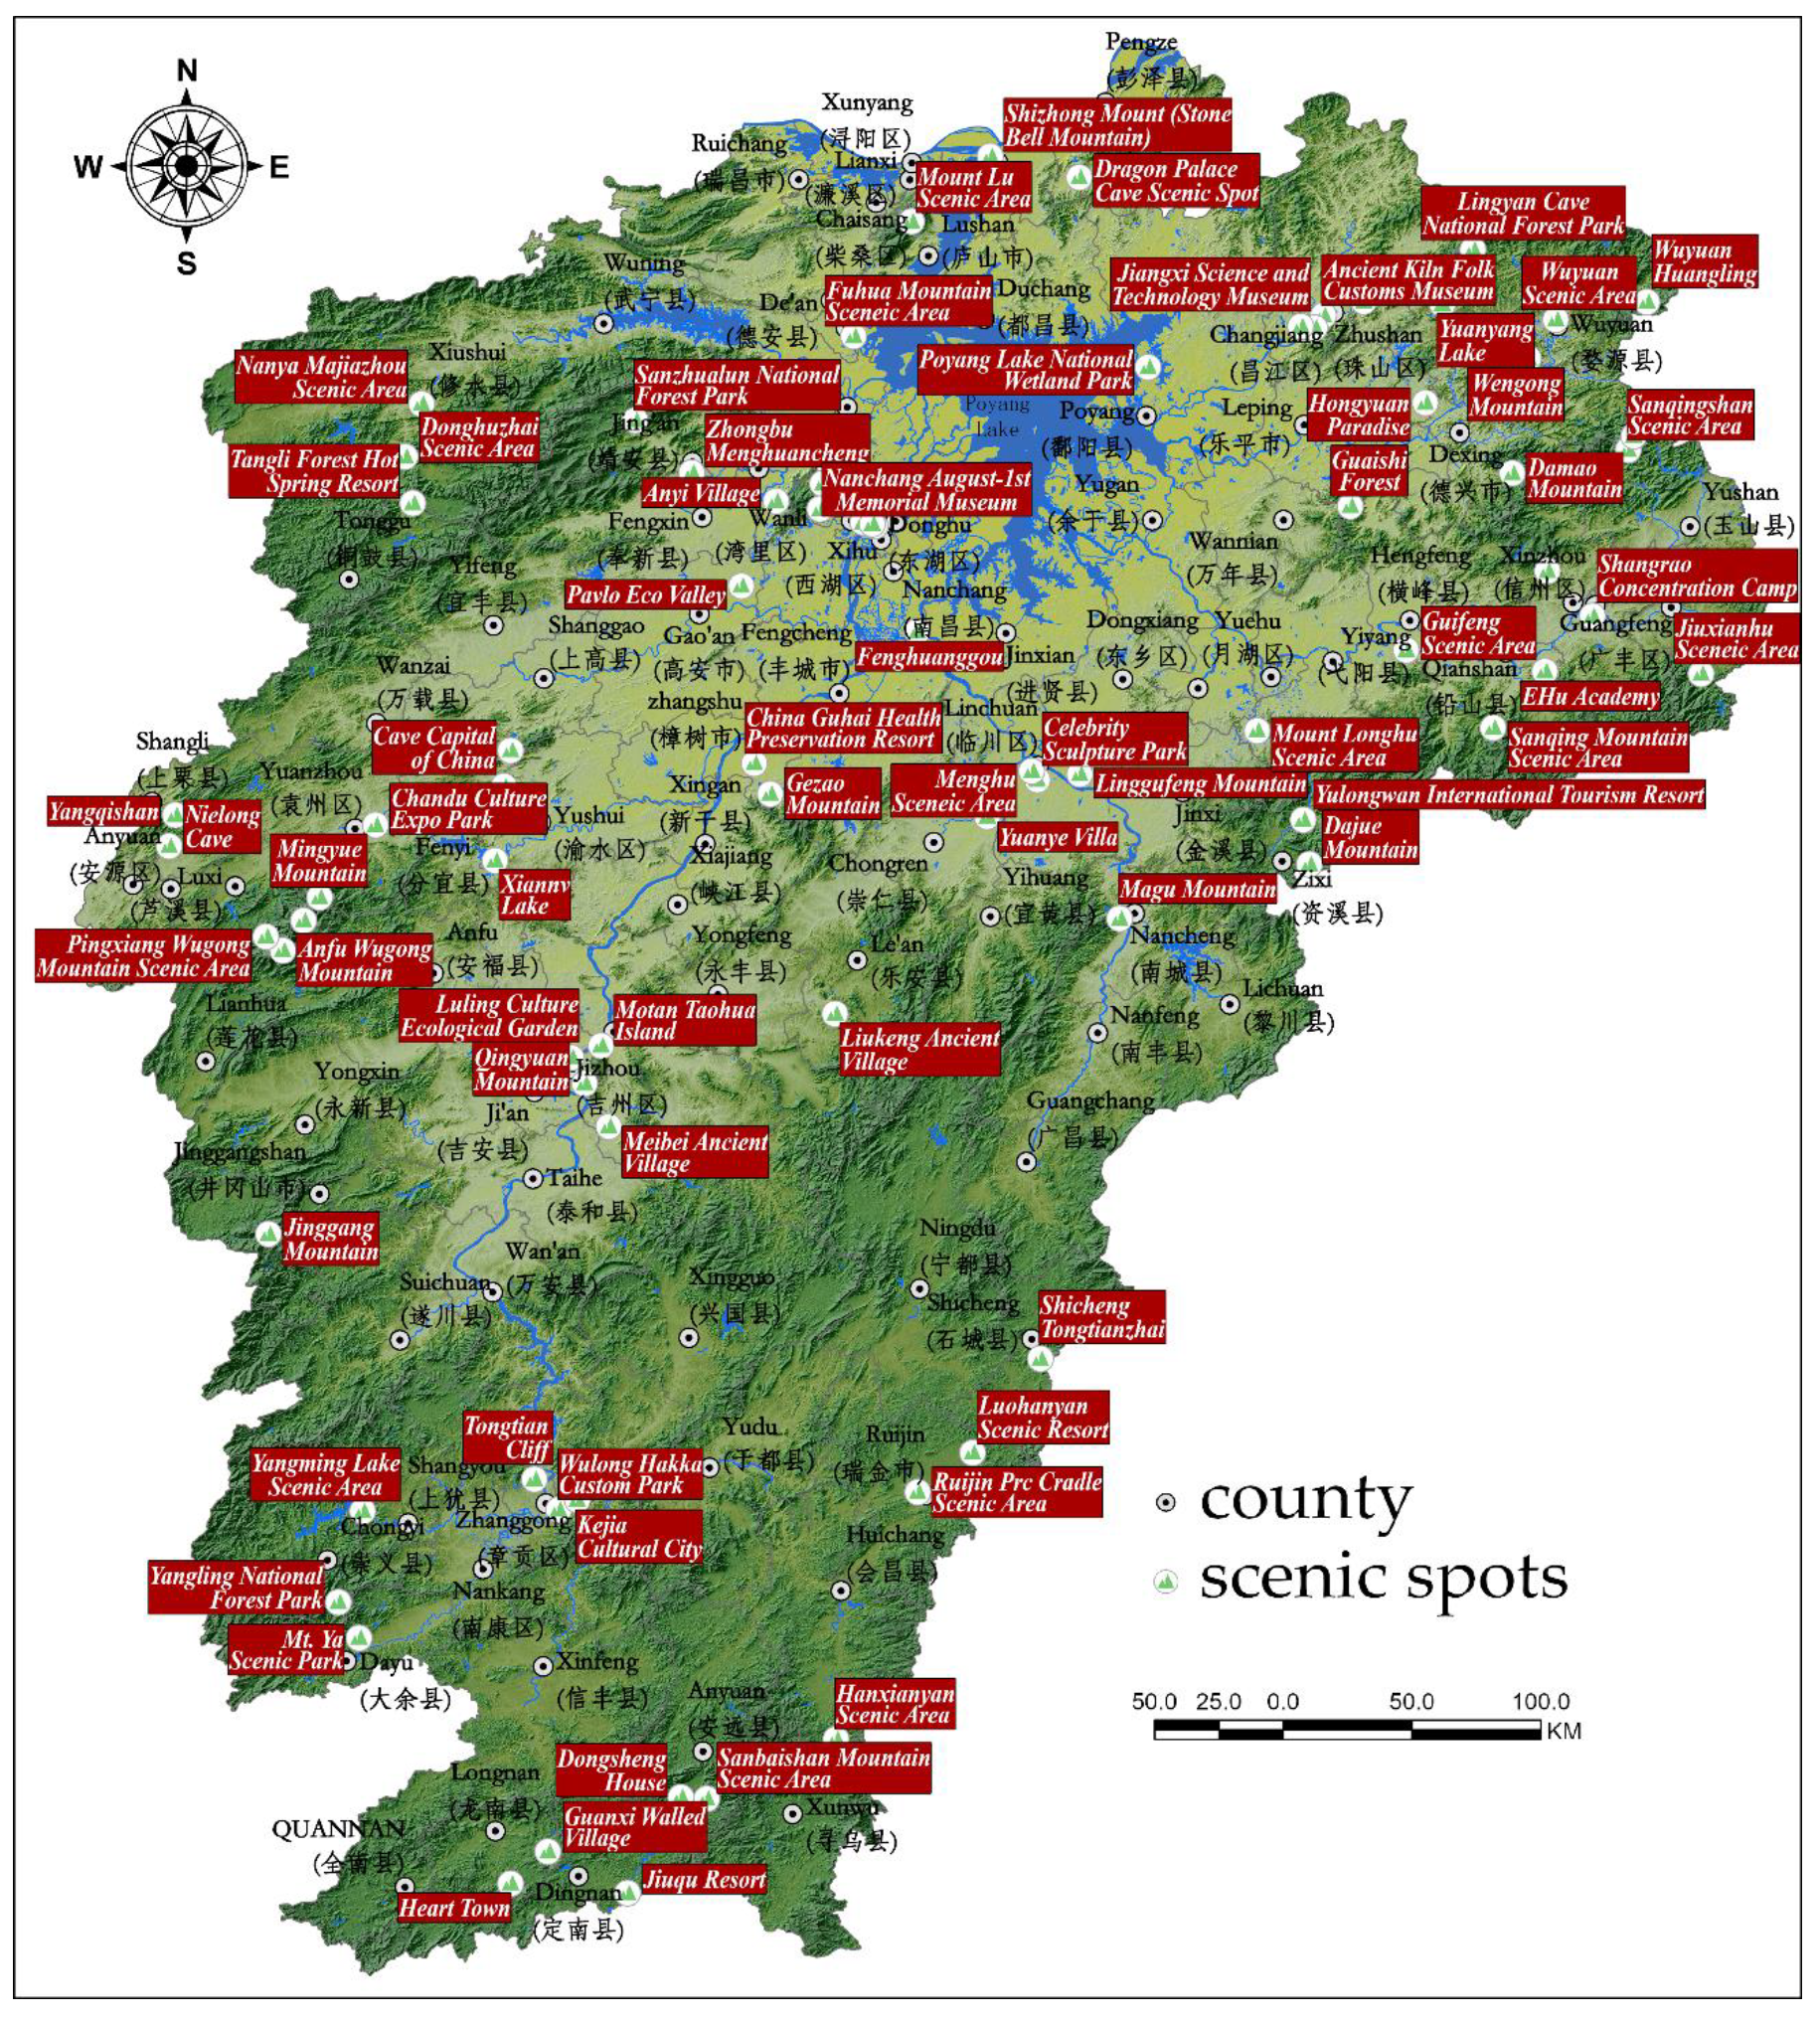
Located in the middle and lower reaches of the Yangtze River in China, Jiangxi Province has a total area of 169,000 square kilometers and a population of 46.661 million (Figure 1). Jiangxi Province is located in the middle subtropics, the monsoon climate is remarkable, the four seasons show picturesque changes in scenery, the ecology is good, and the tourism resources are rich. Poyang Lake, the largest freshwater lake in China, is located in Jiangxi Province. There are many world-class tourist attractions located around Poyang Lake, such as Lushan Mountain, Jingdezhen, Wuyuan, Sanqing Mountain, Guifeng, Longhu Mountain, and others (as shown in Figure A1). These attractions include mountains, lakes, ancient villages, ceramic art, and religious culture, and are considered to be “the most Chinese” tourist route, which is popular among both domestic and foreign tourists. In 2019, the province received 790.783 million domestic tourists, while visitor expenditures amounted to a total of 959.67 billion yuan (data source: official website of Jiangxi Provincial People’s government (http://www.jiangxi.gov.cn/art/2020/3/17/art_5472_1591893.html)). Therefore, Jiangxi’s tourism industry has a pivotal role in the local economy. Strengthening the study of tourism flow in Jiangxi Province plays a key role in the integration of regional tourism resources, and it is of great significance to promote the sustainable development of tourism in Jiangxi Province.
Mafengwo.com is a Chinese travel SNS website that enables users to share travel experiences. It has many users and provides massive amounts of data. Since the launch of the online operation of Mafengwo.com in 2006, the number of registered users continued to rise. By 2018, the number of users exceeded 100 million. In comparison with the online travel agency (OTA), such as Ctrip.com and Qunar.com, Mafengwo.com is a travel social sharing website focusing on user-generated content (UGC). It is more focused on users’ original and shared content. The comments in it are authentic and proactive and therefore have high research value. People can learn the user’s true feelings from the content generated by the user. The research team first collected 2540 attractions and their geographical coordinates in Jiangxi Province, and then collected 531,629 travel photos of the attractions uploaded by users from January 2015 to June 2020.
3.2. Convolutional Neural Networks for Scene Classification
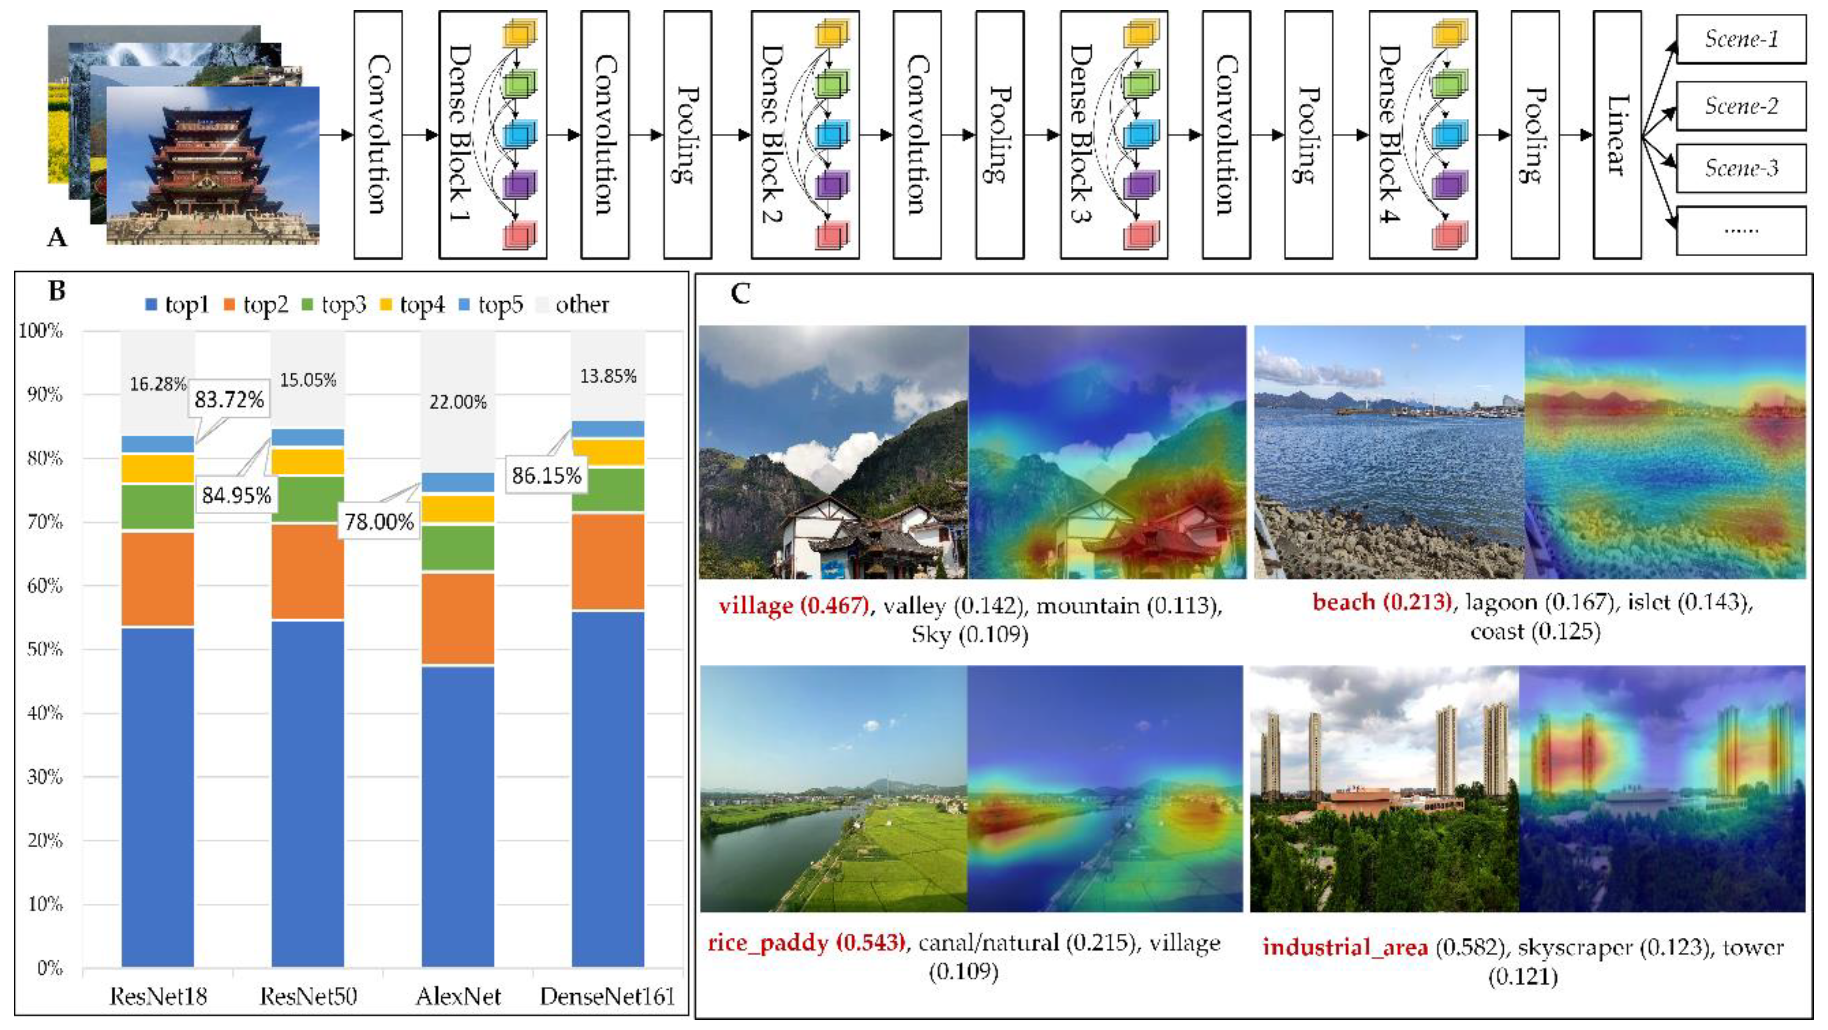
To explore the characteristics of attractions, scene recognition technology was applied for the identification of the scenes of tourist photos. The common tourism classes, which can be detected in the scene classification, include a mountain, pagoda, field, village, forest, lake, etc. In this work, the scene classification model Places365-CNN [7] is used to extract the scenes in the attractions. Convolutional neural networks (CNNs) trained on the Places2 Database, Places365-CNN can recognize the 365 different classes of scene/location and the class activation map that indicates the discriminative image regions used by the CNN to identify that category (Figure 2C). The choice of Places365-CNN is based on two key reasons. Firstly, its model is built on a large-scale data set. Places2 Database contains more than 10 million images comprising 400+ unique scene categories, which is designed following the principles of human visual cognition [7]. The dataset features 5000 to 30,000 training images per class, consistent with real-world frequencies of occurrence. Second, Places365-CNN provides AlexNet [34], ResNet (ResNet18 and ResNet50; the following numbers indicate the number of layers of the neural network) [35], DenseNet161 [36], and multiple prediction trained models, which we can use directly.
The run of the prediction trained models to get the scene prediction from the photos, as well as the prediction results, were sorted out according to the scene possibility (Figure 2A). The research team used 36,500 photos in the validation set of places2 dataset to test the four models, respectively, which showed that the DenseNet161 model had the highest accuracy 56.16% for top-1 accuracy and 86.15% for top-5 accuracy on the validation set (Figure 2B). Therefore, the DenseNet161 prediction trained model was used to extract scenes from the travel photos we collected. As shown in Figure 2C, the class activation maps (CAMs) [37], generated by mapping the predicted class scores back to the previous convolutional layer, are used to highlight the discriminative image regions used for the top 1 tourism scene classification, making the results more explanatory. The real world is complicated, and various scenes are crisscrossed. For example, the place in the first photo of Figure 2C is a combination of various scenes of village, valley, and mountains. Therefore, this study draws on the DEMO (http://places2.csail.mit.edu/demo.html) processing method and determines that the scene categories with a probability higher than 0.1 in the classification results of each photo are valid. Finally, we got a frequency of 365 types of scenes for each scenic spot.
3.3. Tourism Scene Clustering Based on LDA
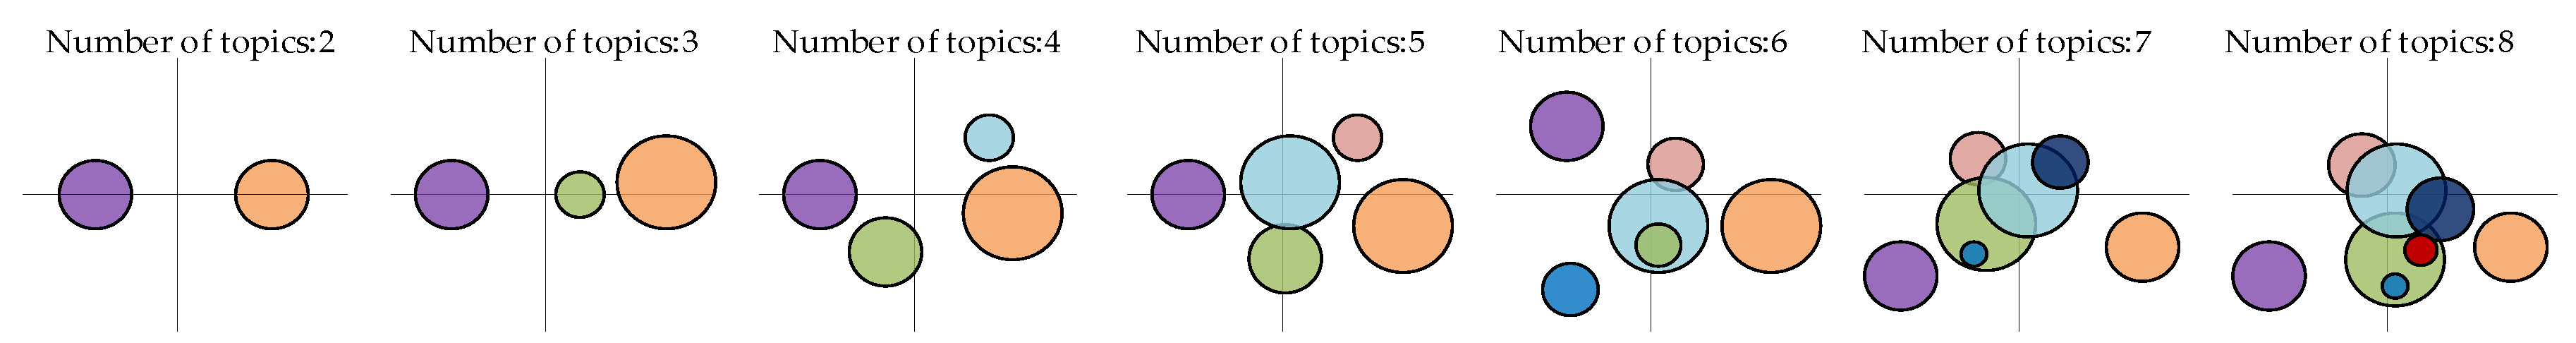
Latent Dirichlet Allocation (LDA) is an unsupervised machine learning technology, which uses a three-level Bayesian probability model to identify the hidden topic information in documents [38]. Its main idea is the following: a document is composed by selecting a topic with a certain probability, and selecting a word from the topic with a certain probability, that is, a document represents a probability distribution composed of several topics, and each topic represents a probability distribution composed of several words. In this study, we regard a tourism attraction as a “document” and a scene in a tourism attraction as a “word” in the “document”, in order to find out the theme of the tourism attraction and the scenes contained in the theme. It is very important to select the appropriate number of topics in the LDA model. Too many topics will lead to many meaningless topics, and too few topics will make a topic too general, which will affect the accuracy of the results. Ldavis [39] was used to confirm the number of topics of attractions. Ldavis provides a global view of the topics (and how they differ from each other), while at the same time allowing for a deep inspection of the terms most highly associated with each topic [39].
We have done many experiments on the choice of the number of topics. Figure 3 shows the Ldavis’s evaluation of the topic classification in each experiment. The results show that the LDA model can clearly classify tourism attractions into two to five topics. It also shows that setting the number of topics higher than five does not improve the modeling of topics significantly, and the topics start to repeat and some meaningless topics appear. Based on the previous analysis, we classify the tourism attractions into five topics.
There has been a lot of research showing that ranking terms in decreasing order of probability is suboptimal for topic interpretation, in that the topics inferred by LDA are not always easily interpretable by humans [39,40]. We use the relevance index proposed by Carson and Kenneth [39], by which to rank terms within topics to aid in the task of topic interpretation. The relevance of scene w to topic k given a weight parameter (where ) as:
Let denote the probability of the scene for topic , and let denote the marginal probability of the scene w in all scenes. This study adjusted the value of several times and found that the optimal relevance can be obtained when = 0.3.
3.4. Spatial Analysis
The tourism image is affected by the natural environment and human factors, and there are spatial differences. Hot spot analysis can identify the spatial distribution of high value and low value cluster of different tourism scenes, and can effectively reflect the spatial relevance of each tourism image. This paper uses the Getis-Ord statistic [41] to identify the hot spot and cold spot areas of the main tourism scenes. The formula is as follows:
where is the number of photos of a certain scene in tourist attraction j, is the spatial weight between tourist attraction i and j, n is equal to the total number of tourist attractions, and:
The statistic returned for each tourist attraction is a z-score [41]. For positive , the larger the is, the more intense the clustering of high values (hot spot). For negative , the smaller the is, the more intense the clustering of low values (cold spot).
3.5. Analysis Method of the Temporal Variation
To quantify the temporal differences of tourism images in Jiangxi Province, the seasonal intensity index and seasonal variation index are introduced to explore the temporal distribution of various scenes. The seasonal intensity index is used to measure the concentration of tourism scenes in the time distribution. The formula is as follows:
The R in the formula (5) represents the seasonal intensity index of the scene calculated monthly. The larger the R is, the more significant the fluctuation during the low season and peak season will be, which indicates that the scene is more concentrated in the time distribution; the smaller the R value is, the smaller the difference between the low season and peak season will be, which indicates that the scene is more stable in the time distribution. is the proportion of the scene during the ith month in the total volume of the same scene during the whole year, and 12 in the formula (5) represents 12 months in one year, and 8.33 is equivalent to 100/12.
The seasonal variation index is an average that can be used to compare an actual observation relative to what it would be if there were no seasonal variation. This paper uses it to measure the peak season and low season of a scene, so as to compare the tourism image of different seasons. The formula is as follows:
In formula (6), is the seasonal variation index in the ith month, is the average number of a scene in the ith month for many years, i=1, 2, 3…12; is the average value of the same scene in all months. reflects the monthly average change of the tourism scene. If the value of is higher, it indicates that the month is the peak season of the tourism scene.
4. Results
This chapter introduces the main results we got. In the first part, we introduce the main tourism scenes and the main tourism LDA topics composed of tourism scenes in Jiangxi. In the second part, the spatial distribution characteristics of the tourism image are introduced. The third part introduces the temporal distribution characteristics of the tourism image.
4.1. Overall Image
4.1.1. Classification Results of Tourism Scenes
First of all, the research team conducted scene detection on 53,1629 photos uploaded by tourists in all tourist attractions to identify the most likely scene tags. These photos represent 344 scenes out of 365 scenes in places365. The 20 scenes with a proportion of 1% or above among 344 scenes are shown in Figure 4 and the sum of the number of appearances of these scenes accounts for 40.69% of the total. Therefore, it was assumed that these scenes can represent the main image of tourist destinations in Jiangxi Province.
4.1.2. Distribution of LDA Topics
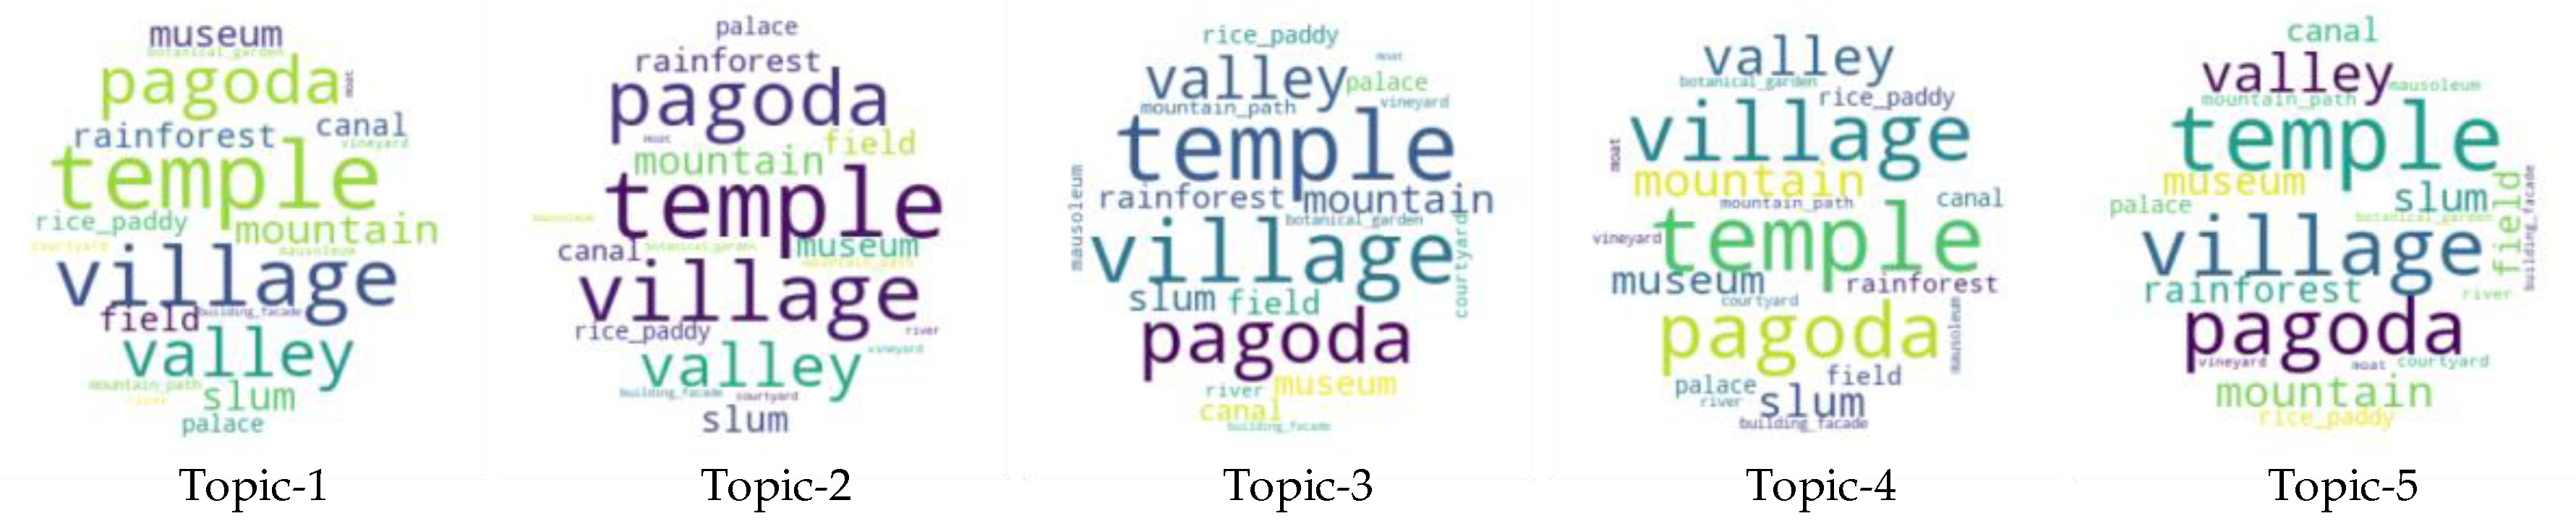
The results of the LDA modeling include the theme distribution of attractions and the scene distribution of describing themes. The scene distribution of topics reveals what themes can be reflected by different scene co-occurrence patterns. Figure 5 shows the scene distribution of the five LDA topics. The probability of appearances of temple, village, pagoda, mountain, and valley in each topic is very high; however, it was challenging to distinguish the relationship between the scene and the topic. Due to the fact that these scenes are common in Jiangxi, they may exist in all topics. Therefore, it is not very accurate to understand the topic structure through the probability of the scene.
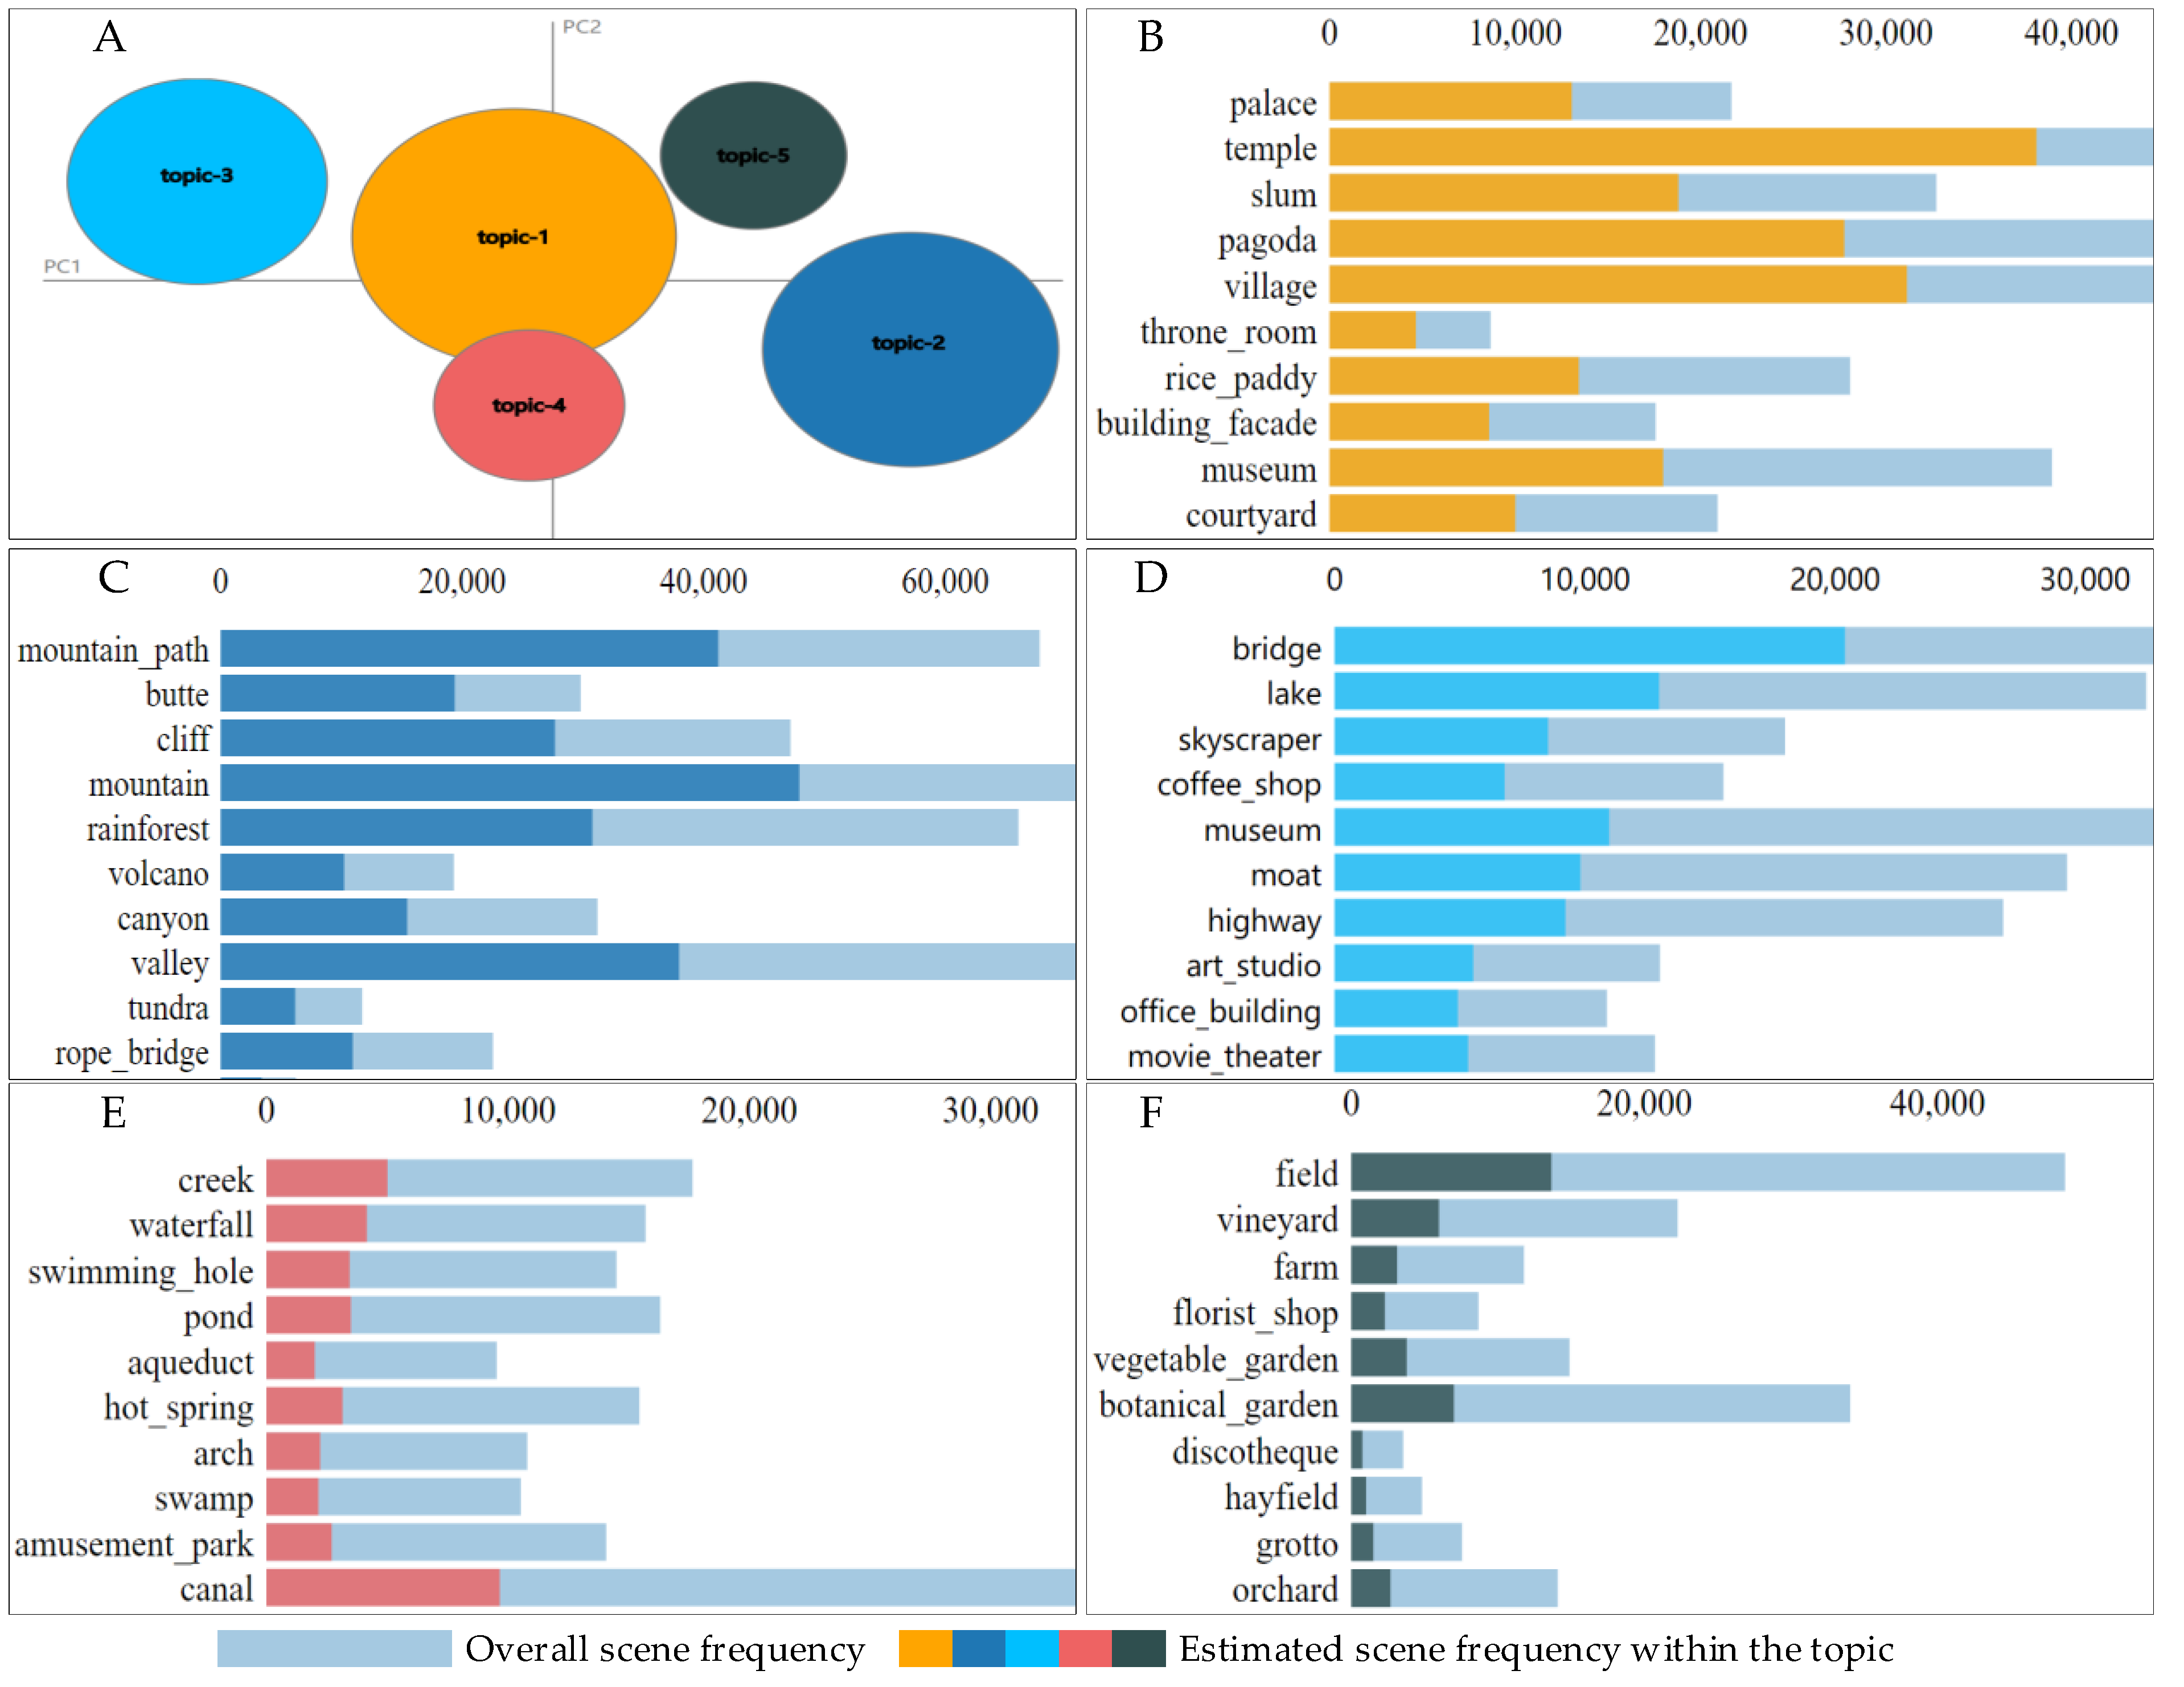
Figure 6A presents the five most important themes extracted from scenes of 531,629 UGC photos at 2540 attractions. Topic 1 is the most popular topic, with a probability of 0.318. The probabilities of topic 2, topic 3, topic 4, and topic 5 are 0.264, 0.203, 0.11, and 0.105, respectively. Since LDA is an unsupervised clustering method, the semantics of the generated categories need to be identified manually. According to the co-occurrence characteristics of relevant tourism scenes, we define the five LDA topics as the image of real architecture and village, the image of mountain, the image of urban tourism, the image of water, and the image of rural tourism, which are described in detail in Table 1.
4.2. Spatial Distribution Characteristics of Tourism Image
4.2.1. Spatial Distribution of LDA Topics
Figure 7 shows the spatial distribution of LDA topics at the county level. Topic 1 (ritual architecture and village) is the most widely distributed. Almost all counties have tourist attractions related to this topic in Jiangxi Province, and many counties have many such attractions. Jiangxi has a profound cultural background, and many ancient buildings and villages have been preserved, which has become a major feature of Jiangxi tourism. In addition, topic 3 (urban tourism) and topic 5 (rural tourism) are widely distributed, but there are not many prominent counties. Among them, Nanchang and Ganzhou are the prominent areas of urban tourism. Since Nanchang is the provincial capital and Ganzhou is the provincial sub-central city, their urbanization process is relatively fast. Wuyuan has the most scenic spots related to rural tourism. Wuyuan has become a well-known town in the world features in famous Huizhou local culture as well as charming idyllic scenery, known as the most beautiful village in China. Topic 2 (mountain) and topic 4 (water) are natural scenery tourism, and the distribution of related tourism attractions is closely related to the distribution of mountains and water systems in Jiangxi.
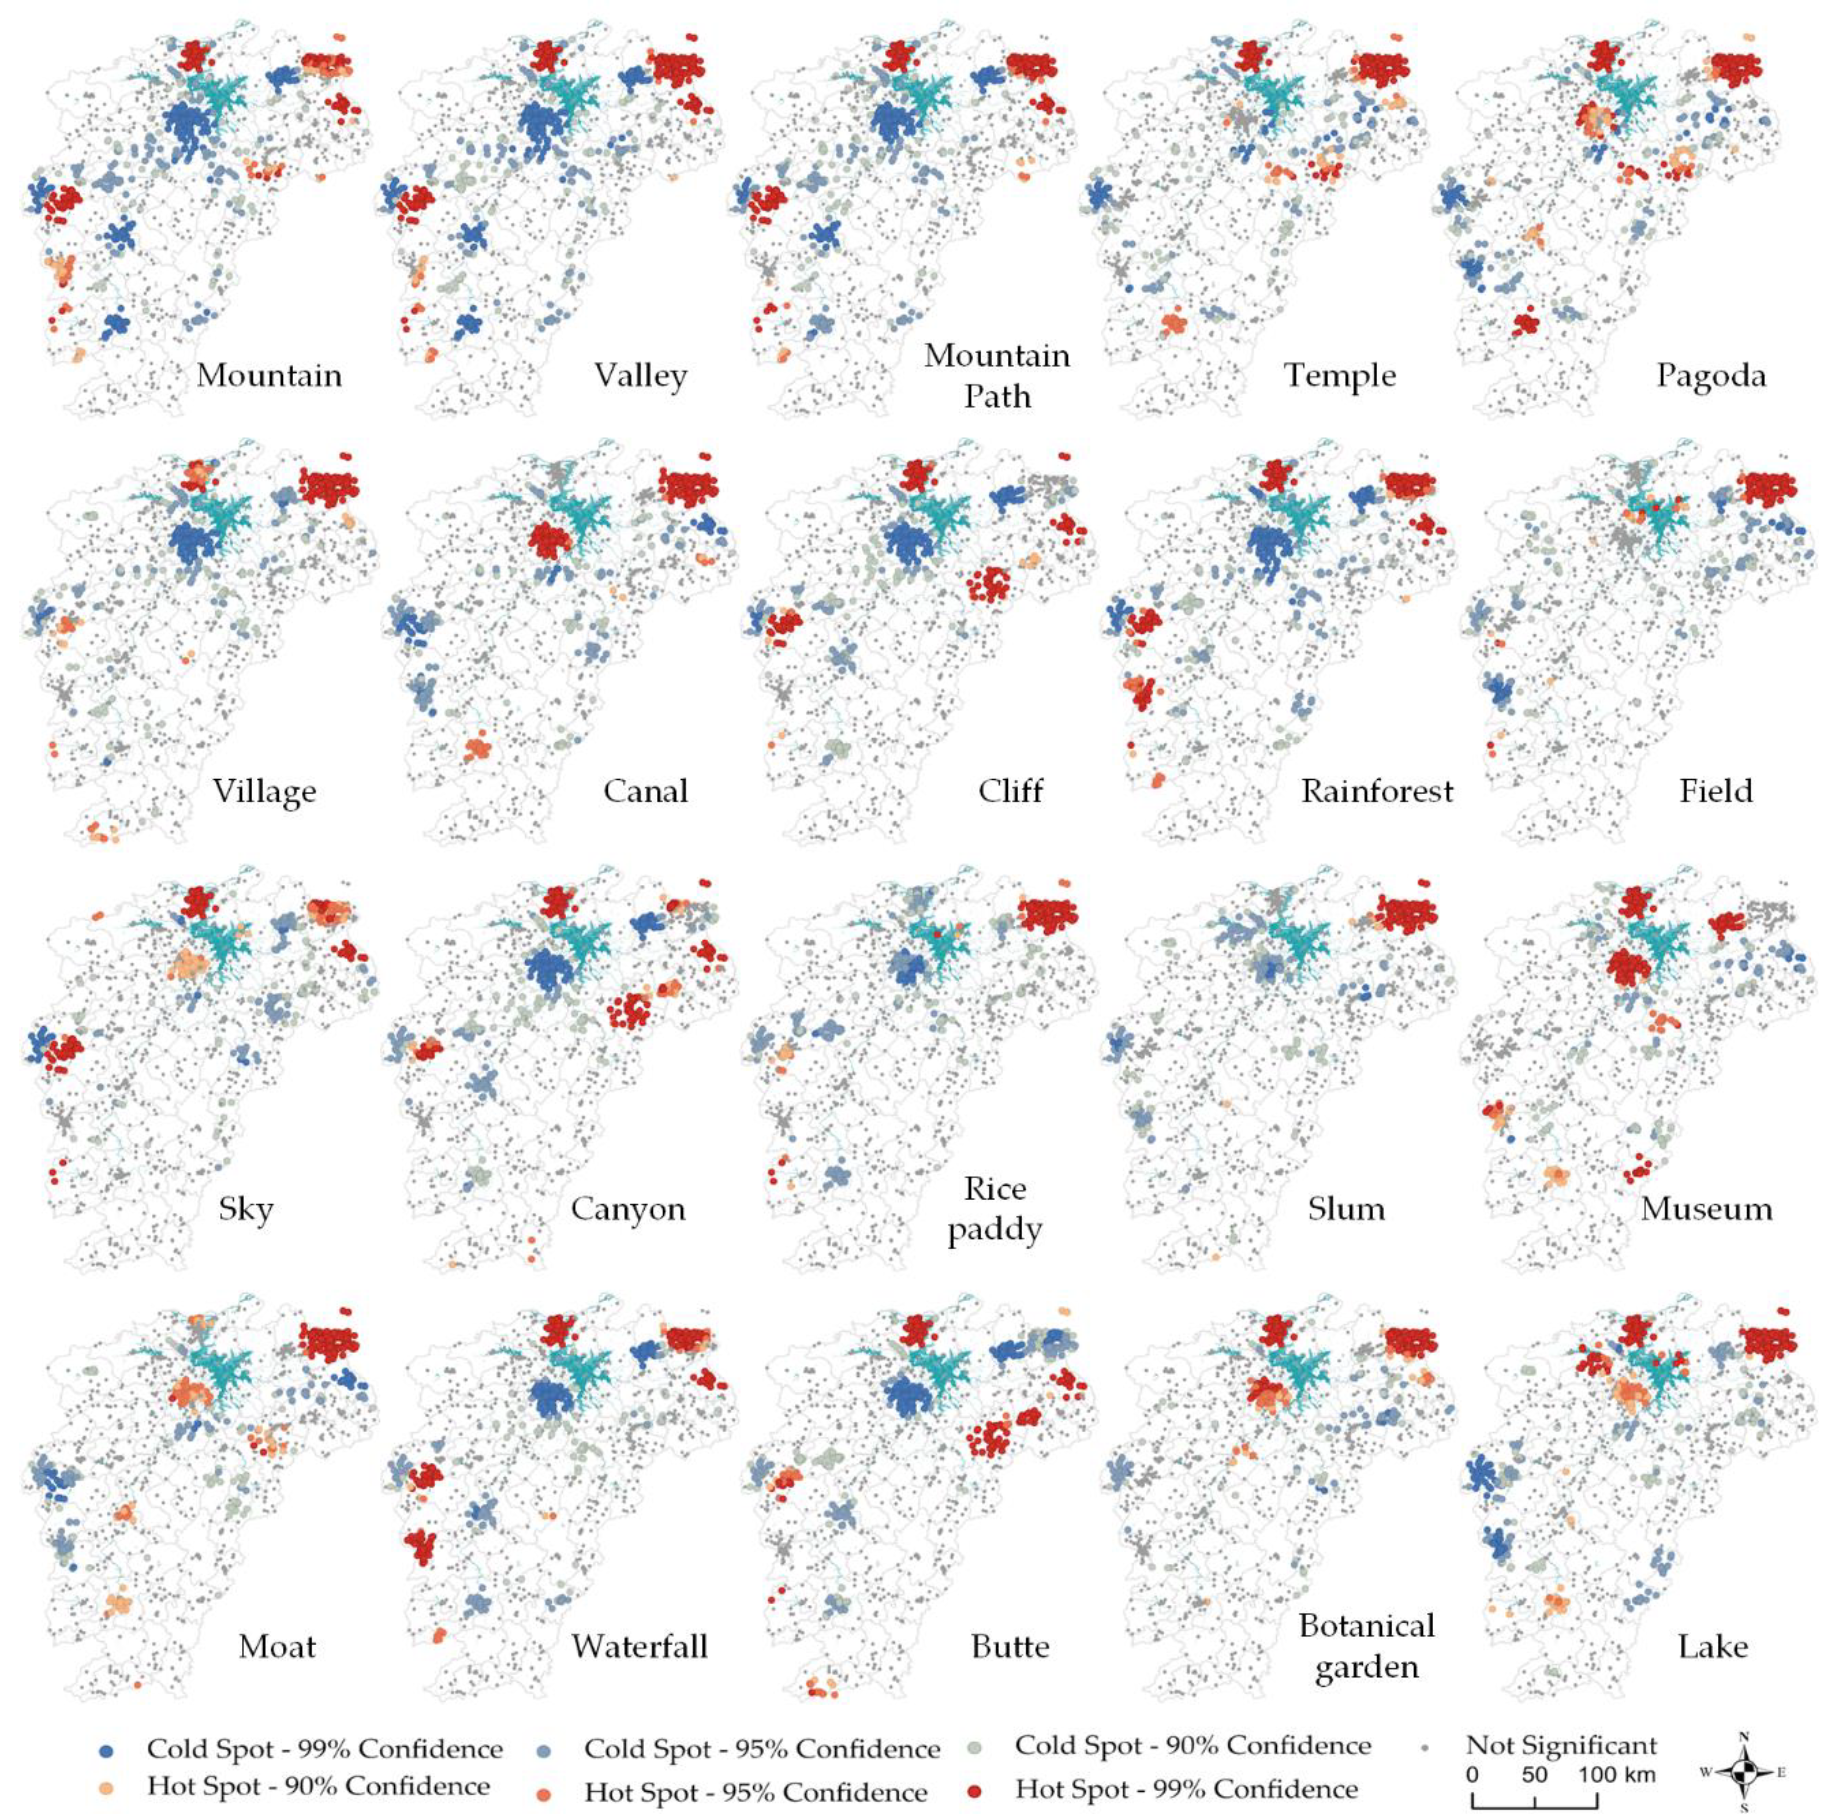
4.2.2. Results of Hot Spot Analysis
We use the spatial statistics toolbox of ArcGIS Pro software (https://www.esri.com/en-us/arcgis/products/arcgis-pro/overview) to calculate Gi* statistics, which can automatically calculate statistical significance and divide it into four confidence intervals: 99%, 95%, 90%, and no significance. From the overall observation of Figure 8, it can be highlighted that the cold and hot spots of different tourism scenes spatially have a certain degree of consistency. The hot spots of the mountain scene are distributed in the northeast and southwest of Jiangxi. The five most famous mountains in Jiangxi (Lu Mountain, Jinggang Mountain, Wugong Mountain, Sanqing Mountain, Longhu Mountain) are in these areas. The spatial distribution of cold and hot spots in Cliff, butte, valley, mountain path rainforest, and waterfall is similar to the spatial distribution in the mountains. This shows the image of the mountain scenic spot in Jiangxi that has diverse shapes of the mountains, including steep cliffs and towering butte. There are forests in the mountains, paths in the forests, and waterfalls along the paths.
These famous mountains are not exactly the same but also have unique tourism scenes. The hot spots of the sky and the mountains overlap, and the most prominent areas are Lu Mountain, Sanqing Mountain, and Wugong Mountain, which shows that they are the best destinations to watch the sunrise and sunset. In addition, the temple of Longhu Mountain and Sanqing Mountain is very prominent, while Jinggang Mountain is not, in which the museum is an important scene. The main reason is that Sanqing Mountain and Longhu Mountain are closely related to Taoism; especially, Longhu Mountain is considered to be the birthplace of Taoism. So, there are many temples related to Taoism. Jinggang Mountain is known as the cradle of the Chinese revolution, where many museums were set up for revolutionary martyrs and wars. Similarly, Ruijin, known as the Cradle of the Republic, located in southeast Jiangxi, is also a hot spot in the museum tourism scene.
The hot spot distribution map of the village scene shows that there is no doubt that Wuyuan is the most obvious rural tourism destination. Combining the hot distribution maps of a slum, field, and rice paddy scenes, it can be inferred that scenes, such as ancient villages and rice fields, are the characteristics of Wuyuan. From the overall point of view, Wuyuan is almost a hot spot for all tourist scenes. This shows that Wuyuan is a destination with extremely rich tourism resources.
Compared to the natural scenery and rural, the tourism scene in the city is relatively less in Jiangxi. Among the 20 major tourism scenes, only the hot spots of moat and pagoda are mainly distributed in cities. Ganjiang River, Fuhe River, Xinjiang River, Raohe River, and Xiuhe River are collectively referred to as the five major rivers in Jiangxi Province. The five major rivers flow through almost all the cities in Jiangxi Province, so rivers have become an important carrier of urban tourism. Pagoda is a common element of traditional culture in Jiangxi Province, which embodies people’s yearning for beauty. It is mostly architectural landmarks in various places.
4.3. Temporal Variation Characteristics of Tourism Image
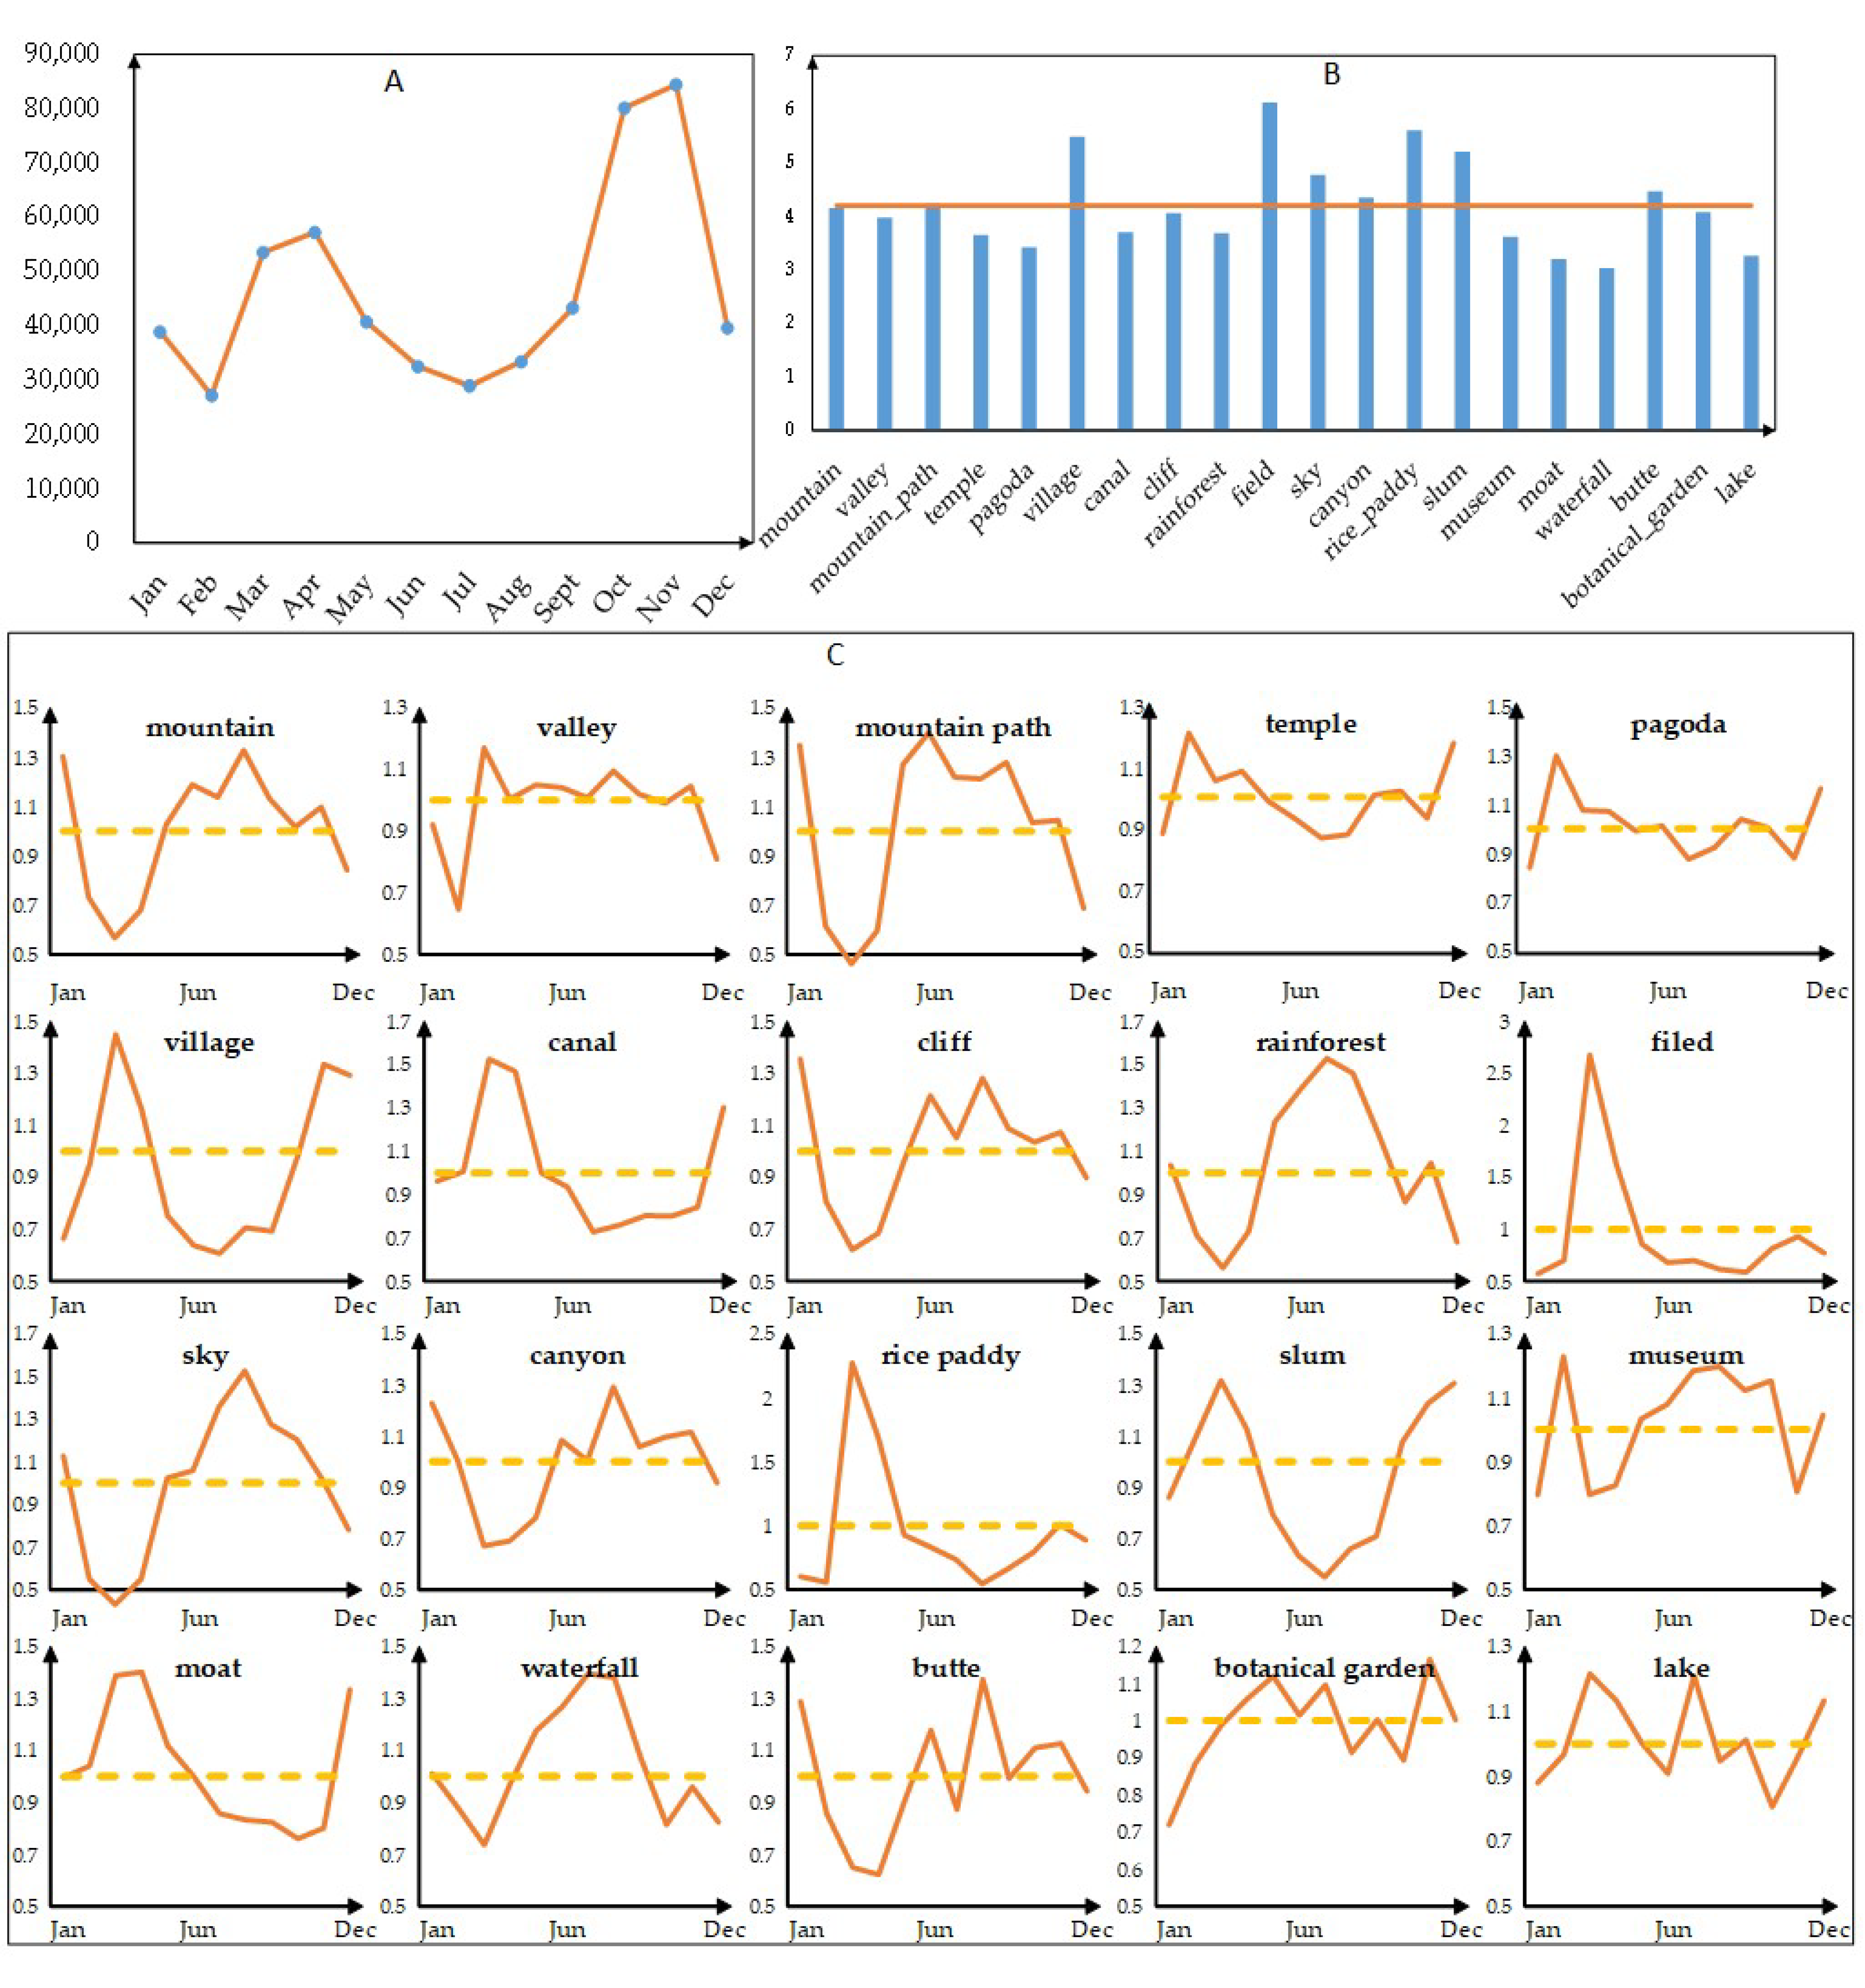
Figure 9A shows that the distribution of tourist travel time is uneven in the year. It can be clearly seen that the distribution of tourists’ photos shows a “double peak and double valley” pattern, with a large peak in April and November, and a small valley value in February and July. Affected by the climate and holidays, the tourism industry in Jiangxi Province shows obvious seasonality. Therefore, it is necessary to study the temporal changes in the tourism image.
Figure 9B shows the seasonal intensity index of 20 major tourism scenes and the mean value of all tourism scenes. It can be seen that the seasonal intensity index of rural image-related scenes, such as village, field, rice paddy, and slum, is relatively large, which indicates that the rural tourism image of Jiangxi Province has a large range of changes throughout the year, with significant seasonal differences, with an obvious peak season and off-season, showing the characteristics of imbalance in the time distribution. Combining Figure 9C, it becomes obvious that the seasonal variation index of scenes is related to rural image fluctuation significantly, showing a "peak-like" distribution. Overall, the peak appears in March, indicating that March is the most frequent month for tourists to visit the countryside. Since the proportion of mountain image-related scenes is the highest among all the scenes, it can be assumed that the seasonal intensity index of these scenes is close to the average value of all scenes. Opposite to the rural image, the mountain image presents the "valley like" distribution characteristics, and the valley value appears in March. The seasonal variation index of mountain image-related scenes was the highest from July to August. Moreover, the temporal change trend of the rain forest and sky scene is very similar to the mountain image, which shows that there is a great relationship between the two and the mountain image. The seasonal intensity index of water image-related scenes is relatively small, and the fluctuation is relatively small with the change of seasons. The seasonal variation index of canyon and waterfall is similar to that of the mountain image, while canal and moat are similar to the rural image. The seasonal intensity index of scenes related to the ritual architecture image and museum is significantly lower than the mean value. As the tourism scenes are not affected by the seasonal climate, the seasonal variation index is between 0.9 and 1.3, which is not obvious in the low season and peak season.
5. Discussion
The result of content analysis on Jiangxi’s tourism photo reveals the spatial and temporal heterogeneity of different scenic spots. It helps to understand the tourism image for different scenic spots in Jiangxi Province, and thereby reveals the natural characteristics and cultural heritage of the scenic spot, which are meaningful for promoting tourism marketing and enhancing destination attractiveness. The main discussion points are as follows.
(1) There are rich and distinctive tourism resources in Jiangxi Province. Because of its unique geographical location and humanistic environment, mountain scenery, ritual architecture, and rural countryside are the most popular tourist images, which are far more concerned than other images, and are the core attraction of Jiangxi tourism. However, the image of Jiangxi’s urban tourism is not obvious, and there is no particularly eye-catching urban tourism scene.
(2) The tourism image of Jiangxi shows obvious spatial heterogeneity. Overall, different counties have a different emphasis on the topic of tourism. Ritual architecture and village, urban, and rural images are widely distributed, but there are many popular counties with the topic of ritual buildings and village, while there are few popular counties with the topic of urban and the topic of rural. The scenic spots related to the topic of mountains are located around Jiangxi Province, and those related to the topic of water are distributed in the counties where the five major rivers pass, which is influenced by the geographical environment. In addition, the spatial distribution of scenic spots with the same topic is also different. For example, from the point of view of topography and geology, mountains in different places have different appearances, and different historical human settlements make mountains in different places have unique cultural tourism scenes.
(3) There are significant seasonal differences in many tourist scenes in Jiangxi, with an obvious peak and off-season like fields in spring and mountains in summer. Seasonal tourism scenes should be the focus of tourism marketing in each season. Although historical architectural scenes, such as palaces and temples, are less affected by seasonal changes, these scenes have attracted more attention from tourists almost throughout the year and can become auxiliary elements of tourism marketing in each season.
Based on the above analysis of the tourism image of Jiangxi, we make two suggestions for the DMOs. On the one hand, it is necessary to maintain the characteristics of the scenic spot and take advantage of the advantages of different seasons. Each season has its natural beauty and cultural characteristics. Therefore, the scenic area should fully explore the tourism characteristics of different seasons. On the other hand, it is necessary to give full play to geographical advantages, link surrounding scenic spots, and promote diversified tourism. Scenic spots can complement each other’s resources, integrate each other’s advantageous resources, and jointly develop the market to create a win-win situation.
This study not only studied the tourism image of different scenic spots in Jiangxi Province based on visual content analysis technology but also provides a new big data-based methodological framework for the comprehensive perception of tourism image. The technical innovations are as follows. Compared with the 103 scenes in study [28], the scene classification technology used in this article can classify more travel scenes. Meanwhile, the LDA topic clustering technology was applied to process tourism scenes of photos to discover the classification of tourism in Jiangxi Province. In particular, the same type of study [3,16,17] often ignores the spatial and temporal characteristics of the tourism image. To fill this gap, hot spot analysis and the tourism season index were adopted in our framework.
6. Conclusions and Future Work
The tourism image is the core element that characterizes destination characteristics. In this study, we proposed a data-driven framework for tourism destination image characterization with the support of UGC photographs data. First, Places365-CNN, an image recognition method based on CNN, was used to extract and quantify scenes of the tourism destination from traveler photographs. On this basis, LDA, a text analysis method, innovatively was used to mine the visual topics of tourist attractions. We found that the tourist attractions in Jiangxi Province can be clustered into five topics: ritual architecture and village, mountain, urban, water, and rural. Then, this study specifically focused on the temporal and spatial characteristics of tourism images and found that both are significantly heterogeneous. From the spatial dimension, the diversity of topography and regional culture is an important factor affecting the spatial pattern of tourism image. From the temporal dimension, this study compared the intensity of seasonal variation of tourism scenes, and found the off-season and peak season. On the whole, we developed a big data analytic profile for Jiangxi’s tourism image based on travel photos.
It must be acknowledged that research based on big data has limitations. For example, users of social media, such as Mafengwo.com, are generally young people. Therefore, using these data may ignore some social groups, such as children, the elderly, the poor, and foreign tourists [11]. However, compared to the traditional survey method, such as visitor-employed photography, more travel photos from SNS can be obtained in a fast and low-cost way. As for the Jiangxi case, 531,629 travel photos were used. It is quite challenging to gather photos from so many users by traditional methods.
In the future, we plan to explore the tourism image of Jiangxi from more perspectives. Currently, only the physical travel scenes were extracted from photos to represent travel images. It is expected to combine with a new classification algorithm [42] to evaluate the beauty of tourism scenes in photos. In this way, the emotional image can be perceived. For instance, the beauty of a scenic spot in different seasons can be compared, as the peak season of passenger flow does not represent the peak season of beauty. Additionally, the beauty of different scenic spots with the same tourist scene can be compared. On the other hand, the information mined from the text content from SNS can be combined to understand a more comprehensive tourism image of Jiangxi, and the difference between visual images and semantic images can also be compared [15].
Author Contributions
Conceptualization, Hui Lin; Formal analysis, Xin Xiao; Methodology, Xin Xiao; Project administration, Chaoyang Fang; Software, Xin Xiao; Visualization, Xin Xiao; Writing—original draft, Xin Xiao; Writing—review and editing, Chaoyang Fang and Hui Lin. All authors have read and agreed to the published version of the manuscript.
Funding
This research was funded by the National Natural Science Foundation of China under Grant 41671378.
Acknowledgments
Thanks to Fan Zhang of MIT Senseable City Lab and Sergeeva Kseniia of Jiangxi Normal University for helping improve the paper. And the authors would like to acknowledge all of reviewers and editors.
Conflicts of Interest
The authors declare no conflict of interest.
Appendix A
Figure A1.
Topographic map of Jiangxi Province and distribution of main tourist attractions.

References
- Crompton, J.L. An Assessment of the Image of Mexico as a Vacation Destination and the Influence of Geographical Location upon That Image. J. Travel Res. 1979, 17, 18–23. [Google Scholar] [CrossRef]
- Li, J.; Xu, L.; Tang, L.; Wang, S.; Li, L. Big data in tourism research: A literature review. Tour. Manag. 2018, 68, 301–323. [Google Scholar] [CrossRef]
- Kim, H.; Stepchenkova, S. Effect of tourist photographs on attitudes towards destination: Manifest and latent content. Tour. Manag. 2015, 49, 29–41. [Google Scholar] [CrossRef]
- Gu, Z.; Zhang, Y.; Chen, Y.; Chang, X. Analysis of Attraction Features of Tourism Destinations in a Mega-City Based on Check-in Data Mining—A Case Study of Shenzhen, China. ISPRS Int. J. Geo-Inf. 2016, 5, 210. [Google Scholar] [CrossRef] [Green Version]
- Jin, C.; Cheng, J.; Xu, J. Using User-Generated Content to Explore the Temporal Heterogeneity in Tourist Mobility. J. Travel Res. 2017, 57, 779–791. [Google Scholar] [CrossRef]
- Liu, L.; Zhou, B.; Zhao, J.; Ryan, B.D. C-IMAGE: City cognitive mapping through geo-tagged photos. GeoJournal 2016, 81, 817–861. [Google Scholar] [CrossRef] [Green Version]
- Zhou, B.; Lapedriza, A.; Khosla, A.; Oliva, A.; Torralba, A. Places: A 10 Million Image Database for Scene Recognition. IEEE Trans. Pattern Anal. Mach. Intell. 2018, 40, 1452–1464. [Google Scholar] [CrossRef] [Green Version]
- Bae, S.H.; Yun, H.J. Spatiotemporal Distribution of Visitors’ Geotagged Landscape Photos in Rural Areas. Tour. Plan. Dev. 2017, 14, 167–180. [Google Scholar] [CrossRef]
- Hunt, J.D. Image as a Factor in Tourism Development. J. Travel Res. 1975, 13, 1–7. [Google Scholar] [CrossRef]
- Guo, Y.; Barnes, S.J.; Jia, Q. Mining meaning from online ratings and reviews: Tourist satisfaction analysis using latent dirichlet allocation. Tour. Manag. 2017, 59, 467–483. [Google Scholar] [CrossRef] [Green Version]
- Peng, X.; Bao, Y.; Huang, Z. Perceiving Beijing’s “City Image” Across Different Groups Based on Geotagged Social Media Data. IEEE Access 2020, 8, 93868–93881. [Google Scholar] [CrossRef]
- Chen, W.; Xu, Z.; Zheng, X.; Luo, Y. Geo-Tagged Photo Metadata Processing Method for Beijing Inbound Tourism Flow. ISPRS Int. J. Geo-Inf. 2019, 8, 556. [Google Scholar] [CrossRef] [Green Version]
- Spyrou, E.; Mylonas, P. Analyzing Flickr metadata to extract location-based information and semantically organize its photo content. Neurocomputing 2016, 172, 114–133. [Google Scholar] [CrossRef]
- Popescu, A.; Grefenstette, G. Deducing trip related information from flickr. In Proceedings of the 18th International Conference on World Wide Web, Madrid, Spain, 20–24 April 2009; pp. 1183–1184. [Google Scholar]
- Sheng, F.; Zhang, Y.; Shi, C.; Qiu, M.; Yao, S. Xi’an tourism destination image analysis via deep learning. J. Ambient Intell. Humaniz. Comput. 2020. [Google Scholar] [CrossRef]
- Kim, D.; Kang, Y.; Park, Y.; Kim, N.; Lee, J. Understanding tourists’ urban images with geotagged photos using convolutional neural networks. Spat. Inf. Res. 2020, 28, 241–255. [Google Scholar] [CrossRef] [Green Version]
- Stepchenkova, S.; Zhan, F. Visual destination images of Peru: Comparative content analysis of DMO and user-generated photography. Tour. Manag. 2013, 36, 590–601. [Google Scholar] [CrossRef]
- Taecharungroj, V.; Mathayomchan, B. The big picture of cities: Analysing Flickr photos of 222 cities worldwide. Cities 2020, 102, 102741. [Google Scholar] [CrossRef]
- Zhang, F.; Zhou, B.; Liu, L.; Liu, Y.; Fung, H.H.; Lin, H.; Ratti, C. Measuring human perceptions of a large-scale urban region using machine learning. Landsc. Urban Plan. 2018, 180, 148–160. [Google Scholar] [CrossRef]
- Milman, A. Postcards as representation of a destination image: The case of Berlin. J. Vacat. Mark. 2012, 18, 157–170. [Google Scholar] [CrossRef]
- Milman, A. The Symbolic Role of Postcards in Representing a Destination Image: The Case of Alanya, Turkey. Int. J. Hosp. Tour. Adm. 2011, 12, 144–173. [Google Scholar] [CrossRef]
- Pan, S. The Role of TV Commercial Visuals in Forming Memorable and Impressive Destination Images. J. Travel Res. 2009, 50, 171–185. [Google Scholar] [CrossRef]
- Garrod, B.; Kosowska, A. Destination image consistency and dissonance: A content analysis of Goa’s destination image in brochures and guidebooks. Tour. Anal. 2012, 17, 167–180. [Google Scholar] [CrossRef]
- Garrod, B. Understanding the relationship between tourism destination imagery and tourist photography. J. Travel Res. 2009, 47, 346–358. [Google Scholar] [CrossRef]
- Fung, C.K.W.; Jim, C.Y. Unraveling Hong Kong Geopark experience with visitor-employed photography method. Appl. Geogr. 2015, 62, 301–313. [Google Scholar] [CrossRef]
- Hunter, W.C. China’s Chairman Mao: A visual analysis of Hunan Province online destination image. Tour. Manag. 2013, 34, 101–111. [Google Scholar] [CrossRef]
- Mak, A.H.N. Online destination image: Comparing national tourism organisation’s and tourists’ perspectives. Tour. Manag. 2017, 60, 280–297. [Google Scholar] [CrossRef]
- Zhang, K.; Chen, Y.; Li, C. Discovering the tourists’ behaviors and perceptions in a tourism destination by analyzing photos’ visual content with a computer deep learning model: The case of Beijing. Tour. Manag. 2019, 75, 595–608. [Google Scholar] [CrossRef]
- Deng, N.; Liu, J.; Dai, Y.; Li, H. Different cultures, different photos: A comparison of Shanghai’s pictorial destination image between East and West. Tour. Manag. Perspect. 2019, 30, 182–192. [Google Scholar] [CrossRef]
- Zhang, F.; Zu, J.; Hu, M.; Zhu, D.; Kang, Y.; Gao, S.; Zhang, Y.; Huang, Z. Uncovering inconspicuous places using social media check-ins and street view images. Comput. Environ. Urban Syst. 2020, 81, 101478. [Google Scholar] [CrossRef]
- Giglio, S.; Bertacchini, F.; Bilotta, E.; Pantano, P. Machine learning and points of interest: Typical tourist Italian cities. Curr. Issues Tour. 2020, 23, 1646–1658. [Google Scholar] [CrossRef]
- Chen, M.; Arribas-Bel, D.; Singleton, A. Quantifying the Characteristics of the Local Urban Environment through Geotagged Flickr Photographs and Image Recognition. ISPRS Int. J. Geo-Inf. 2020, 9, 264. [Google Scholar] [CrossRef] [Green Version]
- Deng, N.; Li, X. Feeling a destination through the “right” photos: A machine learning model for DMOs’ photo selection. Tour. Manag. 2018, 65, 267–278. [Google Scholar] [CrossRef]
- Krizhevsky, A.; Sutskever, I.; Hinton, G.E. Imagenet classification with deep convolutional neural networks. Commun. ACM 2017, 60, 84–90. [Google Scholar] [CrossRef]
- He, K.; Zhang, X.; Ren, S.; Sun, J. Deep residual learning for image recognition. In CVPR 2016, Proceedings of Proceedings of the IEEE Conference on Computer Vision and Pattern Recognition, Las Vegas, NV, USA, 26 June–1 July 2016; IEEE: New York, NY, USA, 2016; pp. 770–778. [Google Scholar]
- Huang, G.; Liu, Z.; Van Der Maaten, L.; Weinberger, K.Q. Densely connected convolutional networks. In CVPR 2017, Proceedings of the IEEE Conference on Computer Vision and Pattern Recognition, Honolulu, HI, USA, 21–26 July 2017; IEEE: New York, NY, USA, 2017; pp. 4700–4708. [Google Scholar]
- Zhou, B.; Khosla, A.; Lapedriza, A.; Oliva, A.; Torralba, A. Learning deep features for discriminative localization. In CVPR 2016, Proceedings of Proceedings of the IEEE Conference on Computer Vision and Pattern Recognition, Las Vegas, NV, USA, 26 June–1 July 2016; IEEE: New York, NY, USA, 2016; pp. 2921–2929. [Google Scholar]
- Blei, D.M.; Ng, A.Y.; Jordan, M.I. Latent dirichlet allocation. J. Mach. Learn. Res. 2003, 3, 993–1022. [Google Scholar]
- Sievert, C.; Shirley, K. LDAvis: A method for visualizing and interpreting topics. In Proceedings of the Workshop on Interactive Language Learning, Visualization, and Interfaces, Baltimore, MD, USA, 27 June 2014; Association for Computational Linguistics: Stroudsburg, PA, USA, 2014; pp. 63–70. [Google Scholar]
- Chang, J.; Gerrish, S.; Wang, C.; Boyd-Graber, J.L.; Blei, D.M. Reading tea leaves: How humans interpret topic models. Adv. Neural Inf. Process. Syst. 2009, 22, 288–296. [Google Scholar]
- Getis, A.; Ord, J. The analysis of spatial association by use of distance statistics, geographycal analysis. In Perspectives on Spatial Data Analysis; Springer: Berlin/Heidelberg, Germany, 1992. [Google Scholar]
- Talebi, H.; Milanfar, P. NIMA: Neural Image Assessment. IEEE Trans. Image Process. 2018, 27, 3998–4011. [Google Scholar] [CrossRef] [Green Version]
Figure 1.
The geographic location of Jiangxi Province and the spatial distribution of photo collection points (scenic spots). Figure A1 shows the topographic map of Jiangxi Province and the distribution of main tourist attractions.
Figure 1.
The geographic location of Jiangxi Province and the spatial distribution of photo collection points (scenic spots). Figure A1 shows the topographic map of Jiangxi Province and the distribution of main tourist attractions.

Figure 2.
(A) The DenseNet161 [36] model for detecting scenes in photos. The model can predict 365 real scenes. (B) Accuracy comparison of four convolutional neural network models. Top-N accuracy means that the model that gives N highest probability tourism scenes that must match the expected scene. (C) The class activation maps (CAMs) of the scene detection results.

Figure 3.
Each circle represents an Latent Dirichlet Allocation (LDA) topic, the area of the circle indicates the importance of each topic in the scene of the whole tourism attractions, and the distance between the centers of circles indicates the similarity between the topics.
Figure 3.
Each circle represents an Latent Dirichlet Allocation (LDA) topic, the area of the circle indicates the importance of each topic in the scene of the whole tourism attractions, and the distance between the centers of circles indicates the similarity between the topics.

Figure 4.
1% or higher proportion of tourism scenes.

Figure 5.
Word cloud diagram composed of scenes in five LDA topics. The larger the size, the higher the probability of the scene.
Figure 5.
Word cloud diagram composed of scenes in five LDA topics. The larger the size, the higher the probability of the scene.

Figure 6.
Five LDA topics of Jiangxi tourist attractions. (A) Distribution of the five topics. Each circle represents a topic, the area of the circle indicates the importance of each topic in the scene of the whole tourism attractions. (B) Top-10 most relevant scenes for topic 1. (C) Top-10 most relevant scenes for topic 2. (D) Top-10 most relevant scenes for topic 3. (E) Top-10 most relevant scenes for topic 4. (F) Top-10 most relevant scenes for topic 5.

Figure 7.
The spatial distribution of the LDA topic of tourism attractions in Jiangxi Province. (A) Distribution of the number of tourist attractions with five topics in each county. The larger the pie size, the more the total number. (B–F) For the spatial distribution map of a single topic, the lower the color, the less the number of scenic spots of the topic; otherwise, the more scenic spots of the topic.

Figure 8.
The spatial distribution map of hot and cold spots of the main tourism scenes. Red represents significant spatial clusters of high values of the scene, and the higher the confidence, the more likely these scenic spots are the hot spots of the scene. Blue represents significant spatial clusters of low value of the scene, and the higher the confidence, the more likely these scenic spots are the cold spots of the scene.

Figure 9.
(A) Monthly changes in the quantity of photos uploaded by tourists. (B) The seasonal intensity index of the main tourism scenes. The orange line represents the average value of all scenes, which is 4.20. (C) The seasonal variation index of the main tourism scenes.
Figure 9.
(A) Monthly changes in the quantity of photos uploaded by tourists. (B) The seasonal intensity index of the main tourism scenes. The orange line represents the average value of all scenes, which is 4.20. (C) The seasonal variation index of the main tourism scenes.


Table 1.
Introduction to five LDA topics.
| Topic Name | Relevant Tourism Scenes | Description |
|---|---|---|
| Image of Ritual Architecture and Village | Palace, temple, slum, pagoda, village, museum, etc. | Jiangxi not only has a prosperous Confucian culture, Taoism and Buddhism also occupy an important position in China. Therefore, there are many religious resorts represented by ritual architectural scenes such as temples, pagodas, and palaces. With the change of dynasties, some ritual buildings were destroyed and turned into ruins and now look like slums. Some of them were well preserved and transformed into museums. In addition, Figure 6B also shows that villages are also closely related to this topic. |
| Image of Mountain | Mountain path, butte, cliff, mountain, volcano, valley, tundra, etc. | There is an ancient Chinese poem, “One gets different impressions of a mountain when viewing it from different positions”, which is used to describe the varied posture of Lushan mountain in Jiangxi province. Figure 6C shows images of different shapes of mountains such as cliff, butte, volcano, canyon, valley, tundra, etc. Like this, we can get an idea of the different representative images of mountain that tourists have in mind when visiting Jiangxi. |
| Image of Urban Tourism | Bridge, lake, skyscraper, coffee shop, museum, moat, highway, etc. | From the scenes of a skyscraper, a coffee shop, a highway, and a movie theater in Figure 6D, it can be inferred that this topic is related to urban tourism, although these scenes are not significant in Figure 5. The reason why the bridge and lake scenes appear in this topic is that Jiangxi has a dense water network. The five major rivers, including Ganjiang, Fuhe, Xinjiang, Raohe, and Xiuhe, basically flow through all the cities in Jiangxi. These rivers play an important role in urban tourism. |
| Image of Water | Creek, waterfall, swimming hole, pond, hot spring, etc. | Water as a tourist resource is the basic element of landscape composition. Figure 6E shows that the image of water includes aqueducts and creeks in cities or villages, as well as ponds and waterfalls in the mountains. Therefore, swimming and hot springs are important tourism activities in Jiangxi. |
| Image of Rural Tourism | Field, vineyard, farm, vegetable garden, etc. | As a major agricultural province, Jiangxi has abundant rural tourism resources. In addition to visiting ancient buildings in the village, mentioned in topic 1, tourists mainly go to rural areas to eat farm meals, live in farmhouses, do farm work and enjoy farm activities. These scenes can be found in Figure 6F. |
Publisher’s Note: MDPI stays neutral with regard to jurisdictional claims in published maps and institutional affiliations. |
© 2020 by the authors. Licensee MDPI, Basel, Switzerland. This article is an open access article distributed under the terms and conditions of the Creative Commons Attribution (CC BY) license (http://creativecommons.org/licenses/by/4.0/).
Share and Cite
MDPI and ACS Style
Xiao, X.; Fang, C.; Lin, H. Characterizing Tourism Destination Image Using Photos’ Visual Content. ISPRS Int. J. Geo-Inf. 2020, 9, 730. https://doi.org/10.3390/ijgi9120730
AMA Style
Xiao X, Fang C, Lin H. Characterizing Tourism Destination Image Using Photos’ Visual Content. ISPRS International Journal of Geo-Information. 2020; 9(12):730. https://doi.org/10.3390/ijgi9120730
Chicago/Turabian StyleXiao, Xin, Chaoyang Fang, and Hui Lin. 2020. "Characterizing Tourism Destination Image Using Photos’ Visual Content" ISPRS International Journal of Geo-Information 9, no. 12: 730. https://doi.org/10.3390/ijgi9120730
Note that from the first issue of 2016, this journal uses article numbers instead of page numbers. See further details here.