1. Introduction
Currently, a wide range of geodetic procedures and methods to record the actual state of objects on the Earth surface is available [
1]. Photogrammetry is one of these methodologies, which is considered to be the art, science, and technology of acquiring geometric information related to physical objects through processes of recording, measuring, and interpreting photographs and patterns [
2]. These processes include automated interest-point detection [
3], Structure from Motion (SfM) algorithms [
4], and dense image-matching techniques [
5]. To improve and speed up photogrammetric processing, several commercial and open-source libraries and pieces of software have been developed [
6,
7]. Among the most used commercial software, Pix4Dmapper (Pix4D SA, Lausanne, Switzerland), Agisoft Metashape (Agisoft LLC, St. Petersburg, Russia), and DroneDeploy (DroneDeploy, San Francisco, CA, USA) stand out. Some examples of open-source software and libraries include MicMac [
6], VisualSFM [
8], Bundler [
9], Python Photogrammetry Toolbox [
10], and Open Drone Map [
11], which are based on SfM techniques [
12]. Despite the availability of several solutions for photogrammetric processing, the cost and the performance associated with each solution could be a deciding factor [
13]. Regarding the cost of commercial software, prices vary, DroneDeploy being the best option from an economic point of view. In contrast, open-source solutions are free and can be a feasible solution for several users. Despite the high costs associated with commercial software, it is important to consider that software providers make all of needed functionalities available off-the-shelf in a single software package, whereas free and open-source software (FOSS) usually offer a single category of functionalities [
14]. In this way, the development of a global and complete application involves the use of different open-source libraries, which has become a great challenge for developers [
15].
In the last decade, Internet access through devices (computers, smartphones, and tablets) has increased significantly [
16]. For this reason, many organizations are considering the Internet as the main platform for software solutions, creating software as a service (SaaS). This type of platform presents several advantages and it is worth highlighting its ability to maintain and update the applications without distributing and installing any software on client computers [
17].
Considering the commercial photogrammetric SaaS, Pix4D Cloud, DroneDeploy, and 4DMapper stand out. Some free photogrammetric web-interfaces (e.g., ARC 3D Webservice, MiaW, Culture 3D Cloud Platform, CMP SfM web service, 3DNOW) are available. However, there is a lack of open-source solutions that offer a complete and integrated solution for the processing and visualization of aerial imagery acquired from unmanned aerial vehicles (UAVs).
As a result, considering the aforementioned advantages, the aim of the proposed research is to present VisWebDrone (visual web platform for drone-based imagery analysis), a web application for UAV photogrammetry based on open-source technologies. The proposed solution will be maintained as a free and open-source platform, available on GitHub, relying on the users contribute. The web application is composed of several pieces of open-source software that are completely integrated, combining the data-processing stage with the graphical presentation of the results. The data-processing stage is performed using MicMac, while the graphical presentation of the results is provided by Leaflet and Potree. Several Graphical User Interface (GUI) solutions, integrating MicMac, have already been developed. Among the solutions developed, the CEREMA (
Centre d’études et d’expertise sur les risques, l’environnement, la mobilité et l’aménagemen) has released the
AperoDeDenis, a GUI for MicMac that is under development. Another GUI, the
InterfaceMicmac, developed by IGN (
Institut national de l’information géographique et forestière) was discontinued. Recently, Alessio Calantropio of Politecnico di Torino developed the
GEMINI (Graphically Enhanced MicMac’s New Interface) solution, which is focused on the quality assessment of the achieved results [
18]. Although all GUI solutions presented applied the abstracting command line provided by MicMac software, none of them has available graphical solutions for the manipulation and visualization of the achieved results, using photogrammetric processing (e.g., visualization of orthophoto mosaics and point clouds). VisWebDrone intends to fill this gap, providing the appropriate tools for this purpose.
Following this introductory section,
Section 2 describes the VisWebDrone structure and architecture, presenting the modules and software integrated into the web application.
Section 3 is dedicated to the demonstration of the implemented solutions presented in
Section 2. Then, to exemplify and test the web application functionalities, two study areas are presented in
Section 4. In
Section 5, the results are presented and discussed. Finally, in
Section 6 the conclusions of the present research are addressed.
2. System Architecture
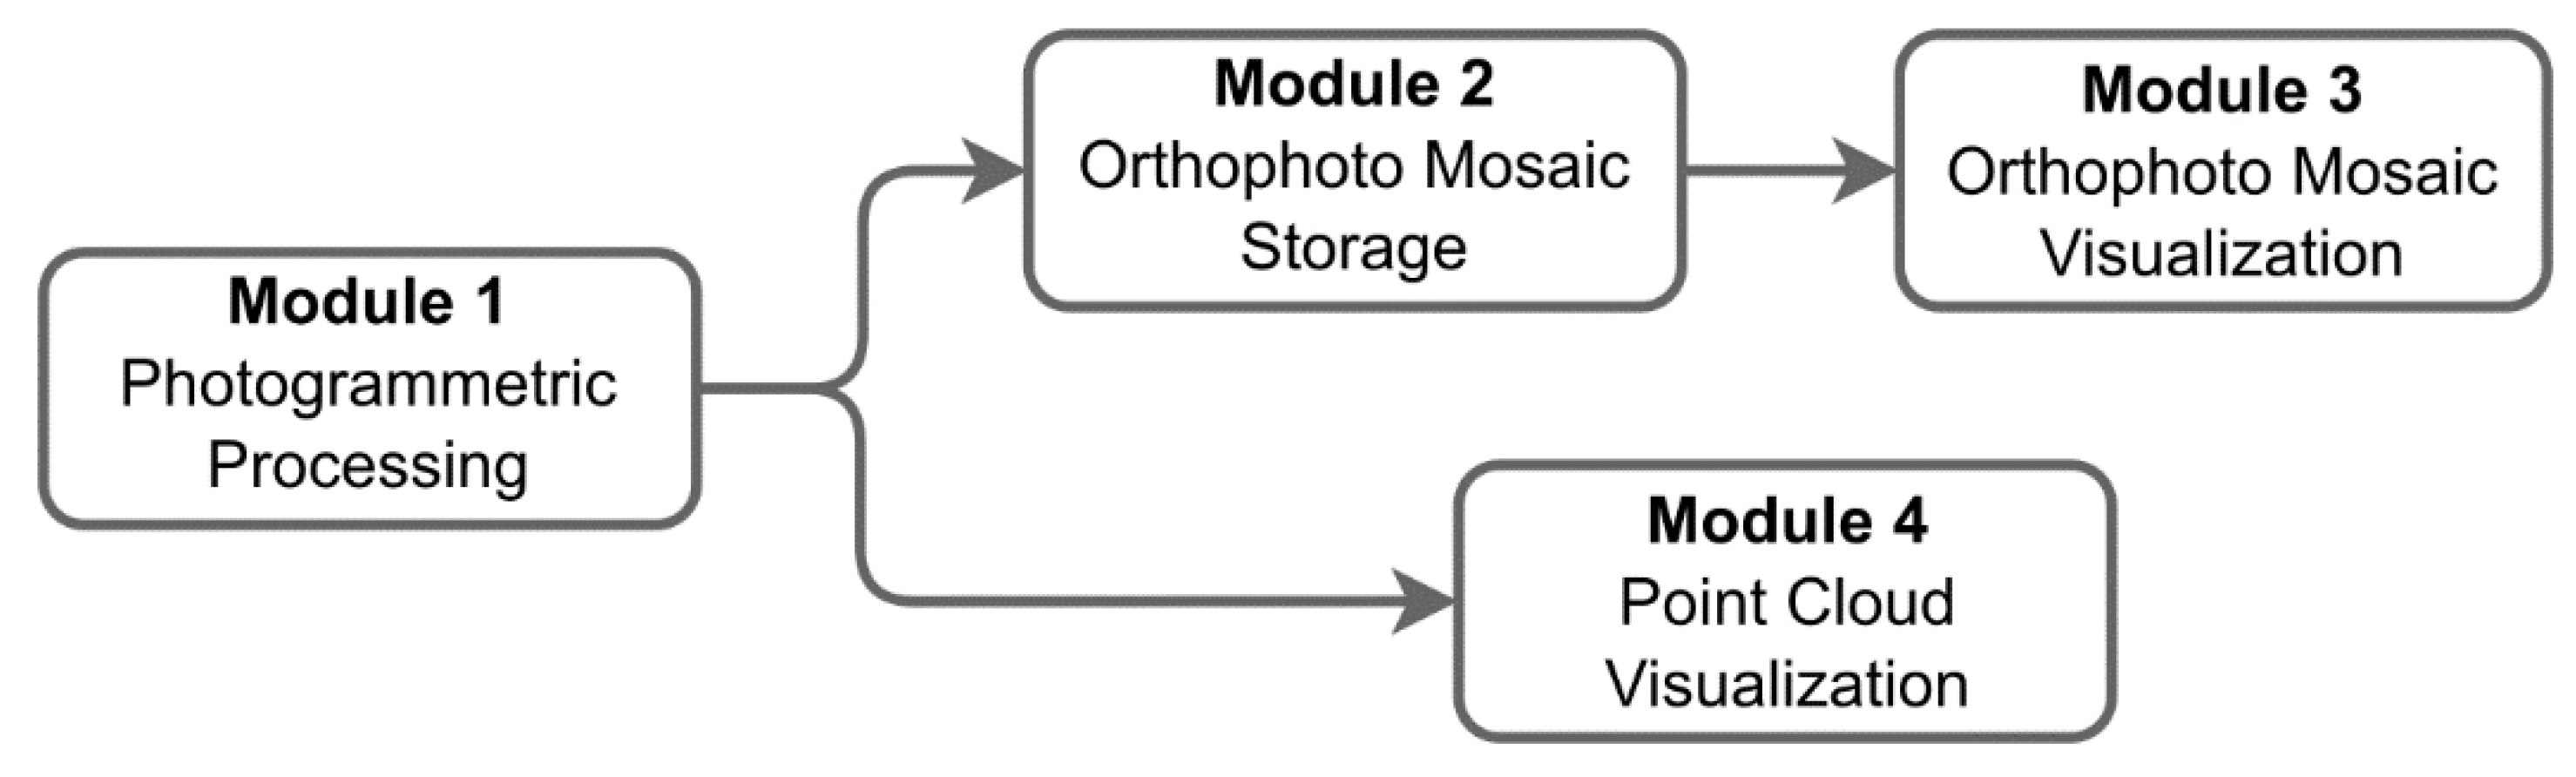
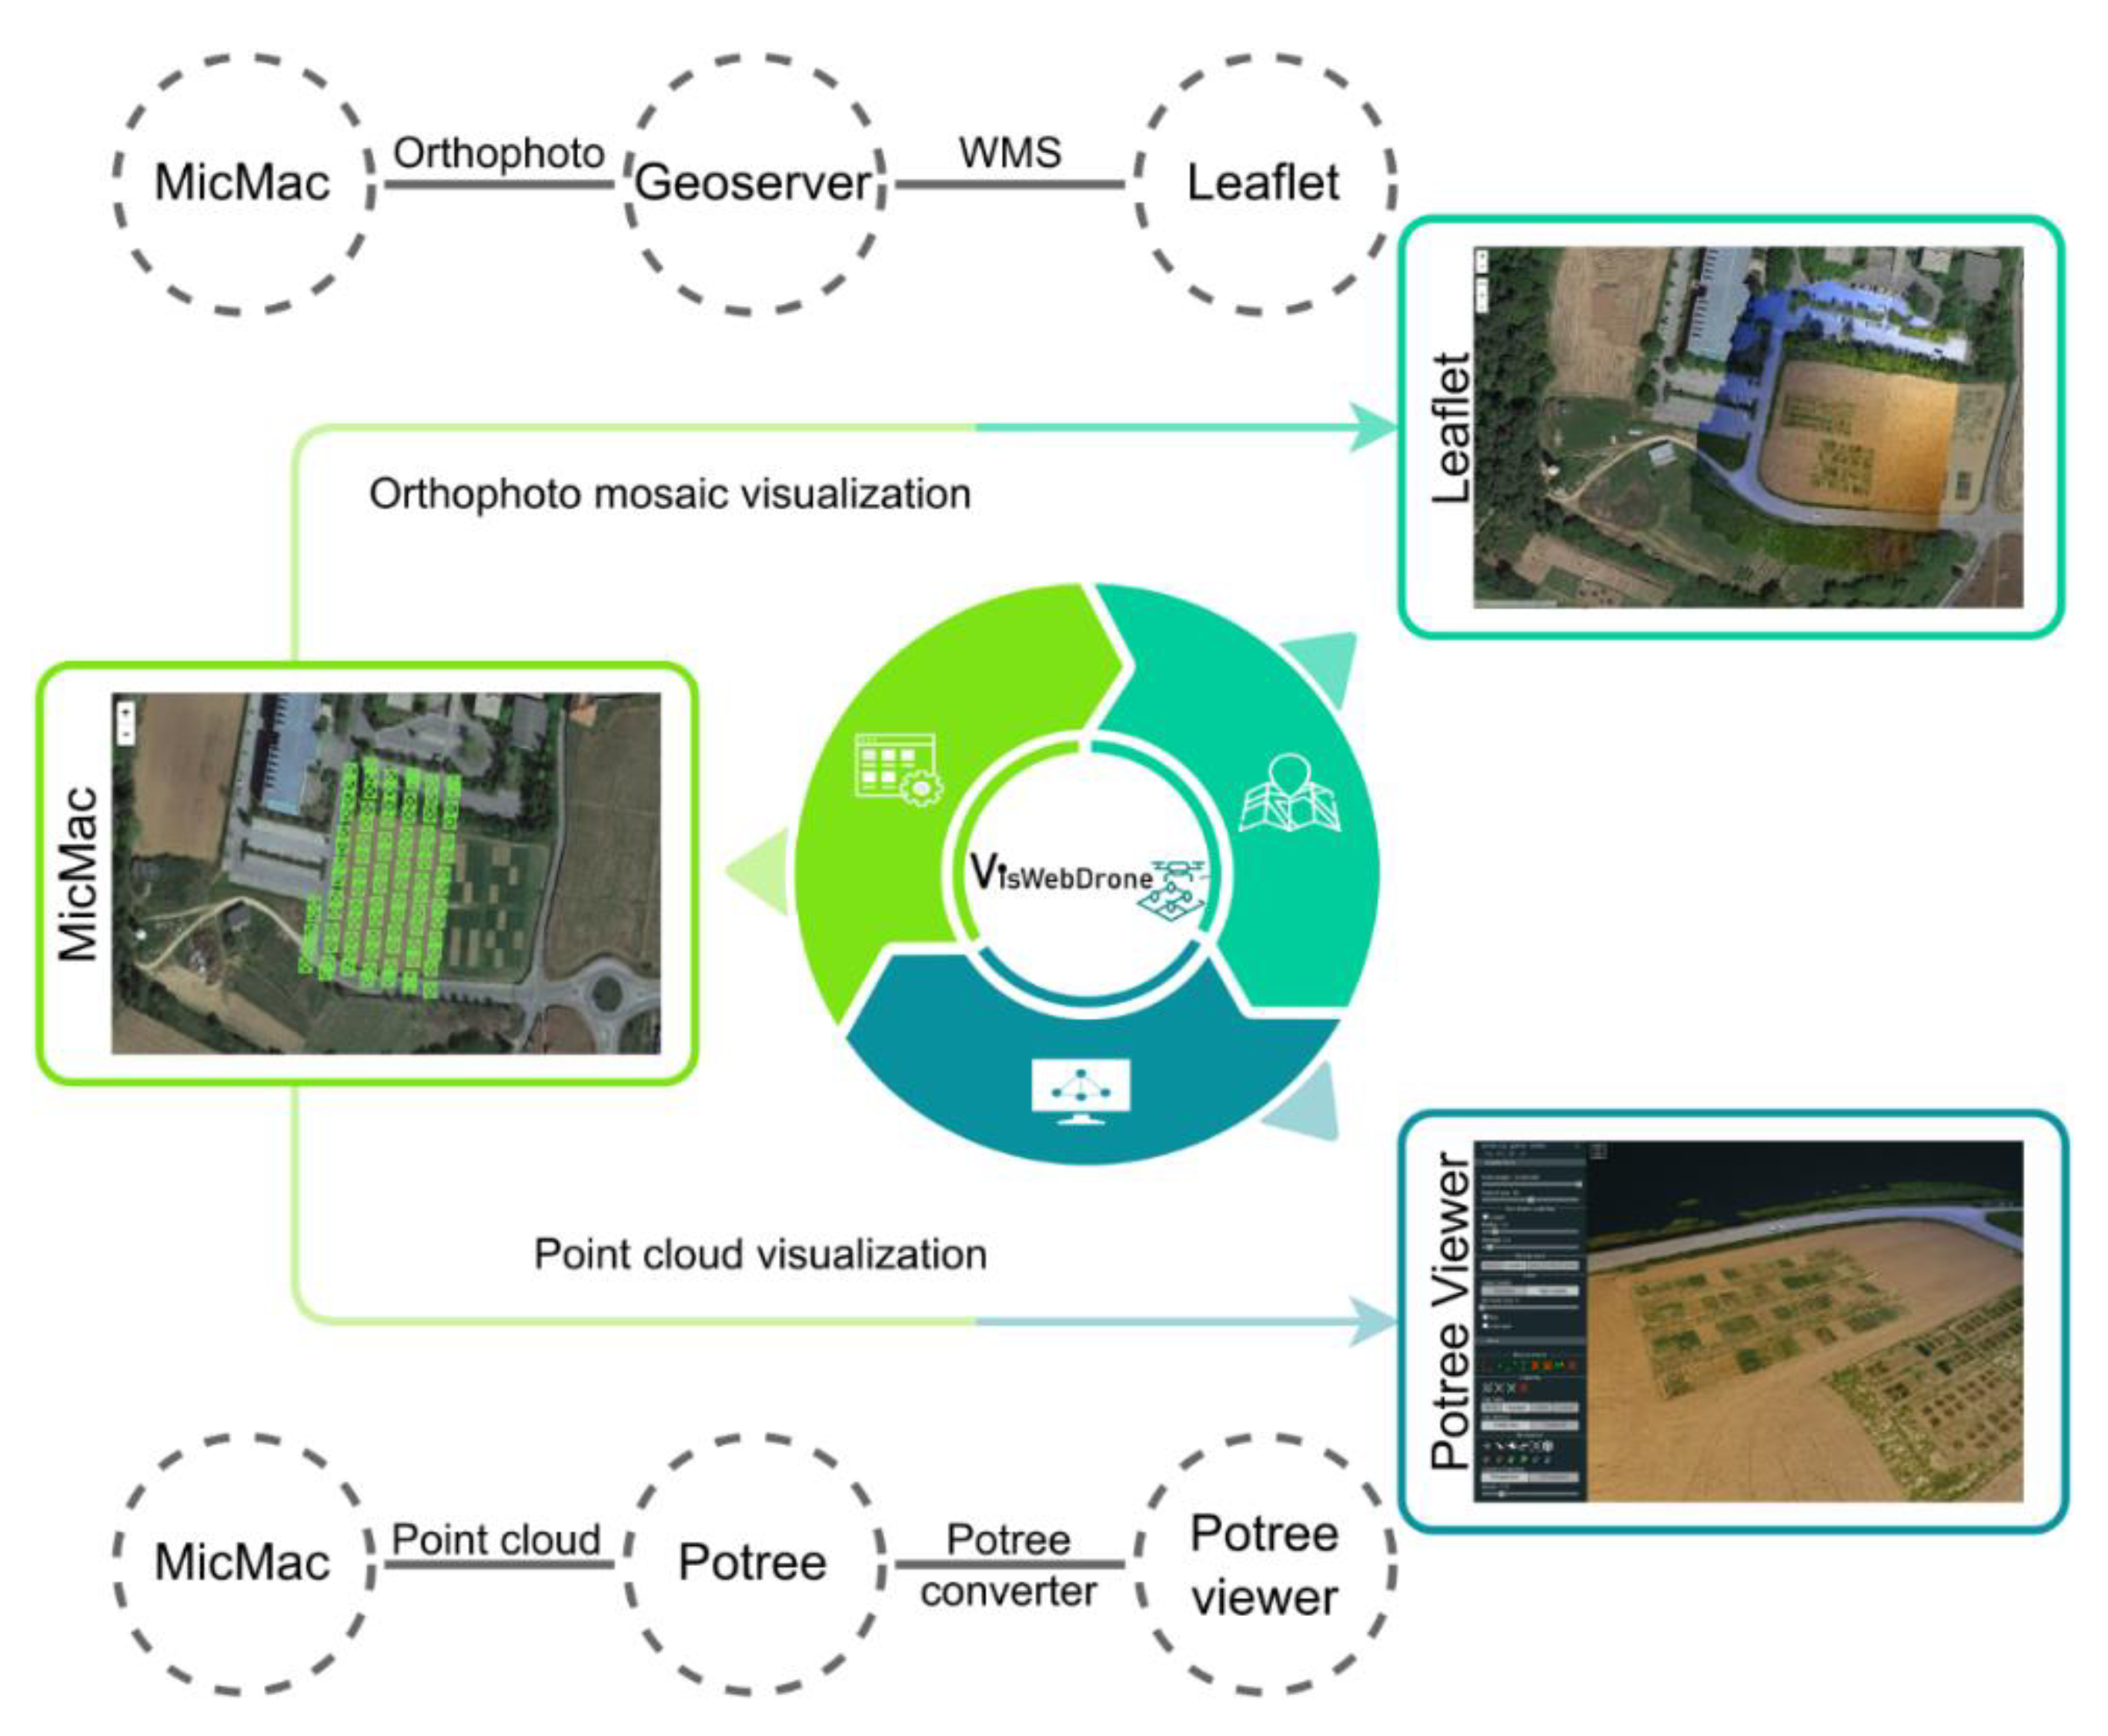
The conception of a web application for manipulation, analysis, and visualization of UAV-based imagery outputs requires four modules. Module 1 is responsible for the photogrammetric processing, receiving as inputs the images collected by UAVs and producing as outputs an orthophoto mosaic and a 3D dense point cloud. Next, Module 2 is used to store the orthophoto mosaic in a map server. This module receives as input the orthophoto, generated in Module 1, and makes available several web services for geographical data publishing. Module 3 is responsible for orthophoto mosaic visualization, using a Web Map Service (WMS) layer as input and produces a web-mapping page for orthophoto visualization as output. Finally, Module 4 deals with dense point cloud visualization and analysis. This module receives the point cloud data, provided by Module 1, and builds a webpage for its visualization.
Figure 1 presents the flowchart of the modules.
2.1. Module 1—Photogrammetric Processing
Among the different photogrammetric packages freely available, OpenDroneMap (ODM) and MicMac were considered the most suitable options for the development of the proposed web application. This choice is mainly because both integrate tools allowing the generation of orthophoto mosaics and point clouds, in the same pipeline.
ODM is a community-based open-source toolkit, developed for processing and analyzing aerial imagery acquired by UAVs. This command-line-based program runs on all major operating systems through the use of Docker container (Docker, Inc., Palo Alto, CA, USA) and is distributed under the GPLv3 license [
19].
MicMac is associated with the acronym “Multi Images Correspondances par Méthodes Automatiques de Corrélation—Multi Image Matches by Automatic Correlation Methods” and its development began in 2005, by the French National Institute of Geographic and Forestry Information (IGN) and the French National School of Geographic Sciences (ENSG) [
6]. MicMac is an open-source software distributed under the CeCILL-B license. Initially, it was provided as an Extensible Markup Language (XML) framework, allowing the processing parametrization to be defined by users. However, in 2010, the XML framework was discontinued, giving way to a simplified command-line interface that has been contributing to an increase of the use of this open-source software. MicMac is a versatile software, which can be used in different types of objects, from small objects acquired from the ground perspective to buildings acquired from an aerial perspective. Even imagery form regional areas, such as cities or natural places, acquired from manned aircraft or satellites, can be used [
20].
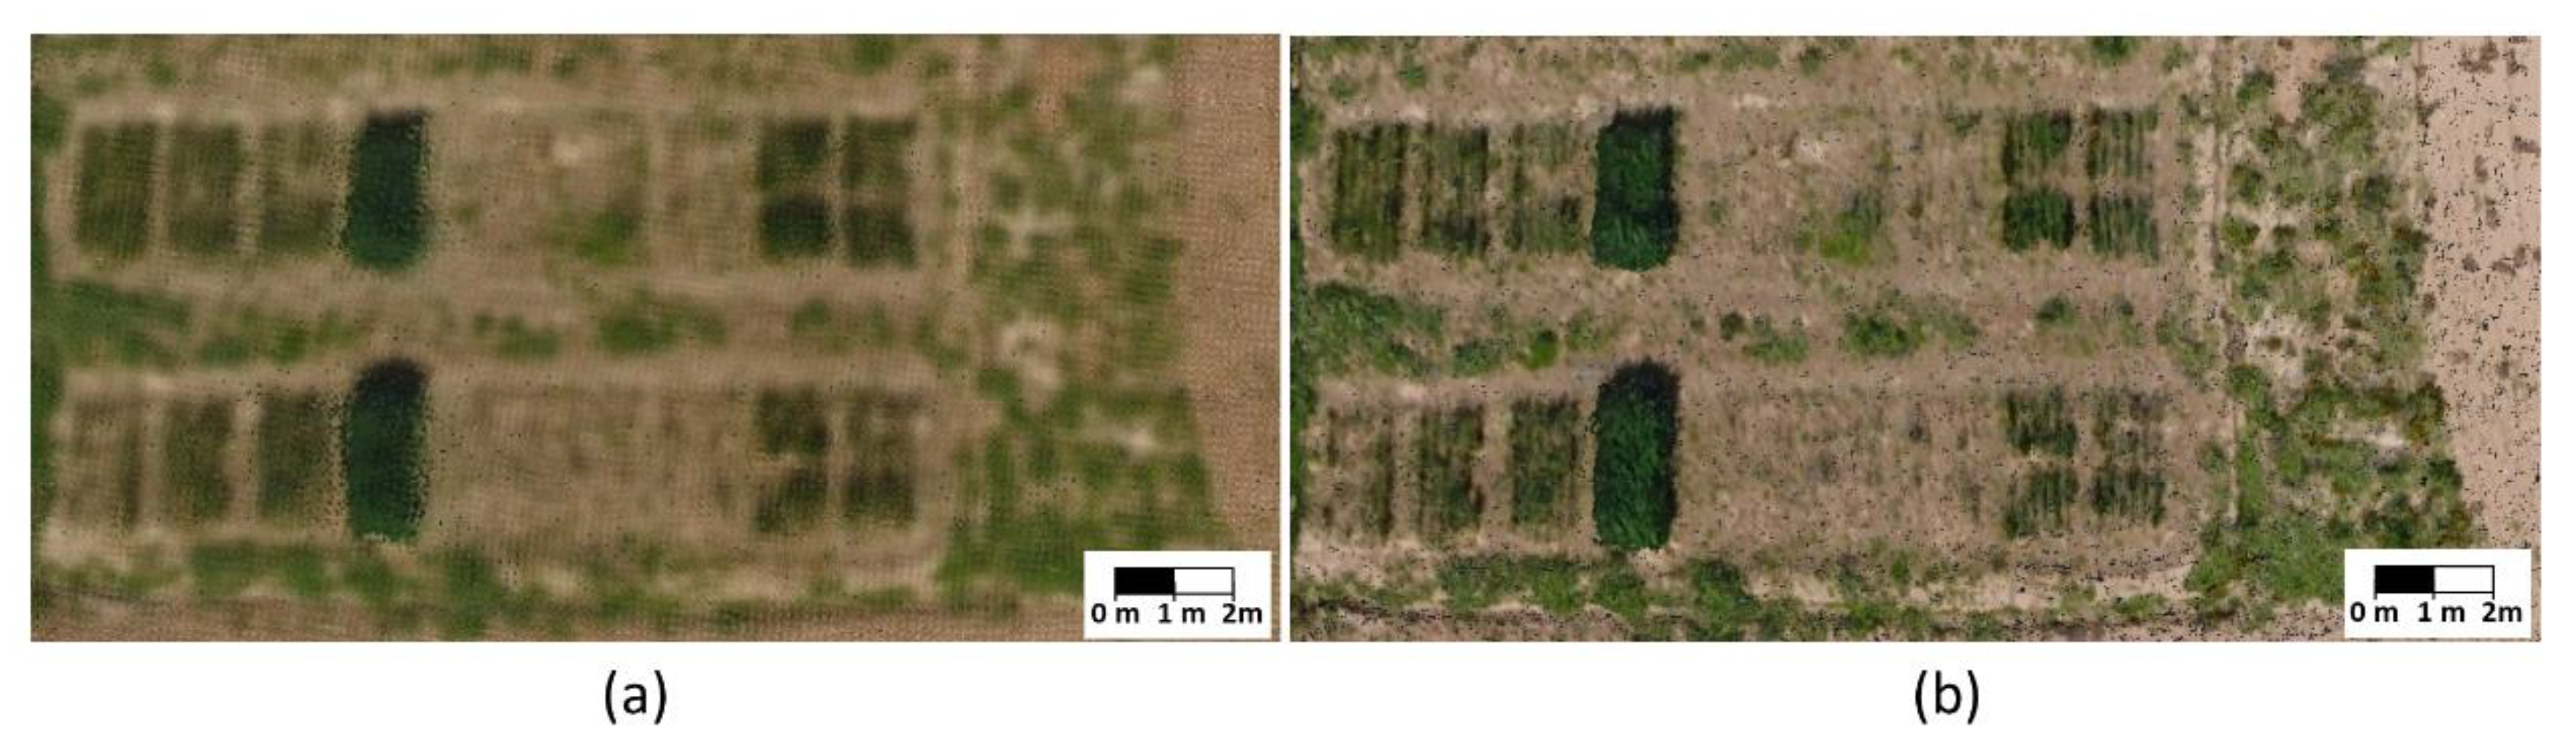
Both ODM and MicMac are free and open-source solutions. However, the accuracy of 3D point clouds is vital in VisWebDrone, allowing the execution of accurate three-dimensional measurements. For this purpose, a preliminary comparative test was performed between both solutions. In ODM, the depthmap-resolution parameter controls the density of the point cloud by setting the resolution of the depthmap images. Therefore, a higher value for this parameter (1200) was defined, according to the ODM community suggestions. Regarding the MicMac parameters, the C3DC tool with BigMac parameter was applied, which presents a higher preset of 1pt/4px. Considering the results, the point cloud data generated by MicMac presents a higher density of points (12,462,884 points), as well as a better quality and definition when compared to ODM results (10,851,334 points).
Figure 2 depicts the dense point clouds generated using the same imagery dataset in both solutions. Regarding the performance of both software in the production of orthophoto mosaic, the results presented were good and met the expectations. Therefore, for the reasons presented above, MicMac was selected to perform photogrammetric processing.
2.2. Module 2—Orthophoto Mosaic Storage in a Web GIS Server
For the task of storing raster generated data in Module 1, two web Geographic Information System (GIS) servers stand out as some of the most used in FOSS communities, the MapServer and the GeoServer.
MapServer was founded in 1996, at the University of Minnesota. It is an open-source web-mapping project, designed for developing interactive and interoperable web-mapping applications. MapServer offers support for several Open Geospatial Consortium (OGC) standards, such as WMS, Web Feature Service (WFS), and Web Coverage Service (WCS), and is compatible with a wide variety of vector and raster formats. This web server runs as a common gateway interface (CGI) application with Apache and Microsoft web servers [
21].
GeoServer, in turn, was founded in 2001, belonging to the Lime Group, the Open Planning Project, and Refractions Research. This platform plays a crucial role in the management, storage and presentation of geospatial data over the Internet. Users can upload data into the GeoServer using a web administration tool, a database, or gsconfig—a Python library for manipulating a GeoServer instance via the GeoServer RESTConfig API. As a web server, it integrates an interface where users can search for layers, consult data provided by database or manage the web services used to share raster and vector data [
22]. GeoServer serves spatial data based on OGC standards: WMS for the display of maps as images, WFS for vector data, WCS for raster data, Web Processing Service (WPS) for invoking geospatial processing services, and WFS-T for edition that allows the creation, deletion, and updating of features. GeoServer is a RESTful server where every resource could be requested using a Universal Resource Identifier (URI), which is dependent on the web service defined. Regarding WMS requests, maps could be provided in several formats, such as Geotiff, KML, and Portable Network Graphics (PNG). On the other hand, in WFS requests, the vector data could be provided in formats such as Geography Markup Language (GML), GeoJSON, and Shapefile [
23].
Regarding the comparison between both web GIS servers presented in this subsection, they are both similar in the supported OGC standards. However, GeoServer offers WFS-T, which is essential to edit processing results, allowing feature creation, deletion, and updating. MapServer, in contrast, does not offer this important service. Moreover, another important advantage of GeoServer is that it has a web administration tool available that optimizes the user experience which makes it possible to search for layers, consult data provided by database, or manage the web services used to share raster and vector data [
24]. For the above-mentioned reasons, GeoServer was elected as the web GIS server to store orthophoto mosaics.
2.3. Module 3—Orthophoto Mosaic Visualization
Web-mapping Application Programming Interfaces (APIs) are function libraries that are usually based on JavaScript. These APIs include tools that facilitate data fusion, provided from different resources, through their acquisition, manipulation, and visualization [
25]. To visualize orthophoto mosaics, generated in the Module 1 of the proposed web application, two frequently used web-mapping APIs were analyzed—the OpenLayers and the Leaflet. The selection of these particular web-mapping APIs is because of good support and documentation provided for the developers, which contributes to the increase in number of communities that are using these APIs.
OpenLayers is a JavaScript library used for web map creation. This solution implements a JavaScript API for building rich web-based geographic applications, which is one of the mostly used open-source technologies. It also implements industry-standard methods for geographic data access, such as the OGC, WMS, and WFS standards [
26].
Leaflet, in turn, is similar to OpenLayers, being a JavaScript library developed to create web maps. This library includes a wide variety of functions allowing the creation of simple web maps or complex and interactive web maps offering users changing/edition possibilities [
27].
Considering the characteristics of each web-mapping API, it can be noted that Leaflet API has much shorter code than OpenLayers for doing the same process, which makes it faster. Moreover, Leaflet supports OpenStreetMap as well as other map providers. For these reasons, Leaflet was considered the most feasible API to load and visualize orthophoto mosaics.
2.4. Module 4—3D Point Cloud Visualization
To allow the 3D point cloud visualization in VisWebDrone, point cloud viewers were analyzed. Despite the lack of FOSS software for this purpose, two solutions were identified: Potree and Plasio technologies [
28].
Potree is a web-based point cloud renderer allowing the visualization of billions of points. It simplifies the dissemination of point cloud data, once it is presented in a web page, without requiring the existence of additional software [
29]. Potree depends on WebGL technology, which is a JavaScript API compatible with HTML5. WebGL is a variation of OpenGL but is adapted to web browsers, allowing the Graphics Processing Unit (GPU) rendering capabilities to be applied to web pages. Potree also depends on three.js library which consists of a rendering library used to manipulate scene graphs and draw calls [
30].
Plasio is also based on WebGL technology, being a web-based point cloud viewer that supports LASer (LAS) files and its compressed version LASer zip (LAZ). To use it for displaying single files, its development team is working on a multi-resolution indexing and rendering stack applied to large point clouds [
31].
Potree was the chosen software for the point cloud visualization, once it proved to be the most robust platform, offering a wide set of tools for point cloud visualization, manipulation, and analysis.
2.5. Software Integration
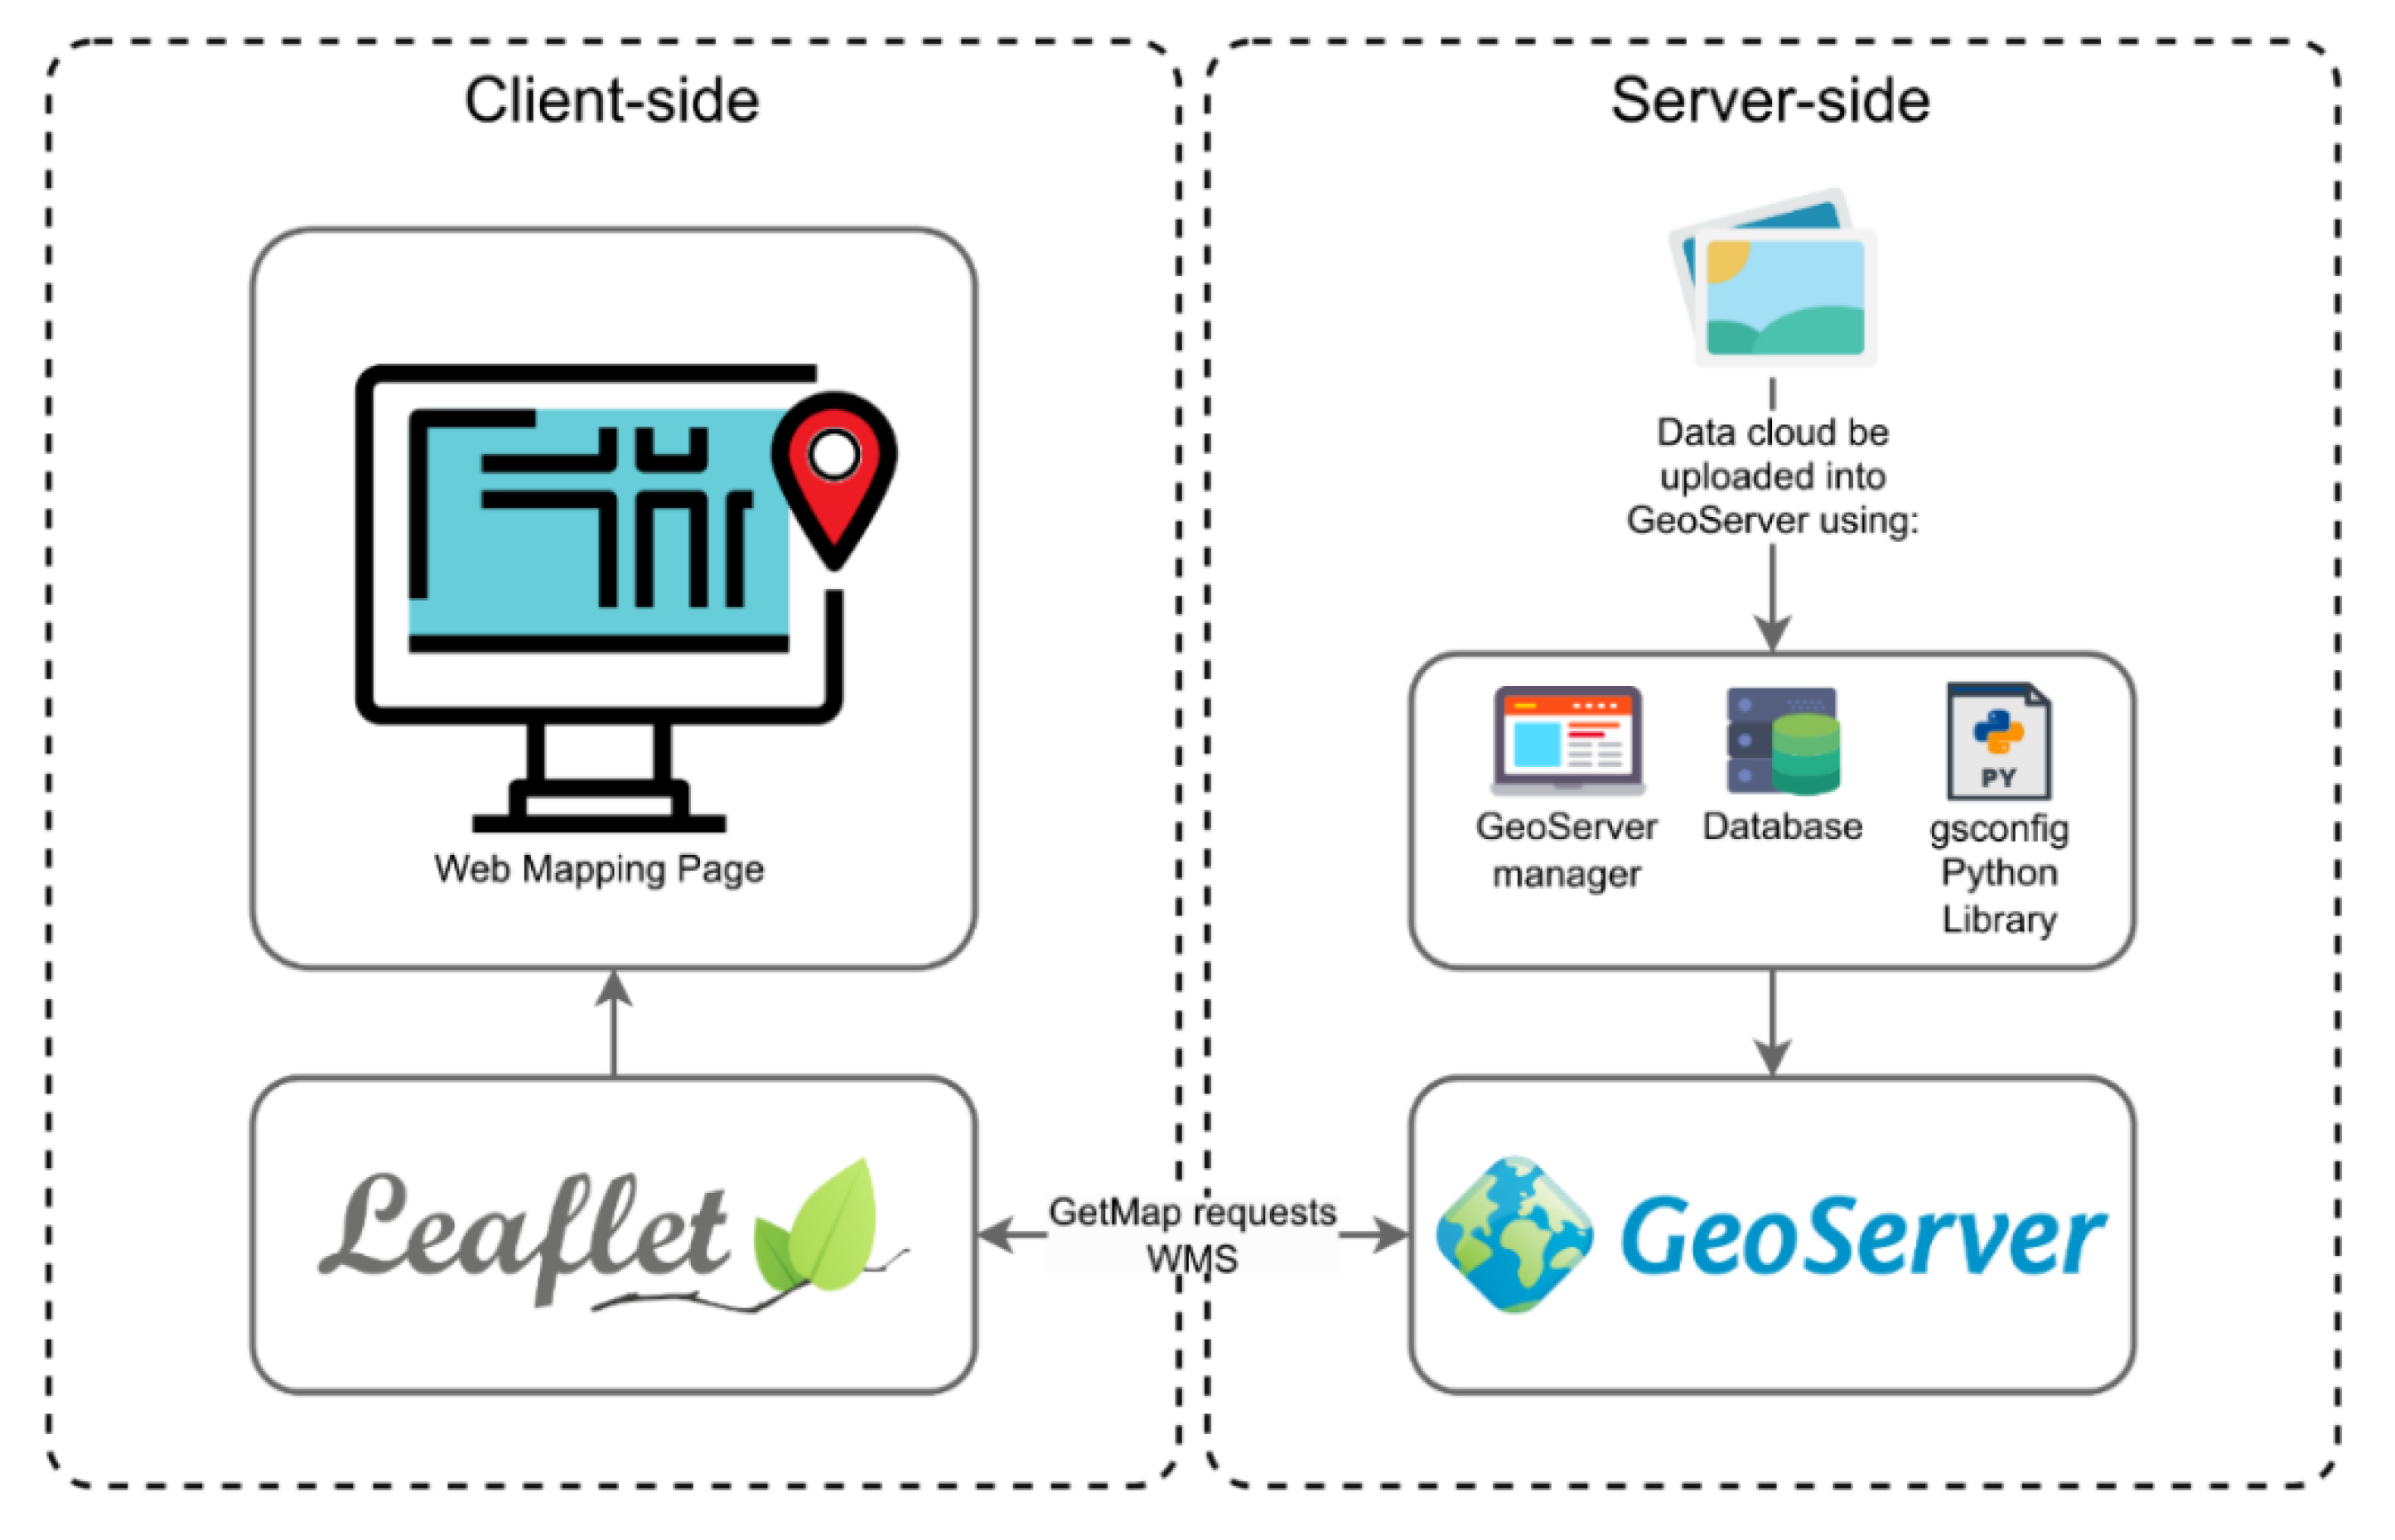
For the web application development, a Representational State Transfer (REST) architecture was implemented, which enables communications between client and server sides, performed through HyperText Transfer Protocol (HTTP) methods [
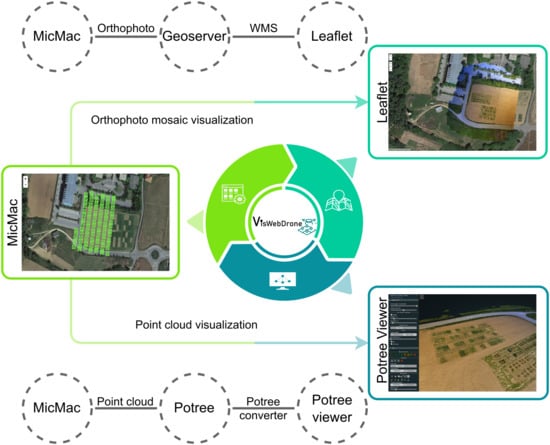
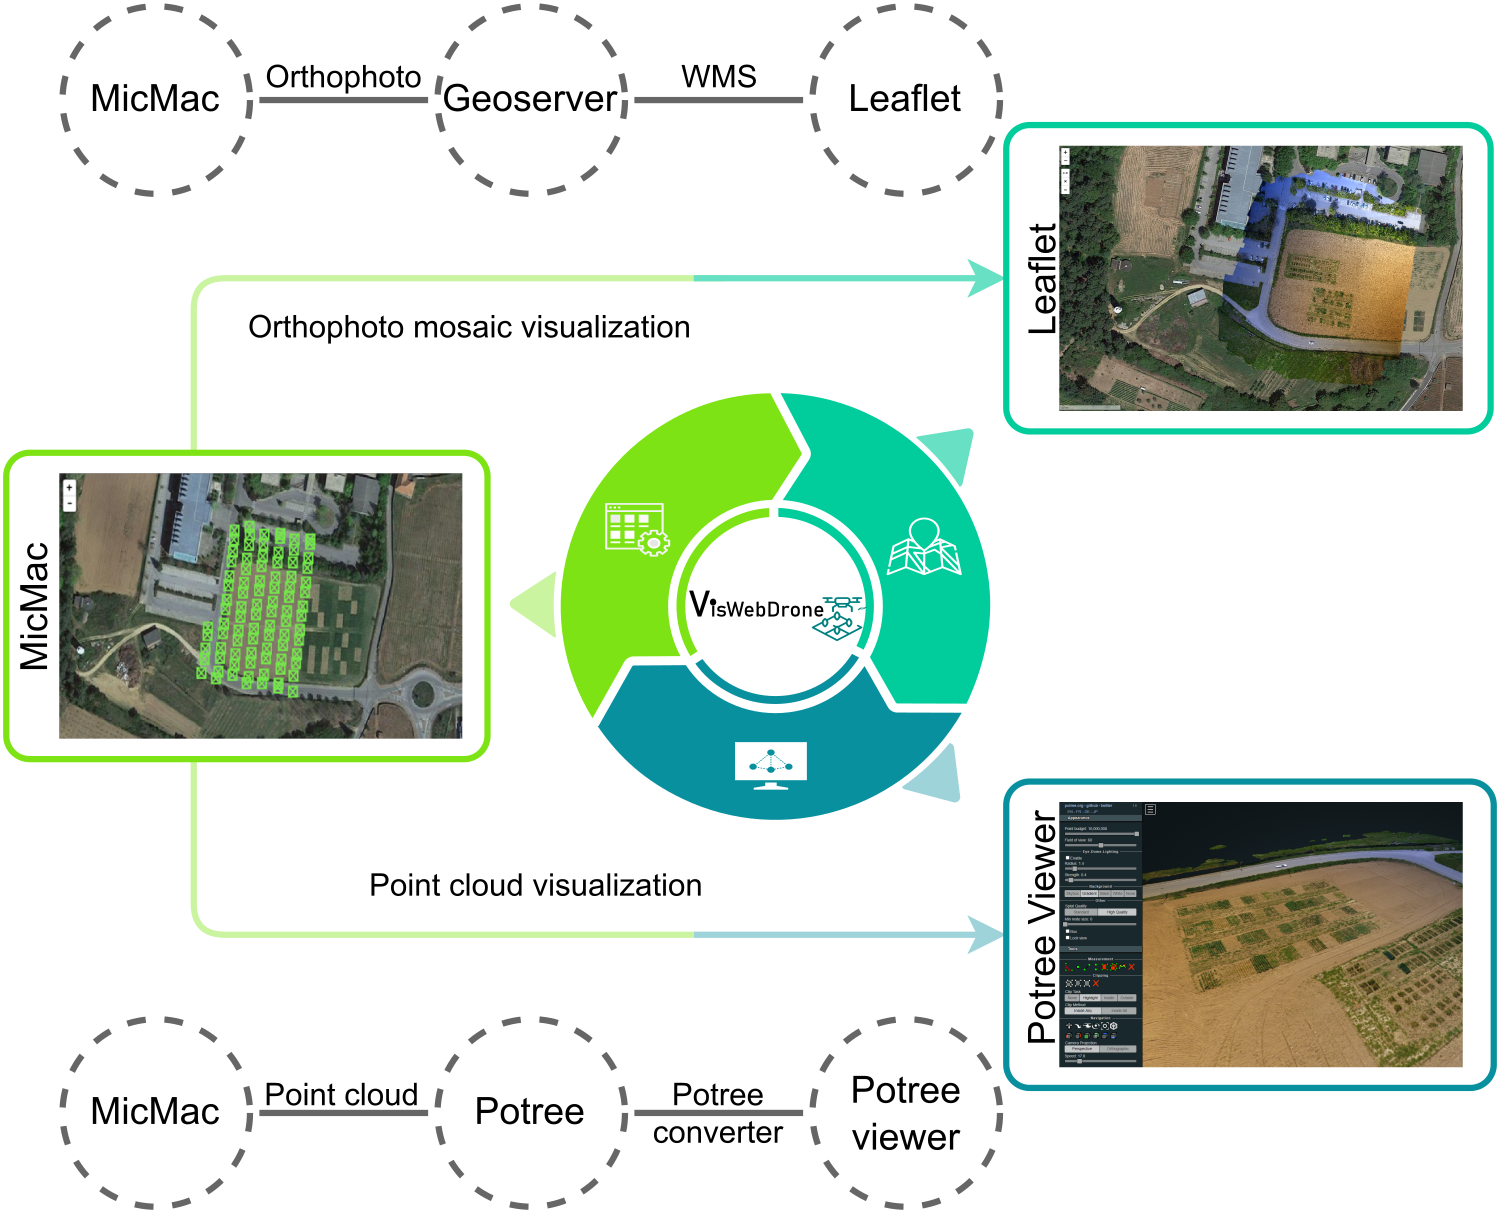
32]. The client side is associated with the web application interface, responsible for enabling users to upload images on a system and define the processing parameters. Users can select a complete photogrammetric processing pipeline that generates the orthophoto mosaic and the point cloud, or select each one individually. The defined processing pipeline, in turn, is sent as a request for the server side, outlining the processing sequence that will be done by MicMac. This process is executed through several PHP and Ajax scripts. Once data processing performed by MicMac is complete, it is possible to obtain the orthophoto mosaic that will be stored on a GeoServer instance, using the gsconfig Python library. GeoServer has a set of web services available that can be used to share raster data in web applications. In this case, the WMS is used through the request of Leaflet. The point cloud is rendered in the web page, using Potree. This process is illustrated in
Figure 3.
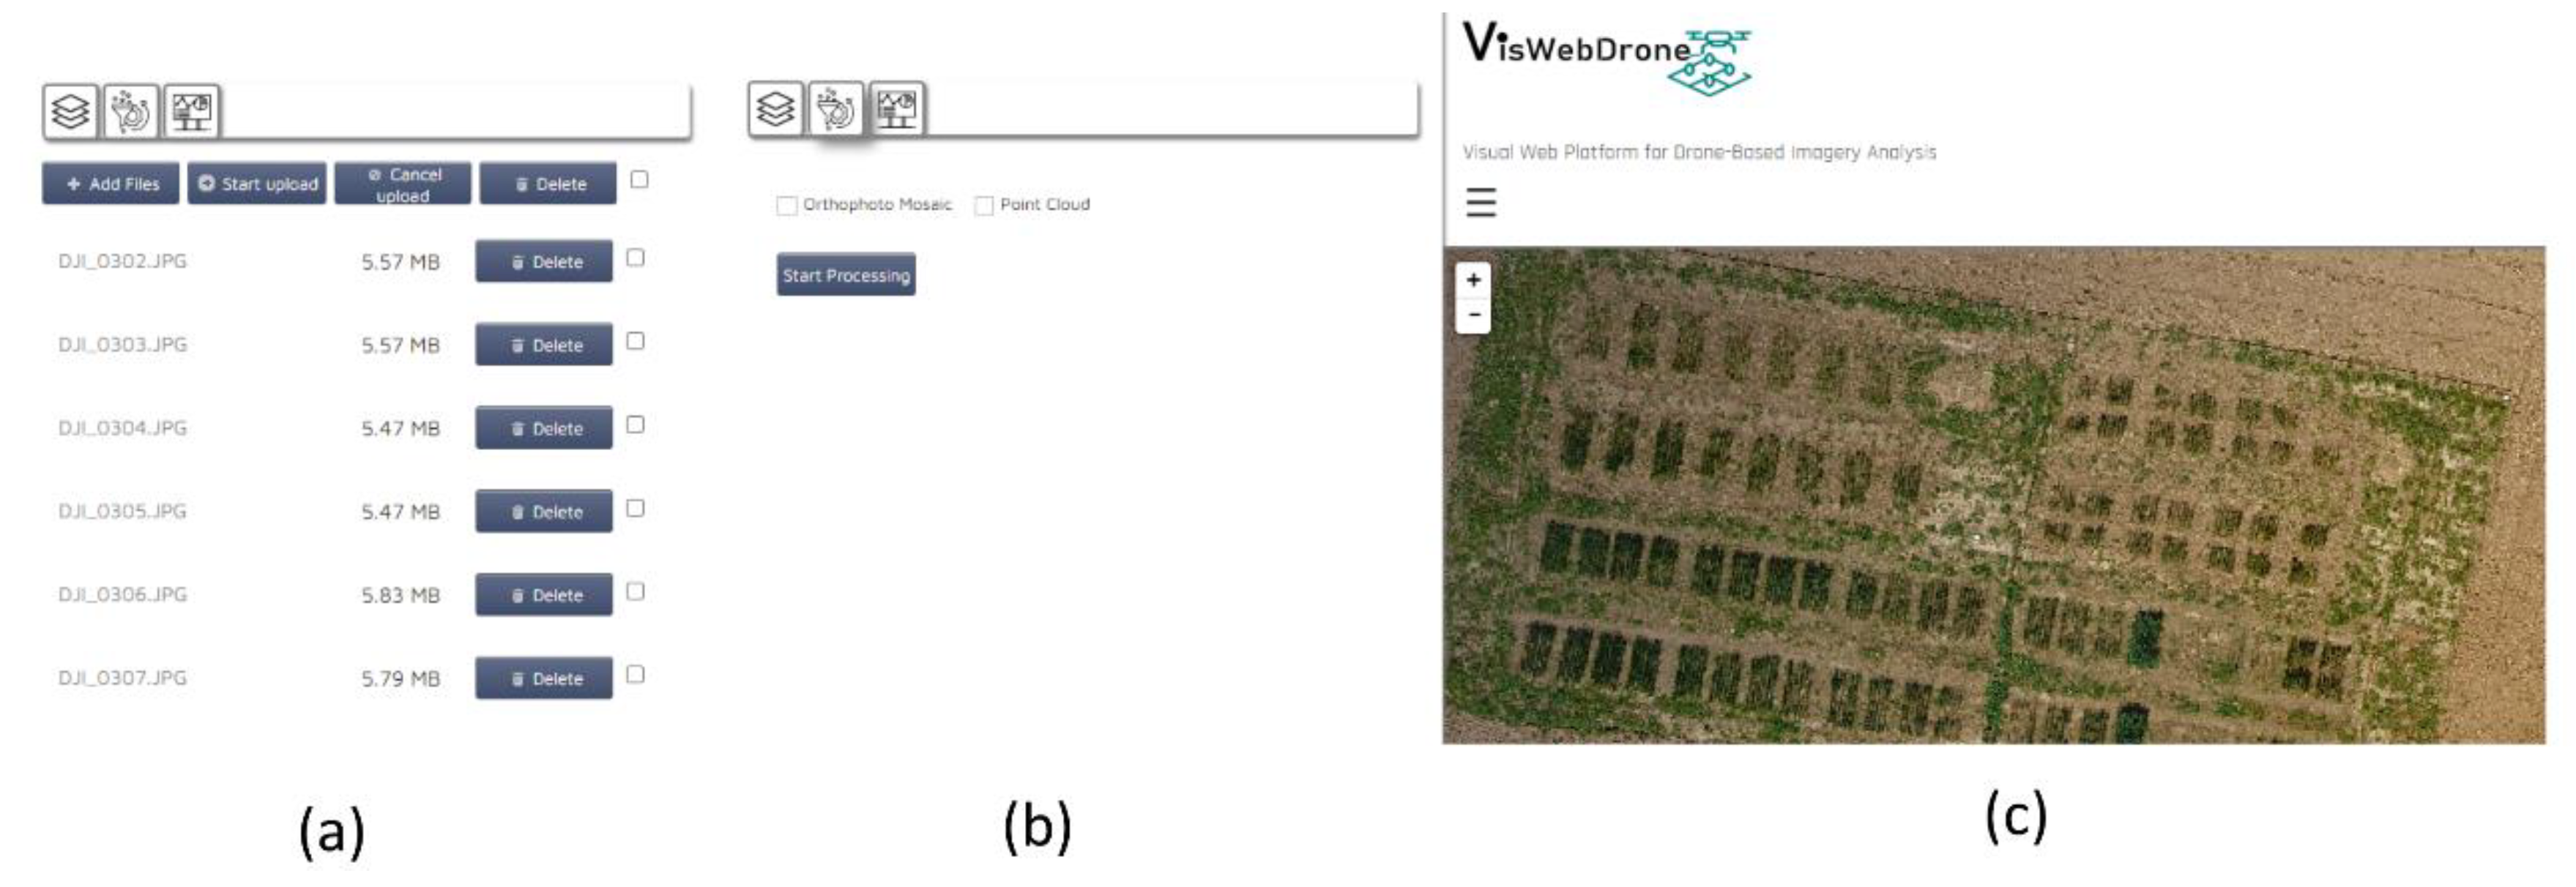
The web application interface intends to promote a user-friendly experience, presenting a simple, intuitive, and clean design. VisWebDrone is composed of a section to select and upload images collected by UAVs (
Figure 4a), a section to select the type of output to process (
Figure 4b)—orthophoto mosaic, point cloud, or both—and another section to visualize the results of photogrammetric processing (
Figure 4c).
4. Case Study
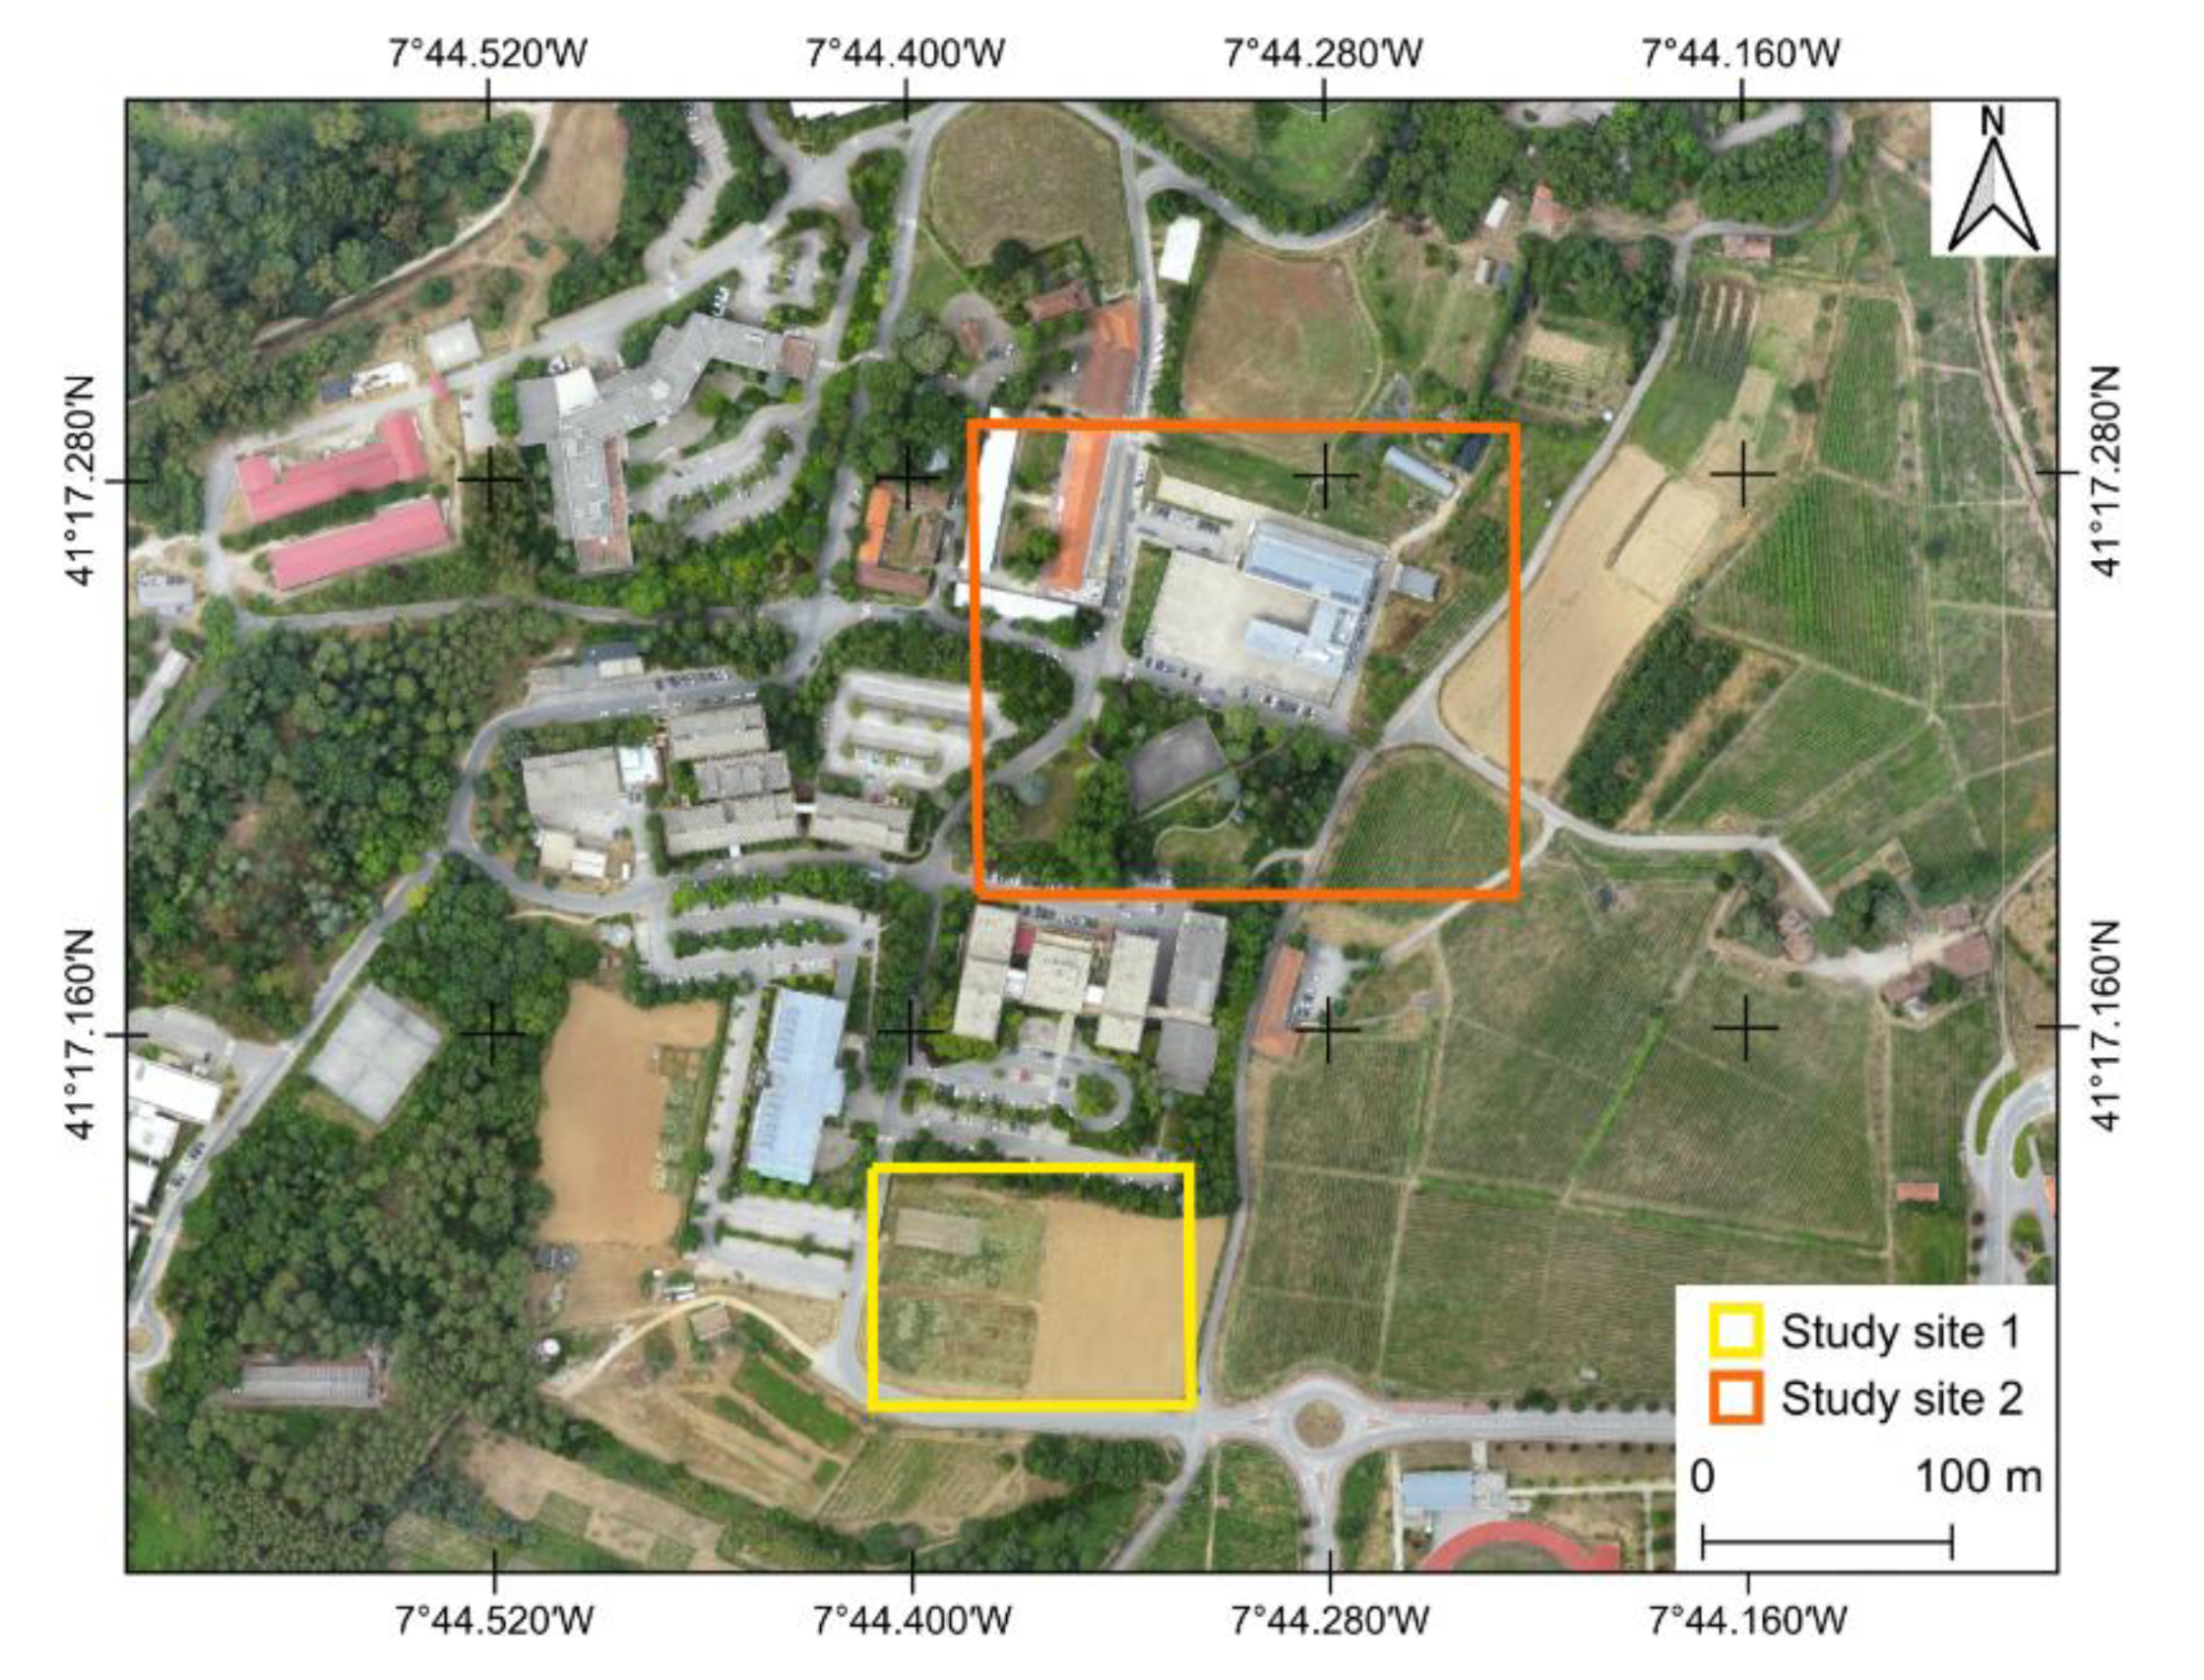
To explore and test the web application functionalities, two study areas, with data collected from UAV, were selected and are presented in this section. The data were collected on the campus of the University of Trás-os-Montes e Alto Douro, Vila Real, Portugal. The first study area is related to a set of agronomical trials, while the second includes building areas (
Figure 7). The idea behind this selection is to evaluate the performance of the solution in rural environments, where geometric entities are scarce and in semi-urban environments, where the existence of these geometric structures has the potential to improve the performance of these solutions, as they are easily recognizable. Thus, the performance of the proposed application can be tested in most common application cases.
4.1. Data Acquisition
The images were acquired using a commercial unmanned aerial system (UAS), the DJI Phantom 4 (DJI, Shenzhen, China). It is a cost-effective solution that is prepared to execute manual or fully automatic flights, using different configurations through a set of user-defined waypoints. DJI Phantom 4 is a multi-rotor UAV, equipped with an RGB sensor with 1/2.3’’ CMOS that has a resolution of 12.4 MP. The focal length of the camera is 3.6 mm (35 mm equivalent: 20.0 mm). The images collected are 4000 × 3000 pixels, and latitude, longitude, and altitude information were provided by the on-board Global Navigation Satellite System (GNSS) receiver.
For the first study area, 89 images were acquired in a single-grid configuration at a flight height of 40 m, with a longitudinal overlapping between images of 80% and a lateral overlapping of 70%, while in the second study area a double-grid flight configuration was planned at a height of 80 m (324 images acquired), giving a longitudinal overlapping between images of 90% and lateral overlapping of 75%.
To correct the errors of the UAV GNSS receiver, GCPs were acquired in the PT-TM06/ETRS89 coordinate system, using the Mobilemapper 100 GNSS receiver (Ashtech Inc., CA, USA) in RTK mode and were used for imagery alignment during photogrammetric processing. In the first and second study areas, 8 and 5 GCPs were acquired, respectively.
4.2. Data Processing, Aligment, and Visualization
The data acquired in the two study areas were processed using MicMac. However, to allow a comparison with commercial solutions, the photogrammetric software Pix4Dmapper Pro was also used. Thus, it was possible to compare the processing time and to assess the quality of the orthorectified mosaic and the point cloud data. The photogrammetric processing in both solutions was performed locally in the same workstation equipped with two Intel(R) Xeon(R) CPU E5-2680 v4, two NVIDIA Quadro M4000 GPUs, 128 GB RAM and a 1 TB SDD in the Windows 10 Enterprise operating system.
4.2.1. Data Processing Using Pix4Dmapper Pro
The photogrammetric processing using the Pix4Dmapper Pro (version 4.5.6) was based on three main processes. In the first process (Initial Processing), the digital photo camera was calibrated, and images were oriented. Considering the relative orientation, tie points were automatically measured through the stereo pairs in overlapping areas. On the next step, GCPs were entered and measured automatically, with a manual correction in the position of these points. Having concluded the relative orientation, the aerial triangulation step was performed. The triangulation was an automatic step, where tie points were transformed into geodetic coordinates system. In the second process (Point Cloud and Mesh), the point cloud was generated, combining the filtering and smoothing steps to determine point cloud densification, avoiding noisy and erroneous points. In the third process (Digital Surface Model (DSM), Orthomosaic and Index), the generation of DSM and the orthophoto mosaic included several sections allowing the definition of the data format and the specifications of outputs.
4.2.2. Data Processing Using MicMac
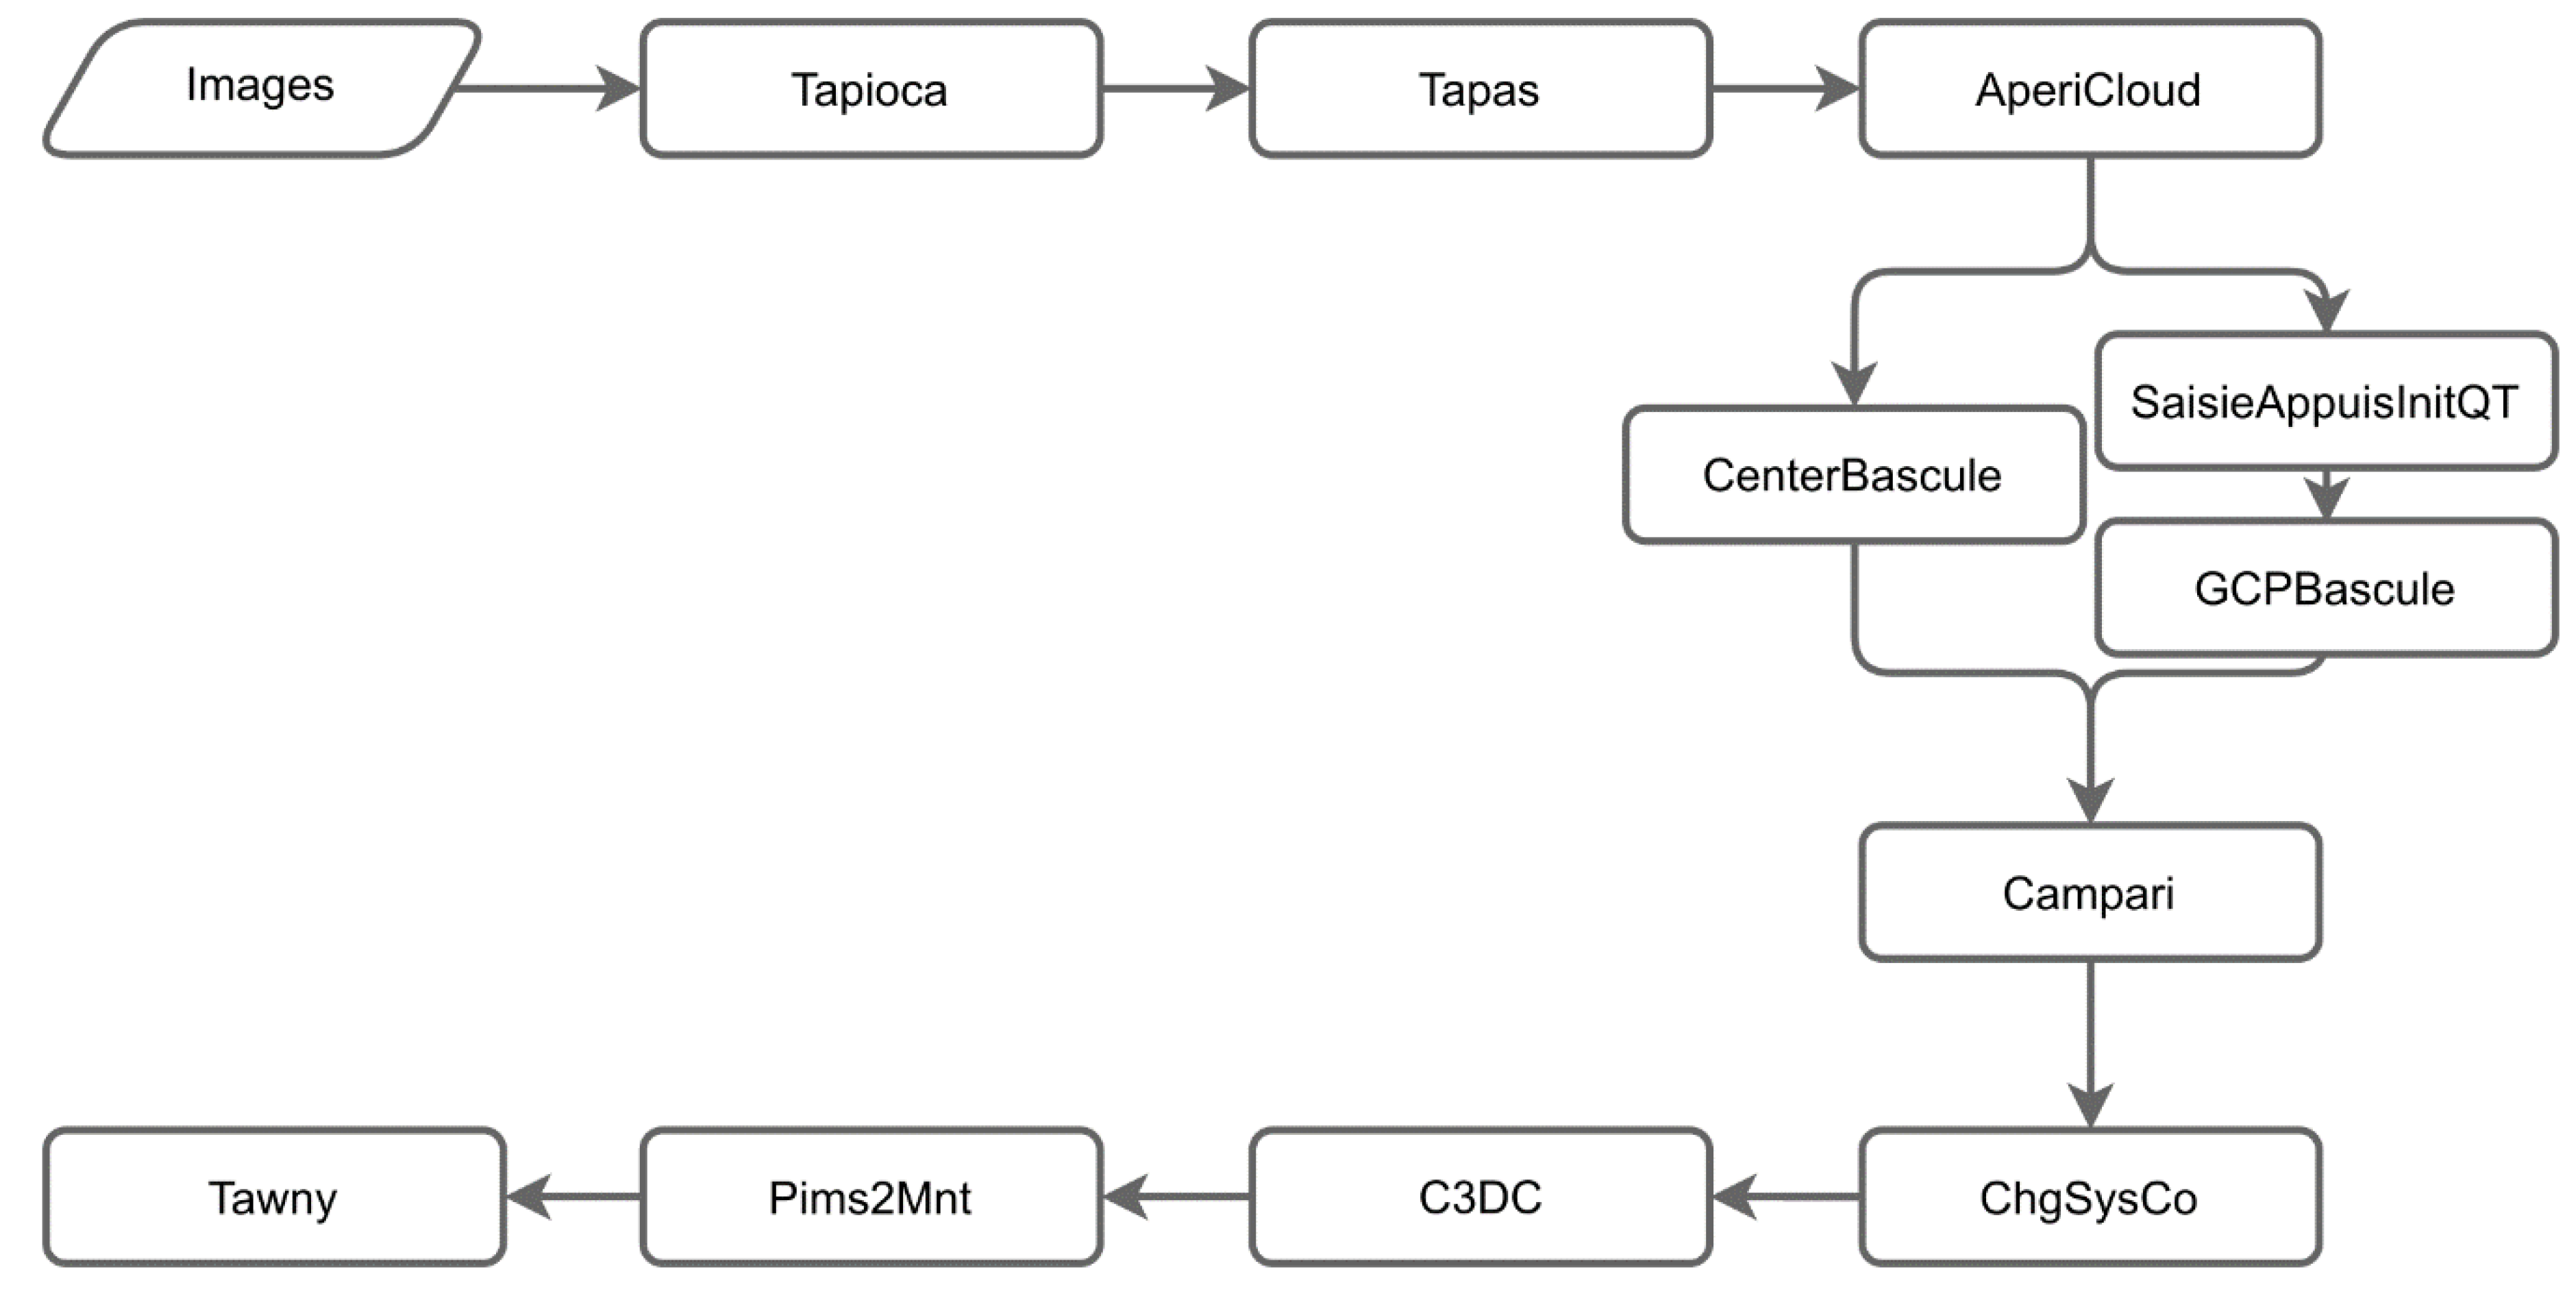
Initially, the ExifTool software was used to read the metadata associated with the images collected by UAV. These data provided important information, such as the focal length of the camera and the absolute and the relative altitude and the GNSS coordinates, which were used to locate each image in a basemap presented in a web application.
Following the initial procedure, tie points identification was performed using the Tapioca tool. This tool required the identification of two mandatory arguments, the directory/path of images and the image size, in pixels. After the identification of tie points, these were used by the Tapas tool to calculate the relative orientation of images and the position and distortion model of the camera’s optics. The Tapas tool required, as mandatory arguments, the identification of calibration model (FraserBasic) and the directory/path of images. On the next process, a PLY file with the position of the cameras was generated, using the AperiCloud tool. The following step consisted of the use of SaisieAppuisInitQT for GCPs marking, following by the GCPBascule tool, to transform the relative orientation into an absolute one, based on GCP data. Then, the Campari tool was applied to execute the bundle adjustment made using camera positions and tie points. ChgSysCo was then used to define the final coordinate system. For this purpose, an XML file that identified the EPSG code parameters was created. The defined code was the EPSG: 3763 (ETRS89/ PT-TM06), which is an official coordinate system of Portugal and the same as the GCP. After this step, the C3DC tool was used to perform an automatic match, generating a high-density point cloud, in PLY format, from a set of oriented images. Finally, photogrammetric processing was concluded by the Tawny tool, which was used to produce the orthophoto mosaic in a TIF format.
4.2.3. Visualization of Data Using Leaflet and Potree
On successful completion of data processing, the orthophoto mosaic was uploaded into the GeoServer using the gsconfig Python library. This library allowed the automatic configuration of layer style, as well as the definition of the final coordinate system. Once this procedure was concluded, the communication was implemented between the server (GeoServer) and the Leaflet using the WMS service. On the Leaflet library, the coordinates of the base map were always updated, according to the coordinates associated with the orthophoto mosaic.
Regarding to Potree, the PotreeConverter tool was applied to transform the point cloud in PLY format into a WebGL HTML file optimized to visualize and manipulate the data.
4.2.4. Data Alignment
To evaluate the point cloud accuracy, the mean error and the Root Mean Square Error (RMSE) was calculated as in Equation (1), using Microsoft Excel. RMSE measures the difference between forecast and corresponding observed values, giving a relatively high weight to large errors. In this way, the RMSE is most feasible when large errors are particularly undesirable [
38]. Usually, photogrammetry projects require a good accuracy and the existence of lower errors. Therefore, accuracy evaluation through RMSE is essential.
where
ei, represents the error of each point in a given direction (X, Y, Z), and
n the number of Check Points (CPs).
5. Results and Discussion
5.1. Orthophoto Mosaic and Point Cloud Results
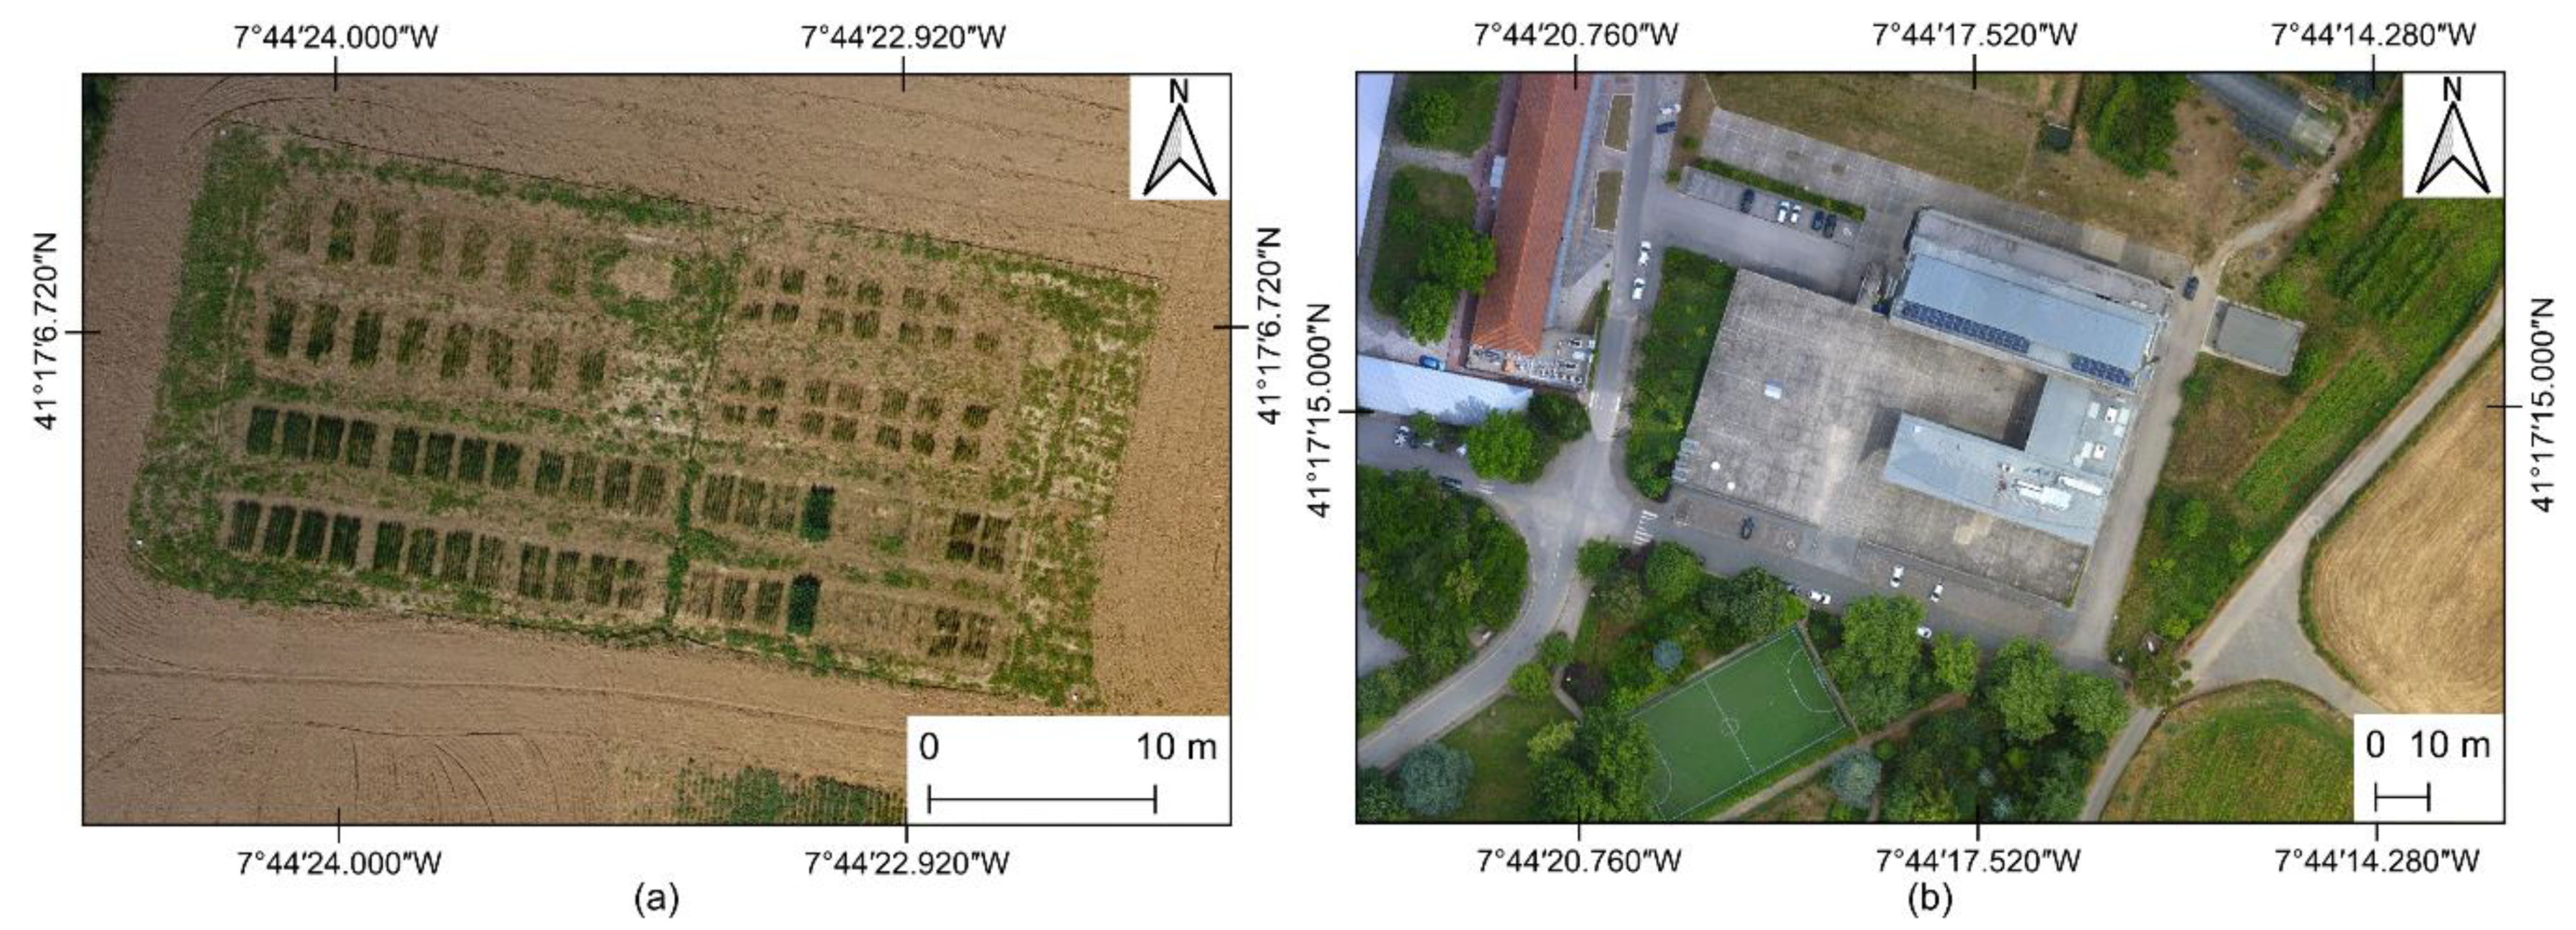
Considering the first study area, the orthophoto mosaic generated (
Figure 8a) was created with a Ground Sampling Distance (GSD) of 1.78 cm, making it possible to visualize the surveyed area with great detail. Regarding the second study area, a lower spatial resolution was obtained on the orthophoto mosaic (
Figure 8b) with a GSD of 3.70 cm. Considering the orthophoto mosaic observations, problems in transition areas were not noticeable in the region of interest, as it is not presenting displacement areas, and verifying a good balance in brightness levels in both cases. However, outside the region of interest, where a fewer number of images were acquired, some radiometric or coloring variations are more noticeable close to the borders. These issues were already observed in other studies [
39].
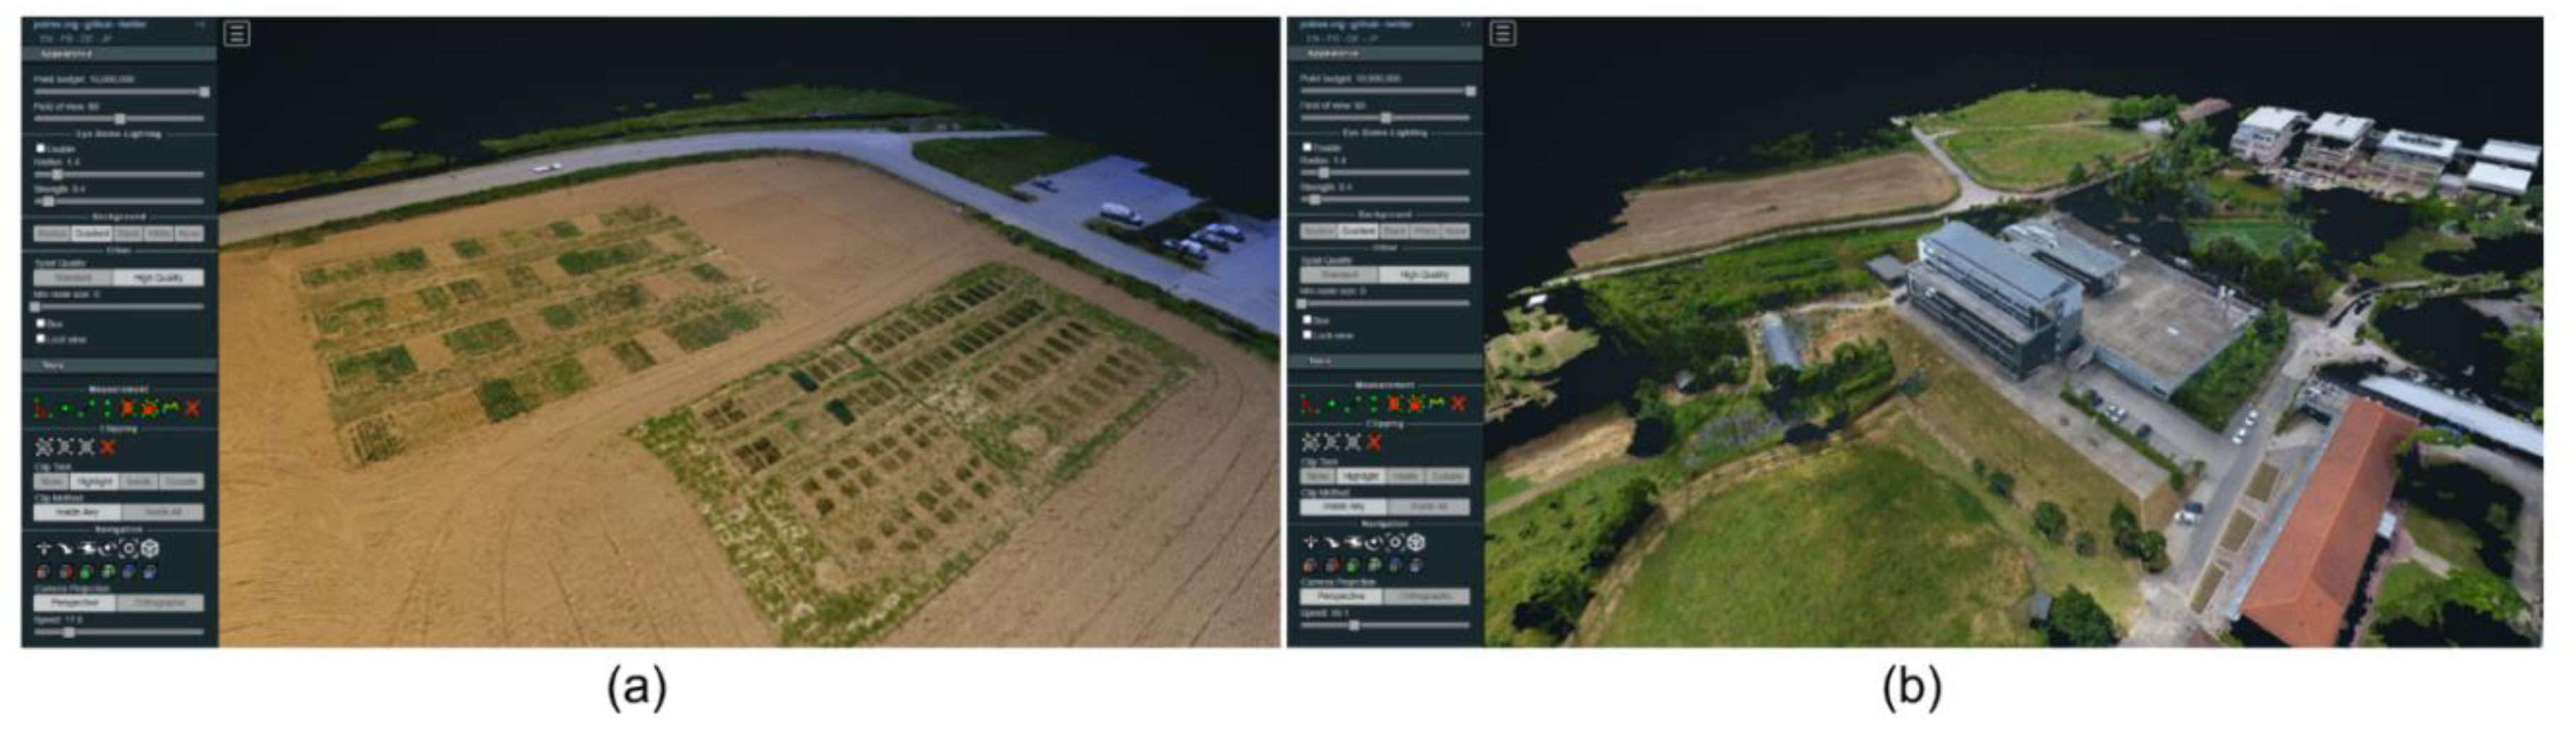
Considering the point cloud data, in first study area (
Figure 9a), a total of 12,462,884 points were generated. Regarding the point cloud data produced in second study area (
Figure 9b), a total of 15,637,246 points were generated. Both cases high-quality dense point clouds were generated. However, some points from dense tall vegetation were not estimated in the second study area.
5.2. Data Alignment and Photogrammetric Processing Time Evaluation
The mean error and RMSE in X, Y, and Z directions were calculated in for both study areas. In this way, several points were identified in the point cloud data and the coordinates of their centers were obtained. These coordinates were then compared with the corresponding GCPs, obtained in the field with the GNSS equipment. The results provided by MicMac were also compared with those obtained by Pix4Dmapper Pro.
Table 1 presents the comparative results.
Considering first study area, the accuracy obtained in the processing carried out by MicMac is lower than the GSD, respectively RMSEX = 1.18 cm, RMSEY = 0.90 cm, and RMSEZ = 2.15 cm. Regarding Pix4Dmapper Pro results, the RMSE is slightly lower in all directions, respectively RMSEX = 0.92 cm, RMSEY = 0.67 cm, and RMSEZ = 1.92 cm. However, these results prove the effectiveness of MicMac in photogrammetric processing, since the results are similar to those obtained using a commercial solution and the errors are below the GSD. Regarding the second study area, MicMac results continue to be comparable to Pix4Dmapper Pro, again with a slight advantage for the commercial solution. However, MicMac results respect the requirements by a wide margin. In fact, MicMac achieved individual RMSE of RMSEX =1.95 cm, RMSEY = 1.55 cm and RMSEZ = 2.29 cm, which are in line with those obtained by Pix4Dmapper Pro, respectively RMSEX = 1.66 cm, RMSEY = 1.43 cm, and RMSEZ = 2.17 cm.
According to the literature related to absolute accuracy evaluation [
40,
41,
42], an error of 1–2 times the GSD horizontally and 1–3 times the GSD vertically could be expected, which means that the accuracy obtained with MicMac is in line with these expected values. In this study, we purposely selected mixed areas, where anthropogenic objects occupied rural zones, to assess the global behavior of the analyzed solutions. However, in other studies, in which more homogeneous areas were analyzed, MicMac presented good accuracies, in some cases even better than commercial solutions [
43,
44,
45].
A comparative evaluation of photogrammetric processing time executed by Pix4Dmapper Pro and MicMac was also carried out. The execution time of the two solutions for carrying out the two most relevant tasks are presented in
Table 2. Photogrammetric processing was performed with high-quality parameters in both pieces of software, contributing to higher computational costs. Regarding the Pix4Dmapper Pro software, the processing time was faster, since it used resources from both GPU and CPU. On the other hand, MicMac only used the CPU resources, which contributed to a longer processing time. Moreover, the MicMac configurations allow extremely detailed tie point detection, which also contributes to time spent in photogrammetric processing [
39,
45].
In
Table 2, the photogrammetric processing time is proportional to the image number included on the web application. However, the platform works perfectly with a higher quantity of images.
The higher processing times (approximately twice the time), obtained by MicMac, can be considered to be a disadvantage of this solution. However, this software is free and open-source, offering high-quality results with good accuracies that are in line with the accuracy thresholds defined in the literature.
During the photogrammetric processing, Pastis/Tapioca and Apero/tapas were the slowest processes of the pipeline. Several algorithms, such as OriRedTieP, are in development and could optimize and improve the photogrammetric workflows.
6. Conclusions
In the upcoming years, web-based software, services, and applications are expected to increase. The developed web application, presented in this paper, is based solely on open-source technologies, demonstrating its ability in the production of feasible solutions, as long as integration is performed correctly. In the present study, the integration of MicMac, GeoServer, Leaflet, and Potree was successfully performed.
The proposed application is freely available and can be employed for multiple uses in academic or professional contexts. The target users can have little or no experience into the photogrammetric processing of UAV-based imagery since the interface is intuitive and minimal interactions are needed. Moreover, public entities can benefit from the use of this web application, since it can be installed on a server and multiple users can access to it through a web browser (or using Docker for a single device), minimizing the costs in the hardware needed to locally conduct the photogrammetric processing.
An example of potential users are police forces responsible for road traffic accident reconstruction, which can use UAVs to acquire imagery from accident scenes and to process them in a quicker way, and to focus on the final products to produce accurate sketches and to digitally preserve evidence for future usage. The application allows not only visualization of the orthophoto mosaics and point clouds but also analysis of the results by enabling the users to perform several measurements.
The web application was tested by analyzing the performance of photogrammetric processing. The orthophoto mosaic demonstrated a good balance in brightness. The point cloud, in turn, presented a high density of points, demonstrating good quality. Considering the RMSE results obtained by MicMac, the thresholds of 1–2 times the GSD horizontally and 1–3 times the GSD vertically were respected. Moreover, MicMac proved the ability to provide accurate results, even when compared with other popular commercial solutions, such as Pix4Dmapper Pro.
Considering the integration of the results obtained in Leaflet and Potree, this process was executed with success being completely automatic, demonstrating a good quality and performance for the visualization of data. The web application development offers the possibility of being continuously updated. In this way, there is a continuous intention to integrate new open-source solutions and new products.

 ,
, 


