2. Literature Review
Associated research has revealed that in the offline sales scenario, the sale amount and rental are closely related to customer mobility [
13,
14], which may reflect customers’ tendencies. Therefore, a prerequisite for increasing profits is understanding the mobility of customer flows and their influencing factors. Next, we first review the development based on questionnaires, and then focus on the recent update of indoor positioning data.
Data collected by questionnaires have played an important role in understanding the popularity of different stores and their influencing factors, even in recent years. Based on customers’ movement information, Brown [
15] studied the one-week-long flows of 250 shopping groups in a suburban district center and found dense customer flows around anchor stores. Hirsch et al. [
16] investigated the influencing factors of customer flow distribution and uncovered that flows are spatially concentrated in the retail categories of food, health and body, and fashion, and the pass ratio declines as the distance from the center of the shopping mall increases. Widiyani [
17] systematically studied the factors influencing a customer to visit a store in a shopping mall based on a large survey data set. The influence of the level of the floor, the type of store and staying time were also quantified. El-Adly and Eid [
18] studied the relationships between the shopping environment, customer-perceived value, customer satisfaction and customer loyalty, and uncovered a significant correlation between the mall environment and customer loyalty, which is also mediated by the customer-perceived value of malls and customer satisfaction. Based on customers’ store choices and satisfaction, Jaravaza et al. [
19] found that the travelling time, location convenience, proximity to complimentary outlets and store visibility were significant factors influencing customers’ store choices. Based on 489 interviews, Mathaba et al. [
20] found that the conduct of store staff, brand availability, price promotion and store atmosphere were major factors that shoppers considered when selecting sportswear shops. Hilal [
21] revealed that factors such as store image, store convenience, store environment, store attractiveness and service quality influence store loyalty based on 389 customers’ questionnaires. Each customer has his/her own decision-making style during mall shopping, and Alavi et al. [
22], to clarify the influencing factors, revealed relationships between the decision-making styles, levels of satisfaction and purchase intentions via classifying customer decision-making into eight styles. In addition to factors related to shopping malls per se, Gilboa et al. [
23] found that mall experiences regarding equity and loyalty are not universal, and national culture and mall-industry age moderate positive mall outcomes. In all, although these studies have provided valuable information on the popularity of stores and their influencing factors, some drawbacks and problems still exist. First, the data collected via questionnaires were mainly limited due to the high cost of data collection; therefore, there might exist the possibility of biased sampling. Second, even though in some studies, data were collected by interception directly in the shopping area [
24,
25,
26], most of the store visit information is usually based on customers’ recall and is incomplete and inaccurate because it may be mingled with uncertainties due to memory loss. Third, the questionnaire surveys and interviews usually represent non-probability sampling, where sample choice is largely dependent on the willingness of customers (that is, only cooperative customers can be picked up), so this could be another reason for biased sampling, and the analysis cannot sufficiently represent the overall customers.
With the development of indoor positioning technology, a variety of sensors have been used to determine indoor behavior. An indoor positioning system estimates the location inside a building using radio waves, magnetic fields, acoustic signals or other sensory information collected by mobile devices [
27,
28]. Radio wave-based techniques are most widely used in indoor positioning applications and can be divided into several types: RFID, Bluetooth, Wi-Fi and others [
29,
30]. Data collected by indoor positioning technology have been used to infer indoor behavior in different scenarios, such as museums [
31], airports [
32], hospitals [
33], exhibitions [
34], shopping malls [
35], football games [
36] and campuses [
37]. The recent research progress on customers’ shopping behavior relating to indoor positioning data can be summarized into three categories: the inference of the customer’s behavior and mobility, the identification of mobility patterns, and the determination of the factors that influence these patterns.
Regarding behavior and mobility, with the development of indoor positioning techniques, research has increasingly been based on indoor positioning data. Hurjui et al. [
38] developed an RFID-based system to identify and analyze the activity of purchasing products. Vukovic et al. [
39] designed an RFID system to position shopping baskets. The method can be used to track the trajectories of customers and to infer and analyze customer movement and the time spent in specific store segments. Phua et al. [
40] assessed the data collected from Bluetooth devices to capture customer movement. The results demonstrated that auto-logging data via Bluetooth can be used to estimate the lengths of the shopping trips of shoppers who carry the devices. Shende et al. [
41] developed a beacon system through which customers are tracked and personalized discounts are offered to customers based on their trip patterns and purchase records. In addition to individual behavior and paths, Oosterlinck et al. [
35] estimated customer flows in shopping malls using Bluetooth tracking. A case study in a Belgian shopping mall showed that the analysis of customer flows can reveal the number of stores visited and the flows to and between stores. Dogan et al. [
42] presented a process mining implementation to discover customer paths based on data gathered by iBeacon devices, which can further support a personalized recommendation system.
Customer mobility patterns can be studied based on trajectory reconstruction. Larson et al. [
43] employed a multivariate clustering algorithm to identify customer flow patterns in a supermarket in terms of nodes, time and stopping time. The results revealed customer flow patterns, which can be described and defined by aisles, end-cap displays and the racetrack. To examine the behavioral patterns of visitors tracked by Bluetooth, Delafontaine et al. [
44] applied sequence alignment methods to the data at a major trade fair in Belgium and revealed the heterogeneity of trip patterns in terms of the duration, the number of visited sites and the sequence of visits. Versichele et al. [
45] performed mass event visitor tracking using Bluetooth technology. In their research, the complex spatiotemporal dynamics of visitor movements were obtained, in addition to general statistics, such as visitor counts, the share of returning visitors and visitor flow maps. Based on the analysis of Wi-Fi traced data, Danalet et al. [
37] uncovered patterns of serial correlation from customer trajectories, which may indicate potential catering locations and their market shares. By collecting Wi-Fi-based log data containing the space-time information of customers, Liu et al. [
46] found that customer flows between different stores follow a power law distribution; namely, only a small fraction of store pairs are closely related via dense customer flow, while most other store pairs are weakly related. Customer behavior regarding gender was examined based on Wi-Fi log-based data [
47] and Bluetooth-based data [
48]. An analysis of customer trajectories showed that male and female customers have different behavior in terms of duration and the type of store visited. To understand crowd behaviors in an indoor environment, Zhou et al. [
49] analyzed Ultra-Wide-Band (UWB) positioning data with the help of statistics, visualization and unsupervised machine learning. A framework to extract the crowds’ movement was proposed to identify the interconnections between different locations and extract the temporal visiting patterns of the crowds by day and location.
Regarding the factors that influence customer mobility patterns, recent updates have mainly focused on the influence of the spatial layout of shopping malls on the overall pattern of customers’ mobility. Hwangbo et al. [
50] examined the factors influencing the visit sequences of customers by connecting transaction data and their positions, which are represented by the locations of the deployed access points (APs) that are installed to detect mobile devices carried by customers. The influence of different categories of stores on customer flows was analyzed, and the optimized movement patterns, aiming to achieve the highest sales, were obtained to rearrange the layout via a process mining algorithm. Yang et al. [
51] combined questionnaire data about customers’ purchasing behavior and their movement trajectories tracked by the UWB indoor positioning system, and found that the spatial layout of the supermarket significantly affect people’s impulse purchasing behavior. Kim et al. [
52] conducted three field experiments with different visual merchandising displays in shopping mall to compare customer movement patterns based on location-based tracking data. Their results confirmed that effective store rearrangement could change customer movement patterns and improve the overall sales of store zones.
The literature review above shows that indoor positioning data have been extensively used to study customers’ movement behavior and their patterns, whereas research on the relationship between customer flow and stores, specifically, the pattern of customer flow to stores and its influencing factors, is still insufficient. There are two main reasons. First, although survey data have been extensively used, the results may be biased or even fallacious due to the insufficiency of survey data in terms of uncertainties, non-probability and limited sampling numbers. Second, despite the fact that indoor positioning data have been applied to the analysis of customer flows, factors, especially the locational ones (including the floor, the area, the distance to the escalator and the distance to floor center), that may influence the flows are seldom investigated. In this paper, based on Wi-Fi-based indoor positioning data, we first uncover the spatiotemporal pattern of customer flows to stores, and then with a linear multivariable regression quantify the influence of various factors, which include locational and social ones. Note that in this paper, we selected the data of two shopping malls located in two cities of different styles (i.e., Beijing, the capital of China, and Chongqing, the megacity in southwestern China). The reasons are twofold. The first is that more data of different shopping malls may help to uncover general patterns of customer flow and its influencing factors from common ground. The second is that a comparison between two shopping malls can also be indicative of the influencing factors for those differences of flow patterns in terms of city style, location in the city and layout.
3. Materials and Methods
3.1. Location and Data
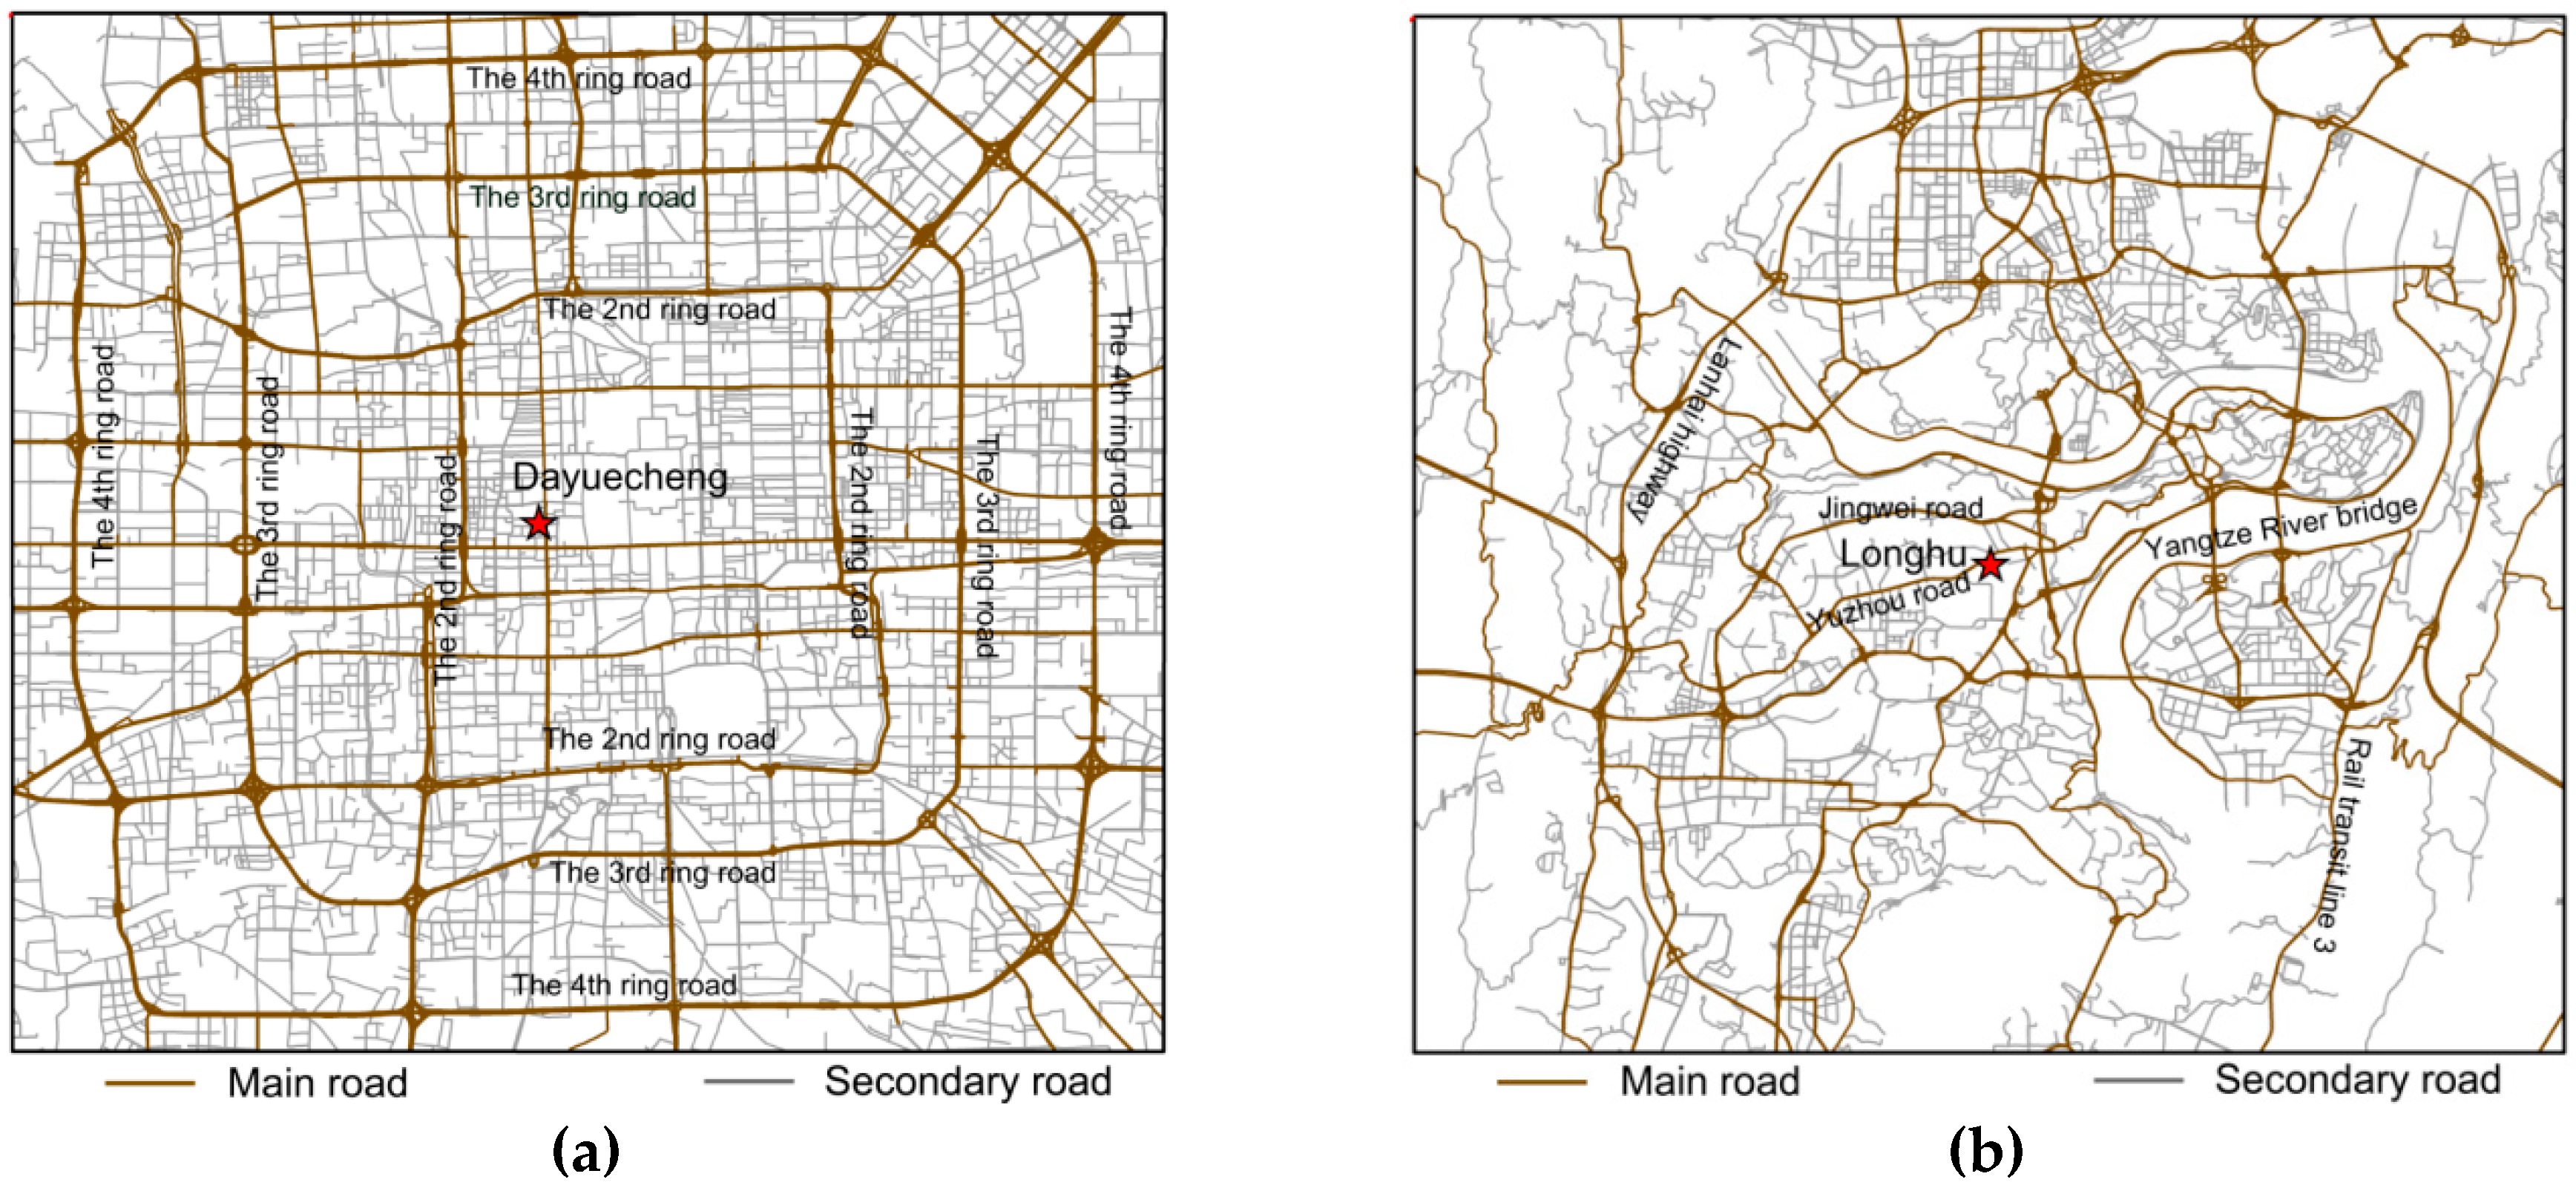
The indoor positioning data were collected in two shopping malls: Dayuecheng (DYC hereafter), located in Xidan, central Beijing, and Longhutianjie (LH hereafter), located near the inner city, Chongqing, southwest China. The locations of the two shopping malls are shown in
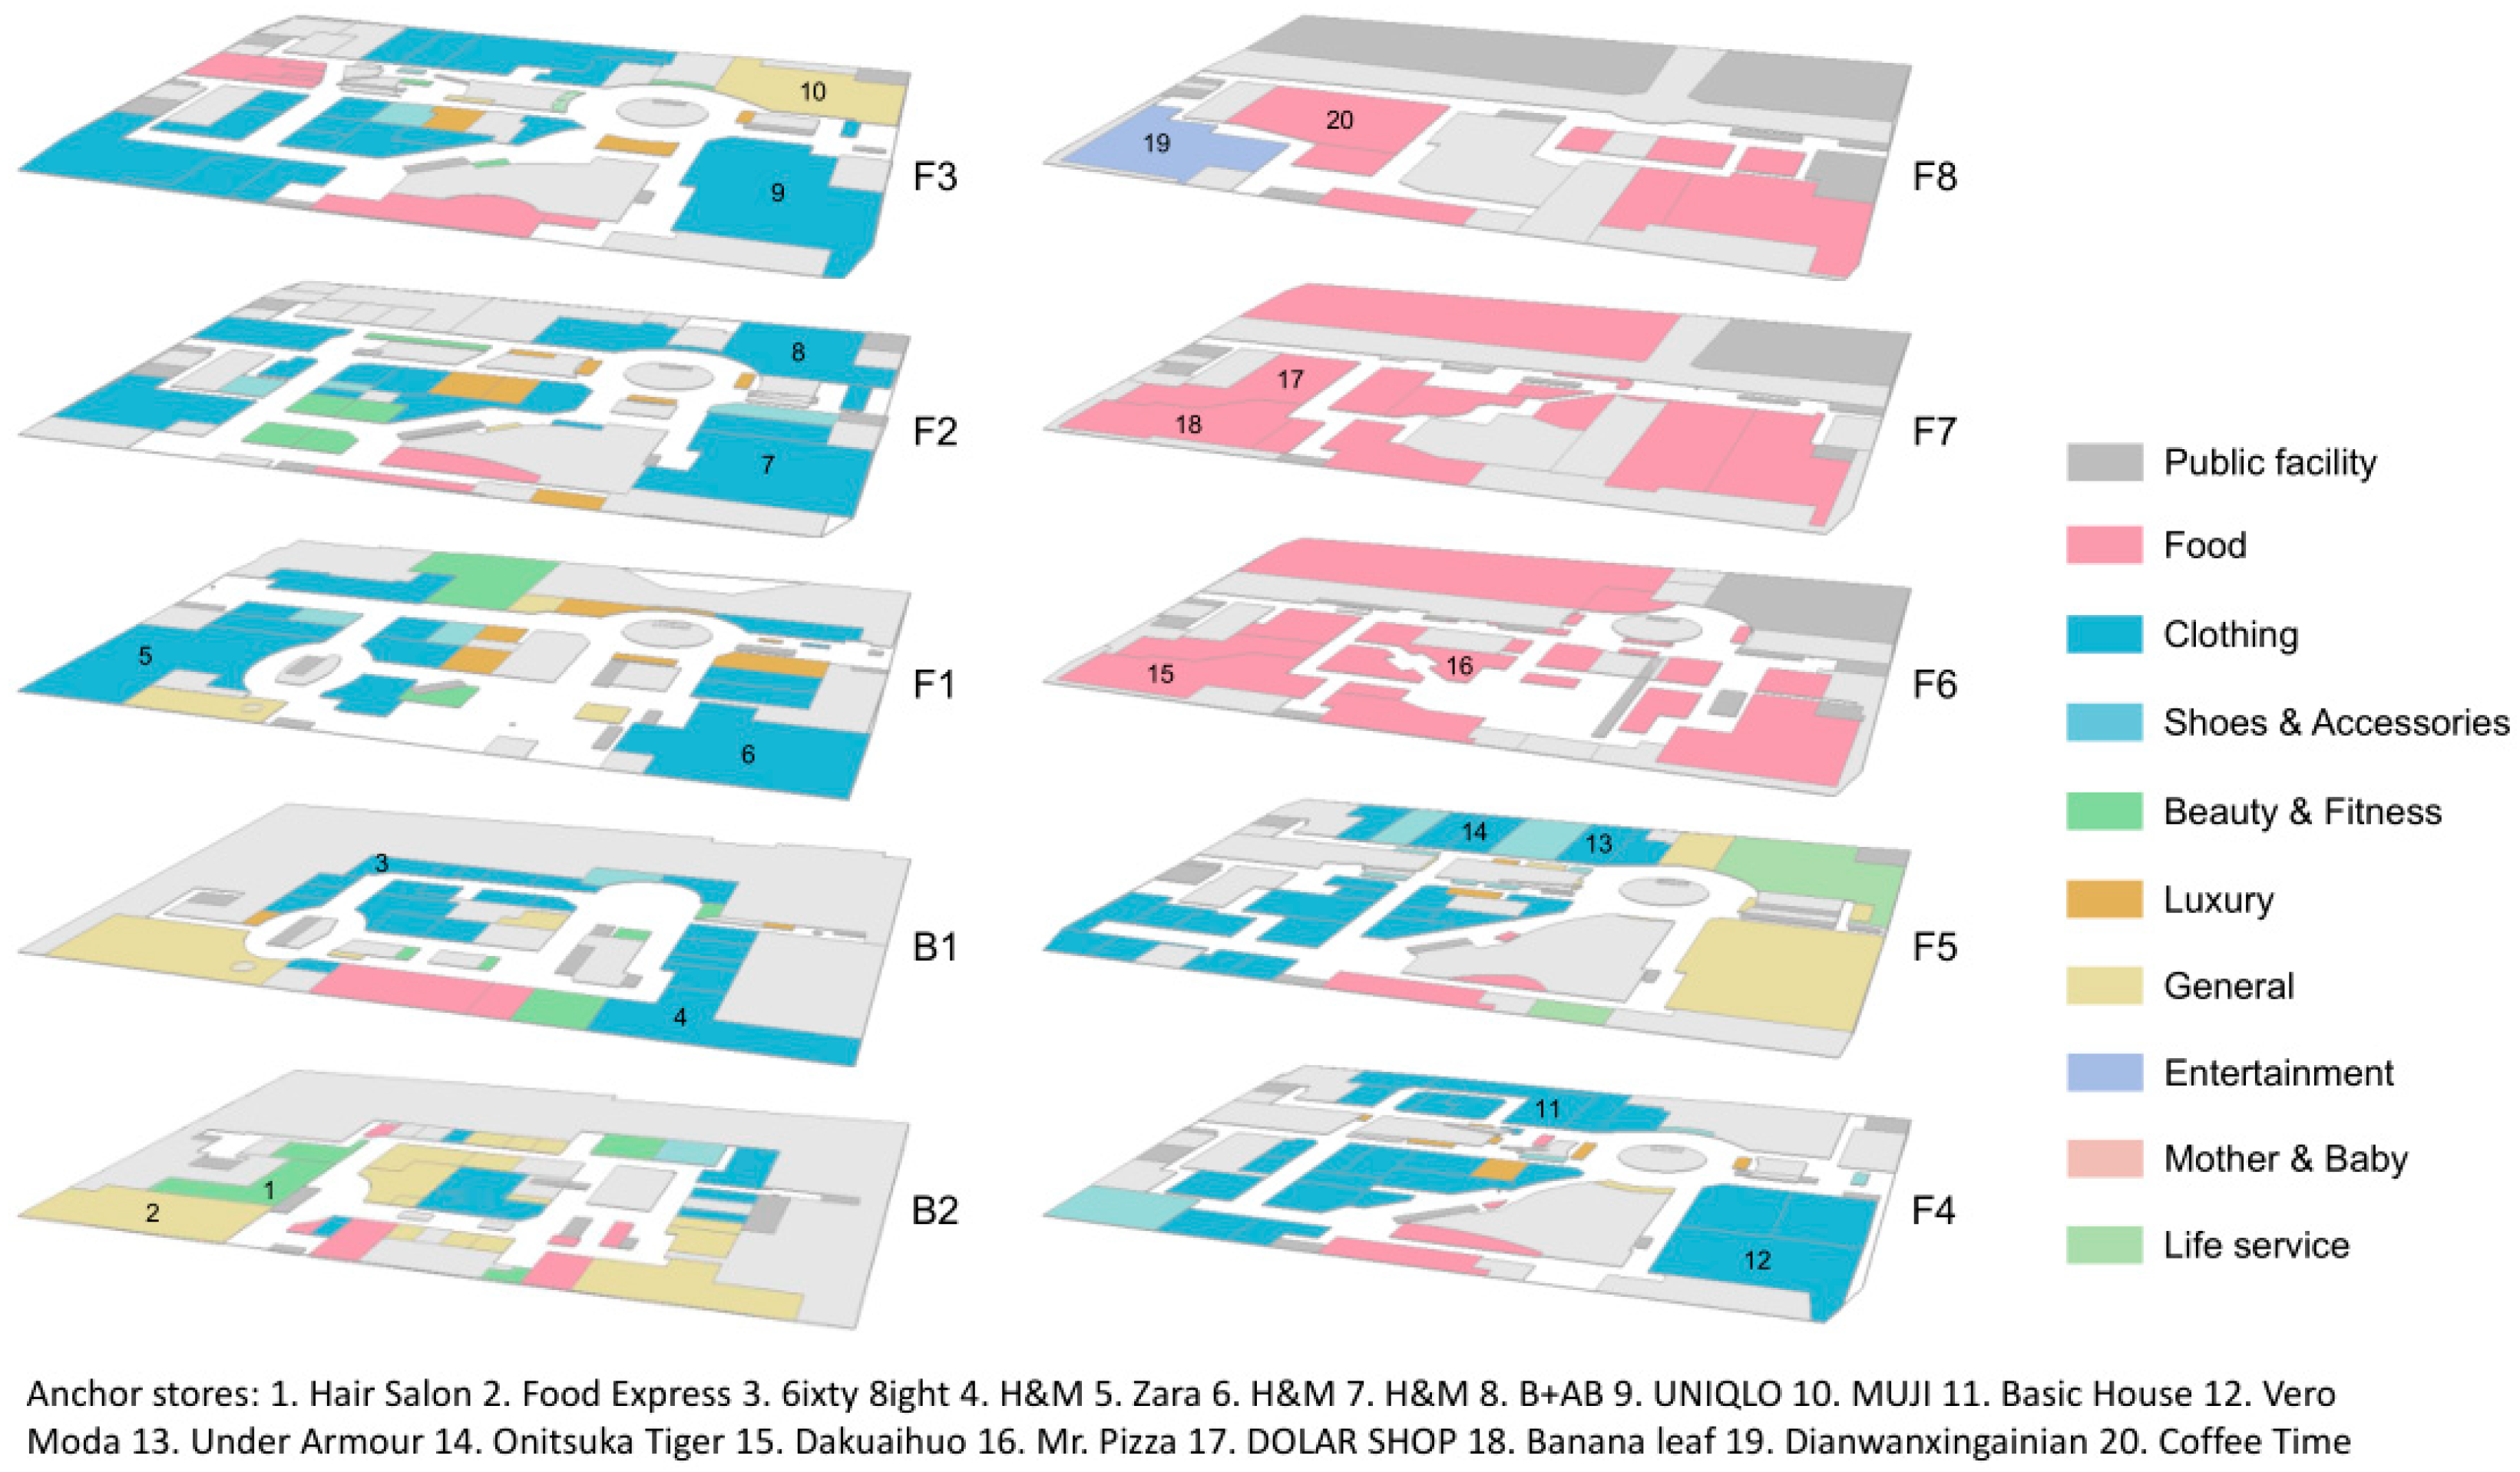
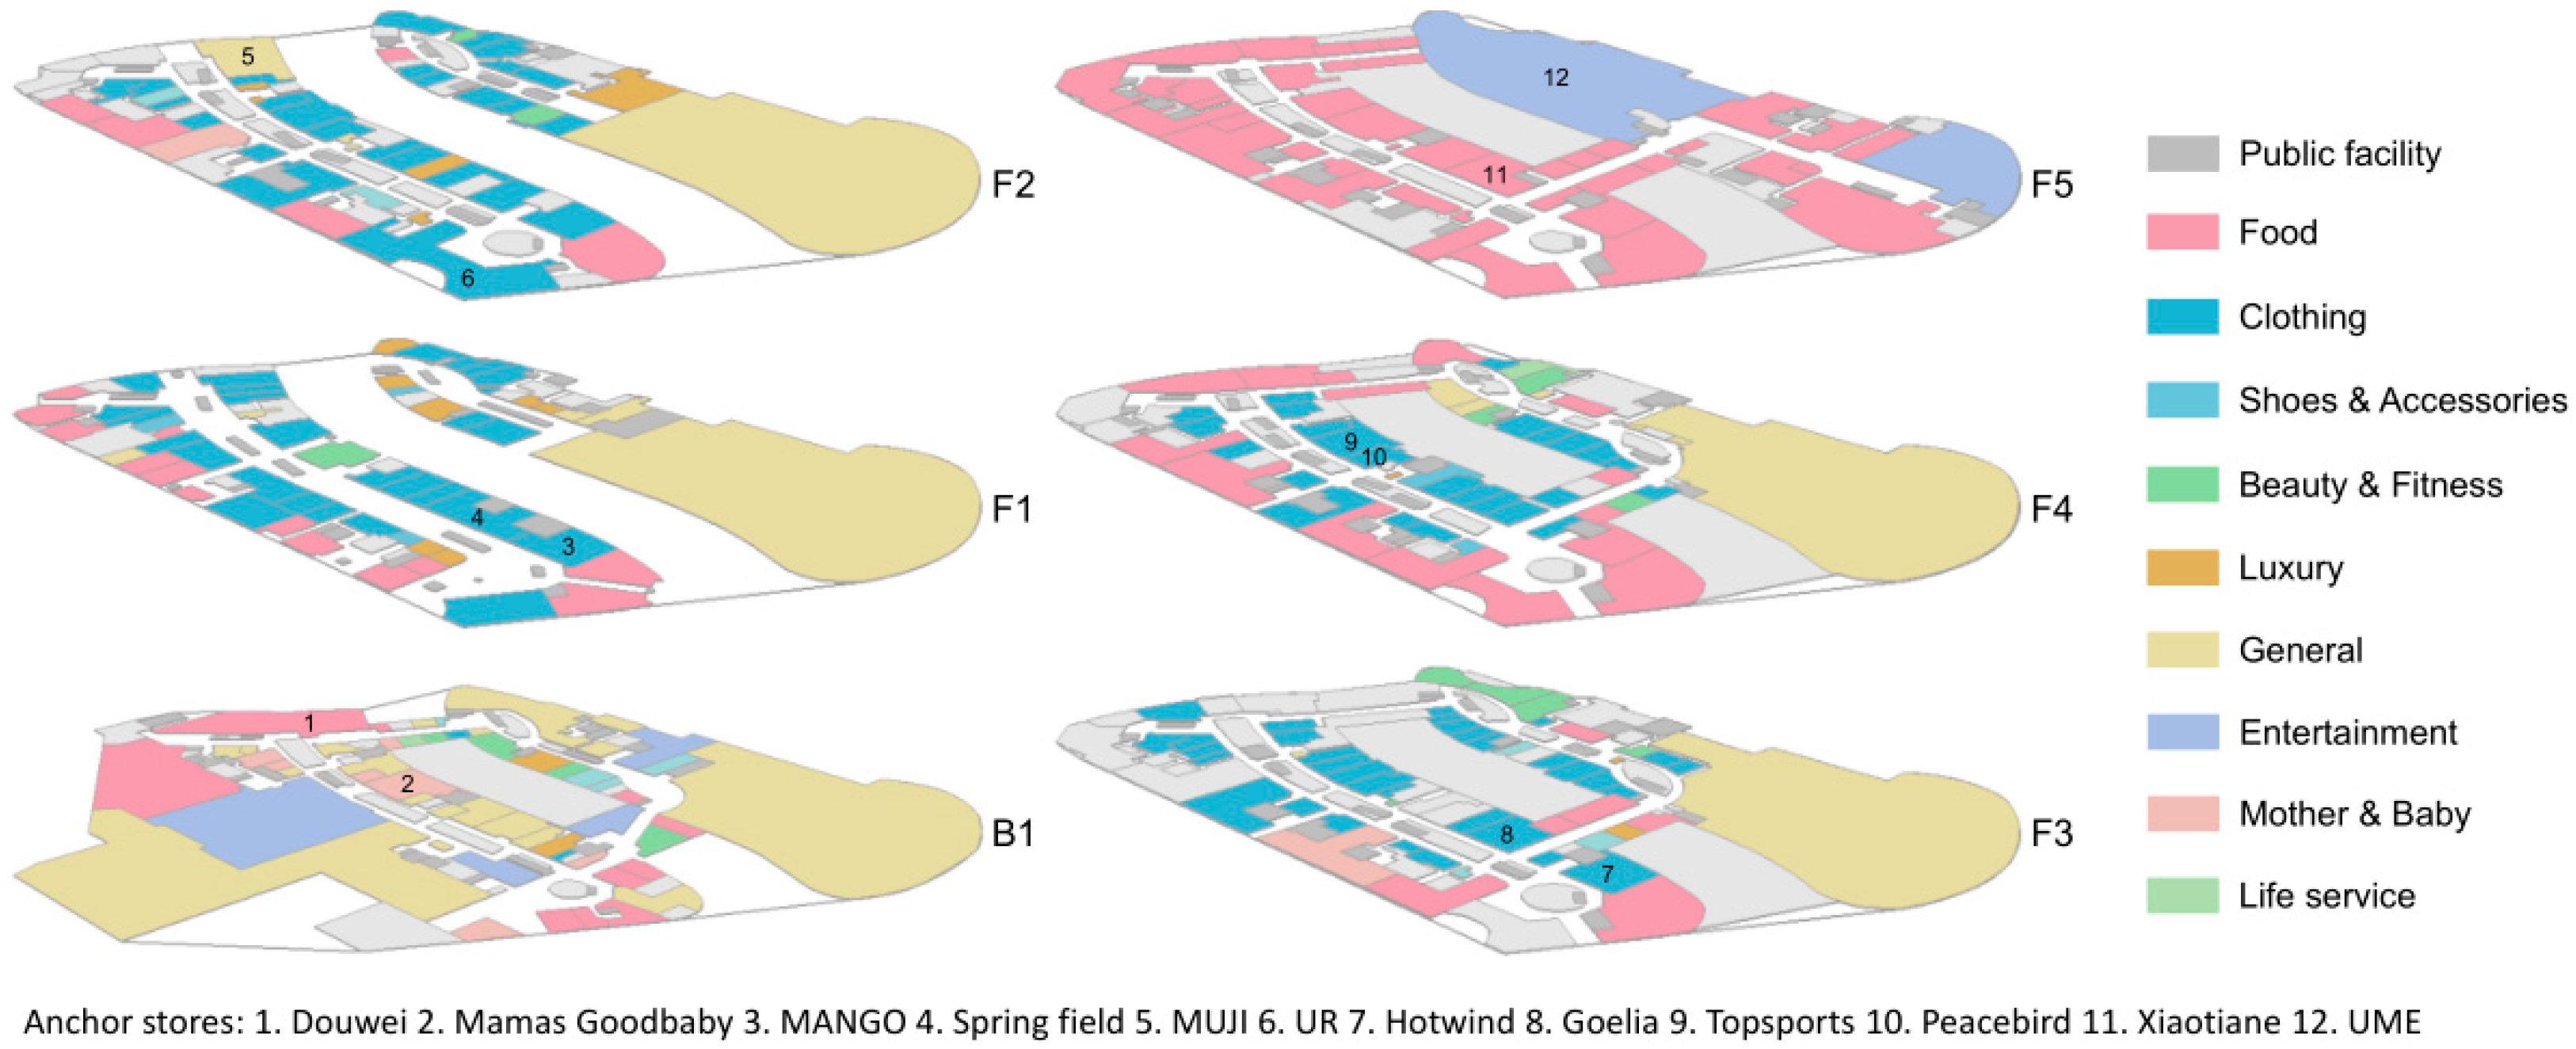
Figure 1. DYC contains 272 stores distributed on 10 floors, and the total area is 51,354 square meters. LH has 265 stores distributed on 6 floors, and the total area is 123,793 square meters. The layouts of the two shopping malls are displayed in
Figure 2 and
Figure 3.
We divided the stores into 9 classes: clothing, food, general, shoes and accessories, luxury, beauty and fitness, life service, entertainment and mother and baby. The number of stores and the total area for each class are listed in
Table 1, which show that clothing and food are the two main classes of stores in terms of number and area in both shopping malls.
We collected indoor positioning data in DYC between 11 May 2015 and 17 May 2015 and those of LH between 30 June 2014 and 06 July 2014. Each of the datasets covered one week and was chosen to avoid important holidays (i.e., Spring Festival, Labor Day and National Day) and special events for determining general patterns hidden in customer flows. The indoor positioning data were recorded by the Wi-Fi engine systems installed in both shopping malls. Due to the high coverage of mobile phones and high percentage of Wi-Fi usage in shopping malls (people usually used free Wi-Fi instead of their own mobile connections for internet surfing because cellphone traffic fees were expensive and network connection speeds were low during those periods), the customers recorded via APs made up the majority of the total web users and, furthermore, more than 50% of the total customers. As a result, we think the data collected may reflect the overall patterns of customers as a whole.
To ensure the precision of indoor positioning, the APs were installed in the shopping malls while satisfying two conditions. The first is that the Aps were deployed with a maximum distance of 10 m between each other, and the second is that in each store, at least one AP was installed. Additionally, each AP was installed under the ceiling with a metal mask to screen the signal from handsets from the floor above. The system is based on a passive indoor positioning mode, where the signal of a handset is recorded if it connects to APs. Thereby, the location of the handset carrier (i.e., the customer) can be determined via indoor positioning. Here, we used the fingerprinting method for its high positioning accuracy [
53,
54]. In short, each location in the research area has a unique combination of signal intensities received by different APs, and a handset can be located by referring to a fingerprint lookup table, where each cell is filled with a combination of signal intensities [
27,
55]. Specifically, the matching between the recorded intensities and the predefined fingerprinting lookup table can be realized via the k-Nearest Neighbor (KNN) method, Artificial Neural Network (ANN) and Support Vector Machine (SVM) [
56,
57]. Here, we used the KNN method to determine the locations. Because the fingerprint maps were generated based on the current layout of the shopping malls, the obstacles caused by the building are considered in the map and may have a small influence on the locating accuracy.
After the location was determined, we built the indoor positioning database for further analysis. In the database, each record includes six attributes: Time_stamp, MAC, Building_ID, Floor_ID, X and Y, where Time_stamp is the time stamp recorded when a positioning datum is collected, MAC is the media access control address of a mobile device (each cell phone has a unique MAC address), Building_ID is the code used to discriminate DYC from LH, Floor_ID denotes the floor number, and X and Y are the x- and y-coordinates of a location, respectively. Since the intensities recorded by the APs are not directly related to our research, we omitted them from the database for brevity. Based on in situ testing, the positioning accuracy in the two shopping malls was within 5 m, which is sufficient for determining whether a customer is in a specific store. Note that here, the 5 m accuracy referred to is the horizontal one. Due to the screening effect of the ceilings and masks, the floor where a specific handset is located can be effectively determined. The difference between two consecutive Time_stamp values is the temporal interval, which is dependent on the frequency with which a handset connects to nearby APs. In our study, the temporal interval ranged from 1 s to 20 min. In order to extract customers’ in-store visits for the analysis of customer flow, we first determined whether a location (X and Y) was inside a store or not during an interval via overlay analysis. Then, a series of stores and their durations for each customer were inferred from the locations and intervals, respectively.
Note that a “ping-pong” effect caused by signal drifting generally exists, which may cause a false appearance of a customer moving quickly between stores when in fact, he/she is still in the same store. To cope with the “ping-pong” effect, we then used the method in [
58]; specifically, a store in a series was processed if its duration was less than a threshold (in our work, we used 10 s; that is, durations less than 10 s were seen as signal drifting). After that, the visiting sequences of customers, termed as the order of stores, were generated for later computation.
Meanwhile, before exploring the customer flow patterns, the data were pre-processed to remove noise. The noise included three main types of records. The first was randomly generated MACs. That is, the MAC of the same phone is changed all the time. Fortunately, only the MACs of iPhones were randomly generated in the period during which we collected the data. To eliminate this kind of noise, we removed the MACs of iPhones, which can be identified from their signal protocols. The second was data generated by the shop assistants. A MAC is considered to be that of an assistant if it presents at least three days in the week for more than five hours each day. The third was data generated by electronic devices for sale, e.g., mobile phones and iPads. A MAC is treated as an electronic device that is on sale if it is present for more than 8 h a day and is always within the same store. These MACs were removed before further computation.
3.2. Analysis Procedure
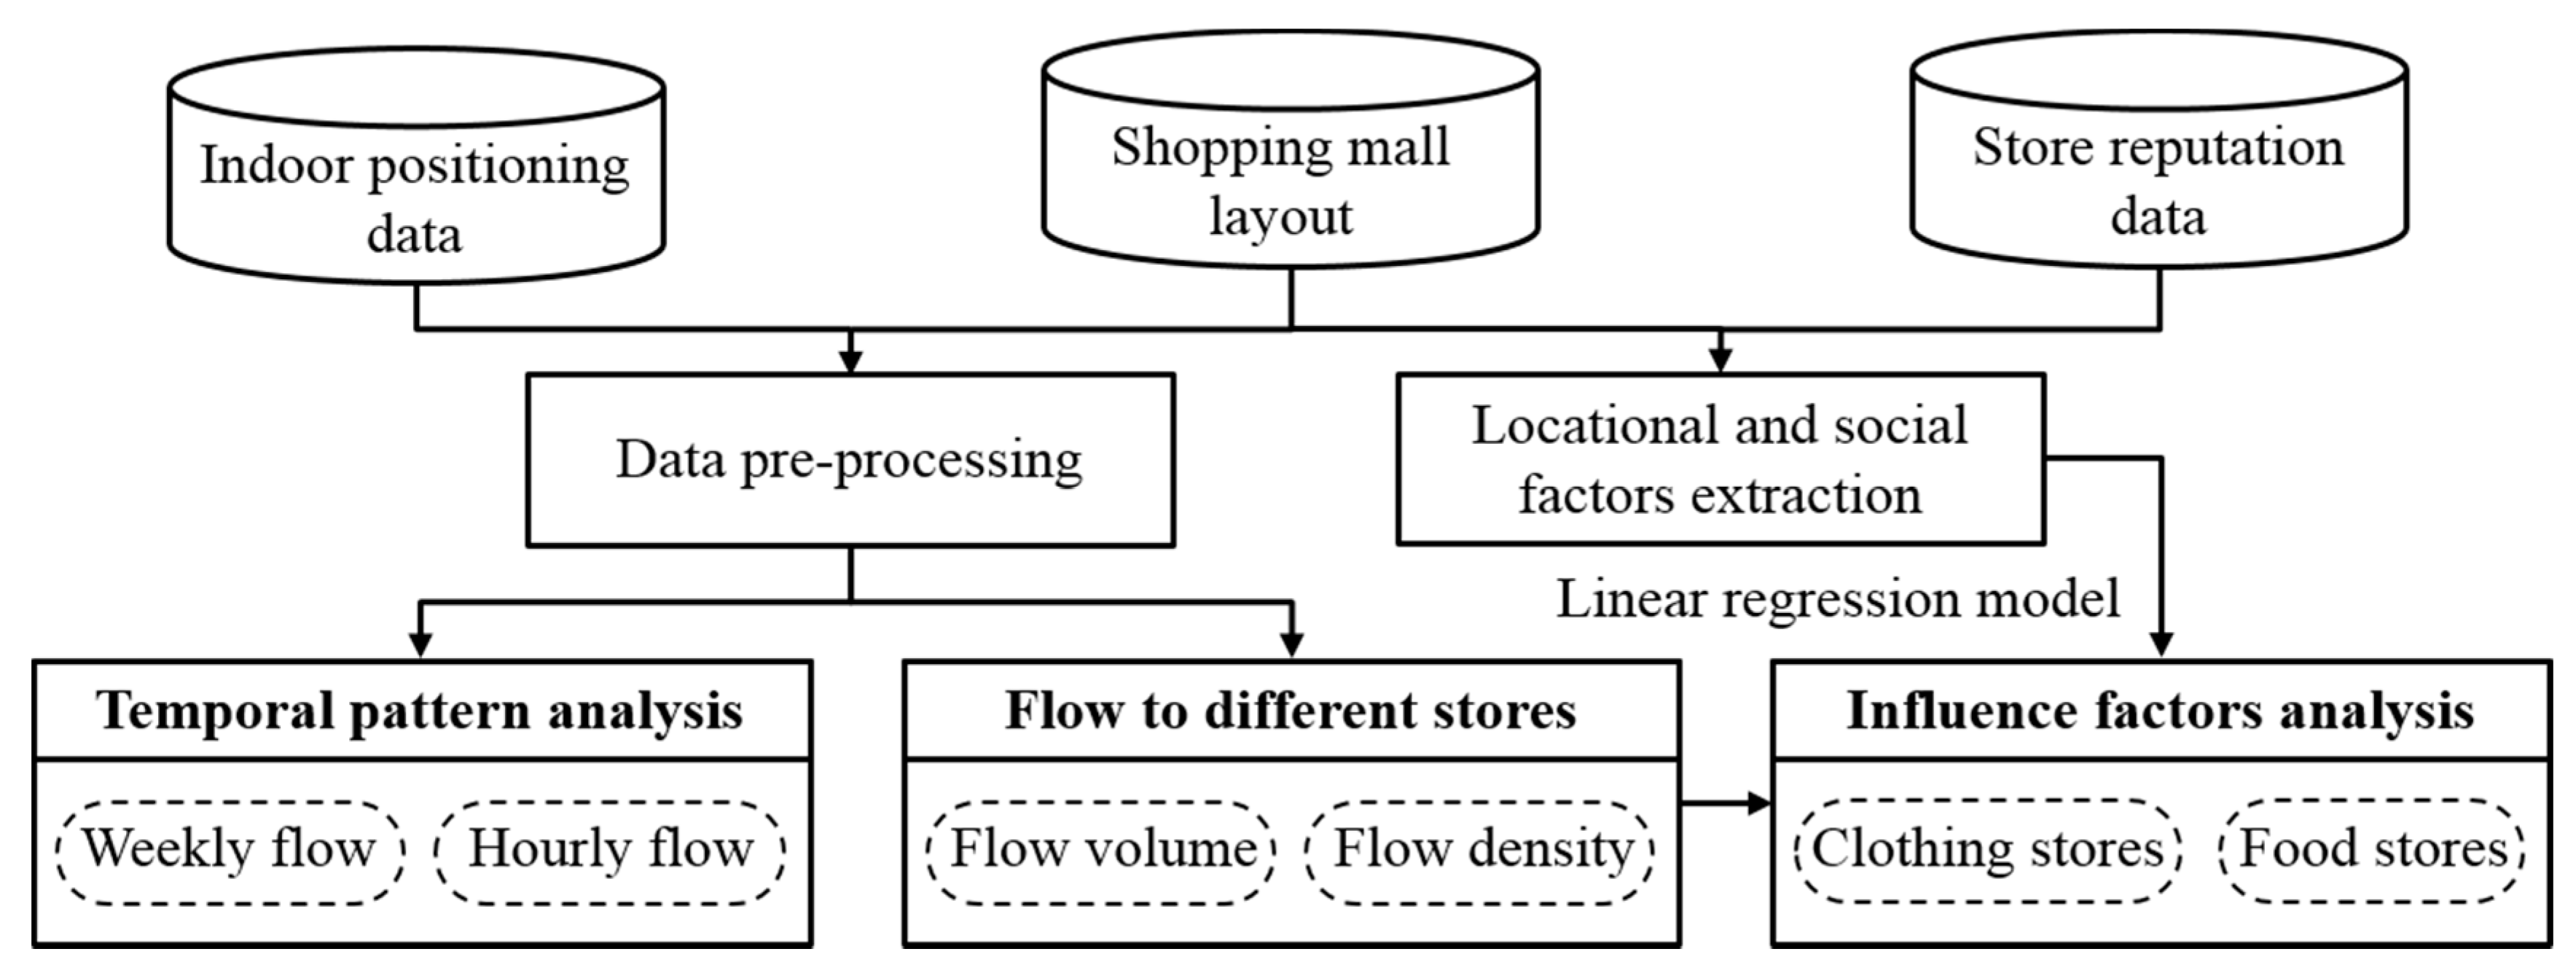
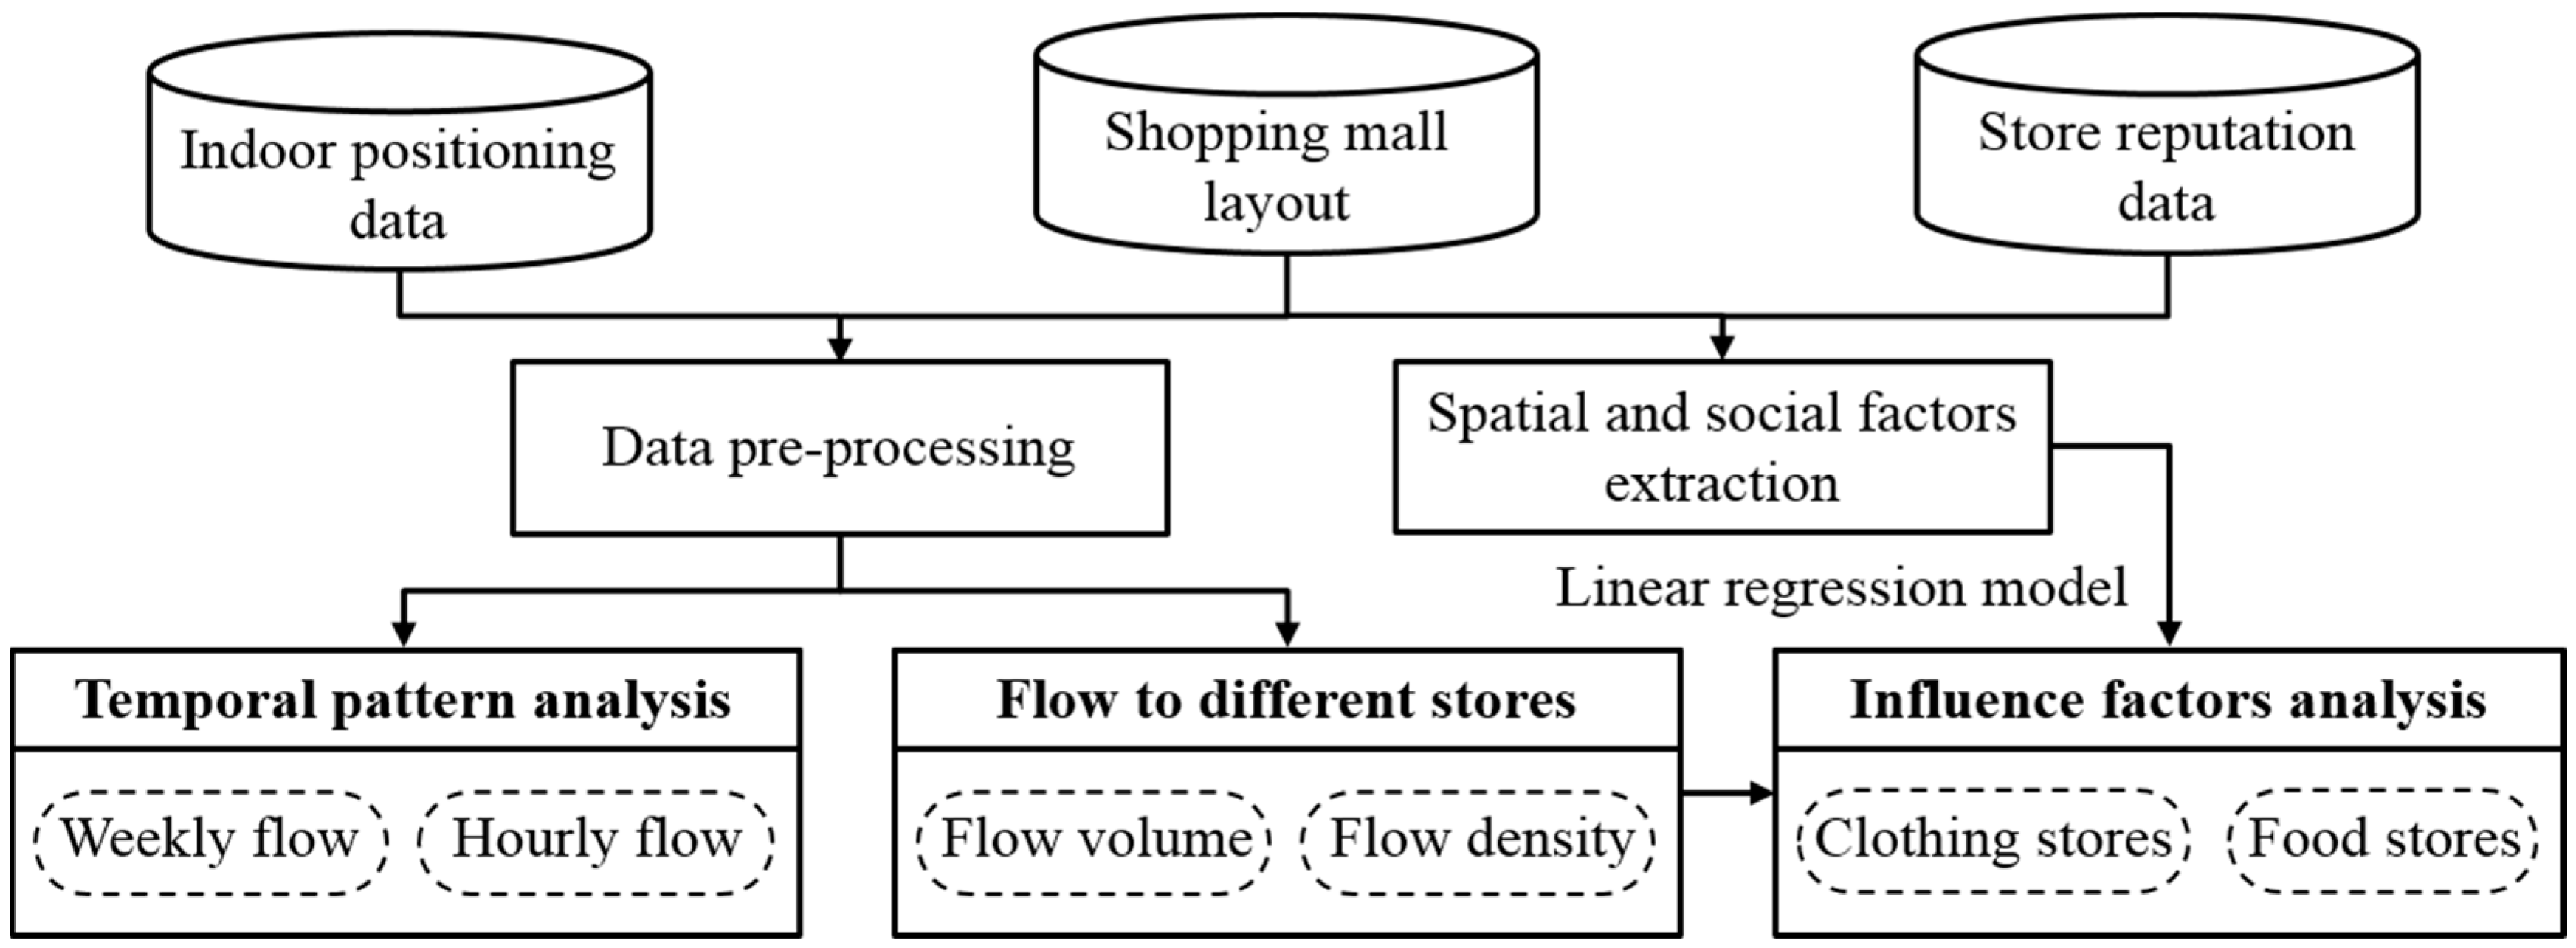
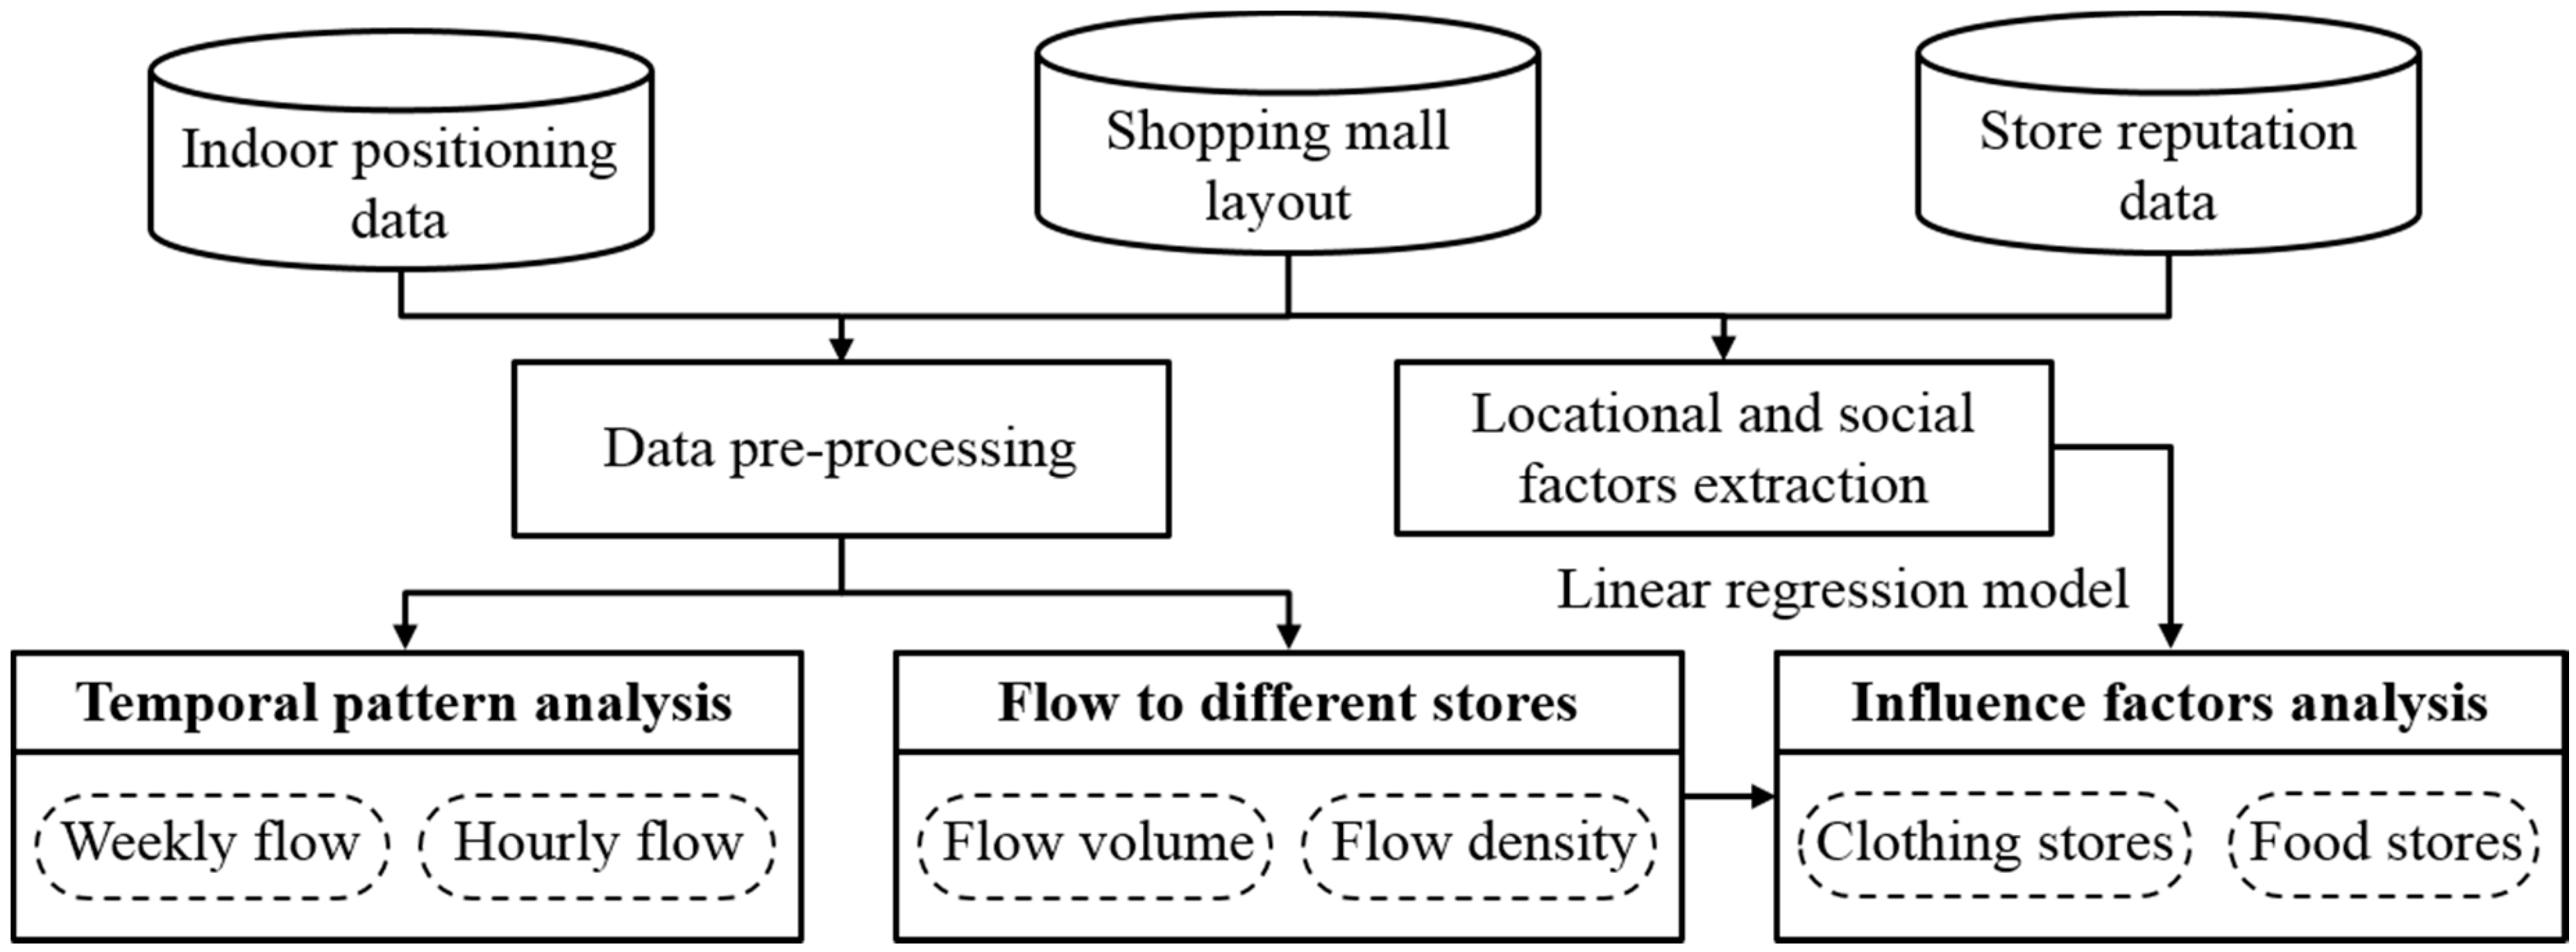
To uncover customer flow patterns and their influencing factors, the analysis procedure can be divided into three steps (
Figure 4). We first revealed temporal patterns by analyzing the overall customer flows in the two shopping malls at different temporal scales (i.e., weeks and hours). Then, we analyzed the patterns of customer flows to different stores. Finally, the influencing factors were quantified via a linear multivariable regression model, where customer flow density on the weekend was the dependent variable and the independent variables included locational and social factors.
To determine the factors that may influence customer flows to stores, we needed to choose the influencing factor first, which was based on previous research [
3,
4,
13,
14,
18,
50,
52] and online comment information (dianping.com). Here, we selected 9 factors, among which the first eight were locational variables and the last one was a social one. The locational variables were related to the shopping mall layout and included the store floor, location (1 if the store was located at the corner, otherwise, 0), area, visibility (number of sides neighboring the aisle), number of same type of store nearby (within 30 m), distance to an anchor store, distance to the nearest elevator and distance to the floor center. The social variable included the store reputation, represented by the “comment level (ranging from 1 (low) to 5 (high))” from Dianping.com (the most popular website for commenting on stores), which may significantly influence a customer’s choice. In addition, because the consumption level may influence a customer to choose food stores, besides the stated nine factors for clothing stores, we added “average consumption per person” to the regression function for food stores. Average consumption per person means the amount of consumption per person for customers along with the “comment level” on “Dianping.com”.
Note that anchor stores are those that not only attract large customer flows to themselves but also bring many customers to other stores. Anchor stores usually have high fame and large areas and are seen as shopping destinations [
59]. In our paper, the anchor stores were selected according to two criteria. The first was high total connectivity (
Ci), which is defined as follows:
where
SCij is the link connectivity between stores
i and
j, defined as follows:
where
tij is the total number of customers who both visited stores
i and
j in one shopping trip,
N is the number of stores, and
i≠
j. The range of
SCij is from 0 to 1, and a value of 1 represents the strongest association between the two stores; therefore,
Ci can be seen as the summation of the strengths of association between
i and other stores. The second was the area. The anchor stores were then determined by selecting the two largest stores among the top 5 stores in terms of the total connectivity on each floor.
Although there are 8 and 9 classes of stores in DYC and LH, respectively, we considered only clothing and food stores for factor detection because (1) these two classes of stores dominate both shopping malls, accounting for 43.7% and 25.9% of the stores in DYC and 44.91% and 39.62% of the stores in LH, respectively, and (2) the customer flows to these two classes of stores also rank first and second.
4. Results
4.1. Temporal Pattern of Customer Flow
4.1.1. Weekly Customer Flow
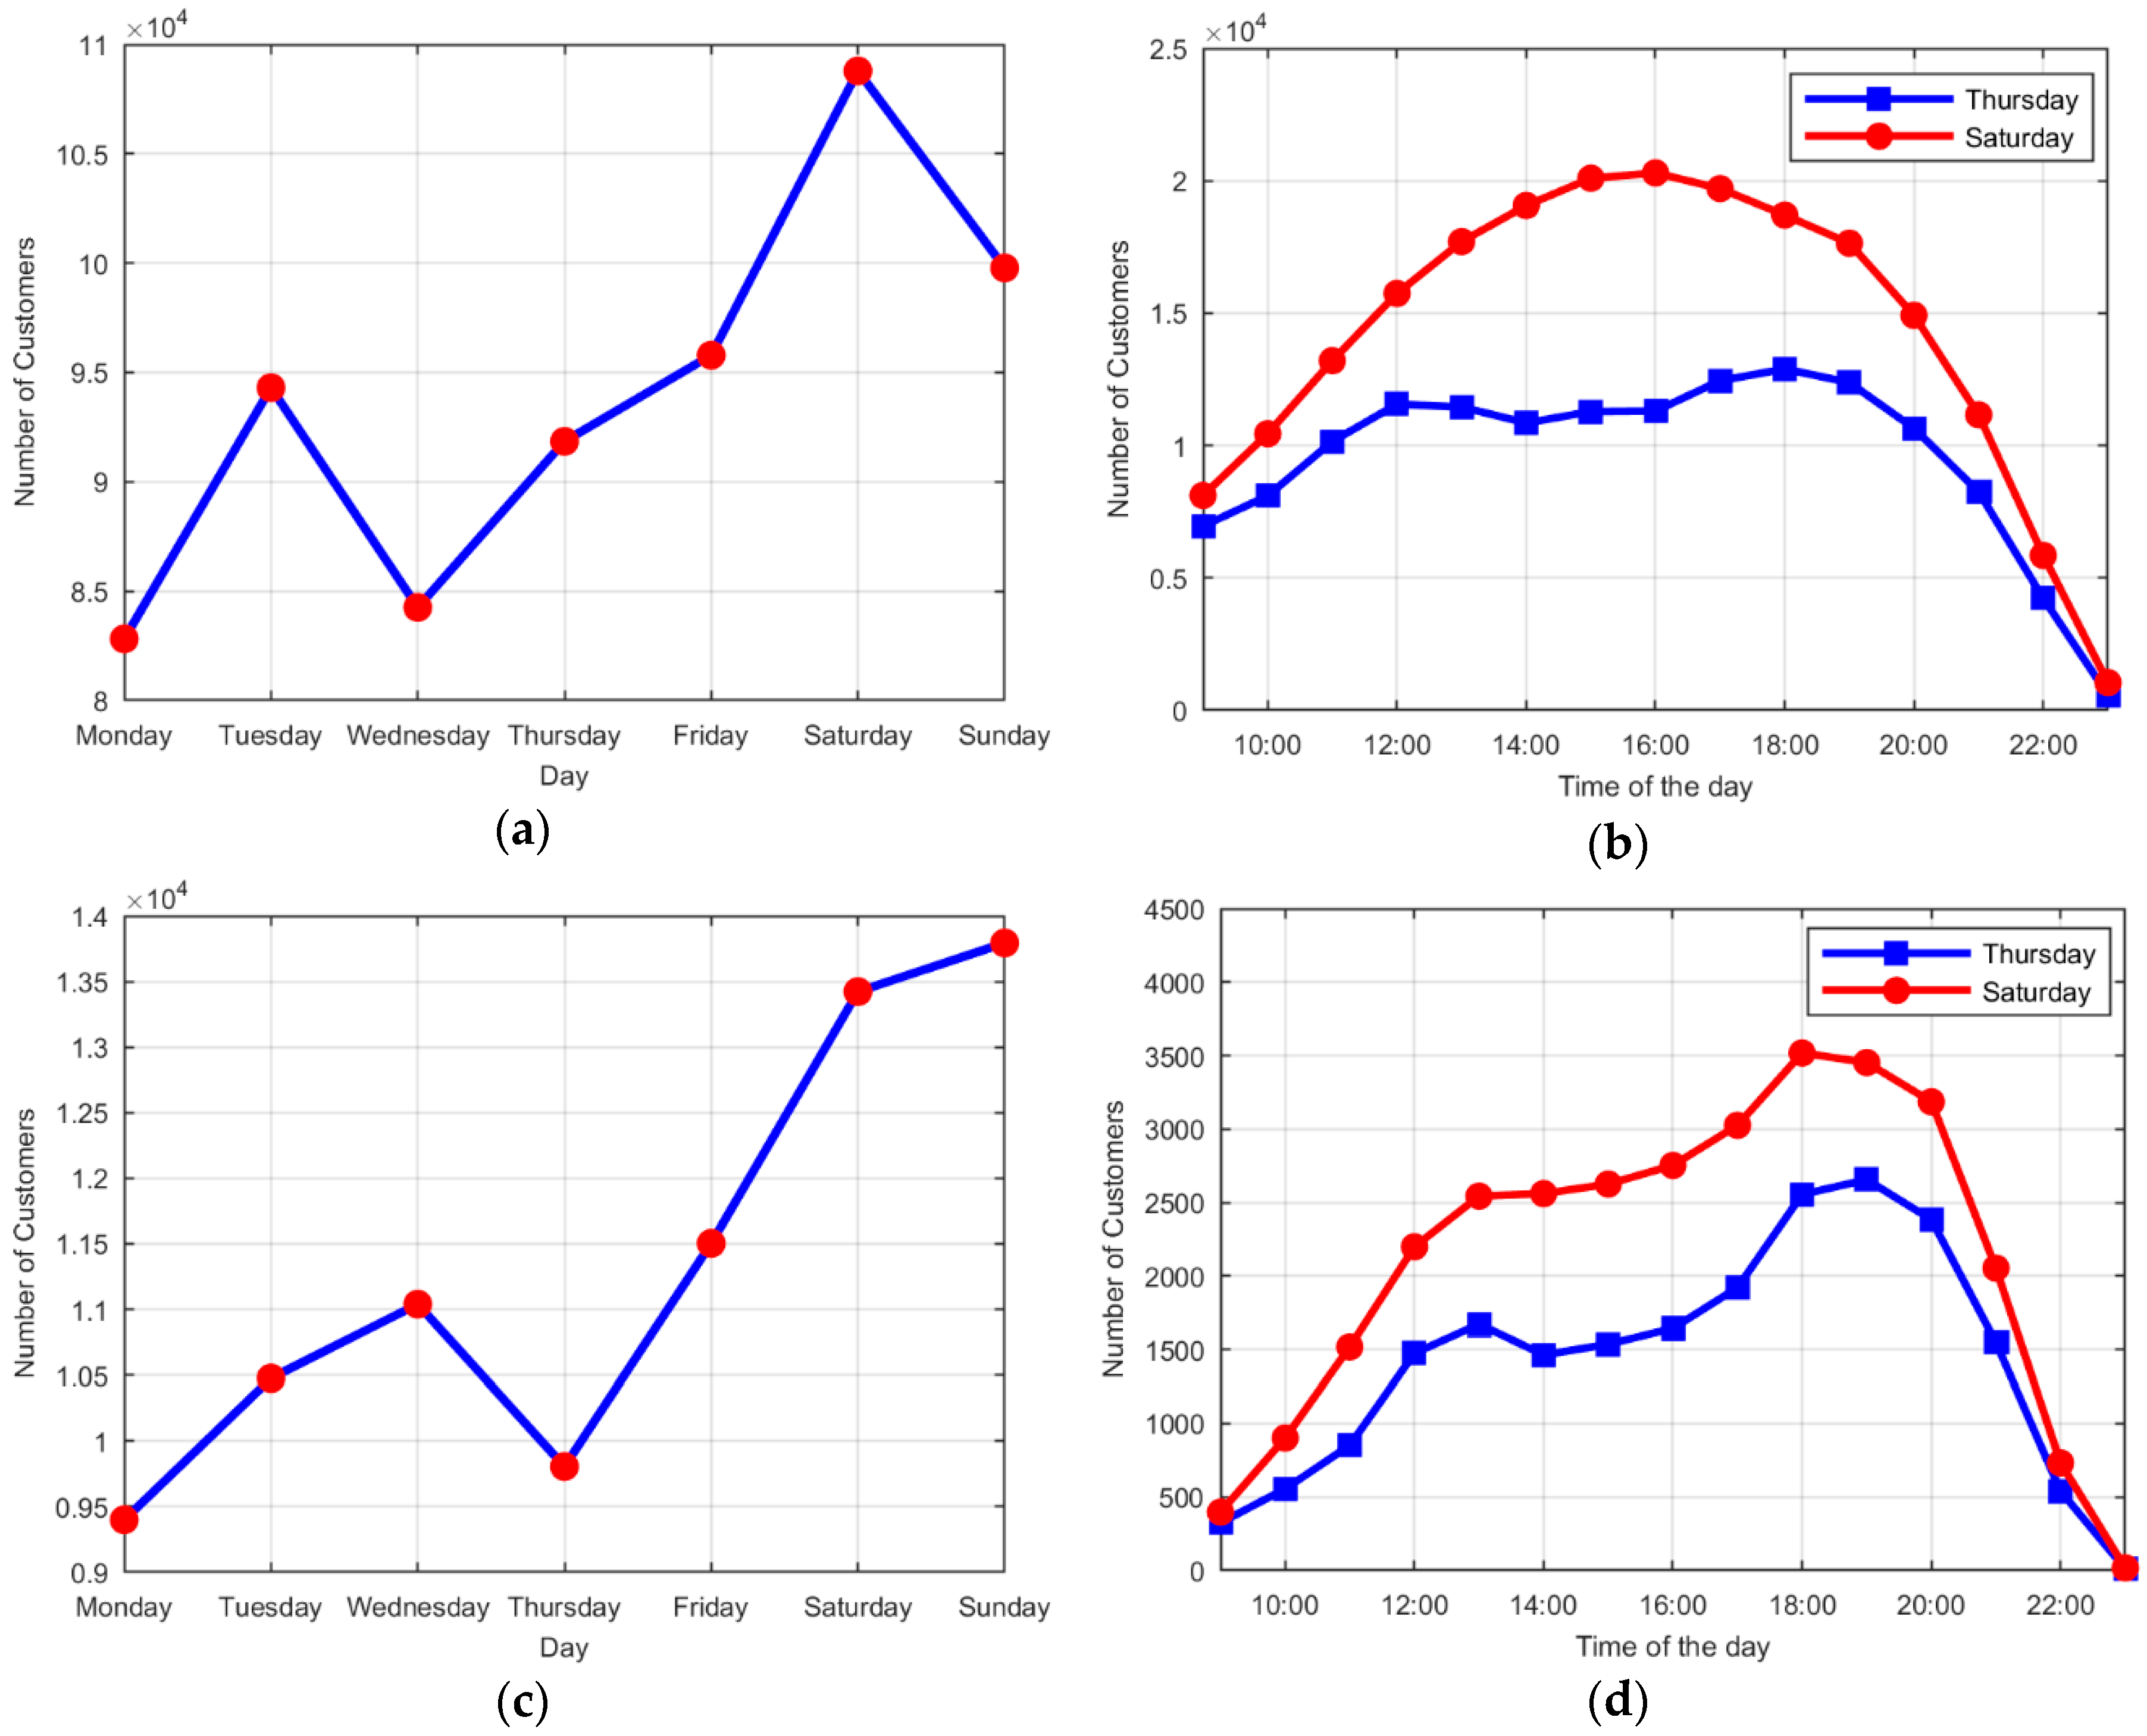
Figure 5a displays the weekly flows in DYC. Saturday shows a peak, while Monday and Wednesday appear as valleys. The weekly flows of LH are shown in
Figure 5c. Although the total number of customers is much smaller than that of DYC, the weekly flow shows a pattern similar to that of DYC, except for a slight difference. Specifically, the peak for LH is on Sunday, and the valleys are on Monday and Thursday. The weekend peaks and Monday valleys are unsurprising, and the reason for the midweek valley might be that customers transfer soft purchase demand (do not have to buy immediately) to the weekend. In addition, the average staying time of customers in DYC on Thursday is 3774 s, and that on Saturday is 4395 s. By contrast, those of LH are 5625 and 6243 s on Thursday and Saturday, respectively, both of which are longer than those of DYC, indicating a difference in the rhythm of life between the two cities.
4.1.2. Hourly Customer Flow
To analyze the hourly customer flow, we choose Thursday for weekdays and Saturday for the weekend. Because Friday and Monday are close to weekends, the customer purchase behavior may be different from ordinary weekdays. As a result, we excluded Monday and Friday and chose Thursday. Regarding the weekend, we thought the data of Saturday could better represent the purchase behavior in leisure time since customers do not need to work the next day. For this reason, we chose Saturday. The hourly customer flows for DYC and LH are displayed in
Figure 5b,d, where the red curve represents the customer flow on Saturday and the blue represents the flow on Thursday. In
Figure 5b, the flow on Saturday, which is much greater than that on Thursday throughout the entire day, is displayed as an arched curve, with a maximum reached at 15:00. The curve on Thursday shows two shallow peaks located at 12:00 and 18:00. In contrast to those of DYC, both curves for LH demonstrate an “M” shape in
Figure 5d, with that on Thursday being more significant. Specifically, the left peak is between 12:00 and 13:00, and the right peak is between 18:00 and 20:00, both of which correspond to mealtimes. These two figures present two interesting characteristics. First, the mealtime-related peaks on Thursday are more obvious than those on Saturday for both shopping malls, which indicates that customers visiting the shopping malls on Thursday are more likely to visit during lunch time or after work. Second, the curves for LH are more mealtime-dependent, indicating that customers of LH are likely to choose to visit at mealtimes, whereas those of DYC are not.
The differences above can be attributed to two reasons. One is the city style. Chongqing is a southwestern city in China, and its economic status and consumption level cannot compete with those of Beijing. As a result, Chongqing citizens have a slower rhythm of life than that of Beijing citizens. Moreover, the shopping malls are located in different urban zones. DYC is in the central business area, and the function of the mall is high-end consumption. In addition, tourism may also play a role in the hourly flow pattern of DYC. LH is located close to the inner city, and the function is more leisurely, with a combination of food, entertainment and purchasing. These two reasons may explain why the temporal curve is more mealtime-dependent for LH than for DYC.
4.2. Customer Flows to Different Stores
4.2.1. Statistics of Customer Flows
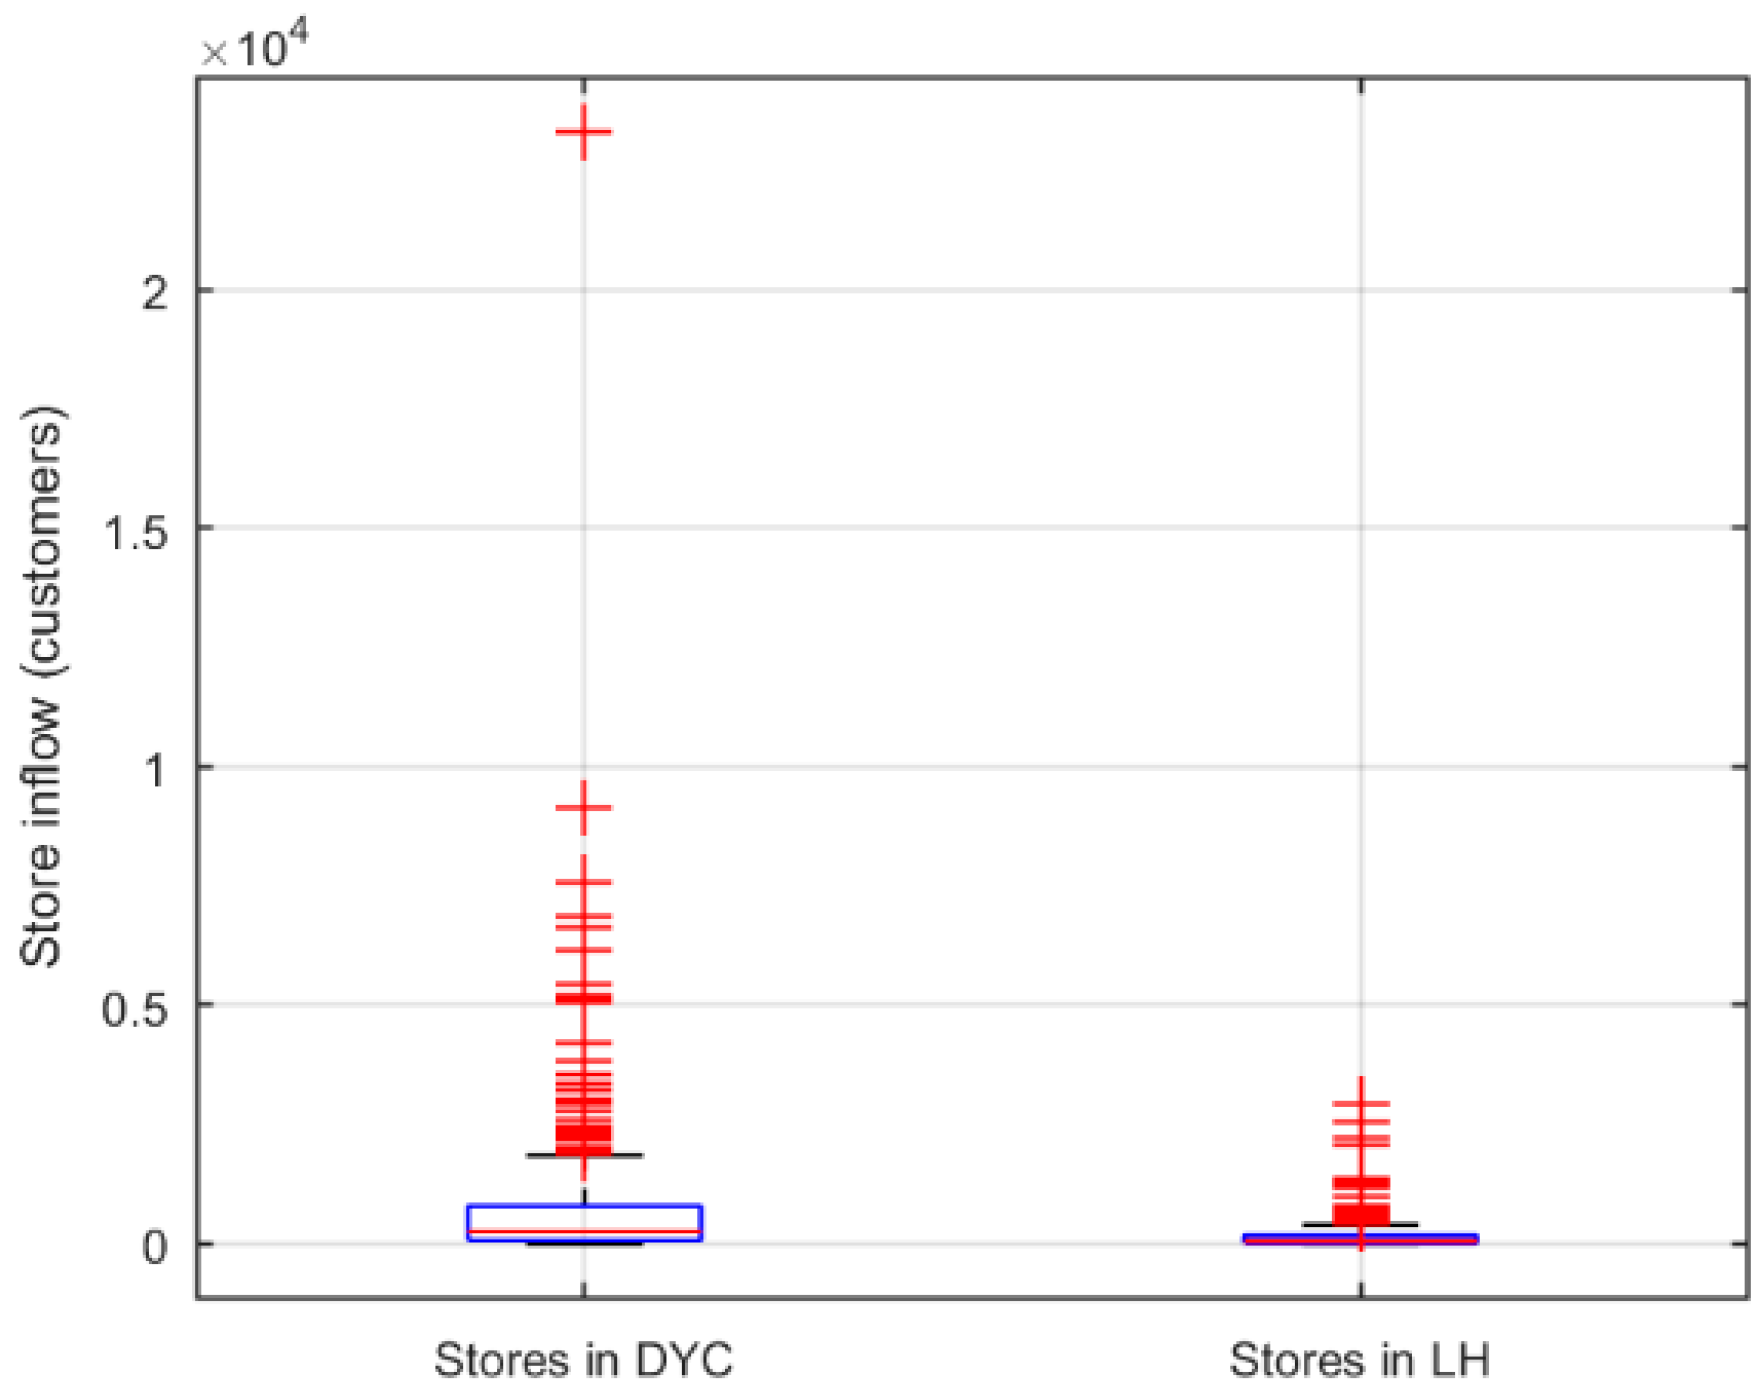
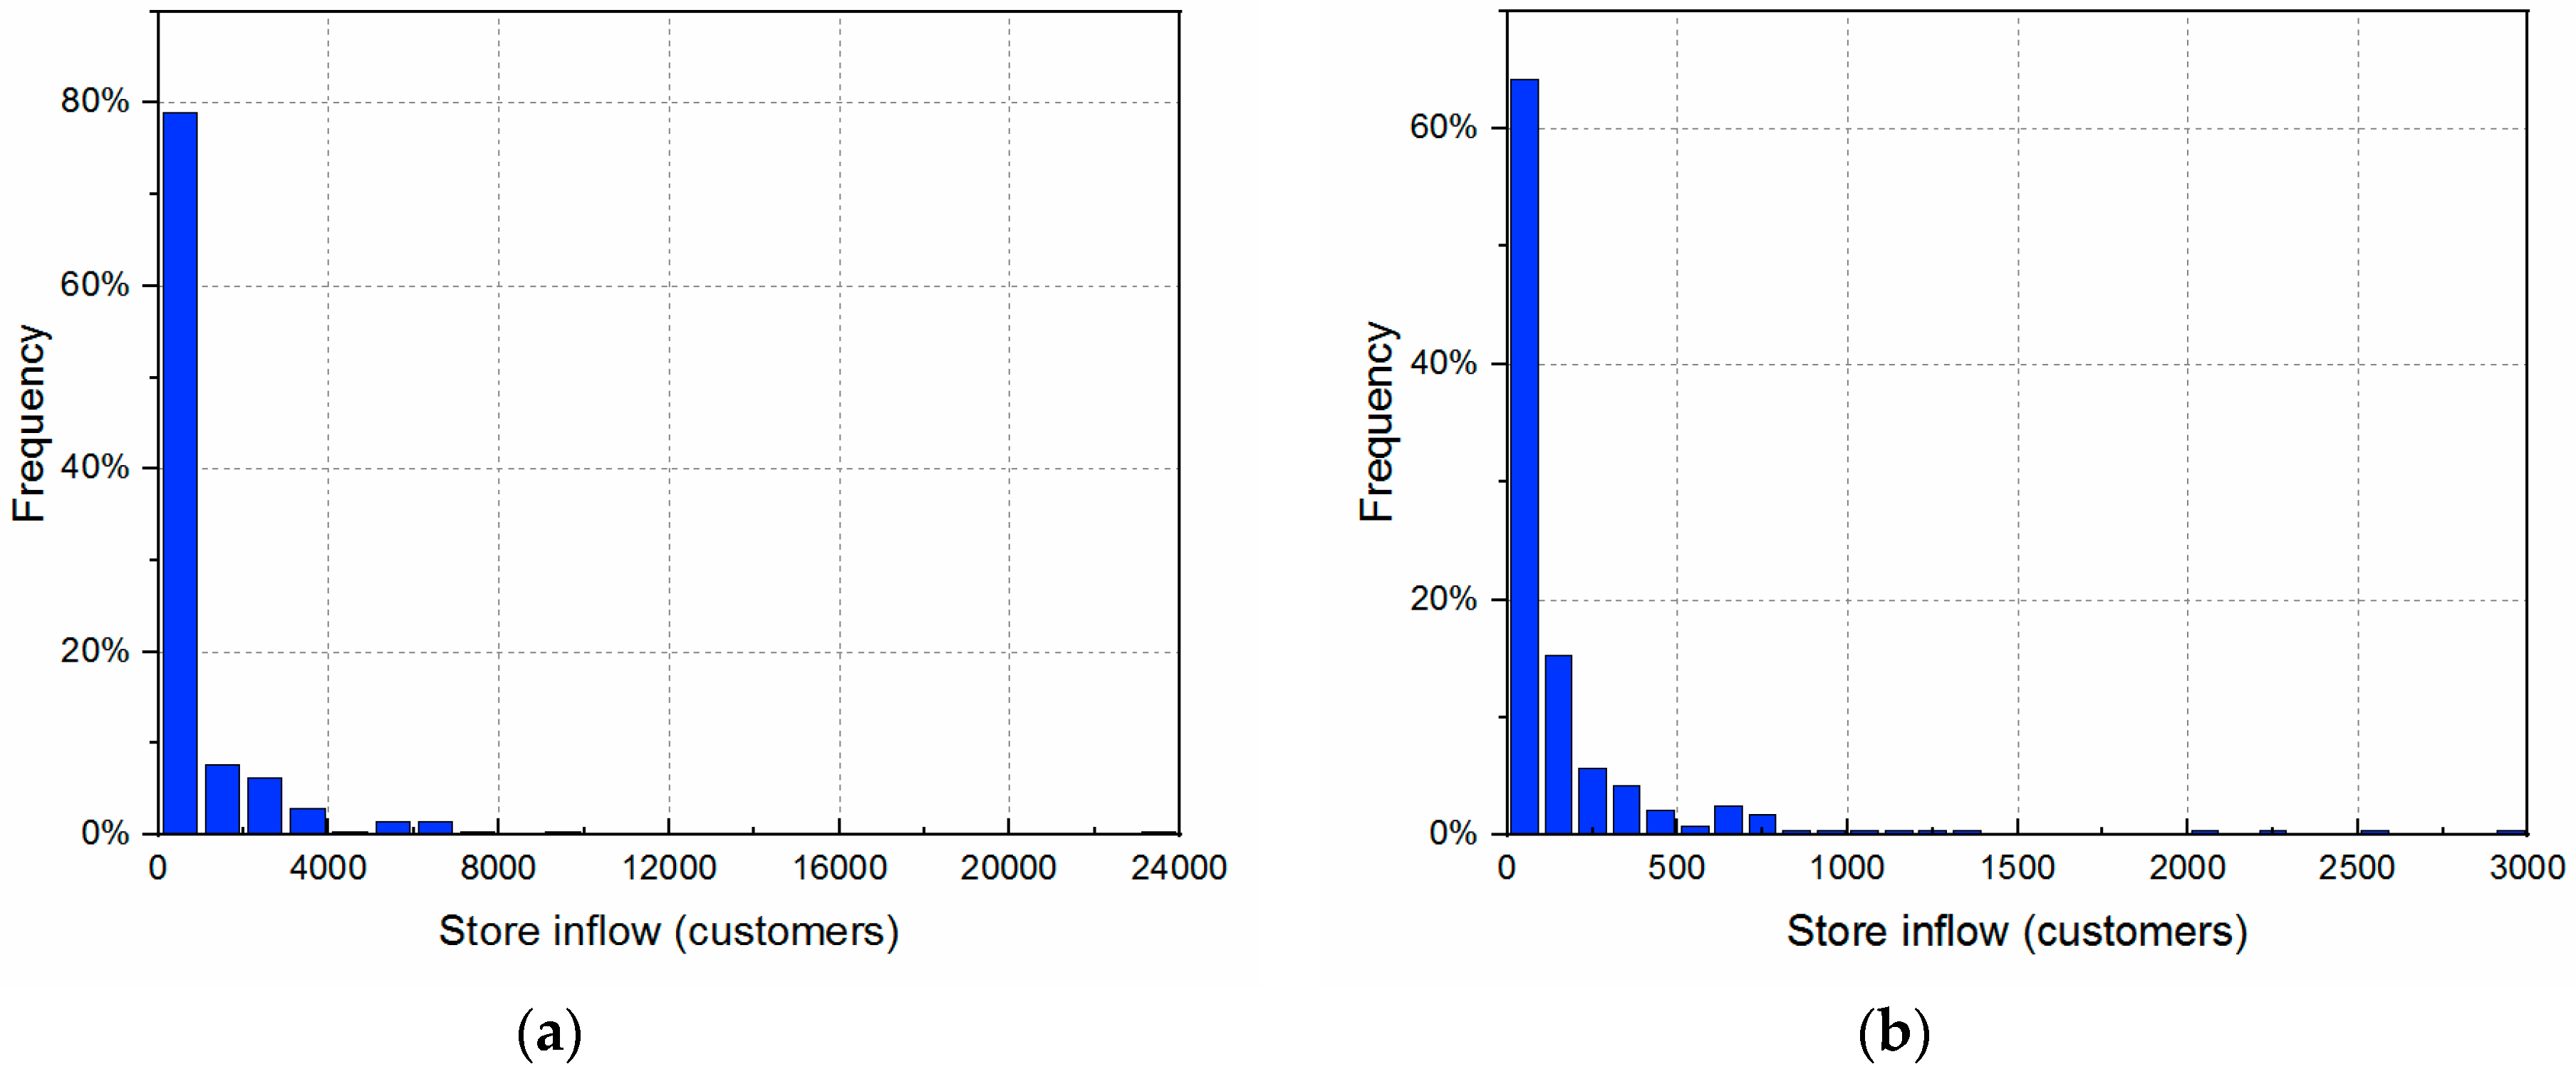
The store inflow was calculated as the number of customers visiting each store averaged over the studied week. The boxplots and histograms of the store inflows of the two shopping malls are displayed in
Figure 6 and
Figure 7, respectively. The mean store inflow for DYC was 885.95, and that of LH was 170.81, while the variance of DYC was larger than that of LH. The histograms in
Figure 7 show that the probability distributions for both shopping malls decrease exponentially as the store inflow increases. The statistics of customer flows to different classes for DYC on Thursday and Saturday are listed in
Table 2, and those for LH are listed in
Table 3.
Table 2 shows that more than 60% of the customer flow to stores in DYC is contributed by clothing stores, and the contribution by food is between 16 and 18% on both days. In LH, we found a different phenomenon: approximately 50% of the customer flow to stores is for food, and only 15–17% is for clothing stores, on both days. The general category accounts for the third-greatest flow in both shopping malls on both days. Apart from the first three classes, the total proportions of customer flows for the other classes are less than 20% in both shopping malls. The ranks of the other classes differ between the two malls, except beauty and fitness and life service, but are almost the same between the two days, except beauty and fitness and luxury in DYC, and beauty and fitness and mother and baby in LH. We also found that the proportion of flows to clothing and food stores in DYC decreases on weekends. The same phenomenon is also observed for food in LH.
To measure the popularity of a specific store, we calculated the average customer flow to each store per day of the week (i.e., the store inflow density, defined as the number of customers visiting a store in a whole day, divided by the area of the store). The top 10 stores in both shopping malls are listed in
Table 4. In DYC, there are five clothing stores, three food stores, one general store and one shoes and accessories store, while in LH, there are five food stores, three general stores and two entertainment stores. Interestingly, although the customer flow to clothing stores ranks second in LH, there is no clothing store in the top 10 list.
The customer flows of the different classes and top 10 stores show that more customers visit DYC for clothing stores, whereas more customers visit LH for meals, which conforms to the results of the hourly flows (
Figure 5). The difference in customer flow can be attributed to the different functions of the two shopping malls. LH is located on the outskirts of a city with a slower rhythm of life, and the goal of shopping might be to enjoy the act of consumption, which results in the highest flow to food stores. By contrast, DYC is located in the center of a megacity that has a high level of consumption and contains more clothing stores of famous brands; the goal of shopping in this case may be to quickly purchase a famous brand. This can also explain why DYC demonstrates a higher proportion of customer flows for clothing compared to LH.
4.2.2. Customer Flow Density
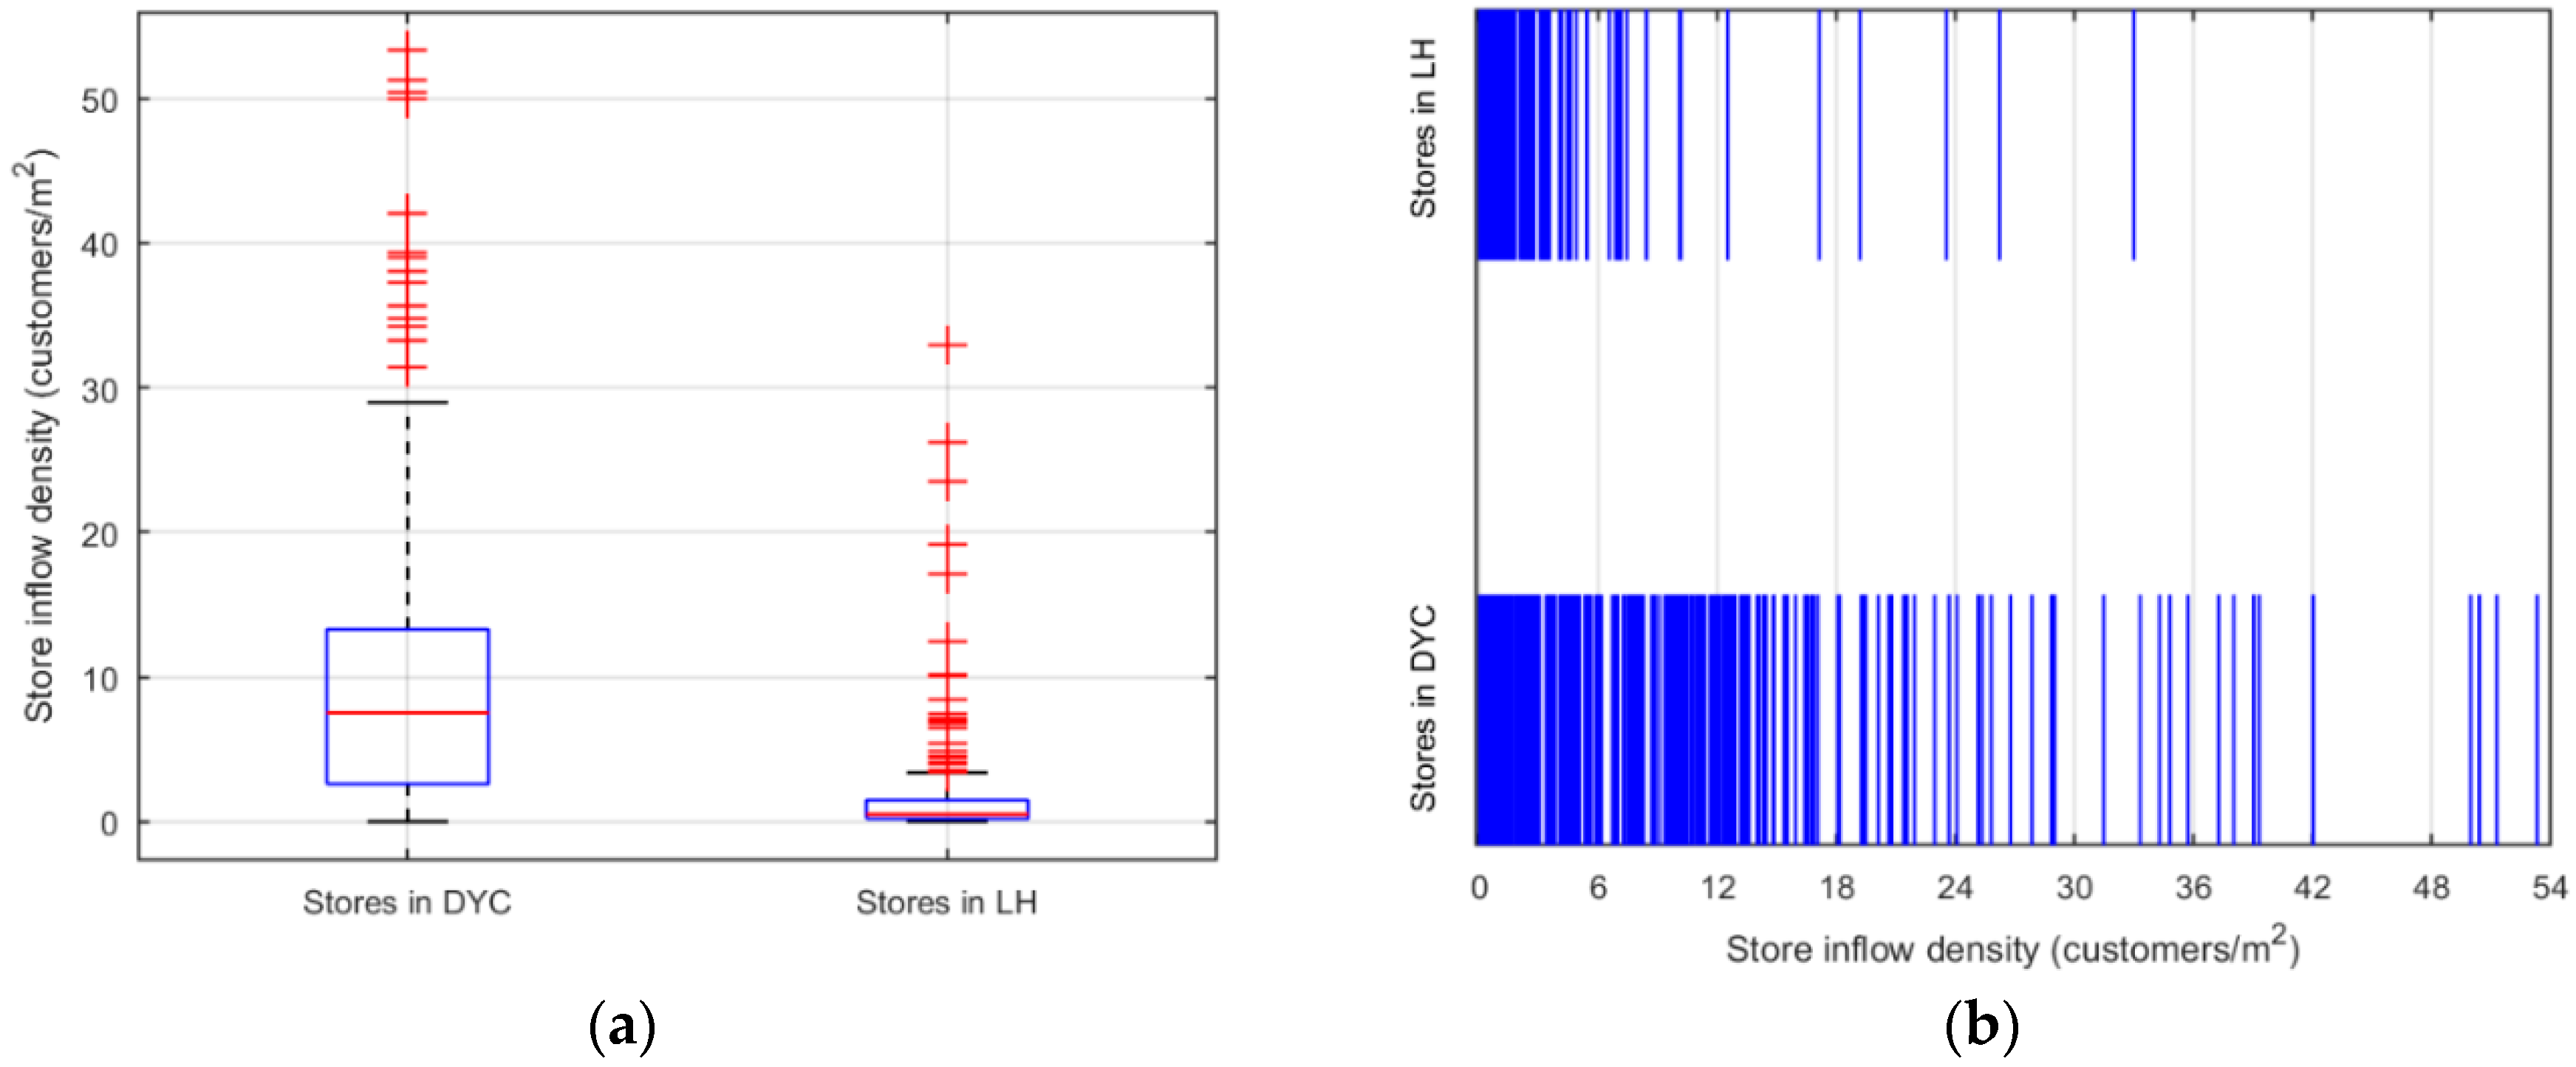
The boxplot and rugplot of the store inflow density are shown in
Figure 8a,b, respectively. We found that the store inflow densities in DYC are larger than those in LH as a whole, while the variance in DYC is also larger. The rugplots demonstrate that the store inflow density is not evenly distributed along the x-axis but concentrated at the low-value end. Histograms of the store inflow density are displayed in
Figure 9 for both shopping malls. The x-axis indicates the store inflow density, and the y-axis, the proportion of the stores. The proportion of the stores decreases as the store inflow density increases. The disagreement between flow and flow density is also observed for different classes (see
Table 2 (DYC) and
Table 3 (LH)). On Thursday, the top three flow densities are for clothing, shoes and accessories, and luxury, whereas on Saturday, the order changes to shoes and accessories, clothing and beauty, and fitness in DYC. In LH, we observe a different picture. On Thursday, the top three are food, shoes and accessories, and life service, whereas on Saturday, they are mother and baby, food, and shoes and accessories. We also note that in terms of the top ten stores (
Table 4), the order of the flow density is quite different from that of the customer flow, even in the same class. The difference in flow density between classes may be due to intrinsic characteristics. For instance, those classes with few stores (e.g., entertainment and life service; see
Table 1) may be strongly dependent on their functions, while some classes of stores may be influenced by market prices (e.g., gold stores of luxury). As a result, analyzing the reasons for the differences of flow density between different classes is outside the scope of this paper. However, a difference between stores of the same class may indeed indicate factors influencing customer flows, which are analyzed below.
4.3. Influencing Factors for Customer Flow Density
To quantify the influencing factors for customer flows to stores, we employed a linear multivariable regression model, where the customer inflow density is the dependent variable and nine/ten factors mentioned in “
Section 3.2” are the independent variables for clothing/food stores, respectively (
Table 5). Except social factors (i.e., comment levels and average consumption per person, obtained from the Internet), all the locational factors were computed based on the layout maps of the two shopping malls. Note that the anchor stores, included in the independent variable “distance to anchor store” and detected using Equations (1) and (2), in the two shopping malls are listed in
Table 6. We performed the regression analyses separately for the two shopping malls. The results of four regression analysis functions, i.e., DYC–clothing, DYC–food, LH–clothing and LH–food, are shown in
Table 5.
Overall, store inflow density can be explained to a large extent by the independent factors since all the functions show high R2 (the lowest is larger than 0.4). The regression results indicate that store inflow density is significantly influenced by location and comment level, all of which show significance at the 0.1 level or below. In addition, another factor that influences most stores is visibility, with the exception of food stores in DYC. Interestingly, the factor of area has an insignificant influence on flow density for all stores. The significant factors are different for the four functions, which are described below.
As for clothing stores in DYC, we identified seven significant variables, i.e., the floor, location, visibility, number of same type of store nearby, distance to an anchor store, distance to an elevator and comment level. Among these variables, the floor, location, visibility and comment level are positively related to the store inflow density, whereas the number of the same class of stores nearby, distance to an anchor store and distance to an elevator are negatively related. For food stores in DYC, they have few significant influencing factors. Only the location and comment level are significantly related to the store inflow density.
As for LH, five variables are significant for clothing stores, specifically, the location, visibility, distance to an elevator, distance to the floor center and comment level. Among them, the location, visibility and comment level are positively related to the store inflow density, which indicates a positive influence on attracting customer flow. By contrast, the distance to the elevator and distance to the floor center are negatively related to flow density. For food stores, four variables are significantly related to the store flow density: the location, visibility and comment level are positively related to customer flow, while average consumption per person has a negative influence.
A comparison between DYC and LH demonstrates that the clothing stores in both shopping malls are significantly sensitive to the location, visibility, distance to an elevator and comment level. The difference is that the clothing stores in DYC are affected by more factors including the floor, the distance to an anchor store and the number of the same class of stores nearby, while the stores in LH are influenced more intensely by the distance to the floor center. Regarding food stores, both shopping malls are affected by the average consumption per person and visibility. The difference is that food stores in LH are significantly affected by visibility.
Compared to food stores, the clothing stores in both shopping malls are affected by more factors related to location and convenience; specifically, the common additional factors for clothing stores in both shopping malls are visibility and distance to an elevator. Different shopping malls display different influential factors for clothing stores; in DYC, they are the floor, number of same class of stores nearby and distance to an anchor store, while in LH, the factor is the distance to the floor center.
5. Discussion
In this section, we discuss the factors that significantly influence the store inflow density based on the analysis of two shopping malls. First, all stores are influenced by the location and comment level, which can be explained by the basic laws of business for attracting customers. Regarding location, an important truth always holds; that is, a better location has a positive effect of attracting customers. The comment level can be seen as the public reputation, which is always an important factor for attracting customers. In the network era, information online may influence offline stores, which indicates that the relationship between virtual and real spaces cannot be ignored.
Second, the difference in customer flow between clothing and food stores is significant. Clothing stores have more significant factors related to not only location but also convenience because the behavior of buying clothing is associated with greater uncertainty than that of having meals; in other words, most customers compare more stores before making a decision when buying clothing. As a result, a better location, for example, near the floor center or the elevator, may make it easier to attract customers. By contrast, restaurant customers appear to be more determined such that customer flows have a weak relationship with the factors associated with convenience in both shopping malls.
Third, apart from the differences between store classes, a discrepancy between DYC and LH is also clear. As mentioned in “
Section 3.1”, LH is more than twice the area of DYC, and LH is shaped like a belt and is composed of two parts (
Figure 3), while DYC is shaped like a square (
Figure 2), all of which may influence the customers’ choice of stores. Regarding clothing stores, the customer flows to clothing stores are related to both the distance to the floor center and distance to an elevator in LH, whereas the flows to clothing stores show a nonsignificant relationship with the distance to the floor center in DYC. This is because the large area of LH may make customers choose reachable stores (such as those near the center or elevator), while in DYC, customers can visit more stores even not close to the center. In addition, DYC has more powerful anchor stores than LH, as indicated by the total connectivity values (The average total connectivity of the anchor stores in DYC is 4.42, and that of the anchor stores in LH is 3.87. Remember that the anchor stores were selected based on their total connectivity and their areas.). Therefore, the customer flows to clothing stores in DYC are related to the distance to the anchor stores, which may distribute more customers to other stores. The difference in the food stores between the two shopping malls is that in LH, the food stores are scattered on different floors, so they are more sensitive to visibility. By contrast, the food stores in DYC are concentrated on F6, F7 and F8, so they are less sensitive to visibility. Another difference is that the average consumption per person has a significant influence on food stores in LH, possibly because of the low consumption power in Chongqing compared to that in Beijing.
6. Conclusions
The patterns of customer flows in DYC and LH in terms of the overall malls, store classes and stores were analyzed in this paper. Regarding the overall customer flows, we found that at the week level, higher customer flows appear on the weekend, while lower flows are observed on Monday and midweek. The hourly flows in LH are strongly related to mealtimes, while in DYC, the flow is weakly related to mealtimes only on weekdays. Regarding the customer flows for different classes, clothing and food stores attract the greatest customer flows in DYC, while in LH, the order is food and clothing stores. The difference can be explained by the functions of the shopping malls and the local consumption levels, which may be dependent on the locations of the shopping malls. Regarding the customer flows to stores, the highest flow is observed for internationally famous clothing brands in DYC, while in LH, the densest customer flow is observed for restaurants.
To further understand the customer flow to stores, we used a linear multivariable regression model, where the clothing and food stores were analyzed. The results indicate that the store inflow densities for both clothing and food stores are related to the location and comment level. Compared to those to food stores, customer flows to clothing stores are dependent on convenience factors (namely, distance to an elevator and distance to the floor center (only for LH)). This is because clothing shopping requires more comparisons between stores, and more easily reachable stores will attract more customers. The difference between DYC and LH is that the flows to clothing stores are more sensitive to the distance to anchor stores and the competitiveness of the same class of stores (namely, the number of the same class of stores nearby) in DYC, while in LH, the flows to food stores are more sensitive to average consumption per person. The former difference is because of the discrepancy in the functions and layouts of the two shopping malls, and the latter is due to the different living standards of the two cities.
All the characteristics of customer flows from indoor positioning data may provide useful information for the sales of shopping malls in the network era. Weekly or hourly flow patterns may help to adjust business time, supply and services, while the statistics of different classes and stores may help managers to rearrange the retail format and optimize the rents of different stores. Moreover, the results regarding influencing factors may assist arranging the layout of shopping malls. For example, clothing stores could be placed near the elevator, while for a food store, a convenient location is needed, and a good reputation is always necessary for all stores to attract customers. To increase the overall number of customers, the anchor stores could be placed in the inner place of each floor.
The study also has certain limitations. The first is that the data used were limited to the same season. Data of different seasons may help to indicate temporal differences. The second is that we used two shopping malls from different cities. Although the factors relating to city styles are revealed, factors regarding function and transportation may be concealed by the difference in city styles. In the future, more comparisons can be made regarding shopping malls in the same city, or with more similar tenant mixes or locations. Results from such research could provide a clearer idea about the influencing factors.


