Strengthening Participation Using Interactive Planning Support Systems: A Systematic Review


Abstract
1. Introduction
2. Interactive PSS Enhancing Stakeholder Participation in Planning
2.1. Interactive PSS Tools
2.2. Planning Processes and Interactive PSS Workshops
3. Impacts of Interactive PSS on Participation
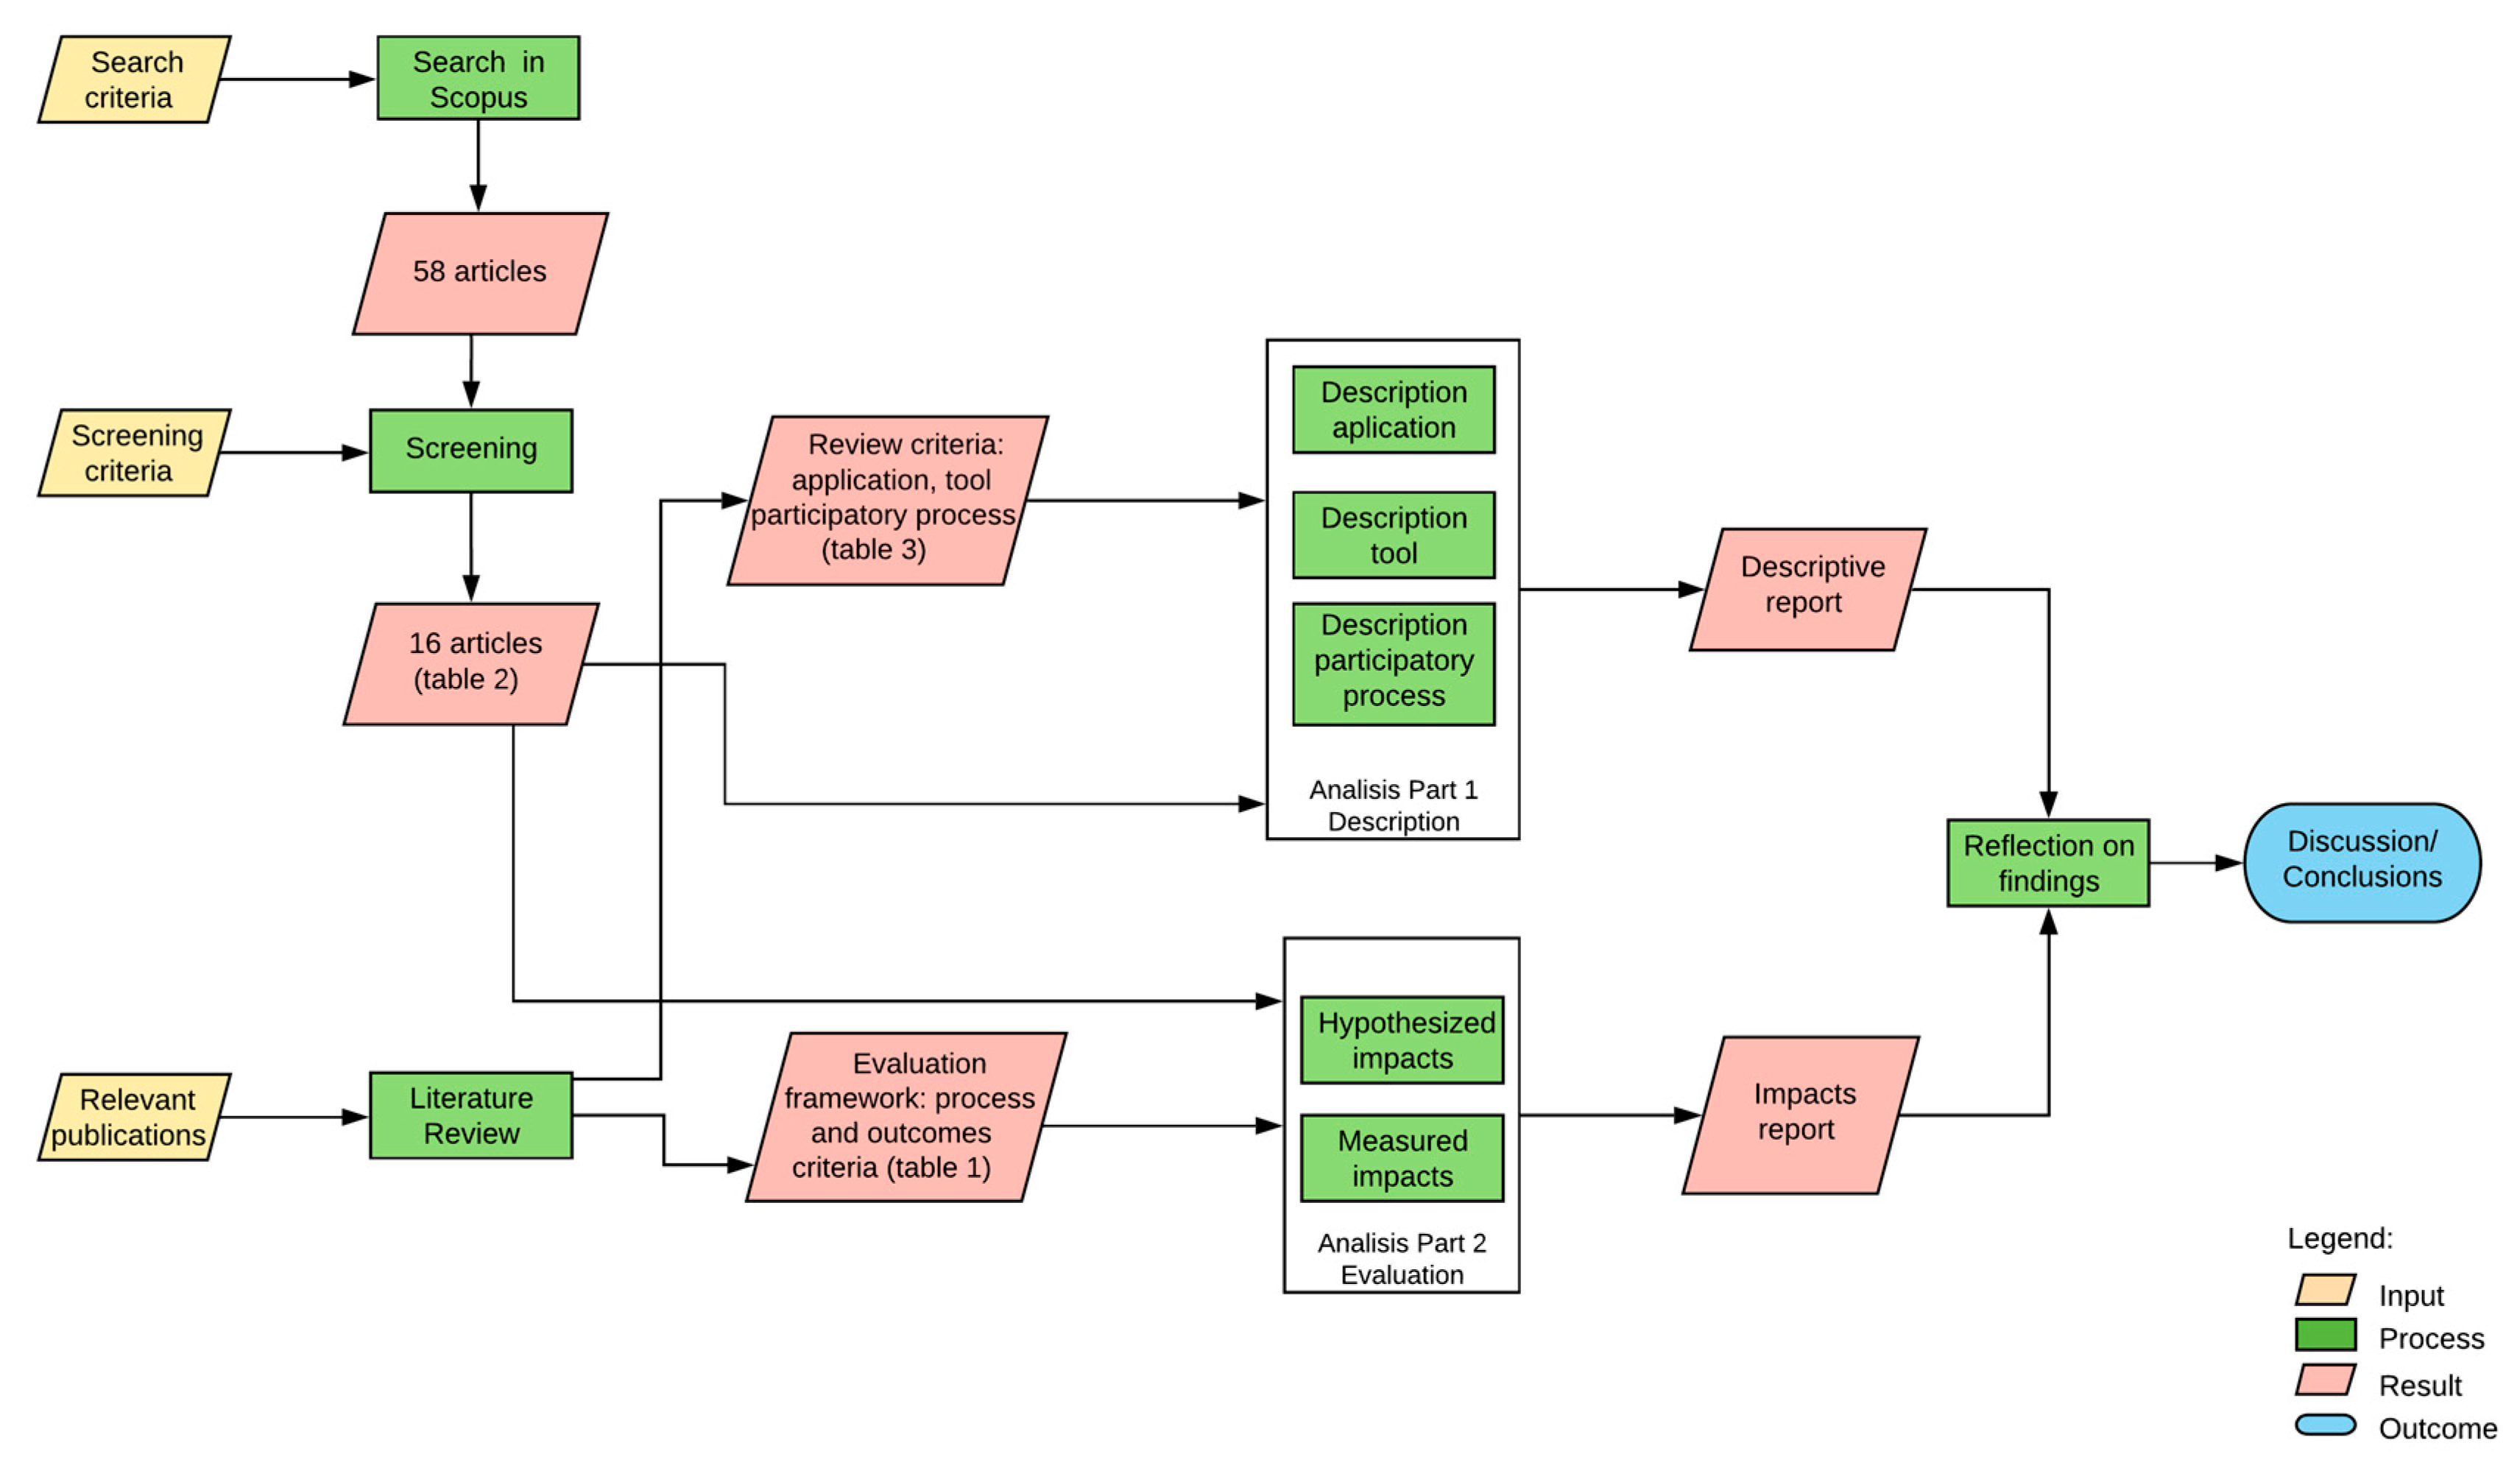
4. Review Methodology
- Keyword = maptable or one of the following synonyms: touchtable, tabletop, touch user interface, tangible user interface, tui, plus different spellings of these terms such as map table;
- AND
- Keyword = urban planning or one of the following related terms: spatial planning, strategic planning, urban design.
- Focus on stakeholder participation in spatial planning in general, i.e., planning related activities at any scale (national to sub-local),
- Use of the maptable to facilitate the participatory process,
- Real-world case study, i.e., applied in a real context, with real stakeholders, and addressing a real or at least realistic problem setting, i.e., a typical contemporary planning issue,
- Peer reviewed and published articles, book chapters, or conference papers,
- Interactive PSS applications, tool and workshop described in sufficient detail, so that the necessarily details for all criteria can be elicited.
5. Review Results
5.1. Interactive PSS Applications, Tools, and Participatory Processes
5.2. Dimensions and Aspects of Participation Reported in the Studies
6. Discussion
6.1. Interactive PSS Applications, Tools and Processes
6.2. Interactive PSS Contribution to Participation
6.3. Reflection of the Methodology Applied in this Review
6.4. Future Research Needs
7. Conclusions
Author Contributions
Funding
Acknowledgments
Conflicts of Interest
Appendix A. Analysis Part One—Details of Reviewed Interactive PSS

| ID | Case Studies | Sector/Field of Application | Scale | Goal of the Application |
|---|---|---|---|---|
| 1 | Ijssel river clos to Deventer, Netherlands | Water management | Regional | Designing spatial measures for controlling water levels of the river |
| 2 | Groningen province, Netherlands | Climate change adaptation | Regional | Integrating sectoral adaptation measures |
| 3 | South West Victoria, Australia | Forest regeneration planning | Regional | Designing biolinks (ecological corridors) for forest regeneration |
| 4 | Three case studies: (a) Stedendriehoek area, (b) hypothetical area, (c) Brabantse Delta (all areas in the Netherlands) | Water related land use planning (a, c), energy transition (b) | Regional | Exploring available information, exchanging ideas about the current and future situation, sketching potential interventions |
| 5 | Two case studies: (a) Bodegraven polder, Netherlands, (b) Mull of Kintyre, Scotland | (a) Rural land use planning, (b) offshore renewable energy planning | Regional | Involving stakeholders in entire planning process of analysis of the situation, design of potential interventions, choice of agreed upon interventions |
| 6 | Four case studies: (a) Rijnenburg, Utrecht, (b) Arnhem, (c) Deventer, (d) Achterhoek (all areas in the Netherlands) | (a) Sustainable urban development, (b) energy transition, (c) rban design, (d) adjustment of urban development plans | Urban, city to neighbourhood level | Facilitating communication among stakeholders during different planning stages |
| 7 | Three case studies: (a) Hommerts, (b) Veenpolder, (c) Buitenveld (all areas in the Netherlands) | Rural land use planning | Regional | Designing a spatial adaptation strategy for land use related water management in a peat meadow area |
| 8 | Two case studies, each conducted in multiple areas: (a) Esch-sur-Alzette, Luxembourg; Ludwigsburg, Germany, (b) London, UK; Brussels, Belgium; Luxembourg | (a) Climate change mitigation, (b) urban logistics | Urban | Translating policy visions into concrete projects |
| 9 | Six case studies: Beira, Mozambique; London, UK; Oaxaca, Mexico; Utrecht, Dordrecht, Tilburg, all Netherlands | Climate change adaptation | Urban | Defining green and blue adaptation measures |
| 10 | Liemers Corridor, Netherlands | Regional development planning | Regional | Negotiating distribution of commercial and industrial development locations at regional level |
| 11 | Dortmund, Germany | Environmental health | Urban, city to neighbourhood level | Mapping stakeholder knowledge on environmental health issues |
| 12 | North-East Scotland, Scotland | Landscape planning | Urban and rural, regional scale | Exploring spatial behaviour in the local landscapes |
| 13 | Enschede, Netherlands | Energy transition | City | Discussing locations of renewable energy projects |
| 14 | Two case studies: Dortmund and Munich, Germany | Environmental health | City district | assessing and mapping multiple environmental burdens |
| 15 | Sydney, Australia | Urban redevelopment | Urban, precinct level | Developing different scenarios of urban redevelopment |
| 16 | City of Hume, Melbourne, Australia | Health related urban planning | Urban, city level | exploring built Environment scenarios regarding impacts on walkability and designing interventions |
| ID | Hardware Setup/System Architecture | Software | Main GIS Functions | External Model Coupled | Stakeholders Involved |
|---|---|---|---|---|---|
| 1 | Maptable used with stylus pens, stand alone system | ArcGIS plus interface panel for maptable (Woosh) | Drawing features, sketching, annotating, queries, calculation of effects | Hydrologic model (Waqua), spatial schematization tool (Baseline) | No |
| 2 | Maptable, stand alone system | ArcGIS | Drawing, visualisation | No | No |
| 3 | Maptable, stand alone system | ArcGIS plus landscape constructor extension and visualisation tool (SIEVE) | Drawing polygons, assigning vegetation types, 3D visualization | Landscape object library | No |
| 4 | Maptable, clinet-server structure | ArcObjects technology, various libraries | Sketching, indicator calculation | 4b) Energy performance model | Lab based study beforehand, (see [25]) |
| 5 | Maptable (Diamond Touch™) 3, stand alone system | CommunityViz Scenario 360 1, DT collaborate (ArcGIS plugin) | Drawing, MCA, allocation | No | No |
| 6 | Mapsup MapTable®, stand alone system | CommunityViz Scenario 360 1 | Drawing, indicator calculation, visualisation | Sustainability Profile of the Location (SPL) score calculated based on indicators | No |
| 7 | Maptable, SUR 40 Samsung, stand alone system | CommunityViz Scenario 360 1 | Geodesign tools, indicator calculation, | No | No |
| 8 | Maptable (GTUI) used with physical objects (tags), web-based | PostgreSQL1 server with geospatial extension; client: Java application (open source) | Place tagged objects on the screen for calling certain functions such as split screen, data layers | No | No |
| 9 | Maptable, stand alone system | Not given | Allocate predefined interventions, ranking of interventions, performance indicator calculation | No | Test cases of the tool run in Rotterdam and Delft (see [21]) |
| 10 | MapsUp MapTable®, stand alone system | CommunityViz Scenario 3601 | (Re)-allocating pre-configured building blocks of development space, indicator calculations | No | No |
| 11 | Maptable plus extra screen, stand alone system | Phoenix 2 | Sketching, annotating with symbols 3D visualization | No | No |
| 12 | Maptable, Samsung SUR40 with Microsoft Pixelsense, web-based | Bing maps | Pan and zoom, no particular GIS functions used | No | No |
| 13 | Maptable plus extra screen, stand alone system | CommunityViz Scenario 360 1 | Sketching, indicator calculations | No | Discussions of the model with the municipality |
| 14 | Maptable plus extra screen, stand alone system | CommunityViz Scenario 360 1 | Sketching, multi criteria analysis (MCA) | No | No |
| 15 | Maptable, stand alone system | ArcGIS toolbox | Input of model parameters, scenario calculation, 3D visualization | No | No |
| 16 | Maptable, stand alone system | CommunityViz Scenario 360 1 | Sketching, changing model assumptions, indicator calculation | Custom regression models built into CommunityViz | No |
| ID | Planning Phase | Stakeholders/Participants | PSS-Supported Steps | Other Participatory Steps | Process Facilitation | Process Evaluation |
|---|---|---|---|---|---|---|
| 1 | Design | Practitioners from city, ministry, forestry, infrastructure agency, architect | Three stages: define measures, calculate effects, evaluate results | Evaluation of design done verbally based on calculated effects | Process and technical facilitator | Not given |
| 2 | Choice | Different sectoral experts | Three stages: map sectoral measures, integrate spatial measures into one coherent map, agree on integration map | Measures first sketched on paper maps | Moderator to operate the GIS on the maptable | Not given |
| 3 | Design | Landscape planners, scientists | Design and then visualisation in 3D | No | Not given | 5 point likert scale questionnaire on usability of tool |
| 4 | Problem analysis and design | Practitioners (landscape architects, planners) and academics | Three stages: area exploration, selection of suitable locations, design of new locations | No | No | Observers (development team and experts) filling evaluation questionnaires, discussion of findings with participants; stated experiences of participants |
| 5 | Problem analysis, design, and choice | Design workshop: 10 stakeholders (municipality, waterboard, NGO, etc.); choice workshop: local stakeholders, citizens, and municipality | Two workshops, local knowledge and negotiation workshop, each workshop having 3 sessions: intro to research problem, familiarise with tools, participants use of tools to fulfil the objectives | Design on paper maps in parallel groups, use of DEFINTE MCA in design workshop | no | Survey at the end of each workshop, plenary discussion |
| 6 | Problem analysis, design, and choice; partly addressed in separate case studies | Different practitioners: environmentalist analysts (noise, air quality, water management), urban designers | Various number of workshops in different cases workshops; | No | Technical facilitation on using the PSS | Survey questionnaire in negotiations workshop |
| 7 | Problem analysis and design | Farmers, interest groups, NGOs | Three assignment in the workshops, related to three strategies | No | No | Survey done before and after the workshop |
| 8 | Design | Local stakeholders: urban planners, GIS technicians, social scientists, engineers, energy experts, and companies; municipalities, public transportation | Translate vision into concrete projects); understanding the context | No | No | Questionnaire |
| 9 | Design | Various local experts: municipal staff members, planners, local experts, NGOs, partly also citizens | First maps and 3D visualization were shown | Loosely linked to climate adaptation app [86] | Not given | Questionnaire |
| 10 | Not strictly related to a typical planning process | regional urban development practitioners from province and municipalities | Two workshops: various rounds of playing with different tasks, foci | No | No | Video recording, three questionnaires during the workshop regarding expectations |
| 11 | Problem analysis | Practitioners from planning and health (municipality, agencies, NGOs) | Three phases: explore existing information, add tacit knowledge, integrate knowledge | Rich picture drawing | Facilitator for substantial and procedural issues | observations, questionnaire, oral feedback, screen and voice recording |
| 12 | Not given | 22 participants, individuals, most of them being researcher on land based issues | Joint discussion self-recorded GPS walking routes visualised on the maptable | Combined with smart phones GPS tracking of walking routes | No | Individual interviews 4-6 weeks after workshop, video recording of the sessions |
| 13 | Problem analysis | Citizens, policy makers | Two stages, focussing on different types of renewable energy | No | Moderator and chauffeur | Questionnaire, screen and voice recording |
| 14 | Problem analysis | Researchers and practitioners (municipality, housing association, NGO) | Part of a one day planning game | Planning game on identifying economically and socially deprived districts, and communities | Moderator and chauffeur | Questionnaire, observations, screen and voice recording |
| 15 | Problem analysis and design | Urban planners | Session structured into five steps related to five different questions | No | Technical facilitator | Pre and post workshop questionnaire |
| 16 | Design | Urban planners and one health expert | Sketching interventions after intro to the tool, compare scenarios | No | Technical facilitator | Questionnaire, group discussion |
Appendix B. Analysis Part Two—Reported Impacts on Aspects and Criteria of Participation
| ID | tr | fa | in | ef | C | |
|---|---|---|---|---|---|---|
| H = 2 | H = 4 | H = 2 | H = 3 | H = 12 | ||
| M = 1 | M = 2 | M = 7 | M = 4 | M = 12 | ||
| M = 1 | M = 2 | M = 2 | M = 2 | M = 3 | ||
| 1 [20] | “The design [of the maptable interface] should address [...] efficiency [...] properly.” (p. 265) | ef | H | |||
| “... Very suitable in brainstorming, quick and easy to present ideas, empowers collaboration (p. 270) | C | M | ||||
| “Designing is equally possible for all participants.” (p. 270) | in | M | ||||
| 2 [55] | “...the table setting was expected to better facilitate face-to-face communication...” (p. 7) | C | H | |||
| “...the [...] table was expected to entice participants to interact and share on the table.” (p. 7) | C | H | ||||
| The table setting allowed four to five people at a time to view the work and communicate comfortably. (p. 7) | C | M | ||||
| “The simultaneous projection of intermediate steps and resulting maps on a wall enabled larger groups to follow the work in progress...” (p. 7) | in | M | ||||
| “This led to a moderate degree of group participation.” (p. 7) | C | M | ||||
| 3a [57] | “...such a suite of geo-visualisation tools will enable active participation and exploration of decision spaces by a number of end users.” (p. 331) | C | H | |||
| “enables and engages participants in an interactive session bringing together researcher, landscape planners and policy-makers in a participatory way” (p. 331) | C | H | ||||
| “...using this approach helps the user to make changes in their 2D plan […] and view them interactively in the 3D environment immediately...” (p. 338) | ef | H | ||||
| 3b [56] | “All participants can view the designed biolink…” | fa | H | |||
| “...interactive participatory decision making approach to involve multi-stakeholders in landscape.” | C | H | ||||
| 4a [58] | “...enable experts and citizens to exchange ideas in an efficient and accessible way.” (p. 8) | ef | H | |||
| “...invites participants to engage actively in a process of communication ...” (p. 8) | C | H | ||||
| “The MapTable environment stimulated discussion...” (p. 13) | C | M | ||||
| “...the user who is holding the pen dominates the session...” (p. 14) | fa | M | ||||
| “The use of the MapTable keeps all the participants active.” (p. 14) | in | M | ||||
| “...leading to relevant and well-informed discussions.” (p. 16) | C | M | ||||
| 4b [59] | “Each stakeholder [...] has the opportunity [...] to contribute its own ideas...” | in | H | |||
| 5a [10] | “...maps are used as the means of communication to facilitate stakeholder dialog”. (p. 334) | C | H | |||
| “Stakeholders are invited to work together [...] and share their views...” (p. 334) | C | H | ||||
| “To communicate information about land use suitability” (p. 334) | C | H | ||||
| “...tools were effective for communicating large amounts of information...” (p. 337) | ef | M | ||||
| “prompted input from all participants...” (p. 337) | in | M | ||||
| 5b [60] | “During the ‘local-knowledge’ workshop all contributors participated enhancing interactivity and communication across sectors.” (p. 7) | in | M | |||
| 6a [11] | “...urban designers from the external firm were less actively involved...” (p. 178) | in | M | |||
| “...otherwise the momentum would have been lost.” (p. 179) | ef | M | ||||
| “…leading to sensitivity to technical errors and lengthy calculation times.” (p. 179) | ef | M | ||||
| “...of the environmental analysts found it difficult to think in terms of scores of 1–10...” (p. 180) | in | M | ||||
| “...would be successful if the urban designers would stay around MapTable until the end...” (p. 180) | in | M | ||||
| “...intensive discussions about the incorporation of environmental issues in the spatial plan...” (p. 180) | C | M | ||||
| “...measures couldn’t be presented right away, people lost their concentration...” (p. 181) | ef | M | ||||
| “...leads to an open and constructive group dynamics...” (p. 182) | fa | M | ||||
| 6b [37] | “...the PSS was utilized to support this collaboration...” | C | H | |||
| “...the MapTable PSS clearly involved [...] communication support...” | C | M | ||||
| “It enabled the different professionals to explore together the sustainability Consequences...” | C | M | ||||
| “...it had a broader aim of supporting a constructive dialogue with increased collaboration and communication...” | C | H | ||||
| “...were enthusiastic about how this information on consumption patterns was visualized and communicated...” | C | M | ||||
| “...is its ability to keep participants active around it, their attentions focused on the information...” | ef | M | ||||
| “...the MapTable PSS [...] led to a fair, clear and transparent selection process...” | fa, tr | M | ||||
| “...participants could directly be addressed by other participants and convinced to participate in the collaboration process...” | C | M | ||||
| 7 [38] | “...provided a common platform for discussion.” (p. 104) | C | H | |||
| “...did well in facilitating exchange of information...” (p. 113) | C | M | ||||
| 8 [61] | “...Users should be able to talk to each other face-to-face...” (p. 189) | C | H | |||
| “...provide a new, common language for inter-discussion.” (p. 189) | C | H | ||||
| “...each of them playing an equal part in the discussion.” (p. 190) | fa | H | ||||
| “...communicate differently [...] and will collaborate more...” (p. 196) | C | H | ||||
| “...stakeholders to discuss longer...” (p. 196) | ef | M | ||||
| “...the discussion process will get shorter and that a solution will be found faster...” (p. 197) | ef | M | ||||
| “...allowing stakeholders to express themselves in a clear way... “(p 197) | in | M | ||||
| “...allows everybody to participate...” (p. 198) | in | M | ||||
| “...encourage communication...” (p. 198) | in | M | ||||
| “...some citizens will have problems to understand everything.” (p 198) | in | M | ||||
| “...helpful for brainstorming with other people or to convince a politician of a strategy...” (p. 201) | C | M | ||||
| “...multiple participants actively interacted...” (p. 202) | in | M | ||||
| 9 [83] | “...discuss alternative measures...” (p. 428) | C | H | |||
| “...facilitates reasoning together...” (p. 429) | C | H | ||||
| “...effectively supported climate-proof planning...” (p. 433) | ef | M | ||||
| “...details of the plan were discussed among participants at the design table...” (p. 434) | C | M | ||||
| 10 [62] | “...facilitated a focused form of communication...” (p. 84) | C | M | |||
| “All participants pointed to relevant features on the map...” (p. 84) | in | M | ||||
| “...in order for the negotiation to work, insight in the figures is essential...” (p. 85) | tr | M | ||||
| “...helps to structure the discussion...” (p. 85) | ef | M | ||||
| “...used the Maptable more as a discussion tool...” (p. 86) | C | M | ||||
| 11 [12] | “...to enable communication...” (p. 4) | C | H | |||
| “...listening to each other, treating each other’s interests with respect...” (p. 5) | fa | H | ||||
| “...discussing their own perspectives and knowledge...” (p. 10) | C | M | ||||
| “...information and knowledge are communicated...” (p. 11) | C | M | ||||
| “...tensions and resistances also surfaced...” (p. 11) | C | M | ||||
| 12 [63] | “We observed that interaction with the touch table can be dominated by one or two individuals...” (p. 13) | fa | M | |||
| “... can make it easier for more reserved participants to contribute.” (p. 13) | fa | M | ||||
| 13 [9] | “...encourages stakeholders to discuss jointly...” (p. 3) | C | H | |||
| “...various groups focused [...] more on achieving the given goals rather than on an eventually conflicting discussion of potential locations...” (p. 10) | C | M | ||||
| “...allows better comunication...” (p. 12) | C | M | ||||
| 14 [51] | “...active dialogue [...] and an exchange of each other’s perspectives...” (p. 5) | C | H | |||
| “...transparency in the process...” (p. 5) | tr | H | ||||
| “...an active dialogue among the participants...” (p. 13) | C | M | ||||
| “...exchange of perspectives among | C | M | ||||
| Participants...” (p. 13) | C | M | ||||
| “...Collaborative relationships were also evident...” (p. 17) | ||||||
| 16a [64] | “...two-hour participatory workshop to facilitate dialog [...] among researchers and practitioners...” (p. 131) | C | H | |||
| 16b [65] | “...degree of transparency.” (p. 157) | tr | H | |||
| “...sketch and test ideas together...” (p. 158) | C | H | ||||
| “...supporting communication...” (p.159) | C | H | ||||
| “...effective tool to support communication...” (p. 160) | C | M | ||||
| “...support consultation with other stakeholders and public...” (p. 161) | C | M | ||||
| “...unclear whether the operation of the Walkability PSS on the MapTable itself was essential to support participation and engagement...” (p. 164) | C | M | ||||
| ID | aw | sl | dl | L | |
|---|---|---|---|---|---|
| H = 2 | H = 4 | H = 2 | H = 3 | ||
| M = 1 | M = 2 | M = 7 | M = 4 | ||
| M = 1 | M = 2 | M = 2 | M = 2 | ||
| 5a [10] | “...helped increasing their awareness of new aspects of the region’s problems” (p. 337) | aw | M | ||
| 6a [11] | “...is clearly capable of improving the learning processes of actors...” (p. 181) | L | M | ||
| “...this interaction did not necessarily lead to learning processes...” (p. 181) | L | M | |||
| 6b [37] | “...analysts indicated to have learned a lot from each other...” | L | M | ||
| 9 [83] | “...should raise awareness...” (p. 428) | aw | H | ||
| “...impacts and vulnerable spots were recognized by the participants...” (p. 433) | sl | M | |||
| “...supported a learning process...” (p. 433) | L | M | |||
| 10 [62] | “...learning (individual and group learning) as the most important quality criterion...” (p. 77) | L | H | ||
| 11 [12] | “...to enable [...] social learning...” (p. 4) | L | H | ||
| “...leads to enriched insights and social learning...” (p. 14) | L | M | |||
| 12 [63] | “…had become more aware of other people she encountered on her walk...” (p. 11) | aw | M | ||
| 13 [9] | “...to raise awareness and facilitate social learning of stakeholders...” (p. 3) | aw | H | ||
| “...achieving the goal of social learning...” (p. 11) | L | M | |||
| “...learned by the participants in the sense of social learning...” (p. 11) | L | M | |||
| “...learned something about renewable energy during the workshops...” (p. 12) | L | M | |||
| 14 [51] | “...intended outcomes of knowledge co-production and social learning...” (p. 3) | L | H | ||
| “...detected mismatch between expected and observed outcomes is corrected by revisiting the assumptions...” (p. 6) | dl | H | |||
| “...mismatch between expected and observed outcomes is corrected...” (p. 6) | sl | H | |||
| “...Critical questioning of underlying assumptions of the model...” (p. 13) | dl | M | |||
| “Evident instances of single-loop learning...” (p. 15) | sl | M | |||
| “Instances of double-loop learning occurred...” (p. 16) | dl | M | |||
| 16a [64] | “...two-hour participatory workshop to facilitate [...] co-learning among researchers and practitioners...” (p. 131) | L | H | ||
| ID | kn | co | un | qa | |
|---|---|---|---|---|---|
| H = 2 | H = 4 | H = 2 | H = 3 | ||
| M = 1 | M = 2 | M = 7 | M = 4 | ||
| M = 1 | M = 2 | M = 2 | M = 2 | ||
| 1 [20] | “After an agreement has been reached on a common design...” (p. 267) | co | M | ||
| “In the discussion [...] ideas for changing in the design in the next cycle were indicated. (p. 269) | qa | M | |||
| 2 [55] | “The resulting, integrated map was accepted by all participants...” (p. 8) | co | M | ||
| 3a [57] | “…reason for bringing together these spatial data layers is to enhance participants’ understanding and thinking about the study area.” (p.335) | un | H | ||
| 3b [56] | “…this gives users the opportunity to consider these factors in their biolink delineation” | kn | H | ||
| “improved biodiversity and habitat plans can be created between…” | qa | H | |||
| “a more informed way of understanding environmental processes” | un | H | |||
| 4a [58] | “...invites participants to engage actively in a process of [...] sharing of knowledge.” (p. 8) | kn | H | ||
| “landowners and formal organizations [...] try to come to a consensus.” (p. 9) | co | H | |||
| “In an iterative working process, ‘hotspots’ were continuously evaluated, discussed and changed.” (p. 15) | kn | M | |||
| 5a [10] | “To improve stakeholder understanding of the problem” (p. 334) | un | H | ||
| “exchange of local knowledge and stakeholder dialog” (p. 334) | kn | H | |||
| “To use this information to improve the quality of the plans” (p. 335) | qa | H | |||
| “To negotiate a land use plan that is perceived as acceptable by all Participants” (p. 335) | co | H | |||
| “… increased the credibility of the information presented...” (p. 338) | qa | M | |||
| 5b [60] | “... aim was to gather spatially explicit data from local sea-users...” (p. 3) | kn | H | ||
| “...aim [...] was to build a consensus on the best locations...” (p. 3) | co | H | |||
| “Conflict [...] emerged throughout the workshop process.” (p. 3) | co | M | |||
| “...new stakeholder maps were generated {...] based on the knowledge of the [...] stakeholders...” (p. 4) | kn | M | |||
| “Participants added a considerable amount of data ...” (p. 4) | kn | M | |||
| Discussion [...] regarding the quality of the data used led to suggestions that the published tidal data were inaccurate.” (p. 5) | qa | M | |||
| Results [...] indicated that 80% of participants found the combination of knowledge from researchers and stakeholders to be most helpful” (p. 7) | kn | M | |||
| “...contributed to a broader understanding of the complexity of problems...” (p. 7) | un | M | |||
| 6a [11] | “...the structuration of local knowledge...” (p. 174) | kn | H | ||
| “...it helped them to envision the diverse topics of a planning problem in an interconnected way...” (p. 180) | un | M | |||
| “...If you emphasize integrality too much, it hampers focus and creativity.” (p. 180) | qa | M | |||
| “...lead to group dynamics in which it is easier to come up with ideas...” (p. 180) | kn | M | |||
| “...understanding of the issues of relevance to other disciplines and the interrelatedness of problems...” (p. 180) | un | M | |||
| 6b [37] | “...which both provided insight in the planning issue...” | un | M | ||
| “...gained more insight into the plans of other municipalities and into the future economic consequences of these plans...” | un | M | |||
| “...the increased transparency through [...] the PSS did not always support reaching agreements...”) | co | M | |||
| 7 [38] | “...increased understanding of these relations...” (p. 113) | un | M | ||
| 8 [61] | “...better understand the maps...” (p. 196) | un | M | ||
| ...new type of overview [...], which is more understandable...” | un | M | |||
| “Stakeholders will discuss longer before reaching a consensus.” (p. 196) | co | H | |||
| 9 [83] | “...supports them in how to share their knowledge...” (p. 428) | kn | H | ||
| “Two alternative plans emerged from this discussion...” (p. 433) | qa | M | |||
| “...forced participants to be explicit about their proposed interventions...” (p. 434) | qa | M | |||
| “...to find a common preference with all participants...” (p. 434) | co | M | |||
| 10 [62] | “...used in-depth knowledge...” (p. 84) | kn | M | ||
| “...identify and discuss locations [...] that otherwise might be overlooked.” (p. 86) | qa | M | |||
| “...successfully brings information together in interactive fashion...” (p. 87) | kn | M | |||
| “...Learning about the issue...” (p. 87) | un | M | |||
| 11 [12] | “...to develop a shared understanding about the problem situation...” (p. 4) | un | H | ||
| “...enable integration of explicit knowledge and stakeholders’ tacit knowledge...” (p. 4) | kn | H | |||
| “...willing to put their “half baked” ideas forward...” (p. 5) | kn | H | |||
| “...knowledge is shared easily...” (p. 11) | kn | M | |||
| “...externalize and capture tacit knowledge...” (p. 12) | kn | M | |||
| “...Consensus was reached...” (p. 14) | co | M | |||
| 12 [63] | “...method to facilitate discussions about people’s perceptions and knowledge of local landscapes.” (p. 1) | kn | H | ||
| “…the touch table facilitated participants in gaining an understanding...” (p. 7) | un | M | |||
| “...the session around the touch table had helped to change the understanding [...] people had...” (p. 11) | un | M | |||
| 13 [9] | “...discussions towards consensual options and locations...” (p. 3) | co | H | ||
| “...high level of agreement between the participants...” (p. 11) | co | M | |||
| “...mapping results were perceived as less valuable and reliable...” (p. 13) | qa | M | |||
| 14 [51] | “...engaged in cooperative endeavors of knowledge production...” (p. 3) | kn | H | ||
| “...participants may also come to understand...” (p. 4) | un | H | |||
| “...elicitation of stakeholders’ tacit knowledge...” (p. 5) | kn | H | |||
| “...participants’ suggestions and knowledge were also considered.” (p. 12) | kn | M | |||
| “...co-creation of knowledge among the groups...” (p. 16) | kn | M | |||
| “...participants discovered common linkages between various interests...” (p. 17) | co | M | |||
| “...were able to agree on a set of indicators/indices...” (p. 17) | co | M | |||
| “...lead to collective action by the group...” (p. 17) | co | M | |||
| 15 [22] | “...combination of models in the tool facilitates the understanding of the role of different variables...” (p. 1389) | un | M | ||
| 16a [64] | enabled a group of spatial planners to [...] understand how this increased the probability of transport walking | un | M | ||
| ID | Ow | mu | cb | sa | |
|---|---|---|---|---|---|
| H = 2 | H = 4 | H = 2 | H = 3 | ||
| M = 1 | M = 2 | M = 7 | M = 4 | ||
| M = 1 | M = 2 | M = 2 | M = 2 | ||
| 1 [20] | The design should address [...] satisfaction properly (p. 265) | sa | H | ||
| 5a [10] | “the Touch table helped increasing their awareness of [...] different standpoints as well as scopes of other stakeholders (p. 337) | mu | M | ||
| 6a [11] | “...lead to group dynamics in which it is easier [...] to think beyond professional roles...” (p. 180) | mu | M | ||
| 6b [37] | “...the PSS gets people off their islands, they come closer....” | mu | M | ||
| 7 [38] | “...raised awareness of the perspectives of other Participants...” (p. 113) | mu | M | ||
| 9 [83] | “...satisfaction with the way the planning process was structured...” (p. 433) | sa | M | ||
| “...stimulates thinking beyond the own professional roles...” (p. 434) | mu | M | |||
| 10 [62] | “...tool effectively brings motives to the surface...” (p. 87) | mu | M | ||
| “...insight in each other’s current situation and future plans...” (p. 87) | mu | M | |||
| 11 [12] | “...participants identify commonalities in views...” (p. 7) | mu | H | ||
| “...construction of shared meanings was evidenced...” (p. 14) | mu | M | |||
| 12 [63] | “...how what the other person said made them remember other aspects of their walk...” (p. 11) | mu | M | ||
| 13 [9] | “...to increase community engagement...” (p. 3) | ow | H | ||
| “...to get to know the views of others...” (p. 11) | mu | M | |||
| “...their views on renewable energy with the other participants...” (p. 12) | mu | M | |||
| 14 [51] | “...shared understanding of the issues under investigation...” (p. 5) | mu | H | ||
| “...insights into normative aspects and each other’s assumptions...” (p. 5) | mu | H | |||
| “...participants were able to work through their interests linking these with others...” (p. 17) | mu | M | |||
References
- Healey, P. Planning through Debate: The Communicative Turn in Planning Theory. Town Plan. Rev. 1992, 63, 143–162. [Google Scholar] [CrossRef]
- Healey, P. The Communicative Turn in Planning Theory and its Implications for Spatial Strategy Formation. Environ. Plan. B Plan. Des. 1996, 23, 217–234. [Google Scholar] [CrossRef]
- Friedmann, J. Thinking about complexity and planning. Int. Plan. Stud. 2019, 24, 13–22. [Google Scholar] [CrossRef]
- Innes, J.E.; Booher, D.E. Reframing public participation: Strategies for the 21st century. Plan. Theory Pract. 2004, 5, 419–436. [Google Scholar] [CrossRef]
- Batty, M. Planning support systems and the new logic of computation. Reg. Dev. Dialogue 1995, 16, 1–17. [Google Scholar]
- Geertman, S. PSS: Beyond the implementation gap. Transp. Res. Part A Policy Pract. 2017, 104, 70–76. [Google Scholar] [CrossRef]
- Pelzer, P.; Geertman, S.; van der Heijden, R.; Rouwette, E. The added value of Planning Support Systems: A practitioner’s perspective. Comput. Environ. Urban Syst. 2014, 48, 16–27. [Google Scholar] [CrossRef]
- Flacke, J.; de Boer, C.; van den Bosch, F.; Pfeffer, K. Interactive Planning Support Systems with Citizens: Lessons Learned from Renewable Energy. In Handbook of Planning Support Science; Geertman, S., Stillwell, J., Eds.; Edward Elgar Publishing: Cheltenham, UK, 2020; pp. 482–504. [Google Scholar]
- Flacke, J.; de Boer, C. An Interactive Planning Support Tool for Addressing Social Acceptance of Renewable Energy Projects in The Netherlands. IJGI 2017, 6, 313. [Google Scholar] [CrossRef]
- Arciniegas, G.; Janssen, R. Spatial decision support for collaborative land use planning workshops. Landsc. Urban Plan. 2012, 107, 332–342. [Google Scholar] [CrossRef]
- Pelzer, P.; Arciniegas, G.; Geertman, S.; de Kroes, J. Using MapTable® to learn about sustainable urban development. In Planning Support Systems for Sustainable Urban Development; Geertman, S., Toppen, F., Stillwell, J., Eds.; Springer: Berlin/Heidelberg, Germany, 2013; pp. 167–186. [Google Scholar]
- Shrestha, R.; Köckler, H.; Flacke, J.; Martinez, J.; van Maarseveen, M. Interactive Knowledge Co-Production and Integration for Healthy Urban Development. Sustainability 2017, 9, 1945. [Google Scholar] [CrossRef]
- Russo, P.; Lanzilotti, R.; Costabile, M.F.; Pettit, C.J. Towards satisfying practitioners in using Planning Support Systems. Comput. Environ. Urban Syst. 2018, 67, 9–20. [Google Scholar] [CrossRef]
- te Brömmelstroet, M. PSS are more user-friendly, but are they also increasingly useful? Transp. Res. Part A Policy Pract. 2017, 91, 96–107. [Google Scholar] [CrossRef]
- Pelzer, P. Usefulness of planning support systems: A conceptual framework and an empirical illustration. Transp. Res. Part A Policy Pract. 2017, 104, 84–95. [Google Scholar] [CrossRef]
- te Brömmelstroet, M. Performance of Planning Support Systems. Comput. Environ. Urban Syst. 2013, 41, 299–308. [Google Scholar] [CrossRef]
- Coors, V.; Jasnoch, U.; Jung, V. Using the virtual table as an interaction platform for collaborative urban planning. Comput. Graph. 1999, 23, 487–496. [Google Scholar] [CrossRef]
- Ben-Joseph, E.; Ishii, H.; Underkoffler, J.; Piper, B.; Yeung, L. Urban simulation and the luminous planning table: Briding the gap between the digital and the tangible. J. Plan. Educ. Res. 2001, 21, 195–202. [Google Scholar] [CrossRef]
- Hopkins, L.D.; Ramanathan, R.; Pallathucheril, V.G. Interface for a sketch-planning workbench. Comput. Environ. Urban Syst. 2004, 28, 653–666. [Google Scholar] [CrossRef]
- Bulens, J.; Ligtenberg, A. The MapTable, an interactive instrument for spatial planning design processes. In Proceedings of the 9th AGILE Conference on Geographic Information Science, Visegrád, Hungary, 20–22 April 2006. [Google Scholar]
- Voskamp, I.; van de Ven, F. Planning support system for climate adaptation: Composing effective sets of blue-green measures to reduce urban vulnerability to extreme weather events. Build. Environ. 2015, 83, 159–167. [Google Scholar] [CrossRef]
- Leao, S.Z.; Troy, L.; Lieske, S.N.; Randolph, B.; Pettit, C. A GIS based planning support system for assessing financial feasibility of urban redevelopment. GeoJournal 2018, 83, 1373–1392. [Google Scholar] [CrossRef]
- Chokshi, A.; Seyed, T.; Marinho Rodrigues, F.; Maurer, F. ePlan Multi-Surface: A Multi-Surface Environment for Emergency Response Planning Exercises. In Proceedings of the 9th ACM International Conference on Interactive Tabletops and Surfaces, Dresden, Germany, 16–19 November 2014; Dachselt, R., Graham, N., Hornbaek, K., Nacenta, M., Eds.; ACM: New York, NY, USA, 2014; pp. 219–228. [Google Scholar]
- Paelke, V.; Nebe, K.; Geiger, C.; Klompmaker, F.; Fischer, H. Multi-Modal, Multi-Touch Interaction with Maps in Disaster Management Applications. In Proceedings of the International Archives of the Photogrammetry, Remote Sensing and Spatial Information Sciences, Melbourne, Australia, 5 August–1 September 2012; pp. 55–60. [Google Scholar]
- Vonk, G.; Ligtenberg, A. Socio-technical PSS development to improve functionality and usability—Sketch planning using a Maptable. Landsc. Urban Plan. 2010, 94, 166–174. [Google Scholar] [CrossRef]
- Dias, E.; Linde, M.; Rafiee, A.; Koomen, E.; Scholten, H. Beauty and Brains: Integrating Easy Spatial Design and Advanced Urban Sustainability Models. In Planning Support Systems for Sustainable Urban Development; Geertman, S., Toppen, F., Stillwell, J., Eds.; Springer: Berlin/Heidelberg, Germany, 2013; pp. 469–484. [Google Scholar]
- Ryall, K.; Morris, M.R.; Everitt, K.; Forlines, C.; Shen, C. Experiences with and Observations of Direct-Touch Tabletops. In Proceedings of the 1st IEEE International Workshop on Horizontal Interactive Human-Computer Systems, Adelaide, Australia, 5–7 January 2006. [Google Scholar]
- Doeweling, S.; Tahiri, T.; Riemann, J.; Muehlhaeuser, M. Collaborative Interaction with Geospatial Data—A Comparison of Paper Maps, Desktop GIS and Interactive Tabletops. In Collaboration Meets Interactive Spaces; Anslow, C., Campos, P., Jorge, J., Eds.; Springer: Cham, Switzerland, 2016; pp. 319–348. [Google Scholar]
- Rogers, Y.; Lindley, S. Collaborating around vertical and horizontal large interactive displays: Which way is best? Interact. Comput. 2004, 16, 1133–1152. [Google Scholar] [CrossRef]
- Tong, L.; Tabard, A.; George, S.; Serna, A. Horizontal vs. Vertical: How the Orientation of a Large Interactive Surface Impacts Collaboration in Multi-surface Environments. In Proceedings of the IFIP Conference on Human-Computer Interaction, Bombay, India, 25–29 September 2017; pp. 202–222. [Google Scholar]
- Simon, H.A. The New Science of Management Decision; Harper: New York, NY, USA, 1960. [Google Scholar]
- Greiving, S.; Fleischhauer, M. Spatial planning response towards natural and technological hazards. Geol. Surv. Finl. 2006, 42, 109–123. [Google Scholar]
- Zucca, A.; Sharifi, A.M.; Fabbri, A.G. Application of spatial multi-criteria analysis to site selection for a local park: A case study in the Bergamo Province, Italy. J. Environ. Manag. 2008, 88, 752–769. [Google Scholar] [CrossRef] [PubMed]
- Goodspeed, R.; Pelzer, P. Organizing, Facilitating, and Evaluating PSS Workshops. In Handbook of Planning Support Science; Geertman, S., Stillwell, J., Eds.; Edward Elgar Publishing: Cheltenham, UK, 2020. [Google Scholar]
- McEvoy, S.; van de Ven, F.H.; Blind, M.W.; Slinger, J.H. Planning support tools and their effects in participatory urban adaptation workshops. J. Environ. Manag. 2018, 207, 319–333. [Google Scholar] [CrossRef] [PubMed]
- Eikelboom, T.; Janssen, R. Collaborative use of geodesign tools to support decision-making on adaptation to climate change. Mitig. Adapt. Strat. Glob. Chang. 2017, 22, 247–266. [Google Scholar] [CrossRef]
- Pelzer, P.; Arciniegas, G.; Geertman, S.; Lenferink, S. Planning Support Systems and Task-Technology Fit: A Comparative Case Study. Appl. Spat. Anal. 2015, 8, 155–175. [Google Scholar] [CrossRef][Green Version]
- Janssen, R.; Eikelboom, T.; Verhoeven, J.; Brouns, K. Using Geodesign to Develop a Spatial Adaptation Strategy for Friesland: In Geodesign by Integrating Design and Geospatial Sciences; Springer: Cham, Switzerland, 2014; pp. 103–116. [Google Scholar]
- Geertman, S.; Stillwell, J. (Eds.) Handbook of Planning Support Science; Edward Elgar Publishing: Cheltenham, UK, 2020. [Google Scholar]
- Brown, G.; Chin, S.Y.W. Assessing the Effectiveness of Public Participation in Neighbourhood Planning. Plan. Pract. Res. 2013, 28, 563–588. [Google Scholar] [CrossRef]
- Laurian, L.; Shaw, M.M. Evaluation of Public Participation. J. Plan. Educ. Res. 2009, 28, 293–309. [Google Scholar] [CrossRef]
- Gunton, T.; Day, J. The theory and practice of collaborative planning in resource and environmental management. Environments 2003, 31, 5–19. [Google Scholar]
- Rowe, G.; Frewer, L.J. Public Participation Methods: A Framework for Evaluation. Sci. Technol. Hum. Values 2000, 25, 3–29. [Google Scholar] [CrossRef]
- Mannarini, T.; Talò, C. Evaluating public participation: Instruments and implications for citizen involvement. Community Dev. 2013, 44, 239–256. [Google Scholar] [CrossRef]
- Russo, P.; Costabile, M.; Lanzilotti, R.; Pettit, C. Usability of Planning Support Systems: An Evaluation Framework. In Planning Support Systems and Smart Cities; Geertman, S., Ferreira, J., Goodspeed, R., Stillwell, J., Eds.; Springer: Heidelberg, Germany, 2015; pp. 337–354. [Google Scholar]
- Pelzer, P.; Geertman, S.; van der Heijden, R. A comparison of the perceived added value of PSS applications in group settings. Comput. Environ. Urban Syst. 2016, 56, 25–35. [Google Scholar] [CrossRef]
- Arciniegas, G.; Janssen, R.; Rietveld, P. Effectiveness of collaborative map-based decision support tools: Results of an experiment. Environ. Model. Softw. 2013, 39, 159–175. [Google Scholar] [CrossRef]
- Siebenhüner, B. The role of social learning on the road to sustainability. In Governance and Sustainability; Routledge: London, UK, 2005; pp. 85–99. [Google Scholar]
- Shrestha, R.; Flacke, J.; Martinez, J.A.; van Maarseveen, M. Interactive Cumulative Burden Assessment: Engaging Stakeholders in an Adaptive, Participatory and Transdisciplinary Approach. IJERPH 2018, 15, 260. [Google Scholar] [CrossRef] [PubMed]
- Rouwette, E.A.J.A.; Vennix, J.A.M.; van Mullekom, T. Group model building effectiveness: A review of assessment studies. Syst. Dyn. Rev. 2002, 18, 5–45. [Google Scholar] [CrossRef]
- Innes, J.E.; Booher, D.E. Consensus Building and Complex Adaptive Systems: A Framework for Evaluating Collaborative Planning. J. Am. Plan. Assoc. 1999, 65, 412–423. [Google Scholar] [CrossRef]
- Corburn, J. Healthy City Planning: From Neighbourhood to National Health Equity; Routledge: New York, NY, USA, 2013. [Google Scholar]
- Argyris, C.; Schön, D. Organizational Learning: A Theory of Action Perspective; Addison Wesley: New York, NY, USA, 1979. [Google Scholar]
- Pfeffer, K.; Baud, I.; Denis, E.; Scott, D.; Sydenstricker-Neto, J. Participatory spatial knowledge management tools. Inf. Commun. Soc. 2013, 16, 258–285. [Google Scholar] [CrossRef]
- Jacobs, C.; Koomen, E. A GIS-assisted method for defining an integrated vision of a climate proof Groningen. In Proceedings of the 13th AGILE International Conference on Geographic Information Science, Guimarães, Portugal, 10–14 May 2010. [Google Scholar]
- Bhandari, C.; Sharma, S.; Bishop, I.D.; Pettit, C. Visualizing future biolinks using a touch table—New dimensions in planning. In Proceedings of the Joint International Conference on Theory, Data Handling and Modelling in GeoSpatial Information Science, Hong Kong, China, 26–28 May 2010. [Google Scholar]
- Sharma, S.; Pettit, C.; Bishop, I.; Chan, P.; Sheth, F. An Online Landscape Object Library to Support Interactive Landscape Planning. Future Internet 2011, 3, 319–343. [Google Scholar] [CrossRef]
- Ligtenberg, A.; de Vries, B.; Vreenegoor, R.; Bulens, J. SimLandScape, a sketching tool for collaborative spatial planning. Urban Des. Int. 2011, 16, 7–18. [Google Scholar] [CrossRef]
- Slager, K.; Ligtenberg, A.; de Vries, B.; de Waard, R. Simlandscape: Serious gaming in participatory spatial planning. In Proceedings of the 10th AGILE International Conference on Geographic Information Science, Allborg, Denmark, 8–11 May 2007. [Google Scholar]
- Alexander, K.A.; Janssen, R.; Arciniegas, G.; O’Higgins, T.G.; Eikelboom, T.; Wilding, T.A.; Krkosek, M. Interactive Marine Spatial Planning: Siting Tidal Energy Arrays around the Mull of Kintyre. PLoS ONE 2012, 7, e30031. [Google Scholar] [CrossRef]
- Maquil, V.; Leopold, U.; de Sousa, L.M.; Schwartz, L.; Tobias, E. Towards a framework for geospatial tangible user interfaces in collaborative urban planning. J. Geogr. Syst. 2018, 20, 185–206. [Google Scholar] [CrossRef]
- Lenferink, S.; Arciniegas Lopez, G.; Samsura, A.; Carton, L. Integrating Geodesign and Game Experiments for Negotiating Urban Development. 2018. Available online: http://ojs-lib.tudelft.nl/index.php/rius/article/view/844 (accessed on 15 February 2018).
- Conniff, A.; Colley, K.; Irvine, K. Exploring Landscape Engagement through a Participatory Touch Table Approach. Soc. Sci. 2017, 6, 118. [Google Scholar] [CrossRef]
- Boulange, C.; Pettit, C.; Giles-Corti, B. The Walkability Planning Support System: An Evidence-Based Tool to Design Healthy Communities; Geertman, S., Ed.; Springer: Cham, Switzerland, 2017; pp. 153–165. [Google Scholar]
- Boulange, C.; Pettit, C.; Gunn, L.D.; Giles-Corti, B.; Badland, H. Improving planning analysis and decision making: The development and application of a Walkability Planning Support System. J. Transp. Geogr. 2018, 69, 129–137. [Google Scholar] [CrossRef]
- Pelzer, P.; Goodspeed, R.; te Brömmelstroet, M. Facilitating PSS Workshops: A Conceptual Framework and Findings from Interviews with Facilitators. In Planning Support Systems and Smart Cities; Geertman, S., Ferreira, J., Goodspeed, R., Stillwell, J., Eds.; Springer: Heidelberg, Germany, 2015; pp. 355–369. [Google Scholar]
- Phoenix; Geodan. Available online: https://www.geodan.com/products-and-services/local-government/phoenix/ (accessed on 17 December 2019).
- CommunityViz Software for Planners. Available online: http://communityviz.city-explained.com/communityviz/index.html (accessed on 17 December 2019).
- Armitage, D.; Marschke, M.; Plummer, R. Adaptive co-management and the paradox of learning. Glob. Environ. Chang. 2008, 18, 86–98. [Google Scholar] [CrossRef]
- UN Habitat. Urbanization and Development: Emerging Futures: World Cities Report 2016; UN Habitat: Nairobi, Kenya, 2016. [Google Scholar]
- Gemeente Enschede. Enschede Wekt op: De Inwoners Hebben Gesproken; Nu Samen Verder: Enschede, The Netherlands, 2017. [Google Scholar]
- te Brömmelstroet, M.; Schrijnen, P.M. From Planning Support Systems to Mediated Planning Support: A Structured Dialogue to Overcome the Implementation Gap. Environ. Plan. B Plan. Des. 2010, 37, 3–20. [Google Scholar] [CrossRef]
- Steiniger, S.; Hunter, A.J. The 2012 free and open source GIS software map—A guide to facilitate research, development, and adoption. Comput. Environ. Urban Syst. 2013, 39, 136–150. [Google Scholar] [CrossRef]
- Onyimbi, J.; Koeva, M.; Flacke, J. Public Participation Using 3D Web-Based City Models: Opportunities for E-Participation in Kisumu, Kenya. IJGI 2018, 7, 454. [Google Scholar] [CrossRef]
- Vonk, G.; Geertman, S.; Schot, P. Bottlenecks blocking widespread usage of planning support systems. Environ. Plan. 2005, 37, 909–924. [Google Scholar] [CrossRef]
- Fung, A. Putting the Public Back into Governance: The Challenges of Citizen Participation and Its Future. Public Admin. Rev. 2015, 75, 513–522. [Google Scholar] [CrossRef]
- Bovaird, T.; Loeffler, E. From Engagement to Co-production: The Contribution of Users and Communities to Outcomes and Public Value. Voluntas 2012, 23, 1119–1138. [Google Scholar] [CrossRef]
- Matosin, N.; Frank, E.; Engel, M.; Lum, J.S.; Newell, K.A. Negativity towards negative results: A discussion of the disconnect between scientific worth and scientific culture. Dis. Models Mech. 2014, 7, 171–173. [Google Scholar] [CrossRef] [PubMed]
- Knight, J. Null and void. Nature 2003, 422, 554–555. [Google Scholar] [CrossRef] [PubMed]
- Fanelli, D. Negative results are disappearing from most disciplines and countries. Scientometrics 2012, 90, 891–904. [Google Scholar] [CrossRef]
- Gwet, K. Handbook of Inter-Rater Reliability: The Definitive Guide to Measuring the Extent of Agreement among Raters; Advanced Analytics, LLC: Boca Raton, FL, USA, 2014. [Google Scholar]
- Te Brömmelstroet, M. Towards a pragmatic research agenda for the PSS domain. Transp. Res. Part A Policy Pract. 2017, 104, 77–83. [Google Scholar] [CrossRef][Green Version]
- Aguilar, R.; Flacke, J.; Pfeffer, K. Towards supporting collaborative spatial planning: Conceptualisation of a maptable tool through user stories. ISPRS Int. J. Geo-Inf. 2020, 9, 29. [Google Scholar] [CrossRef]
- Brhel, M.; Meth, H.; Maedche, A.; Werder, K. Exploring principles of user-centered agile software development: A literature review. Inf. Softw. Technol. 2015, 61, 163–181. [Google Scholar] [CrossRef]
- Champlin, C.J. Contextualizing Planning Support (Systems): Co-Designing to Fit the Dynamics of Spatial Strategy Making. Ph.D. Thesis, Universiteit Twente, Enschede, The Netherlands, 2019; p. 172. [Google Scholar] [CrossRef]
- Van de Ven, F.H.; Snep, R.P.; Koole, S.; Brolsma, R.; van der Brugge, R.; Spijker, J.; Vergroesen, T. Adaptation Planning Support Toolbox: Measurable performance information based tools for co-creation of resilient, ecosystem-based urban plans with urban designers, decision-makers and stakeholders. Environ. Sci. Policy 2016, 66, 427–436. [Google Scholar] [CrossRef]


| Dimensions, Aspects and Criteria | Definition in a PSS Workshop Context | Sources |
|---|---|---|
| Process: Communication and collaboration (C) | ||
| Transparent (tr) | Information about issues and process is available, clarity on model assumptions is given | [40,41] |
| Fair (fa) | Dialogue is free from bias, no group or single participant is dominating the workshop, and all participants are respectful with each other | [40,41] |
| Inclusive (in) | All participants are given equal opportunities to actively participate in the discussion | [40,41,44] |
| Efficient (ef) | Same and more tasks can be conducted with lower investments and/or in less time | [7,16] |
| Process: Social learning (L) | ||
| Awareness raising (aw) | Participants are informed and increase their knowledge about an issue | [9,41] |
| Single loop learning (sl) | Participants are changing behaviour to address a challenging situation | [12,49] |
| Double loop learning (dl) | Participants are reflecting underlying assumptions and values | [12,49] |
| Outcomes: Issue related outcomes | ||
| Knowledge created/integrated (kn) | Participants tacit/experiential knowledge is added | [12,49] |
| Consensus achieved (co) | Acceptable solutions are found based on mutual understanding | [7,40,41] |
| Understanding of the problem improved (un) | Participants can understand the given information and material (un) | [14,16] |
| Quality of decision improved (qa) | Decision integrates broad knowledge base and public input, New aspects added | [41] |
| Outcomes: Social outcomes | ||
| Ownership/commitment (ow) | Participants are committed to the outcome/plan | [16,50] |
| Mutual understanding (mu) | Participants understand each other’s perspectives and issues | [14,16,40,41] |
| Community building (cb) | Development of new collaborations, improved social cohesion | [51] |
| Satisfaction (sa) | High satisfaction among participants, participants are satisfied with process and outcomes | [14,16,40,41] |
| ID | Interactive PSS | Year | Purpose | References |
|---|---|---|---|---|
| 1 | MapTable | 2006 | Collaborative design water management measures along a river | [20] |
| 2 | Touch Table | 2010 | Integration of sectoral climate change adaptation measures | [55] |
| 3 | Landscape Constructor System | 2011 | 3D design and visualization of ecological corridor for forest regeneration | [56,57] |
| 4 | SimLandScape | 2011 | Integration of design and planning to facilitate a collaborative process | [58,59] |
| 5 | Interactive decision support tool | 2012 | Involvement of stakeholders in the entire planning process of analysis, design, choice | [10,60] |
| 6 | MapTable PSS | 2013 | Improved communication among stakeholders during different planning stages | [11,37] |
| 7 | Interactive geodesign tool | 2014 | Design of three spatial adaptation strategy for water management in peat meadow area | [38] |
| 8 | Geospatial Tangible User Interface (GTUI) | 2015 | Support of novel collaborative planning concepts | [61] |
| 9 | Adaptation Support Tool (AST) | 2016 | Collaborative design of green and blue adaptation measures | [21] |
| 10 | geodesign simulation game | 2016 | Negotiation of the supply of development sites at a regional level | [62] |
| 11 | Interactive Spatial Understanding Support System (ISUSS) | 2017 | Support of interactive knowledge co-production among stakeholders in an environmental health context | [12] |
| 12 | GPS Tracking and Maptable tool | 2017 | Exploration of spatial behaviour in the local landscape | [63] |
| 13 | Collaborative Location and Allocation Gaming Environment (COLLAGE) | 2017 | Collaborative allocation of renewable energy projects in a city | [9] |
| 14 | Cumulative burden assessment (CuBA) | 2018 | Collaborative assessment of multiple environmental burdens affecting health | [51] |
| 15 | Urban Redevelopment Financial Feasibility (URFF) | 2018 | Development different scenarios of urban redevelopment | [22] |
| 16 | Walkability PSS | 2018 | Exploration and design built environment scenarios regarding their impacts on walkability | [64,65] |
| Category | Criteria | Description |
|---|---|---|
| Application | Case studies, location | Cities/regions and countries where the tool has been applied to |
| Sector/field of application | The sector/field of application the tool is developed for and used in within the domain of spatial planning | |
| Scale | The planning level in which the tool has been used, from national to sub-local/neighbourhood level | |
| Goal of the application | The goal of the participatory activity, what the stakeholders are asked to do using the interactive PSS | |
| Tool | Hardware setup and system architecture | Hardware components of tool, next to the maptable, e.g., second screen, and system architecture, e.g., stand alone or server client system |
| Software | Software used on the maptable | |
| Main GIS functions | Main GIS function included in the model, e.g., drawing, annotating, multi criteria analysis, scenario analysis, 3D visualization, etc. | |
| External model(s) coupled | Whether an external model (e.g., simulation model) is coupled to the tool | |
| Stakeholders involved in tool development | Involvement of stakeholders in the development of the tool | |
| Participatory Process | Planning phase | Phases of a typical planning process that the tool is used in: problem analysis, design, choice [31] |
| Stakeholders/Participants | (Type of) stakeholders participating in the process (e.g., researchers, practitioners, citizens) | |
| Participatory process | What phases or steps the participants are going through during the participatory activity | |
| Other participatory steps | Whether other (also non-digital) steps and methods are included in the participatory activity, e.g., the drawing of a rich picture [12] | |
| Process facilitation | Involvement of facilitator, moderator, or chauffeur in the participatory activity [66] | |
| Process evaluation | Methods applied to evaluate workshop process and/or outcomes |
| Evaluation Dimension and Criteria | Hypothesized Impacts | Positive Measured Impacts | Negative Measured Impacts |
|---|---|---|---|
| Process: Communication/collaboration | |||
| Transparent (tr) | 2 1 | 1 | 1 |
| Fair (fa) | 4 | 2 | 2 |
| Inclusive (in) | 2 | 7 | 2 |
| Efficient (ef) | 3 | 4 | 2 |
| Communication/collaboration unspecific (C) | 12 | 12 | 3 |
| Process: Social learning | |||
| Awareness raising (aw) | 2 | 2 | 0 |
| Single loop learning (sl) | 1 | 2 | 0 |
| Double loop learning (dl) | 1 | 1 | 0 |
| Social learning, unspecific (L) | 4 | 5 | 1 |
| Outcome: Issue related outcomes | |||
| Knowledge created/integrated (kn) | 9 | 6 | 0 |
| Consensus achieved (co) | 3 | 6 | 2 |
| Problem understanding improved (un) | 4 | 8 | 0 |
| Quality of decision improved (qa) | 2 | 4 | 3 |
| Outcome: Social outcomes | |||
| Ownership/commitment (ow) | 1 | 0 | 0 |
| Mutual understanding (mu) | 2 | 9 | 0 |
| Community building (cb) | 0 | 0 | 0 |
| Satisfaction (sa) | 2 | 3 | 0 |
© 2020 by the authors. Licensee MDPI, Basel, Switzerland. This article is an open access article distributed under the terms and conditions of the Creative Commons Attribution (CC BY) license (http://creativecommons.org/licenses/by/4.0/).
Share and Cite
Flacke, J.; Shrestha, R.; Aguilar, R. Strengthening Participation Using Interactive Planning Support Systems: A Systematic Review. ISPRS Int. J. Geo-Inf. 2020, 9, 49. https://doi.org/10.3390/ijgi9010049
Flacke J, Shrestha R, Aguilar R. Strengthening Participation Using Interactive Planning Support Systems: A Systematic Review. ISPRS International Journal of Geo-Information. 2020; 9(1):49. https://doi.org/10.3390/ijgi9010049
Chicago/Turabian StyleFlacke, Johannes, Rehana Shrestha, and Rosa Aguilar. 2020. "Strengthening Participation Using Interactive Planning Support Systems: A Systematic Review" ISPRS International Journal of Geo-Information 9, no. 1: 49. https://doi.org/10.3390/ijgi9010049
APA StyleFlacke, J., Shrestha, R., & Aguilar, R. (2020). Strengthening Participation Using Interactive Planning Support Systems: A Systematic Review. ISPRS International Journal of Geo-Information, 9(1), 49. https://doi.org/10.3390/ijgi9010049