Article

On the Use of Single-, Dual-, and Quad-Polarimetric SAR Observation for Landslide Detection

1
Department of Energy and Mineral Resources Engineering, Sejong University, Seoul 05006, Korea
2
Satellite Operation & Application Center, Korea Aerospace Research Institute, Daejeon 34133, Korea
*
Author to whom correspondence should be addressed.
ISPRS Int. J. Geo-Inf. 2019, 8(9), 384; https://doi.org/10.3390/ijgi8090384
Submission received: 3 July 2019 / Revised: 26 August 2019 / Accepted: 30 August 2019 / Published: 2 September 2019

Abstract

:
Remote sensing technologies, particularly with Synthetic Aperture Radar (SAR) system, can provide timely and critical information to assess landslide distributions over large areas. Most space-borne SAR systems have been operating in different polarimetric modes to meet various operational requirements. This study aims to discuss how much detectability can be expected in the landslide map produced from the single-, dual-, and quad-polarization modes of observation. The experimental analysis of the characteristic changes of PALSAR-2 signals showed that quad-polarization parameters indicating signal depolarization properties revealed noticeable landslide-induced temporal changes for all local incidence angle ranges. To produce a landslide map, a simple change detection method based on characteristic scattering properties of landslide areas was proposed. The accuracy assessment results showed that the depolarization parameters, such as the co-pol coherence and polarizing contribution, can identify areas affected by landslides with a detection rate of 60%, and a false-alarm rate of 5%. On the other hand, the single- or dual-pol parameters can only be expected to provide half the accuracy with significant false-alarms in areas with temporal variations independent of landslides.

1. Introduction

Landslides are one of the most widespread natural disasters. Producing a landslide map or event inventory map is an essential task to understand the extent and magnitude of landslides. Remote sensing techniques can accelerate the production of landslide maps for large spatial scales [1]. Since the landslide triggering event often hampers the acquisition of optical remote sensing data, the microwave remote sensing techniques including Synthetic Aperture Radar (SAR) can be very useful tools for near real-time landslides detection. The application of SAR images related to landslides has been mainly studied for monitoring slow-moving landslides through interferometric SAR technique based on phase information of SAR images [2]. However, the use of SAR amplitude information for the landslide application is not widespread.
Most studies on the detection of event landslides using SAR amplitude information have been carried out using polarimetric SAR data to overcome difficulties in discriminating landslide areas from land cover classes. Czuchlewski et al. [3] employed L-band airborne polarimetric SAR data (AIRSAR) and examined the usability of polarimetric parameters for detecting a large slope failure triggered by an earthquake in Taiwan. The scattering characteristics of the landslide region were able to be identified by the eigenvalue-eigenvector decomposition [4]. After the launch of space-borne polarimetric SAR systems, several studies have been conducted to analyze the availability of satellite SAR data for landslide detection. Yonezawa et al. [5] applied another type of polarimetric decomposition, such as the model-based decomposition [6], as well as the eigenvalue-eigenvector decomposition to examine landslides triggered by the earthquake in Japan by using L-band ALOS PALSAR data. The model-based decomposition enables interpreting radar images more easily by fitting elementary scattering models, such as the surface scattering, the double-bounce scattering, and the volume scattering, into the polarimetric SAR observation. They found that the surface scattering component can be dominant among other scattering mechanisms in landslide areas. Shibayama et al. [7] applied a similar approach to ALOS-2 PALSAR-2 data, which observed several landslide scars triggered by a typhoon. They examined the scattering properties of landslide areas by an improved version of the model-based decomposition [8] in relation to the local slopes. Wang et al. [9] also applied similar decomposition techniques to examine X-band polarimetric response of landslide areas in China using airborne polarimetric SAR data. Plank et al. [10] further investigated X-band scattering properties of landslide areas using space-borne TerraSAR-X data. Instead of full quad-polarimetric parameters, they used the dual-polarization eigenvalue parameter of TerraSAR-X data and the spectral vegetation index of optical data to generate landslide maps in two different landslide sites in USA and Russia.
Most space-borne SAR systems have been operating in different polarimetric modes, such as the single-polarization (single-pol), dual-polarization (dual-pol), and full or quad-polarization (quad-pol) modes, to meet various operational requirements on the resolution and coverages. In this study, we analyzed the different polarimetric SAR observables, which can be obtained from different polarimetric modes, for detecting landslide areas. However, since there is a lack of studies on the appropriate polarimetric mode for observing disasters such as landslides, it can be difficult to carry out emergency observation effectively. This study aims to discuss how one can actually map the landslide area using each polarimetric mode. Although there were several studies to identify landslides using polarimetric SAR data, few studies performed detection and analyzed accuracies. In this study, we also analyzed how much detectability can be expected in the landslide map produced from each polarimetric observation. Several landslides triggered by the 2016 Kumamoto earthquake in Japan were investigated using the PALSAR-2 data of the ALOS-2 satellite acquired in pre- and post-landslide conditions. This paper is organized as follows: In Section 2, the study area and a description of the acquired SAR data used for this paper are discussed. In Section 3, radar scattering behaviors observed by single-, dual- and quad-pol parameters are discussed. Methods to generate landslide map and the experimental results are presented in Section 4. Discussion on the detection results in relation to the previous studies and environmental conditions are given in Section 5, and summaries and concluding remarks are presented in Section 6.

2. Study Area and Data

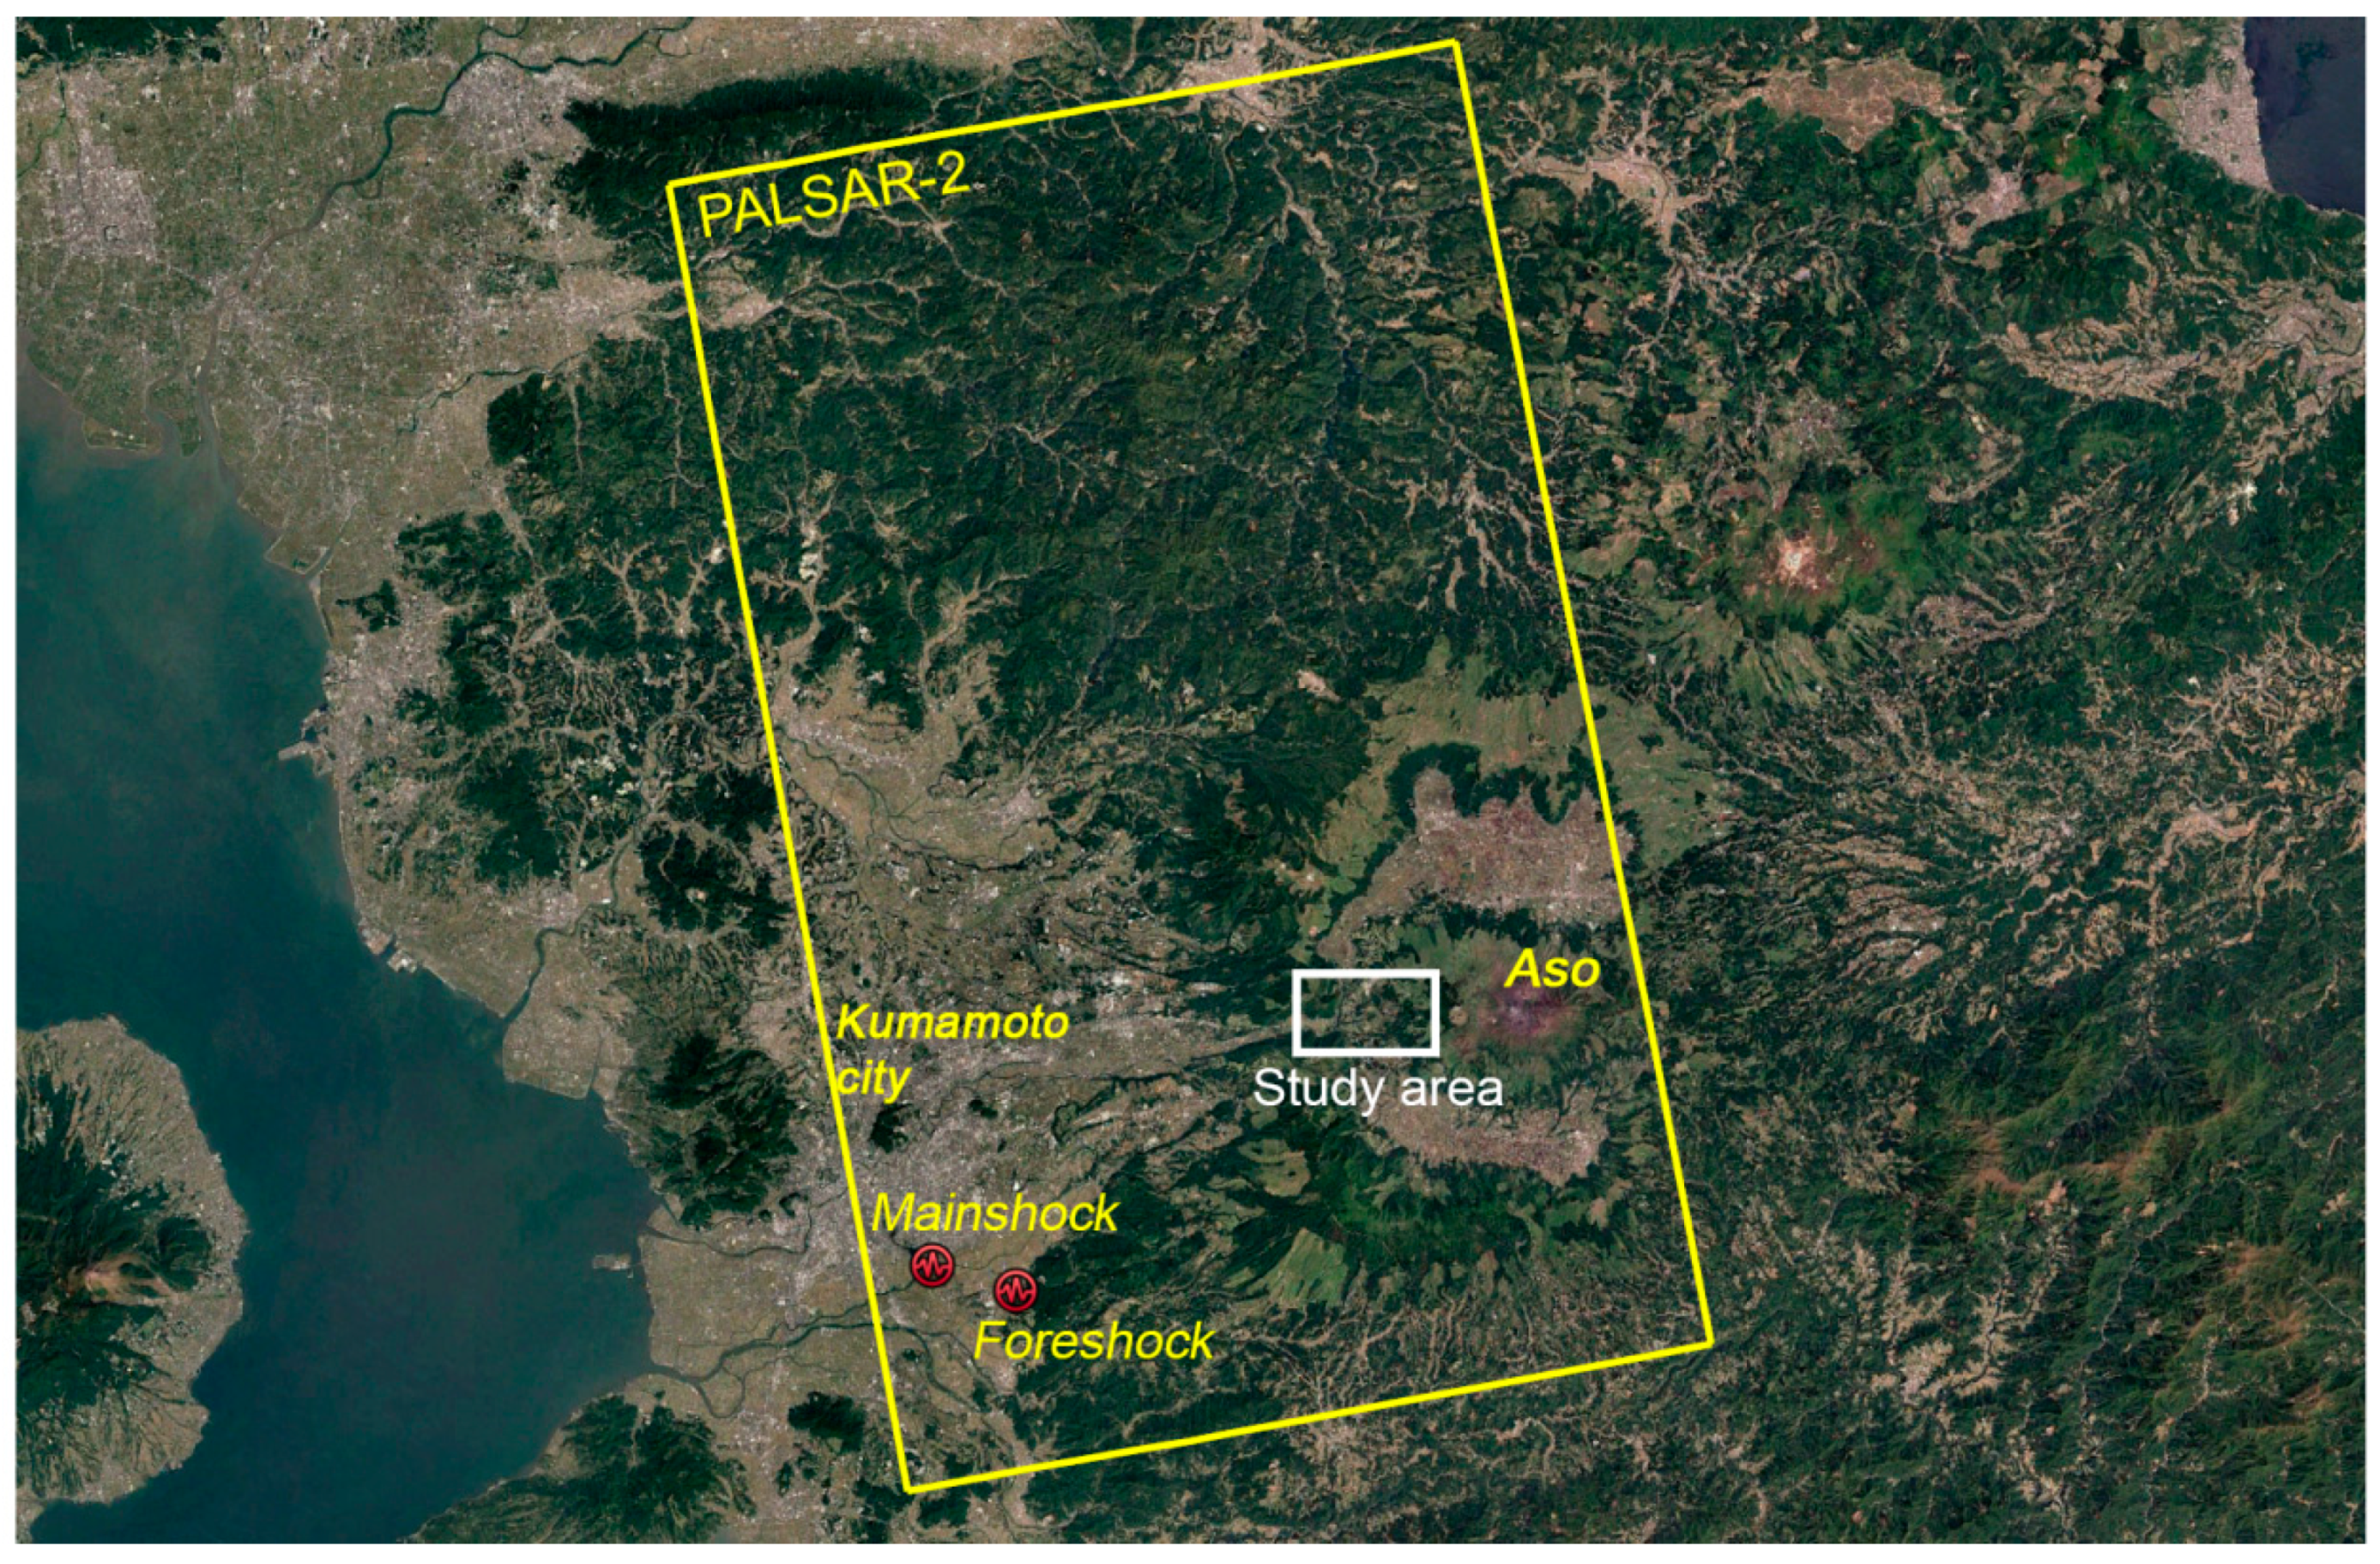
A series of earthquakes occurred in Kumamoto, Kyushu Island, Japan in 2016 [11]. The first major shock (foreshock) occurred at 21:26 Japanese Standard Time (JMT) on 14 April 2016 with the moment magnitude of Mw 6.2. Subsequently, on 16 April at 01:26 JMT, a second strong shock (mainshock) occurred nearby with the magnitude of Mw 7.0. The foreshock occurred at a depth of 11 km. The focal mechanism exhibited right-lateral strike-slip faulting with a NNW–SSE tension axis. The epicenter of the mainshock is approximately 4.5 km northwest of the epicenter of the foreshock. Figure 1 shows the epicenter of the foreshock and mainshock. The focal mechanism of the mainshock is a right-lateral strike-slip fault with a tension axis in the NW-SE direction. It triggered numerous landslides in and around Minamiaso, which is located in the western part of Aso caldera [12].
Among several observation modes of the ALOS-2 PALSAR-2 sensor, a fully polarimetric quad-pol mode data observed on 21 April 2016, about 5 days after the mainshock, was obtained in this study. In addition, a pre-event quad-polarization PALSAR-2 data observed on 3 December 2015 was obtained with the same observation mode. To evaluate landslide-induced changes of SAR signals, a study area (white rectangle in Figure 1) was selected in which several landslides and slope failures occurred by the Kumamoto earthquakes.
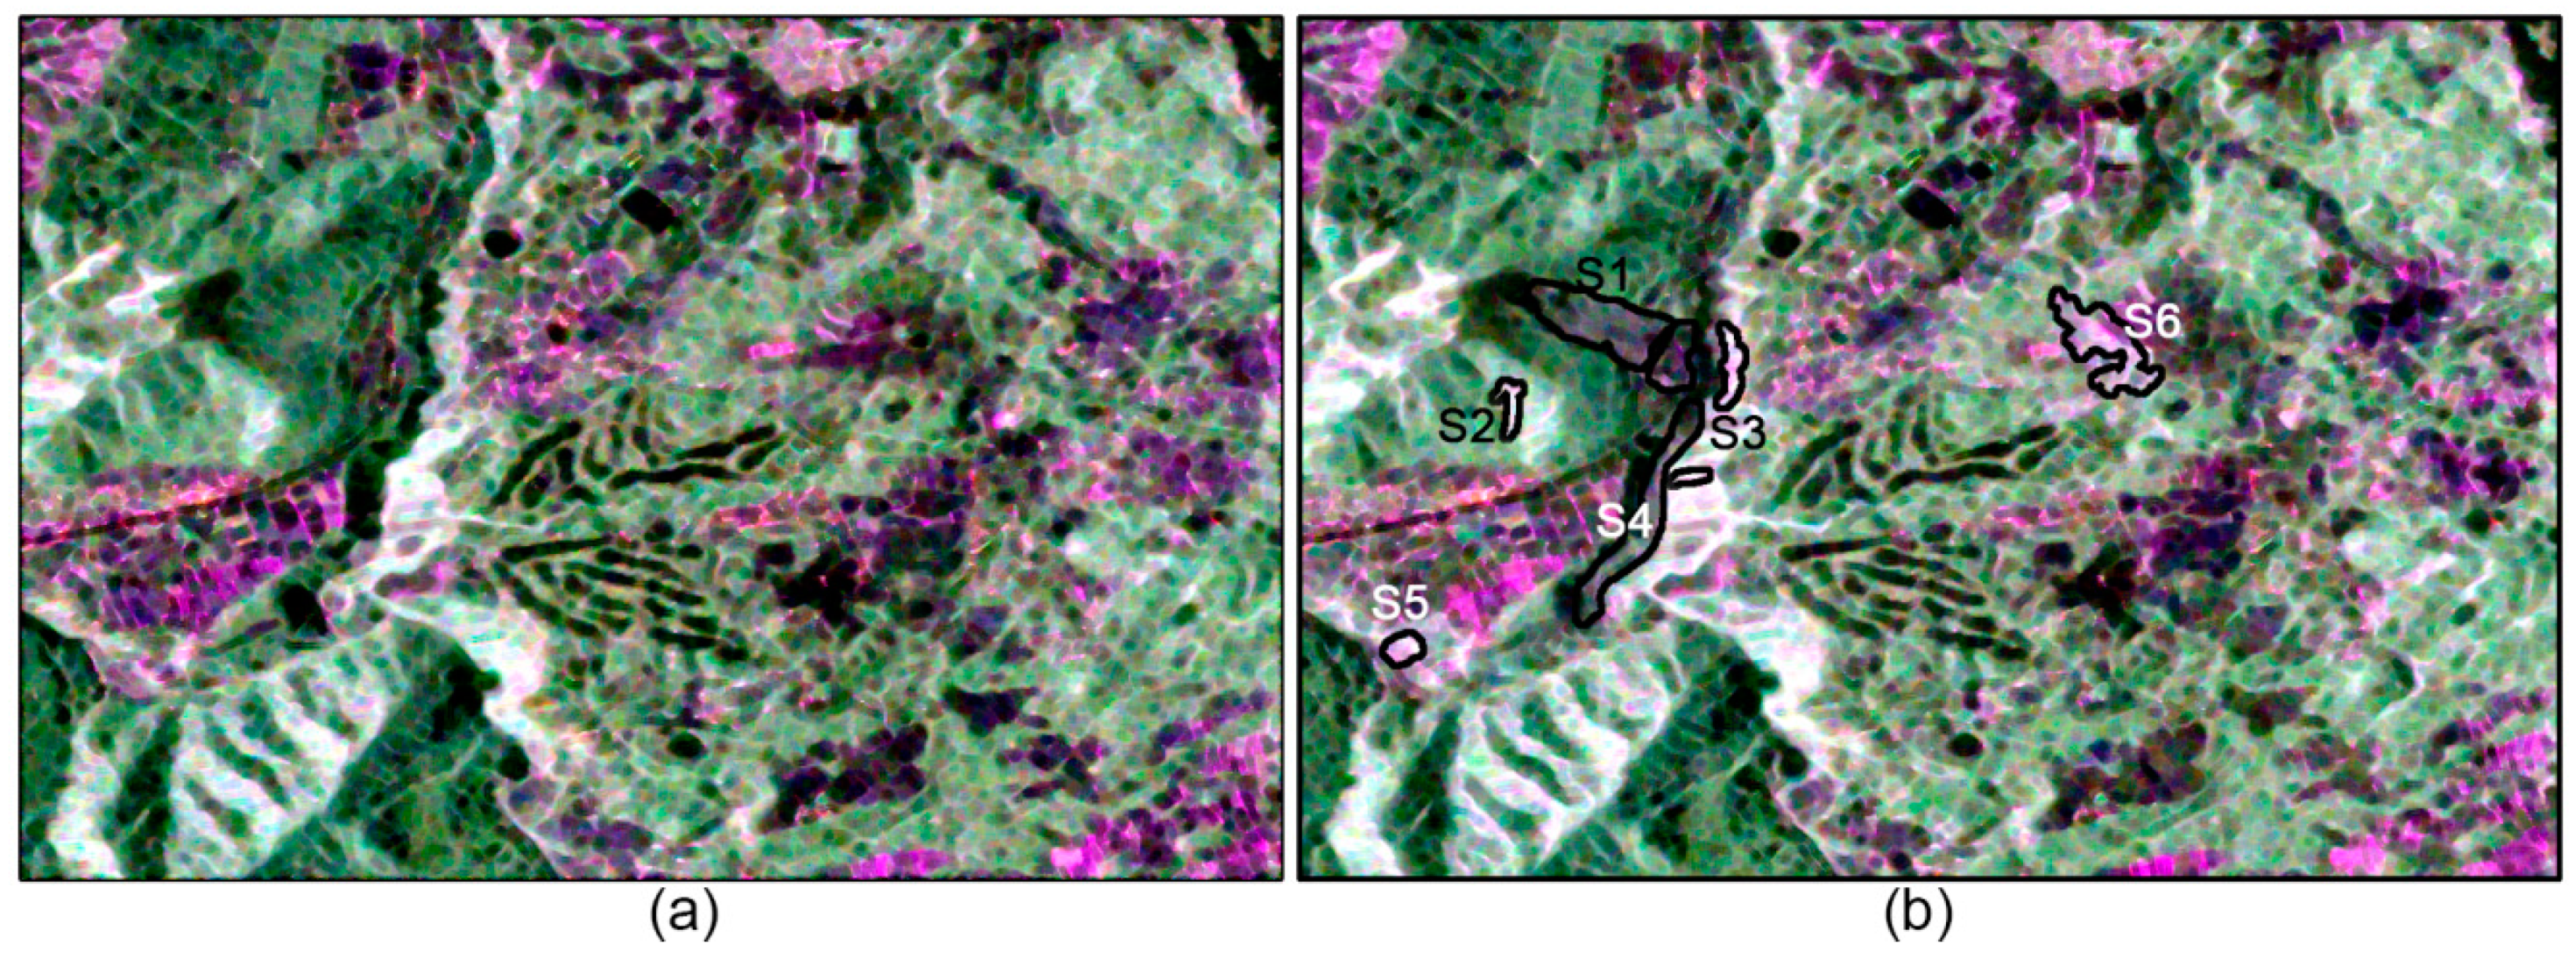
The PALSAR-2 images of the study area acquired before and after the earthquake are shown in Figure 2. Six landslides sites (marked in black in Figure 2b) for the examination of radar scattering responses were manually selected by the literature [12] and the aerial photos [13]. Three of the selected landslides (S1, S2, and S3) occurred in forested areas, while the other three (S4, S5, and S6) occurred in non-forested grasslands and shrublands. Since a landslide generally occurs in sloping terrain, geometric distortions of SAR image should be corrected before further analysis of SAR signals. To represent the SAR images as geometrically similar to the map coordinates, all SAR images were converted to the multilook covariance matrix format [14]. Then, the range-Doppler orthorectification was performed by using SRTM (Shuttle Radar Topography Mission) global 1 arc second digital elevation model (DEM). In addition, polarimetric speckle filtering using the IDAN filter [15] was applied to all PALSAR-2 data to reduce speckle.

3. Radar Scattering Characteristics of Landslide Area

In this Section, we recall the single-, dual-, and quad-pol SAR observables and evaluate their scattering characteristics of manually selected landslide affected areas.

3.1. Single-Pol Scattering Characteristics

Most of conventional SAR systems have been operated in the single polarization channel, which transmit and receive either horizontally (H) or vertically (V) polarized electromagnetic wave. In this study, we will only consider the horizontally polarized signal. The horizontally polarized scattered field E H s is related the incident field E H i by the complex scattering amplitude S H H as
E H s = e j k r r S H H E H i .
where k is wavenumber and r is the distance between the target and the receiving antenna. The scattering amplitude depends on the dielectric and geometric properties of the scatterer in the direction of incident and scattered fields. The scattering properties of natural objects can be generally described by the backscattering coefficient σ H H 0 = S H H S H H * = | S H H | 2 , which is the averaged scattering intensity of a distributed scatterer.
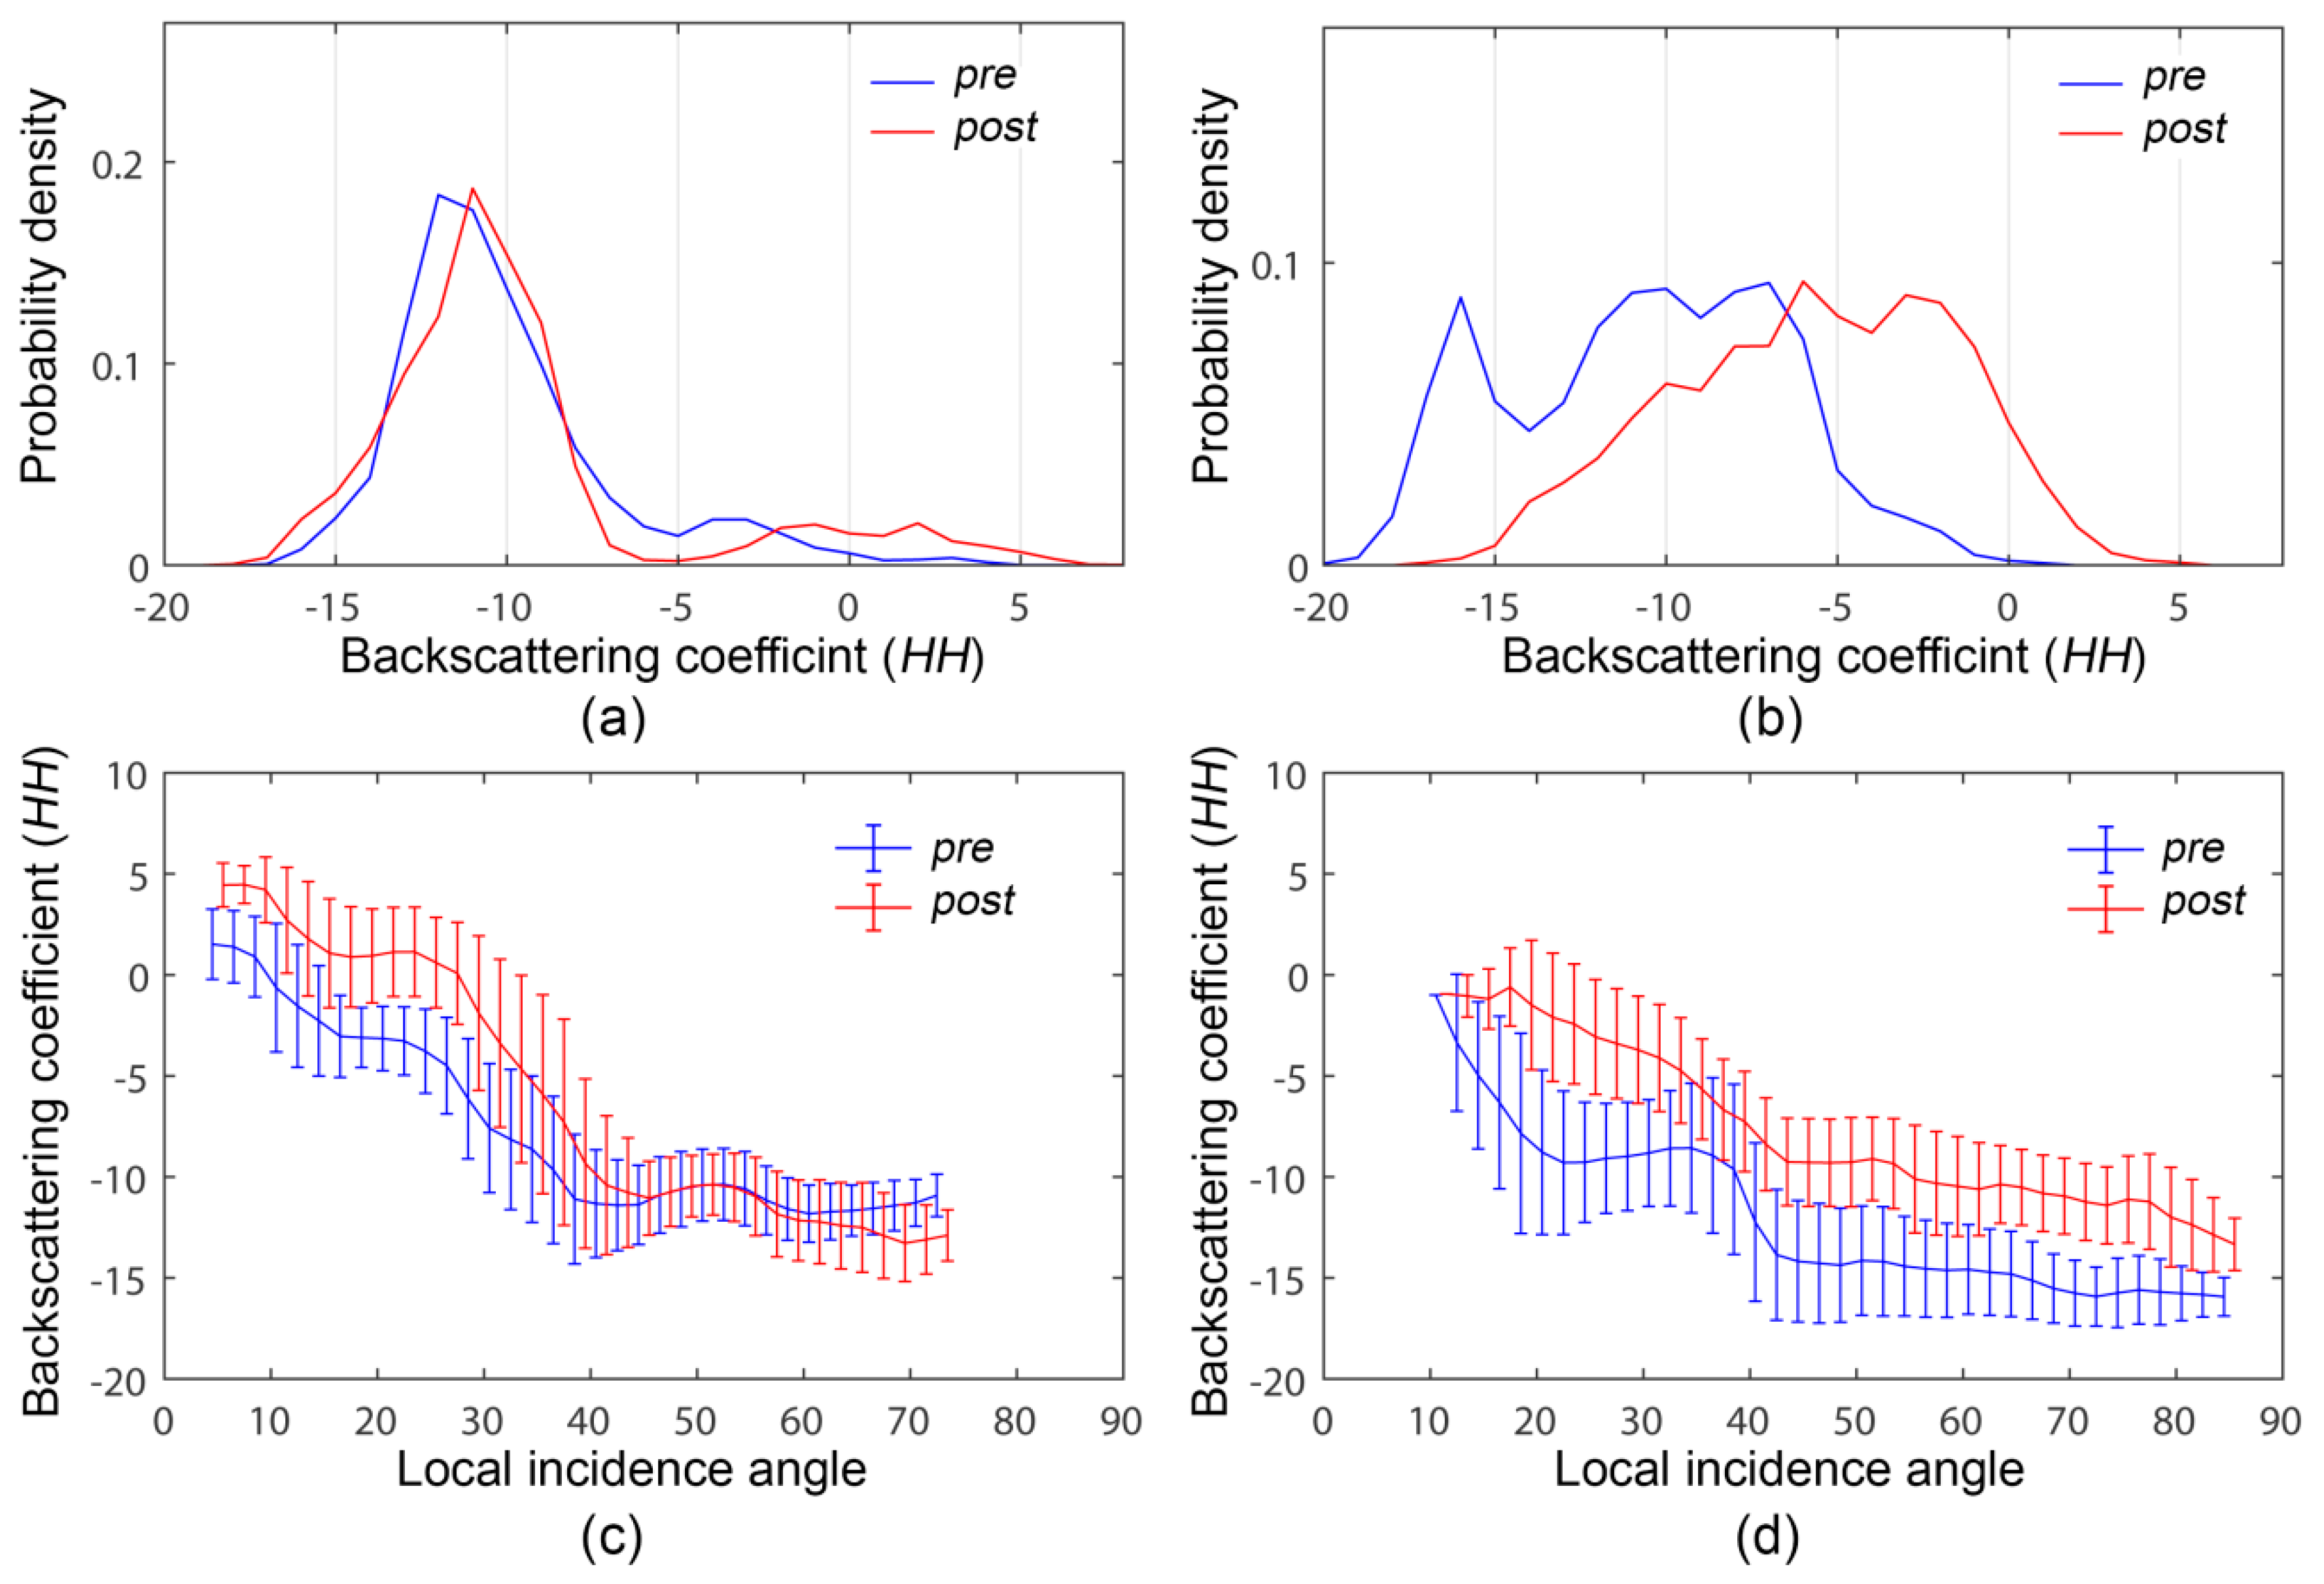
Figure 3a,b show temporal σ H H 0 histograms acquired over the selected landslide sites that occurred in forested areas and non-forested grasslands and shrublands, respectively. It is seen that σ H H 0 generally increases after the landslides occurred in non-forested areas, while there is no clear difference between the two histograms in forested areas. It is probably attributed to changes in the microwave scattering mechanisms, particularly the surface and double-bounce scattering mechanisms, in mountainous forest areas [16].
In the case of the sloping terrain, topography effects should be considered in the analysis of scattering response. Particularly, it was shown in the previous study [16] that the variations of local incidence angle due to local topography can lead to changes in the scattering processes. The local incidence angle θ l is defined as the angle between the line of sight direction and the surface normal as
cos θ l = tan α r g sin θ + cos θ 1 + tan 2 α r g + tan 2 α a z ,
where α r g and α a z are local slope angles in range and azimuth directions respectively, and θ is the incidence angle defined in the flat geometry. Figure 3c,d show the landslide-induced changes of σ H H 0 in relation to the local incidence angle. The uncertain temporal variations of in σ H H 0 histogram can be better explained by the local incidence angle. The temporal changes show different angular trends, particularly in forested areas. The σ H H 0 value increases after the landslide at the low local incidence angle region while it shows no apparent changes at the high local incidence angle regions.

3.2. Dual-Pol Scattering Characteristics

According to the observation strategy [17], PALSAR-2 primarily acquires data in the dual-pol mode. It employs a single polarization transmission (H) and dual (H and V) coherent reception. The dual-pol mode provides two complex scattering amplitude, S H H and S V H , which relate the incident and scattered signals as
[ E H s E V s ] = e j k r r [ S H H S V H ] E H i ,
Then, the dual-pol covariance matrix [ C 2 ] can be obtained by applying multilook processing to the dual-pol complex scattering vector k 2 = [ S H H S V H ] T , such as
[ C 2 ] = k 2 k 2 * T = [ S H H S H H * S H H S V H * S V H S H H * S V H S V H * ] .
The diagonal terms of the dual-pol covariance matrix provides additional scattering intensity in VH-polarization basis, such as σ V H 0 = S V H S V H * = | S V H | 2 . The off-diagonal term is the correlation between HH (co-pol) and VH (cross-pol) scattering amplitudes. Since there will be usually no co- and cross-pol correlation term in natural reflection symmetric media, two scattering intensities or backscattering coefficients are the two important observables in the dual-pol mode.
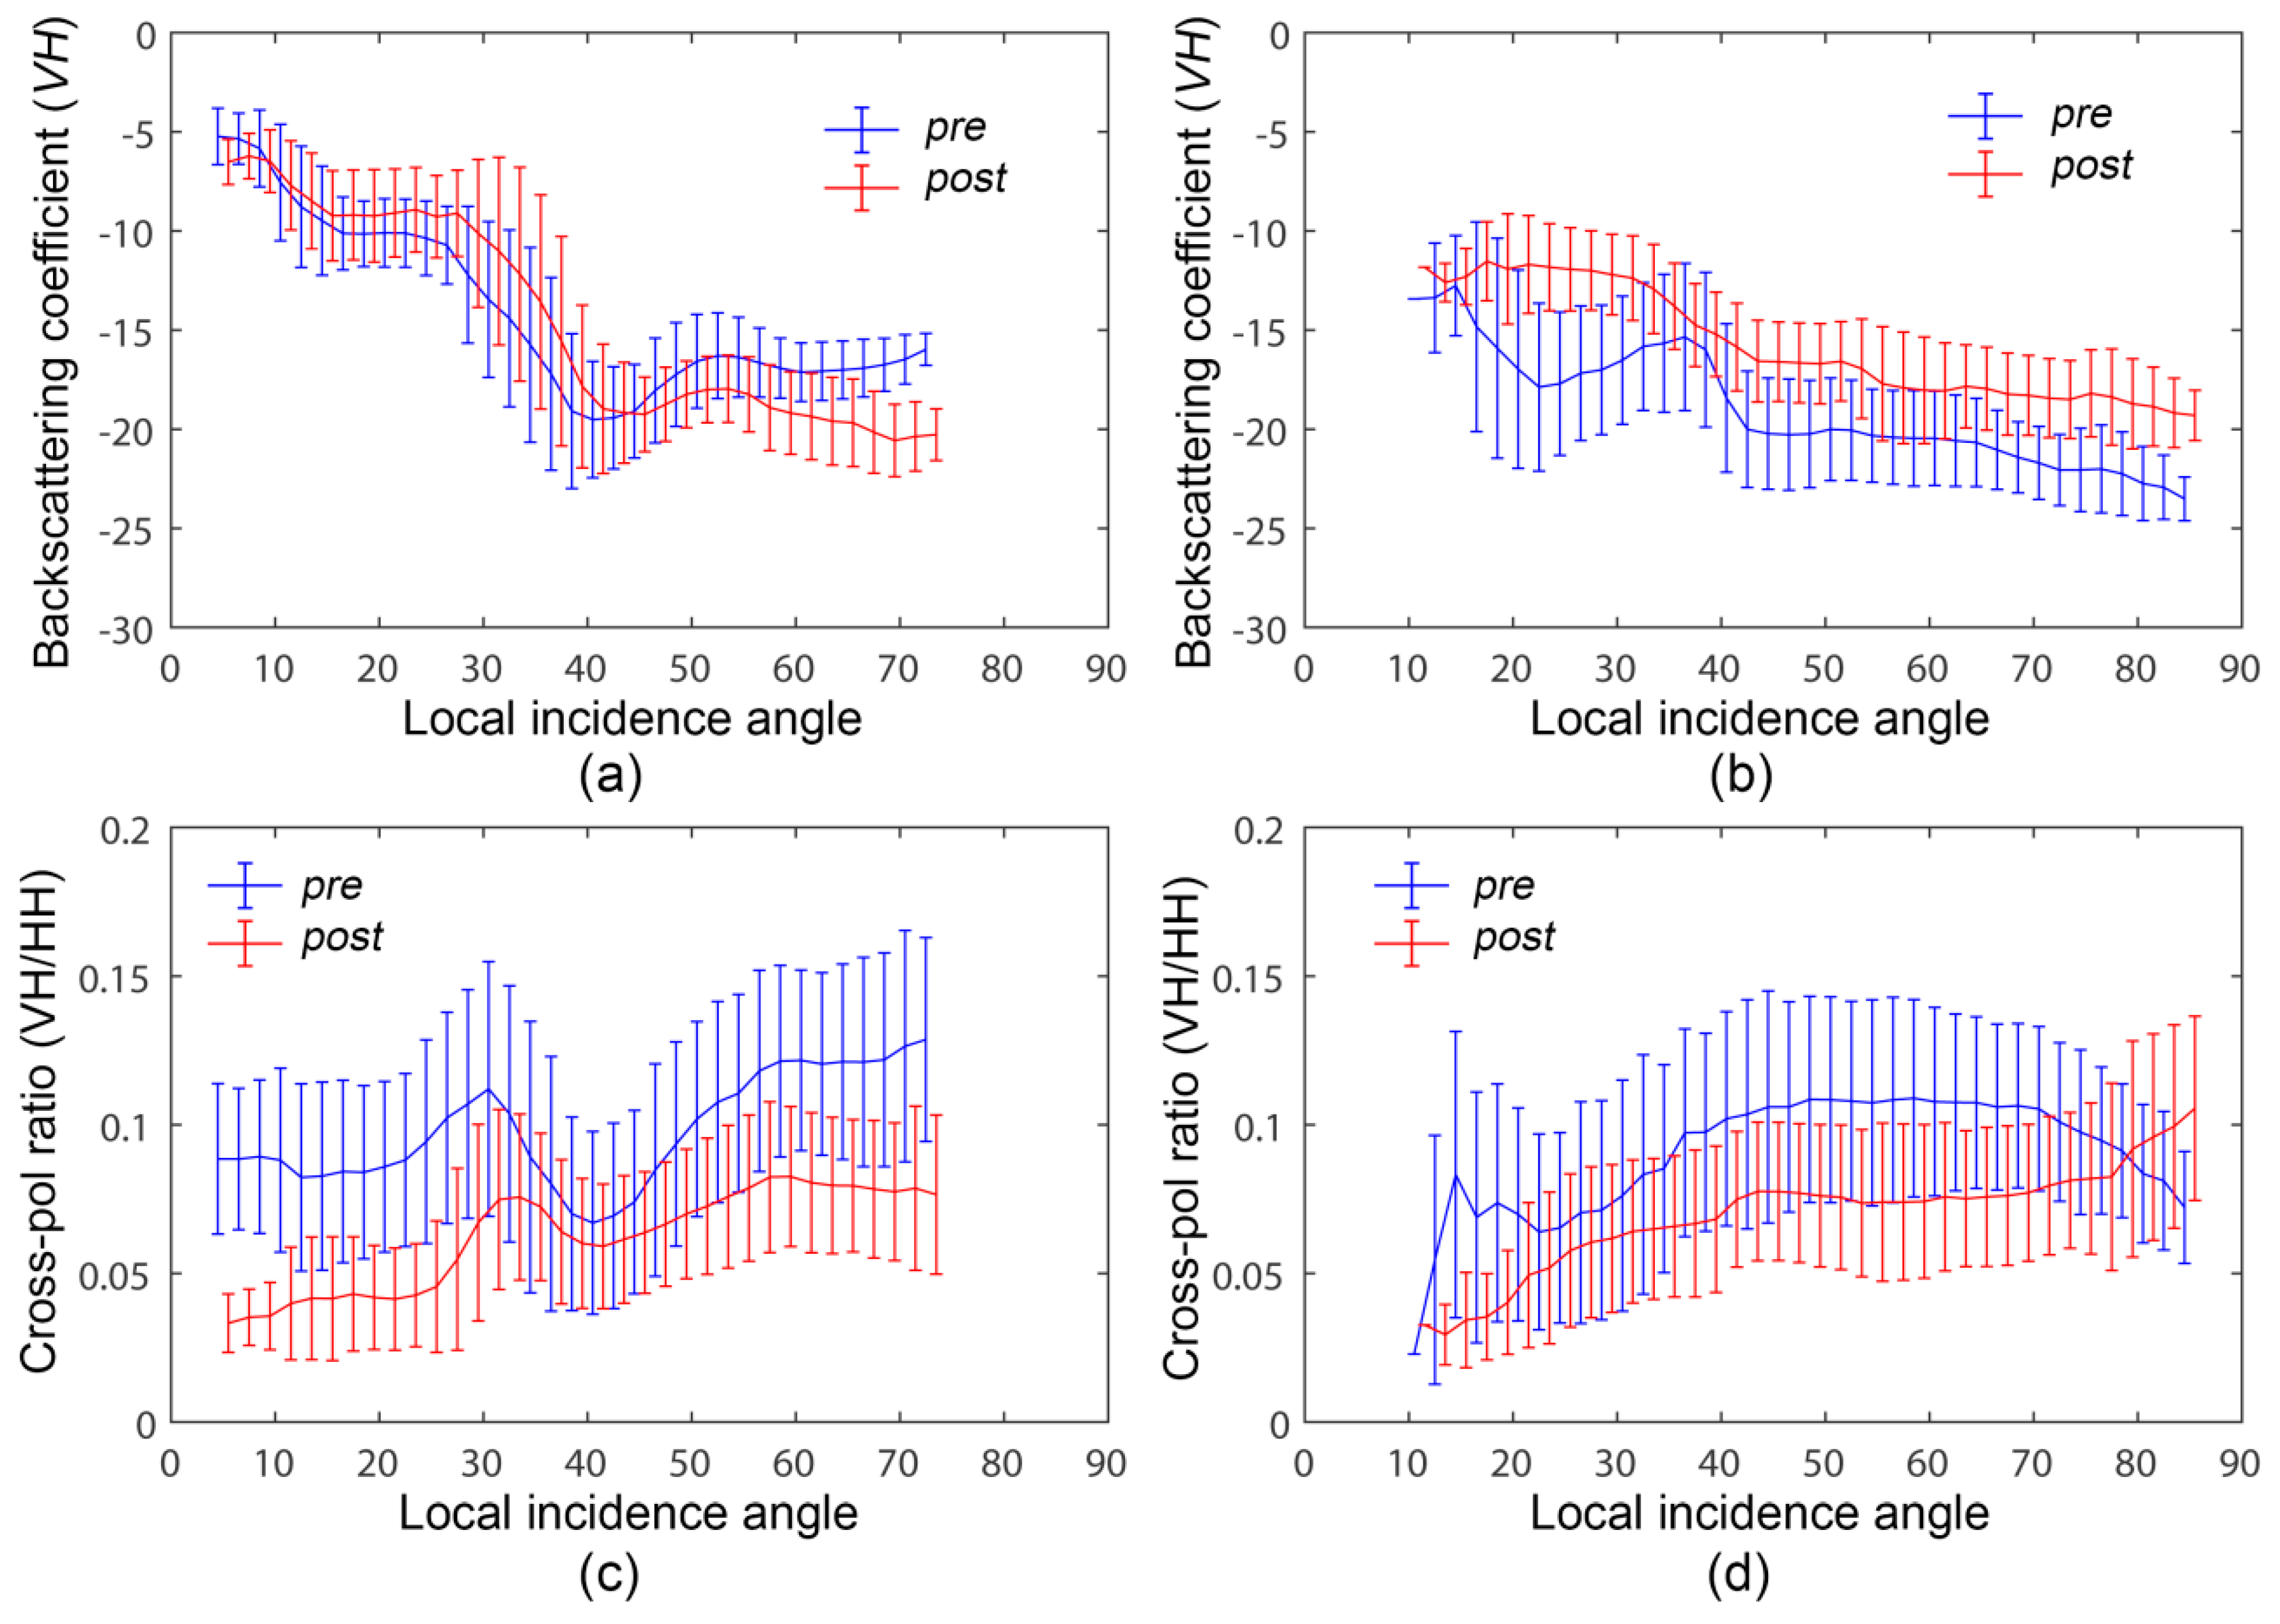
Figure 4a,b show temporal σ V H 0 values of landslide areas that occurred in forested and non-forested areas. As compared with the σ H H 0 case, it shows slightly better separation between pre- and post-landslide conditions at the high incidence angle region, while it shows no apparent differences at the low local incidence angle regions. The two polarization channels exhibit somewhat complementary angular trends, the ratio between VH- and HH-polarization intensities, such as the cross-pol ratio σ V H 0 / σ H H 0 , can be used to further characterize landslide-related backscatter changes. Figure 4c,d show the cross-pol ratio of landslide affected areas in relation to the local incidence angle. It shows a much weak angular dependency on the local incidence angle variations and emphasizes the landslide-induced changes of radar scattering properties in forested areas at either low or high local incidence angle region.

3.3. Quad-Pol Scattering Characteristics

In general case, both the incidence wave and the wave scattered by an object can be adequately described by the two-dimensional orthogonal bases. The incidence wave of the quad-pol mode observation has both horizontal and vertical polarization component. Then, a scattering object can be characterized by the 2 × 2 complex scattering matrix [ S ] , such as
[ E H s E V s ] = e j k r r [ S H H S H V S V H S V V ] [ E H i E V i ] = e j k r r [ S ] [ E H i E V i ] .
The scattering properties of natural media can be described by the quad-pol covariance matrix. In the monostatic backscattering case, when S H V = S V H by the scattering reciprocity, the quad-pol covariance matrix [ C 3 ] can be formed by the complex scattering vector k 3 = [ S H H 2 S H V S V V ] T , such as
[ C 3 ] = k 3 k 3 * T = [ S H H S H H * 2 S H H S H V * S H H S V V * 2 S H V S H H * S H V S H V * 2 S H V S V V * S V V S H H * 2 S V V S H V * S V V S V V * ] .
The Hermitian [ C 3 ] matrix is fully characterized by nine real parameters: three polarimetric intensities in the diagonal elements and three complex polarimetric correlations in the off-diagonal elements. As aforementioned, the co- and cross-pol correlation terms, S H H S H V * and S H V S V V * , will be close to zero for the natural scatterers having reflection symmetry. On the other hand, the correlation coefficient between HH- and VV-polarization, such as S H H S V V * / { S H H S H H * S V V S V V * } , contains important information on the scatterers. The magnitude of the correlation, named co-pol coherence ρ H H V V , indicates signal depolarization and varies from 0 for completely random signal to 1 for pure single scattering [18]. Since a landslide generally results in changes of land cover types from vegetation to bare surface, identification of signal depolarization properties will be important in mapping landslide affected areas.
In addition to the polarimetric intensities and correlation terms in the [ C 3 ] matrix, the general depolarization properties of a scatterer can be characterized by using the eigenvalue analysis [18]. By definition, [ C 3 ] is a Hermitian matrix and can be decomposed into three real non-negative eigenvalues and three orthogonal unitary eigenvectors as:
[ C 3 ] = i = 1 3 λ i e i e i * T = i = 1 3 λ i [ C 3 i ] ,
where λ i and e i are eigenvalues and eigenvectors of [ C 3 ] , respectively.
The eigenvalue decomposition expands [ C 3 ] into the sum of three uncorrelated target matrices [ C 3 i ] where the eigenvalues λ i ( λ 1 λ 2 λ 3 0 ) are the statistical weights for the three components. The amount of polarizing contribution corresponds to the largest eigenvalue while the other eigenvalues are the depolarization components in the [ C 3 ] matrix. Consequently, the relative contribution of the eigenvalues can be a good indicator of system depolarization properties. In order to interpret the eigenvalue contributions, we can define pseudo probabilities P i as
P i = λ i λ 1 + λ 2 + λ 3 .
The spread of probabilities can be represented by the single scaler measure, such as polarimetric entropy H defined as [19]:
H = i = 1 3 P i log 3 P i .
It indicates the scattering randomness which ranges from 0 (single nonzero eigenvalue) for the single scatter to 1 (three equal eigenvalues) for the random scatterer.
For a highly depolarizing media, the entropy is not a unique function of the eigenvalue ratios, and another eigenvalue parameter defined as the polarimetric anisotropy A defined as Equation (10) can be useful to describe two minor eigenvalues [20].
A = λ 2 λ 3 λ 2 + λ 3
It indicates relative importance of the second and the third eigenvalues which also ranges from 0 to 1. High entropy and low anisotropy values imply strongly depolarizing systems with the presence of several scattering mechanisms.
In addition to the entropy and anisotropy parameters, each eigenvalue contribution in Equation (8) can be directly used as a measure of depolarization in a random media. Among them, the smallest eigenvalue P 3 has been used to infer the amount of vegetation. It is called Radar Vegetation Index (RVI) defined as [21]
R V I = 4 P 3 .
The factor 4 was introduced so that the RVI for a cloud of randomly oriented thin cylinders would be equal to 1. On the other hand, the amount of polarizing contribution among backscattered signals, which is represented by the largest eigenvalue P 1 [18], can be a useful parameter for identifying changes of signal depolarization levels caused by the landslide. P 1 has a maximum value of 1 when λ 2 = λ 3 = 0 and a minimum value of 1/3 when λ 1 = λ 2 = λ 3 . Therefore, as in the case of RVI, the normalized value of P 1 , named P p o l , can be defined as:
P p o l = 1.5 P 1 0.5 .
It indicates the polarizing contribution of a partially polarized system which ranges from 0 for the random noise process to 1 for the pure polarizing target.
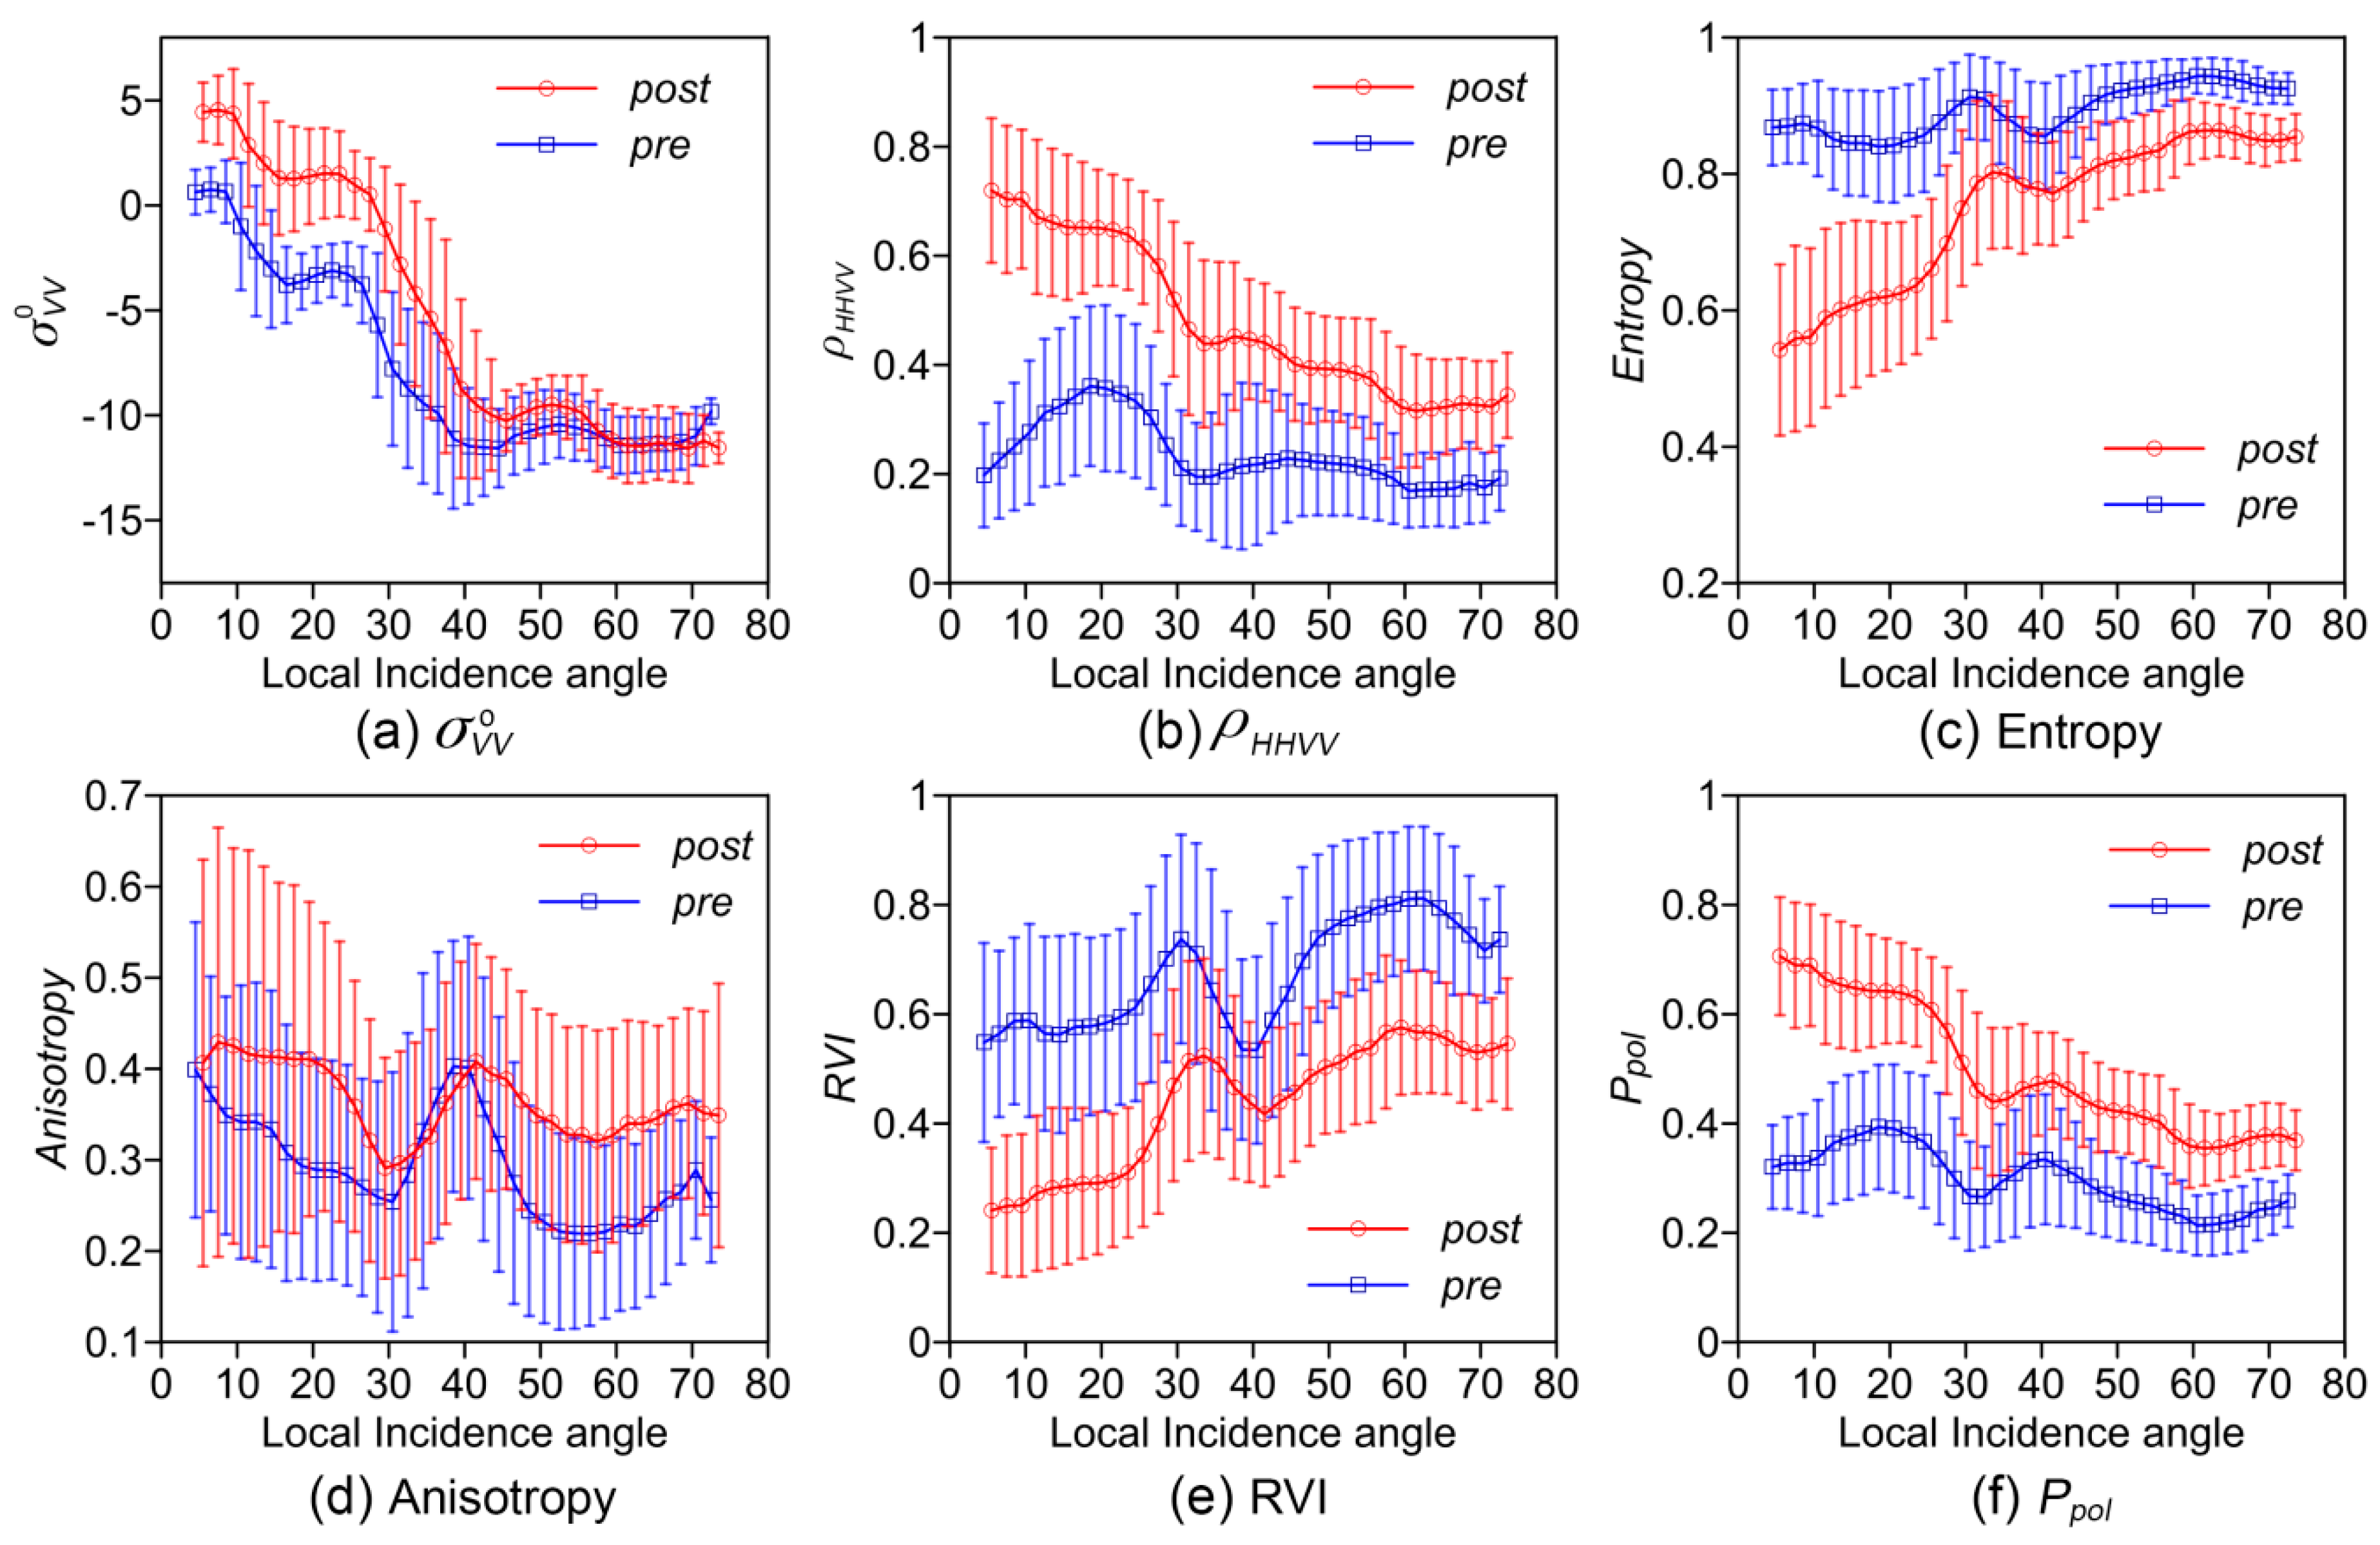
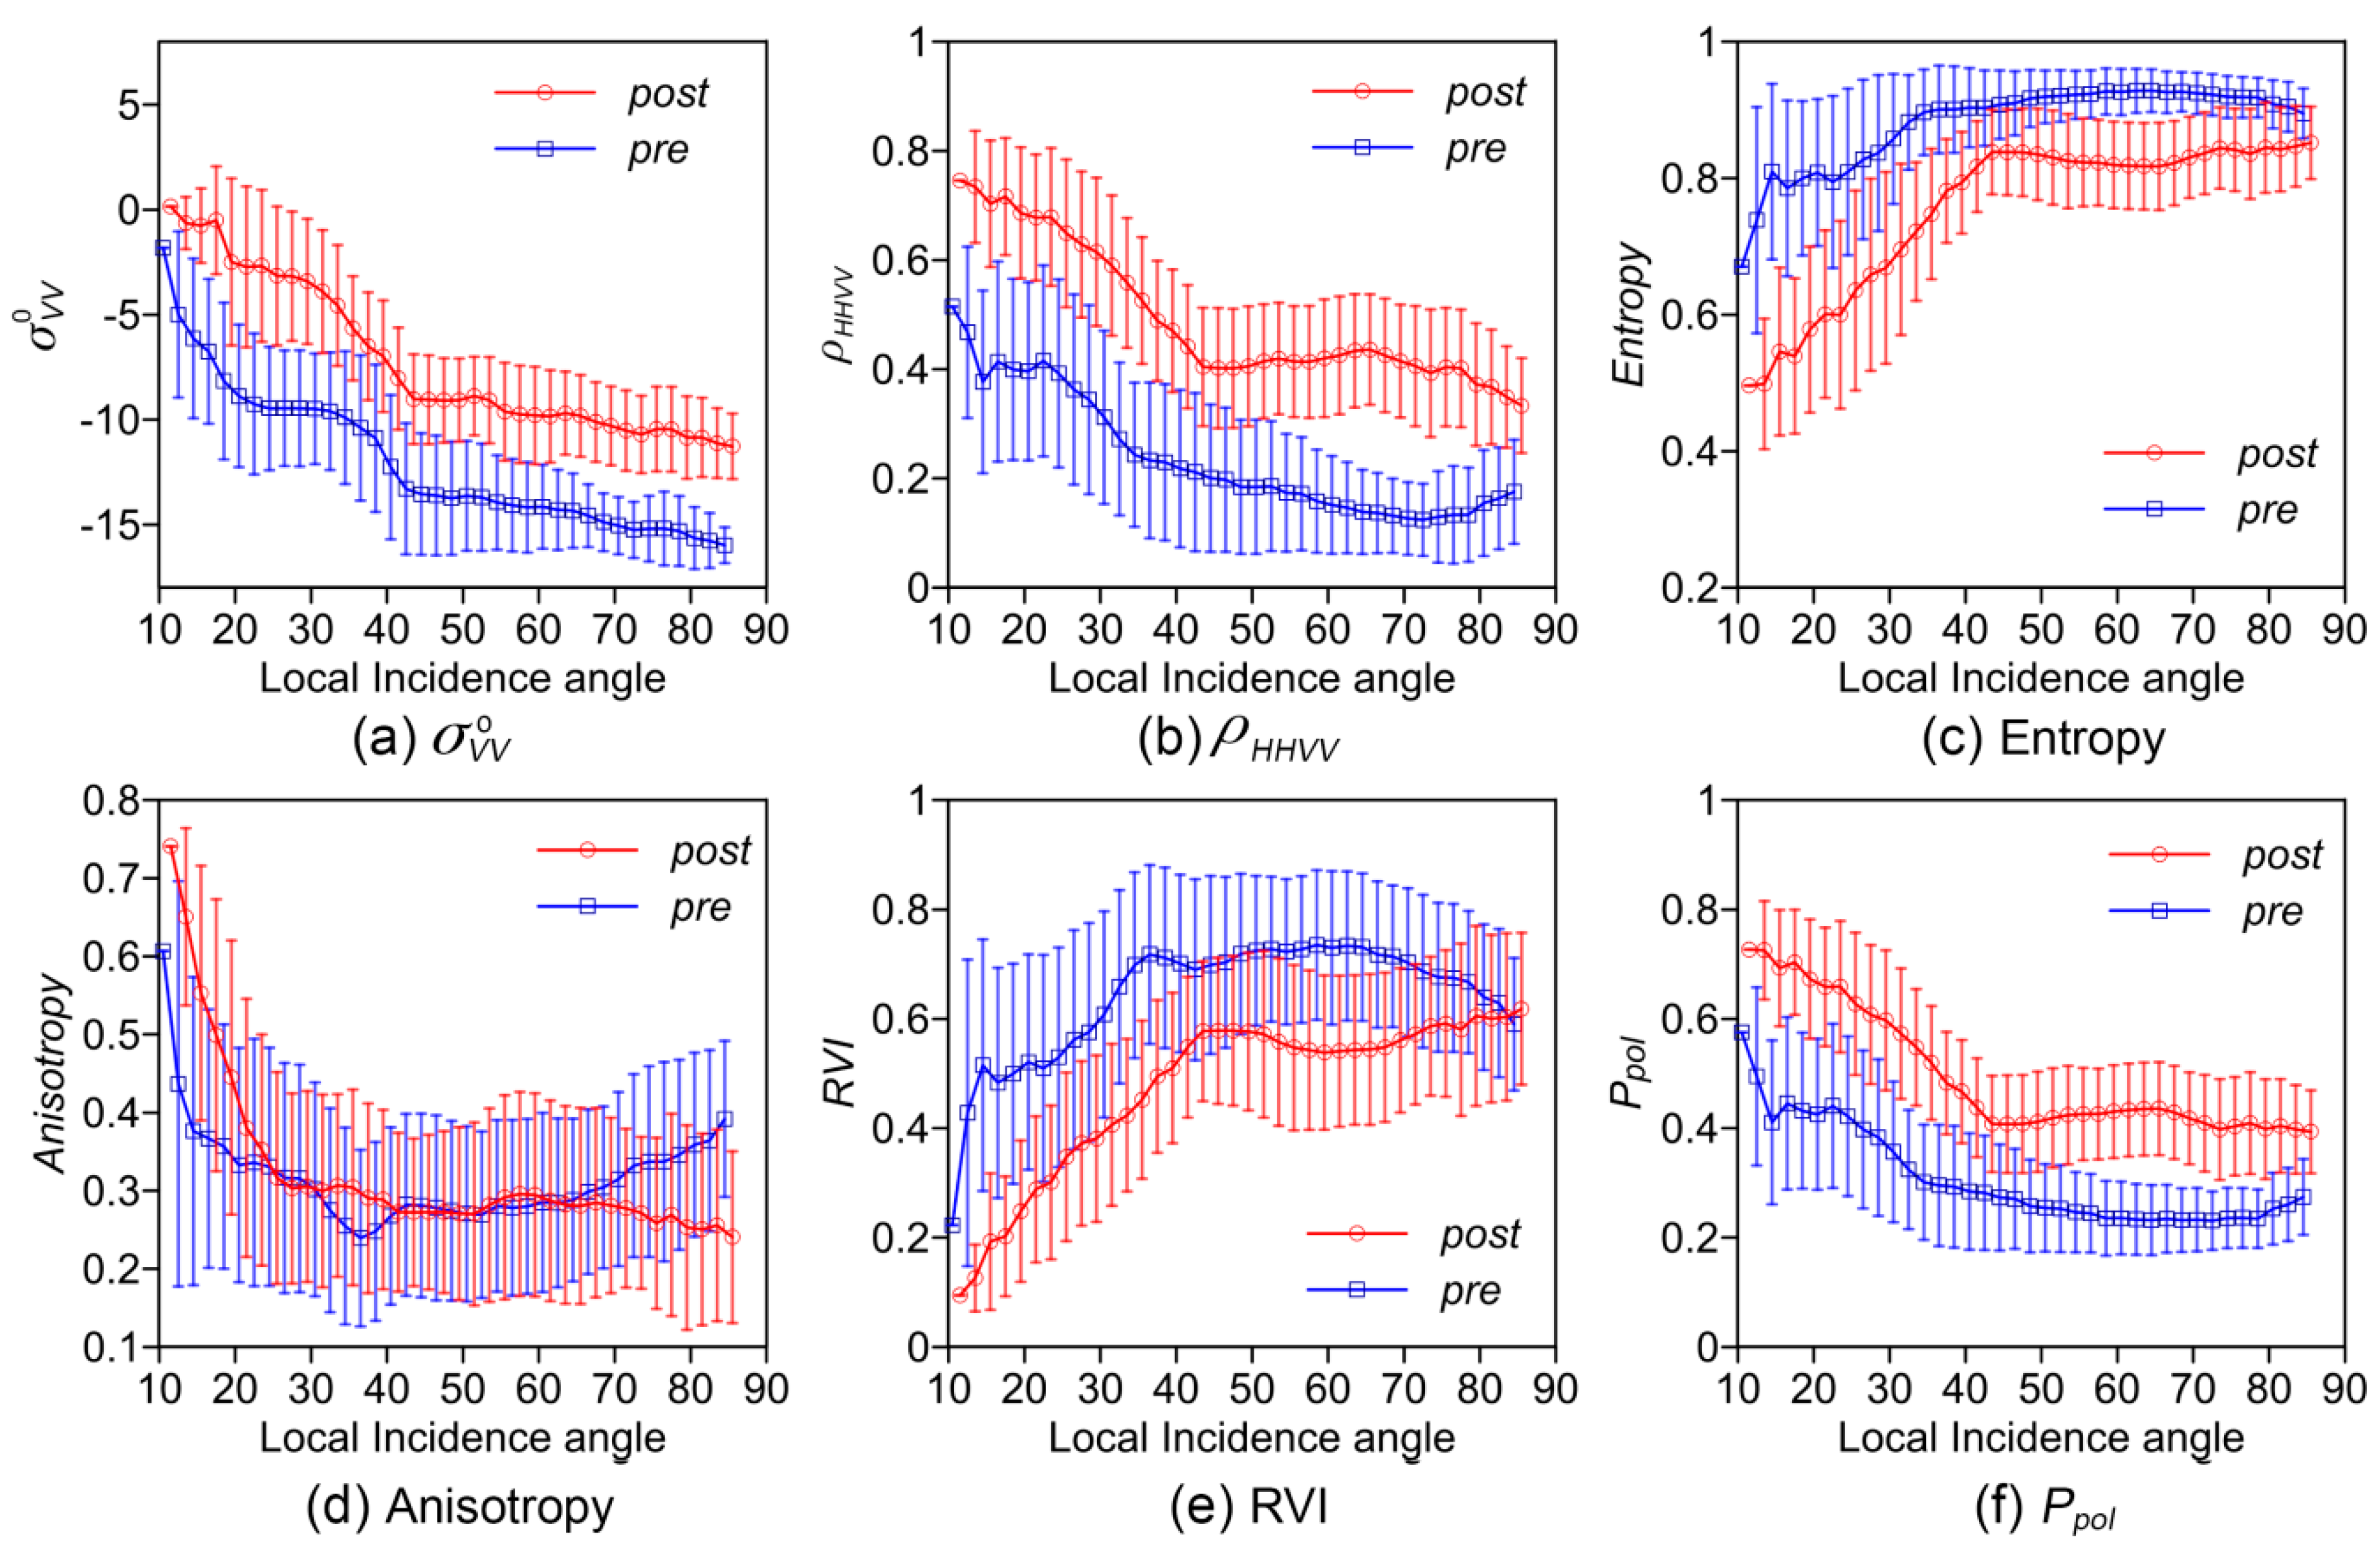
Figure 5 and Figure 6 show the temporal changes of various polarimetric parameters of landslide areas that occurred in forested and non-forested areas, respectively. Among the diagonal components of the [ C 3 ] matrix, only VV-polarization scattering intensity σ V V 0 = S V V S V V * is illustrated in Figure 5a and Figure 6a, because the HH- and HV-polarization scattering intensities were discussed in Figure 3 and Figure 4. Similar to the single or dual-pol cases, it is difficult to distinguish signals from pre- and post-landside conditions in temporal σ V V 0 values, particularly in the forested areas.
It is seen that the polarimetric parameters defined by scattering amplitude and eigenvalue ratios in Figure 5b–f show better discriminability between pre- and post-landslide conditions of the selected sites. Among them, the polarimetric parameters indicating signal depolarization properties, particularly ρ H H V V , entropy, and P p o l , exhibit significant landslide-induced changes for all local incidence angle regions. The anisotropy and RVI parameters, which utilize the minimum eigenvalue, cannot clearly distinguish signals from pre- and post-landslide conditions, especially in non-forested areas as shown in Figure 6.

4. Landslide Detection

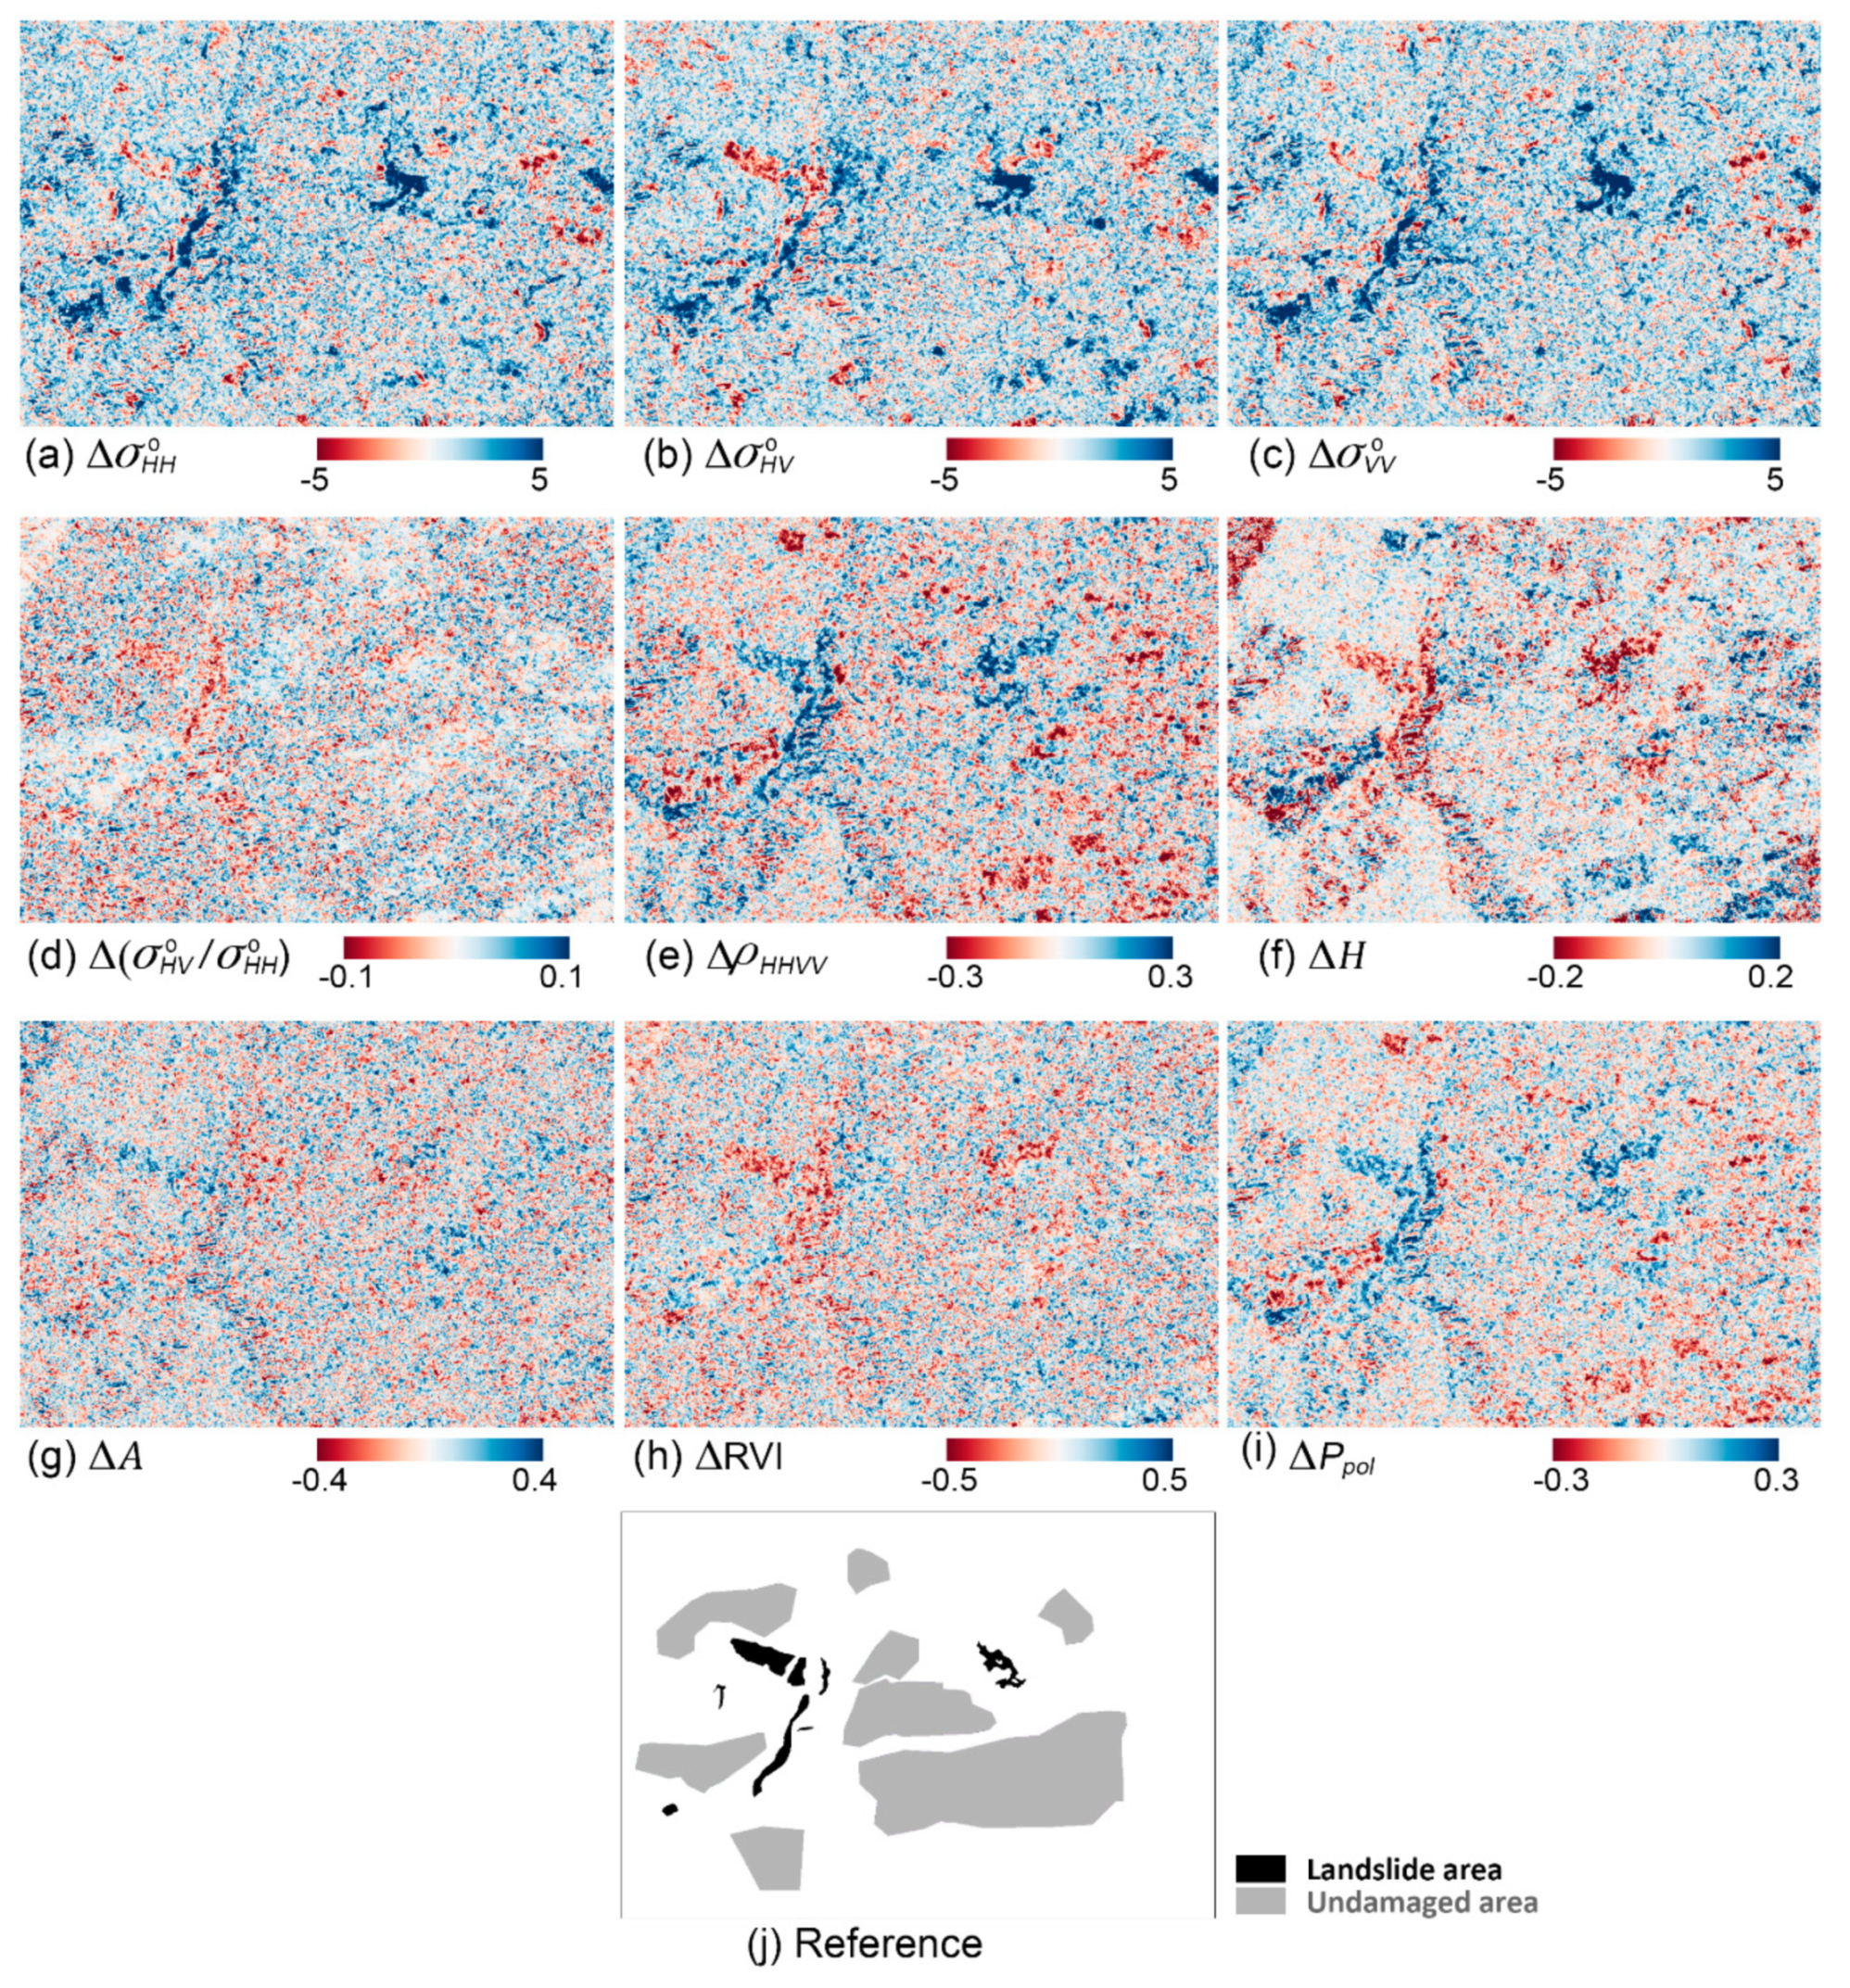
One of the goals of remote sensing data analysis for a landslide event is to generate the landslide map or landslide inventory map. A simple way to map landslide affected areas is to compare remote sensing data acquired at pre- and post-landslide conditions by image differencing. Consider two M × N polarimetric parameters, X 1 and X 2 , acquired at before and after the landslide, respectively. Figure 7 illustrates the difference image, Δ X = X 2 X 1 , for the different polarimetric parameters. Figure 7a–d corresponds to the single- and dual-pol parameters, and Figure 7e–f corresponds to the quad-pol parameters. It also shows a manually generated reference image which illustrates regions of interests for landslide damaged areas and undamaged forest and agricultural areas. It is seen that changes in polarimetric parameters highlight the damaged areas except for the cross-pol ratio and the anisotropy. Three intensities σ H H 0 , σ H V 0 , and σ V V 0 show landslide-induced changes, but the direction of changes vary depending on the slope direction. The eigenvalue parameters and the co-pol coherence exhibit one-directional changes for landslide areas from high depolarization states at the pre-landslide condition to low depolarization states at the post-landslide condition. However, the amount of changes in the landslide areas and the level of general changes unrelated to landslides vary across the polarimetric parameters.
After generating the difference image, the landslide map can be generated by a change detection approach. It aims to assign each pixel of the difference image to either changed class ω c or unchanged background class ω n . One of the simple and unsupervised solutions to this problem, which is important in emergency observation, is to select the global threshold in the difference image. In order to better reflect the characteristic changes of polarimetric parameters occurred in the landslide areas and other undamaged areas, change detection was carried out considering the negatively changed ( ω c 1 ) and the positively changed ( ω c 2 ) classes in this study. To find multiple thresholds from the difference image, we adopted the Expectation–Maximization (EM) thresholding method [22,23,24,25].
We assume that the probability distribution of the difference image p ( Δ X ) is a mixture of three density components associated with the negatively and positively changed classes and unchanged background class, that is,
p ( Δ X ) = P ( ω c 1 ) p ( Δ X | ω c 1 ) + P ( ω n ) p ( Δ X | ω n ) + P ( ω c 2 ) p ( Δ X | ω c 2 ) ,
where P ( ω c 1 ) , P ( ω c 2 ) , and P ( ω n ) are the prior probabilities of negatively changed, positively changed, and unchanged classes, respectively, and p ( Δ X | ω c 1 ) , p ( Δ X | ω c 2 ) , and p ( Δ X | ω n ) are their conditional probability density functions. Both the unknown prior probabilities and the conditional probability density functions can be calculated iteratively by the EM procedure until convergence. If we further assume the Gaussian density functions, the prior and conditional probabilities of ith class where ω i { ω c 1 , ω n , ω c 2 } at (t + 1) iteration is given by:
P t + 1 ( ω i ) = m = 1 M n = 1 N P t ( ω i ) p t ( Δ X ( m , n ) | ω i ) p t ( Δ X ( m , n ) ) M N
μ i t + 1 = m = 1 M n = 1 N P t ( ω i ) p t ( Δ X ( m , n ) | ω i ) p t ( Δ X ( m , n ) ) Δ X ( m , n ) m = 1 M n = 1 N P t ( ω i ) p t ( Δ X ( m , n ) | ω i ) p t ( Δ X ( m , n ) )
σ i 2 t + 1 = m = 1 M n = 1 N P t ( ω i ) p t ( Δ X ( m , n ) | ω i ) p t ( Δ X ( m , n ) ) { Δ X ( m , n ) μ i t } 2 m = 1 M n = 1 N P t ( ω i ) p t ( Δ X ( m , n ) | ω i ) p t ( Δ X ( m , n ) )
where the conditional probability density function of ith class is described by the mean μ i and the standard deviation σ i . Once the final parameter estimates of the three probability distributions are obtained, the optimal threshold values T 1 and T 2 can be derived according to the maximum a posterior decision rule, that is, solving following equations with respect to the variable Δ X :
P ( ω n ) p ( Δ X | ω n ) = P ( ω c 1 ) p ( Δ X | ω c 1 )   and   P ( ω n ) p ( Δ X | ω n ) = P ( ω c 2 ) p ( Δ X | ω c 2 ) .
Since the EM-based threshold is applied exclusively to the pixel values of the difference image, the change detection usually provides noisy classification results. To further improve the detection results, spatial contextual information can be considered after obtaining three probability distributions and preliminary decisions from two threshold values. The Markov Random Field (MRF) model can provide a useful tool for characterizing contextual information [23,24,25,26]. The final change detection map after obtaining class labels for each pixel C l ( m , n ) { ω c 1 , ω n , ω c 2 } can be generated by minimizing the energy function U ( Δ X , C l ) such as:
U ( Δ X , ω ) = m = 1 M n = 1 N [ U d a t a ( Δ X ( m , n ) , ω ( m , n ) ) + U c o n t e x t ( ω ( m , n ) ) ]
where U d a t a is the class conditional energy function. Under the Gaussian assumption, it can be written as:
U d a t a ( Δ X , ω ) = 1 2 ln | 2 π σ ω 2 | + 1 2 ( Δ X μ ω ) 2 / σ ω 2
The contextual energy function U c o n t e x t ( ω ) describes spatial contextual information in a local spatial neighborhood system N given as:
U C o n t e x t ( ω ) = β ( p , q ) N δ ( ω ( m , n ) , ω ( p , q ) ) .
It counts the number of pixels in the neighborhood system assigned to the same class as pixel ( m , n ) with delta function and the β parameter tunes the importance of spatial context. In this study, we used the second-order neighborhood system containing eight neighboring pixels with β = 1.6 .
After obtaining the class decision among the negatively and positively changed classes and unchanged background class for each pixel, the final landslide map can be generated accordingly with the characteristic changes of polarimetric parameters. Each pixel x ( m , n ) of the detection map is assigned to either 1 or 0, where 1 indicates landslide damaged areas and 0 indicates undamaged areas according to:
x ( m , n ) = { 1 , C l ( m , n ) = ω c k ,   k = 1   or   2 0 , otherwise
Appropriate types of change ω c k for different polarimetric parameters (Table 1) were selected based on the analysis on the polarimetric scattering characteristics of landslide areas discussed in the previous Section.
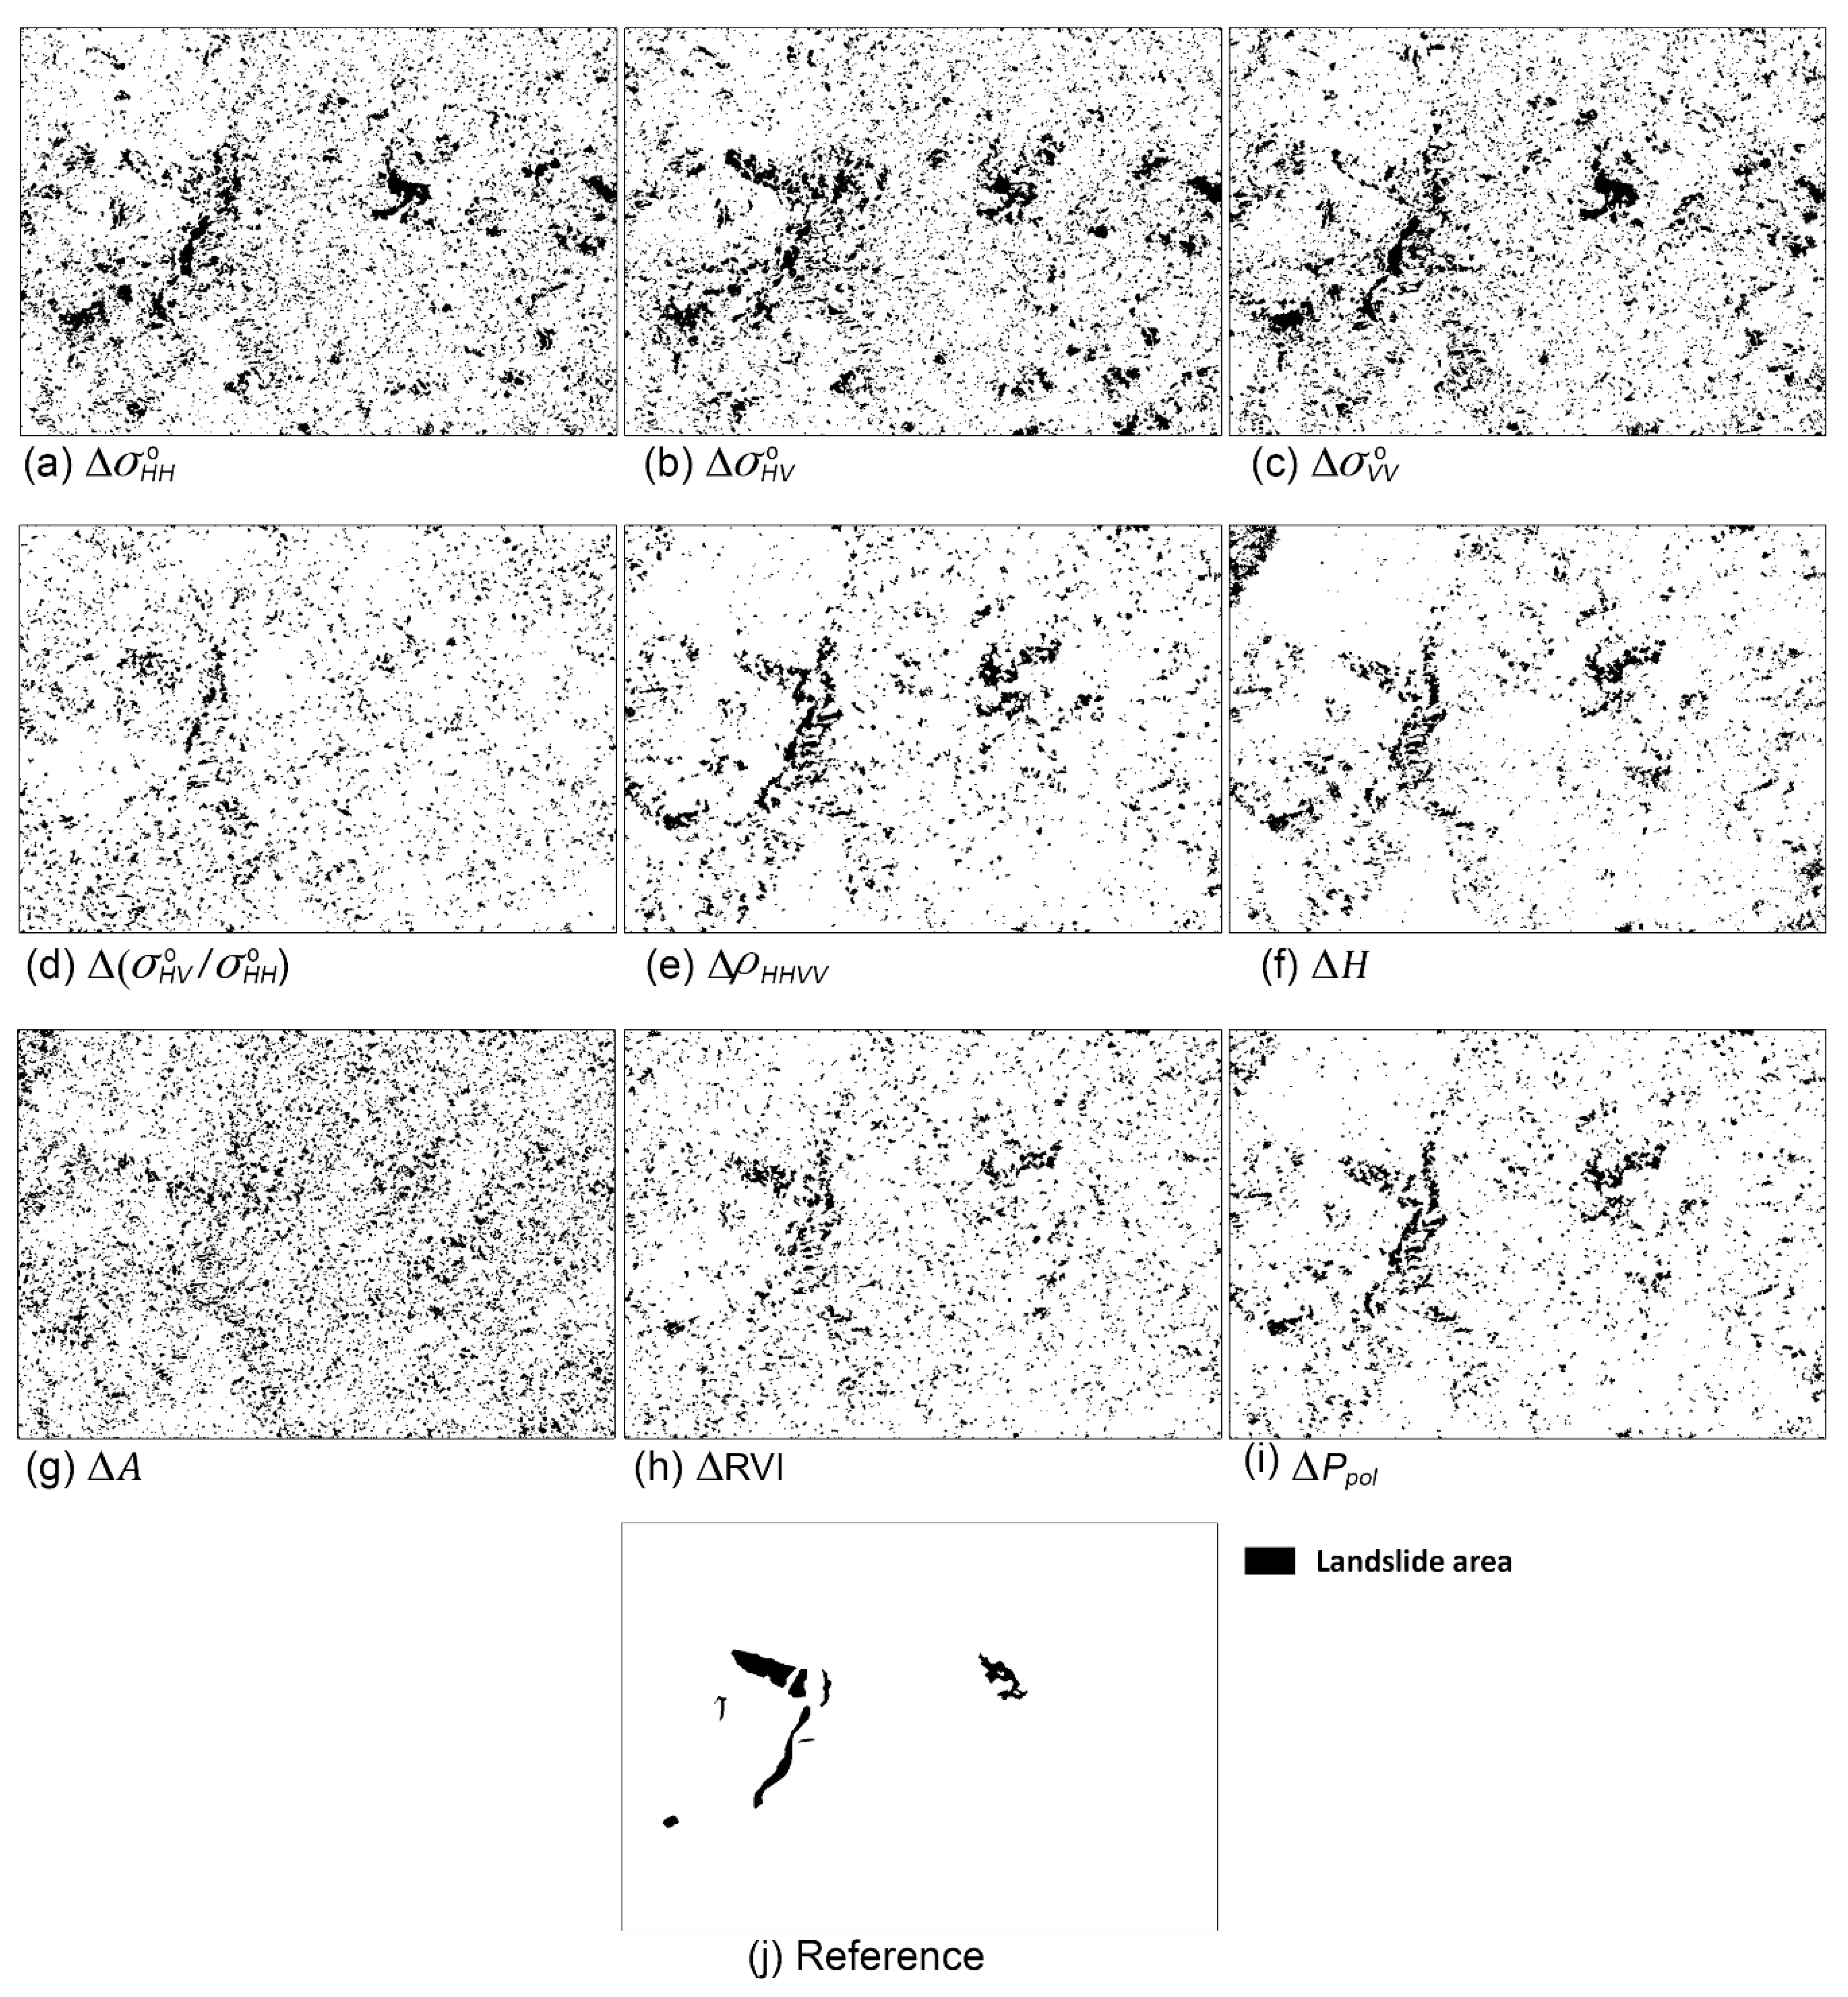
Figure 8 illustrates the final binary decision results for landslide-related changes derived from the selected polarimetric parameters. Comparing the detection results with the reference landslide map in Figure 8i, it is seen that the landslide affected areas can be successfully identified by the automatic change detection from quad-polarization SAR observations. In order to evaluate the detection result quantitatively, several accuracy metrics were considered including the detection rate (Pd), false-alarm rate (Pfa), overall accuracy (OA), and Kappa coefficient (Kappa) [27].
Table 2 shows the accuracy analysis results for each binary classification result. The entries highlighted in bold correspond to the best and second-best polarimetric parameters of a specific accuracy metric. Detection rates of around 60% can be obtained using the co-pol coherence Δ ρ H H V V , the entropy Δ H , and the polarizing contribution Δ P p o l . Changes of single-pol scattering intensities can also provide high detection rates but suffer from significant false alarms at the same time. The OA and Kappa provide an overall idea of detectability. Both accuracy metrics show that Δ ρ H H V V and Δ P p o l are two best parameters for landslide detection. The OA shows much higher values than other accuracy metrics for all polarimetric parameters because of the low proportion of landslide areas in all pixels selected for accuracy analysis. In this case, the overall detection performance of different polarimetric parameters can be better evaluated by the Kappa. According to Kappa, we can expect about two times better performance by using quad-pol parameters with the significantly less false alarm errors than single- or dual-pol parameters.

5. Discussion

5.1. Comparison with Previous Study

Although several papers have discussed landslide detection problems from single-, dual-, and quad-pol SAR data, there have been few studies that have provided accuracy analysis results of landslide detection. Plank et al. [10] analyzed the overall accuracy as well as detection and false alarm rates for two landslide sites in USA and Russia. They used pre-event optical and post-event dual-pol SAR data for detecting landslide areas. The detection rates varied from 0.48 to 0.87 with false alarms ranging from 0.001 to 0.003. Since they used small image chips for the evaluation and ancillary slope information for refining detection results, it was not appropriate to directly compare the accuracies obtained previous study and this study. However, it was possible to examine the performance of the dual-pol parameter used in [10] in comparison with the result obtained in this study.
The key parameter for the landslide identification in [10] was the dual-pol entropy H 2 . It can be derived from the two eigenvalues λ 1 and λ 2 of the dual-pol covariance matrix [ C 2 ] .
H 2 = i = 1 2 P i log 2 P i ,   P i = λ i λ 1 + λ 2
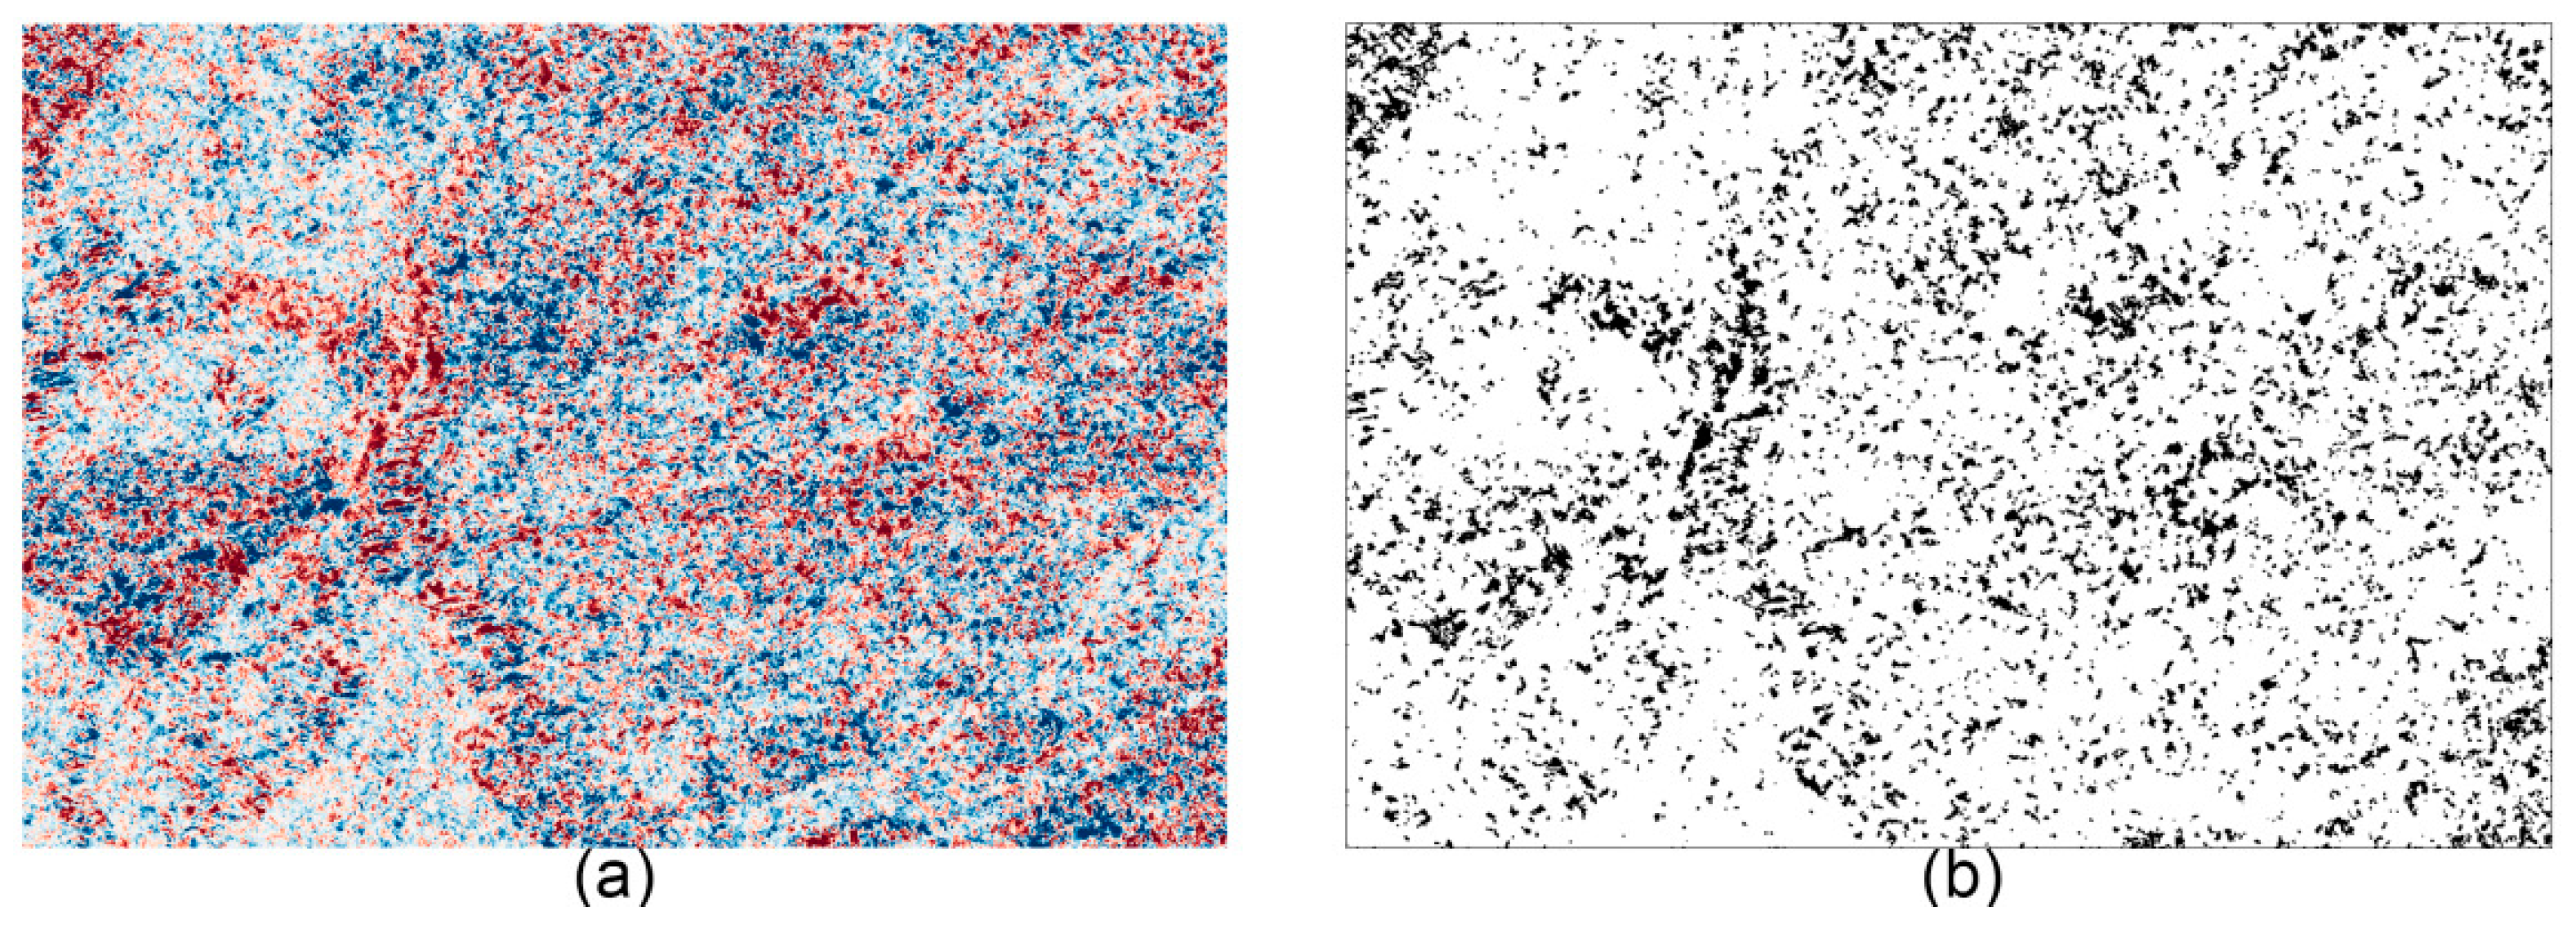
To evaluate the detectability of the H 2 parameter, the EM–MRF based landslide detection method was applied to the temporal change Δ H 2 shown in Figure 9a. In comparing Δ H 2 and the quad-pol entropy Δ H in Figure 8f, Δ H 2 provides more noisy changes in undamaged areas resulting in noisy detection result as shown in Figure 9b.
Table 3 summarizes accuracy parameters of Δ H 2 as compared with those of Δ H . The dual-pol entropy offers lower detectability with a significant amount of false alarms. According to the Kappa coefficient, the overall detection performance of the dual-pol entropy is only about half of the quad-pol entropy. Therefore, it is important to use quad-pol SAR data in the generation of the landslide map.

5.2. Influence of Slope and Land Cover on the Detectability

As discussed in Section 3 and Section 4, the quad-pol parameters indicating depolarization properties exhibited clear landslide-induced temporal changes for all incidence angle regions, and provided much higher detectability than single- or dual-pol parameters. Nonetheless, there were some differences in the detection performance between signal depolarization parameters such as ρ H H V V , H , and P p o l . In order to better understand the detection performance of depolarization parameters, the influence of environmental conditions, such as land cover types and slopes, on the detectability was further examined. Similar to Section 3, the regions of interest were divided into two categories, such as forested areas and non-forested grasslands and shrublands at the pre-landslide condition. The pixels belonging to each category were further subdivided based on the local incidence angle according to the local slope. Then, we recalculated the detection rates for the subdivided regions of interest.
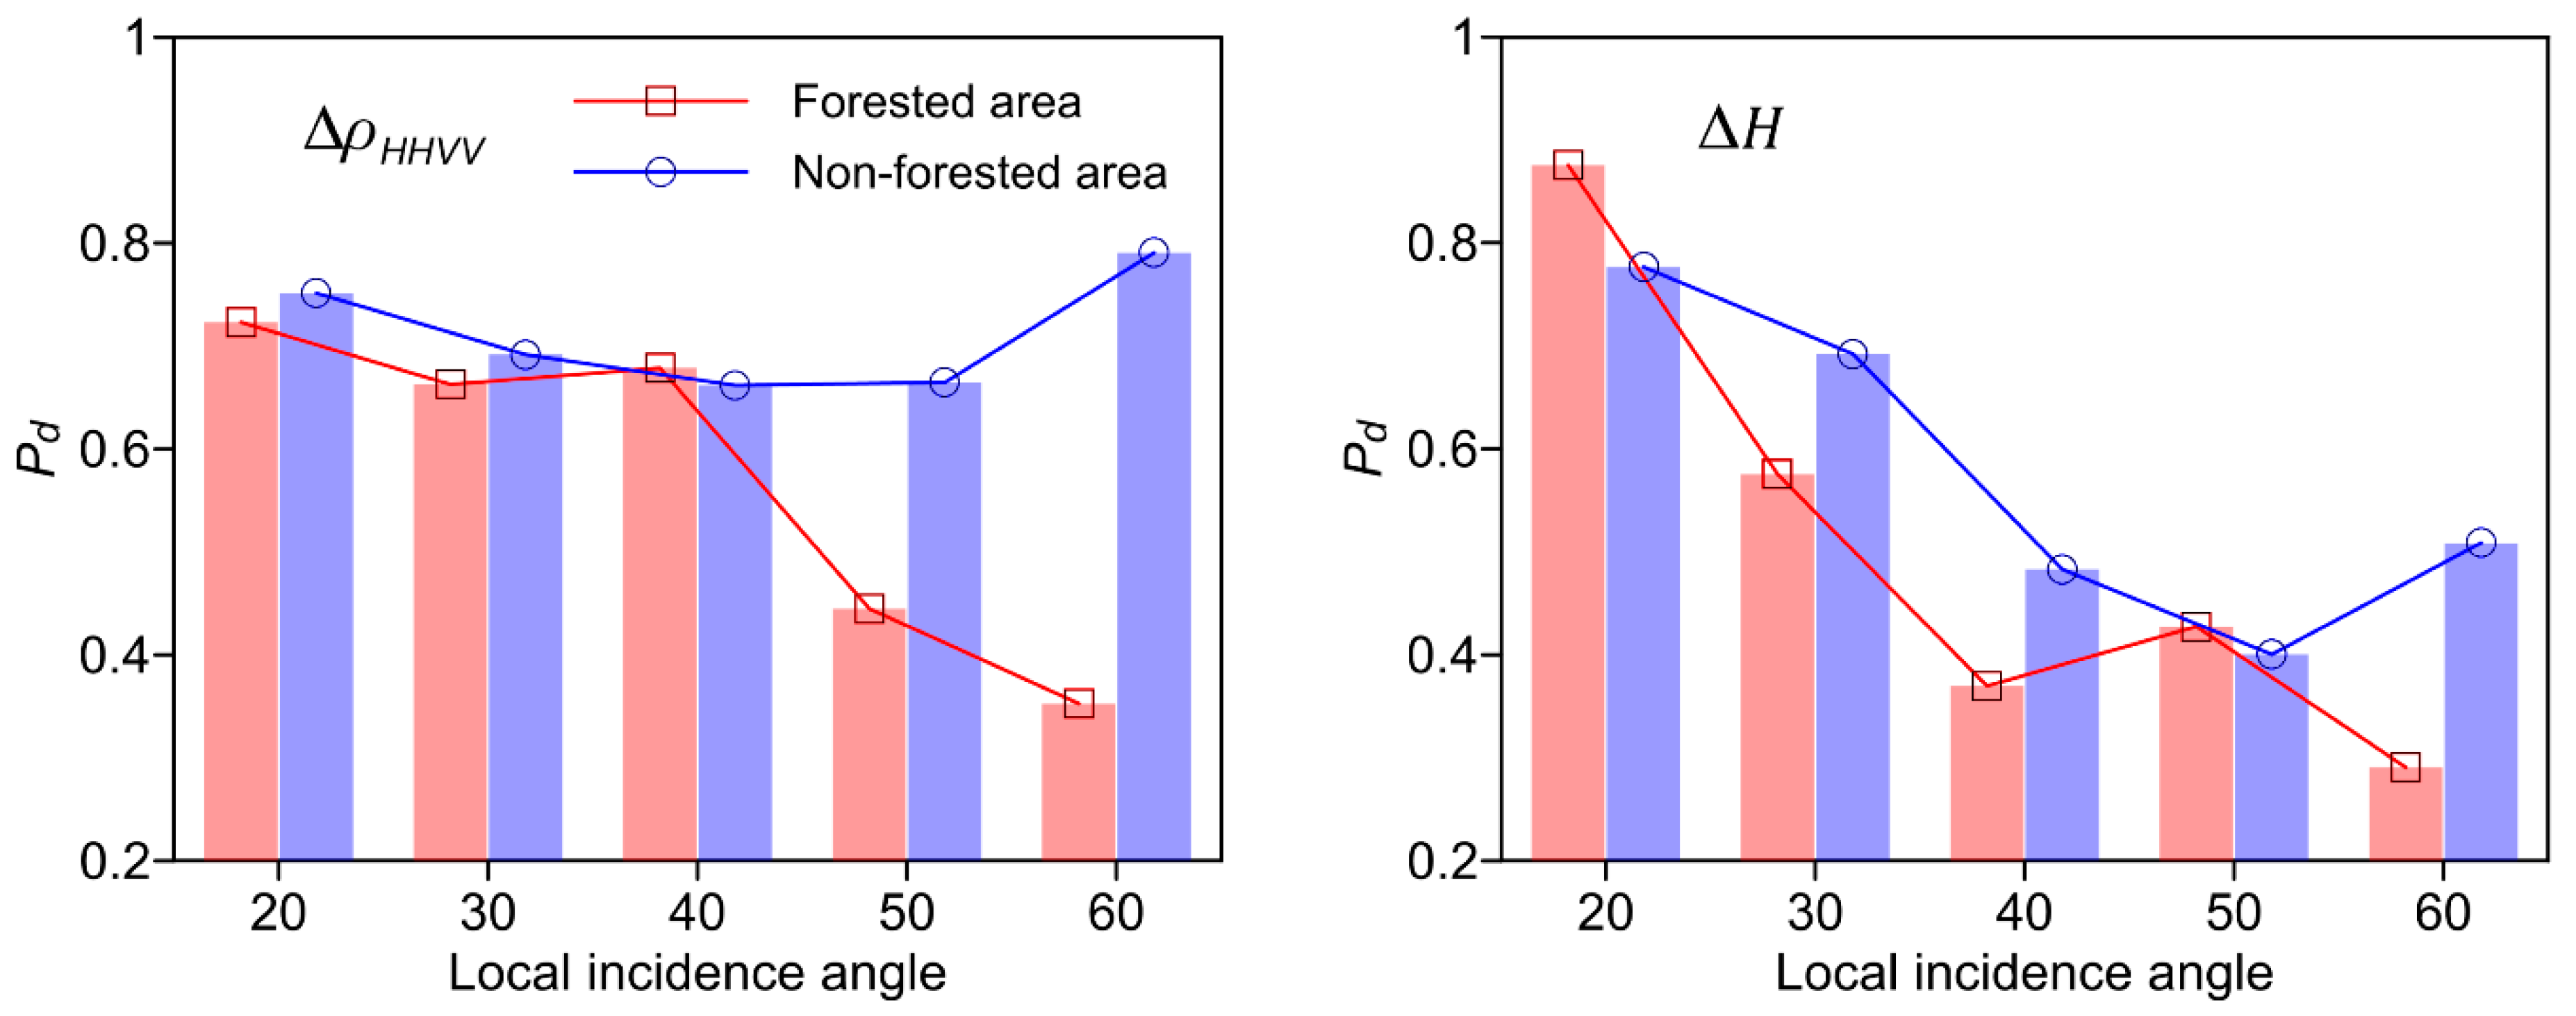
Figure 10 illustrates the effects of environmental conditions on the detectability of two selected depolarization parameters, Δ ρ H H V V and Δ H , that differed in detection accuracy. In Figure 10, the detection rates, which were recalculated for two different land cover types, were plotted with respect to the local incidence angle. It is seen that the detectability of polarimetric parameters can be affected by the local slope. The detection rates generally decrease with an increase of the local incidence angle. In the case of Δ H , which offers a slightly lower detection rate for the entire study area among depolarization parameters, the angular dependency of the detection rate is more evident regardless of the land cover condition. The detection rate of Δ ρ H H V V , however, is much less sensitive to the local incidence angle variation particularly in the non-forested area resulting in the higher overall detectability.

6. Conclusions

Due to various triggering mechanisms, landslides are widespread in many parts of the world. With a significant triggering event, slope failures can be sparse and widely distributed across a large area. Remote sensing technologies, particularly with air-borne or space-borne SAR sensors, can provide timely and critical information to assess landslide distributions over large areas. Nonetheless, studies on the systematic use of SAR data to produce event landslide maps are rare. In this context, this study discussed an automatic detection and mapping strategy of landslide areas from polarimetric SAR data. This study focused mainly on the usability of different polarimetric parameters of single-, dual-, and quad-pol modes observations for deducing information about landslide areas.
The experimental analysis on the characteristics of landslide-induced changes for different polarimetric parameters showed that, in general, SAR observations were largely influenced by the local slopes in which the landslide occurred. This is because the microwave scattering mechanisms can vary not only by landslide-induced land cover changes but also local incidence angle variations in the sloping terrain as reported in the previous study [25]. Consequently, single- or dual-pol SAR observations were not able to represent various landslide areas that occurred in different topographic conditions. However, quad-pol parameters indicating signal depolarization properties revealed noticeable landslide-induced temporal changes for all local incidence angle ranges.
To produce a landslide map, a simple change detection method based on EM thresholding and MRF contextual classification was also presented in this study. For an automatic identification of landslide areas, binary decision strategies based on the characteristic scattering properties of landslide areas were proposed. The accuracy assessment results showed that the depolarization parameters, such as the co-pol coherence and polarizing contribution, can identify areas affected by landslides in about 18.9 km2 study area with a detection rate of 60%, a false-alarm rate of 5%, and a Kappa coefficient of 0.45. On the other hand, the single- or dual-pol parameters can only be expected to provide half the accuracy with significant false-alarms in areas with temporal variations independent of landslides. It is worth noting that the results were obtained exclusively from the polarimetric SAR data. The detection algorithm is unsupervised and fully automatic. Therefore, the proposed detection accuracy can be considered to be the minimum values that can be expected from the quad-pol scattering mechanism indicators if a rapid survey is required. There is enough room to improve accuracy through advanced change detection or supervised classification methods. In particular, considering the effects of environmental conditions on the SAR observations, it is considered that the detection accuracy can be improved by using ancillary information such as DEM and optical remote sensing data.
Author Contributions

Conceptualization, Sang-Eun Park and Sun-Gu Lee; methodology, software, validation, formal analysis and writing-Original draft preparation, Sang-Eun Park; writing-review & editing, Sang-Eun Park and Sun-Gu Lee; project administration, Sun-Gu Lee.

Funding

This work was supported by the “Satellite Information Application” program of the Korea Aerospace Research Institute (KARI) and by the MSIT (Ministry of Science and ICT), Korea, under the ITRC (Information Technology Research Center) support program (IITP-2017-2016-0-00288) supervised by the IITP (Institute for Information & communications Technology Promotion).

Acknowledgments

The authors are grateful to JAXA for providing ALOS-2 PALSAR-2 data.

Conflicts of Interest

The authors declare no conflict of interest.

References

  1. Guzzetti, F.; Mondini, A.C.; Cardinali, M.; Fiorucci, F.; Santangelo, M.; Chang, K.-T. Landslide inventory maps: New tools for an old problem. Earth Sci. Rev. 2012, 112, 42–66. [Google Scholar] [CrossRef] [Green Version]
  2. Scaioni, M.; Longoni, L.; Melillo, V.; Papini, M. Remote Sensing for Landslide Investigations: An Overview of Recent Achievements and Perspectives. Remote Sens. 2014, 6, 9600–9652. [Google Scholar] [CrossRef] [Green Version]
  3. Czuchlewski, K.R.; Weissel, J.K.; Kim, Y. Polarimetric synthetic aperture radar study of the Tsaoling landslide generated by the 1999 Chi-Chi earthquake, Taiwan. J. Geophys. Res. Earth Surf. 2003, 108, 6006. [Google Scholar] [CrossRef]
  4. Cloude, S.R.; Pottier, E. An entropy based classification scheme for land applications of polarimetric SAR. IEEE Trans. Geosci. Remote Sens. 1997, 35, 68–78. [Google Scholar] [CrossRef]
  5. Yonezawa, C.; Watanabe, M.; Saito, G. Polarimetric decomposition analysis of ALOS-PALSAR observation data before and after a landslide event. Remote Sens. 2012, 4, 2314–2328. [Google Scholar] [CrossRef]
  6. Freeman, A.; Durden, S.L. A three-component scattering model for polarimetric SAR data. IEEE Trans. Geosci. Remote Sens. 1998, 36, 963–973. [Google Scholar] [CrossRef] [Green Version]
  7. Shibayama, T.; Yamaguchi, Y.; Yamada, H. Polarimetric scattering properties of landslides in forested areas and the dependence on the local incidence angle. Remote Sens. 2015, 7, 15424–15442. [Google Scholar] [CrossRef]
  8. Yamaguchi, Y.; Moriyama, T.; Ishido, M.; Yamada, H. Four-component scattering model for polarimetric SAR image decomposition. IEEE Trans. Geosci. Remote Sens. 2005, 43, 1699–1706. [Google Scholar] [CrossRef]
  9. Wang, R.N.L.; Deng, Y.; Liu, Y.; Wang, C.; Balz, T.; Li, B. Polarimetric response of landslides at X-band following the Wenchuan earthquake. IEEE Geosci. Remote S. 2014, 11, 1722–1726. [Google Scholar]
  10. Plank, S.; Twele, A.; Martinis, S. Landslide Mapping in Vegetated Areas Using Change Detection Based on Optical and Polarimetric SAR Data. Remote Sens. 2016, 8, 307. [Google Scholar] [CrossRef]
  11. Kato, A.; Nakamura, K.; Hiyama, Y. The 2016 Kumamoto earthquake sequence. Proc. Jpn. Acad. Ser. B 2016, 92, 358–371. [Google Scholar] [CrossRef] [PubMed] [Green Version]
  12. Mukunoki, T.; Kasama, K.; Murakami, S.; Ikemi, H.; Ishikura, R.; Fujikawa, T.; Yasufuku, N.; Kitazono, Y. Reconnaissance report on geotechnical damage caused by an earthquake with JMA seismic intensity 7 twice in 28 h, Kumamoto, Japan. Soils Found. 2016, 56, 947–964. [Google Scholar] [CrossRef]
  13. Information of the 2016 Kumamoto Earthquake. Available online: http://www.gsi.go.jp/BOUSAI/H27-kumamoto-earthquake-index.html (accessed on 15 April 2019). (In Japanese).
  14. Toutin, T.; Wang, H.; Chomaz, P.; Pottier, E. Orthorectification of Full-Polarimetric Radarsat-2 Data Using Accurate LIDAR DSM. IEEE Trans. Geosci. Remote Sens. 2013, 51, 5252–5258. [Google Scholar] [CrossRef]
  15. Vasile, G.; Trouve, E.; Lee, J.-S.; Buzuloiu, V. Intensity-driven adaptive neighborhood technique for polarimetric and interferometric SAR parameters estimation. IEEE Trans. Geosci. Remote Sens. 2006, 44, 1609–1621. [Google Scholar] [CrossRef]
  16. Park, S.-E.; Moon, W.M.; Pottier, E. Assessment of scattering mechanism of polarimetric SAR signal from mountainous forest areas. IEEE Trans. Geosci. Remote Sens. 2012, 50, 4711–4719. [Google Scholar] [CrossRef]
  17. Suzuki, S.; Kankaku, Y.; Shimada, M. ALOS-2 acquisition strategy. In Proceedings of the 2013 IEEE International Geoscience and Remote Sensing Symposium, Melbourne, Australia, 21–26 July 2013. [Google Scholar]
  18. Cloude, S.R. Polarisation: Applications in Remote Sensing; Oxford University Press: New York, NY, USA, 2010. [Google Scholar]
  19. Cloude, S.R.; Pottier, E. A review of target decomposition theorems in radar polarimetry. IEEE Trans. Geosci. Remote Sens. 1996, 34, 498–518. [Google Scholar] [CrossRef]
  20. Lee, J.S.; Pottier, E. Polarimetric Radar Imaging—From Basics to Applications; CRC Press: Boca Raton, FL, USA, 2009. [Google Scholar]
  21. Kim, Y.; van Zyl, J. Comparison of Forest Estimation Techniques Using SAR Data. In Proceedings of the 2001 IEEE International Geoscience and Remote Sensing Symposium, Sydney, Australia, 9–13 July 2001. [Google Scholar]
  22. Dempster, A.P.; Laird, N.M.; Rubin, D.B. Maximum likelihood from incomplete data via the EM algorithm. J. R. Stat. Soc. Ser. B 1977, 39, 1–8. [Google Scholar] [CrossRef]
  23. Bruzzone, L.; Prieto, D.F. Automatic analysis of the difference image for unsupervised change detection. IEEE Trans. Geosci. Remote Sens. 2000, 38, 1171–1182. [Google Scholar] [CrossRef] [Green Version]
  24. Jin, Y.-Q.; Wang, D. Automatic detection of terrain surface changes after Wenchuan Earthquake, May 2008, from ALOS SAR images using 2EM-MRF method. IEEE Geosci. Remote Sens. Lett. 2009, 6, 344–348. [Google Scholar]
  25. Park, S.-E.; Yamaguchi, Y.; Kim, D. Polarimetric SAR remote sensing of the 2011 Tohoku earthquake using ALOS/PALSAR. Remote Sens. Environ. 2013, 132, 212–220. [Google Scholar] [CrossRef]
  26. Solberg, A.H.S.; Taxt, T.; Jain, A.K. A Markov random field model for classification of multisource satellite imagery. IEEE Trans. Geosci. Remote Sens. 1996, 34, 100–113. [Google Scholar] [CrossRef]
  27. Cohen, J. A coefficient of agreement for nominal scales. Educ. Psychol. Meas. 1960, 20, 37–46. [Google Scholar] [CrossRef]
Figure 1. Location of the foreshock and mainshock of the 2016 Kumamoto earthquake and ALOS-2 PALSAR-2 data coverage. Boxed area in the PALSAR coverage is the Minamiaso study site in which many landslides occurred during the earthquake.
Ijgi 08 00384 g001
Figure 2. PALSAR-2 images (red: HH; green: HV; blue: VV) of the study area acquired (a) before and (b) after the earthquake. Manually selected six landslide regions of interest are marked in black.
Ijgi 08 00384 g002
Figure 3. Upper row: Changes of the histogram of the HH-polarization backscattering coefficient calculated over the selected landslide sites in (a) forested and (b) non-forested areas. Lower row: The HH-polarization backscattering coefficient of the (c) forested and (d) non-forested areas in relation to the local incidence angle.
Ijgi 08 00384 g003
Figure 4. Changes of the VH-polarization backscattering coefficient (a,b) and the cross-pol ratio (c,d) for forested (left) and non-forested (right) areas with respect to the local incidence angle.
Ijgi 08 00384 g004
Figure 5. Changes of the polarimetric parameters (a) σ V V 0 , (b) ρ H H V V , (c) entropy, (d) anisotropy, (e) Radar Vegetation Index (RVI), and (f) P p o l in forested areas with respect to the local incidence angle.
Ijgi 08 00384 g005
Figure 6. Changes of the polarimetric parameters (a) σ V V 0 , (b) ρ H H V V , (c) entropy, (d) anisotropy, (e) RVI, and (f) P p o l in non-forested areas with respect to the local incidence angle.
Ijgi 08 00384 g006
Figure 7. Difference images of different polarimetric parameters (ai) and manually determined regions of interests (j) of landslide and undamaged areas.
Ijgi 08 00384 g007
Figure 8. Landslide detection results obtained from different polarimetric parameters (ai) and manually determined landslide areas (j).
Ijgi 08 00384 g008
Figure 9. (a) The difference images of the dual-pol entropy and (b) the landslide detection result.
Ijgi 08 00384 g009
Figure 10. Variations of the detection rates according to the local incidence angle and the land cover type for the detection results from (left) Δ ρ H H V V and (right) Δ H .
Ijgi 08 00384 g010
Table 1. Selected changed class ω c k associated with the landslide area for different polarimetric parameters.
Δ X Δ σ H H 0 , Δ σ H V 0 , Δ σ V V 0 Δ ( σ H V 0 / σ H H 0 ) Δ ρ H H V V Δ H Δ A Δ R V I Δ P p o l
ω c k ω c 1 & ω c 2 ω c 1 ω c 2 ω c 1 ω c 1 & ω c 2 ω c 1 ω c 2
Table 2. Detection accuracies for the different polarimetric parameters.
PdPfaOAKappa
Δ σ H H 0 0.490.130.850.21
Δ σ H V 0 0.510.130.850.22
Δ σ V V 0 0.540.110.880.25
Δ ( σ H V 0 / σ H H 0 ) 0.270.050.910.22
Δ ρ H H V V 0.60.060.920.45
Δ H 0.520.060.920.39
Δ A 0.230.150.820.05
Δ R V I 0.440.060.910.33
Δ P p o l 0.580.050.930.45
Table 3. Detection accuracies for the different polarimetric parameters.
PdPfaOAKappa
Δ H 2 0.410.120.850.18
Δ H 0.520.060.920.39