Article

Combining Design Patterns and Topic Modeling to Discover Regions That Support Particular Functionality

1
Department of Geoinformatics—Z_GIS, University of Salzburg, Schillerstr. 30, 5020 Salzburg, Austria
2
Department of Geography, University of Wisconsin, Madison, WI 53706, USA
3
Department of Computer Science, University of Huddersfield, Queensgate, Huddersfield HD1 3DH, UK
*
Author to whom correspondence should be addressed.
ISPRS Int. J. Geo-Inf. 2019, 8(9), 385; https://doi.org/10.3390/ijgi8090385
Submission received: 20 July 2019 / Revised: 26 August 2019 / Accepted: 30 August 2019 / Published: 3 September 2019

Abstract

:
The problem of discovering regions that support particular functionalities in an urban setting has been approached in literature using two general methodologies: top-down, encoding expert knowledge on urban planning and design and discovering regions that conform to that knowledge; and bottom-up, using data to train machine learning models, which can discover similar regions. Both methodologies face limitations, with knowledge-based approaches being criticized for scalability and transferability issues and data-driven approaches for lacking interpretability and depending heavily on data quality. To mitigate these disadvantages, we propose a novel framework that fuses a knowledge-based approach using design patterns and a data-driven approach using latent Dirichlet allocation (LDA) topic modeling in three different ways: Functional regions discovered using either approach are evaluated against each other to identify cases of significant agreement or disagreement; knowledge from patterns is used to adjust topic probabilities in the learning model; and topic probabilities are used to adjust pattern-based results. The proposed methodologies are demonstrated through the use case of identifying shopping-related regions in the Los Angeles metropolitan area. Results show that the combination of pattern-based discovery and topic modeling extraction helps uncover discrepancies between the two approaches and smooth inaccuracies caused by the limitations of each approach.

1. Introduction

Rapid urbanization has spread all over the globe in recent decades and has transformed cities worldwide, allowing them to support an ever-expanding spectrum of functions and human activities, satisfying residential, commercial, industrial and transportation needs, among others. This has always created new challenges for geography in general, and especially for the discipline of Geographic Information Science (GIScience), that are not only limited to an exploration of land surfaces and urban space, but also involve more human-oriented notions such as regions [1] and places [2]. These notions are fundamental to the understanding of how people live and act in urban spaces, and so that geographic information systems (GIS) can assist citizens in navigating their surroundings in everyday life [3].
In this setting, GIS need to be able to correlate functionality and space so as to provide useful answers to queries such as “what can I do around here” or “where can I find places that provide this function” by relying on knowledge and data on human activity and experience. Put in simpler terms, GIS need to be able to discover functional regions. A popular but slightly specialized definition of functional regions is that they are characterized by connections or interactions (such as labor, commodity or transportation) between different areas and locational entities [4]. Functional urban areas (FUA) and functional urban regions (FUR) [5] are examples that conform to this definition. However, Hartshorne ([1], p. 135-6) originally defined functional regions in broader strokes, emphasizing their approximate unity of functional organization in respect to certain phenomena. For the purposes of this research, we define functional regions within Hartshorne’s context, as semantically coherent areas infused with particular functionality and composed of spatially organized physical entities that enable the support of one or more functions.
To address the challenge of discovering functional regions, research has followed two mostly independent pathways. The first one involves a top-down methodology that begins with encoding knowledge about human activities and experience and then uses the derived knowledge models to identify and delineate functional regions in space (or, in other words, places that support particular functions). Examples include gazetteers [6], semantic spatial search engines [7], and place-based GIS [8]. State-of-the-art knowledge-based approaches like the latter are easily interpretable by drawing on the underlying knowledge, offering explanations behind the discovery of particular functional regions, while also providing results in a machine-readable form. However, the process of acquiring and combining knowledge from relevant expert sources may be error-prone and time consuming [9].
The alternative pathway is to employ bottom-up methodologies that rely on relevant data to discover functional regions, and this has recently attracted increased attention due to the proliferation of crowdsourcing and volunteered geographic information (VGI) [3] as well as the successes of machine learning techniques. Example approaches in this category are capable of extracting functional regions through the use of latent Dirichlet allocation (LDA) topic modeling, Bayes classifiers and clustering methodologies on textual, point of interest (POI) and social network data [10,11,12,13]. State-of-the-art data-driven approaches are capable of uncovering hidden patterns of human behaviour and activity that can be harder to discover by humans using large amounts of data. However, their success largely depends on the availability of relevant, complete and unambiguous datasets, while their results may not always be easily interpretable [14].
In this work, we aim to mitigate the aforementioned disadvantages of the different pathways by bringing them together into a novel framework that combines knowledge-based and data-driven characteristics. Specifically, we propose three ways of fusing pattern-based discovery using the function-based model of place, as introduced in [15], with the extraction of functional regions, and applying LDA topic modeling on POI and human activity data from social networks introduced in [12]. The contributions of this article are three-fold as follows:
  • A critical analysis of the pattern-based approach in [15] and the topic modeling-based approach in [12], uncovering their main advantages and disadvantages in discovering regions that support particular functionalities.
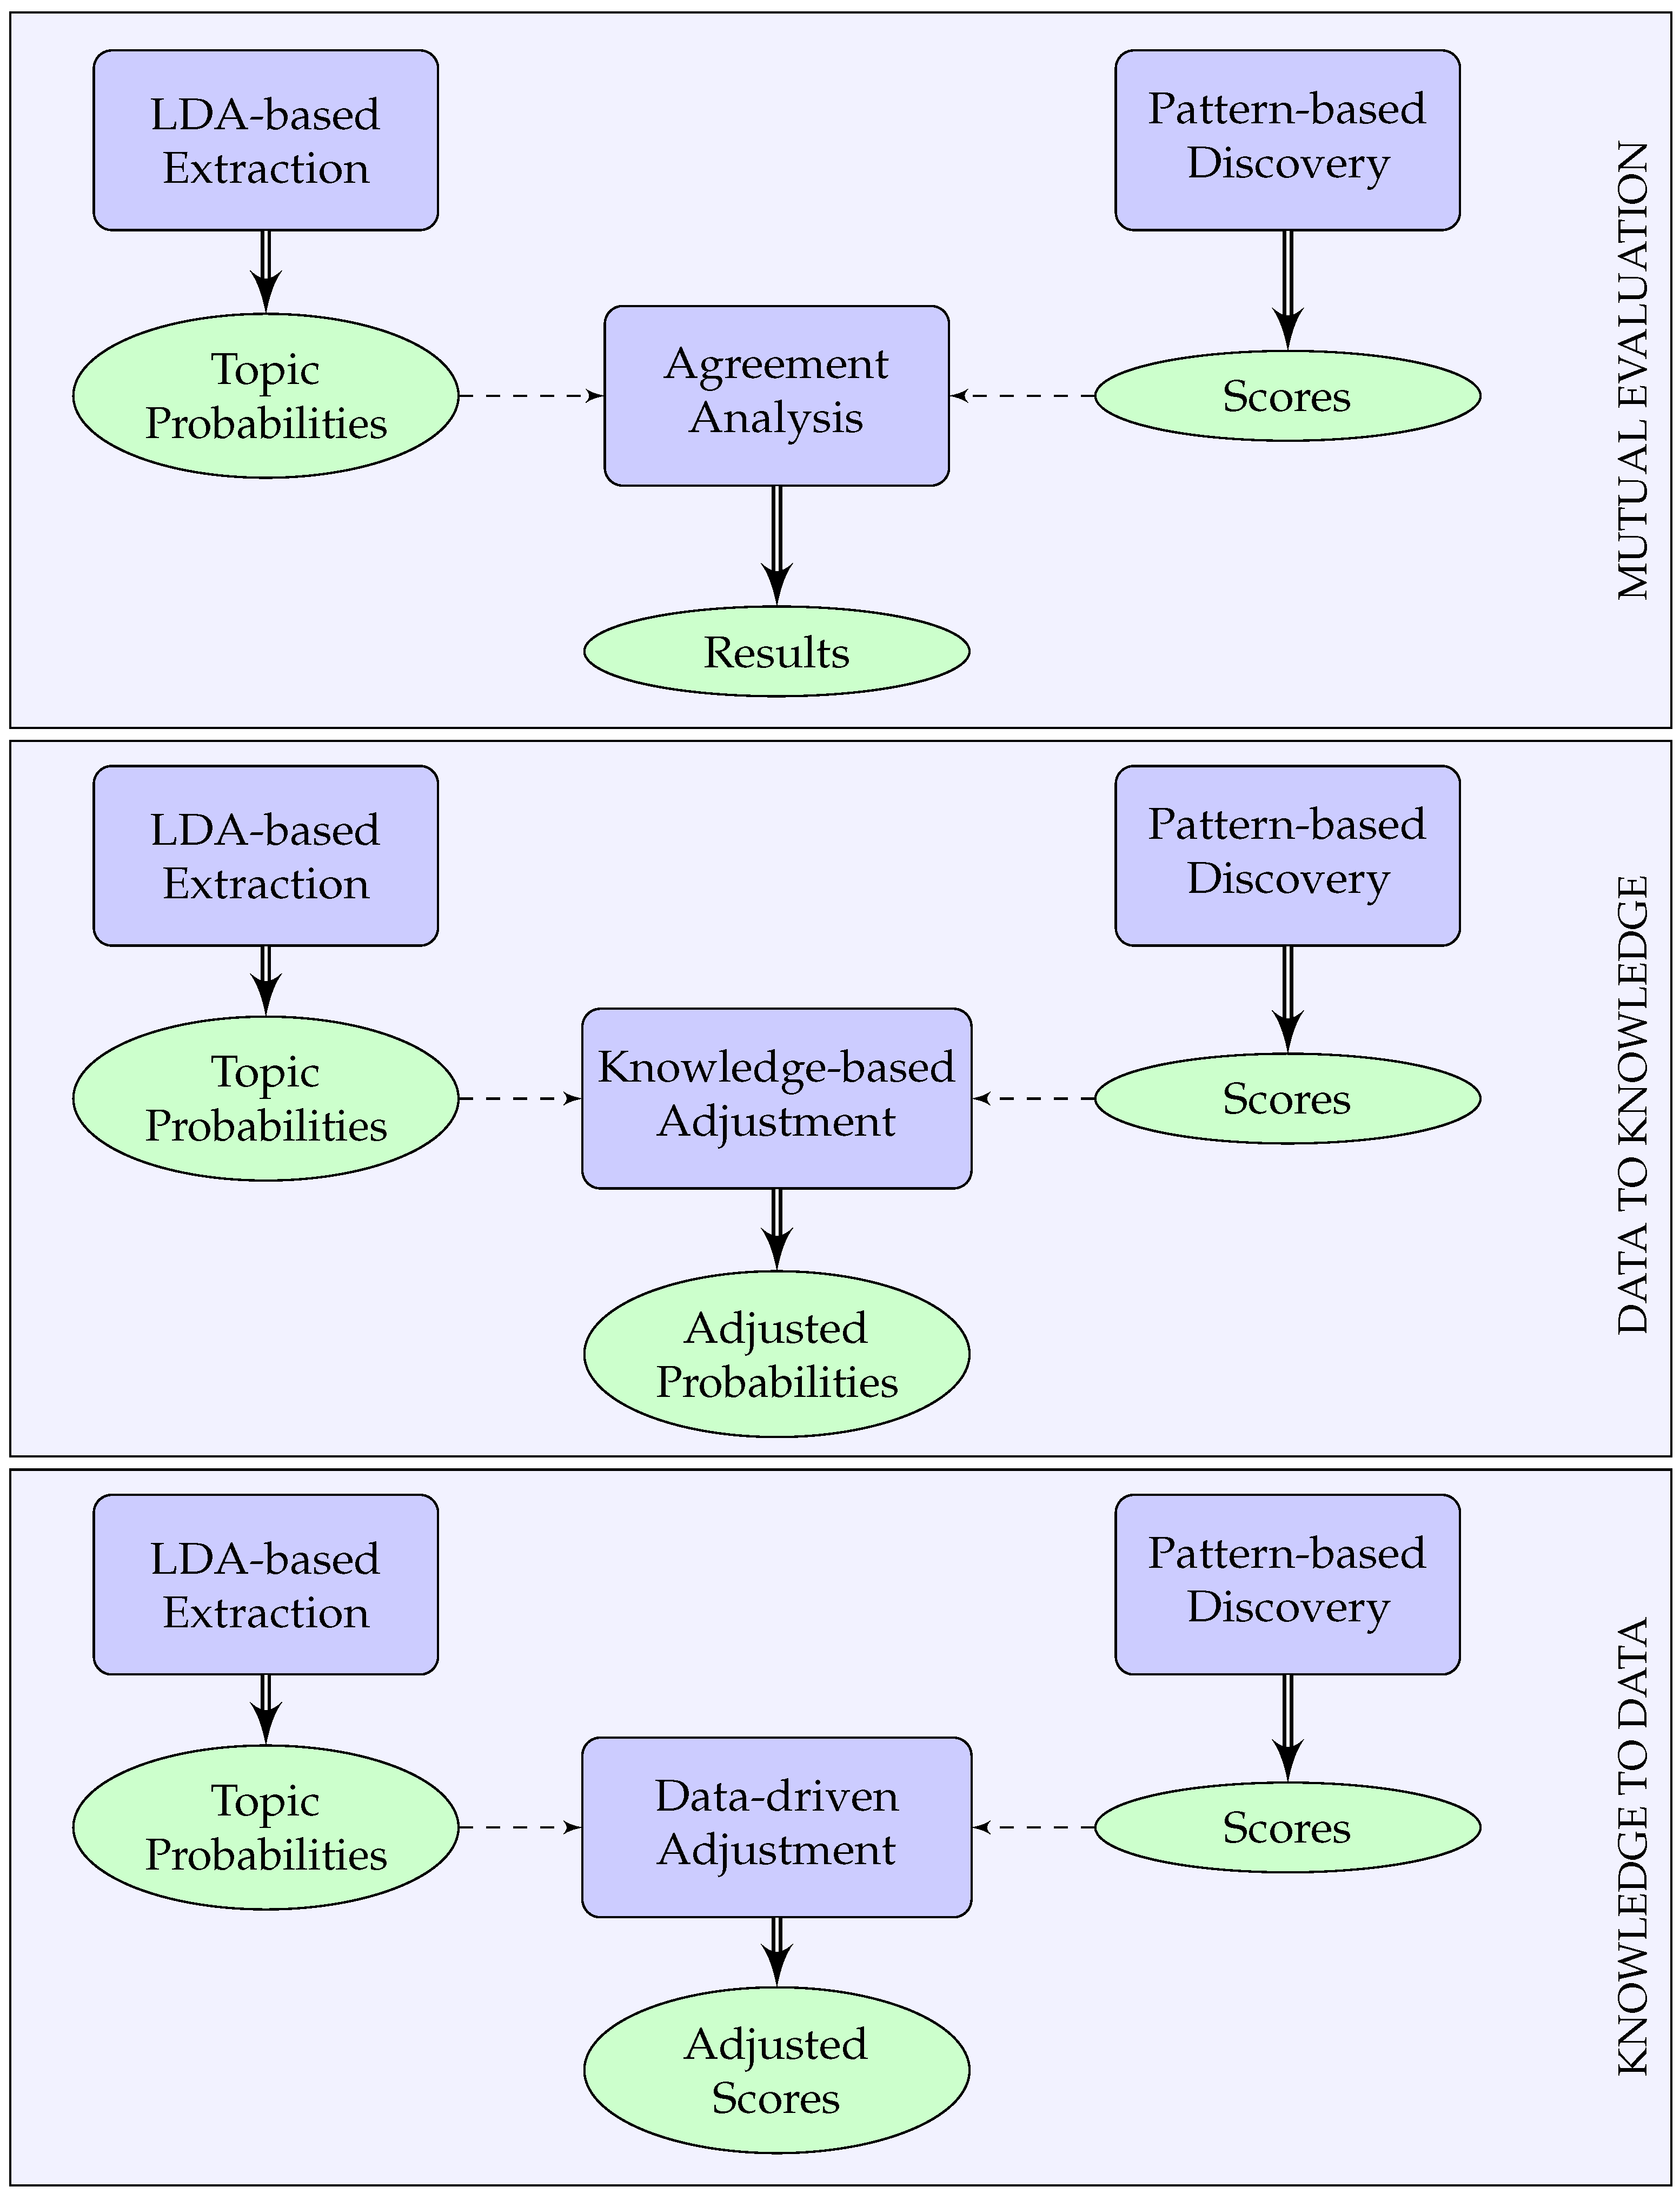
  • A novel framework for discovering functional regions that combines results based on patterns and LDA topic modeling in three different ways: mutual evaluation to identify cases of significant agreement or disagreement; using pattern-based knowledge to adjust topic probabilities; and using topic probabilities to adjust pattern-based results.
  • A discussion, in the context of GIS, of the benefits of combining the interpretability offered by knowledge-based techniques with the transferability and scalability of data-driven methodologies.
The merits of the proposed methodological framework are demonstrated through the example of discovering regions offering shopping-related functionality in the Los Angeles metropolitan area. Results show that the fusion of knowledge and data allows for both a mutual evaluation mechanism to uncover discrepancies between the two methodologies, and processes that adjust the results of one approach by taking into account the results of the other.
The remainder of this article is organized as follows: Section 2 provides a concise summary of the most prominent knowledge-based and data-driven approaches relevant to the discovery of functional regions, along with a detailed critical analysis of the approaches in [12,15]. Section 3 presents the proposed framework that fuses these two approaches. This framework is demonstrated in Section 4 through the example of discovering “shopping plazas” in the Los Angeles metropolitan area. Finally, Section 5 discusses the benefits and lessons learned from the proposed framework, followed by concluding remarks and directions for future research in Section 6.

2. Related Work and Critical Analysis

In this section, we first describe in a concise manner the most prominent representatives of the knowledge-based and data-driven approaches to the problem of identifying and delineating functional regions. For each category, we then offer a more detailed description and a critical analysis of the approaches that form the basis of the fused methodologies presented in Section 3: The knowledge-based one relying on the function-based model of place, as introduced in [15], and the data-driven one applying LDA topic modeling on POI and social network datasets, as introduced in [12].
It should be noted that most of the works discussed in this section adhere to our more generalized definition of functional regions, discussed at the beginning of this article: Functional regions are considered as semantically coherent areas infused with particular functionality, emphasizing the spatial organization of contained physical entities which enables one or more functions. While we include few indicative representatives of works that approach the concept of functionality exclusively through the prism of economic interaction, we exclude any further discussion of similar research, as unrelated to the purposes of this article.

2.1. Knowledge-Based Approaches

The earliest and perhaps the most prevalent approach of discovering regions related to a particular functionality is by using spatially-referenced catalogs of place names, known as digital gazetteers [6]. These encode relations between place names, spatial footprints, spatial categories and temporal information, among others. While gazetteers enable keyword-based identification of particular regions or extracting relevant place names based on spatial footprints, they are unable to go beyond this to support region discovery based on more than one keywords that represent functions, and cannot resolve the inherent ambiguities.
Semantic-based approaches can address this limitation by leveraging ontologies to describe geographic entities. A prominent example is SPIRIT (Spatially aware Information Retrieval on the Internet) [7], a spatial search engine which relies on a geographical ontology maintaining knowledge about place names, place types, spatial footprints and topological relationships to provide both structured and graphical spatial queries. Structured queries are in the form of a triple containing a thematic component (e.g., shopping malls), a spatial relationship (e.g., near) and a geographic component, such as a place name (e.g., London) or an imprecise region (e.g., south of England). Graphical queries allow drawing a polygon on a map to specify the geographic component. Similarly, ontological gazetteers [16] rely on knowledge graphs to enhance the capabilities of standard digital gazetteers. Knowledge contained in these graphs includes thematic information such as types, activities and hierarchies, allowing queries based on similarity and subsumption. Scheider and Purves [17] further propose the creation of semantic descriptions of places by extracting place localization knowledge from narratives, which can then be used to improve place-based searches.
The aforementioned approaches greatly enhance the process of discovering relevant regions on space by relying on both thematic and spatial information. However, while they are capable of recognising and geolocating place names, they cannot explain why a particular region is relevant without an associated place name [18]. A first step towards this direction is the definition and formalization of place reference systems [19]. These associate places with the activities and actions that are afforded by the objects contained within them and use cognitive simulations to determine whether an activity is afforded by a place. However, the complexity of these simulations hinders potential implementations of place reference systems. Also, containment of certain objects alone cannot guarantee the affordance of a particular activity: For instance, a place containing a path and a highway does not afford walking when these intersect with each other.

2.1.1. Discovering Functional Regions using Composition Patterns

To address the aforementioned limitations in discovering places that satisfy particular functionality (in other words, functional regions as defined at the beginning of this article), the approach in [15] relies on patterns created according to the function-based model of place proposed in [8,15,20], and based on knowledge gathered from expert sources. Such sources can range from the widely acceptable descriptions of places in dictionaries or encyclopedias to specialized reports produced by experts, such as urban design standards and manuals. These sources yield information relevant to fundamental elements of the function-based model, namely components, composition rules and functional implications.
Components are at the lowest level and are constituent objects of a place that enable, enhance, hinder or block particular functions. Each component belongs to a particular class (type) of components and is associated with thematic and geometric information. Thematic properties semantically enrich a component and express properties such as “the shop was opened in 2010”. Geometric properties provide a spatial description for each component, e.g., in the form of points, lines and polygons.
Composition rules express relations among components and are of four types: (1) occurrence, describing existence and population; (2) correlation, expressing the relative frequency of appearance; (3) spatial relation, modeling topology; and (4) proximity, expressing the distance between components. Three types of filters are also provided to apply composition rules on subsets of components based on their characteristics (according to type, thematic or geometric property).
Each function is then associated with a logical formula (a named functional implication) made of composition rules that need to hold for that function to be provided. A composition pattern of a place consists of one or more of these functional implications.
Applying the composition pattern on data for the components of interest (e.g., POIs from OpenStreetMap) allows the identification of regions on a map that satisfy some (or all) of the functions contained in the pattern. Regions can be scored according to the number of functions they satisfy out of a pattern, taking into account whether some are considered core or secondary. For instance, a score of zero may be attributed to a region if core functions are not provided, regardless of whether secondary ones are provided or not.

2.1.2. Critical Analysis of the Pattern-Based Approach

The approach of composition patterns considers place as a system of interrelated components, whose spatial configuration permits or prevents particular functions. Therefore, it extends the “declarative” nature of functional regions, allowing a composite view based on the semantic and spatial configuration of the underlying components. For instance, a park is no longer considered as a predefined spatial footprint with assigned semantics or a set of physical entities; instead, it is a region composed by strict rules that spatially organize its containing physical entities, which in turn enable its functionality and approximate its spatial projection.
This differentiating feature has a significant impact in the formalization and integration of functional regions within GIS. On the one hand, instances of functional regions are transformed to semantically enriched spatial data (i.e. components) that are machine readable; on the other hand, the constraints and rules introduced are well-formed and easily interpretable, facilitating human understanding and reasoning. Moreover, functions are not bound to textual descriptions, but take the form of logical rules which, upon evaluation, allow the grading of the corresponding regions according to the number of functions they support, as well as how well they are supported. This facilitates comparison of regions with different or unknown types based on how well they operate given a predefined set of functions.
In addition, since the context of regions is not represented as static text literals, patterns are easily adjustable in order to allow additional or alternate interpretations of functions based on the particular requirements of each setting: For instance, the function of walkability is realized differently in the United States than in Austria, because of the cultural background and urban structures of each country. Additionally, since the approach is built on logical rules, it requires a minimal amount of data to evaluate functional implications, hence it can perform quite well with scarce data.
However, discovering functional regions using composition patterns carries a number of limitations, most notably those of scalability and transferability in terms of the area of study. Scaling to larger areas may significantly increase the preprocessing and actual processing time. For instance, identifying parks within a city is quite efficient, however applying proximity algorithms in the scale of a continent would require several assumptions and performance optimizations to achieve reasonable efficiency.
In terms of transferability, the same pattern can be applied to different parts of the world, provided that they share similar characteristics that affect human behaviour and activities. However, there may be a need for adjustments, in order to make the composition rules or functions fit the area of study in the most appropriate way possible. This would be necessary, for instance, to transfer a pattern from western to eastern countries. In essence, transferability is made difficult because patterns rely on assumptions in order to fit the real world into well-structured hierarchical composition-based models; a semantically correct knowledge-based model that unambiguously identifies all possible connections between components and functions regardless of the area of study is virtually impossible.
Finally, while the approach is not dependent on the availability of high volumes of data, the successful discovery of functional regions requires heterogeneous data sources that need to be unambiguous and finely structured. A pattern that is built on low quality data will inevitably perform inadequately in terms of functional region discovery, while the unavailability, in a region, of data related to core functions within a pattern will lead to excluding this region from results.

2.2. Data-Driven Approaches

A variety of data-driven algorithms have been applied to identify regions of particular characteristics on a map; to facilitate analysis they are presented here based on the type of information used as the source. We first present works that use a single information type (textual, POI, trajectories, and so on), followed by works that combine multiple different types of information.
Adams and Janowicz [11] use unstructured text from Wikipedia articles to derive thematic signatures that can describe the place type associated with each article. LDA topic modeling is used to identify the latent structure of topics contained in each article. Then, the trained LDA model is used on each collection of articles that refer to a specific place type to infer a topic distribution for it (thematic signature).
Hobel et al. [21] relied on tagged POI data in OpenStreetMap (https://www.openstreetmap.org) to understand how users describe particular spatial regions such as shopping areas. An algorithm similar to image segmentation, is used to extract combinations of characteristics that hold for the region, such as “contains at least one shop and restaurant”. The presented case study shows how a description derived from a shopping area in London can be used to discover similar areas in Vienna. POI data are also used in [22] to create learning models that describe the spatial context of each POI category based on its nearby surroundings. Through these models, it is possible to infer similarities and differences between the spatial context of different POI categories or similar categories in different cities (e.g., restaurants and bars have similar patterns compared to gas stations, while patterns are easier to transfer between Las Vegas and Phoenix).
A significant body of work relies on human mobility data, such as commuting flows or taxi trajectories to identify functional regions defined in a slightly more specialized manner than our definition, as discussed at the beginning of this article. A recent indicative example is the work of Tao et al. [23], which used taxi GPS trajectory data to analyse urban regions and infer region functions in Guangzhou, China. Data was used to construct a probability tensor decomposition model, which, in turn, was used to extract temporal patterns and spatial distribution of trajectories. This analysis yielded a number of regions in the study area and the main social functions of each (e.g., residential, commercial, workplace and so on).
A common disadvantage of all the aforementioned works is that they rely on a single information type. This restricts them to a single-dimensional representation which may not be enough to account for the multi-faceted nature of a concept such as a functional region. Also, results may be influenced by data availability, quality and coverage, with particular areas being neglected because they are not sufficiently covered by a particular type of data. As pointed out by Su et al. [24], this problem is more pronounced in VGI data, with increased data coverage and quality being significantly associated with densely populous cities with younger, more educated citizens. To counterbalance these issues, research is increasingly focusing on synthesizing different data types.
Yuan, Zheng and Xie [10] integrated POI data with taxi trajectory data into a novel topic model-based method to discover functional regions. Regions and functions were considered as documents and topics, respectively, while trajectory data were considered as words and POIs as metadata. Hobel, Fogliaroni and Frank [13] applied natural language processing to user comments posted in English on TripAdvisor for the historic center of Vienna, to find compound names that refer to geographic features, which were then used in combination with OpenStreetMap tags to train a Bayes classifier. The area identified by the trained classifier fits with the boundaries of the city of Vienna in 1850.
The aforementioned two works rely on data sources which might not be widely available (taxi trajectories) or representative enough (comments exclusively in English). To address this, researchers have attempted to combine POI categories with social network activities such as check-ins. Noulas et al. [25] used frequencies of Foursquare check-in data per place category to determine which categories are more common in particular regions. This analysis was applied to 10 × 10 km2 regions in New York and London to find clusters containing similar distributions of place types. Zhou and Zhang [26] similarly combined Twitter and Foursquare data to extract spatial distributions of common human activities (e.g., food and restaurants, shops and services, outdoor and recreation) and to determine major hotspots. Finally, Zhi et al. [27] used a vast dataset of 15 million social media check-ins over a year to detect functional regions. Spatiotemporal structures which potentially represent associations between functional regions and human activities were extracted; these associations were then used to discover functional regions in the city of Shanghai.

2.2.1. Functional Region Extraction from POI and Human Activity Data

More recently, Gao, Janowicz and Couclelis [12] proposed the use of both POI data and location-based social network check-ins to train a popularity-based probabilistic topic model for the extraction of functional regions. The key idea of LDA topic modeling for textual data is applied, in a similar fashion to [10], with regions and functions considered as documents and topics, respectively. In contrast to [10], the type of each POI (e.g., restaurant or park) is considered a word, instead of trajectory data. The goal is to produce a discrete probability distribution over POI types for each function. Also, compared to other research that exploits social media check-ins ([25,26,27]), the research in [12] provides a thorough discussion of the robustness of discovered functional regions using different numbers of topics and clusters.
To address the significant effect of human activity to the distribution of functions in an urban setting, the generation of the document-word frequency matrix used in the LDA topic modeling approach is modified. The occurrence of a POI type (word) within a region (document) is re-scaled according to the check-in counts for all POIs of that type in the region. The re-scaled occurrence for a POI type t given a region d is given by the following formula: F r e q ( d , t ) = L o g ( V ( d , t , i ) ) , where V ( d , t , i ) is the number of unique users who have checked-in (using social networks) to venue i of type t in region d.
At the end of this process each region is represented as a vector of K-dimensional latent thematic topics (POI types), with the optimal K determined experimentally. The vector essentially encodes underlying co-occurrence relationships among POI types taking social network-based human activity into account. Individual regions that are semantically similar in terms of the POI types included in the vector may be considered to be contributing to the same function and, hence, forming a larger, but thematically cohesive, functional region. To achieve this, clustering algorithms can be exploited. The experiments presented in [12] apply both k-means clustering [28] and the Delaunay triangulation spatial constraints clustering [29].

2.2.2. Critical Analysis of the Topic Modeling Approach

The popularity of POIs reveals information about the trending associations of human activities with place types. Topic modeling that exploits such information has the advantage of providing a view of urban space as it is seen through the lenses of society and people. From a wider perspective, popularity-based POI topic modeling augments the traditional remote sensing view of the urban environment as physical landscape with information about the distribution of urban functions and human activities, resulting in what is termed as social sensing [30].
This function-based view of urban space allows the extraction of semantic signatures for spatial entities based on their functionality. These signatures can then facilitate a variety of applications. Regions can be discovered given a specific functional context, and can also be compared in terms of similarity based on their assigned functions. Furthermore, the topic extraction method is able to classify regions that are characterized as multi-functional; it reveals the likelihood of certain functions to be present in the region under question, which in turn makes it possible to discover clusters of “similar” functional regions given a context expressed as a multinomial distribution of different types of POIs.
Being a data-driven approach, the extraction of functional regions using topic modeling inherits some common benefits and drawbacks. Scalability and transferability in terms of the area of study are two of the key advantages of the approach. The discovery process of functional regions can be scaled from the boundaries of a city to a country or even a continent, without the need for constraints, assumptions or simplifications while keeping execution at efficient levels in terms of time and space requirements. In terms of transferability, the same LDA topic modeling methodology can be directly applied to any study area with limited or no required adjustments. This stems from the fact that data are used simply as numerical values, without dealing with any case-specific schemas or complex structures.
The aforementioned simplicity, however, causes a high dependency of the quality of topic modeling on the availability of significant amounts of data. The absence of POI types and human activity information may lead to an uneven distribution of functions within a wider region. Misleading classification can also arise since, for instance, POI data and social media check-ins on hotels or residences are often scarce compared to those related to restaurants or bars. Hence, while the approach can scale to larger areas and transfer to different ones, its accuracy will inevitably vary according to data availability and quality.
Another important limitation of this approach is related to interpretability. This is a common characteristic of data-driven techniques, as they tend to employ advanced formulas and parameters which are not always comprehensible by or explainable to humans. In this particular case, this translates to arbitrary boundaries for functional regions that are not necessarily linked to the actual location of the POIs that deliver the functionality in question. Additionally, in some cases the association of the probabilistic weights assigned to POI types may be difficult to directly connect with a perceived functionality. For instance, an increased co-occurrence of shops does not necessarily mean that the region represents a shopping area, since the individual shops might be sparsely located which hinders walkability, a desirable feature associated with shopping-related functionality.

3. Methodology

The analysis in Section 2.1.2 and Section 2.2.2 shows that both approaches introduced in [12,15] have notable benefits, but they are also restricted by important limitations. In this section, we introduce a methodology that combines the works of composition patterns and popularity-based topic modeling forming a fusion approach for discovering functional regions that keeps the best qualities of each individual approach while mitigating the underlying limitations. We present three types of fusion: mutual evaluation, data to knowledge fusion, and knowledge to data fusion. These are illustrated in Figure 1. Note that each of these fusion methods is independent of each other and can be run separately; the first intends to highlight cases where the individual approaches agree or disagree, while the latter two use the results of one approach to influence the results of the other.
The following assumptions are necessary in order to ensure consistency of the fusion processes. Both approaches, composition patterns and topic model extraction, are applied on the same data sets and within the same study area. All the numerical values used are normalized and transposed accordingly to the same spatial scale. Furthermore, the process of discovering particular functional regions differs slightly based on the particularities of each approach. For instance, identifying a functional region as “shopping plaza” translates to finding areas where “shopping mall” is the dominant POI type using LDA topic modeling along with additional POI types related to shops and restaurants (topic 67 in [12] and Table A1 in Appendix A) and without performing any clustering. The same goal translates to discovering regions that conform to a pattern containing a number of sub-functions that are linked to human activities associated with a “shopping plaza”, such as shopping experience and walkability (a full pattern is provided in Table A2 and Table A3 in Appendix A). Hence, comparison is performed on a dominant topic versus relevant pattern basis.
The following notations are introduced for the remainder of this section. F R T (Functional Regions from Topics) denotes the set of functional regions extracted using topic modeling, while F R P (Functional Regions from Patterns) is the set of functional regions identified using composition patterns. The assigned value that represents the probability calculated using the topic model and the score calculated based on a pattern are denoted as V T ( f r i ) and V P ( f r i ) , respectively and are both referred to as confidence values of an individual region f r i . Finally, the resulting set of functional regions after the fusion process is denoted as F R and the adjusted confidence value after fusion for the region f r i is denoted as V F ( f r i ) .

3.1. Mutual Evaluation

This methodology aims to investigate the variability between the results of the composition patterns and topic modeling processes. Mutual evaluation expects the results of the individual approaches as input: functional regions derived using the composition patterns approach, along with their confidence values V P and functional regions extracted using the topic modeling approach, along with their confidence values V T . The mutual evaluation process outputs regions where there is significant agreement between the two approaches, and regions which are judged very differently by the two approaches.
To determine cases where there is significant consensus between the two approaches, we calculate an adjusted confidence value that is the product of the individual ones. Since the topic modeling approach is coarser, it always results in regions that are much larger than those of the composition patterns approach. Hence, for each region f r i extracted using topic modeling, we adjust its confidence value V T ( f r i ) by multiplying it with the maximum confidence value of all regions f r j returned by the composition pattern approach which are contained in f r i . This is encoded in the following equation:
V F ( f r i ) = V T ( f r i ) V P m a x ( f r i ) , w h e r e V P m a x ( f r i ) = m a x ( V P ( f r j ) ) f r j c o n t a i n e d i n f r i .
By taking the product, cases of high agreement are accentuated: If both approaches have high confidence values, the product will be even higher, while in cases where a region is scored low by both approaches, the product will be even lower.
To determine cases where there is significant disagreement, we first calculate the level of disagreement as follows:
V δ ( f r i ) = V T ( f r i ) - V P m a x ( f r i ) m a x ( V T ( f r i ) - V P m a x ( f r i ) ) V T ( f r i ) > V P m a x ( f r i ) 0 V T ( f r i ) = V P m a x ( f r i ) V T ( f r i ) - V P m a x ( f r i ) m i n ( V T ( f r i ) - V P m a x ( f r i ) ) V T ( f r i ) < V P m a x ( f r i ) .
The sign of V δ ( f r i ) indicates which approach yields a higher confidence value (topic modeling for positive and pattern-based for negative). The absolute value indicates the magnitude of disagreement. Then, using a threshold decided on a case-by-case basis, the regions with the highest level of disagreement are isolated. The results of the mutual evaluation process may then be used for further analysis. For instance, for each case of significant disagreement, it may be useful to attempt to explain the reasons that may have caused them, by looking at the individual characteristics of each approach (functional implications within the pattern and POI probabilities within the topic).

3.2. Data to Knowledge Fusion

This fusion process attempts to frame the functional context derived from the topic modeling extraction process in a way that conforms to the guidelines provided by the composition pattern. Similar to mutual evaluation, this process expects the results of the individual approaches as input; functional regions along with their topic probabilities and pattern-based scores, expressed as confidence values V T and V P , respectively. In contrast to the mutual evaluation case, this process does not keep equal distances between the two approaches; instead, it focuses on introducing weights that indicate how well the confidence values of the data-driven approach fit the knowledge-based individual sub-functions. The output of data to knowledge fusion is a set of confidence values V F for the identified functional regions, which are derived from values V T by taking into account values V P .
Data to knowledge fusion considers the knowledge-based results as the “actual” values which are compared with (and used to adjust) the “experimental” values calculated using the data-driven approach. The goal is to inflate or deflate the “experimental” values in order to better approximate the “actual” values, taking into consideration the overall correlation of the results. To achieve this, the confidence value of each functional region extracted using LDA topic modeling for a particular topic is compared against the confidence value calculated based on the individual sub-functions contained within the composition pattern related to this topic. Adjusted confidence values are calculated according to the following formula:
V F ( f r i ) = V T ( f r i ) ( 1 - R ( V T , V P ) ) V P ( f r i ) = 0 V T ( f r i ) + V T ( f r i ) - V P ( f r i ) R ( V T , V P ) V P ( f r i ) > V T ( f r i ) , V P ( f r i ) 0 V T ( f r i ) - V T ( f r i ) - V P ( f r i ) R ( V T , V P ) V P ( f r i ) < V T ( f r i ) , V P ( f r i ) 0 V T ( f r i ) V T ( f r i ) = V P ( f r i ) 0
where R stands for the Pearson correlation coefficient, which gives a rough indication with regard to how associated the distributions of the confidence values of the two approaches are. In essence, this formula adjusts the probability of the topic in question proportionally to the score calculated based on the satisfaction of sub-functions in the pattern. Note that in the exceptional case where this score is equal to zero (because core sub-functions are not satisfied), the probability is adjusted according to the global correlation value across all identified regions.

3.3. Knowledge to Data Fusion

The third fusion process is the dual of the aforementioned one: the data-driven results act as the “actual” values which are compared with (and used in order to adjust) the “experimental” values calculated using the knowledge-based approach. Similarly to the previous two processes, knowledge to data fusion expects as input the results of the individual approaches, functional regions along with their confidence values V T and V P . The output in this case is a set of confidence values V F for the identified functional regions, which are derived from values V P by taking into account values V T .
In essence, the goal of knowledge to data fusion is to adjust the results of the knowledge-based process by considering information derived from human activity information, which is captured through the LDA topic modeling approach. For instance, this would account for cases where a region satisfies most of the sub-functions related to shopping included in a pattern but where reported shopping-related check-ins are relatively low.
Each functional region that is discovered using a composition pattern is compared against the probability value of the associated topic, calculated using LDA topic modeling. Similar to the previous process, adjusted confidence values are calculated using the following formula:
V F ( f r i ) = V P ( f r i ) ( 1 - R ( V T , V P ) ) V T ( f r i ) = 0 V P ( f r i ) + | V T ( f r i ) - V P ( f r i ) | R ( V T , V P ) V T ( f r i ) > V P ( f r i ) , V T ( f r i ) 0 V P ( f r i ) - | V T ( f r i ) - V P ( f r i ) | R ( V T , V P ) V T ( f r i ) < V P ( f r i ) , V T ( f r i ) 0 V P ( f r i ) V P ( f r i ) = V T ( f r i ) 0 .
This formula again allows the proportional adjustment of the score calculated using knowledge-based patterns considering the co-occurrence of POIs derived from the data-driven approach.

4. Demonstration and Results

In this section, we demonstrate the application of the proposed fusion methodologies on the problem of discovering regions that provide functionality associated with “shopping plazas” in the Los Angeles metropolitan area. We first show individual results of the LDA topic modeling approach, as reported in [12], and the function-based pattern approach, as reported in [15], with a slightly updated version of the included composition pattern. Then, we demonstrate the results of applying the mutual evaluation, data to knowledge and knowledge to data fusing techniques. The results are discussed in detail in Section 5.

4.1. Study Area and Data

The demonstration involves the metropolitan area of Los Angeles, California using the official boundaries provided by the U.S. Census Bureau’s TIGER geographic database (https://www.census.gov/geo/maps-data/data/cbf/cbf_msa.html) and coordinate reference system “EPGS:3309”. The POIs involved in the experiment are extracted from the online social platform Foursquare using the Foursquare developer API and represent the entries of December 2016. The total number of POIs within the study area is 14824; they are classified into 425 types and organized in 9 categories, following the formal Foursquare Venue Categorization (https://developer.foursquare.com/docs/resources/categories). Additional data include the street network, acquired from the OpenStreetMap platform, which is classified based on the types and categories found in the OpenStreetMap Wiki (https://wiki.openstreetmap.org/wiki/Key:highway).
It should be noted that the choice of study area and functionality goal is indicative and is informed by knowledge, data quality and availability. The composition pattern follows western world standards since knowledge on these is readily available to the authors. Also, given the popularity of Foursquare in the United States, the quality of POI information and the quantity of checkins is much higher than in other countries, hence leading us to focus on US metropolitan areas. As discussed in Section 2.1.2 and Section 2.2.2, the composition patterns and LDA topic modeling approaches can be applied to any study area or functionality, provided that there is available knowledge and data to create patterns and calculate topic probabilities. To prove this point, we also include in Section 4.5, the results from applying the proposed framework to discover “shopping plaza” regions in the Denver metropolitan area (officially Denver-Aurora-Lakewood) in Colorado.

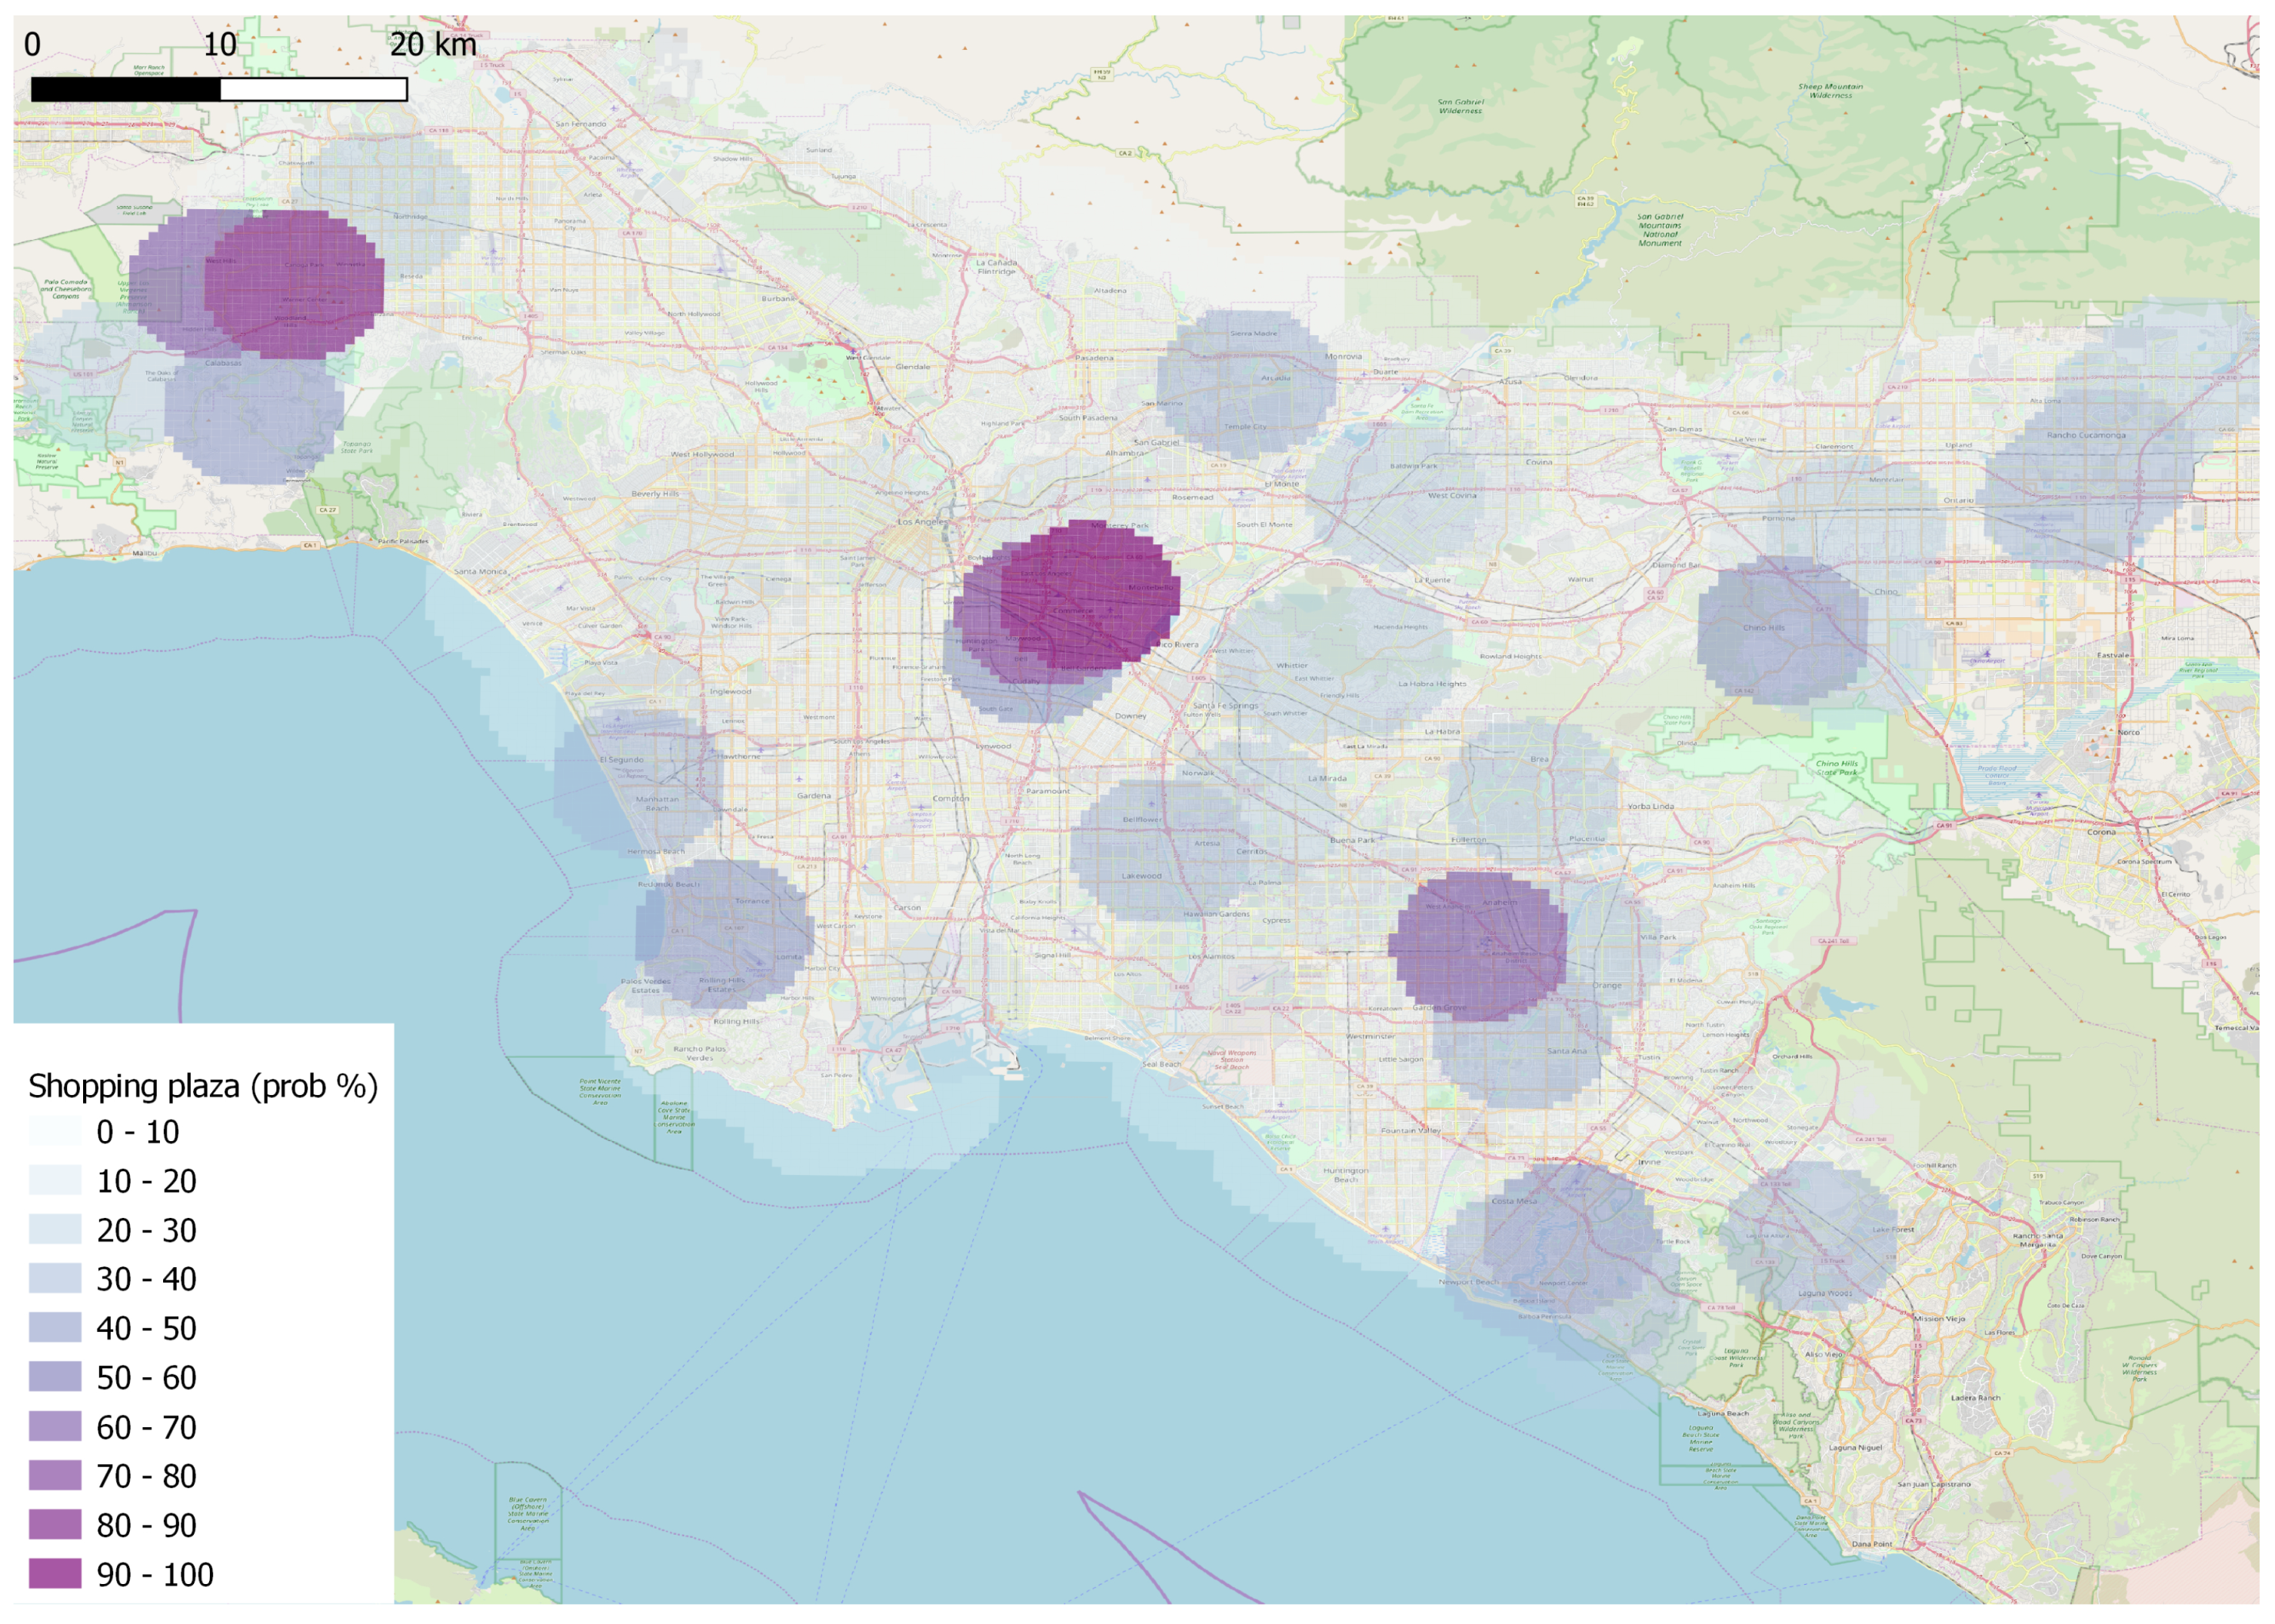
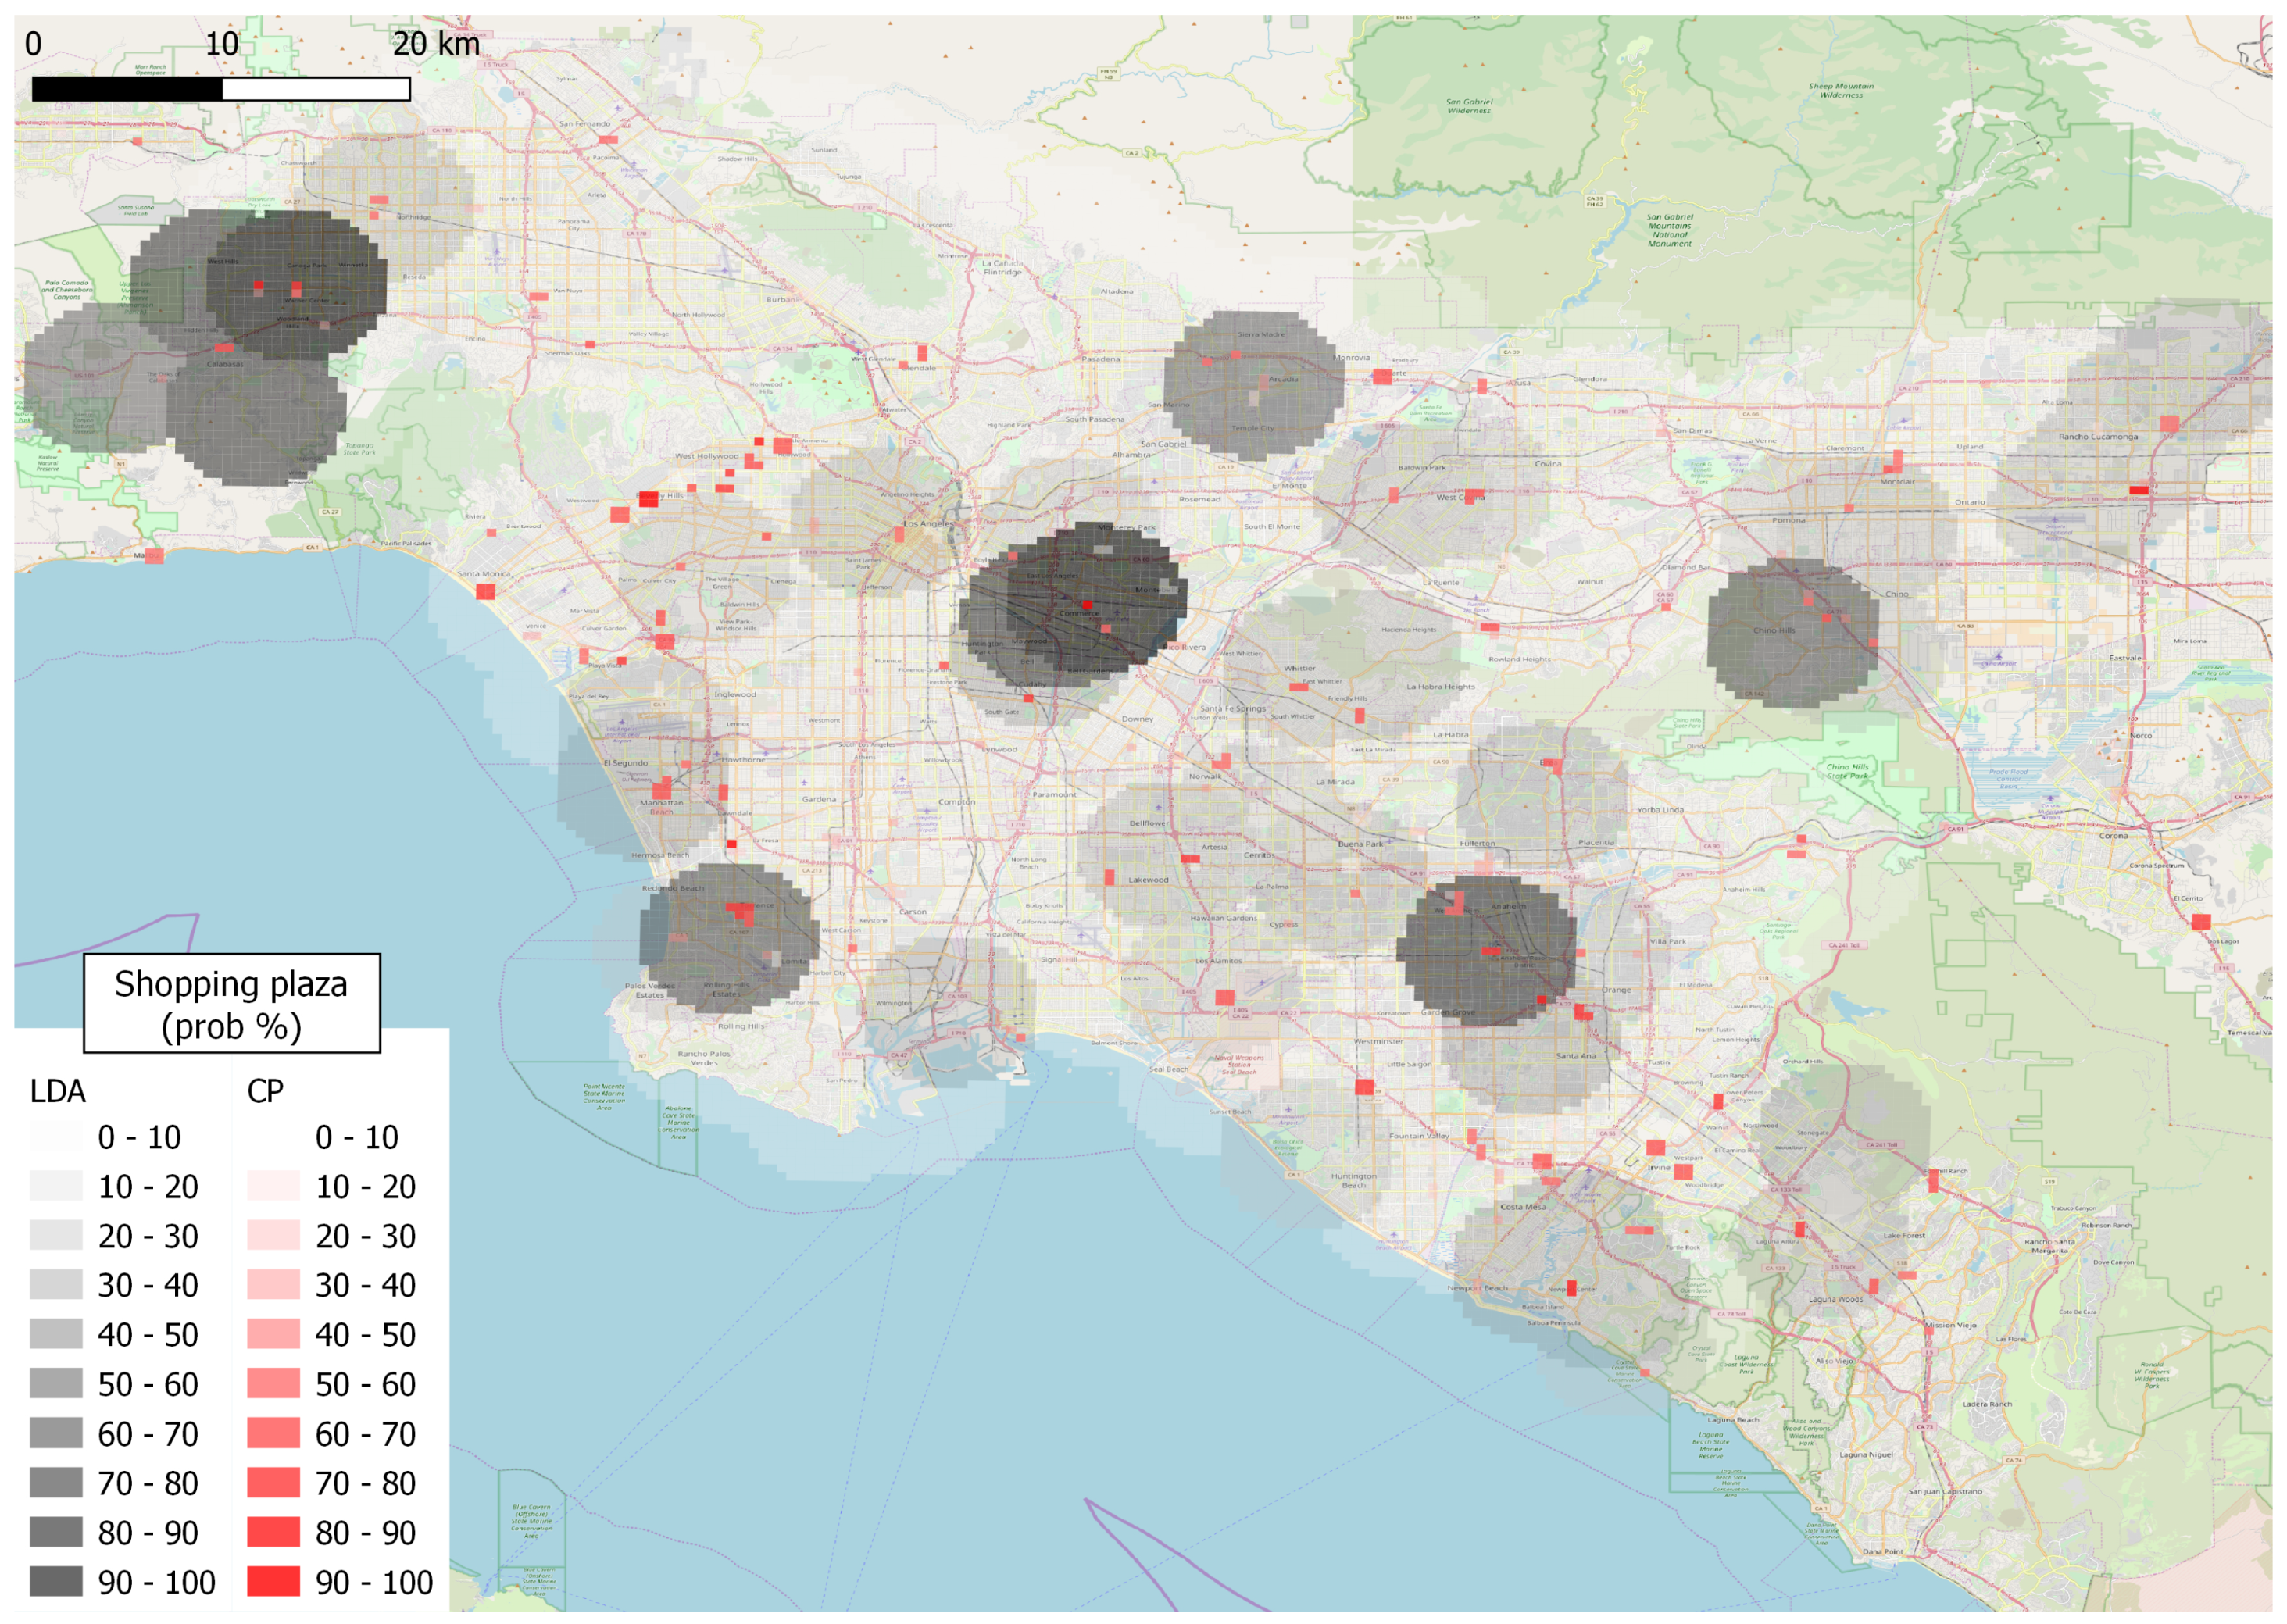
4.2. Results Using Individual Approaches

The topic modeling approach is demonstrated using topic 67 in [12], which is interpreted as “shopping plaza”. It reflects the functional context of a region characterized by a high occurrence of shopping-related POIs, such as shopping malls and accessories stores, accompanied with moderate to low numbers of restaurants or other food-oriented facilities (as shown in Table A1 in Appendix A). The LDA algorithm reported in [12] is applied on 200 regions of 4.5 km radius each, properly distributed to cover approximately all of the spatial extent of the Los Angeles metropolitan area. Each of these candidate regions is then classified based on the probability of topic 67 being dominant, meaning that the candidate region is more likely to be a “shopping plaza” than any other type of functional region.
For the knowledge-based approach we used the function pattern introduced in [15]. In particular, a region is considered as a candidate shopping plaza if it supports the fundamental functions of “shopping experience” and “walkability”. Each candidate, then, is evaluated against various secondary functions, such as: “leisure”, “entertainment”, “accessibility to drivers” and so on and the final score is calculated. For the purposes of the current demonstration we slightly extend the pattern in [15] with additional functions and adjust some of the existing rules. Table A2 and Table A3 in Appendix A present the necessary components and the revised version of the pattern used, as well as the scoring function used.
For clarity and visualization purposes, in all figures that follow, the results are overlayed on a square grid (500 × 500 m2). Figure 2 presents the results of each individual approach on the same map. Darker hues indicate higher probability of the region being a “shopping plaza”, with red and gray colours denoting results using the pattern-based and topic modeling approach, respectively. Figure 3 presents the results of a primitive integration process that does not follow any of the proposed methodologies in Section 3: It simply includes only those results from both approaches that overlap and score higher than 50%. A pie chart is also provided, showing how each category of sub-functions within the pattern contributes to the confidence value.
Figure 2 illustrates the different foundations of each approach, in terms of delineation of functional regions. The approach using patterns based on the function-based model of place searches for specific areas whose components and composition are capable of satisfying the supportive functions contained in the pattern. The LDA topic modelling approach, on the other hand, is capable of identifying the wider regions within which one may find the requested functionality with online social activity evidence, based on co-location of POI types and their popularity.
The results in both figures resemble the egg-yolk representation [31], especially in Figure 3. In particular, the regions discovered using the data-driven approach represent an outer boundary (“egg”) with the semantics that there is a chance of finding a “shopping plaza” within. The results of the knowledge-based search determine the inner boundaries of the sub-regions with the highest functionality, which resemble the core of the parent functional region (“yolk”).

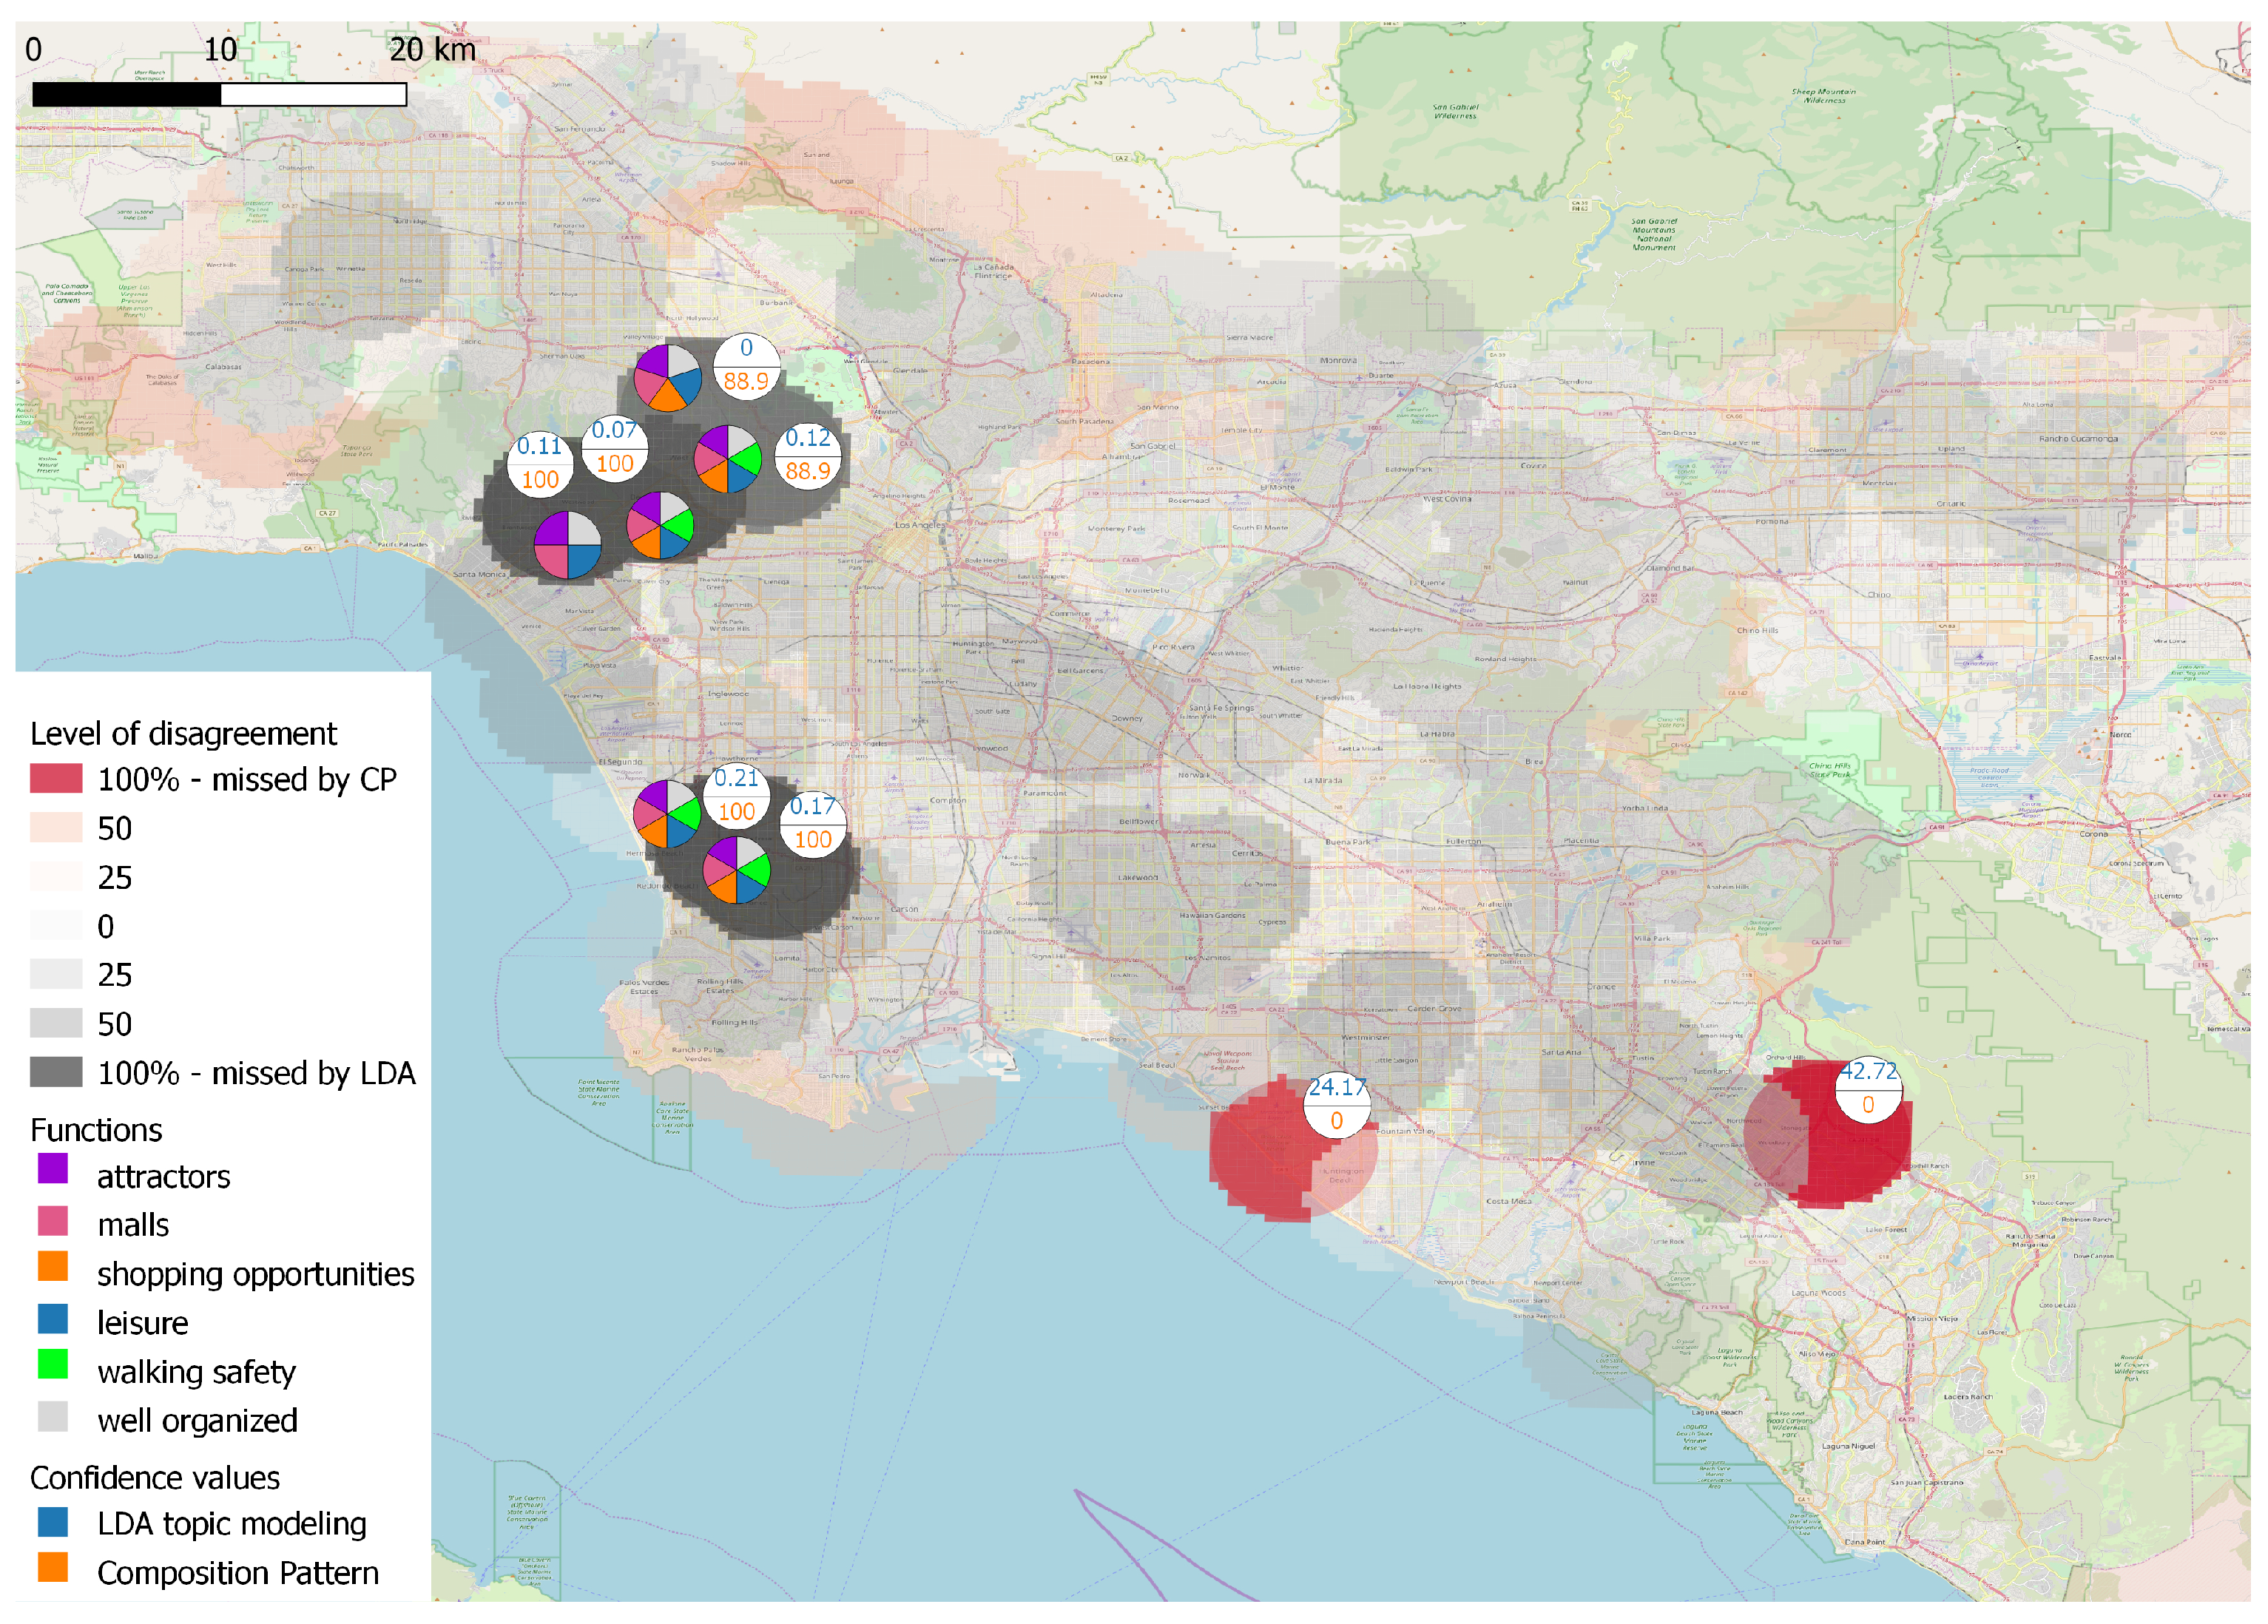
4.3. Results of Mutual Evaluation

The Pearson correlation coefficient value for the particular set of results is equal to 0.387. This indicates a positive association between the distributions of the confidence values of each approach. Following the process described in Section 3.1, we first identified cases of high agreement and produced the map shown in Figure 4 showing identified regions along with adjusted confidence values using the multiplication formula. Note that values are again scaled to 0-100 to facilitate comparison. Given the fact that the LDA topic modeling approach alone returns less results than the pattern-based one, areas of significant agreement mainly converge around regions that have been identified by LDA.
Areas where the two approaches seem to converge, leading to the highest values of combined confidence values, include the regions around East Los Angeles, Canoga Park, Torrance and Anaheim (around Disneyland Park). All of these can be argued to include widely known shopping districts in the Los Angeles metropolitan area.
Finally, we identified cases of significant disagreement by calculating the differences between the confidence values produced using each approach. Regions where results differ significantly between the two approaches are shown in Figure 5. The dark grey regions are cases where the pattern-based approach attributes very low (or zero) likelihood for the region to operate as a “shopping plaza”, whereas the topic modeling approach gives high probability (up to 100). Confidence values of each approach are attached to these regions. On the other hand, the red regions are cases where the confidence value of the knowledge-based approach is very high (88.9 to 100), but the probability using the data-driven approach is very low (0 to 0.21). In these cases, a pie chart is provided as in Figure 3, showing how each category of sub-functions within the pattern contributes to the confidence value.
As can be seen in Figure 5, regions that were excluded from the LDA-based approach are those around West Hollywood and Beverly Hills. As shown in the included pie charts, all of these regions satisfy functionality directly related to shopping plazas. The pattern-based approach did not include regions around Sunset Beach and Northwood, as well as Monterey Park and Montebello. A discussion of the possible reasons behind these cases of significant disagreement is offered in Section 5.

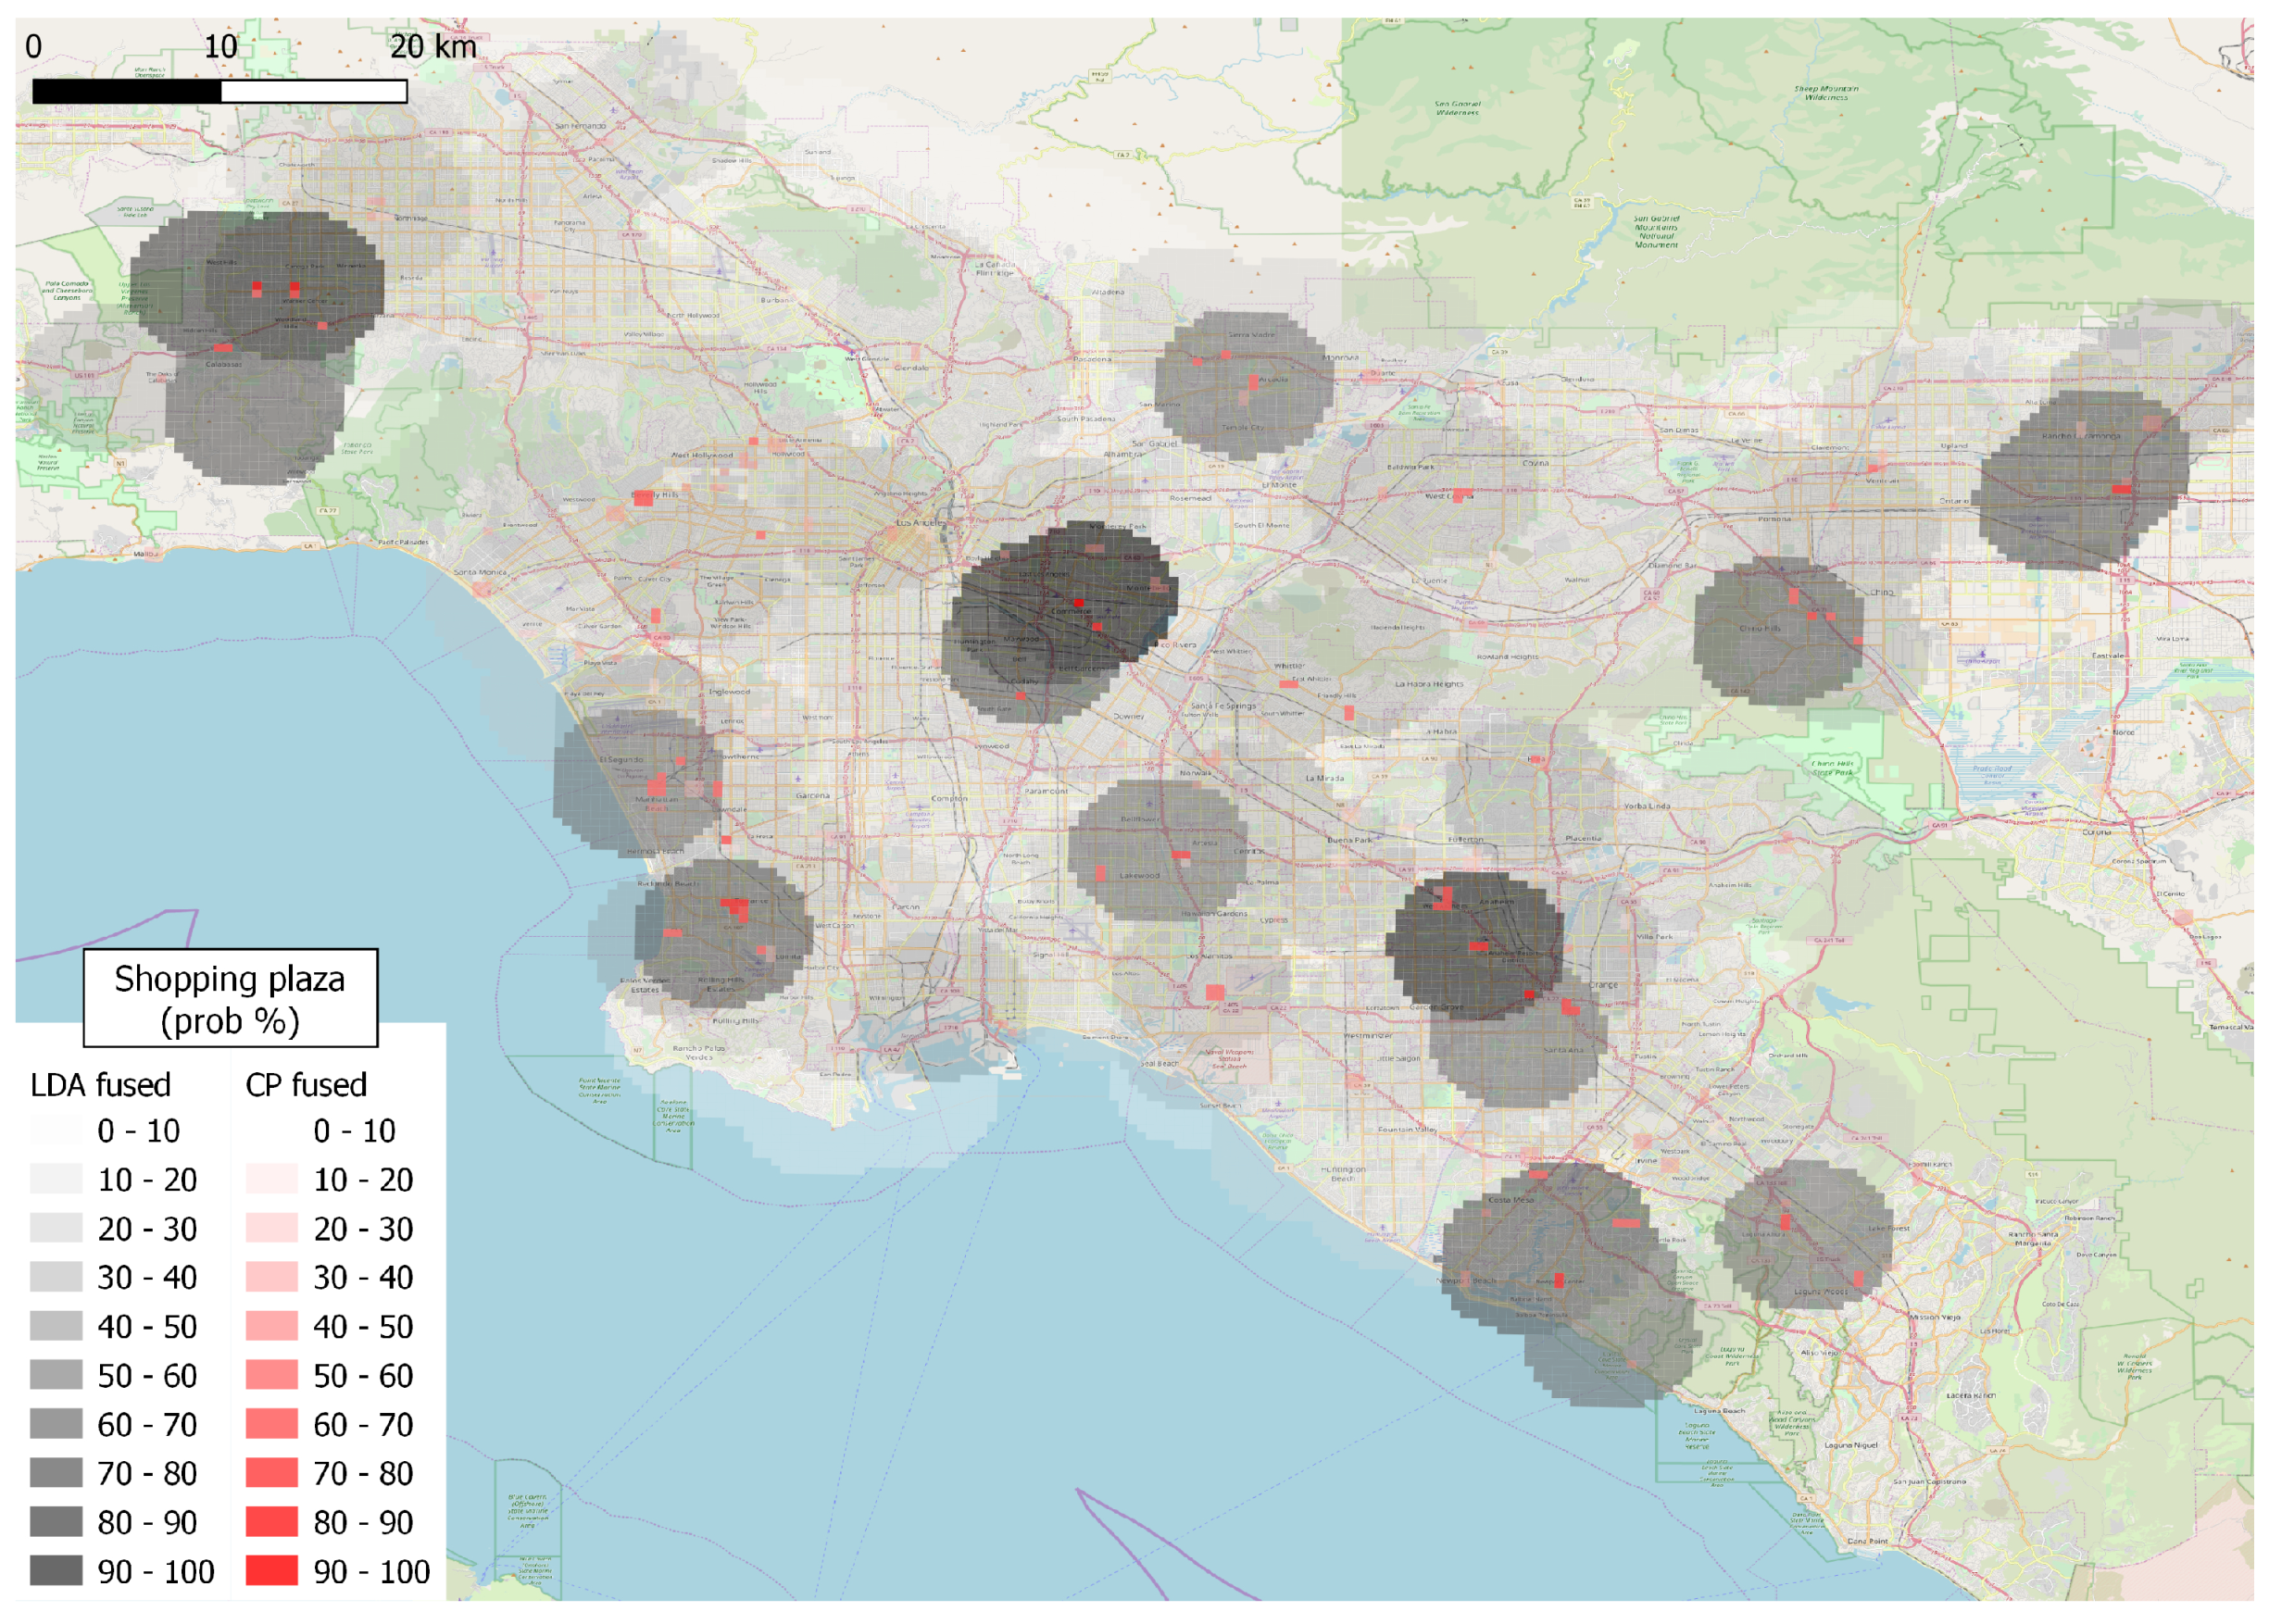
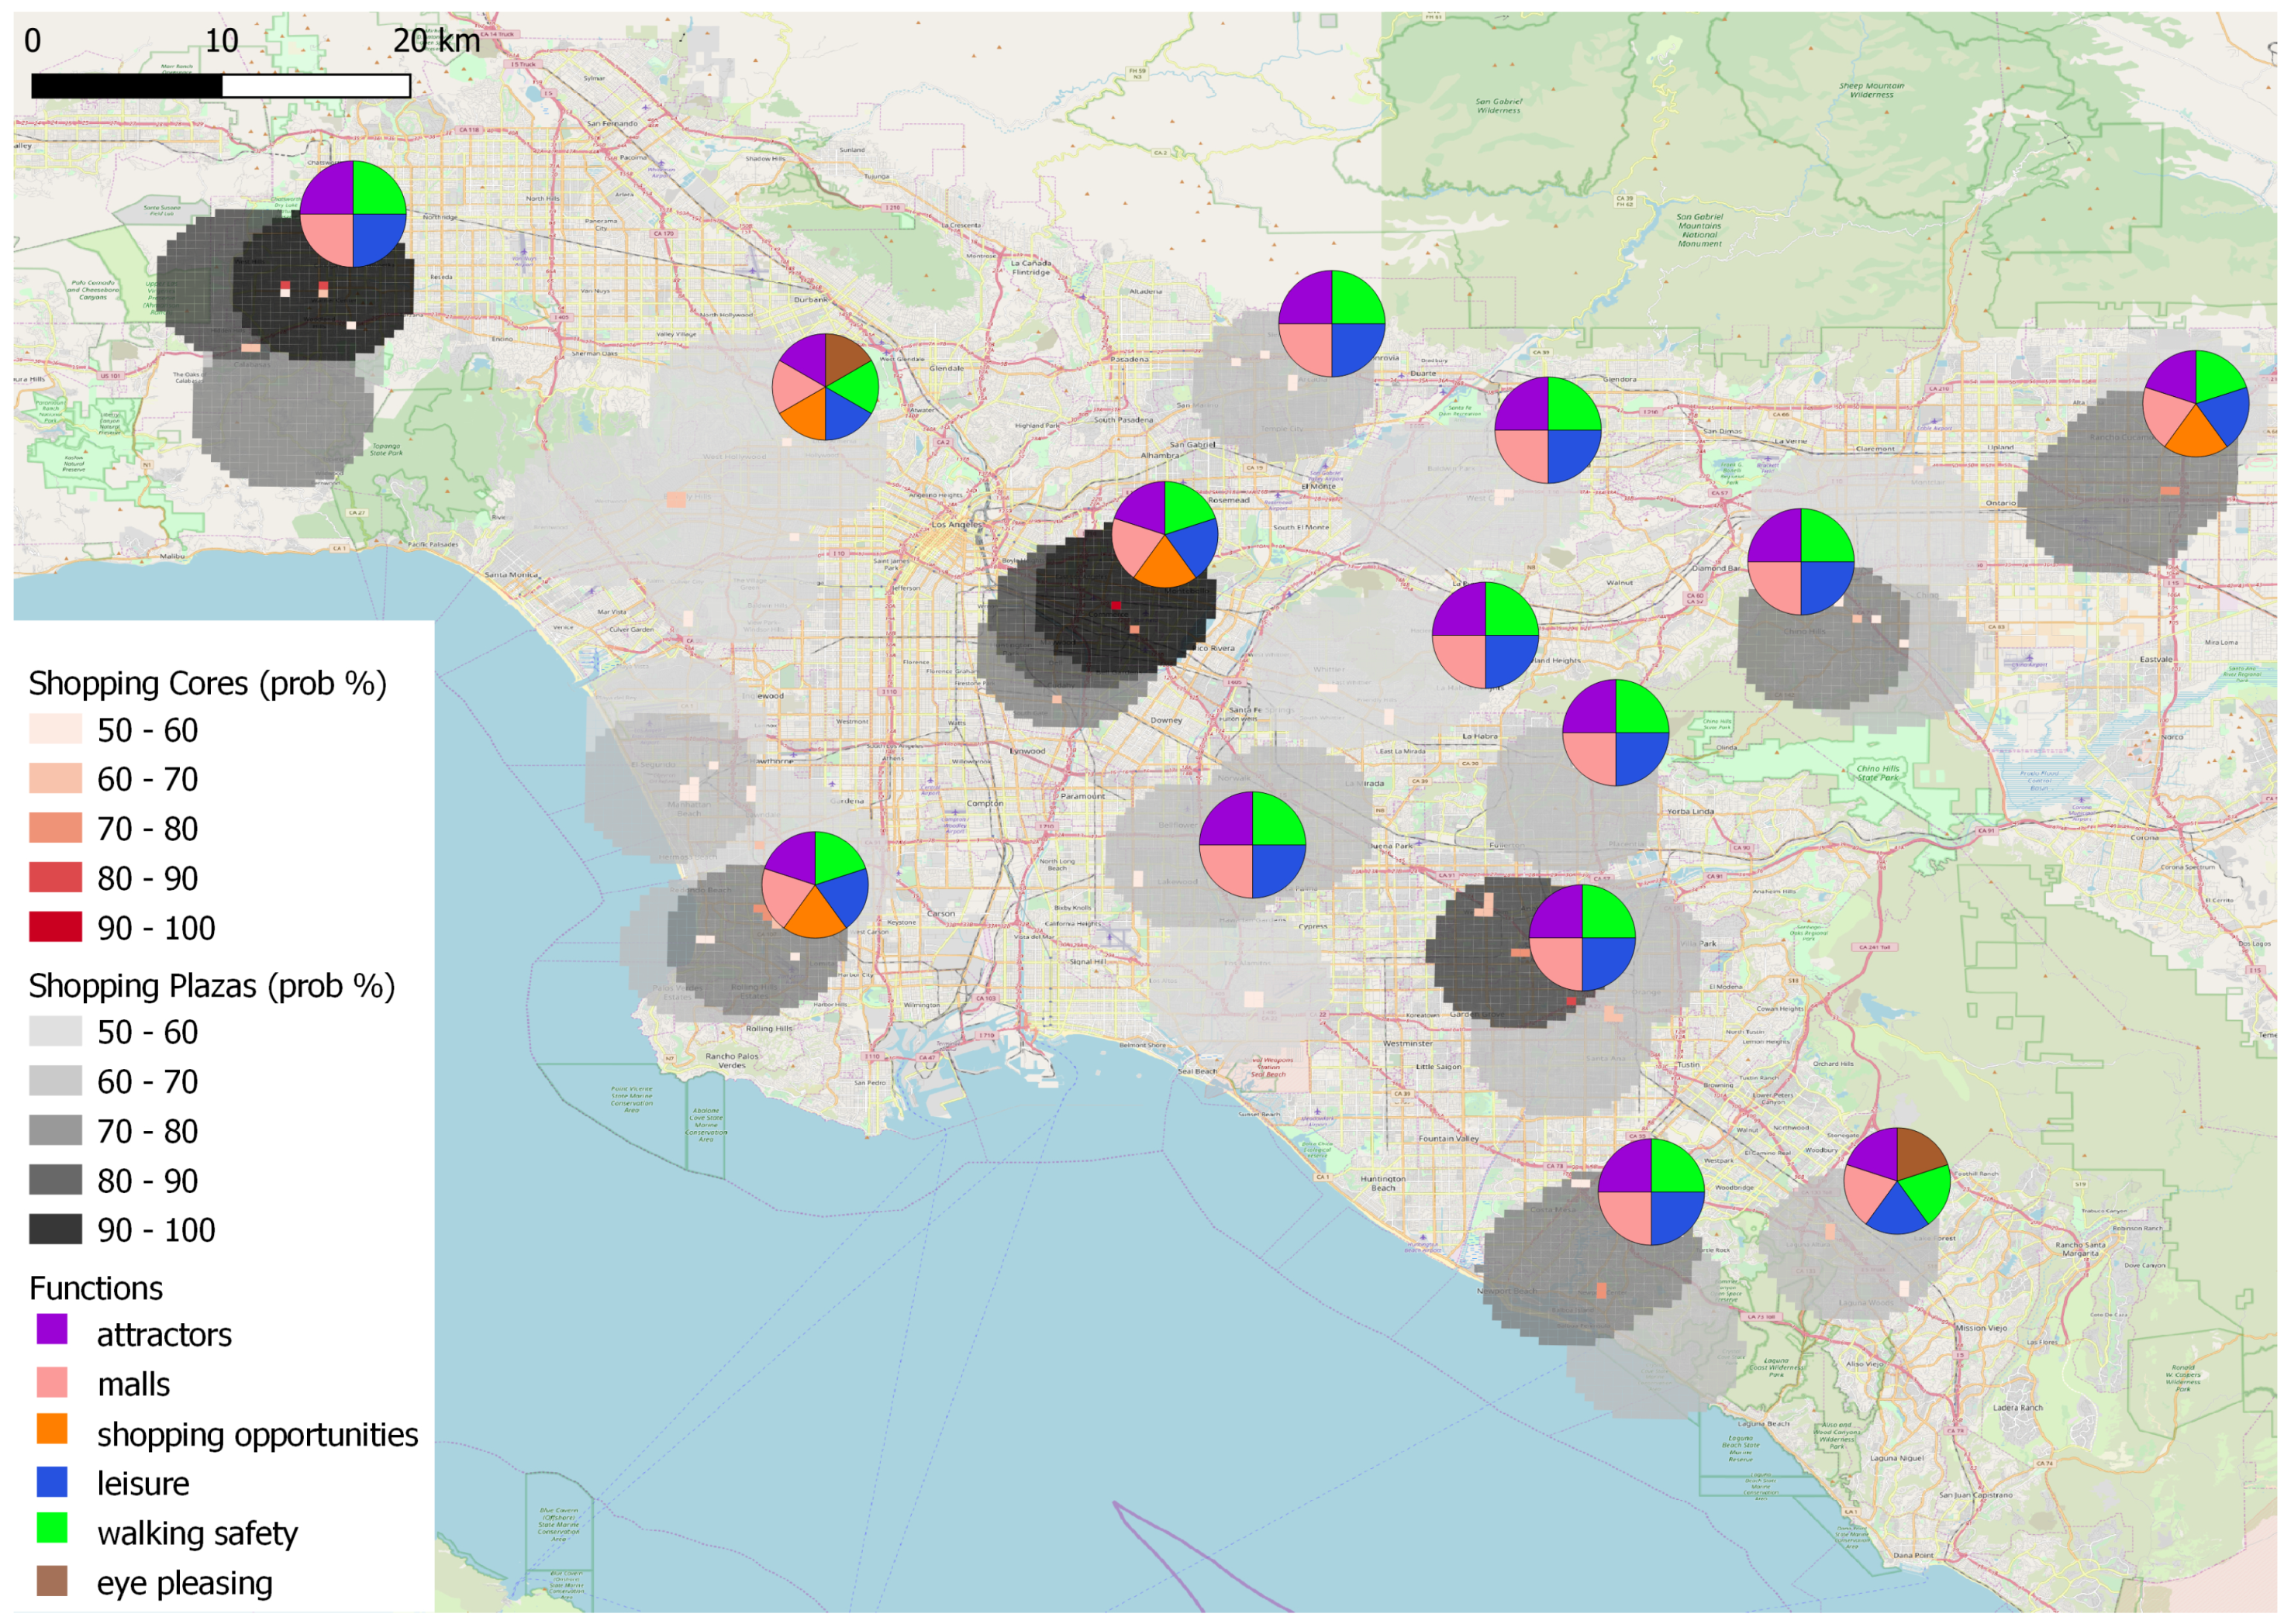
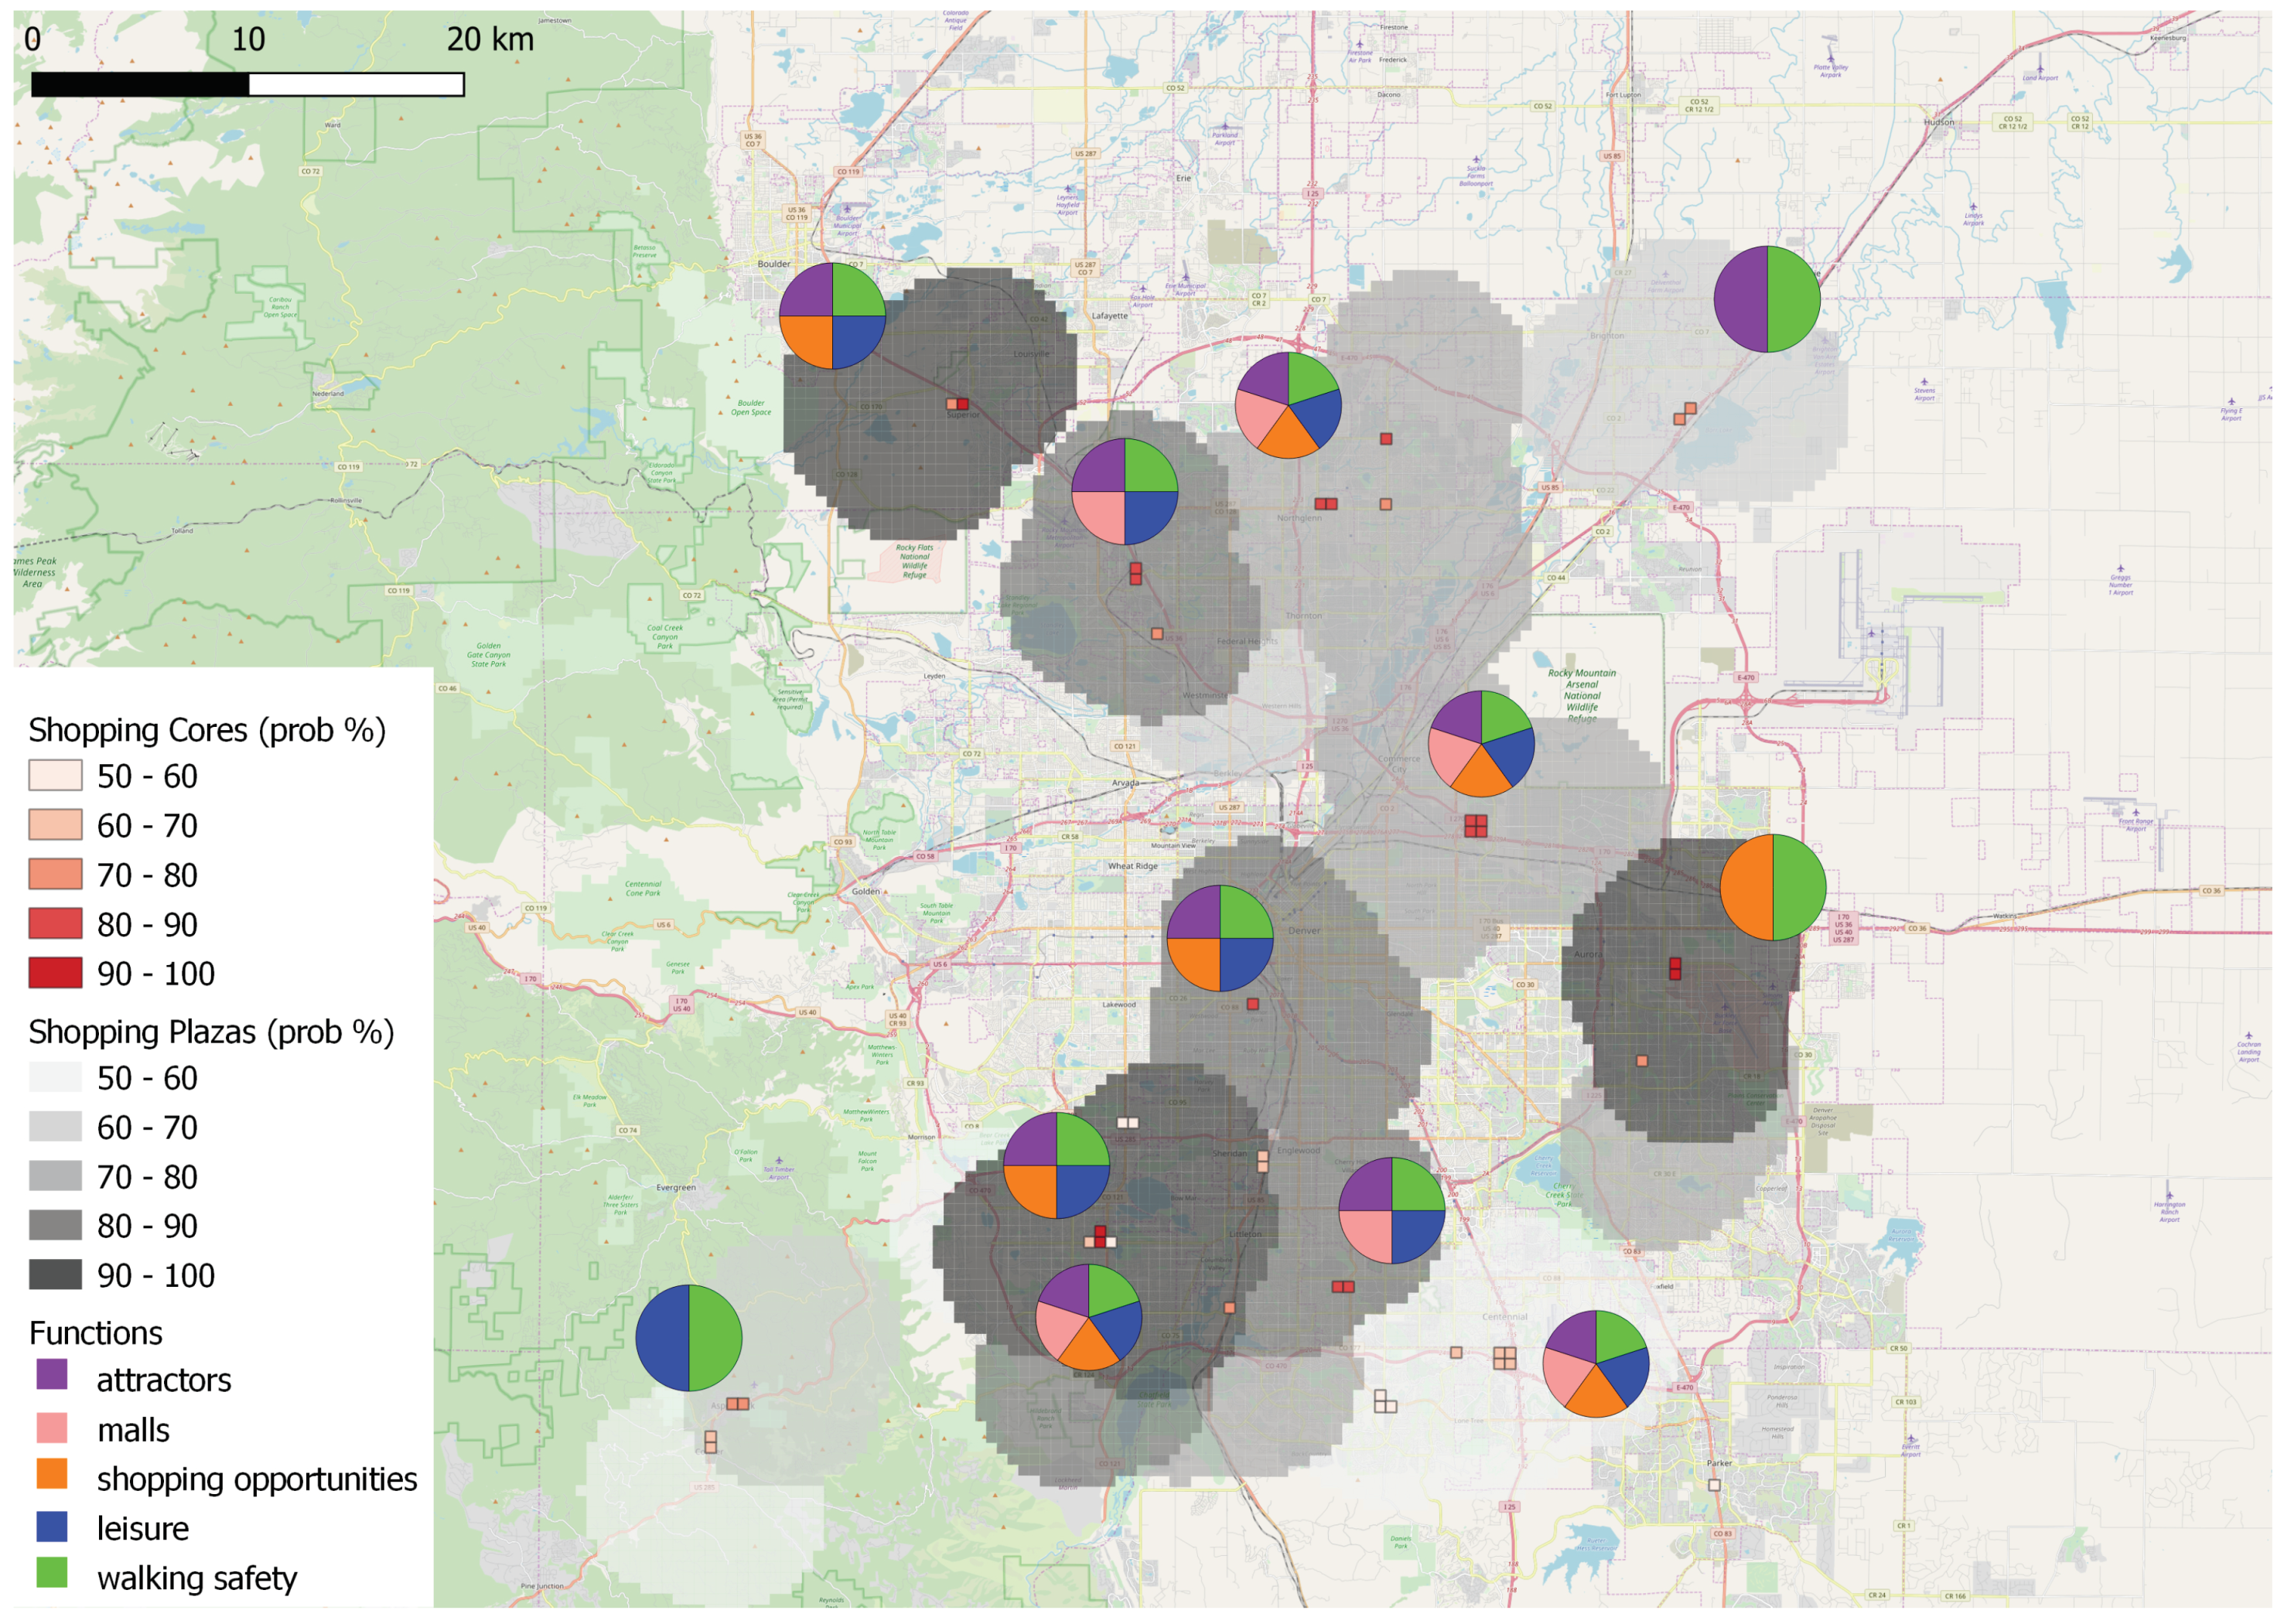
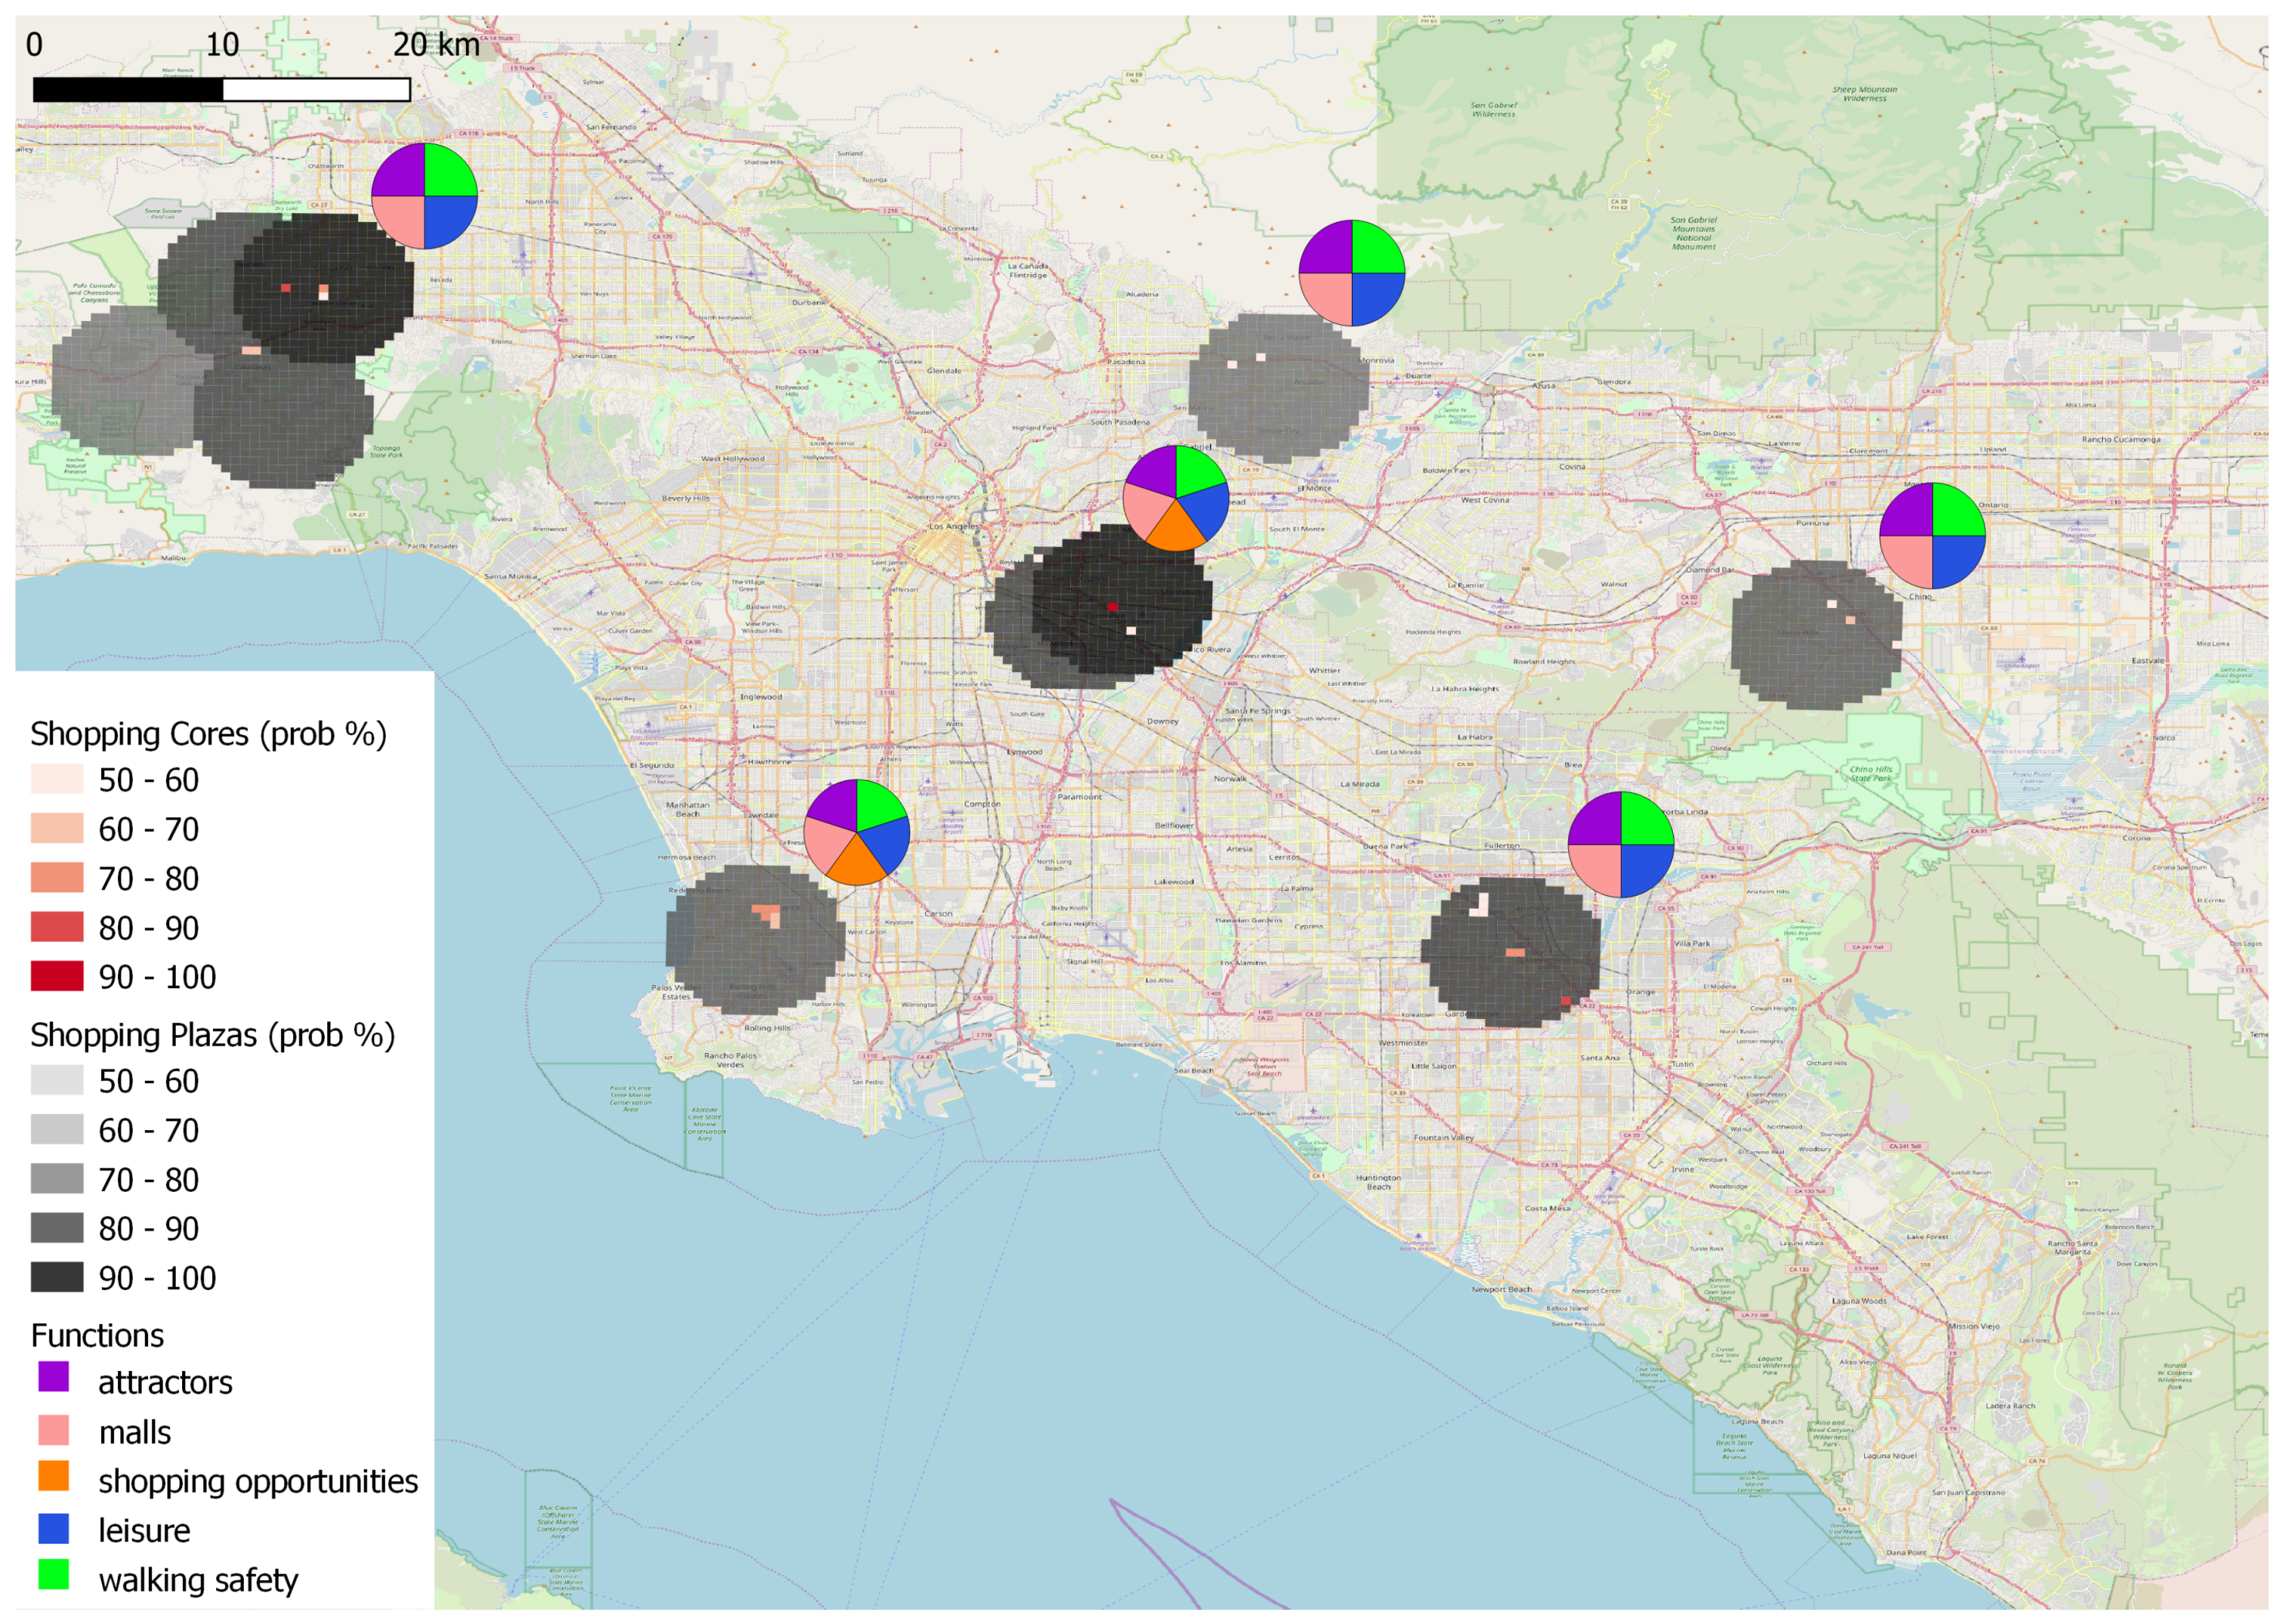
4.4. Results of Data to Knowledge and Knowledge to Data Fusion

Starting with the confidence values calculated using LDA topic modeling, we applied the equation in Section 3.2 and result in confidence values adjusted based on the pattern-based results (LDA fused values). Following the opposite direction, confidence values calculated using the pattern-based approach were adjusted using the formula in Section 3.3 in order to take into account the results of LDA topic modeling (CP fused values). Results are overlayed and shown in Figure 6.
As can be gathered from comparison with Figure 2 and Figure 5, the regions that were previously missed are now included and all region probabilities are adjusted depending on the level of agreement or disagreement. In particular, the data-to-knowledge fusion process leads to an inflation of confidence values throughout the area of study. This allows the aforementioned missed areas to be included, since the higher co-occurrence of non shopping-related POIs is counterbalanced by their spatial configuration, which, according to the defined pattern, facilitates the desired functionality. The knowledge-to-data fusion process achieves similar results, but in the reverse direction; confidence values are, in general, deflated, allowing a more clear identification of the most popular regions, due to the inclusion of social media data exploited by the data-driven approach.

4.5. Overall Results

As an overall result of the latter two fusing processes, we provide in Figure 7 an overall identification of regions functioning as “shopping plazas”. We kept only those overlapping regions from the two fusing processes which have a confidence value higher than 50%, accompanied with an aggregation of the functions that can be found there. Compared to Figure 3, where no fusion has been applied, the number of identified regions is clearly increased, while adjustments have been made to each region, with regard to their extent, attached probabilities, the location of core functionality and the distribution of sub-functions.
As mentioned in Section 4.1, we also provide the results of applying the proposed framework on a different metropolitan area, that of Denver, Colorado. For brevity, Figure 8 only shows overall results similar to Figure 7. The highly-scored regions are around the following areas: Denver downtown and nearby areas (Littleton and Columbine), Aurora, Superior and Broomfield. Apart from Denver downtown, the rest include towns within the wider Denver metropolitan area, each of which hosts a number of actual shopping malls.

5. Discussion

A common characteristic of all methodologies to discover functional regions is the extreme difficulty (or impossibility) of acquiring ground truth, since they are dealing with highly subjective notions derived from human understanding or perception. Figure 4 and Figure 5 indicate that the proposed mutual evaluation process can provide a useful substitute. Figures such as Figure 4 help reinforce the discovery of those regions that are most highly accepted as solutions, based on all the available information. In this manner, the validity of results using one approach can be supported and justified by similar results using the other approach.
On the other hand, Figure 5 serves as a way to detect regions that were missed by either approach due to their individual limitations and helps to understand how these limitations affect results. For instance, the regions that were missed by the LDA-based approach (around West Hollywood and Beverly Hills) are areas where there is a higher co-occurrence (and social media popularity) of POI types related to leisure, as opposed to shopping; this led these regions to be associated with a different topic (related to restaurants and bars). In some of the regions missed by the pattern-based approach (around Sunset Beach and Northwood), while an adequate number of shopping-related POIs is contained, their spatial organization does not satisfy most (or any) of the functional implications in the pattern. Also, in the cases of Monterey Park and Montebello, while the wider area is popular and provides several shopping-related opportunities (both of which are captured by the LDA-based approach), the assumptions behind the pattern-based approach restrict its focus on a much narrower scale, hence attributing lower scores.
Comparing Figure 2 and Figure 6, it can be concluded that the aforementioned limitations which led each approach to miss some results are mitigated. In the new map, topic modeling results now include more relevant regions which were missed, due to lack of knowledge of the composition of the underlying area, while pattern-based results are a bit more grounded, since they now take into account concentration and popularity of relevant POIs. The two fusion processes provide results of different granularity to serve different purposes. On a coarse-grained level, the results of LDA topic modeling adjusted using patterns provide discovery of wider regions with higher recall than the results of LDA alone. On a fine-grained level, pattern-based results adjusted using topic probabilities can now differentiate between two areas where, while both support all functions within a pattern, one area is more popular than the other and, hence, deserves to be ranked higher.
A comparison of Figure 7 and Figure 3 clearly shows the benefits of a functional region discovery approach that fuses knowledge and data. Compared to what can be gathered by simply combining and overlaying best results from either approach, the end result in Figure 7 discovers functional regions of the type “shopping plaza” that:
  • are highly functional, also explaining which particular functions mostly contribute to this, as derived from the knowledge-based aspect;
  • are popular, based on the inclusion of social media information exploited by the data-driven aspect;
  • are homogeneous both in terms of the POIs included and the way they are spatially organized.
These characteristics of the results allow the proposed framework to improve upon the state-of-the-art approaches on which it is based. As also evidenced by the inclusion of results from two different metropolitan areas, the proposed framework is generic enough to be easily transferable. However, transferability may be limited in two ways: (1) if the knowledge encoded in the pattern is not entirely relevant to the study area (e.g., because “shopping plaza” does not follow western world standards); and (2) data of high quality are not available (e.g., POI and social media-related information).
The results of the proposed framework lend support to the argument that the combination of knowledge and data may prove beneficial to the long-standing problem in GIScience of delineating and modeling vaguely defined regions of which cognitive regions, functional regions and places are the most prominent examples [32,33].
The presented results indicate that trusting exclusively either of the two approaches may lead to some results being missed or overly highlighted. By using the fusion methodologies, the results of one approach serve as a “bias” to challenge the “authority” of the other approach. The overall aim moving forward would be to realise fusion earlier, during the discovery process and not as a post-processing step, resulting in a truly hybrid methodology. This would potentially lead to more harmonized results and provide a more realistic view that is neither entirely confined by pattern rules, nor exclusively governed by statistical analysis of data. This is a very interesting future research avenue that we fully intend to explore.

6. Conclusions

In this work, we propose a novel framework for the discovery of regions supporting particular functionalities, that fuses two previously independent research pathways, one top-down and one bottom-up. The top-down, knowledge-driven approach relies on design patterns created based on expert knowledge on urban design and planning. The bottom-up, data-driven approach discovers semantically meaningful topics based on co-occurrence patterns of POI types, incorporating user check-ins on social networks. Three types of fusion are examined: (1) mutual evaluation, where the results of the two approaches are compared to discover cases of significant agreement and disagreement; (2) use of knowledge patterns to adjust topic probabilities produced by the data-driven approach; and (3) use of topic probabilities derived from data to adjust scores calculated using the knowledge-driven approach. The synergy between knowledge and data allows for improved results in functional region discovery, as evidenced by the conducted experiment on identifying “shopping plaza” regions in the Los Angeles metropolitan area. Mutual evaluation can help identify cases where the drawbacks of either approach lead to regions being included or excluded incorrectly, while using one approach to adjust the results of the other leads to improved overall accuracy.
The presented framework is a first attempt at exploring how the lines of knowledge-based and data-driven work in [12,15] can be brought together, by largely keeping the individual methodologies intact while using their results to either evaluate or adjust each other. In the future, we first intend to conduct additional experiments incorporating additional urban areas and other types of functionality. We also plan to explore a tighter integration between the two methodologies with the aim of proposing a unified hybrid methodology that exploits both knowledge and data internally. For instance, knowledge (either raw or encoded in a pattern) can be used to adapt the LDA process itself, e.g., by rescaling the document-word frequency matrix, as is done using check-in data. Alternatively, VGI data can be used to adjust knowledge-based patterns, an approach similar in spirit to the empirical and probabilistic patterns proposed in [34].

Author Contributions

Conceptualization, E.P., S.G. and G.B.; methodology, E.P., S.G. and G.B.; software, E.P. and S.G.; validation, E.P. and S.G.; formal analysis, E.P., S.G. and G.B.; investigation, E.P., S.G. and G.B.; resources, E.P. and S.G.; data curation, E.P. and S.G.; writing–original draft preparation, E.P. and G.B.; writing–review and editing, E.P., S.G. and G.B.; visualization, E.P., S.G. and G.B.; supervision, E.P.; project administration, E.P.

Funding

This research is framed within the Doctoral College GIScience (DK W 1237N23), funded by the Austrian Science Fund (FWF).

Acknowledgments

Open Access Funding by the Austrian Science Fund (FWF).

Conflicts of Interest

The authors declare no conflict of interest. The funders had no role in the design of the study; in the collection, analyses, or interpretation of data; in the writing of the manuscript, or in the decision to publish the results.

Appendix A

In this appendix, we provide additional details for the demonstration presented in Section 4. Table A1 shows the probabilities calculated using LDA topic modeling for the top-15 POIs in the “shopping plaza” topic. Table A2 lists all components that are required for the composition pattern describing functionality related to “shopping plaza”. This pattern is provided in Table A3, including also the scoring function used to calculate the confidence value of each candidate region.
Table A1. Top-15 ranked point of interest (POI) types for the “shopping plaza” topic in [12].
CategoryProbabilityCategoryProbability
shopping mall0.207709bistro0.000105
accessories store0.056738dumpling restaurant0.000096
chocolate shop0.013896korean restaurant0.000090
shoe store0.000288german restaurant0.000080
breakfast spot0.000282herbs & spices store0.000079
gaming cafe0.000196airport terminal0.000078
optical shop0.000180outlet store0.000076
post office0.000114
Table A2. Set of components associated with a shopping plaza.
VariableComponentFilter
C S Shop T y p e _ F i l t e r ( S h o p )
C A Amenity T y p e _ F i l t e r ( A m e n i t y )
C F Facilities C S C A
C W P Walkable plaza T y p e _ F i l t e r ( S u r f a c e )
P r o p _ F i l t e r ( w a l k a b l e , t r u e )
C H Motorway T y p e _ F i l t e r ( R o a d )
P r o p _ F i l t e r ( p e d e s t r i a n s , f a l s e )
C S r Service Road C H P r o p _ F i l t e r ( p e d e s t r i a n s , t r u e )
C W Walkable C W P C S r
C P Parking place C A P r o p _ F i l t e r ( s e r v i c e , p a r k i n g )
C B Transportation node C A P r o p _ F i l t e r ( s e r v i c e , t r a n s p o r t a t i o n )
C A n Anchor Store C S P r o p _ F i l t e r ( g o o d s , v a r i o u s )
C M Mall C S P r o p _ F i l t e r ( g o o d s , v a r i o u s )
P r o p _ F i l t e r ( s e r v i c e , v a r i o u s )
C A t Attractors C M C A n
C S b Basic Shop C S P r o p _ F i l t e r ( g o o d s , b a s i c )
C S e Special Shop C S P r o p _ F i l t e r ( g o o d s , s p e c i a l )
C S u Uncommon Shop C F ( P r o p _ F i l t e r ( g o o d s , u n c o m m o n )
P r o p _ F i l t e r ( s e r v i c e s , u n c o m m o n ) )
C A s Food court C A P r o p _ F i l t e r ( s e r v i c e , s u s t e n a n c e )
C A e Entertainment C A P r o p _ F i l t e r ( s e r v i c e , e n t e r t a i n m e n t )
C A l Luxury services C A P r o p _ F i l t e r ( s e r v i c e , h e a l t h & b e a u t y )
C A v Aesthetics C A P r o p _ F i l t e r ( s e r v i c e , v i s u a l l y p l e a s i n g )
Table A3. Composition pattern of a shopping plaza.
Functional Implications
Functions ( F ) Logical Formula
F W ( C S b , C A t , C W , C S r ) (Walkability) O c c u r r e n c e ( C W , N ) ( ( O c c u r r e n c e ( C S b , [ 5 , ) ) P r o x i m i t y ( C S b , C S b , ( 0 , 500 m ] ) S _ R e l a t i o n ( C W , C S b , [ intersects ] ) ) ( O c c u r r e n c e ( C A t , [ 1 , ) ) ) S _ R e l a t i o n ( C W , C A t , [ intersects ] ) )
F S E ( C A t , C S b , C W ) (Shopping Experience) F W ( O c c u r r e n c e ( C S b , [ 5 , ) S _ R e l a t i o n ( C W , C S b , [ i n t e r s e c t s ] ) ) ( O c c u r r e n c e ( C A t , [ 1 , ) S _ R e l a t i o n ( C W , C A t , [ c o n t a i n s ] ) )
F S V ( C S b ) (Shopping Variety) F S E O c c u r r e n c e ( C S b , [ 5 , ) )
F A T ( C S b ) (Sh. Attractiveness) F S E O c c u r r e n c e ( C A t , [ 1 , ) )
F S D ( C S b , C S e ) (Sh. Orientation) F S E C o r r e l a t i o n ( C S b , C S e , [ 2 , ) )
F S G ( C S e ) (Special Goods) F S E O c c u r r e n c e ( C S e , N )
F C C ( C S b , C A t , C S u , C W ) (Compatible Components) F S E O c c u r r e n c e ( C S u , N ) ( C o r r e l a t i o n ( C S b C A t , C S u , [ 5 , ) ) P r o x i m i t y ( C W , C S u , [ 500 m , ) ) )
F S O ( C S , C A ) (Shopping Opportunities) F S E O c c u r r e n c e ( C A , N ) C o r r e l a t i o n ( C S , C A , [ 2 , ) )
F L ( C A s ) (Leisure) F S O O c c u r r e n c e ( C A s , N )
F E ( C A e ) (Entertainment) F S O O c c u r r e n c e ( C A e , N )
F L S ( C A l ) (Luxury Services) F S O O c c u r r e n c e ( C A l , N )
F R e s u p p l y ( C W , C H ) F S E O c c u r r e n c e ( C H , N ) P r o x i m i t y ( C W , C H , [ 0 , 1000 m ] )
F A D ( C W , C P ) (Access to Drivers) F W O c c u r r e n c e ( C P , [ 1 , ] ) ( S _ R e l a t i o n ( C W , C P , [ intersects ] ) ) P r o x i m i t y ( C W , C P , [ 0 , 200 m ] )
F A N ( C W , C B ) (Access to Non-drivers) F W O c c u r r e n c e ( C B , [ 1 , ] ) ( S _ R e l a t i o n ( C W , C B , [ intersects ] ) ) P r o x i m i t y ( C W , C B , [ 0 , 200 m ] )
F W S ( C H , C W ) (Walking Safety) F W O c c u r r e n c e ( C H , N ) S _ R e l a t i o n ( C W , C H , [ disjoint ] ) )
F W O ( C S , C A ) (Well-Organized) F S E O c c u r r e n c e ( C A , N ) S _ C o n f i g u r a t i o n ( C S , C A , [ c l u s t e r e d ] )
F V P ( C A v , C W ) (Visually Pleasing) F W O c c u r r e n c e ( C A v , N ) ( S _ R e l a t i o n ( C W , C H , [ intersects ] ) P r o x i m i t y ( C W , C A v , [ 0 , 200 m ] ) )
Scoring Function
F S E F W ( F S D + F S O + F S A + F S G + F L + F E + F L S + F A D + F A N + F R + F W S + F V P + F W O ) e r r o r

References

  1. Hartshorne, R. Perspective on the Nature of Geography; Rand McNally: Chicago, IL, USA, 1959. [Google Scholar]
  2. Tuan, Y.F. Space and Place: Humanistic Perspective. In Philosophy in Geography; Springer: Dordrecht, The Netherlands, 1979; pp. 387–427. [Google Scholar]
  3. Goodchild, M.F. Geographical information science. Int. J. Geogr. Inf. Syst. 1992, 6, 31–45. [Google Scholar] [CrossRef]
  4. Brown, L.A.; Holmes, J. The delimitation of functional regions, nodal regions, and hierarchies by functional distance approaches. J. Reg. Sci. 1971, 11, 57–72. [Google Scholar] [CrossRef]
  5. OECD. Redefining “Urban”: A New Way to Measure Metropolitan Areas; OECD Publishing: Paris, France, 2012. [Google Scholar] [CrossRef]
  6. Hill, L.L. Core elements of digital gazetteers: Placenames, categories, and footprints. In Proceedings of the International Conference on Theory and Practice of Digital Libraries, Lisbon, Portugal, 18–20 September 2000; Springer: Berlin, Germany, 2000; pp. 280–290. [Google Scholar]
  7. Purves, R.S.; Clough, P.; Jones, C.B.; Arampatzis, A.; Bucher, B.; Finch, D.; Fu, G.; Joho, H.; Syed, A.K.; Vaid, S.; Yang, B. The design and implementation of SPIRIT: A spatially aware search engine for information retrieval on the Internet. Int. J. Geogr. Inf. Sci. 2007, 21, 717–745. [Google Scholar] [CrossRef]
  8. Papadakis, E.; Blaschke, T. Place-based GIS: Functional Space. In Proceedings of the 4th AGILE PhD School, Leeds, UK, 30 October–2 November 2017; Comber, L., Malleson, N., Eds.; CEUR: Aachen, Germany, 2017; Volume 2208. [Google Scholar]
  9. Boegl, K.; Adlassnig, K.P.; Hayashi, Y.; Rothenfluh, T.E.; Leitich, H. Knowledge acquisition in the fuzzy knowledge representation framework of a medical consultation system. Artif. Intell. Med. 2004, 30, 1–26. [Google Scholar] [CrossRef]
  10. Yuan, J.; Zheng, Y.; Xie, X. Discovering regions of different functions in a city using human mobility and POIs. In Proceedings of the 18th ACM SIGKDD International Conference on Knowledge Discovery and Data Mining, Beijing, China, 12–16 August 2012; ACM: New York, NY, USA, 2012; pp. 186–194. [Google Scholar]
  11. Adams, B.; Janowicz, K. Thematic signatures for cleansing and enriching place-related linked data. Int. J. Geogr. Inf. Sci. 2015, 29, 556–579. [Google Scholar] [CrossRef]
  12. Gao, S.; Janowicz, K.; Couclelis, H. Extracting urban functional regions from points of interest and human activities on location-based social networks. Trans. GIS 2017, 21, 446–467. [Google Scholar] [CrossRef]
  13. Hobel, H.; Fogliaroni, P.; Frank, A.U. Deriving the Geographic Footprint of Cognitive Regions. In Selected papers of the 19th AGILE Conference on Geographic Information Science, Helsinki, Finland, 14–17 June 2016; Sarjakoski, T., Santos, M.Y., Sarjakoski, L.T., Eds.; Lecture Notes in Geoinformation and Cartography; Springer International Publishing: Cham, Switzerland, 2016; pp. 67–84. [Google Scholar]
  14. Doshi-Velez, F.; Kim, B. Towards A Rigorous Science of Interpretable Machine Learning. arXiv 2017, arXiv:1702.08608. [Google Scholar]
  15. Papadakis, E.; Resch, B.; Blaschke, T. Composition of Place: Towards a Compositional View of Functional Space. Cartogr. Geogr. Inf. Sci. 2019. [Google Scholar] [CrossRef]
  16. Janowicz, K.; Keßler, C. The role of ontology in improving gazetteer interaction. Int. J. Geogr. Inf. Sci. 2008, 22, 1129–1157. [Google Scholar] [CrossRef]
  17. Scheider, S.; Purves, R. Semantic Place Localization from Narratives. In Proceedings of the First ACM SIGSPATIAL International Workshop on Computational Models of Place, Orlando, FL, USA, 5–8 November 2013; Scheider, S., Adams, B., Janowicz, K., Vasardani, M., Winter, S., Eds.; ACM: New York, NY, USA, 2013; pp. 16–16. [Google Scholar] [CrossRef]
  18. MacEachren, A.M. Leveraging Big (Geo) Data with (Geo) Visual Analytics: Place as the Next Frontier. In Spatial Data Handling in Big Data Era: Select Papers from the 17th IGU Spatial Data Handling Symposium 2016; Zhou, C., Su, F., Harvey, F., Xu, J., Eds.; Springer Singapore: Singapore, 2017; pp. 139–155. [Google Scholar] [CrossRef]
  19. Scheider, S.; Janowicz, K. Place reference systems. Appl. Ontol. 2014, 9, 97–127. [Google Scholar] [CrossRef]
  20. Papadakis, E.; Resch, B.; Blaschke, T. A Function-based model of Place. In International Conference on GIScience Short Paper Proceedings; California Digital Library: Oakland, CA, USA, 2016. [Google Scholar]
  21. Hobel, H.; Abdalla, A.; Fogliaroni, P.; Frank, A.U. A Semantic Region Growing Algorithm: Extraction of Urban Settings. In Proceedings of the 18th AGILE Conference on Geographic Information Science, Lisbon, Portugal, 9–12 June 2015; Bação, F., Santos, M.Y., Painho, M., Eds.; Lecture Notes in Geoinformation and Cartography. Springer International Publishing: Cham, Switzerland, 2015; pp. 19–33. [Google Scholar]
  22. Liu, X.; Andris, C.; Rahimi, S. Place niche and its regional variability: Measuring spatial context patterns for points of interest with representation learning. Comput. Environ. Urban Syst. 2019, 75, 146–160. [Google Scholar] [CrossRef]
  23. Tao, H.; Wang, K.; Zhuo, L.; Li, X. Re-examining urban region and inferring regional function based on spatial-temporal interaction. Int. J. Digital Earth 2019, 12, 293–310. [Google Scholar] [CrossRef]
  24. Su, S.; Lei, C.; Li, A.; Pi, J.; Cai, Z. Coverage inequality and quality of volunteered geographic features in Chinese cities: Analyzing the associated local characteristics using geographically weighted regression. Appl. Geogr. 2017, 78, 78–93. [Google Scholar] [CrossRef]
  25. Noulas, A.; Scellato, S.; Mascolo, C.; Pontil, M. Exploiting Semantic Annotations for Clustering Geographic Areas and Users in Location-based Social Networks. In Proceedings of the 2011 Workshop on the Social Mobile Web, Barcelona, Spain, 21 July 2011; AAAI: Menlo Park, CA, USA, 2011; Volume WS-11-02. [Google Scholar]
  26. Zhou, X.; Zhang, L. Crowdsourcing functions of the living city from Twitter and Foursquare data. Cartogr. Geogr. Inf. Sci. 2016, 43, 393–404. [Google Scholar] [CrossRef]
  27. Zhi, Y.; Li, H.; Wang, D.; Deng, M.; Wang, S.; Gao, J.; Duan, Z.; Liu, Y. Latent spatio-temporal activity structures: A new approach to inferring intra-urban functional regions via social media check-in data. Geo-Spat. Inf. Sci. 2016, 19, 94–105. [Google Scholar] [CrossRef]
  28. MacQueen, J. Some Methods for Classification and Analysis of Multivariate Observations. In Proceedings of the 5th Berkeley Symposium on Mathematical Statistics and Probability; Le Cam, L.M., Neyman, J., Eds.; University of California Press: Berkeley, CA, USA, 1967; Volume 1, pp. 281–297. [Google Scholar]
  29. Assunção, R.M.; Neves, M.C.; Câmara, G.; Freitas, C.D.C. Efficient regionalization techniques for socio-economic geographical units using minimum spanning trees. Int. J. Geogr. Inform.Sci. 2006, 20, 797–811. [Google Scholar] [CrossRef]
  30. Liu, Y.; Liu, X.; Gao, S.; Gong, L.; Kang, C.; Zhi, Y.; Chi, G.; Shi, L. Social Sensing: A New Approach to Understanding Our Socioeconomic Environments. Ann. Assoc. Am. Geogr. 2015, 105, 512–530. [Google Scholar] [CrossRef]
  31. Cohn, A.; Gotts, N. The ’Egg-Yolk’ Representation of Regions with Indeterminate Boundaries. In Geographic Objects with Indeterminate Boundaries; Burrough, P.A., Frank, A.U., Eds.; Taylor & Francis: London, UK, 1996; pp. 171–187. [Google Scholar]
  32. Mai, G.; Janowicz, K.; Hu, Y.; Gao, S.; Zhu, R.; Yan, B.; McKenzie, G.; Uppal, A.; Regalia, B. Collections of Points of Interest: How to Name Them and Why it Matters. In Proceedings of the Spatial Big Data and Machine Learning in GIScience Workshop at GIScience 2018, Melbourne, Australia, 28 August 2018; Raubal, M., Wang, S., Guo, M., Jonietz, D., Kiefer, P., Eds.; ETH: Zurich, Switzerland, 2018; pp. 29–33. [Google Scholar]
  33. Liu, Y.; Yuan, Y.; Gao, S. Modeling the Vagueness of Areal Geographic Objects: A Categorization System. ISPRS Int. J. Geo-Inf. 2019, 8, 306. [Google Scholar] [CrossRef]
  34. Papadakis, E.; Baryannis, G.; Petutschnig, A.; Blaschke, T. Function-Based Search of Place Using Theoretical, Empirical and Probabilistic Patterns. ISPRS Int. Journal Geo-Inf. 2019, 8, 92. [Google Scholar] [CrossRef]
Figure 1. Overview of the proposed framework fusing knowledge-based and data-driven approaches. Latent Dirichlet allocation (LDA).
Ijgi 08 00385 g001
Figure 2. Shopping plazas in Los Angeles using LDA- and pattern-based approaches separately.
Ijgi 08 00385 g002
Figure 3. Results without using any of the proposed fusion methods.
Ijgi 08 00385 g003
Figure 4. Shopping plazas with significant agreement between the two approaches.
Ijgi 08 00385 g004
Figure 5. Regions where there is significant disagreement between approaches.
Ijgi 08 00385 g005
Figure 6. Shopping plazas in Los Angeles - results of each approach adjusted using the other.
Ijgi 08 00385 g006
Figure 7. Final results combining data-to-knowledge and knowledge-to-data fusion.
Ijgi 08 00385 g007
Figure 8. Results combining data-to-knowledge and knowledge-to-data fusion in the Denver metropolitan area.
Ijgi 08 00385 g008

