Article

Fused Transparent Visualization of Point Cloud Data and Background Photographic Image for Tangible Cultural Heritage Assets

College of Information Science and Engineering, Ritsumeikan University, Kusatsu 5258577, Japan
*
Author to whom correspondence should be addressed.
ISPRS Int. J. Geo-Inf. 2019, 8(8), 343; https://doi.org/10.3390/ijgi8080343
Submission received: 30 June 2019 / Revised: 19 July 2019 / Accepted: 28 July 2019 / Published: 31 July 2019
(This article belongs to the Special Issue Historical GIS and Digital Humanities)

Abstract

:
Digital archiving of three-dimensional cultural heritage assets has increased the demand for visualization of large-scale point clouds of cultural heritage assets acquired by laser scanning. We proposed a fused transparent visualization method that visualizes a point cloud of a cultural heritage asset in an environment using a photographic image as the background. We also proposed lightness adjustment and color enhancement methods to deal with the reduced visibility caused by the fused visualization. We applied the proposed method to a laser-scanned point cloud of a high-valued cultural festival float with complex inner and outer structures. Experimental results demonstrate that the proposed method enables high-quality transparent visualization of the cultural asset in its surrounding environment.

1. Introduction

Digital archiving, which involves measuring, recording, and preserving tangible and intangible cultural assets, utilizing digital information technology, has attracted increasing attention worldwide [1,2,3]. Targets of digital archiving have expanded from planar materials, such as documents, paintings, and photographs, to three-dimensional (3D) objects, such as sculptures, buildings, and archeological artifacts, as well as intangible cultural assets, such as dances, plays, and cultural events [4,5,6]. To make digital archives of 3D objects, particularly large-scale cultural assets, simply capturing an image with a camera is insufficient. Over the past decade, with the development of laser scanning, photographic measurement, and unmanned aerial vehicles, archiving of large-scale 3D objects became possible [7]. A vehicle-based mobile mapping system that integrates a camera, laser scanner, inertial measurement unit, and global positioning system provides an efficient way to generate a 3D point cloud [8]. Precise measurement of large-scale 3D objects has advanced digital archiving of large-scale cultural heritage assets [9,10,11,12,13,14].
Laser-scanned point clouds of large-scale cultural heritage assets often contain complex structures and a large number of points. For example, the numbers of 3D points acquired in our laser-scanning projects were as follows: 3 × 10⁸ points for Khentkawes’ Tomb (Egypt), 3 × 10⁸ points for Machu Picchu (Peru), and 9 × 10⁸ points for Hagia Sophia (Turkey). The most straightforward visualization strategy for a point cloud is point-based rendering [15,16]. Point-based rendering techniques do not require a pre-processing to transform the raw point cloud data into a polygon mesh or a voxel-based presentation. Thus, the precision and density of the original data can be preserved. Discher et al. proposed a real-time rendering approach for 3D point clouds that combines point-based and image-based rendering techniques [17,18,19]. Their studies focused on the applications to virtual reality or web-based environments. However, transparent visualization is required to understand the complex shape and internal structures of valuable cultural heritage assets. Seemann et al. proposed a transparent visualization technique that combines traditional surface splatting with semi-transparent spheres for complex point clouds with different qualities [20]. Conventional point-based rendering suffers from the computational cost required by depth sorting, which makes it unsuitable for large-scale point clouds. In our previous research, we proposed a stochastic algorithm, i.e., Stochastic Point-Based Rendering (SPBR), for precise transparent visualization of large-scale complex point clouds [21]. SPBR achieves noise-robust, high-speed, transparent visualization without requiring depth sorting. We applied SPBR to transparent visualization of large-scale cultural heritage assets [22]. In these applications, we used single-color (black or white) backgrounds to avoid the effects of colors on the visualization results. However, in some cases, scale, position, and surrounding environment information are essential to present a cultural heritage asset. Visualization of cultural heritage assets, as well as their surrounding environments, is required. The simple idea is to scan the entire surroundings and visualize them with the target cultural asset. However, this is not practical because it requires a great deal of manual effort and time, as well as computational time for visualization. Tanaka et al. proposed a method that generates 3D point clouds of surrounding environments using panoramic images [23]. Discher et al. integrated context-providing geographic data, such as 2D maps and 3D terrain models, for visualization and exploration of 3D point clouds [19]. However, to the authors’ knowledge, no previous study has reported fused transparent visualization of a large-scale laser-scanned point cloud at interactive speed.
Therefore, we proposed a fused visualization method that transparently visualizes a point cloud of a cultural heritage asset in an environment using a photographic image as the background. We also proposed lightness adjustment and color enhancement methods to improve the visibility of the cultural heritage asset visualized by the proposed fused transparent visualization method.

2. Fused Transparent Visualization of Point Cloud Data and Background Photographic Image

In this section, we describe the proposed method for precise fused transparent visualization of large-scale complex point clouds acquired by laser scanning of cultural heritage objects. The proposed method is an extension of SPBR, which was developed in our previous research.

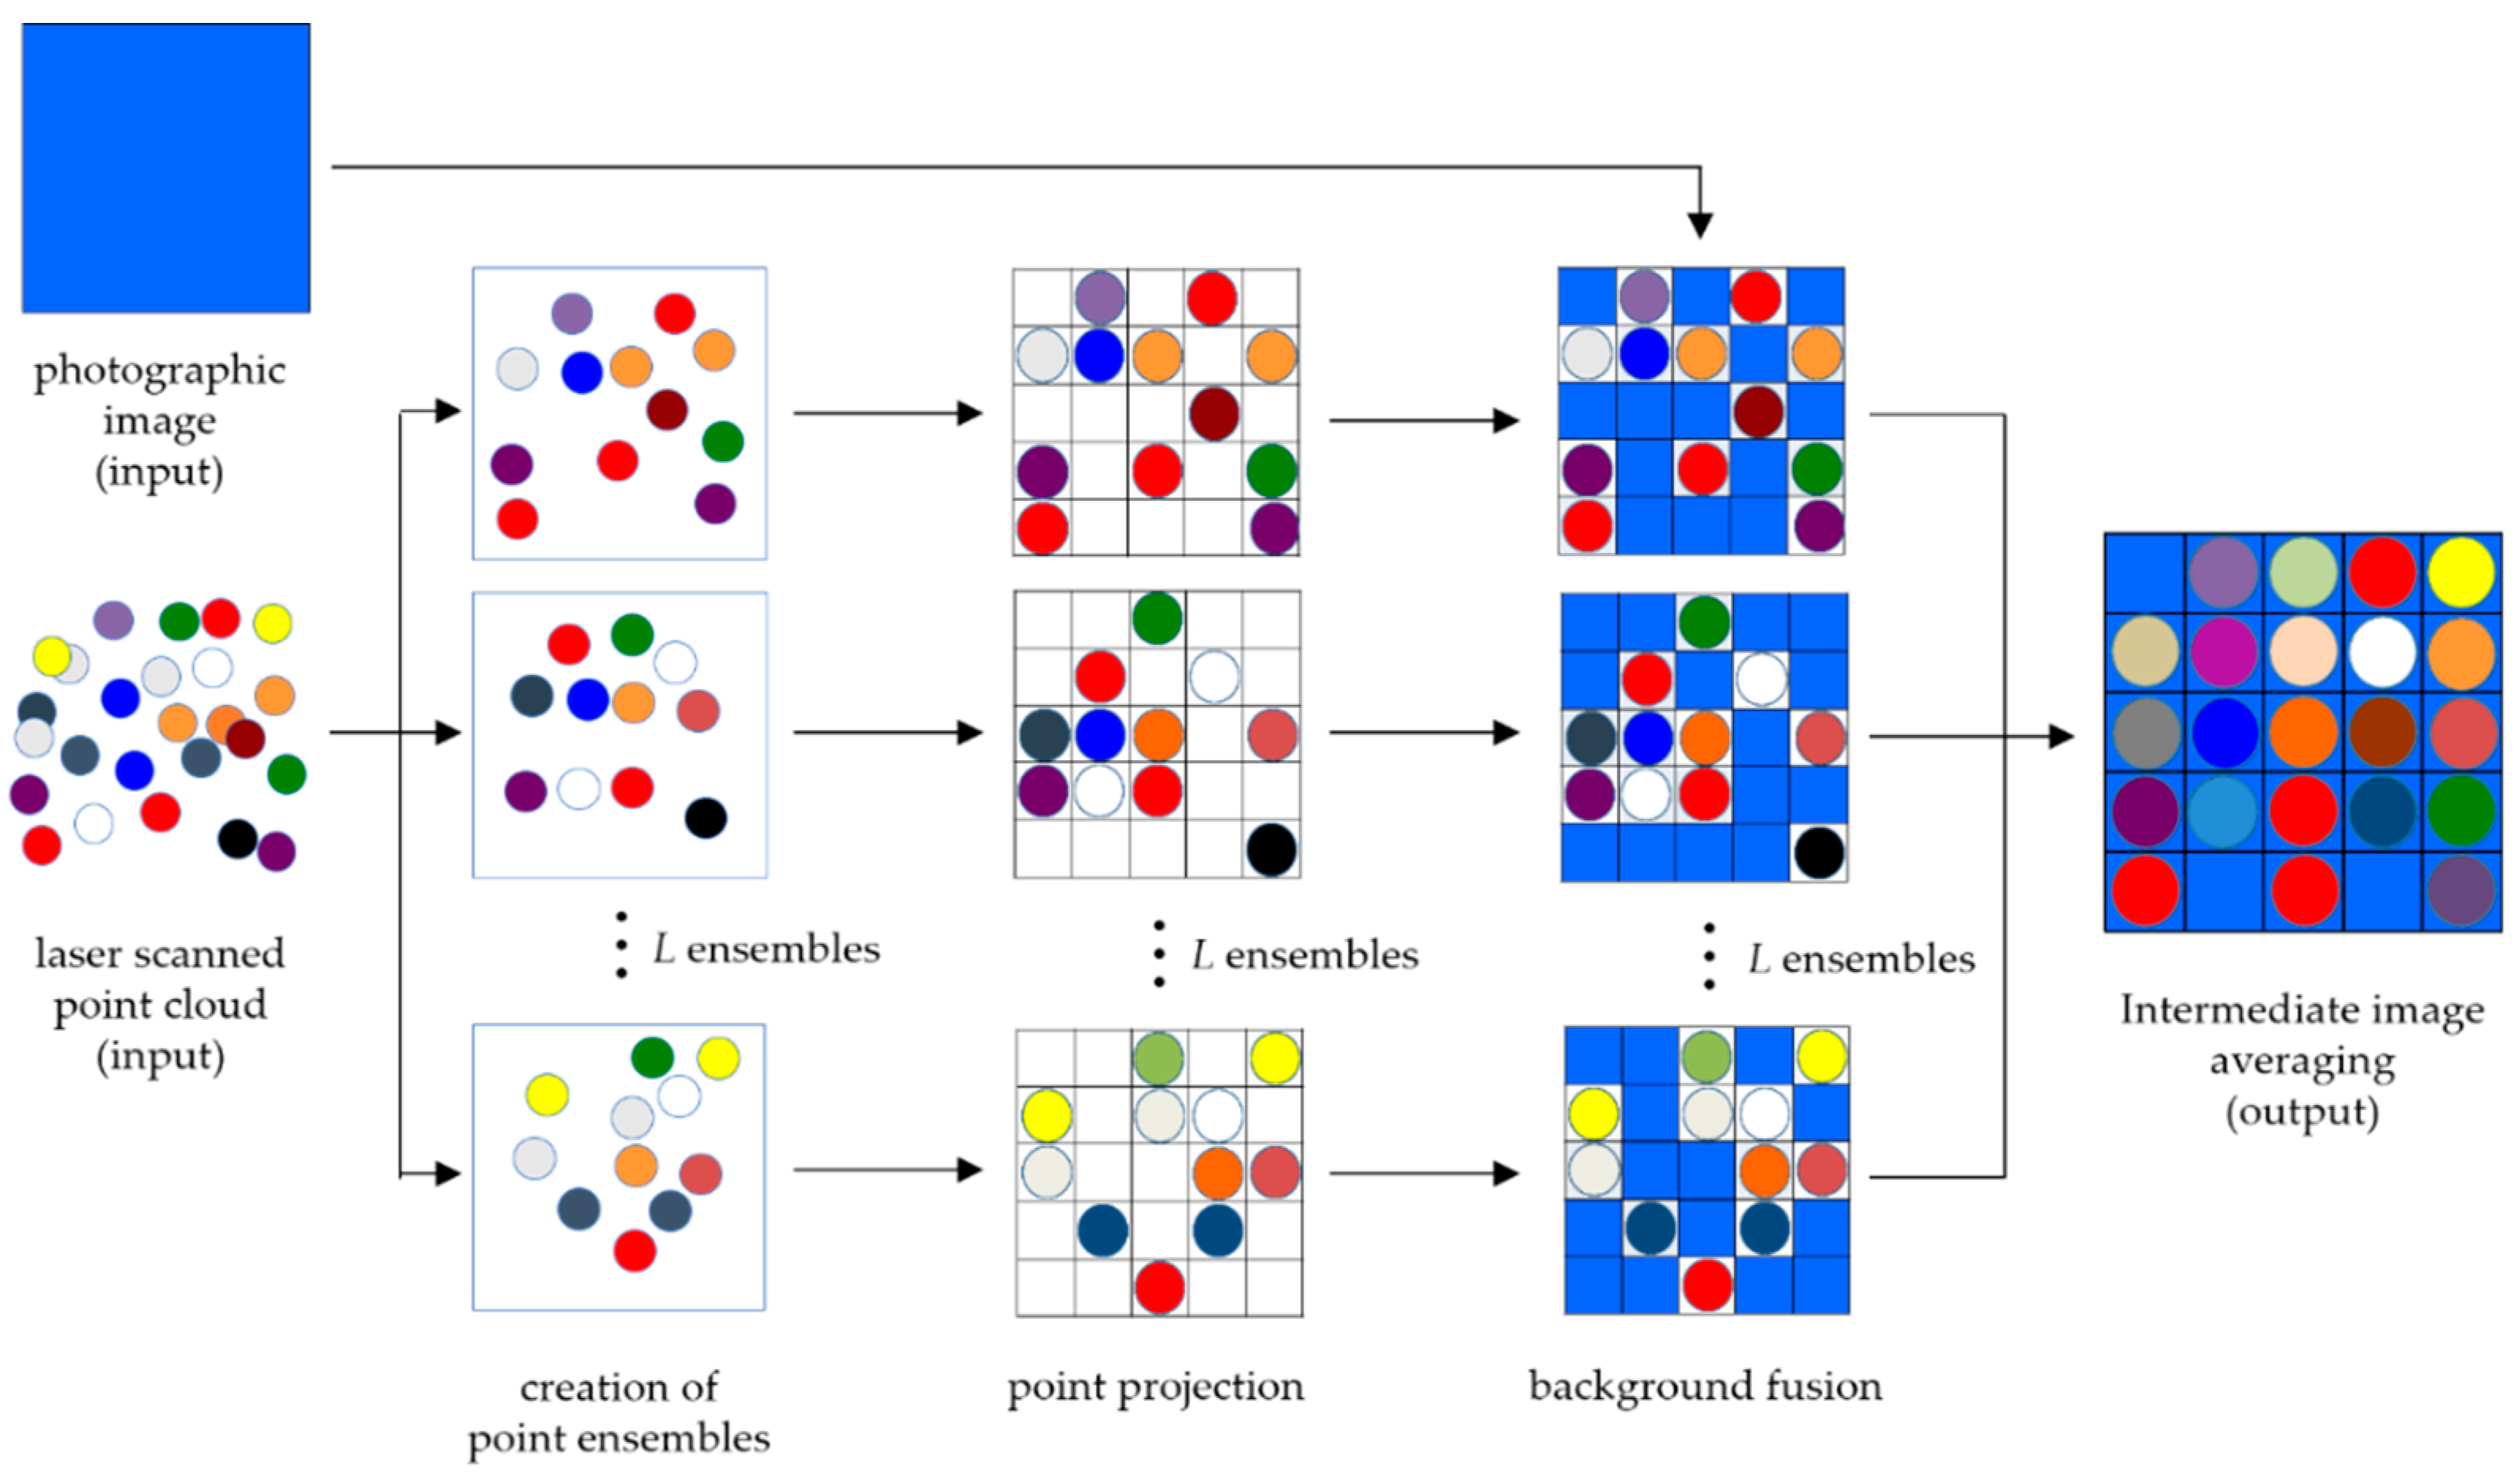
2.1. Fused Transparent Visualization Procedure

Similar to the conventional SPBR visualization procedure [21], the fused transparent visualization also consists of three steps.
STEP 1. Creation of point ensembles
We adjusted the number of points according to the desired opacity α and then randomly divided the points into multiple groups that we refer to as “point ensembles.” Each point ensemble is statistically independent and has the same point density. Hereafter, we refer to the number of point ensembles as the “ensemble number” and denote it by L.
STEP 2. Point projection and background fusion
For each point ensemble, we created an intermediate image by projecting the 3D points onto a 2D image plane. In this process, we considered point occlusion per pixel. In other words, if a pixel is projected by multiple points, its value is determined by the nearest point along the sight direction. If a pixel is projected by none of the points, its value is given by the background photographic image. This step differs from the conventional SPBR. Thus, each intermediate image is a fused result of the point ensemble and the background photographic image.
STEP 3. Intermediate image averaging
The output fused transparent image of the point cloud data and the photographic image was created by averaging the L intermediate images. Thus, an SPBR-based fused transparent visualization of the point cloud and background was achieved.
The difference between the proposed method and the conventional SPBR [21] is that rather than using a specific fixed color for the background in STEP 2, the proposed method used the pixel color of the selected photo as the background image. Therefore, the background of the transparently visualized target object is its surrounding scene captured in a photograph rather than a single-color. Scheme of the proposed fused transparent visualization is shown in Figure 1.

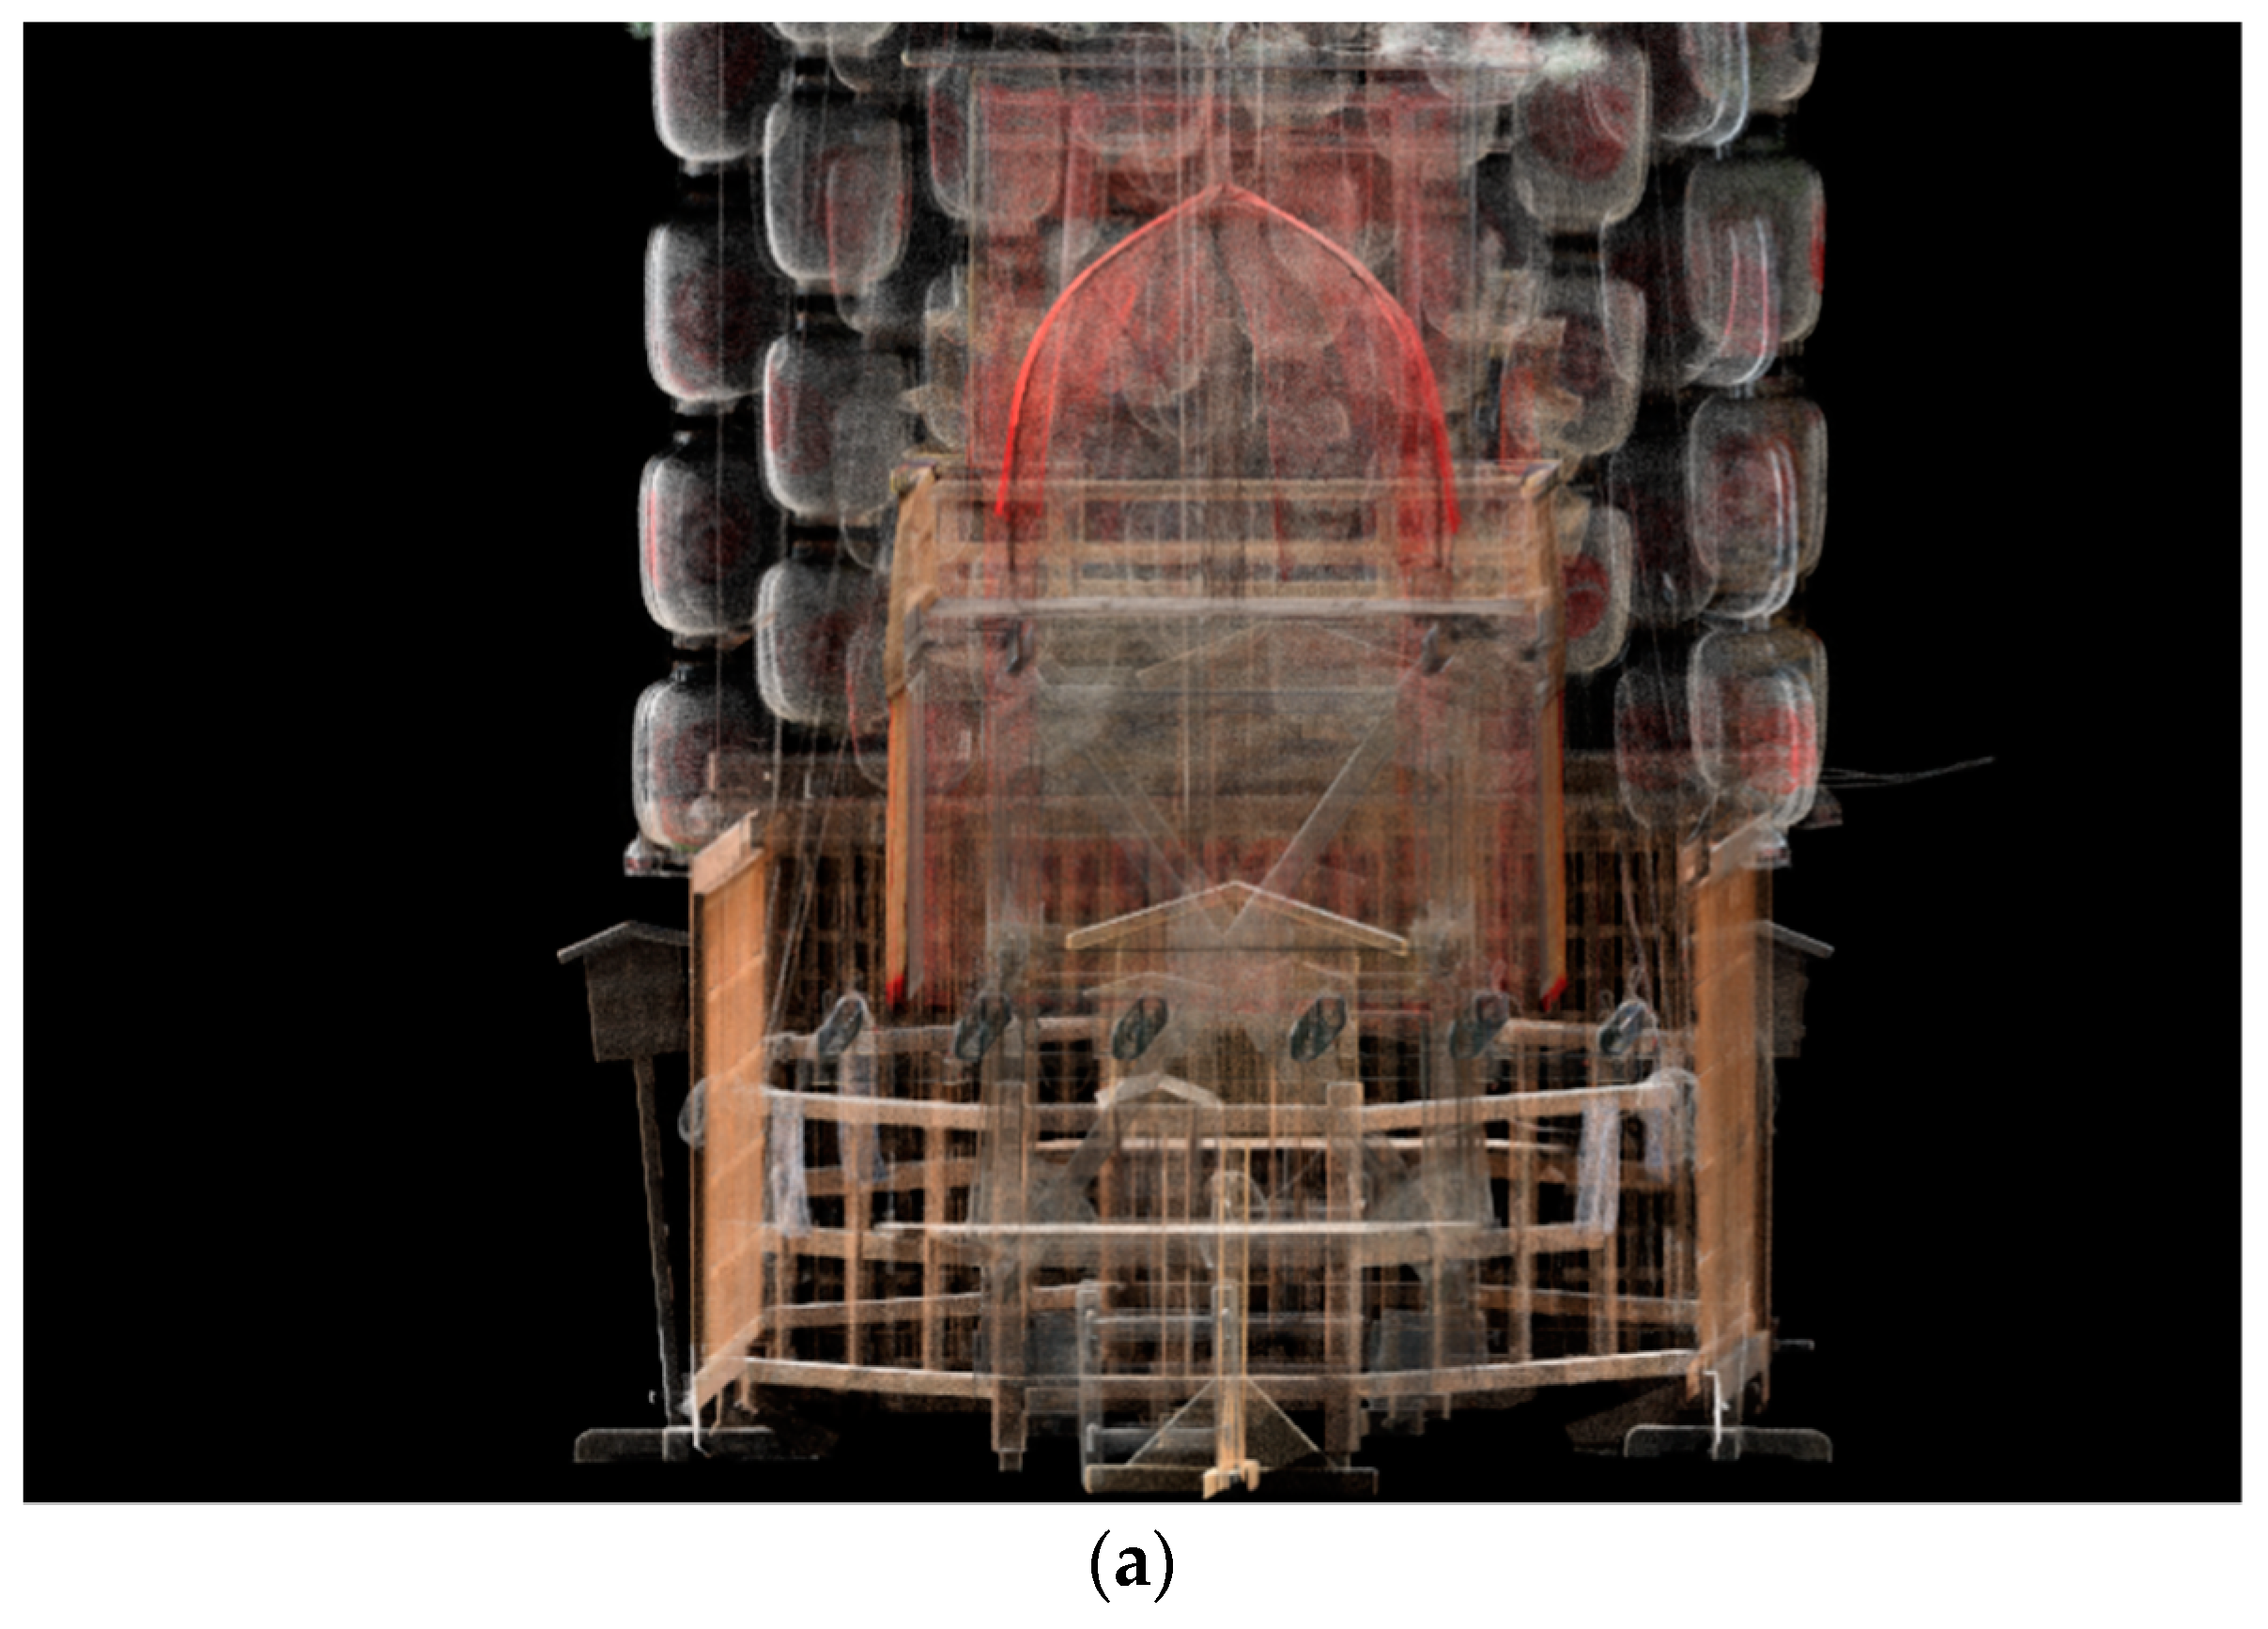
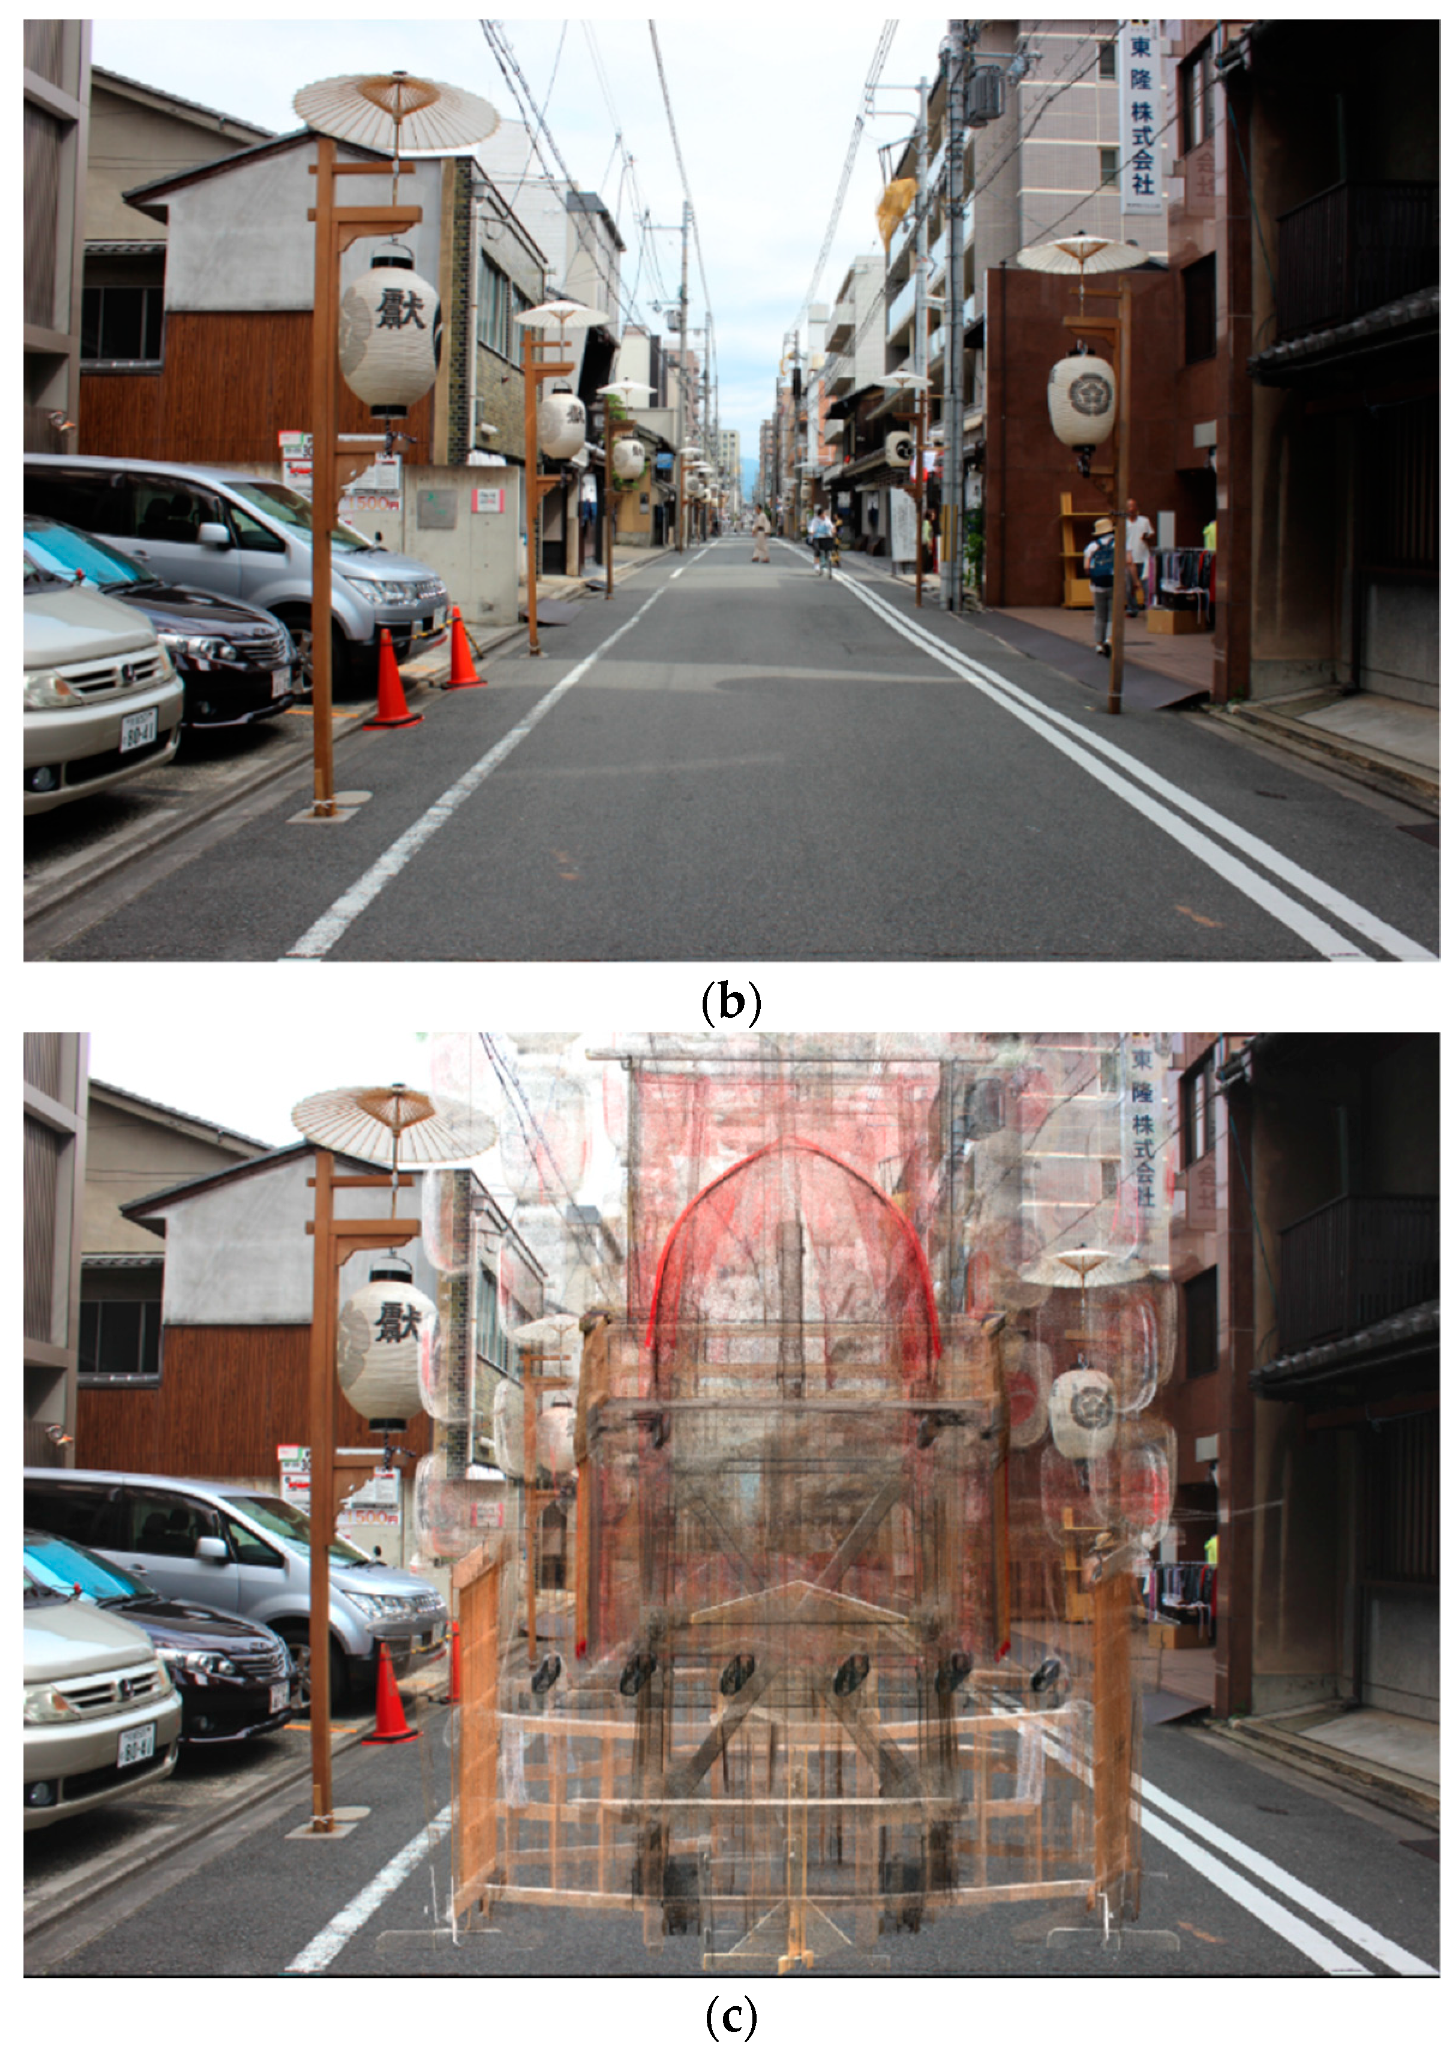
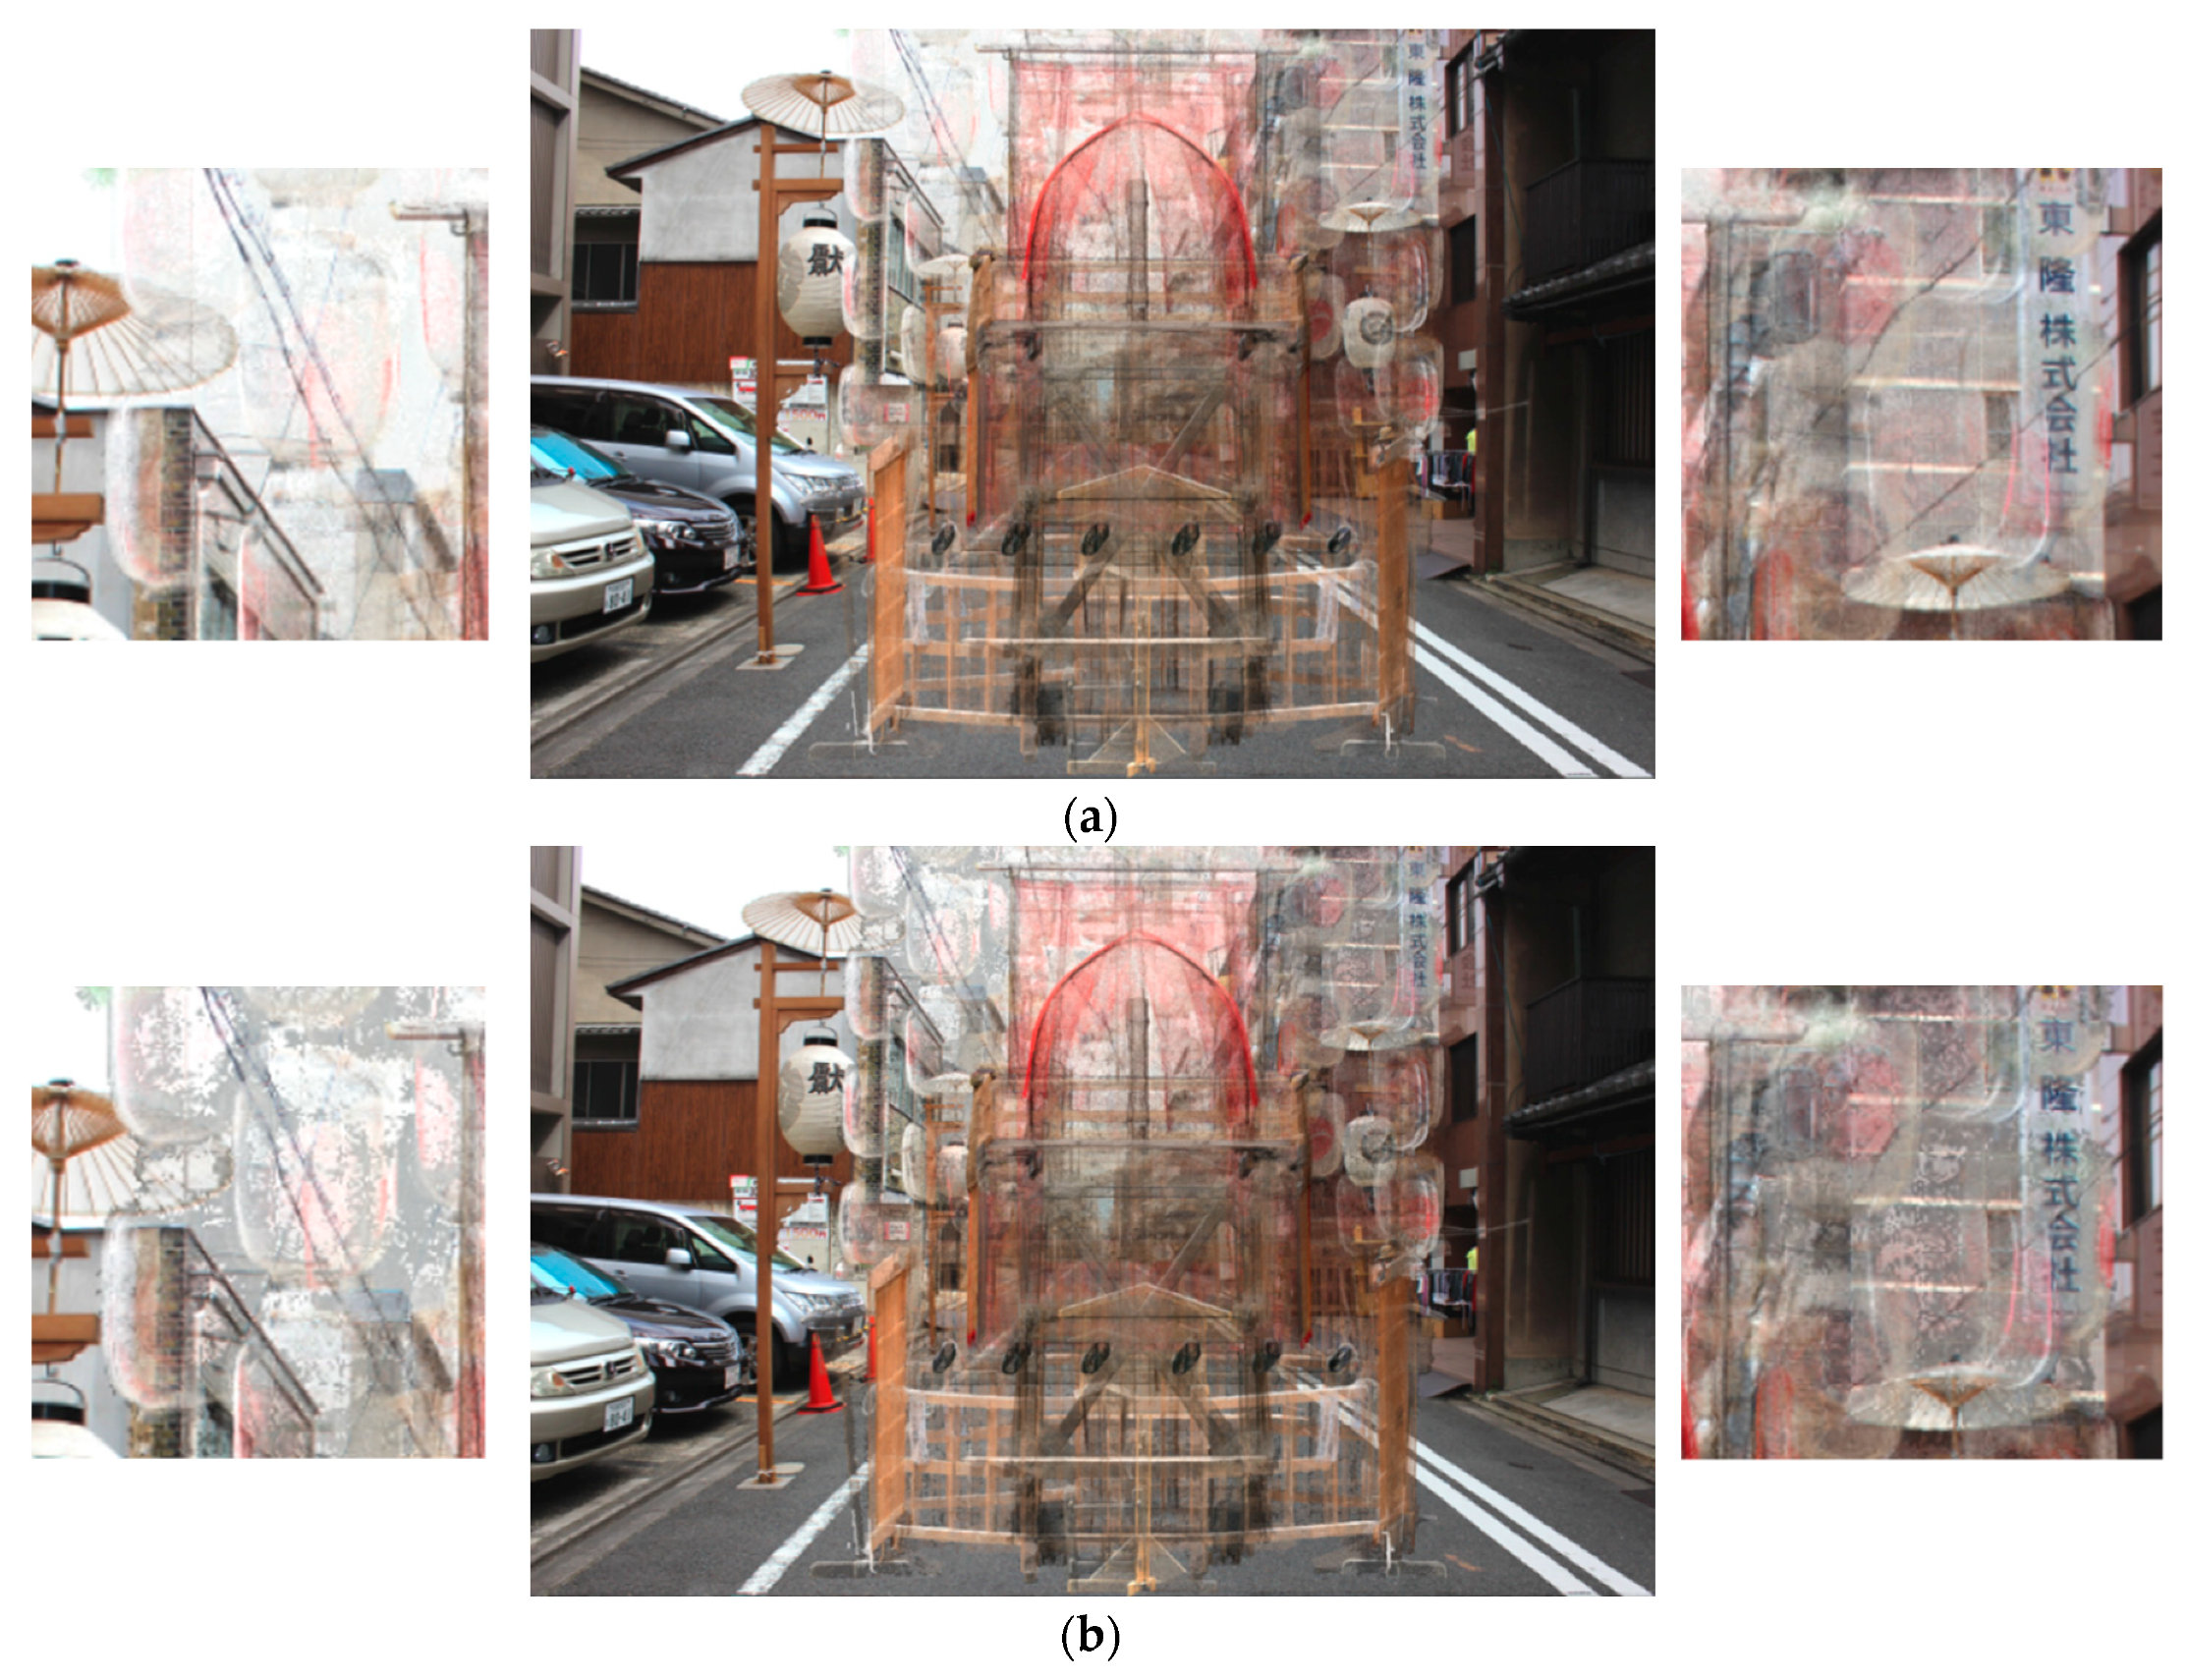
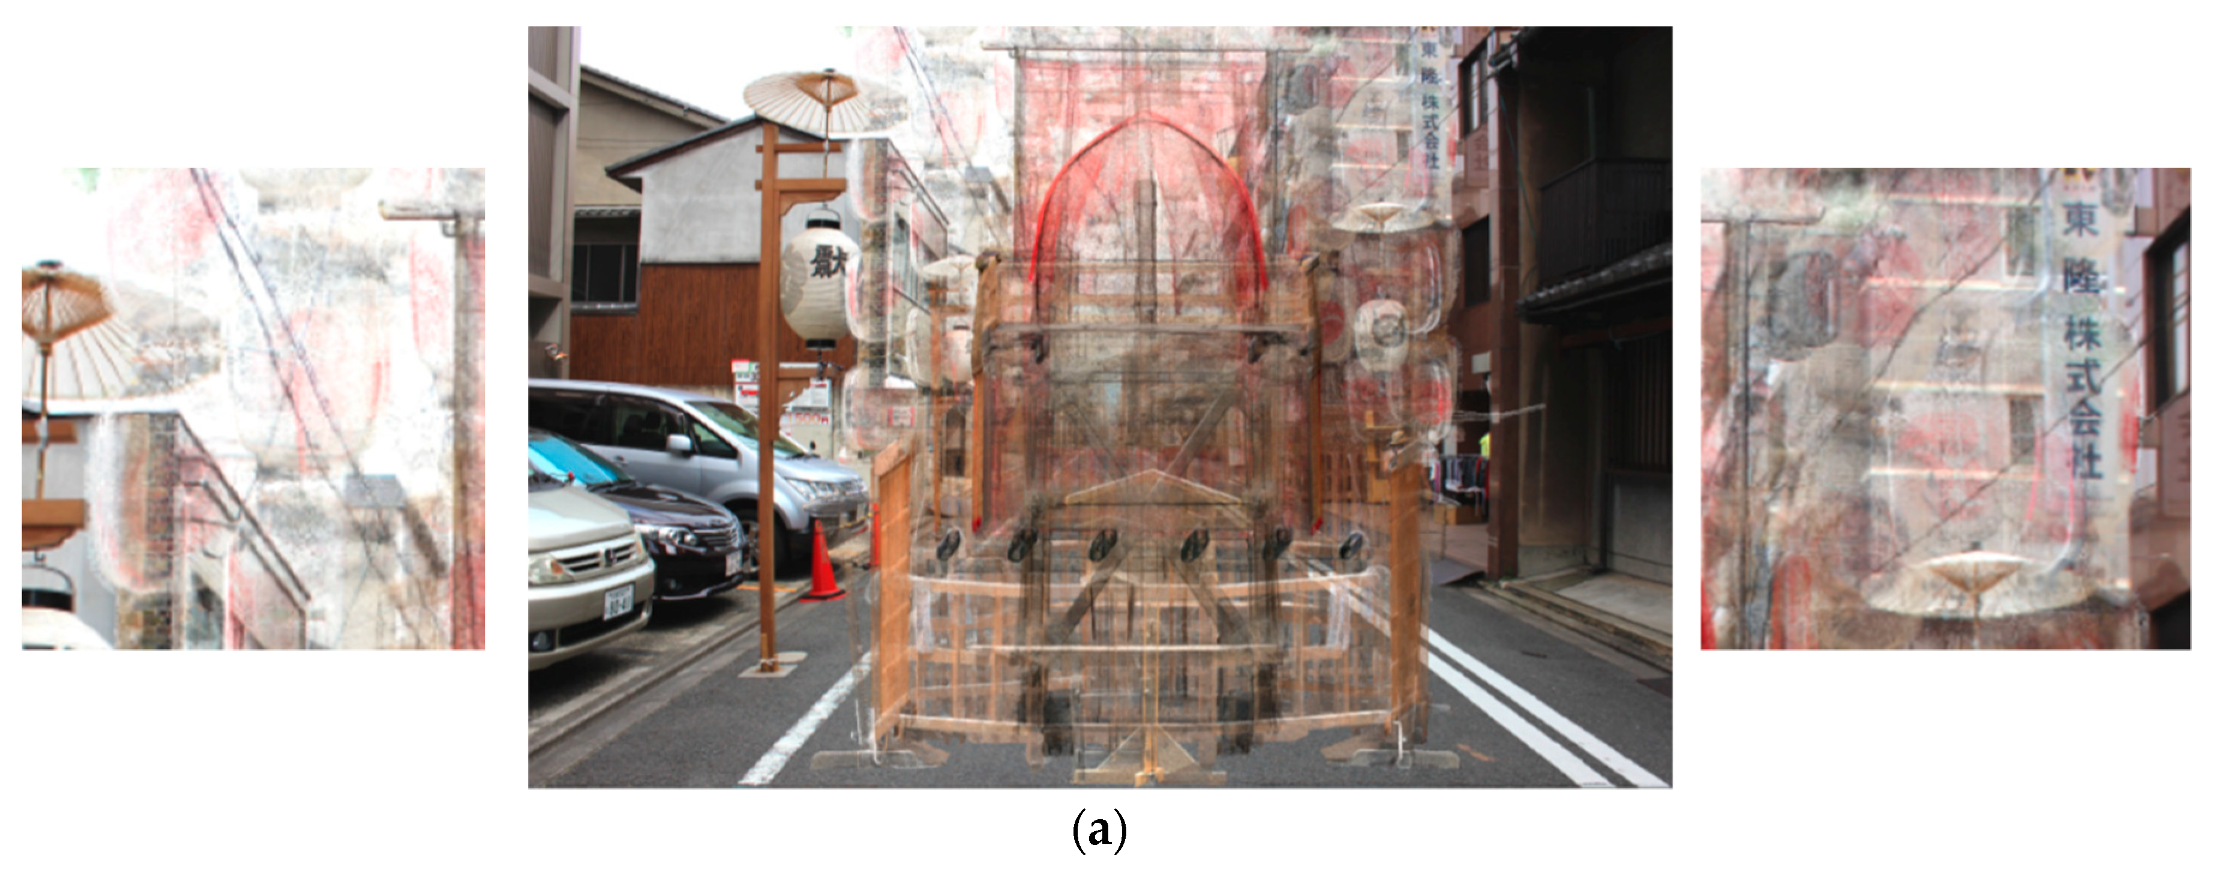
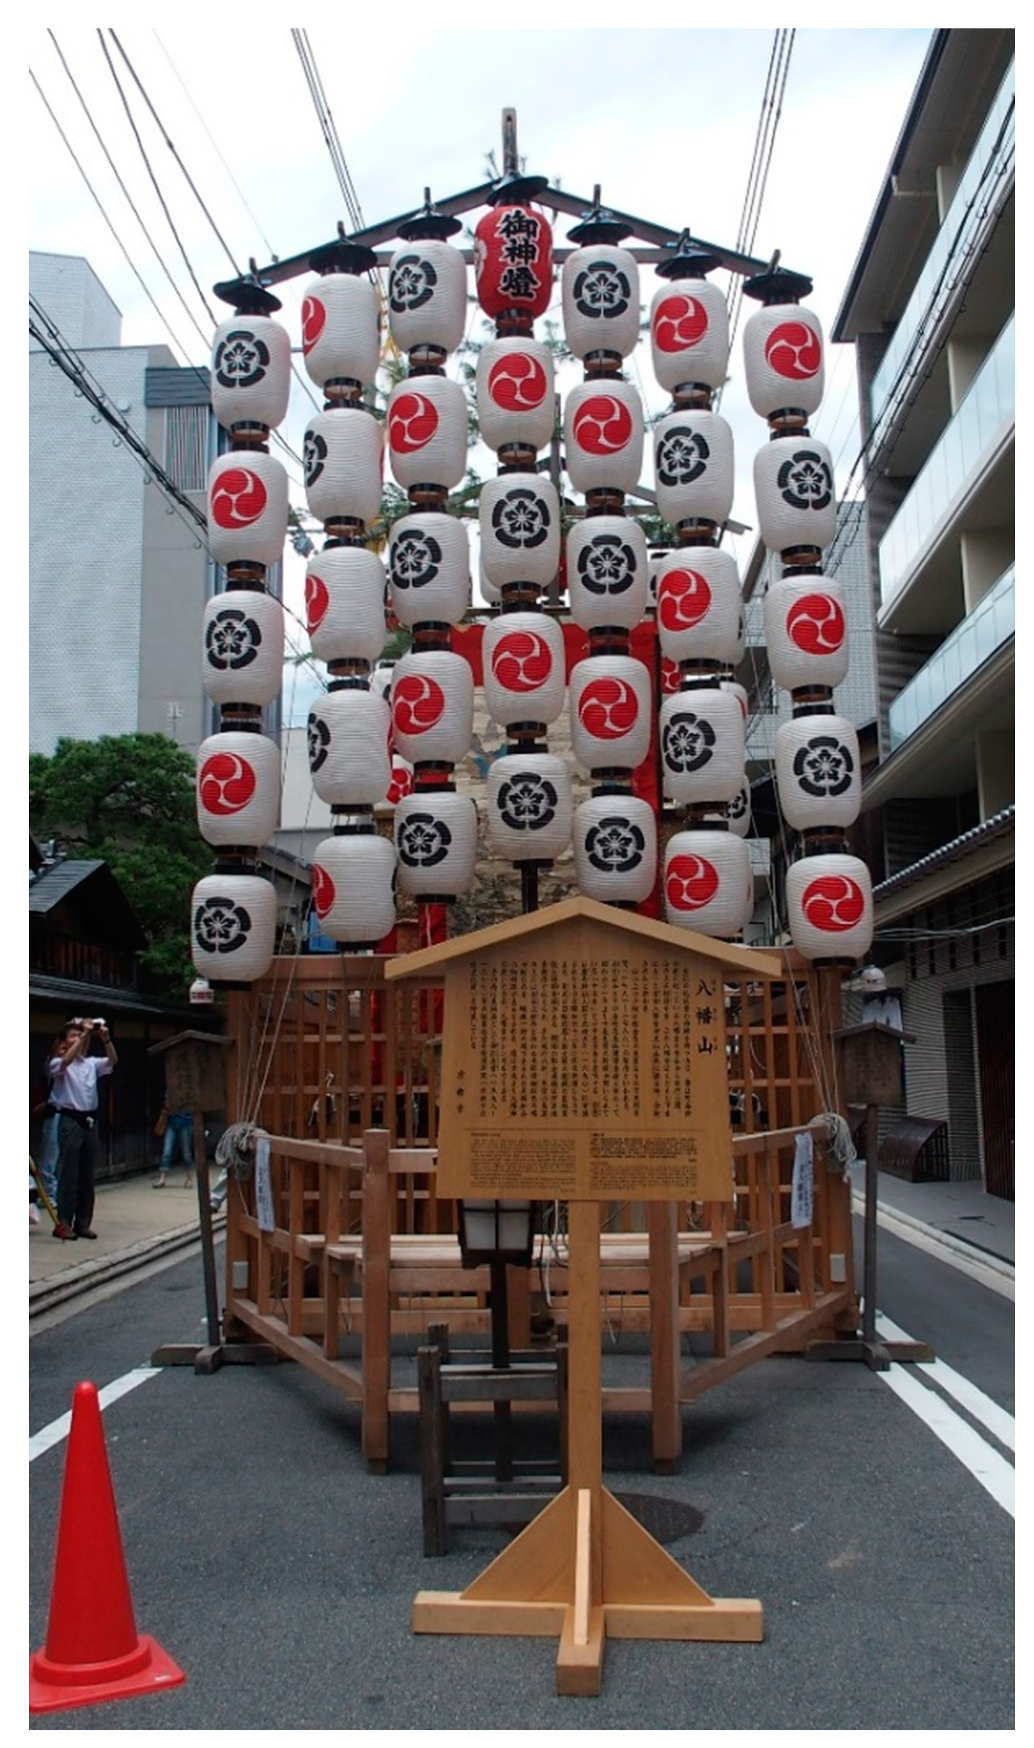
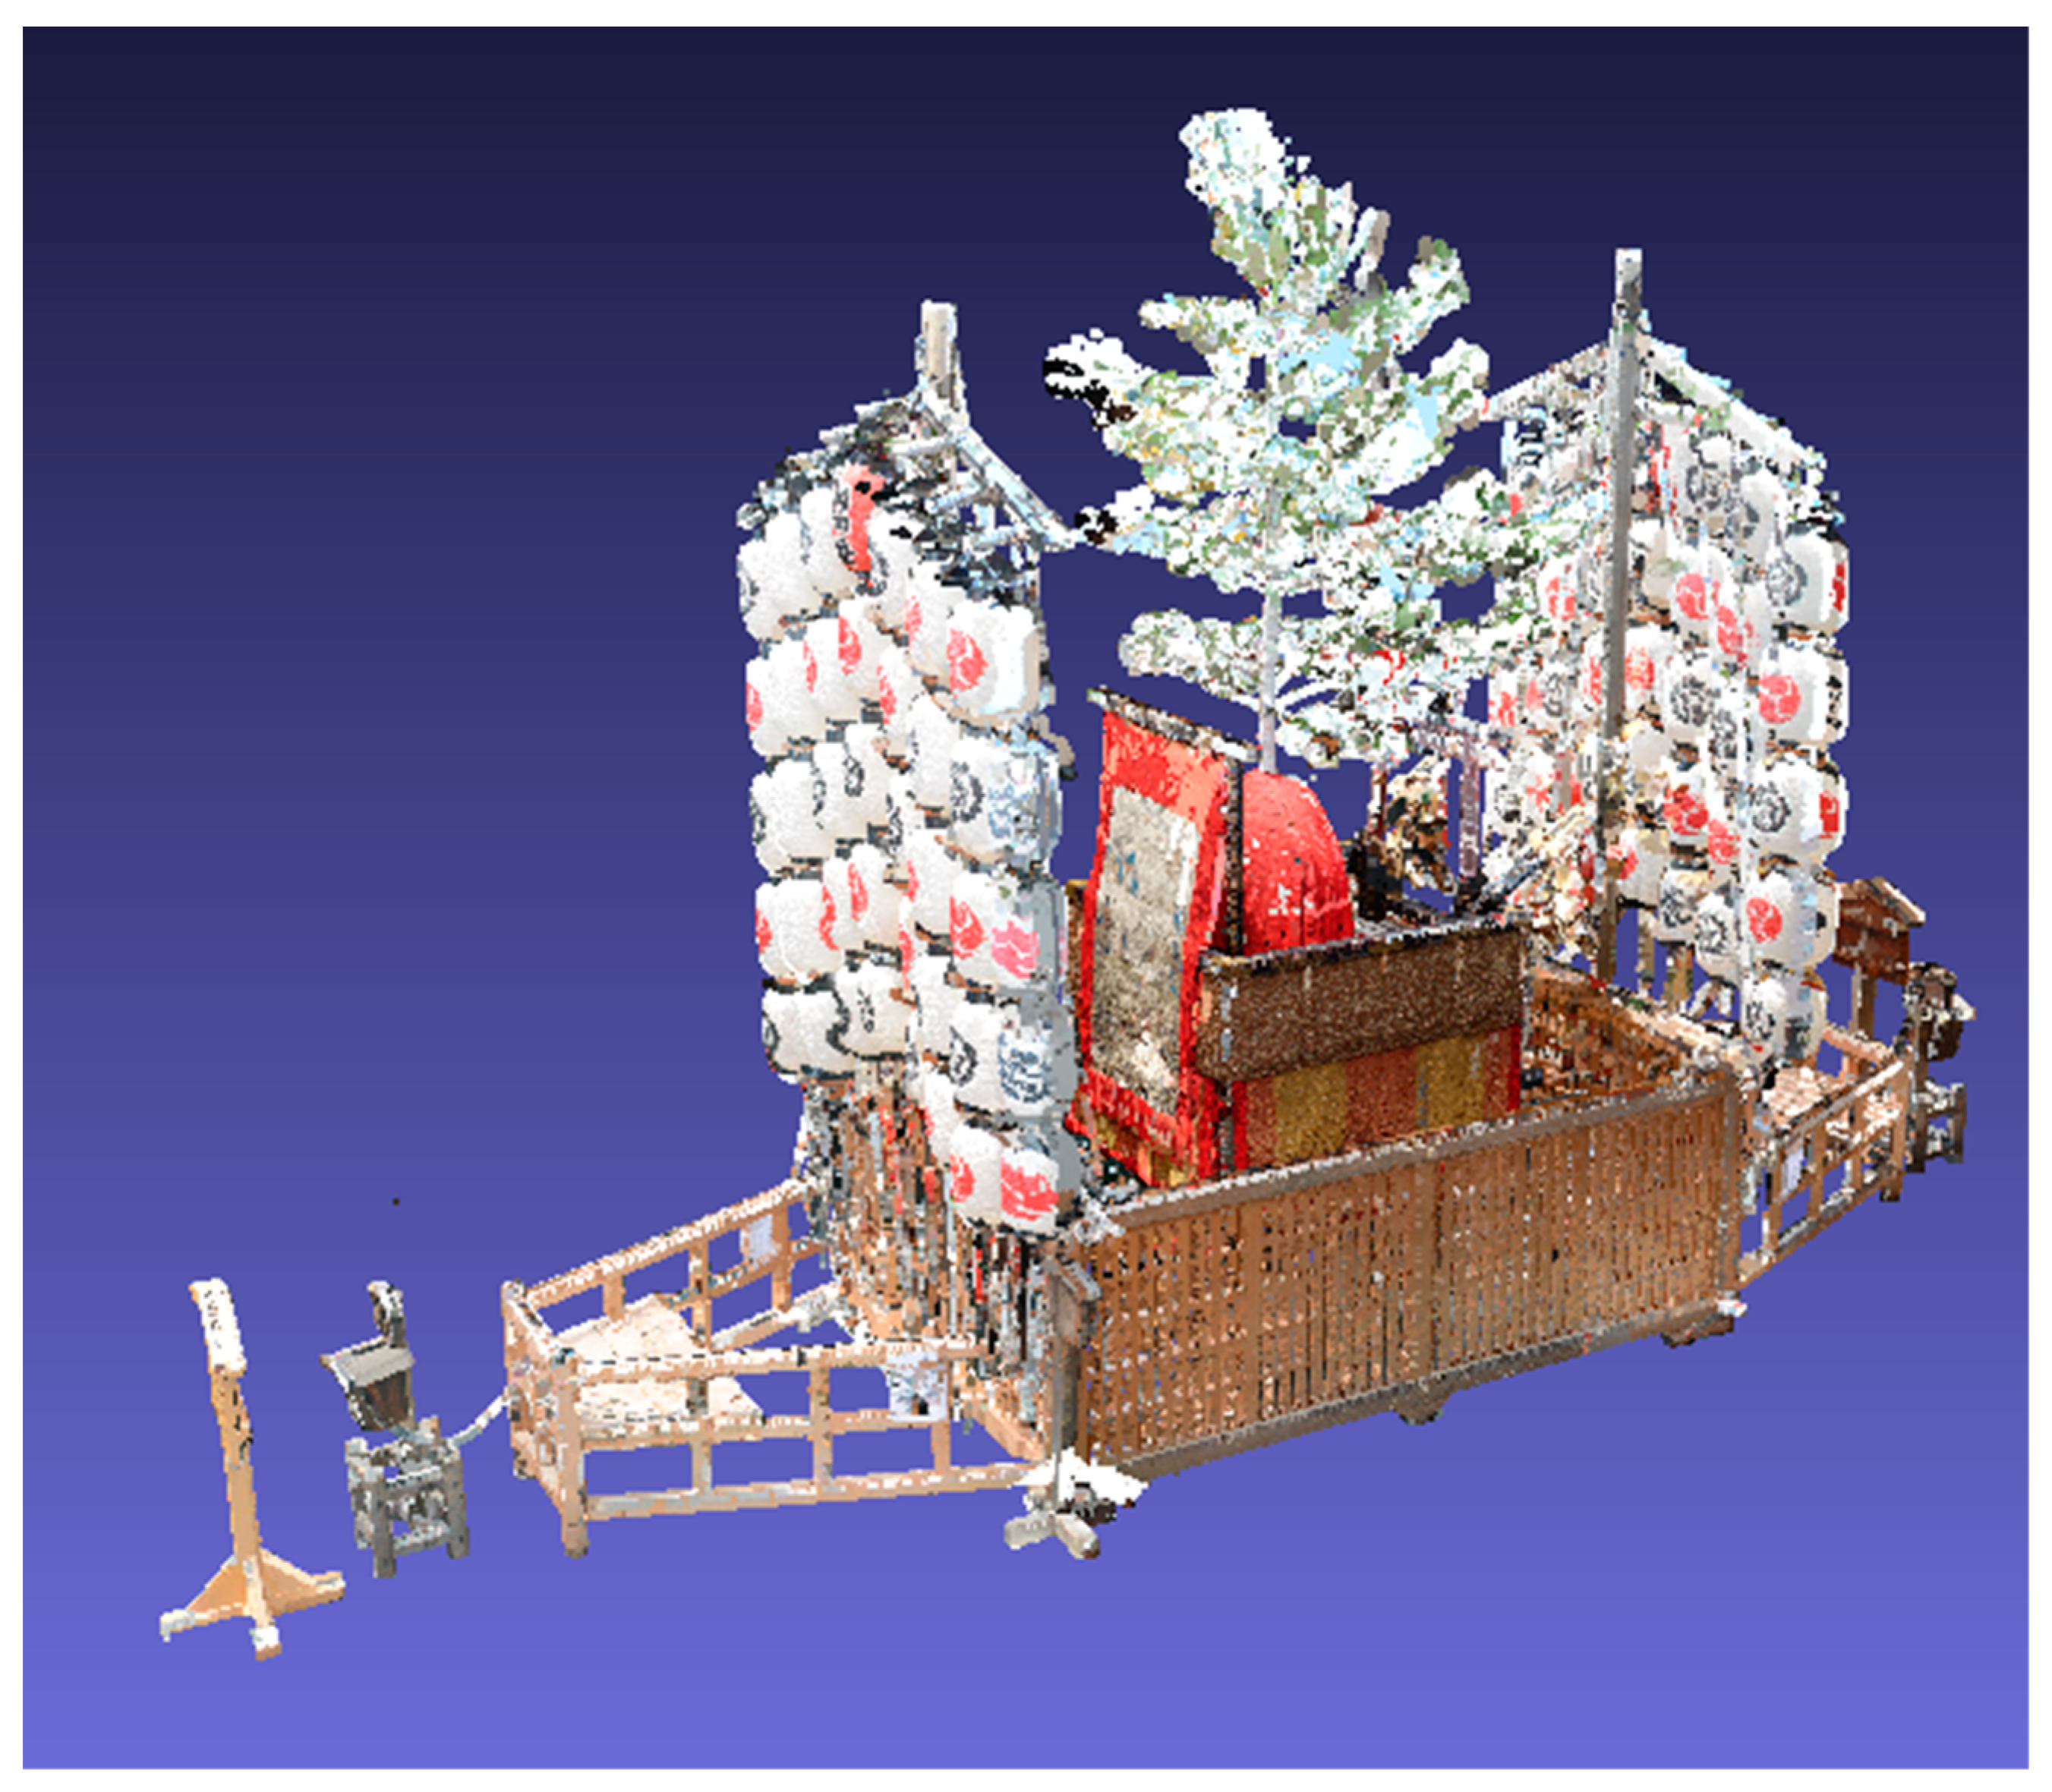
2.2. Application to a Laser-Scanned Point Cloud

We applied our method to a laser-scanned point cloud of the Hachiman-Yama float in the Gion Festival (Figure A1 and Figure A2) and fused it with a corresponding background photographic image. The point cloud acquired with a RIGEL laser scanner (VZ-400) contains 2.62 × 10⁷ points. Figure 2 shows the comparison result of the conventional SPBR based method and the proposed method ( L = 100 ,   α = 0.3 ) . Figure 3 shows the local details of the visualization results of the two methods.
As can be seen in Figure 2c, the scale and surroundings of the float can be perceived, as well as its inner structure, using the proposed method. However, with the effect of the background, the visibility of the float decreased compared to the visibility obtained using the conventional visualization method without the background. Thus, we proposed a visibility enhancement method to solve this problem.

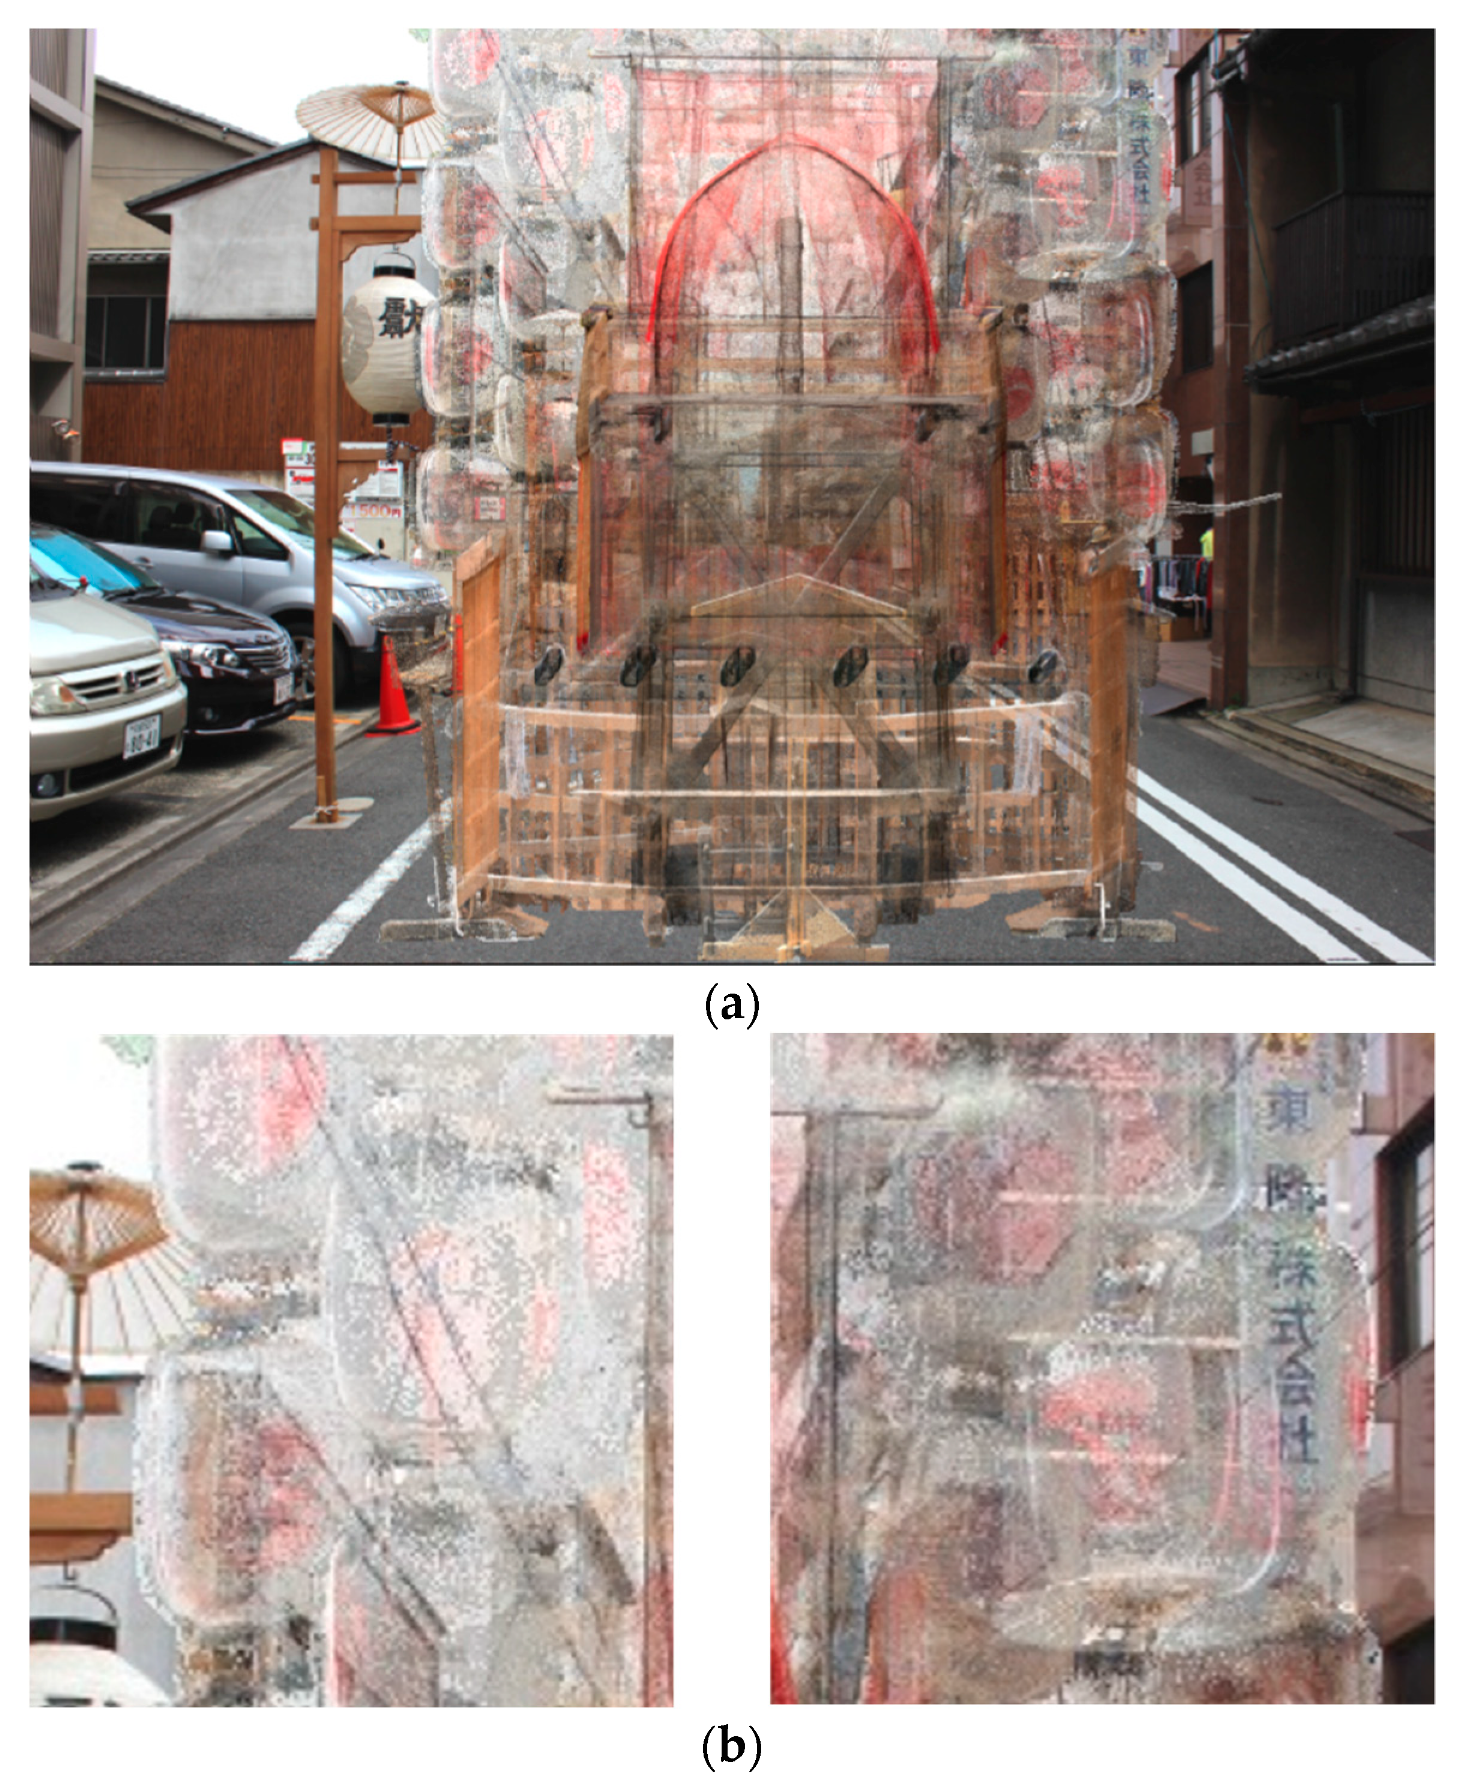
3. Visibility Enhancement for Fused Transparent Visualization

As described in the previous section, the proposed method achieved fused transparent visualization of the point cloud and the background photographic image. However, the visualized point cloud, particularly parts with a lower opacity, becomes unclear after fusing with the colorful background. In this section, we analyze the problems and propose solutions to enhance the visibility of the fused transparent visualization.

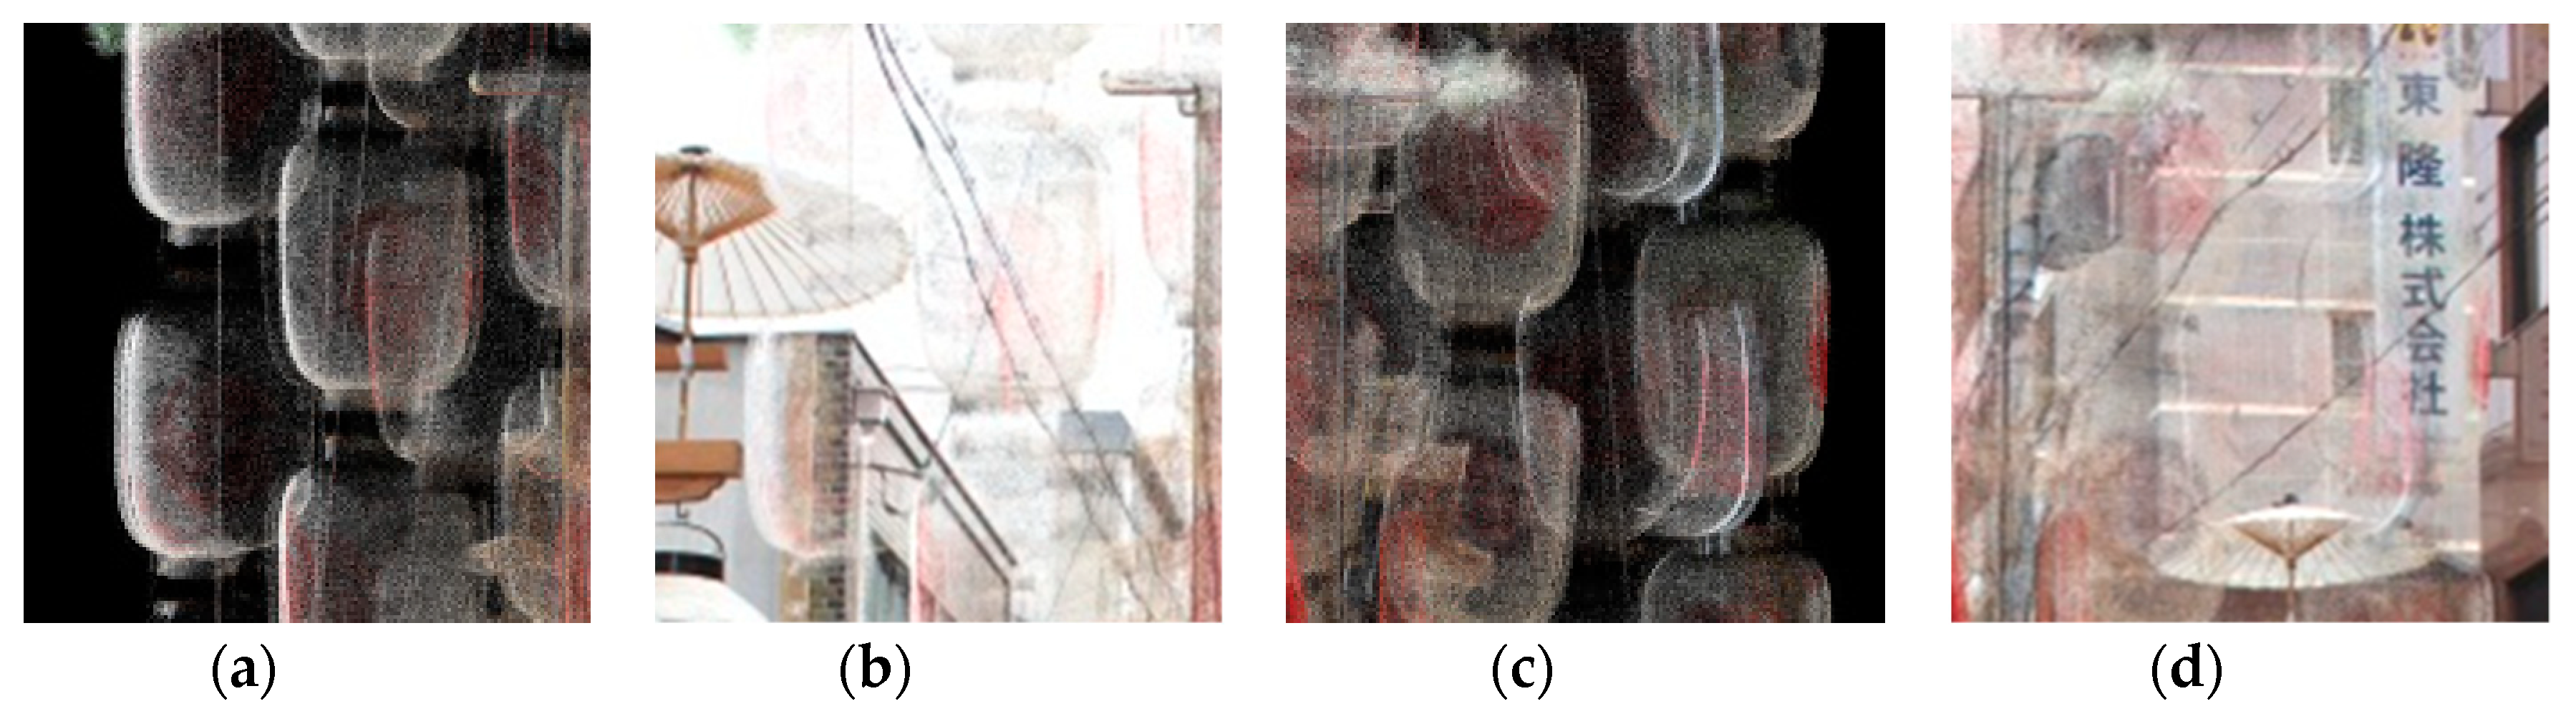
3.1. Causes of the Problem

Two issues are considered to cause a lack of clarity. (1) For a pixel in the visualized image, when the colors of the projected points and the background are similar, the difference between the object and the background is difficult to distinguish. (2) When a small number of points are projected to a pixel, after averaging the intermediate image, the color of the pixel will be dominated by the background color.
First, we verified the color difference between the visualized image after averaging the ensembles of the point cloud and the background image shown in Figure 2 in the CIELAB color space. For two colors, ( L 1 * , a 1 * , b 1 * ) and ( L 2 * , a 2 * , b 2 * ) , the color difference Δ E a b * is defined as:
Δ E a b * = ( L 2 * L 1 * ) 2 + ( a 2 * a 1 * ) 2 + ( b 2 * b 1 * ) 2
The normalized color difference Δ E a b * ( i , j ) on a given pixel can be calculated as follows:
Δ E a b * ( i , j ) = Δ E a b * ( i , j ) Δ E a b min * Δ E a b max * Δ E a b min *
where Δ E a b * ( i , j ) is the color difference on pixel ( i , j ) , and Δ E a b min * and Δ E a b max * are the minimum and maximum color difference values in the whole image, respectively.
We mapped the normalized color difference to a rainbow color map with 256 steps. The visualization result is shown in Figure 4a. As can be seen, the color differences in many regions, particularly the contours of the lanterns in the upper part, were not significant. This color similarity would cause low visibility in these regions on the application of fused visualization.
Then, we verified the number of projections on each pixel. The normalized number of projected points on a given pixel p ( i , j ) is calculated as follows:
p ( i , j ) = p ( i , j ) p min p max p min
where p ( i , j ) is the number of projected points on pixel ( i , j ) , and p min and p max are the minimum and maximum numbers of projected points in the whole image, respectively.
We also mapped the normalized number of projected points to a rainbow color map with 256 steps. The visualization result is shown in Figure 4b. As can be seen, more points were projected to the pixels that belong to the framework of the float. However, fewer points were projected to the lanterns; thus, visibility enhancement on these regions is required.

3.2. Lightness Adjustment

For the regions where the colors of the point cloud and the background were similar, we applied lightness adjustment to the background photographic image.
For each pixel in the visualized image, its value is given by the alpha blending formula [24]:
B = α C p t + ( 1 α ) C b g
where C p t is the average color of the projected points, and C b g is the color of the background. We converted the background image to the HSV (hue, saturation, value) color space and introduced a parameter β ( 0 β 1 ) to Equation (4). Thus, Equation (4) can be rewritten as follows:
B = α C p t + β ( 1 α ) C b g
Note that β is only applied to the V channel in the HSV color space. When β = 1 , Equation (5) is identical to Equation (4), in which lightness adjustment does not apply. For each pixel on the projection plane, lightness adjustment only applies when color difference Δ E a b * ( i , j ) is smaller than a threshold of 0.2. Therefore, lightness adjustment was applied adaptively. Figure 5 shows the results of lightness adjustment at different β values ( β = 0.9 ,   0.7 ,   and   0.4 ). As can be seen, when β was 0.9, the visibility of the lantern in the upper left was still low. However, if β was set to 0.4, the visualized image became unnatural due to the darker background. According to our experiments, 0.7 is the proper value for β in this application.

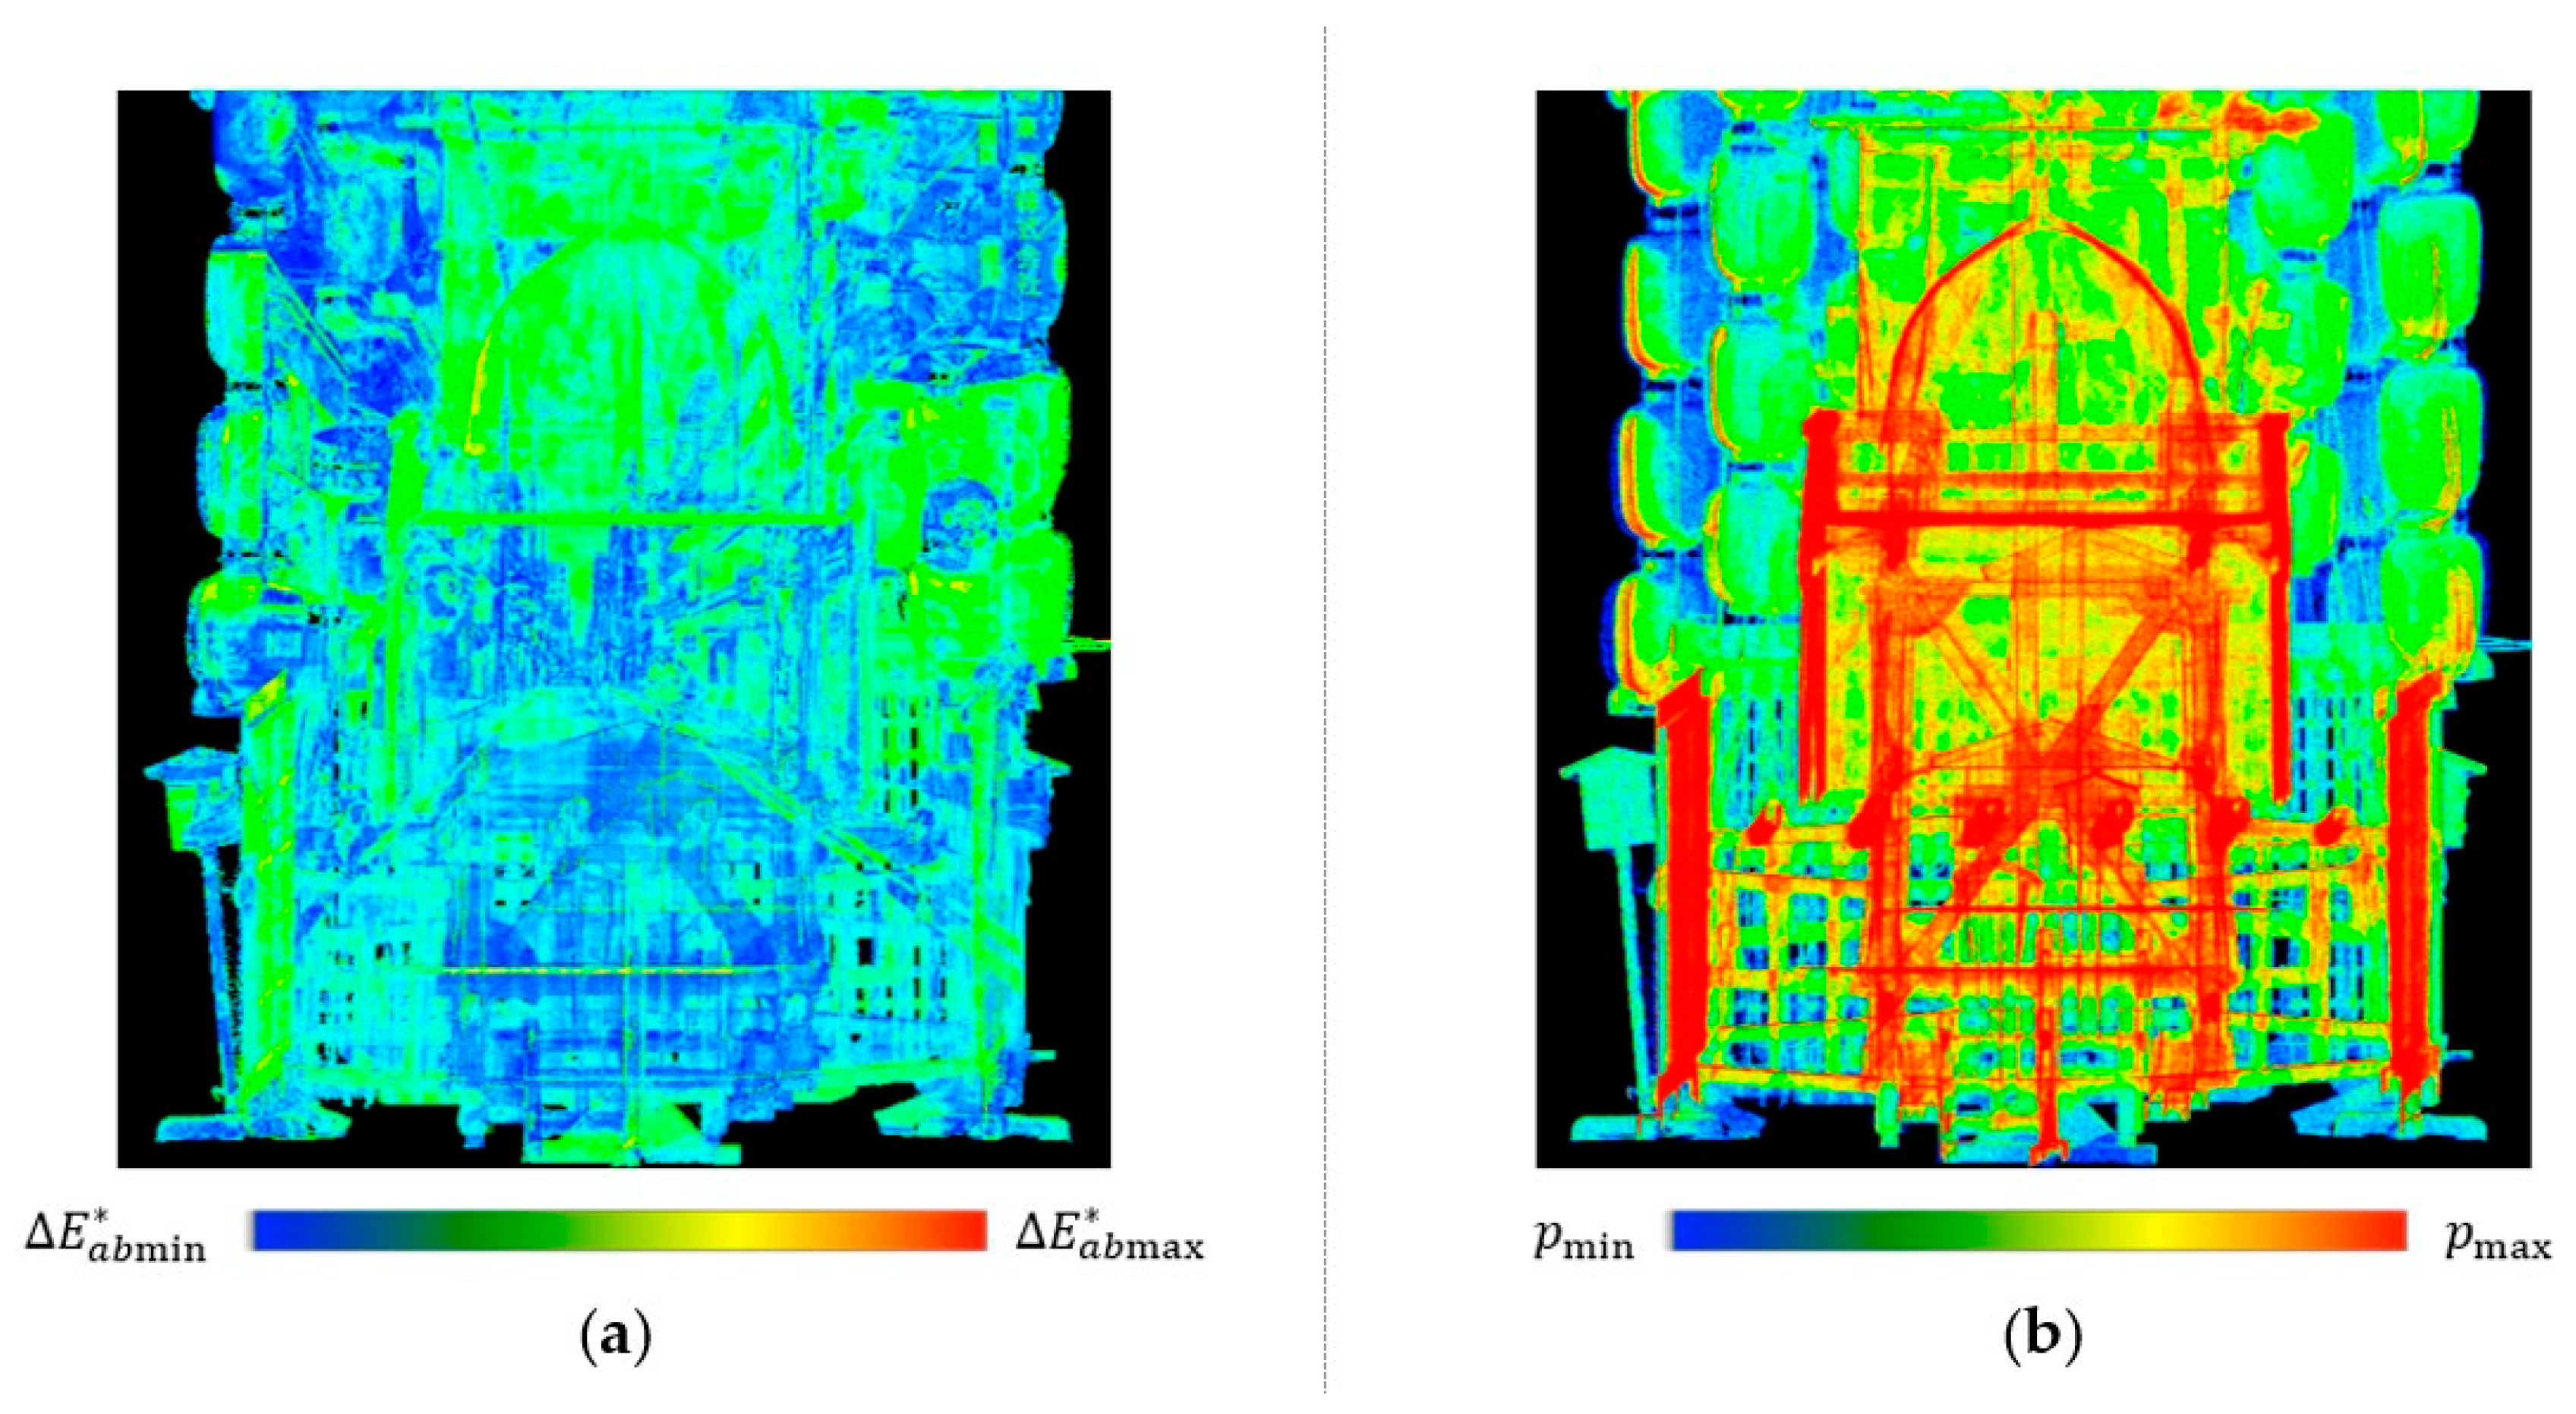
3.3. Color Enhancement

When a pixel has fewer projected points, its color will be dominated by the background color, even when the colors of the projected points and the background differ significantly. This problem can be solved by setting a higher opacity α in transparent visualization using SPBR. However, higher α requires a very large number of projected points, which is extremely difficult in practice. Therefore, we proposed a color enhancement method by replacing the background color with the average point color according to a certain probability.
For the regions only contained in the background, the pixel color in the final image was defined only by the background photographic image. Otherwise, we compared the normalized number of projected points p ( i , j ) of each pixel to a threshold. If p ( i , j ) was greater than or equal to the threshold, we considered that a sufficient number of points were projected to the pixel and did not perform any extra processes. On the other hand, if p ( i , j ) was smaller than the threshold, color enhancement was required for this pixel. Because the final image was generated by averaging the intermediate images, we performed a subsequent process on the pixels of the intermediate images. For each pixel that needed to be color-enhanced, we examined its corresponding pixels in the intermediate images. If the pixel in the intermediate image was not projected by any points, rather than the background color, its color was set to the average color of the projected point C p t by a probability μ .
Figure 6 shows the results of color enhancement at different μ values ( μ = 0.3 ,   0.6 ,   and   0.9 ). In this experiment, we set the threshold for the normalized number of projected points to 0.3, which is consistent with opacity α . As can be seen, with a higher μ value, the color of the point cloud had been enhanced. However, higher μ led to unnatural enhancement on the visualized image. We considered 0.6 to be an appropriate value for μ in this application.

4. Experimental Results and Evaluations

We implemented the proposed method using C++ with several libraries, including Open Graphics Library (OpenGL), Point Cloud Library (PCL), and Kyoto Visualization System (KVS). All tests were performed on an iMac with an Intel Core i-7-5960X CPU, 16 GB memory (DDR3, 1600 MHz), and an NVIDIA GeForce GT 750M GPU (1024 MB). We combined lightness adjustment and color enhancement and applied the combined processes to fused transparent visualization of the point cloud and background photographic image. Average computation time for each process is shown in Table 1. Figure 7a shows the improved fused visualization result using the proposed method ( L = 100 ,   α = 0.3 ,   β = 0.7 ,   μ = 0.6 ) . Figure 7b shows the local details of the visualization result of Figure 7a. Compared to the visualization results without lightness adjustment and color enhancement in Figure 2c and Figure 3b,d, the proposed method achieved better visibility, particularly in the regions that contain lanterns.
To evaluate the effectiveness of the proposed method, we applied the Sobel filter [25] to extract the edges in the images. The Sobel filter measures the spatial gradient on an image by applying a pair of 3 × 3 convolutional kernels to detect horizontal and vertical edge components. We assumed that regions with high visibility result in clear edges. Figure 8 shows the edge extraction results by applying the Sobel filter to the visualization results of the conventional and the proposed methods. Figure 9 shows the local details of the upper left part of the corresponding images in Figure 8.
As shown in Figure 8a and Figure 9a, the edges of some objects, particularly the lanterns in the upper left, have not been extracted successfully. This indicates that the visibility of the objects is low in these regions. Figure 8b,c and Figure 9b,c show the results of applying lightness adjustment and transparent visualization individually to improve the visibility of the fused transparent visualization. It is evident that lightness adjustment successfully emphasized the contours of the lanterns, whereas color enhancement successfully emphasized the patterns on the lanterns. The edge extraction result of the proposed method that combines lightness adjustment and color enhancement is shown in Figure 8d and Figure 9d. We can see that both the shapes and patterns of the lanterns are extracted successfully. The experimental results show that the proposed method has improved the visibility of the point cloud object in the fused transparent visualization.
An overview of the advantages and disadvantages of the conventional SPBR and the proposed method is shown in Table 2.

5. Conclusions

We have proposed a fused transparent visualization method to visualize laser-scanned point cloud data of cultural heritage assets with their surrounding environments. We extended our SPBR method to adapt to the background fusion task. Compared to conventional transparent visualization with a single-color background, fused transparent visualization with a photographic image as the background often results in low visibility of foreground objects, which means it is difficult to distinguish the valuable cultural heritage from the background. Therefore, we proposed two solutions to improve the visibility of the fused transparent visualization result: (1) lightness adjustment for regions with similar colors of the point cloud and the background, and (2) color enhancement for regions with fewer projected points. The experimental results have confirmed the effectiveness of the proposed method.
In the current process, the size of the point cloud on the projection plane was determined manually according to the background image. In the future, we will investigate the automatic adjustment of the size and angle of the point cloud for projection based on the background information. Besides, we plan to extend the proposed method to fused transparent visualization with panoramic photos, which will provide a 360-degree view for the audience to appreciate the cultural heritage in a natural surrounding environment.

Author Contributions

Conceptualization, L.L., K.H. and S.T.; Methodology, L.L., K.H., I.N. and S.T.; Software, I.N.; Validation, L.L. and K.H.; Investigation, I.N.; Data Curation, L.L. and K.H.; Writing—Original Draft Preparation, L.L.; Writing—Review & Editing, L.L., K.H. and S.T.; Visualization, L.L. and I.N.; Project Administration, S.T.; Funding Acquisition, S.T.

Funding

This work was supported in part by JSPS KAKENHI, grant number 16H02826.

Acknowledgments

In this paper, the images of the Hachiman-Yama float are presented with the permission of the Hachiman-Yama Preservation Society. We thank the society for its generous cooperation.

Conflicts of Interest

The authors declare no conflict of interest.

Appendix A

Figure A1. The Hachiman-Yama float in the Gion Festival.
Ijgi 08 00343 g0a1
Figure A2. Laser-scanned point cloud of the Hachiman-Yama float (2.62 × 10⁷ points).
Ijgi 08 00343 g0a2

References

  1. Zorich, D.M. A Survey of Digital Cultural Heritage Initiatives and Their Sustainability Concerns; Council on Library and Information Resources: Washington, DC, USA, 2003. [Google Scholar]
  2. Parry, R. Digital heritage and the rise of theory in museum computing. Mus. Manag. Curatorship 2005, 20, 333–348. [Google Scholar] [CrossRef]
  3. Hachimura, K.; Li, L.; Choi, W.; Fukumori, T.; Nishiura, T.; Yano, K. Generating virtual yamahoko parade of the gion festival. In New Developments in Digital Archives; Hacihmura, K., Tanaka, H.T., Eds.; Nakanishiya Publishing: Kyoto, Japan, 2012; pp. 259–279. [Google Scholar]
  4. Yano, K.; Nakaya, T.; Isoda, Y. (Eds.) Virtual Kyoto: Exploring the Past Present and Future of Kyoto; Nakanishiya Publishing: Kyoto, Japan, 2007; pp. 1–161. [Google Scholar]
  5. Magnenat-Thalmann, N.; Foni, N.; Papagiannakis, G.; Cadi-Yazli, N. Real time animation and illumination in ancient roman sites. Int. J. Virtual Real. 2007, 6, 11–24. [Google Scholar]
  6. Hachimura, K. Digital archiving of dance by using motion capture technology. In New Directions in Digital Humanities for Japanese Arts and Cultures; Kawashima, A., Akama, R., Yano, K., Hachimura, K., Inaba, M., Eds.; Nakanishiya Publishing: Kyoto, Japan, 2008; pp. 167–182. [Google Scholar]
  7. Remondino, F.; Barazzetti, L.; Nex, F.; Scaioni, M.; Sarazzi, D. UAV photogrammetry for mapping and 3D modeling current status and future perspectives. Int. Arch. Photogramm. Remote Sens. Spat. Inf. Sci. 2011, 38, C22. [Google Scholar] [CrossRef]
  8. Masuda, H.; He, J. TIN generation and point-cloud compression for vehicle-based mobile mapping systems. Adv. Eng Inform. 2015, 29, 841–850. [Google Scholar] [CrossRef]
  9. Guidi, G.; Frischer, B.; Simone, M.D.; Cioci, A.; Spinetti, A.; Carosso, L.; Micoli, L.L.; Russo, M.; Grasso, T. Virtualizing Ancient Rome: 3D acquisition and Modeling of a Large Plaster-of-Paris Model of Imperial Rome. In Proceedings of SPIE 5665; SPIE: Bellingham, WA, USA, 2005; Volume Videometrics VIII; pp. 119–133. [Google Scholar]
  10. Ikeuchi, K.; Oishi, T.; Takamatsu, J.; Sagawa, R.; Nakazawa, A.; Kurazume, R.; Nishino, K.; Kamakura, M.; Okamoto, Y. The great Buddha project: Digitally archiving, restoring and analyzing cultural heritage objects. Int. J. Comput. Vis. 2007, 75, 189–208. [Google Scholar] [CrossRef]
  11. Dylla, K.; Frischer, B.; Mueller, P.; Ulmer, A.; Haegler, S. Rome Reborn 2.0: A case study of virtual city reconstruction using procedural modeling techniques. In Proceedings of CAA 2009; Archaeopress: Oxford, UK, 2009; pp. 62–66. [Google Scholar]
  12. Remondino, F.; Girardi, S.; Rizzi, A.; Gonzo, L. 3D modeling of complex and detailed cultural heritage using multi-resolution data. ACM J. Comput. Cult. Herit. 2009, 2, 2. [Google Scholar] [CrossRef]
  13. Koller, D.; Frischer, B.; Humpherys, G. Research challenges for digital archives of 3d cultural heritage models. ACM J. Comput. Cult. Herit. 2009, 2, 7. [Google Scholar] [CrossRef]
  14. Kersten, T.P.; Keller, F.; Saenger, J.; Schiewe, J. Automated Generation of an Historic 4D City Model of Hamburg and Its Visualisation with the GE Engine. In Proceedings of Progress in Cultural Heritage Preservation (Lecture Notes in Computer Science 7616); Springer: Berlin, Germany, 2012; pp. 55–65. [Google Scholar]
  15. Kobbelt, L.; Botsch, M. A survey of point-based techniques in computer graphics. Comput. Graph. 2004, 28, 801–814. [Google Scholar] [CrossRef]
  16. Gross, M.; Pfister, H. (Eds.) Point-Based Graphics; Elsevier: Amsterdam, The Netherlands, 2011. [Google Scholar]
  17. Discher, S.; Richter, S.; Dollner, J. A Scalable WebGL-based Approach for Visualizing Massive 3D Point Clouds using Semantics-Dependent Rendering Techniques. In Proceedings of Web3D’18; ACM: New York, NY, USA, 2018; p. 19. [Google Scholar]
  18. Discher, S.; Masopust, L.; Schulz, S.; Richter, R.; Dollner, J. A point based and image-based multi-pass rendering technique for visualizing massive 3D point clouds in VR environments. J. WSCG 2018, 26, 76–84. [Google Scholar] [CrossRef]
  19. Thiel, F.; Discher, S.; Richter, R.; Dollner, J. Interaction and locomotion techniques for the exploration of massive 3D point clouds in VR environments. Int. Arch. Photogramm. Remote Sens. Spat. Inf. Sci. 2018, 42. [Google Scholar] [CrossRef]
  20. Seemann, P.; Palma, G.; Dellepiane, M.; Cignoni, P.; Goesele, M. Soft Transparency for Point Cloud Rendering. In Proceedings of Eurographics Symposium on Rendering: Experimental Ideas Implementations; ACM: New York, NY, USA, 2018; pp. 95–106. [Google Scholar]
  21. Tanaka, S.; Hasegawa, K.; Okamoto, N.; Umegaki, R.; Wang, S.; Uemura, M.; Okamoto, A.; Koyamada, K. See-Through Imaging of Laser-scanned 3D Cultural Heritage Objects based on Stochastic Rendering of Large-Scale Point Clouds. In Proceedings of ISPRS Annals Photogrammetry Remote Sensing and Spatial Information Sciences; Copernicus Publications: Göttingen, Germany, 2016; pp. 73–80. [Google Scholar]
  22. Hasegawa, K.; Li, L.; Okamoto, N.; Yanai, S.; Yamaguchi, H.; Okamoto, A.; Tanaka, S. Application of stochastic point-based rendering to laser-scanned point clouds of various cultural heritage objects. Int. J. Autom. Technol. 2018, 12, 348–355. [Google Scholar] [CrossRef]
  23. Tanaka, S.; Nakagawa, M. Path Design for Ground-based Panoramic Image Acquisition. In Proceedings of ACRS 2015; AARS: Tokyo, Japan, 2015; p. 118634. [Google Scholar]
  24. Porter, T.; Duff, T. Compositing digital images. Comput. Graph. 1984, 18, 253–259. [Google Scholar] [CrossRef]
  25. Kanopoulos, N.; Vasanthavada, N.; Baker, R.L. Design of an image edge detection filter using the Sobel operator. IEEE J. Solid-State Circuits 1988, 23, 358–367. [Google Scholar] [CrossRef]
Figure 1. Scheme of the proposed fused transparent visualization.
Ijgi 08 00343 g001
Figure 2. Comparison of the conventional transparent visualization based on Stochastic Point-Based Rendering (SPBR) and the proposed fused transparent visualization: (a) transparent visualization based on SPBR, (b) background photographic image of Shinmachi Street, (c) fused transparent visualization of the point cloud of Hachiman-Yama float with its background photographic image.
Ijgi 08 00343 g002aIjgi 08 00343 g002b
Figure 3. Local details of the visualization results in Figure 2: (a) partial enlargement of an upper left part of Figure 2a, (b) partial enlargement of an upper left part of Figure 2c, (c) partial enlargement of an upper right part of Figure 2a, and (d) partial enlargement of an upper right part of Figure 2c.
Ijgi 08 00343 g003
Figure 4. Visualization of (a) the color difference between the point cloud and the background and (b) number of projected points.
Ijgi 08 00343 g004
Figure 5. Visualization results of lightness adjustment with different β values: (a) β = 0.9 , (b) β = 0.7 , and (c) β = 0.4 .
Ijgi 08 00343 g005aIjgi 08 00343 g005b
Figure 6. Visualization results of color enhancement with different μ values: (a) μ = 0.3 , (b) μ = 0.6 , and (c) μ = 0.9 .
Ijgi 08 00343 g006aIjgi 08 00343 g006b
Figure 7. Result of improved fused transparent visualization by the proposed method: (a) visualization result by the proposed method and (b) local details of the visualization result of (a).
Ijgi 08 00343 g007
Figure 8. Results of edge extraction by applying a Sobel filter to the fused transparent visualization images: (a) original fused transparent visualization, (b) lightness adjustment only, (c) color enhancement only, and (d) improved fused transparent visualization by the proposed method.
Ijgi 08 00343 g008
Figure 9. Local details of the edge extraction result in Figure 8: (a) original fused transparent visualization, (b) lightness adjustment only, (c) color enhancement only, and (d) improved fused transparent visualization by the proposed method.
Ijgi 08 00343 g009
Table 1. Average computation time for each process of the proposed method (in seconds).
Lightness AdjustmentColor EnhancementFused Transparent Visualization
0.092.383.19
Table 2. Overview of the conventional SPBR (Stochastic Point-Based Rendering) and the proposed method.
SPBRProposed Fused Transparent VisualizationProposed Method with Lightness AdjustmentProposed Method with Color EnhancementProposed Method with Lightness Adjustment and Color Enhancement
Transparent visualizationYesYesYesYesYes
Fused visualizationNoYesYesYesYes
Visibility in regions with similar object-background colors (e.g., counters of the lanterns)PoorPoorGoodPoorGood
Visibility in regions with few projected points (e.g., patterns of the lanterns)PoorPoorPoorGoodGood

