Article

Fusion of Multi-Sensor-Derived Heights and OSM-Derived Building Footprints for Urban 3D Reconstruction

1
Signal Processing in Earth Observation, Technical University of Munich, 80333 Munich, Germany
2
Remote Sensing Technology Institute, German Aerospace Center, 82234 Wessling, Germany
*
Author to whom correspondence should be addressed.
ISPRS Int. J. Geo-Inf. 2019, 8(4), 193; https://doi.org/10.3390/ijgi8040193
Submission received: 28 February 2019 / Revised: 5 April 2019 / Accepted: 9 April 2019 / Published: 18 April 2019
(This article belongs to the Special Issue Multi-Source Geoinformation Fusion)

Abstract

:
So-called prismatic 3D building models, following the level-of-detail (LOD) 1 of the OGC City Geography Markup Language (CityGML) standard, are usually generated automatically by combining building footprints with height values. Typically, high-resolution digital elevation models (DEMs) or dense LiDAR point clouds are used to generate these building models. However, high-resolution LiDAR data are usually not available with extensive coverage, whereas globally available DEM data are often not detailed and accurate enough to provide sufficient input to the modeling of individual buildings. Therefore, this paper investigates the possibility of generating LOD1 building models from both volunteered geographic information (VGI) in the form of OpenStreetMap data and remote sensing-derived geodata improved by multi-sensor and multi-modal DEM fusion techniques or produced by synthetic aperture radar (SAR)-optical stereogrammetry. The results of this study show several things: First, it can be seen that the height information resulting from data fusion is of higher quality than the original data sources. Secondly, the study confirms that simple, prismatic building models can be reconstructed by combining OpenStreetMap building footprints and easily accessible, remote sensing-derived geodata, indicating the potential of application on extensive areas. The building models were created under the assumption of flat terrain at a constant height, which is valid in the selected study area.

1. Introduction

One particular interest in remote sensing is the 3D reconstruction of urban areas for diverse applications such as 3D city modeling, urban, and crisis management, etc. Buildings belong to the most important objects in urban scenes and are modeled for diverse applications such as simulation of air pollution, estimating energy consumption, detecting urban heat islands, and many others [
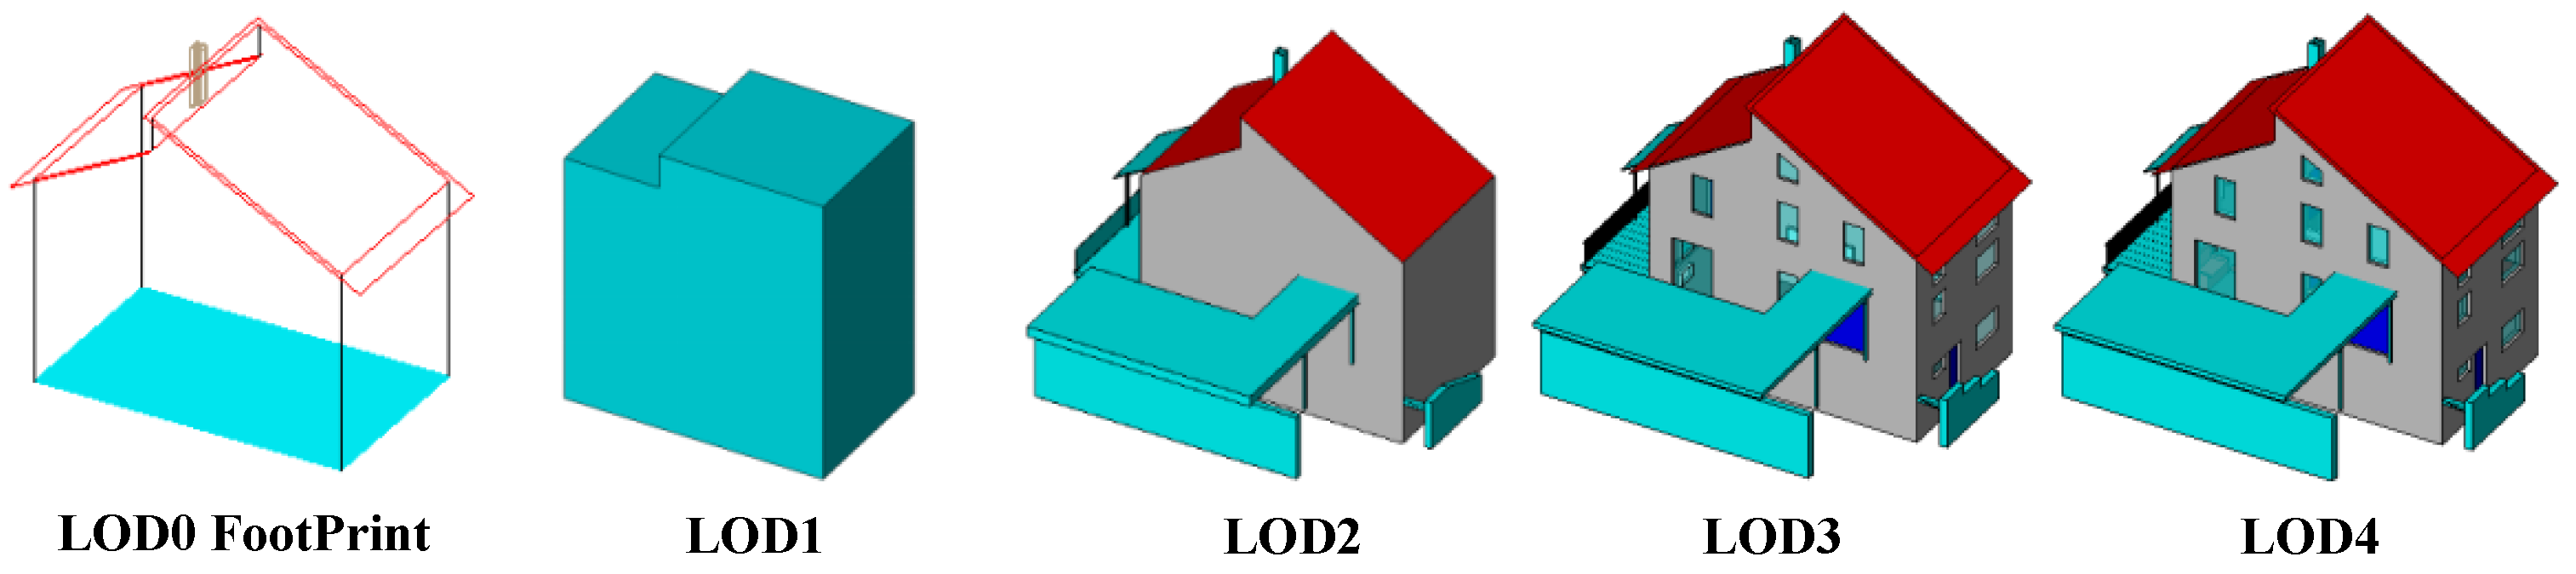
1]. There are different levels of building modeling which have been described under the standard of the OGC City Geography Markup Language (CityGML). These are summarized in [2].
Figure 1 displays different levels-of-detail as defined in the CityGML standard. As shown in this figure, the lowest level of detail (LOD) is 1 (LOD1), which describes building models as block models with flat roof structure and provides the coarsest volumetric representation of buildings [3]. Thus, LOD1 models are frequently produced by extruding a building footprint to a height provided by separate sources [4]. The next level is LOD2, which represents building shapes with more details. Therefore, this type of building modeling demands high-resolution data in comparison to the first level. Comprehensive technical information about variants of the LOD of a 3D building model can be found in [5]. In many cases, the building height information can be provided by versatile remote sensing data sources such as airborne laser scanning [6], high-resolution optical stereo imagery [7], or DEMs produced by synthetic aperture radar (SAR) interferometry [8]. Other sources for LOD modelling are described in [9].
A special interest lies in automatically generating building models for extensive areas at LOD1 level. While height information provided by airborne LiDAR data leads to highly accurate LOD1 representations of buildings [11,12], it is computationally expensive to produce models that cover wide areas. In addition, expensive LiDAR data are often not available for extensive areas. On the other hand, several investigations illustrate the possibility of using other remote sensing data types for 3D building reconstruction for that purpose [13,14]. As an example, the possibility of LOD1 3D building model generation from Cartosat-1 and Ikonos DEMs has been investigated in [15]. In another study, Marconcini et al. proposed a method for building height estimation from TanDEM-X data [16]. Using open DEMs such as SRTM for 3D reconstruction has been evaluated in different studies [17,18,19]. They concluded that SRTM elevation data can be used for recognizing tall buildings. In a recent investigation, Misra et al. compared different global height data sources such as SRTM, ASTER, AW3D, as well as TanDEM-X for digital building height model generation [20].
The main objective of this paper is to investigate the possibility of LOD1-based 3D building modeling from different remote sensing data sources which can be efficiently applied to wide areas. Regarding that each remote sensing source provided by a sensor with specific properties, using multi-sensor data fusion techniques can ultimately provide high quality geodata for 3D reconstruction by instructively integrating the sensors’ properties and mitigating their drawbacks [
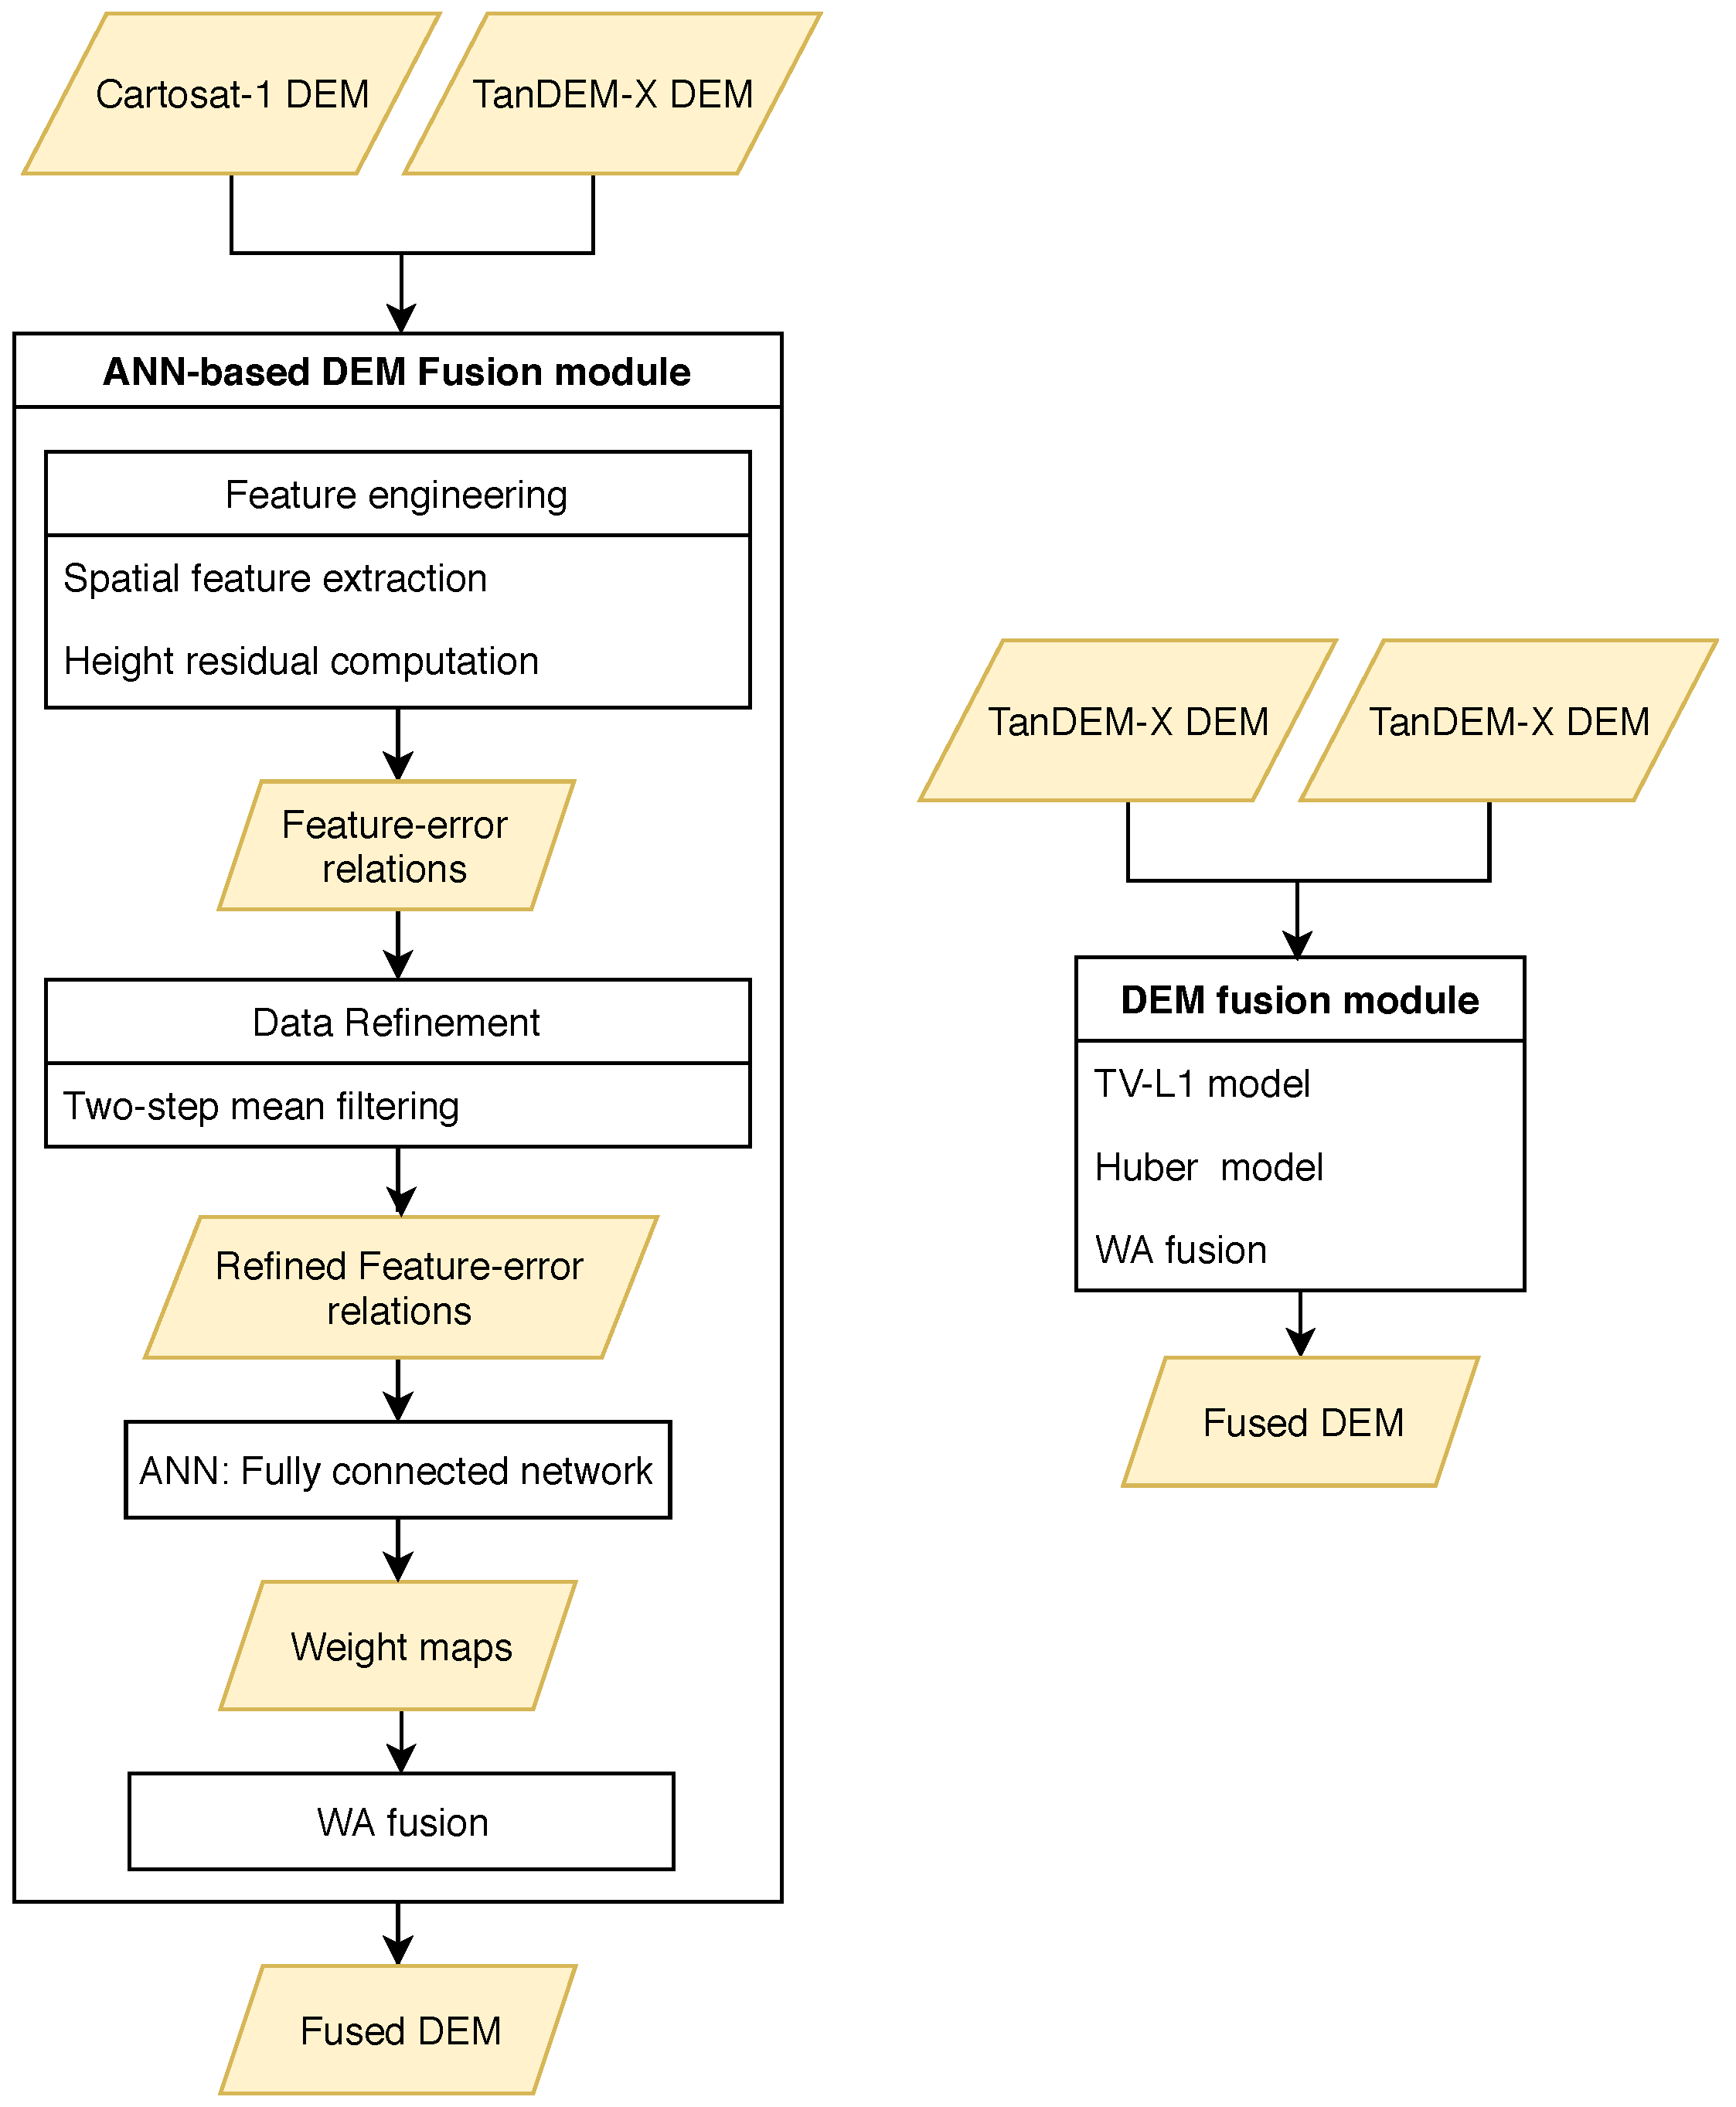
21]. For that purpose, height information is extracted from different sources: medium-resolution DEMs derived from optical imagery such as the Cartosat-1 DEM, and interferometric DEMs generated from bistatic TanDEM-X acquisitions. Due to the limitations and specific properties of those DEMs, state-of-the art DEM fusion techniques are used for improving the height accuracy. More details of those techniques and the logic behind the fusion are explained in the respective sections.
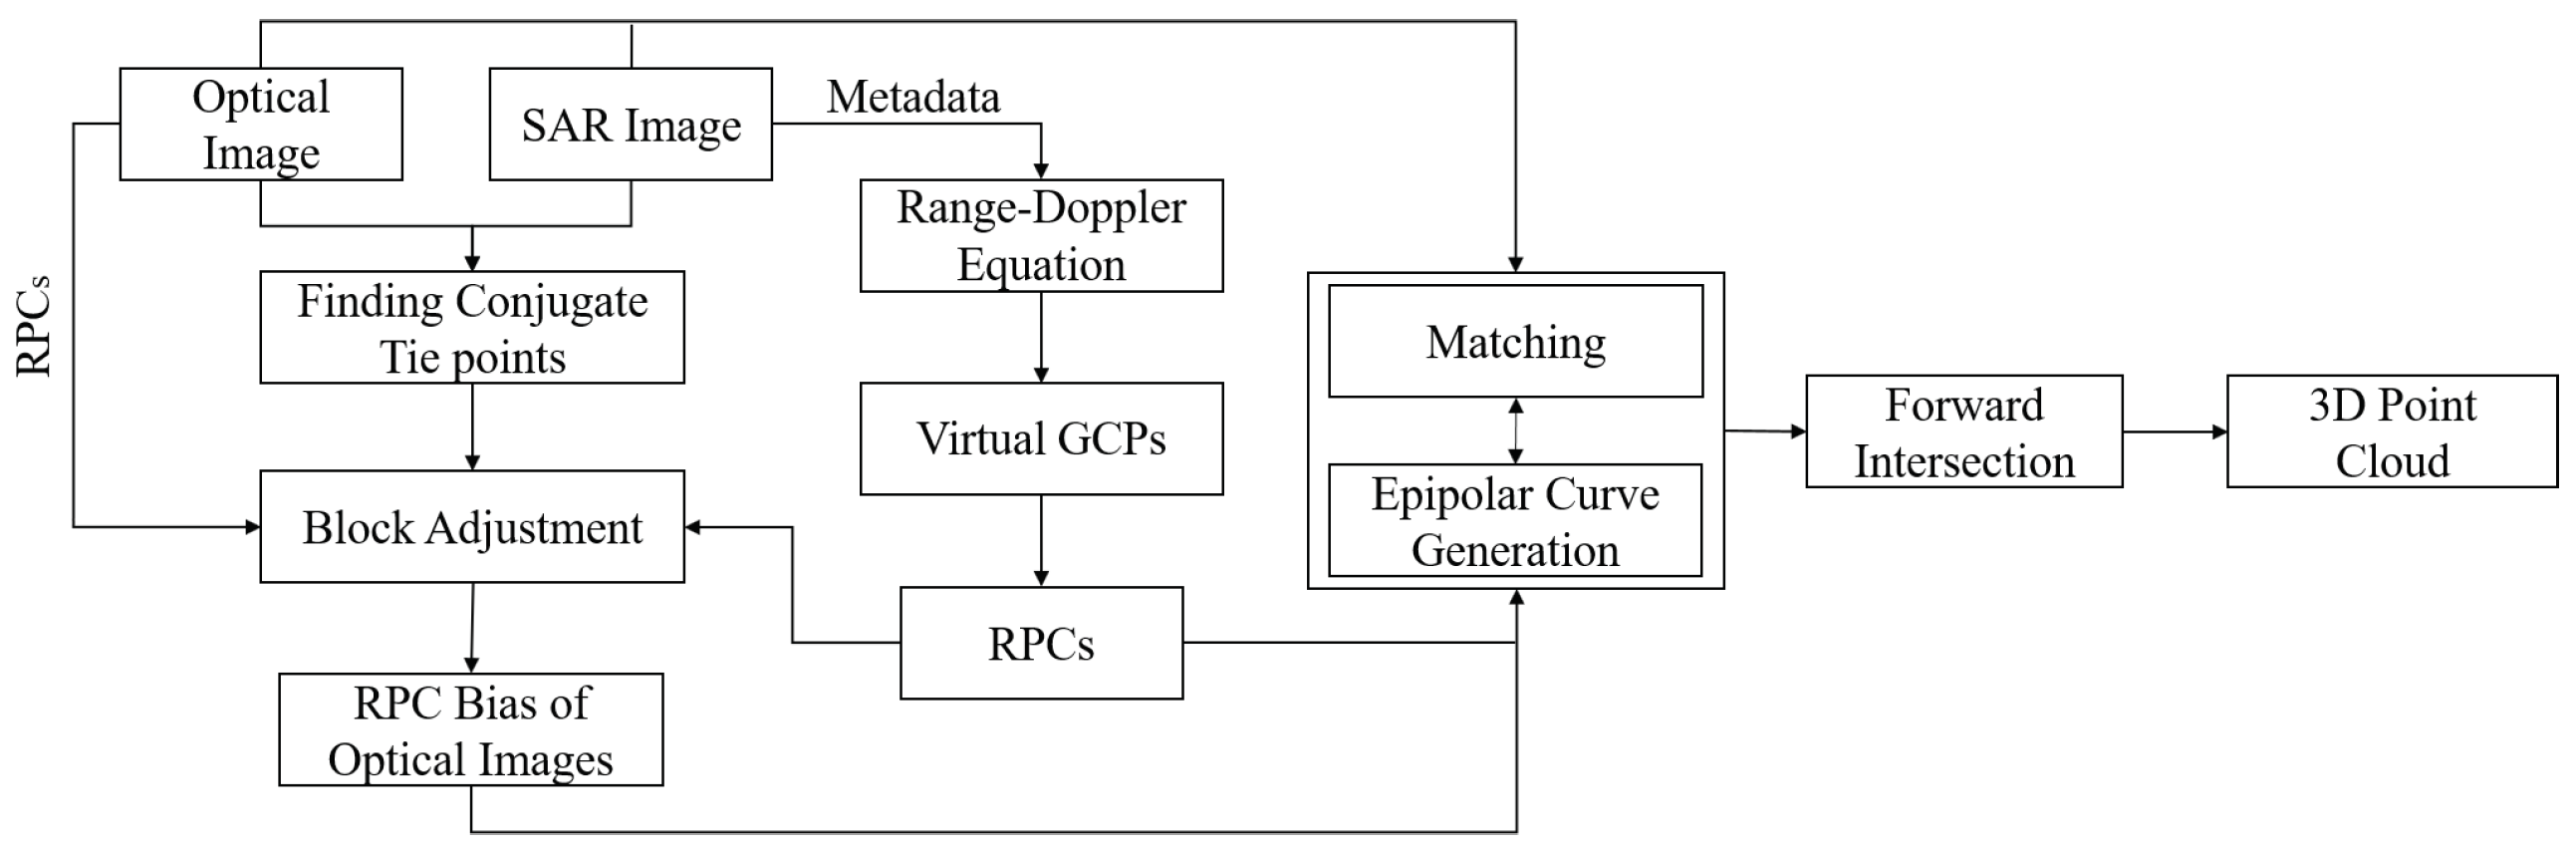
In another experiment, the potential of using heights from SAR-optical stereogrametry for 3D building reconstruction is investigated. Regarding the growing archive of very high-resolution SAR and optical imagery, developing a framework that takes advantages of both SAR and optical imagery can provide a great opportunity to produce 3D spatial information over urban areas. Besides the globally available DEMs derived from optical and SAR remote sensing, this information can also potentially be employed for producing 3D building models at LOD1 level.
Besides height data, building outlines are needed for LOD1 modelling, since the aforementioned height sources are not detailed enough to reliably determine accurate building outlines. We therefore use OpenStreetMap as a form of volunteered geographic information (VGI) that is available with global coverage as well. In this paper, we evaluate the potential of 3D building reconstruction from both building footprints provided by OSM and heights derived by multi-sensor remote sensing data fusion. Since the study area in this research is flat, we consider a constant height for ground and finally generate a building model with this assumption.
In Section 2, different fusion techniques used for height derivation over urban areas are summarized. It includes three fusion experiments: TanDEM-X and Cartosat-1 DEM fusion (Section 2.1), multiple TanDEM-X raw DEM fusion (Section 2.2), and SAR-optical stereogrammetry for 3D urban reconstruction (Section 2.3). After that, a simple procedure for LOD1 building model reconstruction from the multi-sensor-fusion-derived heights and OSM building footprints is presented in Section 3. The properties of the applied data and the study area are described in Section 4, including a summary of the benefits of multi-sensor DEM fusion and SAR-optical stereogrammetry. The outputs and results of LOD1 building model reconstruction using both VGI and different remote-sensing-derived geodata are provided in Section 5. Finally, the potential of LOD1 3D reconstruction using the mentioned data sources, as well as challenges and open issues, are discussed in Section 6.

2. Multi-Sensor Data fusion for Height Generation over Urban Scenes

In this paper, elevation data are derived from different sensor types for 3D building reconstruction. As mentioned earlier, those data sources can be categorized as digital elevation models derived from optical or SAR imagery and also as point clouds reconstructed from SAR-optical image pairs through stereogrammetry. The main idea is to apply data fusion techniques to finally produce more accurate height information. In the following sections, more details of applied fusion techniques will be presented.

2.1. TanDEM-X and Cartosat-1 DEM Fusion in Urban Areas

Cartosat-1 is an Indian satellite equipped with optical sensors for stereo imagery acquisitions. The Cartosat-1 sensor with resolution of 2.5 m and partially large swath width of 30 km makes the acquired stereo images perfect for producing high-resolution DEMs with a wide coverage [22]. However, the main defect of this sensor is the poor absolute localization accuracy [23]. In parallel, the TanDEM-X mission is a recent endeavour for producing a global DEM through an interferometric SAR processing chain. Evaluation with respect to LiDAR reference data illustrates that the TanDEM-X DEM has a better absolute accuracy than the Cartosat-1 DEM, while its precision drops out in urban areas because of intrinsic properties of InSAR-based height construction [24]. Figure 2b shows the performance of both DEMs in a subset selected for height precision evaluation over an urban scene. As displayed in Figure 2b, the overall precision of the Cartosat-1 DEM is better than the overall precision of the TanDEM-X DEM.
Regarding the drawbacks of both DEMs, data fusion is used to finally reach a high quality DEM. In more detail, first the absolute accuracy of Cartosat-1 is increased to the level of absolute accuracy of the TanDEM-X DEM by vertical alignment. Next, both DEMs can be integrated using a sophisticated approach presented in our previous research [25]. The fusion method is developed for multi-sensor DEM fusion with the support of neural-network-predicted fusion weights. For this task, appropriate spatial features are extracted from both target DEMs as well as respective height residuals from some training subsets. The height residuals are calculated respective to available LiDAR over training data. After that, a refinement process is carried out to explore numerical feature-error relations between each type of extracted features and height residuals. Then, the refined feature-error relations are input into fully-connected neural networks to predict a weight map for each DEM. The predicted weight maps can be applied for weighted averaging-based fusion of the input Cartosat-1 and TanDEM-X DEMs. Figure 3 displays the designed pipeline for ANN-based fusion of TanDEM-X and Cartosat-1 DEMs.

2.2. TanDEM-X Raw DEM Fusion over Urban Areas

As mentioned earlier, another possibility to gather reliable height information is to fuse multi-modal TanDEM-X raw DEMs. The standard TanDEM-X DEM is the output of a processing chain consisting of interferometry, phase unwrapping (PU), data calibration, DEM block adjustment, and raw DEM mosaicking [26]. In the mosaicking step, raw DEMs are fused to reach the target accuracy. The fusion method is weighted averaging using weights derived from a height error map produced during the interferometry process. Evaluation demonstrates that weighted averaging does not perform well in urban areas. We proposed to use a more sophisticated fusion approach for fusing TanDEM-X raw DEMs in [27]. For this, we used variational models like TV-L 1 and Huber models and finally produced a high quality DEM over urban areas in comparison to weighted averaging. In this paper, we also apply TV-L 1 and Huber models for fusion of TanDEM-X raw DEMs over the study urban subset to improve height accuracy for 3D building reconstruction. A comparison between the multi-modal TanDEM-X DEM fusion process and the multi-sensor ANN-based fusion is depicted in Figure 3.

2.3. Heights from SAR-Optical Stereogrammetry

In the literature, a few papers can be found that deal with the combination of SAR and optical imagery for the 3D reconstruction of urban objects, e.g., [28]. In this research, we focus on the potential of 3D building reconstruction from very high-resolution SAR-optical image pairs such as TerraSAR-X/WorldView-2 through a dense matching process as a form of cooperative data fusion [21].
A full framework for stereogrammetric 3D reconstruction from SAR-optical image pairs was presented in our previous work [29] is displayed in Figure 4. It consists of several steps: generating rational polynomial coefficients (RPCs) for each image to replace the different physical imaging models by a homogenized mathematical model; RPC-based multi-sensor block adjustment to enhance the relative orientation between both images; establishing a multi-sensor epipolarity constraint to reduce the matching search space from 2D to 1D.
The core challenge in SAR-optical stereogrammetry is to find disparity maps between two images by using a dense matching algorithm. For the presented research, we have investigated the application of classical SGM for that purpose. SGM computes the optimum disparity maps by minimizing an energy functional which is constructed by a data and a fidelity term [30]. While the data term is defined by a similarity measure, the fidelity term employs two penalties to smooth the final disparity map. Because of aggregating cost values computed by a cost function in the heart of SGM along with a regularizing smoothness term, SGM is more robust and lighter than other typical dense matching methods [30], which can be ptentially applied for SAR-optical stereogrammetry. According to [31], pixel-wise Mutual information (MI), and Census are more appropriate for difficult illumination relationships than, e.g., normalized cross-correlation (NCC).

3. LOD1 Building Model Generation

The heights output by the different fusion approaches are then used for 3D building modeling and finally prismatic model generation. Due to the medium resolution of the input DEMs, only LOD1 models can be reconstructed from those heights; also the resolutions of the DEMs are not sufficient for detecting building outlines. As shown in Section 4.3, the point cloud resulting from SAR-optical stereogrammetry is partially sparse and consequently building outlines can not be recognized. One popular option is to exploit the building footprints layer provided by OpenStreetMap (OSM). Then, the heights of building outlines can be derived from either those fused DEMs or the point cloud achieved by SAR-optical stereogrammetry. Technically, this can be realized in two steps. The first step is to classify heights to those located inside and outside building outlines. Then, only points that are within building outlines are kept while the remaining points are discarded. After that, for each remaining height, the ID of the corresponding building (in which the height is located) is assigned. It facilitates the process of joining building footprints layer to heights.
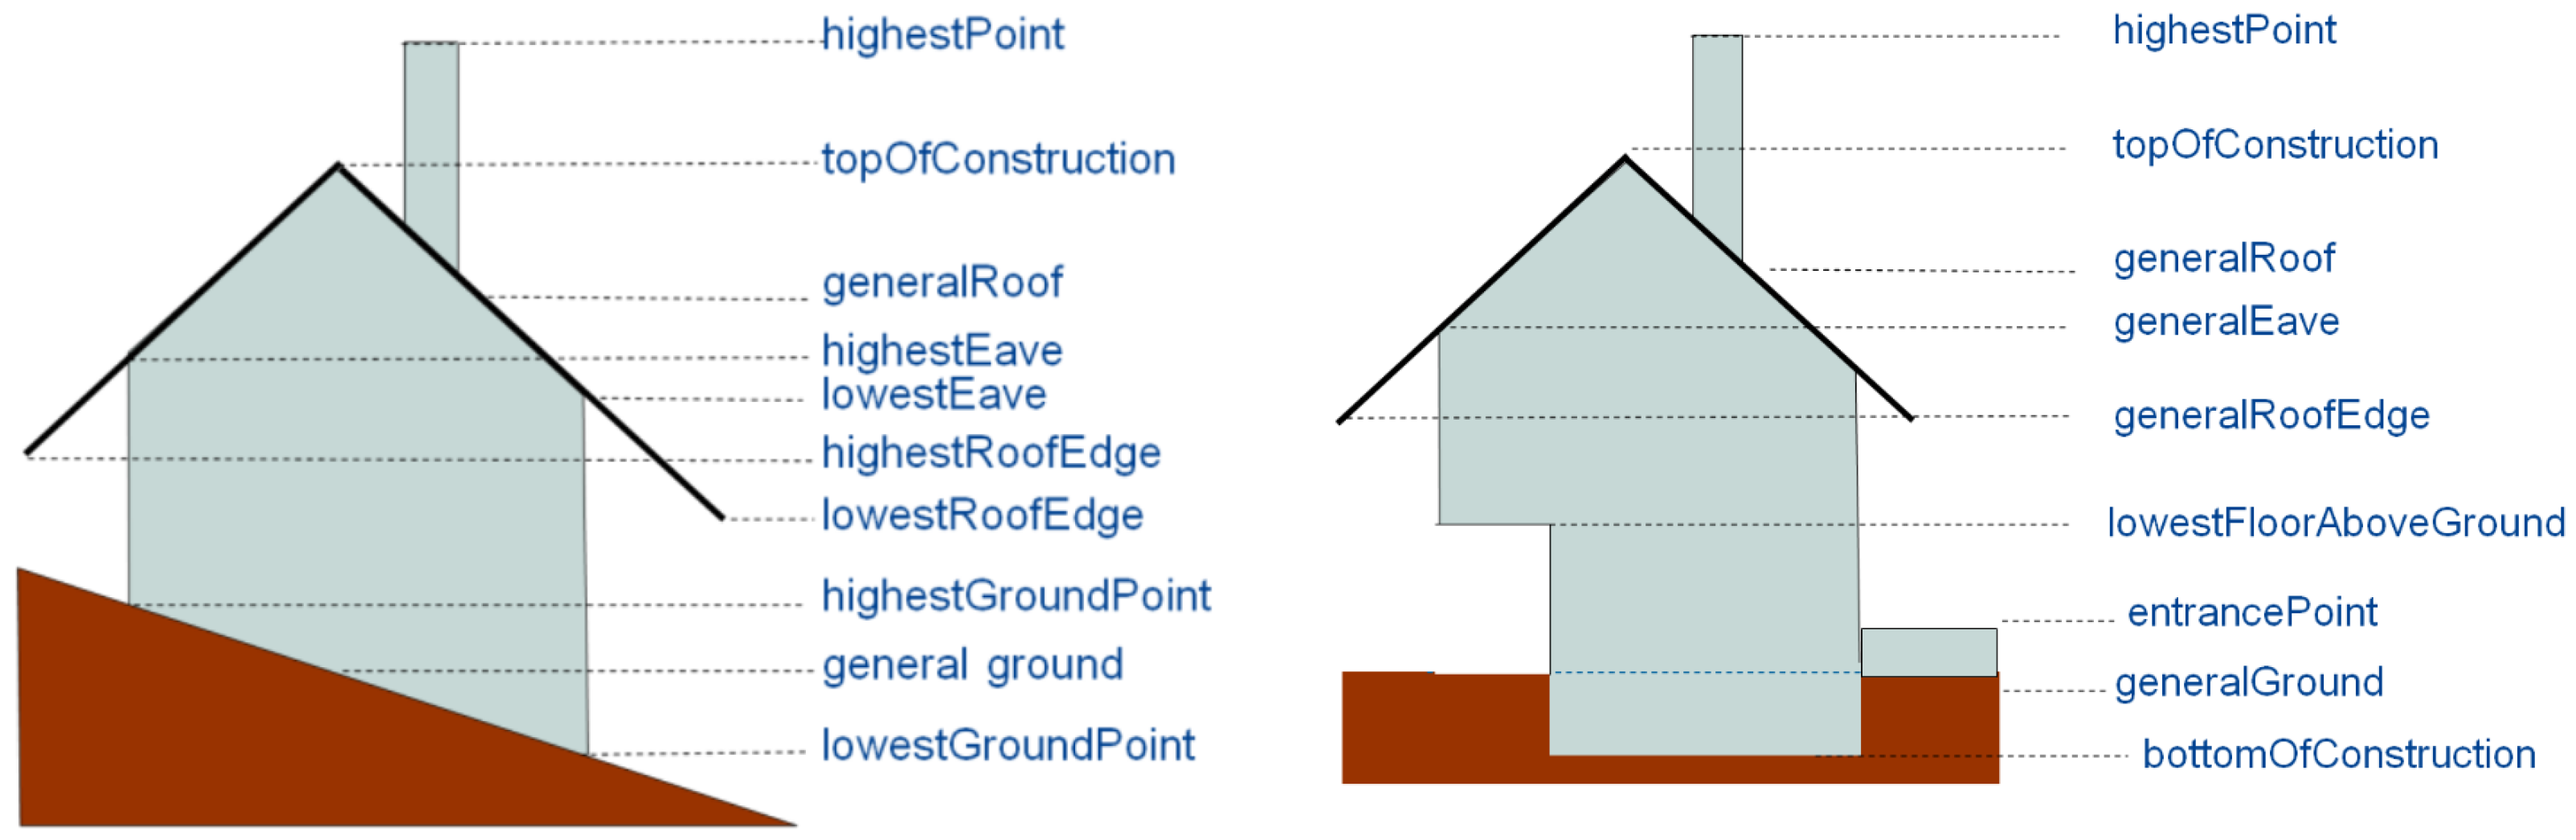
There are several elevation references that should be considered for estimating the building height within its outline [32]. These references are displayed in Figure 5. Three-dimensional reconstruction based on those levels can be realized by using high-resolution data such as LiDAR point clouds along with precise cadastral maps. Specifying those levels in medium resolution remote-sensing-derived heights, however, is not possible. Therefore, for LOD1 3D building reconstruction using medium resolution data such as those applied in this paper, we will only use median or mean of heights inside a building outline. The main advantage of median is its robustness against outliers in comparison to the mean measure. Thus, we propose that LOD1 models can be produced by modeling each building as a coarse volumetric representation using its outline and the median-based allocated height.
Furthermore, for LOD1 reconstruction, we will consider two scenarios. The first one is to model buildings based on the original footprint layers provided by OSM. The second is to update these building outlines in a pre-processing step. This updating has proved to be helpful, because of OSM building footprints often consist of several intra-blocks with different heights. As displayed in Figure 1, a building consisting of two blocks, each with different height level, may appear as an integrated building outline in OSM and thus, only one height value could be assigned for it in a simple LOD1 reconstruction process, while the outline should actually be split into two separate outlines. The result will be that the heights that actually lie in two separate clusters will erroneously be substituted by their median value located somewhere in the middle. While this ultimately leads to a significant height bias, modifying the outlines appropriately optimizes the final reconstruction. In this paper, this building modification is performed semi automatically: The candidate outlines are detected by clustering heights. The number of clusters determines the number of height levels and implies potential separate building blocks. Then, this is verified by visual comparison with open satellite imagery such as provided by Google Earth. Finally, the individual, newly separated building blocks are reconstructed by assigning separate median height values.
In addition to that, horizontal displacements of OSMs’ building footprints respective to highly accurate data such as LiDAR can also lead to a height bias. This phenomenon leads to an inclusion of non-building points to building outlines. Due to significant height differences between non-building and building points, the final height estimations are affected by an underestimation bias. To mitigate this effect, we use a buffer from the building outline inwards to make sure only building points are selected.

4. Test Data

In this paper, as explained in Section 2, the heights for 3D building reconstruction are provided by different sources. For the experiments, a study scene located in Munich, Germany, was selected because of the availability of high-quality LiDAR reference data. Figure 2a displays the considered study urban subset. The characteristics of the different input datasets used in the experiments are listed in following.
  • Cartosat-1 DEM: The Cartosat-1 DEM used in this study is produced from stacks of images acquired over the Munich area based on the pipeline described in [33]. The main characteristics of the Cartosat-1 DEM are expressed in Table 1.
  • TanDEM-X raw DEMs: In this study two tiles of TanDEM raw DEM acquired over Munich city are used. The properties of those tiles are represented in Table 2.
  • TerraSAR-X and WordView-2 images: For the experiment based on heights retrieved by SAR-optical stereogrammetry, a high-resolution TerraSAR-X/WorldView-2 image pair, acquired over the Munich test scene, is used. For the pre-processing, first, the SAR image was filtered by a non-local filter to reduce the speckle [35]. After that, they were resampled to 1 m × 1 m pixel size to homogenize the study scenes with respect to better similarity estimation. After multi-sensor bundle adjustment, sub-images from the overlapped part of the study area were selected. These sub-images are displayed in Figure 6. The specifications of the TerraSAR-X and WorldView-2 images are provided in Table 3.
  • LiDAR point cloud: High-resolution airborne LiDAR data serves for performance assessment and accuracy evaluation of 3D building reconstruction resulting from different height information sources. It is also used for measuring accuracy of data fusion outputs. The vertical accuracy of the LiDAR point cloud is better than ±20 cm and its density is higher than 1 point per square meter. Some preprocessing steps are implemented to prepare LiDAR data for the accuracy assessment in different experiments. Details are explained in corresponding sections.
  • Building footprints: The building footprints layer of the study area is provided by OpenStreetMap. The footprints layer is used in combination with heights derived from different sources for LOD1 3D reconstruction

4.1. Input DEM Generated by TanDEM-X and Cartosat-1 DEM Fusion

The first input data we used for LOD1 building model reconstruction, is a refined DEM resulting from a fusion of Cartosat-1 and TanDEM-X DEMs. As mentioned in Table 1, Cartosat-1 tiles are registered to highly accurate airborne orthophoto images to compensate horizontal misalignment. Before launching the TanDEM-X mission, Cartosat-1 tiles were vertically aligned with SRTM DEM as an almost global, open DEM. However, due to limited vertical accuracy of SRTM, TanDEM-X data can be substituted for vertical bias compensation of Cartosat-1 products. Thus, the alignment improves the vertical accuracy of the Cartosat-1 DEM. The evaluation illustrates that the absolute vertical accuracy of Cartosat-1 DEM increased more than 2 m. The evaluations were performed with respect to a LiDAR DSM created from the LiDAR point cloud by reducing and interpolating the 3D points into a 2.5D grid with a pixel spacing of 5 m. It should be noted that the TanDEM-X raw DEM is also converted into a 5 m pixel spacing DEM by interpolation. As we were able to show in [24], this fusion improves the final DEM quality; quantitative results for the test scene are repeated in Table 4.

4.2. Input DEM Generated by TanDEM-X Raw DEM Fusion

In the TanDEM-X mission, at least two primary DEMs are produced over all landmass tiles to reach the target relative accuracy [36]. This is realized by data fusion techniques such as weighted averaging. However, the weighted averaging performance is not optimal over urban areas. Therefore, in [27] we proposed to use efficient variational methods such as TV-L 1 and Huber models for fusing raw DEMs. We improved the height precision of the applied TanDEM-X raw DEM by employing another available tile (see Table 2). For this purpose, both TanDEM-X DEMs are converted to DEMs with pixel spacing of 6 m. The fusion performances using weighted averaging and variational models are shown in Figure 7. The quantitative results are collected in Table 5. Those evaluations are carried out with respect to a LiDAR DEM with 6 m pixel spacing achieved from the input LiDAR point cloud by interpolation.
As illustrated in Figure 7 and Table 5, the fusion can improve the quality of TanDEM-X raw DEMs. It becomes apparent that variational models, especially TV-L 1 , outperform conventional weighted averaging model.

4.3. Input Point Cloud Generated by SAR-Optical Stereogrammetry

In [29], we have shown that by implementing a SAR-optical stereogrammetry framework for the TerraSAR-X and WorldView-2 image pairs, a sparse point cloud can be produced as a product of cooperative data fusion. A stereogrammetrically generated point cloud using MI as a similarity measure is shown in Figure 8.
To validate the accuracy of the resulting 3D point clouds, we employed the accurate airborne LiDAR point cloud described in Section 4. For accuracy calculation, after Least Square (LS) plane fitting on k (here: k = 6 points) nearest neighbors of each target point in the reference point cloud [37], the Euclidean distance between the target point to the fitted reference plane was measured along different directions. Table 6 summarizes accuracy assessments of the reconstructed point clouds using MI similarity measures along different coordinate axes by LS plane fitting. Additionally, the mean absolute difference between the achieved point cloud respective to the LiDAR data is applied for total accuracy evaluation.

5. Result of LOD1 Building Model Reconstruction

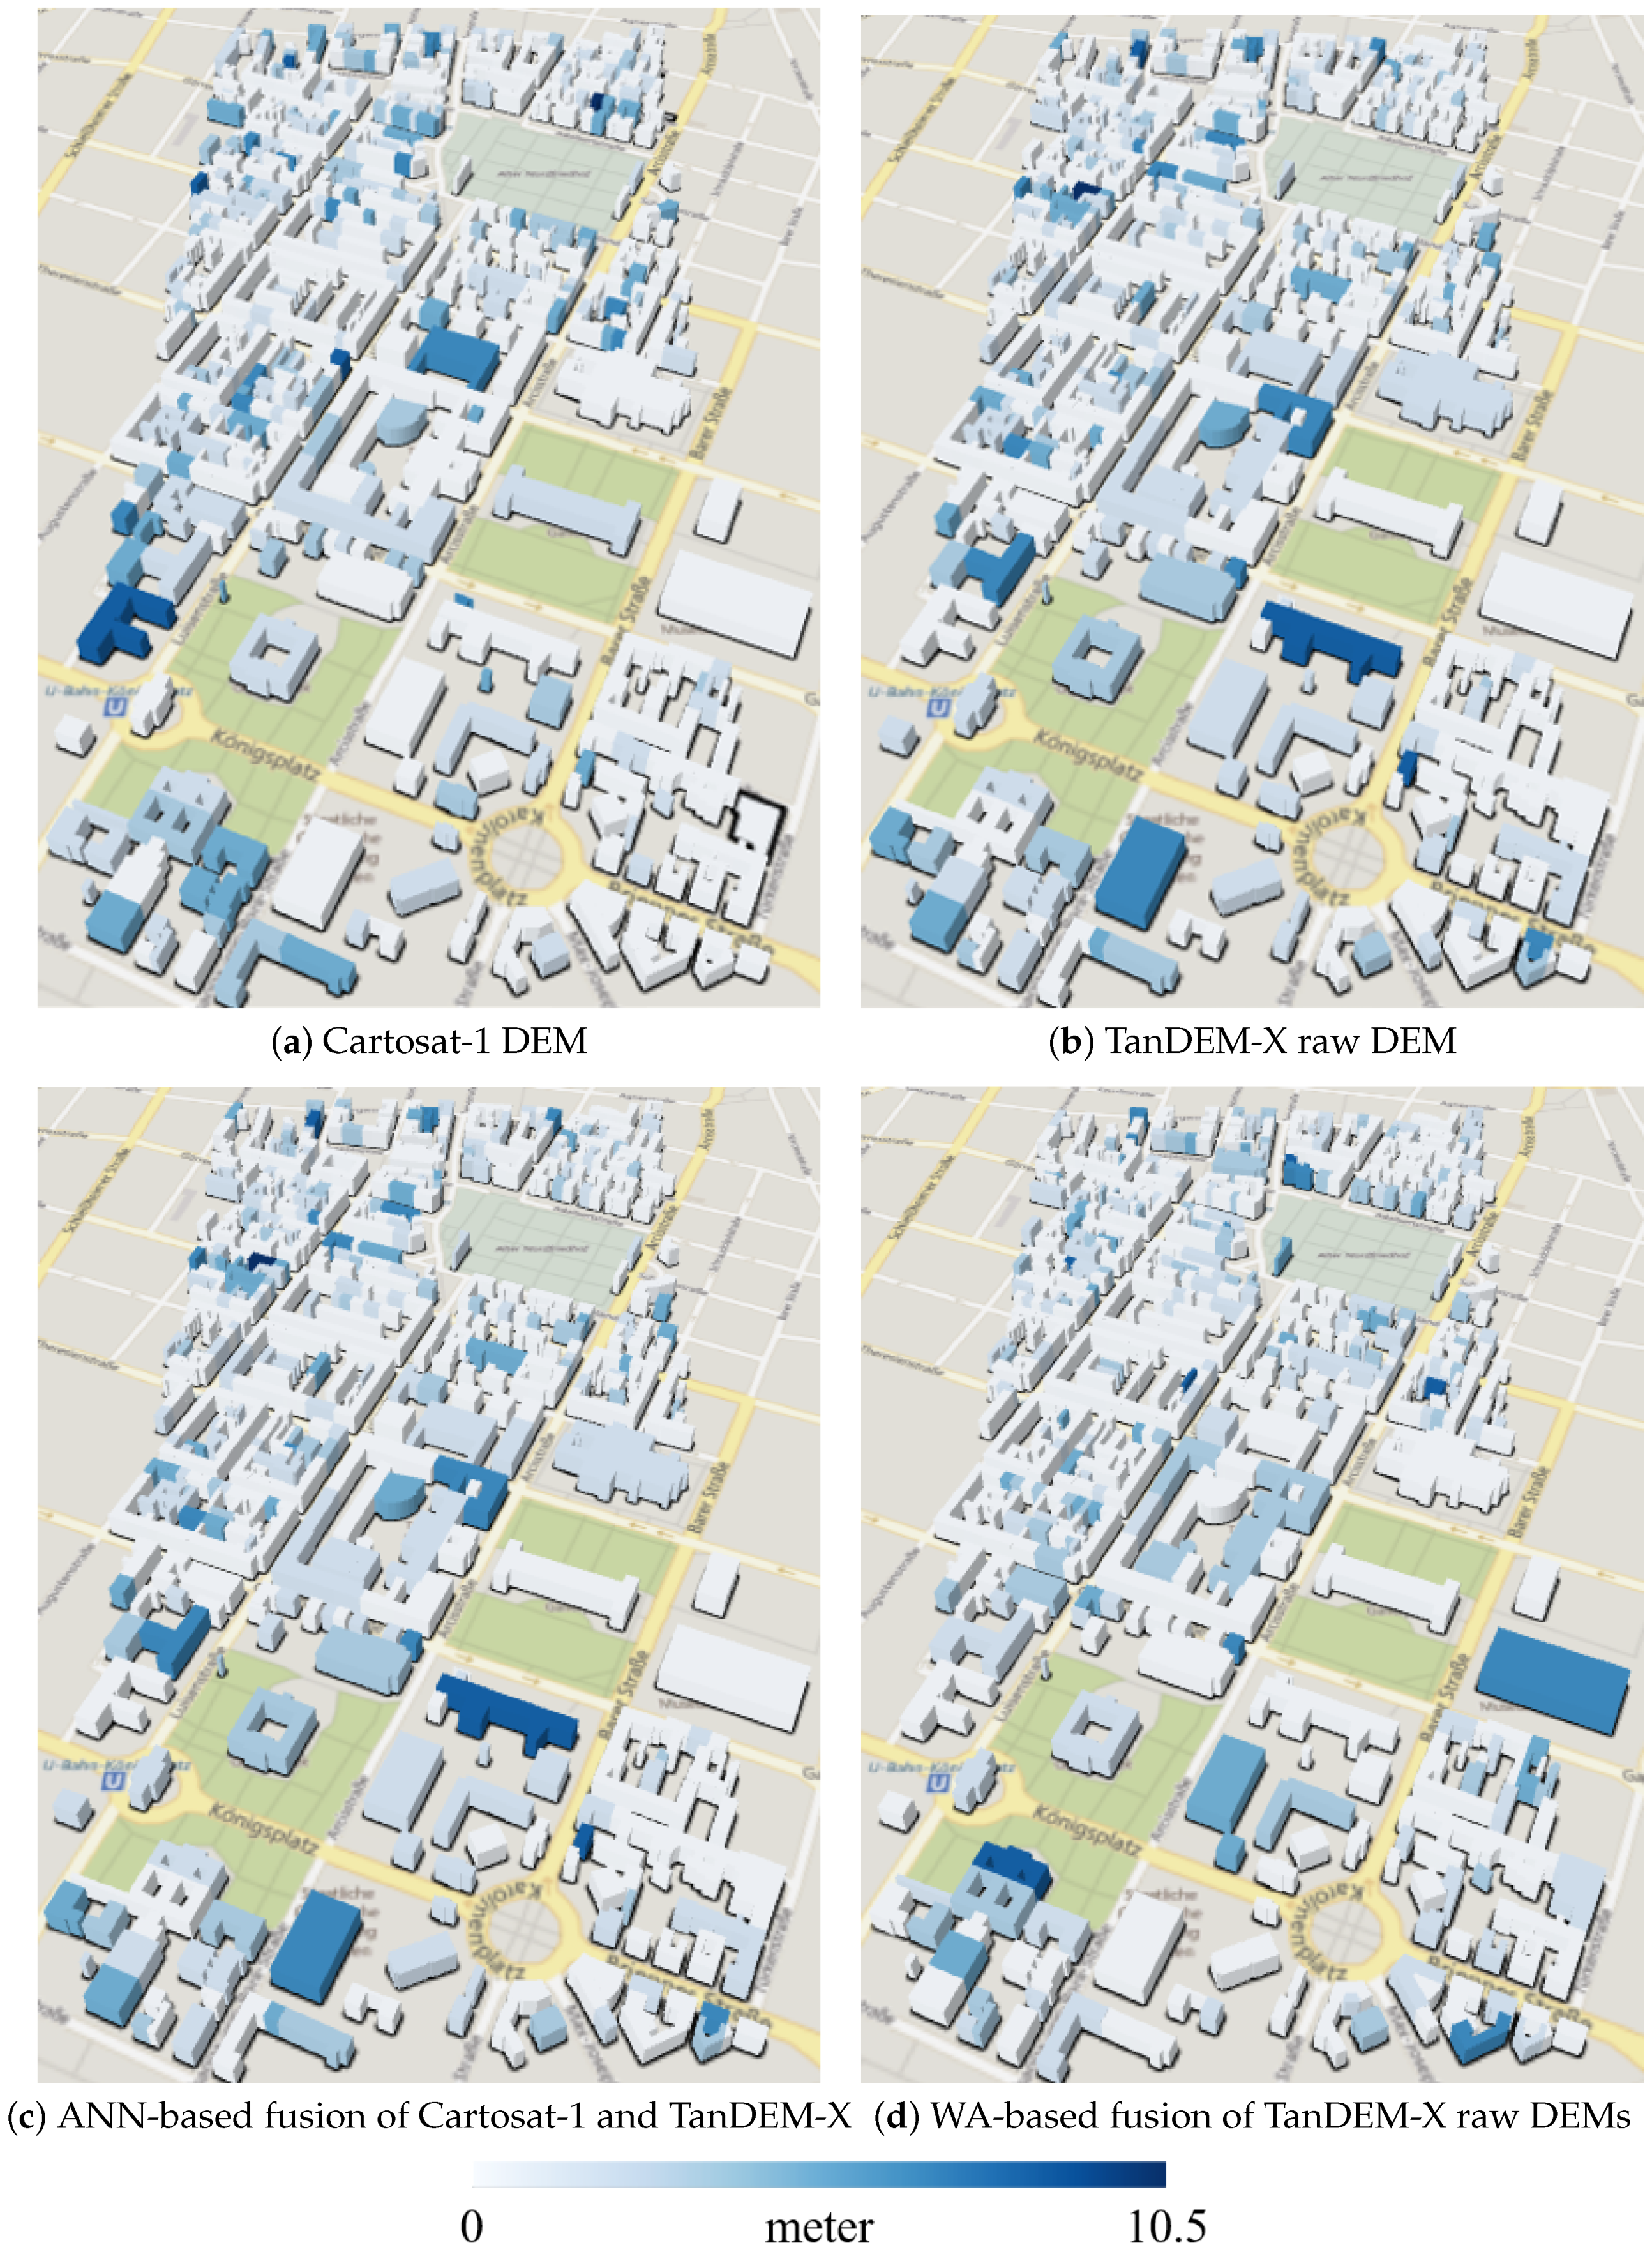
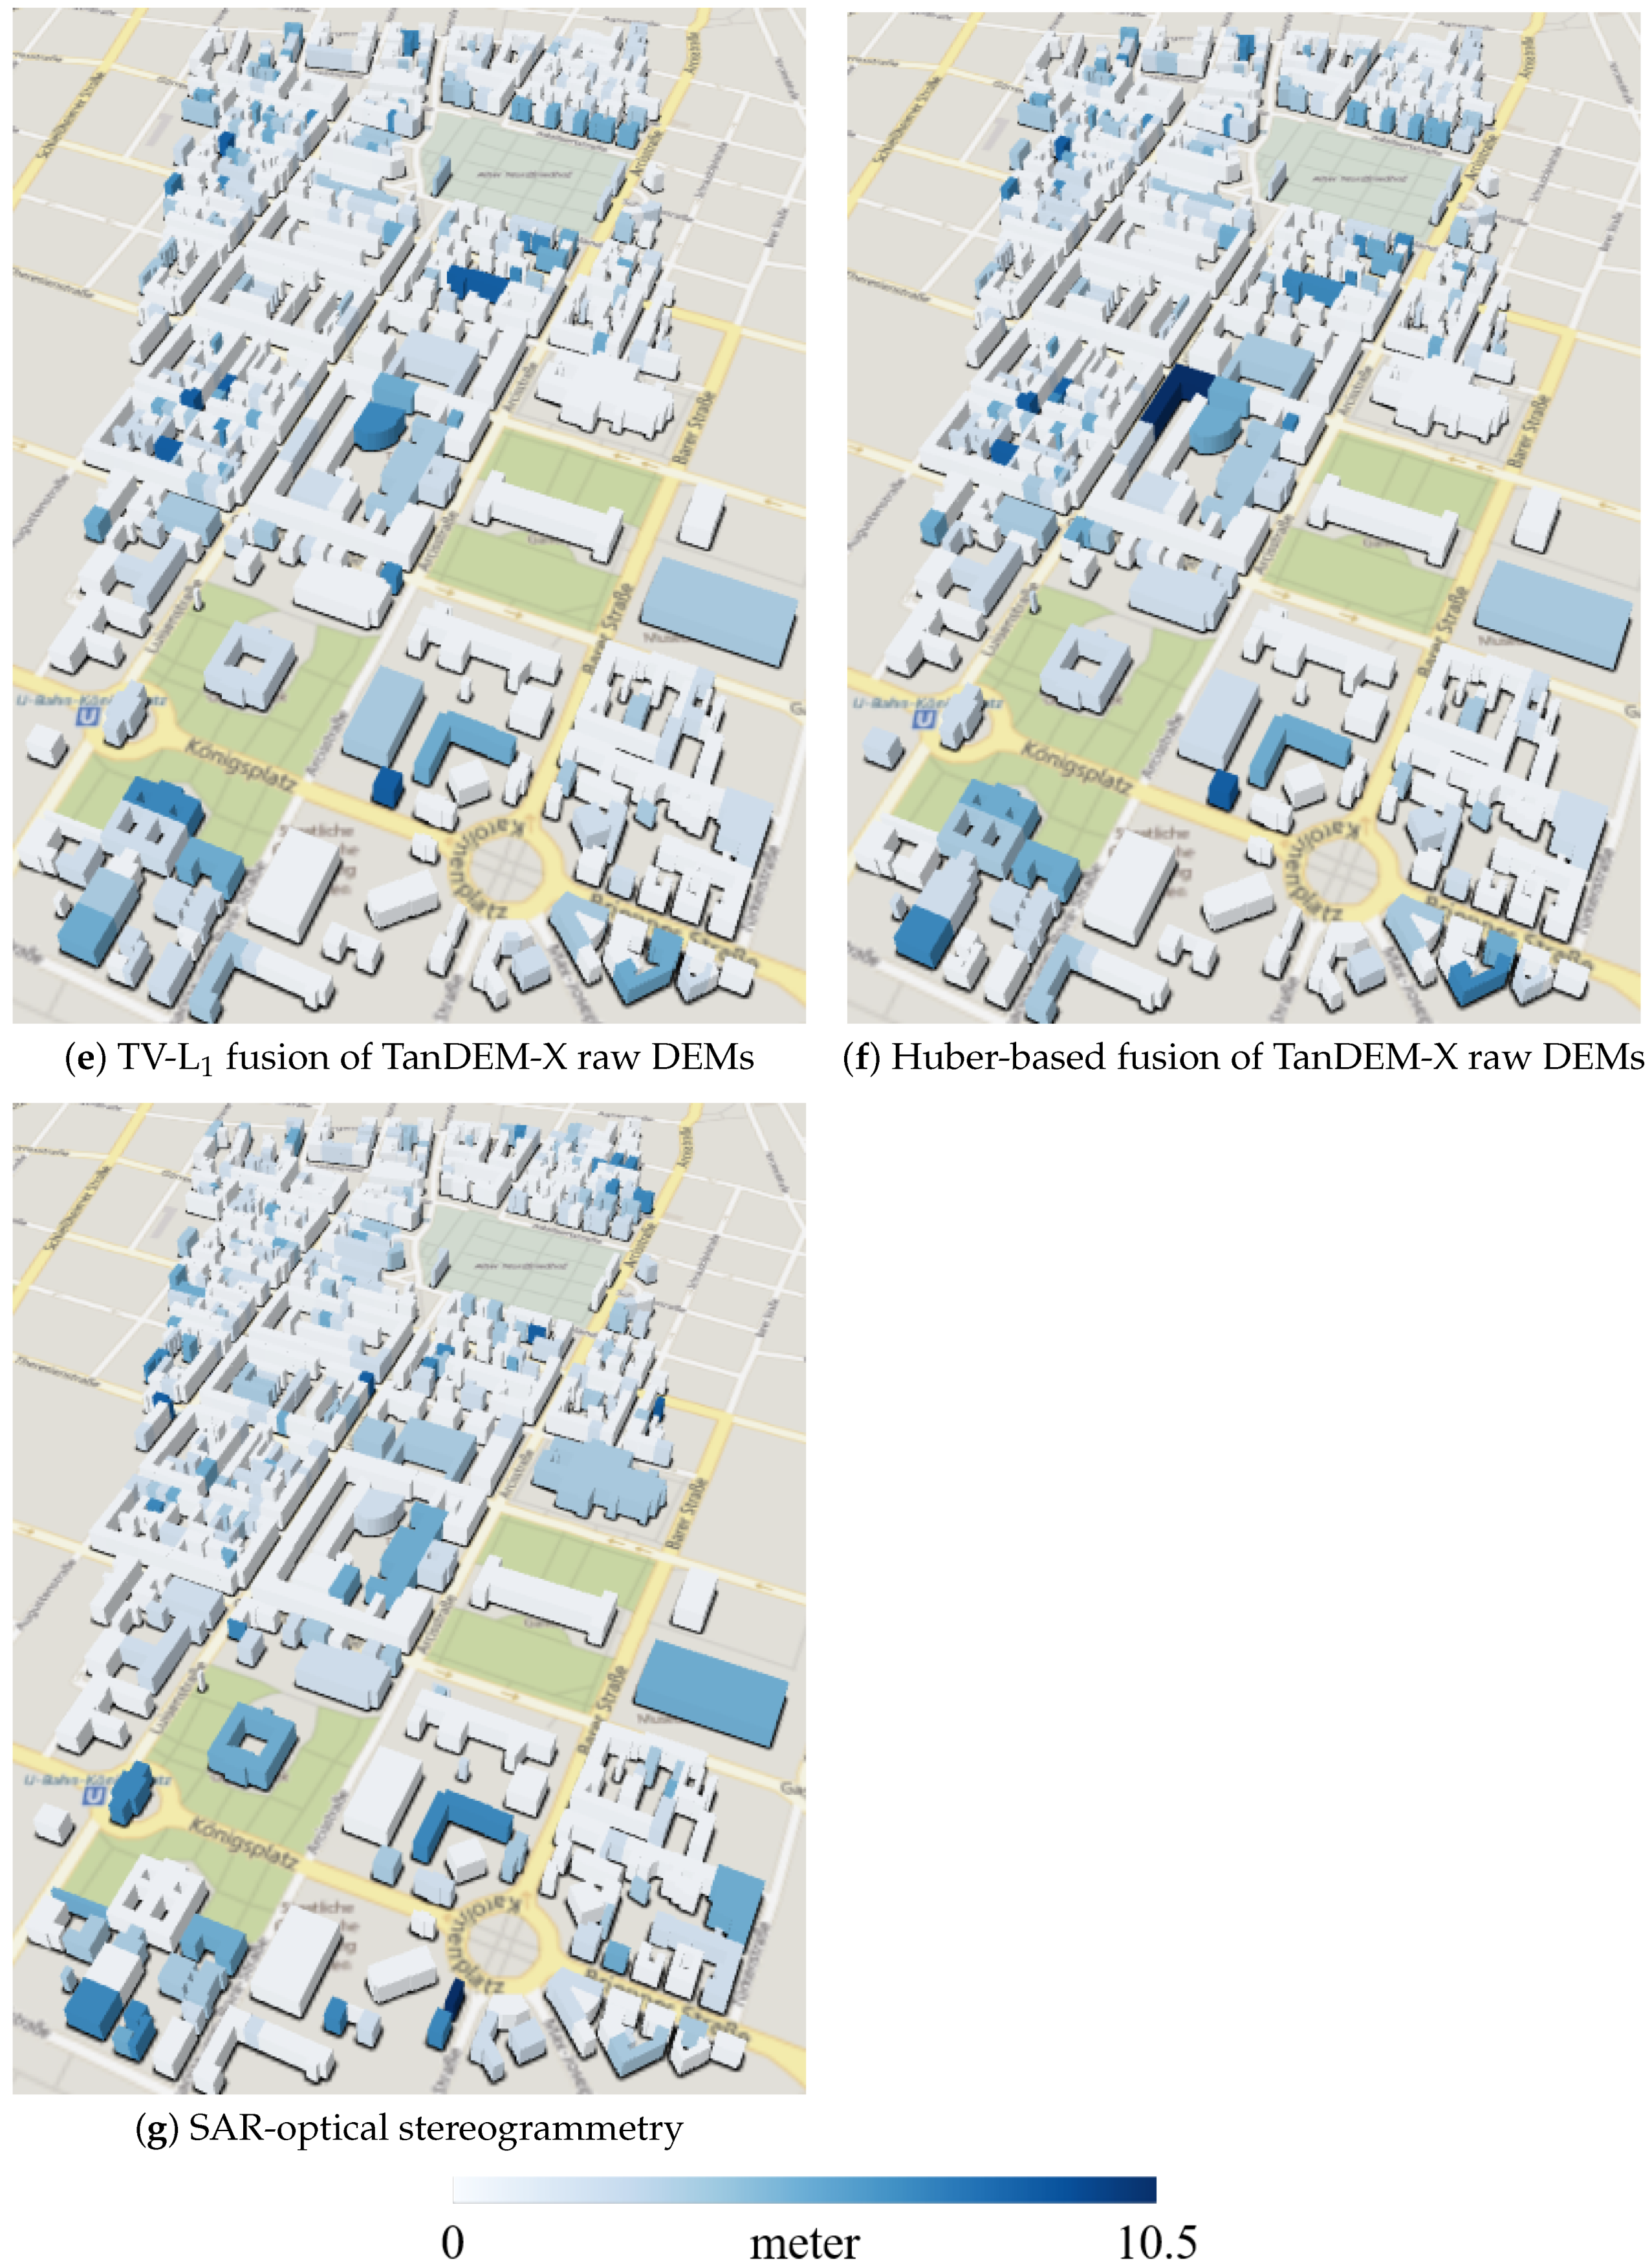
Figure 9 displays LOD1 3D reconstruction results for the study area consisting of prismatic building models generated by combining the height information derived from different sources discussed in the previous sections and building footprints provided by OpenStreetMap. As displayed in Figure 9, on average, all models are systematically biased in comparison to a model produced from high-resolution LiDAR data. However, this bias becomes minimum for a model using heights derived from SAR-optical stereogrammetry, as can be seen when comparing large buildings. However, for better evaluation, quantitative assessment should be performed. Therefore, the height accuracy of each LOD1 model was validated by comparing it with a model was created from the reference LiDAR DSM in a similar manner. For that purpose, we first interpolated the original LiDAR point cloud to a grid with a 1 m pixel spacing. Then, we used TV-L 1 denoising [27] to reduce potential noise effects. This TV-L 1 denoising mitigates biases in building height estimation induced by height outliers and inconsistencies such as those caused by crane-towers. As described in [27], TV-L 1 comprises two terms: a fidelity term and a penalty term. The effect of each term on the final output can be tuned by regularization parameters as weighting factors. Using a higher weight devoted to the penalty term will lead to better edge-preservation. Thus, we used the double weight for the penalty term to enhance urban structures. Then, the final height estimate within each building outline can be computed according to the process described in Section 3. The same process can be applied for the quality measurements of the 3D building reconstructions obtaining from other height information sources. The quantitative evaluations for the LOD1 reconstructions implemented based on scenario 1 (using original OSM) and 2 (using updated outlines) are presented in Table 7 and Table 8, respectively.

6. Discussion

6.1. Multi-Sensor Fusion for Height Exploitation

In this research, we employed different sensor fusion techniques to use heights as a requirement for 3D building reconstruction. Two categories of techniques were used to improve the quality of TanDEM-X DEM as a global DEM. In the first method, using Cartosat-1 DEM could improve the quality of TanDEM-X. During DEM fusion, the issue of low absolute localization accuracy of Cartosat-1 DEM could be solved. It is also recommended to use TanDEM-X as an external DEM during the Cartosat-1 DEM generation to compensate bias existing in the sensor geometry. As a drawback, the Cartosat-1 data is not globally available such as TanDEM-X. Furthermore, due to different natures of TanDEM-X and Cartosat-1 DEMs, we implemented an ANN-based algorithm which utilizes both feature engineering and supervised training for weight map prediction. The weight maps are used for weighted averaging-based fusion to integrate TanDEM-X and Cartosat-1 DEMs. Nevertheless, the training samples do not necessarily exist in an arbitrary study area. The next possibility is to use other TanDEM-X covers acquired through the mission to guarantee target relative accuracy. For this, we implemented variational models to smooth noise appearing in DEMs while preserving the building outlines. The main advantage of variational techniques is that they do not need highly accurate training samples such as those derived from LiDAR data. In addition, it only employs TanDEM-X raw DEM tiles and does not require a higher quality DEM such as that derived from Cartosat-1 data. However, by comparing quantitative results represented in Table 4 and Table 5 using different metrics, it is demonstrated that the first solution i.e., employing Cartosat-1 DEM and implementing ANN-based DEM fusion could ultimately generate a more accurate urban DEM.
Another opportunity for producing heights is to carry out stereogrametry for 3D reconstruction from archived SAR-optical image pairs such as TerraSAR-X and WorldView-2 images. The promising outputs demonstrated potential and possibility of 3D reconstruction from SAR-optical stereogrammetry. However, some development such as improving dense matching performance to produce a denser point cloud as well as noisy point and outlier removal are demanded.

6.2. LOD1 Building Reconstruction

After implementing data fusion techniques for height retrieval, we reconstructed building models using the derived heights and the building outlines provided by OSM. The achieved model is not a complete 3D city model since it provides building heights only. However, this model can be used for applications that require the building volume, which is not affected by the lack of information on the precise elevations of the building bottom/top. We investigated the reconstruction using original building outlines provided by OSM as well as using an updated building footprints layer. Regarding the median values in Table 7, using the original building outlines causes a bias affecting estimated final heights (RMSE values) while standard deviations are much smaller, thus confirming a systematic change in building heights. This bias can be significantly reduced by modifying building outlines in a preprocessing step (Table 8).
Using heights derived from outputs of multi-sensor DEM fusion can still lead to better reconstruction results in comparison to the primary TanDEM-X DEM. While the highest accuracy is obtained by Cartosat-1 data, it owes the accuracy to the bias compensation through the alignment to TanDEM-X. Without the alignment, the existing bias would be propagated to the final building heights.
Last but not least, it has to be mentioned that for generating a complete 3D city model, computing the height of the bottom and the top of a building along with the underlying terrain is required. Due to the limited the resolution of the height data utilized in this study, our focus did not lie on full 3D city model reconstruction but on simple prismatic building model reconstruction. For that purpose, we worked with the assumption of flat terrain at a constant height, which is valid in the selected study area. For a complete 3D city model, more accurate measurements of the terrain and the bottom of building elevations would be necessary.

7. Conclusions

In this research, we evaluated the potential of LOD1 3D reconstruction using data from remote-sensing-derived geodata and volunteered geographic information (VGI). For this purpose, we used heights derived from sources provided for global mapping such as those produced through the TanDEM-X mission. We implemented two DEM fusion experiments to improve the quality of TanDEM-X in urban areas. First is to fuse the TanDEM-X and Cartosat-1 DEMs using corresponding weight maps generated through a supervised ANN-based pipeline. In the second experiment, multiple TanDEM-X raw DEMs are fused by variational models. The results confirm the quality improvement of TanDEM-X after DEM fusion. In another experiment, heights were from an archived TerraSAR-X and WorldView-2 image pair through a stereogrammetry framework. The output was a sparse point cloud with a promising accuracy. Since building outlines as an essential requirement for 3D reconstruction cannot be accurately recognized in those height sources, we employed outlines provided by OSM. It was also shown that the primary outlines are not perfect and should be modified and updated for an accurate reconstruction. The final results demonstrate the possibility of prismatic building model generation (at LOD1 level) on a wide area from easily accessible, remote sensing-derived geodata.

Author Contributions

Conceptualization, Hossein Bagheri, Michael Schmitt, and Xiaoxiang Zhu; Methodology, Hossein Bagheri; Software, Hossein Bagheri; Data Curation and Investigation, Hossein Bagheri; Writing Hossein Bagheri; Review and editing, Michael Schmitt, and Xiaoxiang Zhu; Supervision, Michael Schmitt, and Xiaoxiang Zhu; Project Administration, Michael Schmitt; Funding Acquisition, Hossein Bagheri, Michael Schmitt; Resources, Xiaoxiang Zhu.

Funding

This work is jointly supported by the German Research Foundation (DFG) under grant SCHM 3322/1-1, the Helmholtz Association under the framework of the Young Investigators Group SiPEO (VH-NG-1018), and the European Research Council (ERC) under the European Union’s Horizon 2020 research and innovation programme (grant agreement No. ERC-2016-StG-714087, Acronym: So2Sat.

Acknowledgments

The authors would like to thank Donaubauer of the Chair of Geoinformatics of TUM for fruitful discussions about the CityGML standard and levels-of-detail for building models. In addition, they want to thank everyone, who has provided test data for this research: European Space Imaging for the WorldView-2 image, DLR for the TerraSAR-X images, the Bavarian Surveying Administration for the LiDAR reference data of Munich, Fritz and Baier of DLR for providing TanDEM-X raw DEMs, Reinartz and d’Angelo of DLR for providing the Cartosat-1 DEM.

Conflicts of Interest

The authors declare no conflict of interest. The funding sponsors had no role in the design of the study; in the collection, analyses, or interpretation of data; in the writing of the manuscript, or in the decision to publish the results.

References

  1. Biljecki, F.; Stoter, J.; Ledoux, H.; Zlatanova, S.; Çöltekin, A. Applications of 3D City Models: State of the Art Review. ISPRS Int. J. Geo-Inf. 2015, 4, 2842–2889. [Google Scholar] [CrossRef] [Green Version]
  2. Kolbe, T.H.; Gröger, G.; Plümer, L. CityGML: Interoperable Access to 3D City Models. In Geo-Information for Disaster Management; van Oosterom, P., Zlatanova, S., Fendel, E.M., Eds.; Springer: Berlin/Heidelberg, Germany, 2005; pp. 883–899. [Google Scholar] [Green Version]
  3. Biljecki, F.; Ledoux, H.; Stoter, J. An improved LOD specification for 3D building models. Comput. Environ. Urban Syst. 2016, 59, 25–37. [Google Scholar] [Green Version]
  4. Ledoux, H.; Meijers, M. Topologically consistent 3D city models obtained by extrusion. Int. J. Geogr. Inf. Sci. 2011, 25, 557–574. [Google Scholar] [CrossRef] [Green Version]
  5. Biljecki, F.; Ledoux, H.; Stoter, J.; Vosselman, G. The variants of an LOD of a 3D building model and their influence on spatial analyses. ISPRS J. Photogram. Remote Sens. 2016, 116, 42–54. [Google Scholar] [CrossRef] [Green Version]
  6. Kim, C.; Habib, A.; Chang, Y.C. Automatic generation of digital building models for complex structures from LiDAR data. Int. Arch. Photogram. Remote Sens. 2008, 37, 456–462. [Google Scholar]
  7. Buyukdemircioglu, M.; Kocaman, S.; Isikdag, U. Semi-Automatic 3D City Model Generation from Large-Format Aerial Images. ISPRS Int. J. Geo-Inf. 2018, 7, 339. [Google Scholar] [CrossRef]
  8. Gamba, P.; Houshmand, B.; Saccani, M. Detection and extraction of buildings from interferometric SAR data. IEEE Trans. Geosci. Remote Sens. 2000, 38, 611–617. [Google Scholar] [CrossRef] [Green Version]
  9. Biljecki, F.; Ledoux, H.; Stoter, J. Generating 3D city models without elevation data. Comput. Environ. Urban Syst. 2017, 64, 1–18. [Google Scholar] [CrossRef]
  10. Gröger, G.; Kolbe, T.H.; Nagel, C.; Häfele, K.H. OGC City Geography Markup Language (CityGML) Encoding Standard. Available online: https://www.opengeospatial.org/standards/citygml (accessed on 19 January 2019).
  11. Stoter, J.; Vosselman, G.; Dahmen, C.; Oude Elberink, S.; Ledoux, H. CityGML Implementation Specifications for a Countrywide 3D Data Set. Photogram. Eng. Remote Sens. 2014, 80, 1069–1077. [Google Scholar] [CrossRef]
  12. Arefi, H.; Engels, J.; Hahn, M.; Mayer, H. Levels of Detail in 3D Building Reconstruction from LiDAR Data. ISPRS Int. Arch. Photogram. Remote Sens. Spat. Inf. Sci. 2008, XXXVII-B3b, 485–490. [Google Scholar]
  13. Kolbe, T.H.; Burger, B.; Cantzler, B. CityGML Goes to Broadway; Photogrammetric Week ’15: Stuttgart, Germany, 2015; pp. 343–356. [Google Scholar]
  14. Stoter, J.; Roensdorf, C.; Home, R.; Capstick, D.; Streilein, A.; Kellenberger, T.; Bayers, E.; Kane, P.; Dorsch, J.; Woźniak, P.; et al. 3D Modelling with National Coverage: Bridging the Gap Between Research and Practice. In 3D Geoinformation Science: The Selected Papers of the 3D GeoInfo 2014; Breunig, M., Al-Doori, M., Butwilowski, E., Kuper, P.V., Benner, J., Haefele, K.H., Eds.; Springer International Publishing: Cham, Switzerland, 2015; pp. 207–225. [Google Scholar]
  15. Rajpriya, N.; Vyas, A.; Sharma, S. Generation of 3D Model for Urban area using Ikonos and Cartosat-1 Satellite Imageries with RS and GIS Techniques. Int. Arch. Photogram. Remote Sens. Spat. Inf. Sci. 2014, 40, 899–906. [Google Scholar] [CrossRef]
  16. Marconcini, M.; Marmanis, D.; Esch, T.; Felbier, A. A novel method for building height estmation using TanDEM-X data. In Proceedings of the 2014 IEEE Geoscience and Remote Sensing Symposium, Quebec City, QC, Canada, 14–18 July 2014; pp. 4804–4807. [Google Scholar]
  17. Nghiem, S.; Balk, D.; Small, C.; Deichmann, U.; Wannebo, A.; Blom, R.; Sutton, P.; Yetman, G.; Chen, R.; Rodriguez, E.; et al. Global Infrastructure: The Potential of SRTM Data to Break New Ground. Available online: https://www.researchgate.net/publication/228538455_Global_Infrastructure_The_Potential_of_SRTM_Data_to_Break_New_Ground (accessed on 19 January 2019).
  18. Gamba, P.; Dell Acqua, F.; Houshmand, B. SRTM data characterization in urban areas. Int. Arch. Photogram. Remote Sens. Spat. Inf. Sci. 2002, 34, 55–58. [Google Scholar]
  19. Quartulli, M.; Datcu, M. Information fusion for scene understanding from interferometric SAR data in urban environments. IEEE Trans. Geosci. Remote Sens. 2003, 41, 1976–1985. [Google Scholar] [CrossRef]
  20. Misra, P.; Avtar, R.; Takeuchi, W. Comparison of Digital Building Height Models Extracted from AW3D, TanDEM-X, ASTER, and SRTM Digital Surface Models over Yangon City. Remote Sens. 2018, 10, 2008. [Google Scholar] [CrossRef]
  21. Schmitt, M.; Zhu, X.X. Data Fusion and Remote Sensing: An ever-growing relationship. IEEE Geosci. Remote Sens. Mag. 2016, 4, 6–23. [Google Scholar] [CrossRef]
  22. Srivastava, P.K.; Srinivasan, T.; Gupta, A.; Singh, S.; Nain, J.S.; Prakash, S.; Kartikeyan, B.; Krishna, B.G. Recent Advances in CARTOSAT-1 Data Processing. Available online: https://www.researchgate.net/publication/242118849_Recent_advances_in_Cartosat-1_data_processing (accessed on 19 January 2019).
  23. Lehner, M.; Müller, R.; Reinartz, P.; Schroeder, M. Stereo evaluation of Cartosat-1 data for French and Catalonian test sites. In Proceedings of the ISPRS Hannover Workshop 2007: High Resolution Earth Imaging for Geospatial Information, Hannover, Germany, 2–5 June 2009. [Google Scholar]
  24. Bagheri, H.; Schmitt, M.; Zhu, X.X. Uncertainty assessment and weight map generation for efficient fusion of TanDEM-X and Cartosat-1 DEMs. ISPRS Int. Arch. Photogram. Remote Sens. Spat. Inf. Sci. 2017, XLII-1/W1, 433–439. [Google Scholar] [CrossRef]
  25. Bagheri, H.; Schmitt, M.; Zhu, X.X. Fusion of TanDEM-X and Cartosat-1 elevation data supported by neural network-predicted weight maps. ISPRS J. Photogram. Remote Sens. 2018, 144, 285–297. [Google Scholar] [CrossRef]
  26. Gruber, A.; Wessel, B.; Martone, M.; Roth, A. The TanDEM-X DEM Mosaicking: Fusion of Multiple Acquisitions Using InSAR Quality Parameters. IEEE J. Sel. Top. Appl. Earth Observ. Remote Sens. 2016, 9, 1047–1057. [Google Scholar] [CrossRef]
  27. Bagheri, H.; Schmitt, M.; Zhu, X.X. Fusion of Urban TanDEM-X Raw DEMs Using Variational Models. IEEE J. Sel. Top. Appl. Earth Observ. Remote Sens. 2018, 11, 4761–4774. [Google Scholar] [CrossRef]
  28. Wegner, J.D.; Ziehn, J.R.; Soergel, U. Combining High-Resolution Optical and InSAR Features for Height Estimation of Buildings With Flat Roofs. IEEE Trans. Geosci. Remote Sens. 2014, 52, 5840–5854. [Google Scholar] [CrossRef]
  29. Bagheri, H.; Schmitt, M.; d’Angelo, P.; Zhu, X.X. A Framework for SAR-Optical Stereogrammetry over Urban Areas. ISPRS J. Photogram. Remote Sens. 2018, 146, 389–408. [Google Scholar] [CrossRef] [PubMed]
  30. Hirschmüller, H. Stereo Processing by Semiglobal Matching and Mutual Information. IEEE Trans. Pattern Anal. Mach. Intell. 2008, 30, 328–341. [Google Scholar] [CrossRef] [PubMed] [Green Version]
  31. Hirschmuller, H.; Scharstein, D. Evaluation of Stereo Matching Costs on Images with Radiometric Differences. IEEE Trans. Pattern Anal. Mach. Intell. 2009, 31, 1582–1599. [Google Scholar] [CrossRef] [Green Version]
  32. D2.8.III.2 INSPIRE Data Specification on Buildings—Technical Guidelines. Technical Report, European Commission Joint Research Centre. 2013. Available online: https://inspire.ec.europa.eu/id/document/tg/bu (accessed on 19 January 2019).
  33. d’Angelo, P.; Lehner, M.; Krauss, T.; Hoja, D.; Reinartz, P. Towards Automated DEM Generation from High Resolution Stereo Satellite Images. ISPRS Int. Arch. Photogram. Remote Sens. Spat. Inf. Sci. 2008, 37, 1137–1342. [Google Scholar]
  34. The Federal Agency for Cartography and Geodesy of Germany (BKG). Digital Orthophotos. Available online: https://www.bkg.bund.de/SharedDocs/Downloads/BKG/DE/Downloads-DE-Flyer/AdV-DOP-DE (accessed on 17 September 2018).
  35. Deledalle, C.; Denis, L.; Tupin, F. Iterative Weighted Maximum Likelihood Denoising With Probabilistic Patch-Based Weights. IEEE Trans. Image Process. 2009, 18, 2661–2672. [Google Scholar] [CrossRef] [PubMed] [Green Version]
  36. Rizzoli, P.; Martone, M.; Gonzalez, C.; Wecklich, C.; Tridon, D.B.; Bräutigam, B.; Bachmann, M.; Schulze, D.; Fritz, T.; Huber, M.; et al. Generation and performance assessment of the global TanDEM-X digital elevation model. ISPRS J. Photogram. Remote Sens. 2017, 132, 119–139. [Google Scholar] [CrossRef]
  37. Mitra, N.J.; Nguyen, A.; Guibas, L. Estimating surface normals in noisy point cloud data. Int. J. Comput. Geom. Appl. 2004, 14, 261–276. [Google Scholar] [CrossRef]
Figure 1. Different levels of detail of building models according to OGC City Geography Markup Language (CityGML) 2.0 [10].
Ijgi 08 00193 g001
Figure 2. (a) Study subset selected over Munich, (b) Precision of the Cartosat-1 (left) and TanDEM-X (right) digital elevation models (DEMs) over an exemplary urban subset respective to high-resolution LiDAR data. Both DEMs were assessed with respect to a co-aligned LiDAR DEM.
Ijgi 08 00193 g002
Figure 3. Different DEM fusion modules for improving the TanDEM-X quality. Left: The proposed pipeline for TanDEM-X and Cartosat-1 DEM fusion, Right: Process of multi-modal TanDEM-X DEM fusion.
Ijgi 08 00193 g003
Figure 4. Framework for 3D reconstruction from synthetic aperture radar (SAR)-optical image pairs [29].
Ijgi 08 00193 g004
Figure 5. Examples of elevation references for different kinds of building [32].
Ijgi 08 00193 g005
Figure 6. Display of SAR-optical sub-scenes extracted from Munich study areas (the left-hand image is from WorldView-2, the right-hand image is from TerraSAR-X).
Ijgi 08 00193 g006
Figure 7. Absolute residual maps of the initial input raw DEMs and the fused DEMs obtained by different approaches for the study area over Munich.
Ijgi 08 00193 g007
Figure 8. Achieved point cloud from stereogrammetric 3D reconstruction of TerraSAR-X/WorldView-2 over the Munich study subset.
Ijgi 08 00193 g008
Figure 9. Level-of-detail 1 (LOD1) reconstructions of the study urban scene using heights derived from different sources and building outlines obtained from building foot prints layer of OpenStreetMap (OSM). Colors indicate absolute height residuals.
Ijgi 08 00193 g009aIjgi 08 00193 g009b
Table 1. Properties of Cartosat-1 tile. For more information about BKG orthophotos, please refer to [34].
Cartosat-1 DEM
Stereoscopic angle31
Max number of rays11
Min number of rays2
Horizontal referenceBKG orthophotos
Vertical referenceSRTM DEM
Pixel spacing5 m
Mean height error (1 σ )2–3 m
Table 2. Properties of the nominal TanDEM-X raw digital elevation models (DEMs) tiles for the Munich area.
TanDEM-X Raws DEMs: Munich Area
Acquisition Id10234911145180
Acquisition modeStripmapStripmap
Center incidence angle38.25 37.03
Equator crossing directionAscendingAscending
Look directionRightRight
PolarizationHHHH
Height of ambiguity45.81 m53.21 m
Pixel spacing0.2 arcsec0.2 arcsec
HEM mean1.33 m1.58 m
Table 3. Specifications of the TerraSAR-X and WorldView-2 images.
SensorAcquisition ModeOff-Nadir Angle ( )Ground Pixel Spacing (m)Acquisition Date
TerraSAR-XSpotlight22.990.85 × 0.4503.2015
WorldView-2Panchromatic5.200.50 × 0.5007.2010
Table 4. Accuracy (in meter) of Cartosat-1 and TanDEM-X DEM fusion in the urban study subset over Munich. The bold values indicate the best results which were obtained through the proposed DEM fusion pipeline.
DEMMeanRMSESTD
Raw DEMCartosat-1−0.685.275.23
TanDEM-X−0.366.436.42
Fused DEMANN-based−0.555.024.98
Table 5. Height accuracy (in meters) of the TanDEM-X data before and after DEM fusion in the study area over Munich. The bold values indicate the best results which obtained through the TV- L 1 -based fusion.
DEMMeanRMSESTD
Fused DEMWA0.847.517.46
TV- L 1 0.776.116.06
Huber0.786.146.09
Table 6. Accuracy assessment of reconstructed point clouds using different similarity measures with respect to LiDAR reference.
Similarity MeasuresMean (m)STD (m)RMSE (m)Mean (m)
XYZXYZXYZd
MI0.00−0.040.271.571.693.091.571.693.102.75
Table 7. Quantitative evaluations (in meters) of the level-of-detail 1 (LOD1) reconstructions of the urban scene using heights derived from different sources along with original building outlines of OpenStreetMap (OSM).
ElevationsMedianRMSESTD
input DEMCartosat-18.6310.014.67
TanDEM-X9.6810.164.28
Fused DEMANN-based: Cartosat-1 and TanDEM-X9.569.974.28
Weighted Averaging:TanDEM-X7.919.54.81
TV- L 1 : TanDEM-X8.948.953.82
Huber: TanDEM-X8.9793.83
SAR-optical stereogrammetryTerraSAR-X/WordlView-26.519.735.83
Table 8. Quantitative evaluations (in meters) of the LOD1 reconstructions of the urban scene using heights derived from different sources along with modified building outlines of OSM.
ElevationsMedianRMSESTD
input DEMCartosat-1−0.962.852.27
TanDEM-X−0.933.432.83
Fused DEMANN-based: Cartosat-1 and TanDEM-X−0.923.092.48
Weighted Averaging:TanDEM-X−0.722.812.5
TV- L 1 : TanDEM-X−0.682.862.56
Huber: TanDEM-X−0.672.962.64
SAR-optical stereogrammetryTerraSAR-X/WorldView-2−0.293.613.57

