How Data-Poor Countries Remain Data Poor: Underestimation of Human Settlements in Burkina Faso as Observed from Nighttime Light Data


Abstract
1. Introduction
2. Literature and Background
3. Materials and Methods
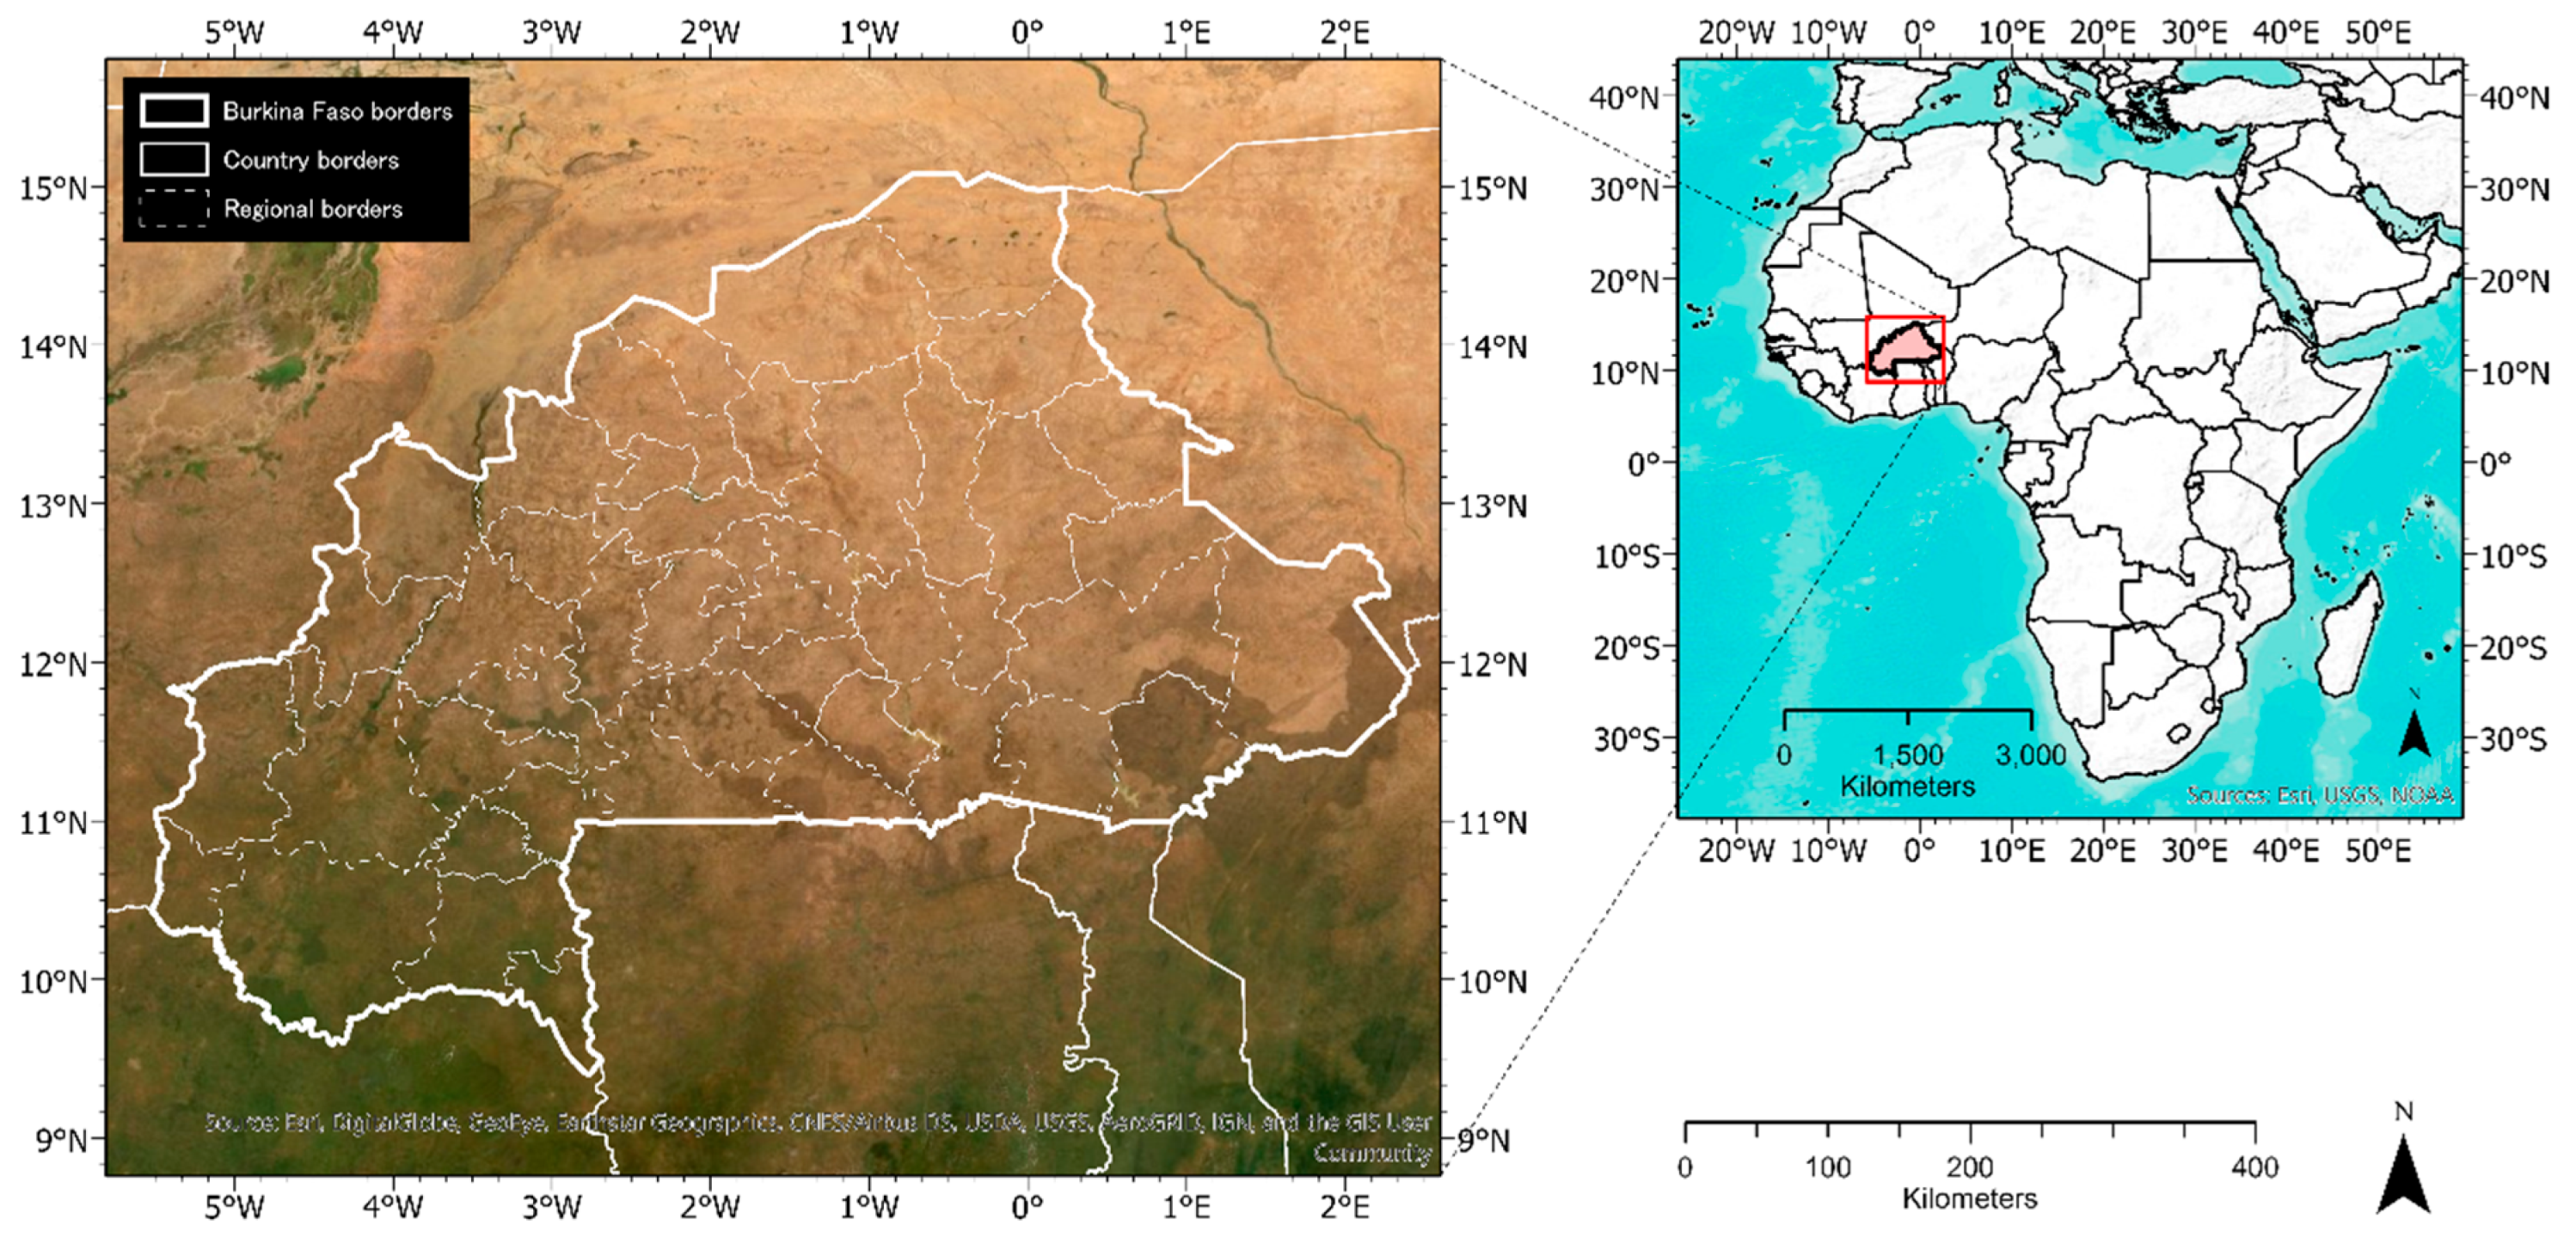
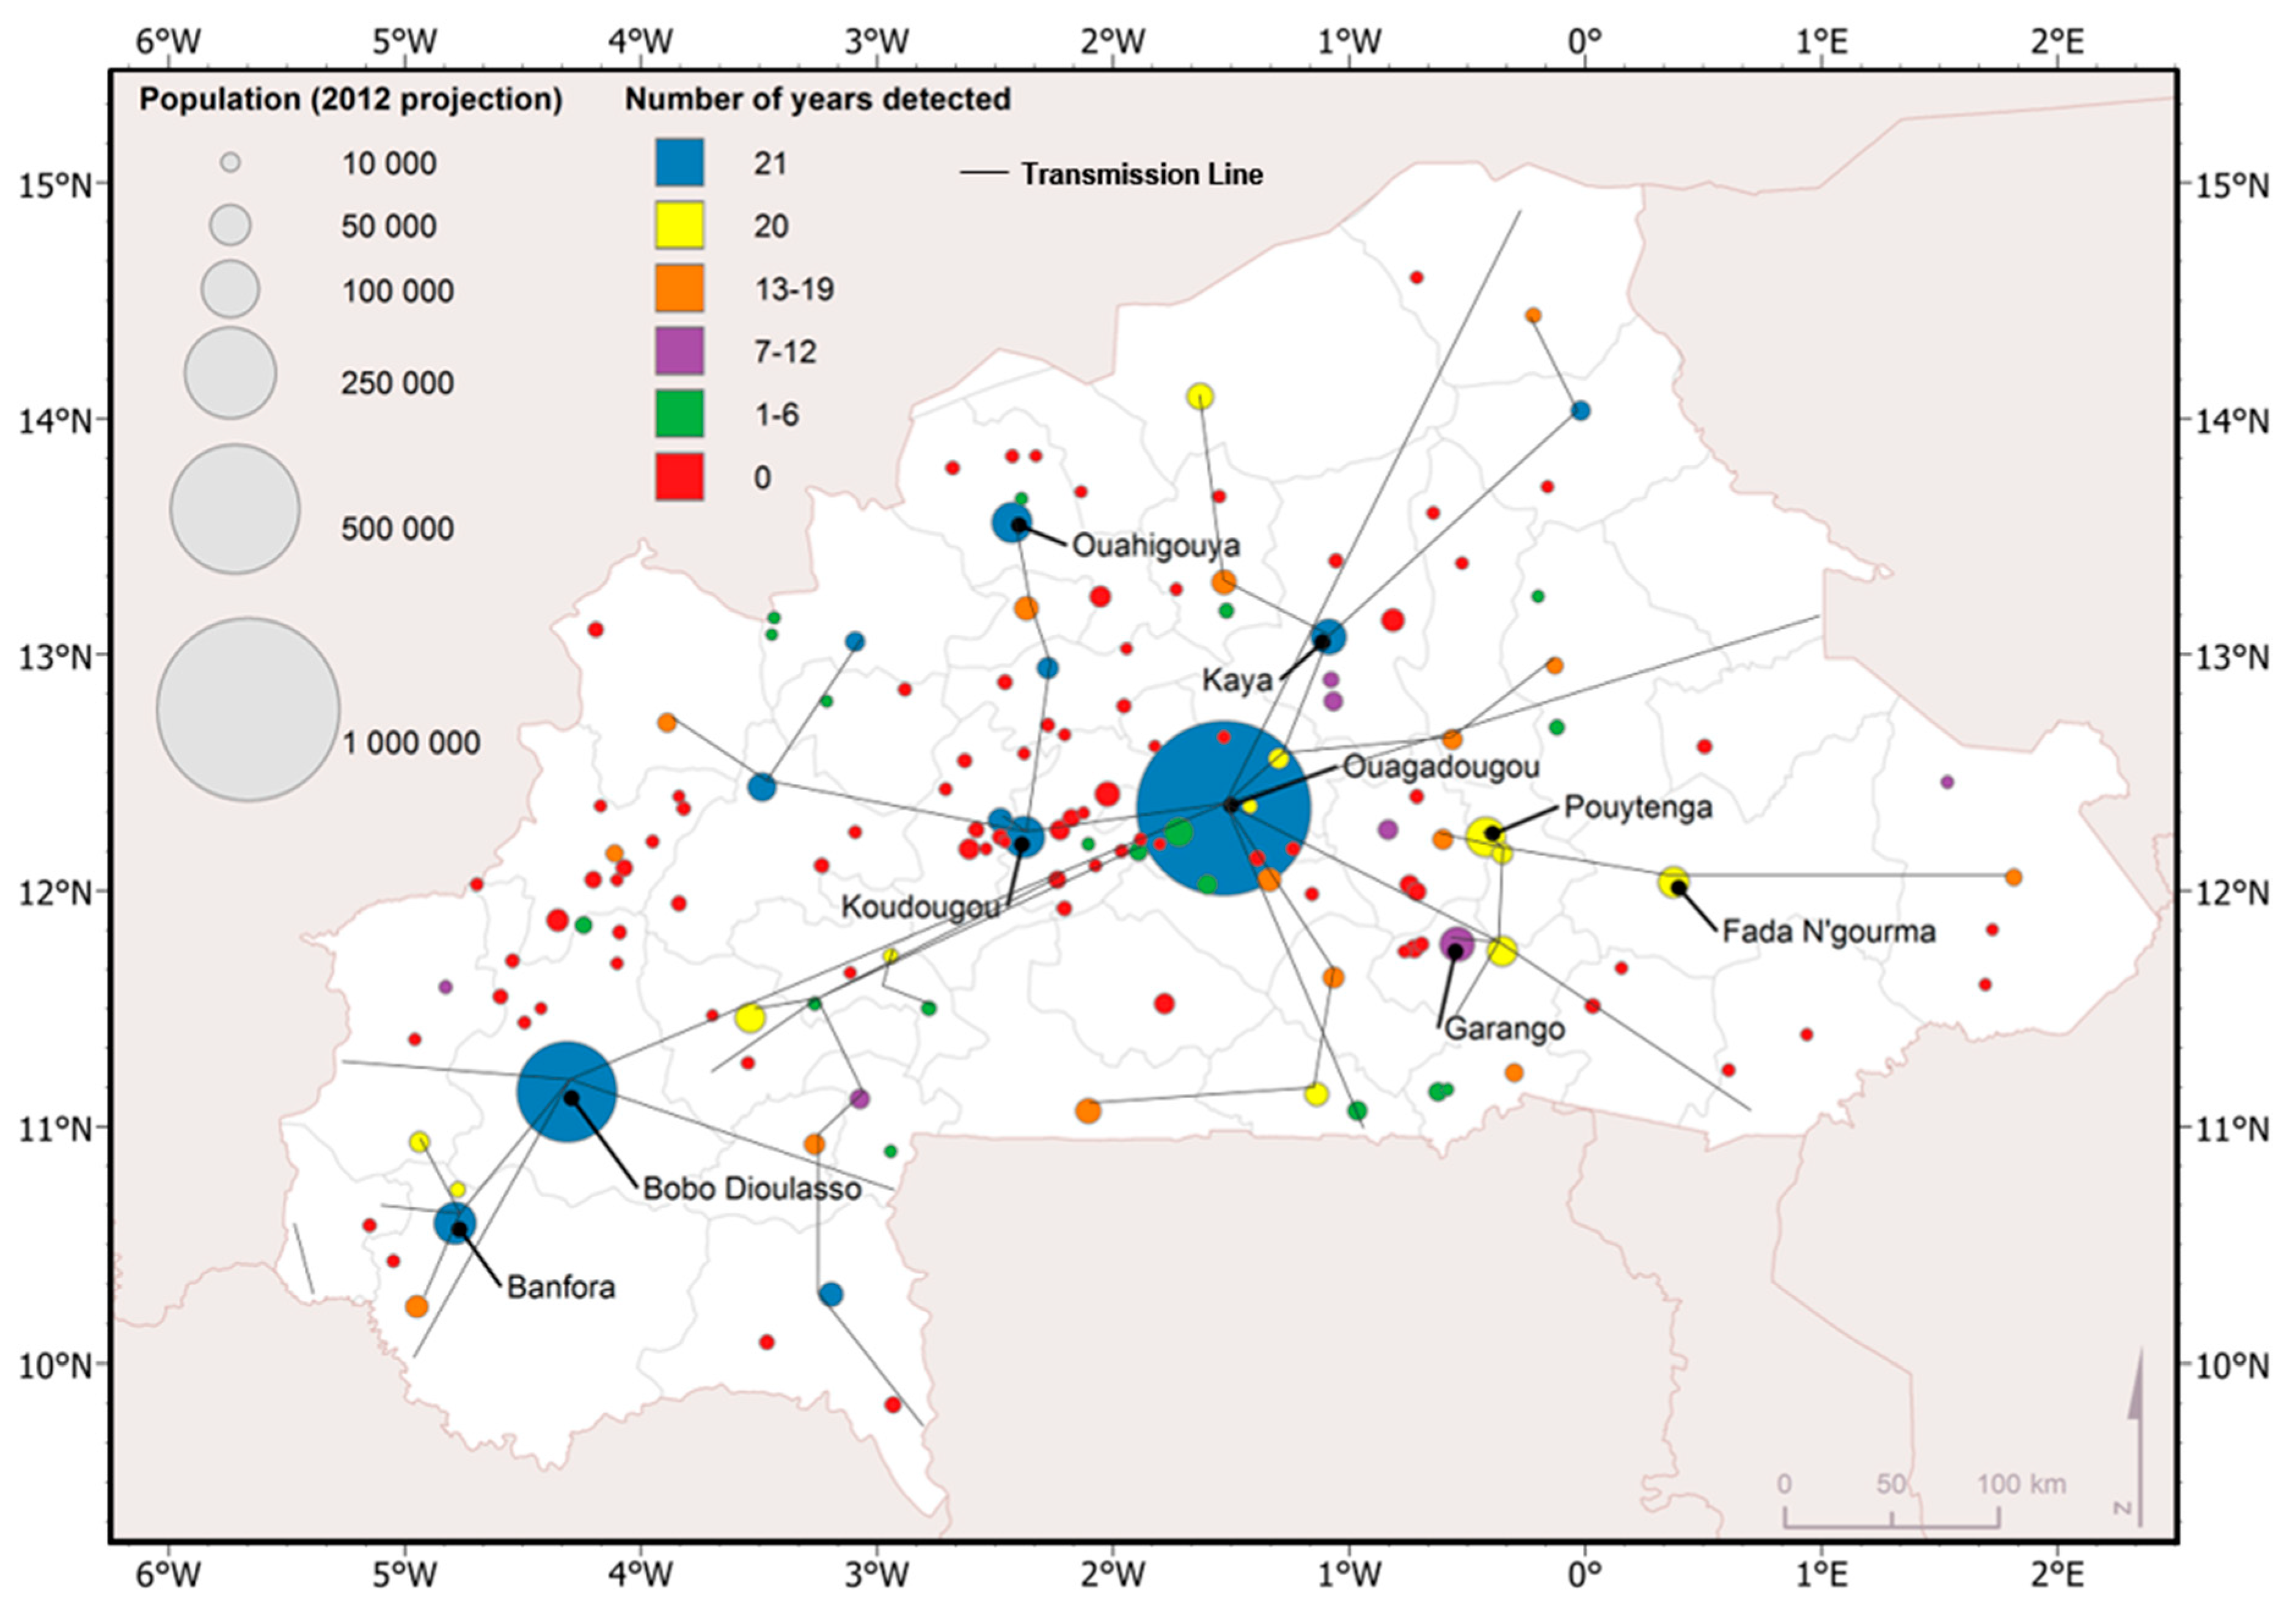
3.1. Study Area
3.2. Data and Methods
4. Results
4.1. Detection of Communities using DMSP-OLS and VIIRS-DNB
4.2. Access to Electricity and Rate of Detection
5. Discussion
6. Conclusions
Author Contributions
Funding
Conflicts of Interest
References
- Keola, S.; Andersson, M.; Hall, O. Monitoring economic development from space: Using nighttime light and land cover data to measure economic growth. World Dev. 2015, 66, 322–334. [Google Scholar] [CrossRef]
- Gallup, J.L.; Sachs, J.D.; Mellinger, A.D. Geography and Economic Development. Int. Reg. Sci. Rev. 1999, 22, 179–232. [Google Scholar] [CrossRef]
- Maddison, A. Monitoring the World Economy, 1820–1992; Organization for Economic Cooperation and Development: Paris, France, 1995. [Google Scholar]
- Barro, R.J. Economic growth in a cross-section of countries. Q. J. Econ. 1991, 106, 407–443. [Google Scholar] [CrossRef]
- Nordhaus, W.D. Geography and marcoeconomics: New data and new findings. Proc. Natl. Acad. Sci. USA 2006, 103, 3510–3517. [Google Scholar] [CrossRef] [PubMed]
- Henderson, J.V.; Storeygard, A.; Weil, D.N. Measuring economic growth from outer space. Am. Econ. Rev. 2012, 102, 994–1028. [Google Scholar] [CrossRef]
- Johnson, S.; Larson, W.; Papageorgiou, C.; Subramanian, A. Is newer better? Penn World Table Revisions and their impact on growth estimates. J. Monet. Econ. 2013, 60, 255–274. [Google Scholar] [CrossRef]
- Ravallion, M.; Chen, S. When Economic Reform is Faster than Statistical Reform: Measuring and Explaining Income Inequality in Rural China. Oxf. Bull. Econ. Stat. 1999, 61, 33–56. [Google Scholar] [CrossRef]
- Hall, O. Remote sensing in social science research. Open Remote Sens. J. 2010, 3, 1–16. [Google Scholar] [CrossRef]
- Chuhan-Pole, P.; Dabalen, A.L.; Land, B.C. Mining in Africa: Are Local Communities Better Off? World Bank Publications: Washington, DC, USA, 2017. [Google Scholar]
- World Gazetteer. 2015. Available online: https://apps.gis.ucla.edu/geodata/dataset/world_gazetteer/resource/0fcd1a90-8fe3-4e05-92de6cad419e69c0 (accessed on 6 March 2017).
- Chen, X.; Nordhaus, W.D. Using luminosity data as a proxy for economic statistics. Proc. Natl. Acad. Sci. USA 2011, 108, 8589–8594. [Google Scholar] [CrossRef]
- Levin, N.; Duke, Y. High spatial resolution night-time light images for demographic and socio-economic studies. Remote Sens. Environ. 2012, 119, 1–10. [Google Scholar] [CrossRef]
- Croft, T.A. Nighttime images of the earth from space. Sci. Am. 1978, 239, 86–98. [Google Scholar] [CrossRef]
- Elvidge, C.D.; Baugh, K.E.; Kihn, E.A.; Kroehl, H.W.; Davis, E.R.; Davis, C.W. Relation between satellite observed visible-near infrared emissions, population, economic activity and electric power consumption. Int. J. Remote Sens. 1997, 18, 1373–1379. [Google Scholar] [CrossRef]
- Doll, C.N.H.; Muller, J.-P.; Morley, J.G. Mapping regional economic activity from night-time light satellite imagery. Ecol. Econ. 2006, 57, 75–92. [Google Scholar] [CrossRef]
- Ghosh, T.; Powell, R.L.; Elvidge, C.D.; Baugh, K.E.; Sutton, P.C.; Anderson, S. Shedding light on the global distribution of economic activity. Open Geogr. J. 2010, 3, 148–161. [Google Scholar]
- Mellander, C.; Lobo, J.; Stolarick, K.; Matheson, Z. Night-time light data: A good proxy measure for economic activity? PLoS ONE 2015, 10, e0139779. [Google Scholar] [CrossRef]
- Lessman, C.; Seidel, A. Regional Inequality, Convergence, and Its Determinants: A View from Outer Space. Eur. Econ. Rev. 2017, 92, 110–132. [Google Scholar] [CrossRef]
- Wu, R.; Yang, D.; Dong, J.; Zhang, L.; Xia, F. Regional Inequality in China Based on NPP-VIIRS Night-Time Light Imagery. Remote Sens. 2018, 10, 240. [Google Scholar] [CrossRef]
- Sutton, P.; Roberts, D.; Elvidge, C.D.; Melj, H. A comparison of nighttime satellite imagery and population density for the continental United States. Photogramm. Eng. Remote Sens. 1997, 63, 1303–1313. [Google Scholar]
- Sutton, P.; Roberts, D.; Elvidge, C.D.; Bauch, K. Census from heaven: An estimate of the global human population using night-time satellite imagery. Int. J. Remote Sens. 2001, 22, 3061–3076. [Google Scholar] [CrossRef]
- Pozzi, F.; Small, C.; Yetman, G. Modeling the distribution of human population with night-time satellite imagery and gridded population of the world. In Proceedings of the Pecora 15/Land Satellite Information IV/ISPRS Commission I/FIEOS 2002 Conference, Denver, CO, USA, 10–15 November 2002. [Google Scholar]
- Bustos, M.F.A.; Hall, O.; Andersson, M. Nighttime lights and population changes in Europe 1992–2012. AMBIO 2015, 44, 653–665. [Google Scholar] [CrossRef]
- Lu, H.; Zhang, M.; Sun, W.; Li, W. Expansion analysis of yangtze river delta urban agglomeration using dmsp/ols nighttime light imagery for 1993 to 2012. ISPRS Int. J. Geo-Inf. 2018, 7, 52. [Google Scholar] [CrossRef]
- Henderson, M.; Yeh, E.T.; Gong, P.; Elvidge, C.D.; Baugh, K.E. Validation of urban boundaries derived from global night-time satellite imagery. Int. J. Remote Sens. 2003, 24, 595–609. [Google Scholar] [CrossRef]
- Wang, L.; Li, W.; Wang, P.; Liu, X.; Yang, F.; Qu, J.J. Spatiotemporal characterization of the urban sprawl and its impacts on urban island in China with DMSP/OLS and MODIS measurements. Theor. Appl. Climatol. 2019, 138, 293–303. [Google Scholar] [CrossRef]
- Elvidge, C.D.; Cinzano, P.; Pettit, D.R.; Arvesen, J.; Sutton, P.; Small, C.; Nemani, R.; Longcore, T.; Rich, C.; Safran, J.; et al. The Nightsat Mission Concept. Int. J. Remote Sens. 2007, 28, 2645–2670. [Google Scholar] [CrossRef]
- Kloog, I.; Haim, A.; Stevens, R.G.; Barchana, M.; Portnov, B.A. Light at night co-distributes with incident breast but not lung cancer in the female population of Israel. Chronobiol. Int. 2008, 25, 65–81. [Google Scholar] [CrossRef]
- Bharti, N.; Tatem, A.J.; Ferrari, M.J.; Grais, R.F.; Djibo, A.; Grenfell, B.T. Explaining seasonal fluctuations of measles in Niger using nighttime lights imagery. Science 2011, 9, 1424–1427. [Google Scholar] [CrossRef]
- Agnew, J.; Gillespie, T.W.; Gonzalez, J.; Min, B. Baghdad nights: Evaluating the US military ‘surge’ using nighttime light signatures. Environ. Plan. A 2008, 40, 2285–2295. [Google Scholar] [CrossRef]
- Witmer, F.D.W.; O’Loughlin, J. Detecting the effects of wars in the Caucasus regions of Russia and Georgia using radiometrically normalized DMSP-OLS nighttime lights imagery. GISci. Remote Sens. 2011, 48, 478–500. [Google Scholar] [CrossRef]
- Moor, A.M.; Alegana, V.A.; Gething, P.W.; Tatem, A.J.; Snow, R.W. Using remotely sensed night-time light as a proxy for poverty in Africa. Popul. Health Metr. 2008, 6, 5. [Google Scholar]
- Elvidge, C.D.; Sutton, P.C.; Ghosh, T.; Tuttle, B.T.; Baugh, K.E.; Bhaduri, B.; Bright, E. A global poverty map derived from satellite data. Comput. Geosci. 2009, 35, 1652–1660. [Google Scholar] [CrossRef]
- Doll, C.N.H.; Pachauri, S. Estimating rural population without access to electricity in developing countries through night-time light satellite imagery. Energy Policy 2010, 38, 5661–5670. [Google Scholar] [CrossRef]
- Ebener, S.; Murray, C.; Tandon, A.; Elvidge, C.C. From wealth to health: Modelling the distribution of income per capita at the sub-national level using night-time light imagery. Int. J. Health Geogr. 2005, 4, 5. [Google Scholar] [CrossRef] [PubMed]
- Sutton, P.C.; Costanza, R. Global estimates of market and non-market values derived. Ecol. Econ. 2002, 41, 509–527. [Google Scholar] [CrossRef]
- Sutton, P.C.; Taylor, M.J.; Anderson, S.; Elvidge, C.D. Sociodemographic characterization of urban areas using nighttime imagery, Google Earth, Landsat, and “social” ground truthing. In Urban Remote Sensing; CRC Press: Boca Raton, FL, USA, 2007; pp. 291–310. [Google Scholar]
- Zhou, D.; Zhao, S.; Zhang, L.; Sun, G.; Liu, Y. The footprint of urban heat island effect in China. Sci. Rep. 2015, 5, 11160. [Google Scholar] [CrossRef] [PubMed]
- Doll, C.H.; Muller, J.P.; Elvidge, C.D. Night-time imagery as a tool for global mapping of socioeconomic parameters and greenhouse gas emissions. AMBIO 2000, 29, 157–163. [Google Scholar] [CrossRef]
- Weidmann, N.B.; Schutte, S. Using night light emissions for the prediction of local wealth. J. Peace Res. 2017, 54, 125–140. [Google Scholar] [CrossRef]
- Levin, N.; Zhang, Q. A global analysis of factors controlling VIIRS nighttime light levels from densely populated areas. Remote Sens. Environ. 2017, 190, 366–382. [Google Scholar] [CrossRef]
- Bennett, M.M.; Smith, L.C. Advances in using multitemporal night-time lights satellite imagery to detect, estimate, and monitor socioeconomic dynamics. Remote Sens. Environ. 2017, 192, 176–197. [Google Scholar] [CrossRef]
- Jean, N.; Burke, M.; Xie, M.; Davis, W.M.; Lobell, D.B.; Ermon, S. Combining satellite imagery and machine learning to predict poverty. Science 2016, 353, 790–794. [Google Scholar] [CrossRef]
- Bruederle, A.; Hodler, R. Nighttime lights as a proxy for human development at the local level. PLoS ONE 2018, 13, e0202231. [Google Scholar] [CrossRef]
- Tanaka, K.; Keola, S. Shedding light on the shadow economy: A nighttime light approach. J. Dev. Stud. 2017, 53, 32–48. [Google Scholar] [CrossRef]
- African Development Fund. Electrification Project for Semi-Urban Arears of Ouagadougou and Bobo Dioulasso. 2016. Available online: https://www.afdb.org/fileadmin/uploads/afdb/Documents/Project-and-Operations/Burkina_Faso_-Approved-_AR_-Electrification_project_for_semi-urban_arears_of_Ouagadougou_and_Bobo_Dioulasso.pdf (accessed on 14 April 2018).
- Eberhard, A.; Rosnes, O.; Shkaratan, M.; Vennemo, H. Africa’s Power Infrastructure; The World Bank: Washington, DC, USA, 2011. [Google Scholar]
- Elvidge, C.D.; Milesi, C.; Dietz, J.B.; Tuttle, B.T.; Sutton, P.C.; Nemani, R.; Vogelmann, J.E. US constructed area approaches the size of Ohio. Eos Trans. Am. Geophys. Union 2004, 85, 233. [Google Scholar] [CrossRef]
- Baugh, K.E.; Elvidge, C.D.; Ghosh, T.; Ziskin, D. Population detection profiles of DMSP-OLS night-time imagery by regions of the world. In Proceedings of the 30th Asia-Pacific Advanced Network Meeting, Hanoi, Vietnam, 9–13 August 2010. [Google Scholar]
- Ma, X.; Tong, X.; Liu, S.; Ma, Z.; Zheng, S. An Improved Index for Desaturation of DMSP Nighttime Light Data. In Proceedings of the IGARSS 2018—2018 IEEE International Geoscience and Remote Sensing Symposium, Valencia, Spain, 22–27 July 2018; IEEE: Piscataway, NJ, USA, 2018. [Google Scholar]
- Elvidge, C.D.; Hsu, F.C.; Baugh, K.E.; Ghosh, T. National trends in satellite observed lighting: 1992–2012. In Global Urban Monitoring and Assessment Through Earth Observation; Weng, Q., Ed.; CRC Press: Boca Raton, FL, USA, 2013. [Google Scholar]
- Schott, J.R.; Salvaggio, C.; Volchok, W.J. Radiometric scene normalization using pseudoinvariant features. Remote Sens. Environ. 1988, 26, 1–16. [Google Scholar] [CrossRef]
- Elvidge, C.; Ziskin, D.; Baugh, K.; Tuttle, B.; Ghosh, T.; Pack, D.; Erwin, E.; Zhizhin, M. A fifteen year record of global natural gas flaring derived from satellite data. Energies 2009, 2, 595–622. [Google Scholar] [CrossRef]
- Elvidge, C.D.; Hsu, F.-C.; Baugh, K.E.; Ghosh, T. National trends in satellite-observed lighting. Glob. Urban Monit. Assess. Earth Obs. 2014, 23, 97–118. [Google Scholar]
- Hall, O.; Bustos, M.A.; Boke Olén, N.; Niedomysl, T. Population Centroids of the World Administrative Units from NighttimeLights 1992–2013. Sci. Data 2019, 6, 235. [Google Scholar] [CrossRef] [PubMed]
- Shi, K.; Yu, B.; Huang, Y.; Hu, Y.; Yin, B.; Chen, Z.; Chen, L.; Wu, J. Evaluating the ability of NPP_VIIRS nighttime light data to estimate the Gross Domestic Product and the electric power consumption of China at multiple scales: A comparison with DMSP-OLS data. Remote Sens. 2014, 6, 1705–1724. [Google Scholar] [CrossRef]
- Baugh, K.; Hsu, F.C.; Elvidge, C.; Zhizhin, M. Nighttime light compositing using the VIIRS Day-Night Band: Preliminary results. Proc. Asia-Pac. Adv. Netw. 2013, 35, 70–86. [Google Scholar] [CrossRef]
- Lee, T.E.; Miller, S.D.; Turk, F.J.; Schueler, C.; Julian, R.; Deyo, S.; Dills, P.; Wang, S. The NPOESS VIIRS Day/Night visible sensor. Bull. Am. Meteorol. Soc. 2006, 87, 191–199. [Google Scholar] [CrossRef]
- Ma, T.; Zhou, Y.; Wang, Y.; Zhou, C.; Haynie, S.; Xu, T. Diverse relationships between Suomi-NPP VIIRS night-time light and multi-scale socioeconomic activity. Remote Sens. Lett. 2014, 5, 652–661. [Google Scholar] [CrossRef]
- Ma, T.; Zhou, C.; Pei, T.; Haynie, S.; Fan, J. Responses of Suomi-NPP VIIRS-derived nighttime lights to socioeconomic activity in China’s cities. Remote Sens. Lett. 2014, 5, 165–174. [Google Scholar] [CrossRef]
- Li, X.; Xu, H.; Chen, X.; Li, C. Potential of NPP-VIIRS nighttime light imagery for modeling the regional economy of China. Remote Sens. 2013, 5, 3057–3081. [Google Scholar] [CrossRef]
- Minnesota Population Center. Integrated Public Use Microdata Series; International: Version 7.0 Burkina Faso; IPUMS: Minneapolis, MN, USA, 2018. [Google Scholar]
- Doll, C.N.H. Development of a 2009 stable lights product using DMSP-OLS. In Proceedings of the 30th Asia-Pacific Advanced Network Meeting, Hanoi, Vietnam, 9–13 August 2010. [Google Scholar]


| Detection Rate | Communities Detected | |||
|---|---|---|---|---|
| Years | Percentage | Count | Percentage | Average Population |
| 21 | 100% | 12 | 9% | 222,679 |
| 20 | 95% | 12 | 9% | 33,418 |
| 13–19 | 62%–91% | 15 | 10% | 21,743 |
| 7–12 | 33%–57% | 7 | 5% | 21,891 |
| 1–6 | 5%–29% | 18 | 12% | 13,852 |
| 0 | 0% | 83 | 57% | 11,248 |
| Communities Detected | |||
|---|---|---|---|
| Population | Average Detection Rate (%) | Count | Percentage |
| 0–9999 | 3% | 59 | 40% |
| 10,000–24,999 | 28% | 62 | 42% |
| 25,000–49,000 | 69% | 17 | 12% |
| 50,000–499,999 | 93% | 7 | 5% |
| 500,000+ | 100% | 2 | 1% |
| Detection Rate | Electrification | ||||
|---|---|---|---|---|---|
| Years | Percentage | Electrified Households | Total Number Households | Percentage Electrified | Average Electrified per Community |
| 21 | 100% | 38 | 7597 | 0.50% | 0.68% |
| 20 | 95% | 57 | 3852 | 1.48% | 1.23% |
| 13–19 | 62%–91% | 55 | 9980 | 0.55% | 0.64% |
| 7–12 | 33%–57% | 96 | 4835 | 1.99% | 2.14% |
| 1–6 | 5%–29% | 103 | 9263 | 1.11% | 1.22% |
| 0 | 0% | 333 | 23,719 | 1.49% | 1.26% |
© 2019 by the authors. Licensee MDPI, Basel, Switzerland. This article is an open access article distributed under the terms and conditions of the Creative Commons Attribution (CC BY) license (http://creativecommons.org/licenses/by/4.0/).
Share and Cite
Andersson, M.; Hall, O.; Archila, M.F. How Data-Poor Countries Remain Data Poor: Underestimation of Human Settlements in Burkina Faso as Observed from Nighttime Light Data. ISPRS Int. J. Geo-Inf. 2019, 8, 498. https://doi.org/10.3390/ijgi8110498
Andersson M, Hall O, Archila MF. How Data-Poor Countries Remain Data Poor: Underestimation of Human Settlements in Burkina Faso as Observed from Nighttime Light Data. ISPRS International Journal of Geo-Information. 2019; 8(11):498. https://doi.org/10.3390/ijgi8110498
Chicago/Turabian StyleAndersson, Magnus, Ola Hall, and Maria Francisca Archila. 2019. "How Data-Poor Countries Remain Data Poor: Underestimation of Human Settlements in Burkina Faso as Observed from Nighttime Light Data" ISPRS International Journal of Geo-Information 8, no. 11: 498. https://doi.org/10.3390/ijgi8110498
APA StyleAndersson, M., Hall, O., & Archila, M. F. (2019). How Data-Poor Countries Remain Data Poor: Underestimation of Human Settlements in Burkina Faso as Observed from Nighttime Light Data. ISPRS International Journal of Geo-Information, 8(11), 498. https://doi.org/10.3390/ijgi8110498