Article

Evaluation of the Accuracy of the Field Quadrat Survey of Alpine Grassland Fractional Vegetation Cover Based on the Satellite Remote Sensing Pixel Scale

1
College of Geomatics and Geoinformation, Guilin University of Technology, 12 Jiangan Road, Guilin 541004, China
2
Guangxi Key Laboratory of Spatial Information and Geomatics, 12 Jiangan Road, Guilin 541004, China
3
State Key Laboratory of Cryospheric Sciences, Northwest Institute of Eco-Environment and Resources, Chinese Academy of Sciences, 320 Donggang West Road, Lanzhou 730000, China
4
Institute of Fragile Ecosystem and Environment, Nantong University, 999 Tongjing Road, Nantong 226007, China
5
School of Geographic Sciences, Nantong University, 999 Tongjing Road, Nantong 226007, China
*
Author to whom correspondence should be addressed.
ISPRS Int. J. Geo-Inf. 2019, 8(11), 497; https://doi.org/10.3390/ijgi8110497
Submission received: 11 September 2019 / Revised: 17 October 2019 / Accepted: 31 October 2019 / Published: 3 November 2019
(This article belongs to the Special Issue Geo-Informatics in Resource Management)

Abstract

:
The fractional vegetation cover (FVC) data measured on the ground is the main source for the calibration and verification of FVC remote sensing inversion, and its accuracy directly affects the accuracy of remote sensing inversion results. However, the existing research on the evaluation of the accuracy of the field quadrat survey of FVC based on the satellite remote sensing pixel scale is inadequate, especially in the alpine grassland of the Qinghai-Tibet Plateau. In this paper, five different alpine grasslands were examined, the accuracy of the FVC obtained by the photography method was analyzed, and the influence of the number of samples on the field survey results was studied. First, the results show that the threshold method could accurately extract the vegetation information in the photos and obtain the FVC with high accuracy and little subjective interference. Second, the number of samples measured on the ground was logarithmically related to the accuracy of the FVC of the sample plot (p < 0.001). When the number of samples was larger, the accuracy of the FVC of the sample plot was higher and closer to the real value, and the stability of data also increased with the increase of the number of samples. Third, the average FVC of the measured quadrats on the ground was able to represent the FVC of the sample plot, but on the basis that there were enough measured quadrats. Finally, the results revealed that the degree of fragmentation reflecting the state of ground vegetation affects the acquisition accuracy of FVC. When the degree of fragmentation of the sample plot is higher, the number of samples needed to achieve the accuracy index is higher. Our results suggest that when obtaining the FVC on the satellite remote sensing pixel scale, the number of samples measured on the ground is an important factor affecting the accuracy, which cannot be ignored.

1. Introduction

Fractional vegetation cover (FVC) refers to the percentage of the vertical projection of green vegetation in a total analyzed area [1]. It is an important parameter used to describe vegetation status, and reflects changes in the ecosystem. It is also the main factor affecting the interaction between surface, atmospheric and hydrological processes [2].
FVC is often used to monitor the process of ecological change and evaluate the ecological environment, which is an important parameter in the field of ecological environmental monitoring [3]. Therefore, accurately estimating the FVC of a region not only reveals the current ecological environment status and its changing trends, but also provides accurate data for numerous areas of simulation studies, such as ecology, hydrology and meteorology.
The acquisition methods of FVC mainly include conventional ground measurement and inversion estimation based on remote sensing data [4]. Conventional ground measurement methods include the visual estimation method, the sampling method, and the photographic method [5]. Among them, the visual estimation method directly estimates the FVC based upon experience, but the results are prone to subjectivity. The FVC calculated by the sampling method on the ground is relatively high in accuracy, but is time-consuming and laborious with low efficiency. The photographic method uses a digital camera to shoot the ground from above and then uses image processing software to interpret the image to obtain the FVC. Due to its high precision, efficiency and economical simplicity, it is one of the main methods of ground measurement. Although the ground measurement method is the most direct means to obtain FVC, these methods can only ensure the accuracy of FVC monitoring in small areas, and it is impossible to carry out long-term positioning monitoring on a wide range of vegetation conditions. With the continuous development of remote sensing technology, compared with the traditional ground measurement methods, the wide field of view, real-time and low cost of remote sensing technology are widely used in FVC estimation. For example, Yan et al. [6] use the random forest regression model utilizing FVC monitoring data and the vegetation index to better predict grassland FVC. Based on sample data, Li et al. [1] use the pixel dichotomy model to evaluate the inversion accuracy of grassland FVC at different resolutions. Jia et al. [7] use the MODIS surface reflectance data to generate a global FVC data set based on the general regression neural network inversion model. At present, research has continuously improved the inversion accuracy of FVC that is based on remote sensing inversion algorithms. However, it ignores that all satellite quantitative remote sensing inversion methods require accurate ground measurement data, in order to be calibrated and verified [8,9].
Quadrat photography is the main technique used to obtain FVC in the field. Although this method can accurately estimate the FVC at the scale of the sample quadrat, the scale of the sample quadrat is difficult to match with the scale of the remote sensing pixel. Accurate field measurements data, which can be matched with the scale of the satellite remote sensing pixels, can provide accurate calibration and verification of data for satellite remote sensing inversion, and further enhance its reliability. At present, some studies are aiming to set a certain number of quadrats in the sample plot which can match with the scale of satellite remote sensing pixels, and the mean value of FVC obtained by the quadrats would represent the “true” FVC of the sample plot. However, the heterogeneity of different areas and different underlying surfaces vary substantially. The average value of the fixed number of quadrats represents the measured value of the observed sample plot, and its accuracy changes with the variance of the area and the underlying surface. Moreover, few studies have been conducted to investigate the influence of issue on remote sensing inversion results. Based on the above problems, this study observed five typical alpine grasslands on the Qinghai-Tibet Plateau (where the heterogeneity of the underlying surfaces of the alpine grasslands varies greatly) and obtained the field-measured FVC by the quadrat photographic method (the quadrats were evenly distributed in the sample plot, which matched the scale of the satellite remote sensing pixels). The main objectives were to: 1) Analyze the accuracy of FVC obtained by the photographic method, 2) evaluate the influence of the number of quadrats on the field survey of the satellite remote sensing pixel scale, and 3) explore the relationship between the heterogeneity of underlying surfaces and the accuracy of field investigation.

2. Materials and methods
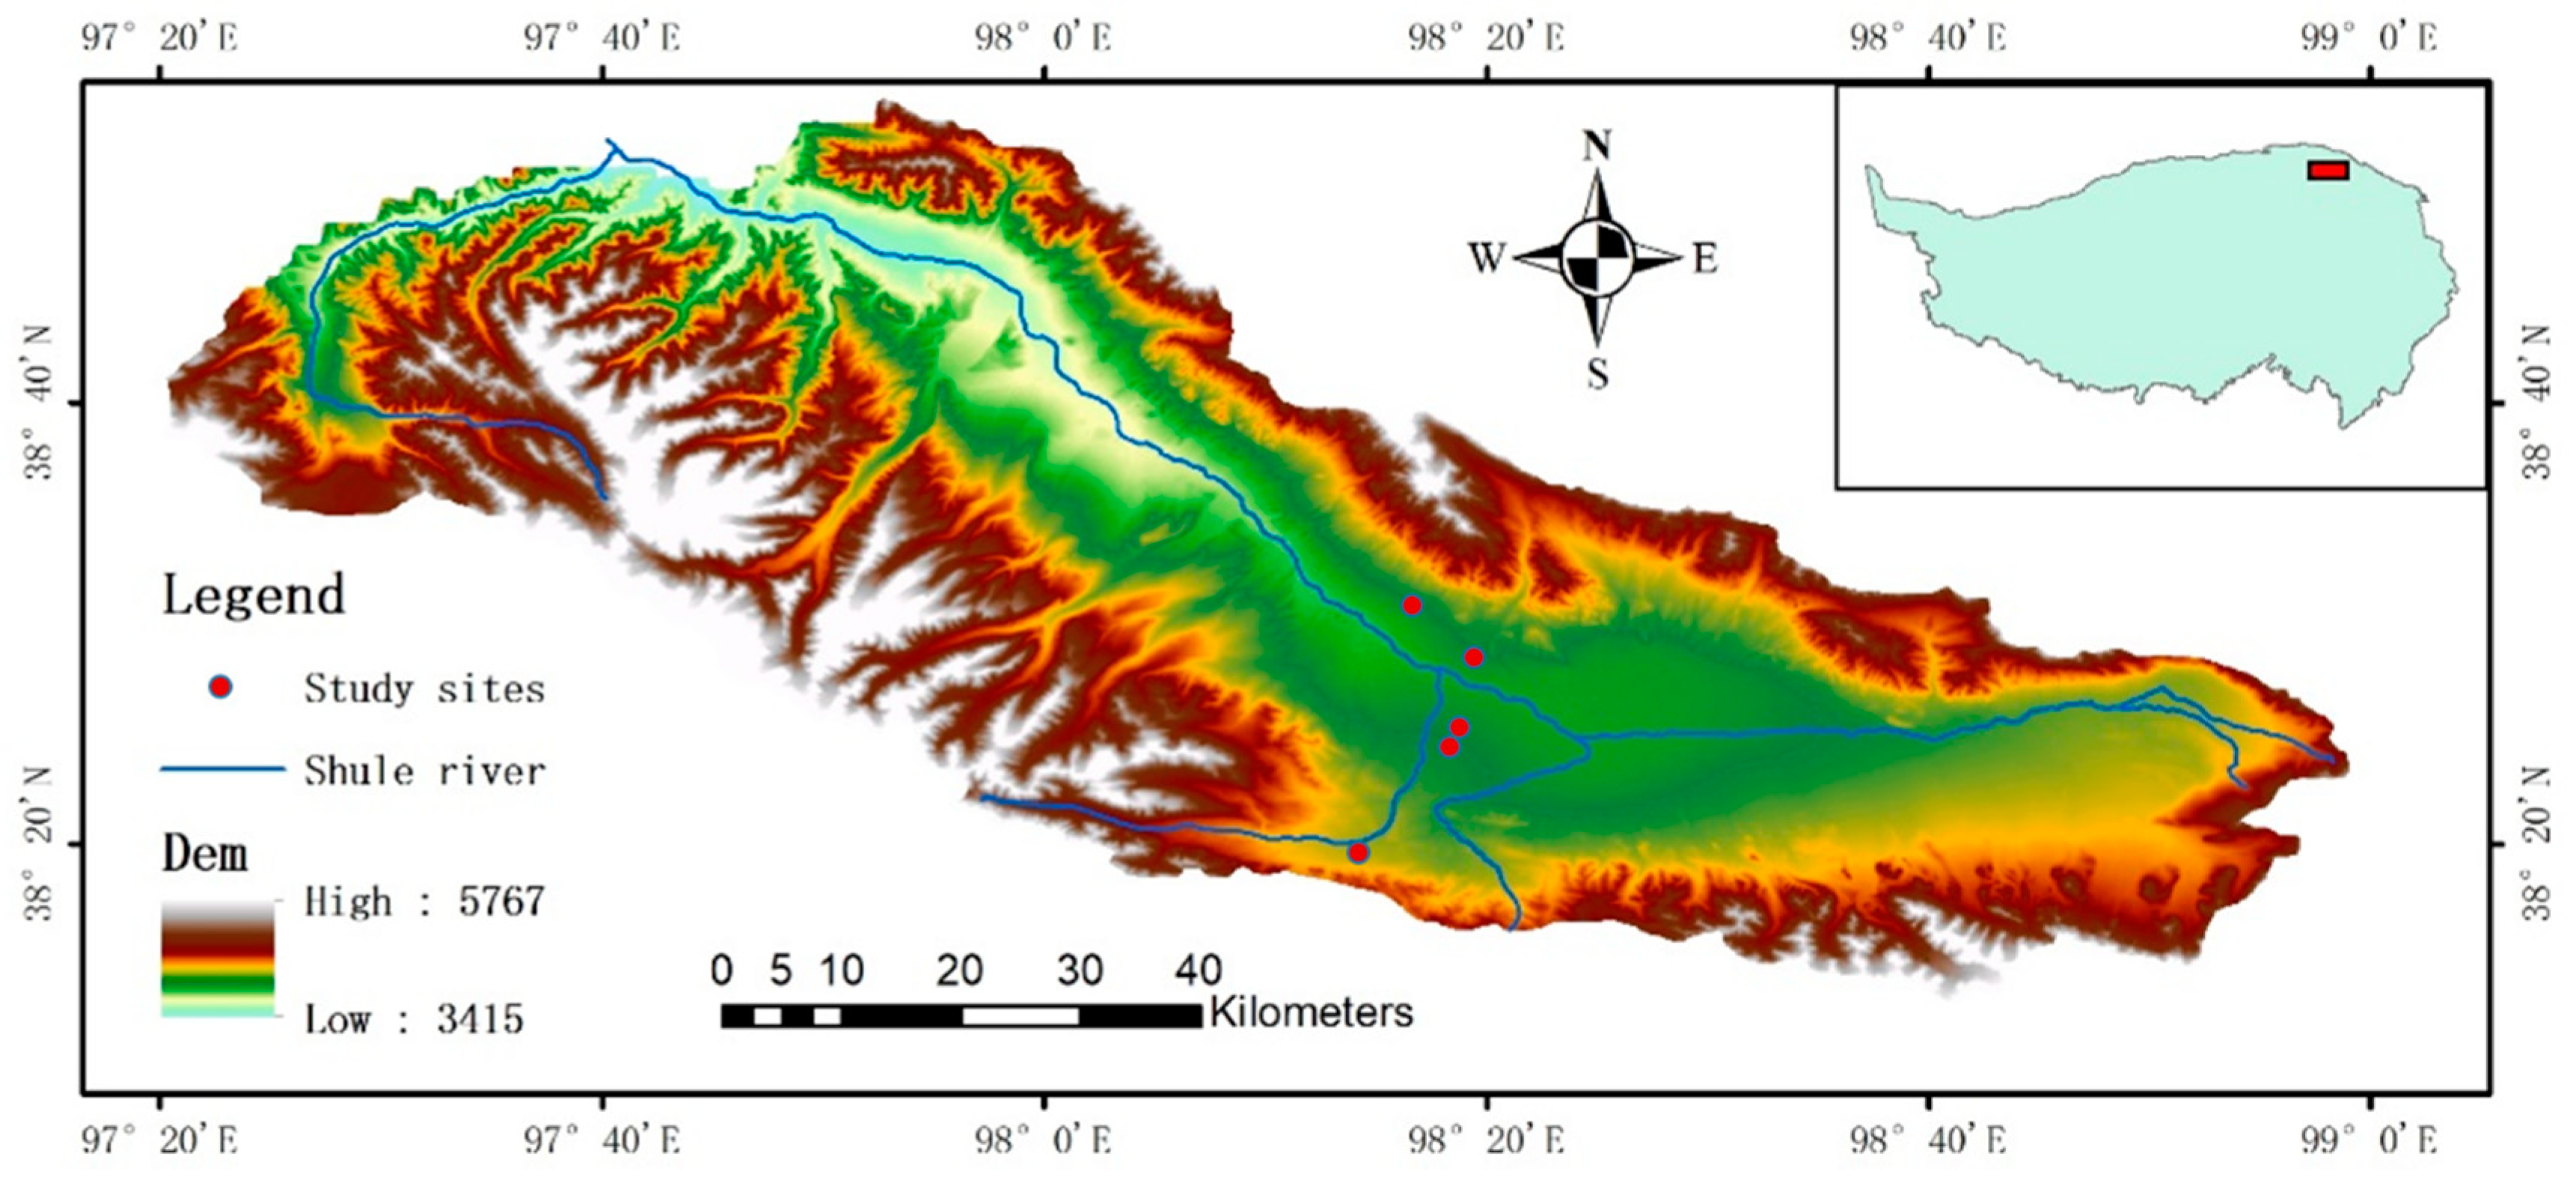
2.1. Study Area

The area studied is located near the upper reaches of Shule River (Figure 1), one of the three inland rivers of the Hexi Corridor in China. It is located at 96.6° to 99.0°E and 38.2° to 40.0°N, with an elevation of 2078–5763 meters and a drainage area of 11,400 square kilometers [10]. This region has a continental, arid desert climate, which is dry, cold and windy. The annual average temperature and precipitation are -2.7 °C and 349.2 mm, respectively [11]. Permafrost is widely distributed in the region; the vegetation types are mainly alpine meadow and alpine steppe, and the overall coverage is low [12]. The main soil types found in this region are alpine cold desert soil, alpine meadow steppe soil, chestnut soil, light chestnut soil and mountain limestone soil.

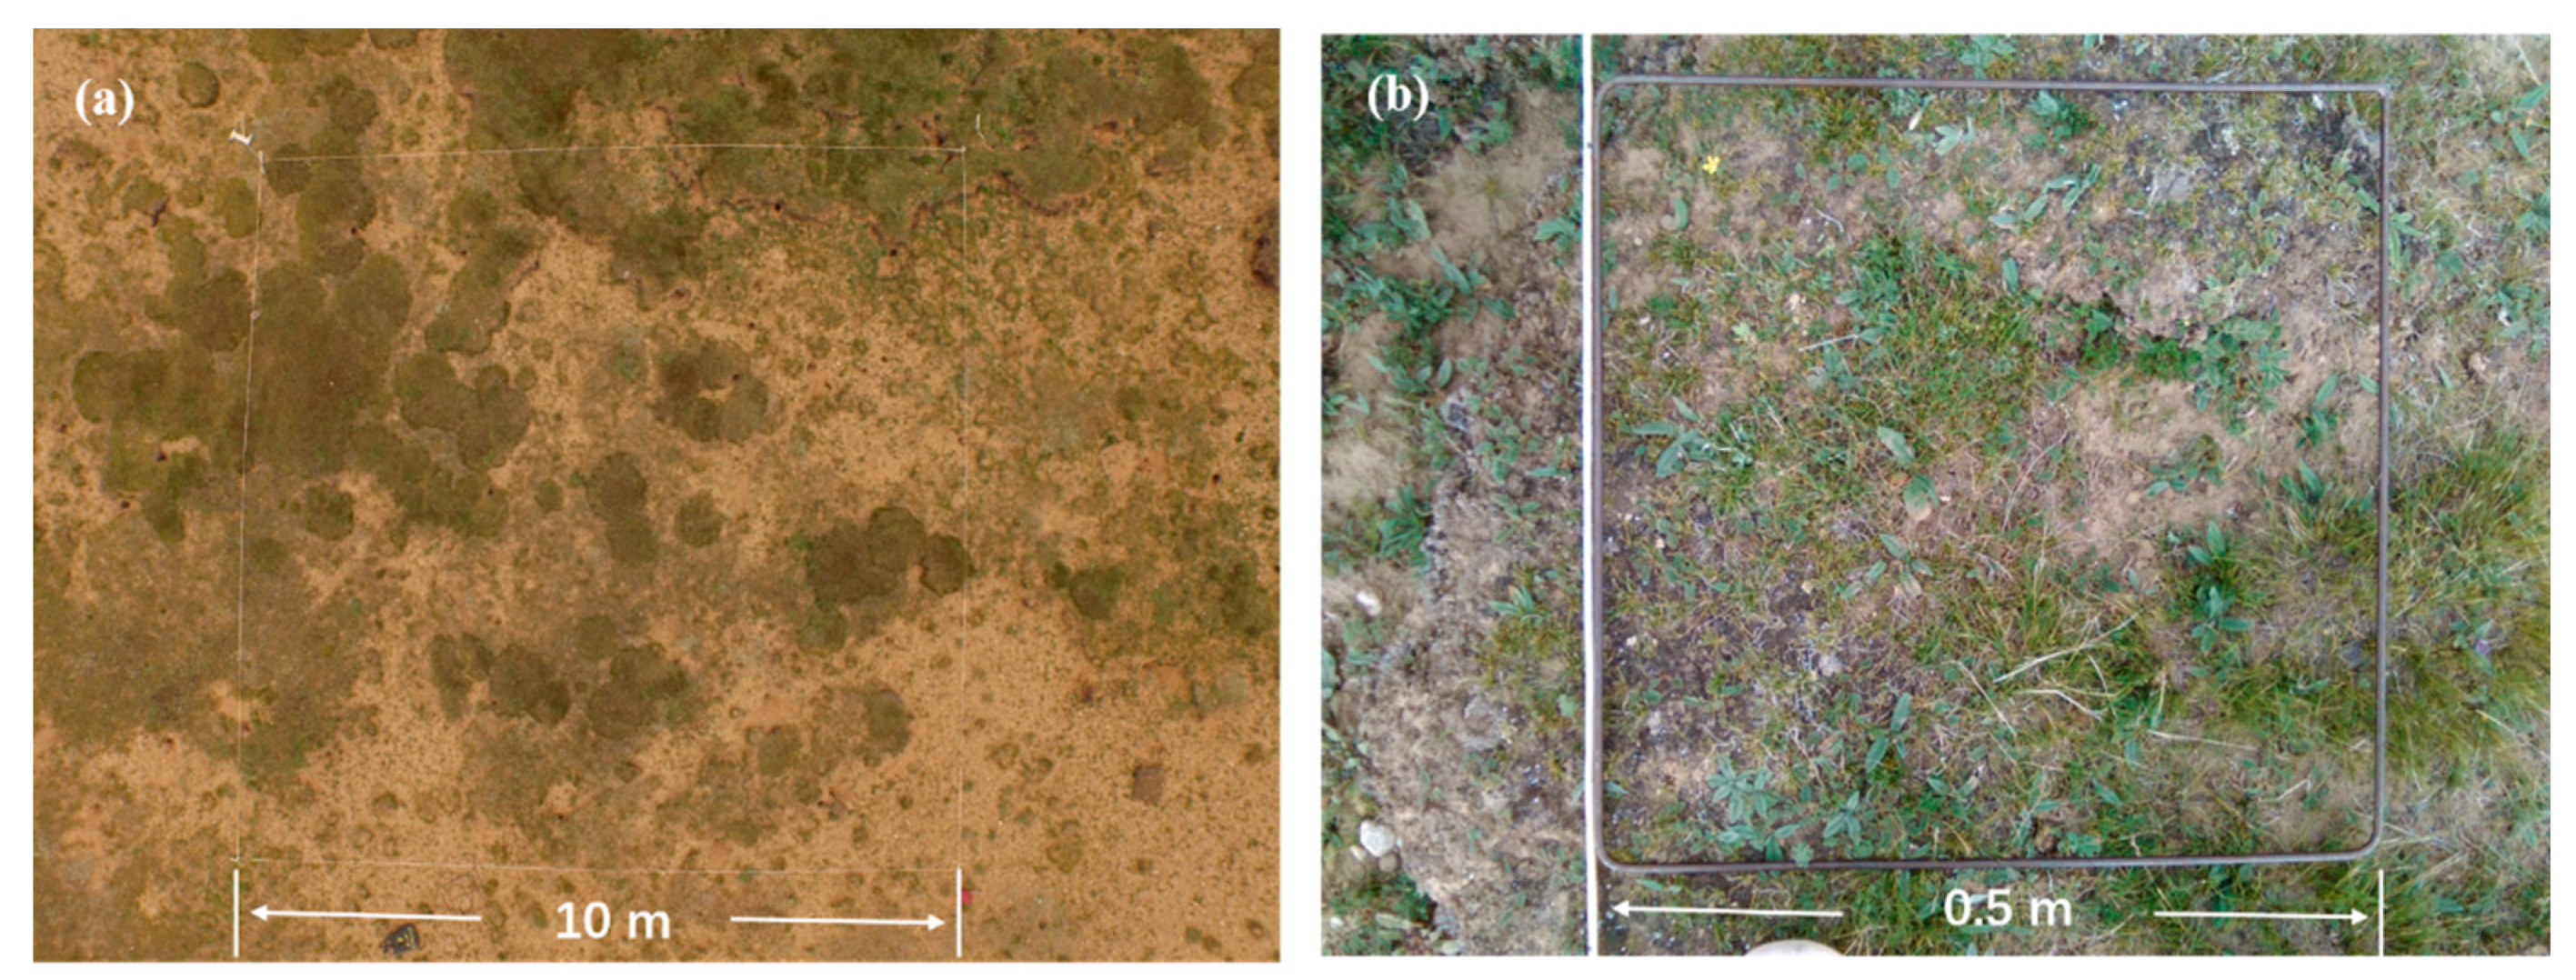
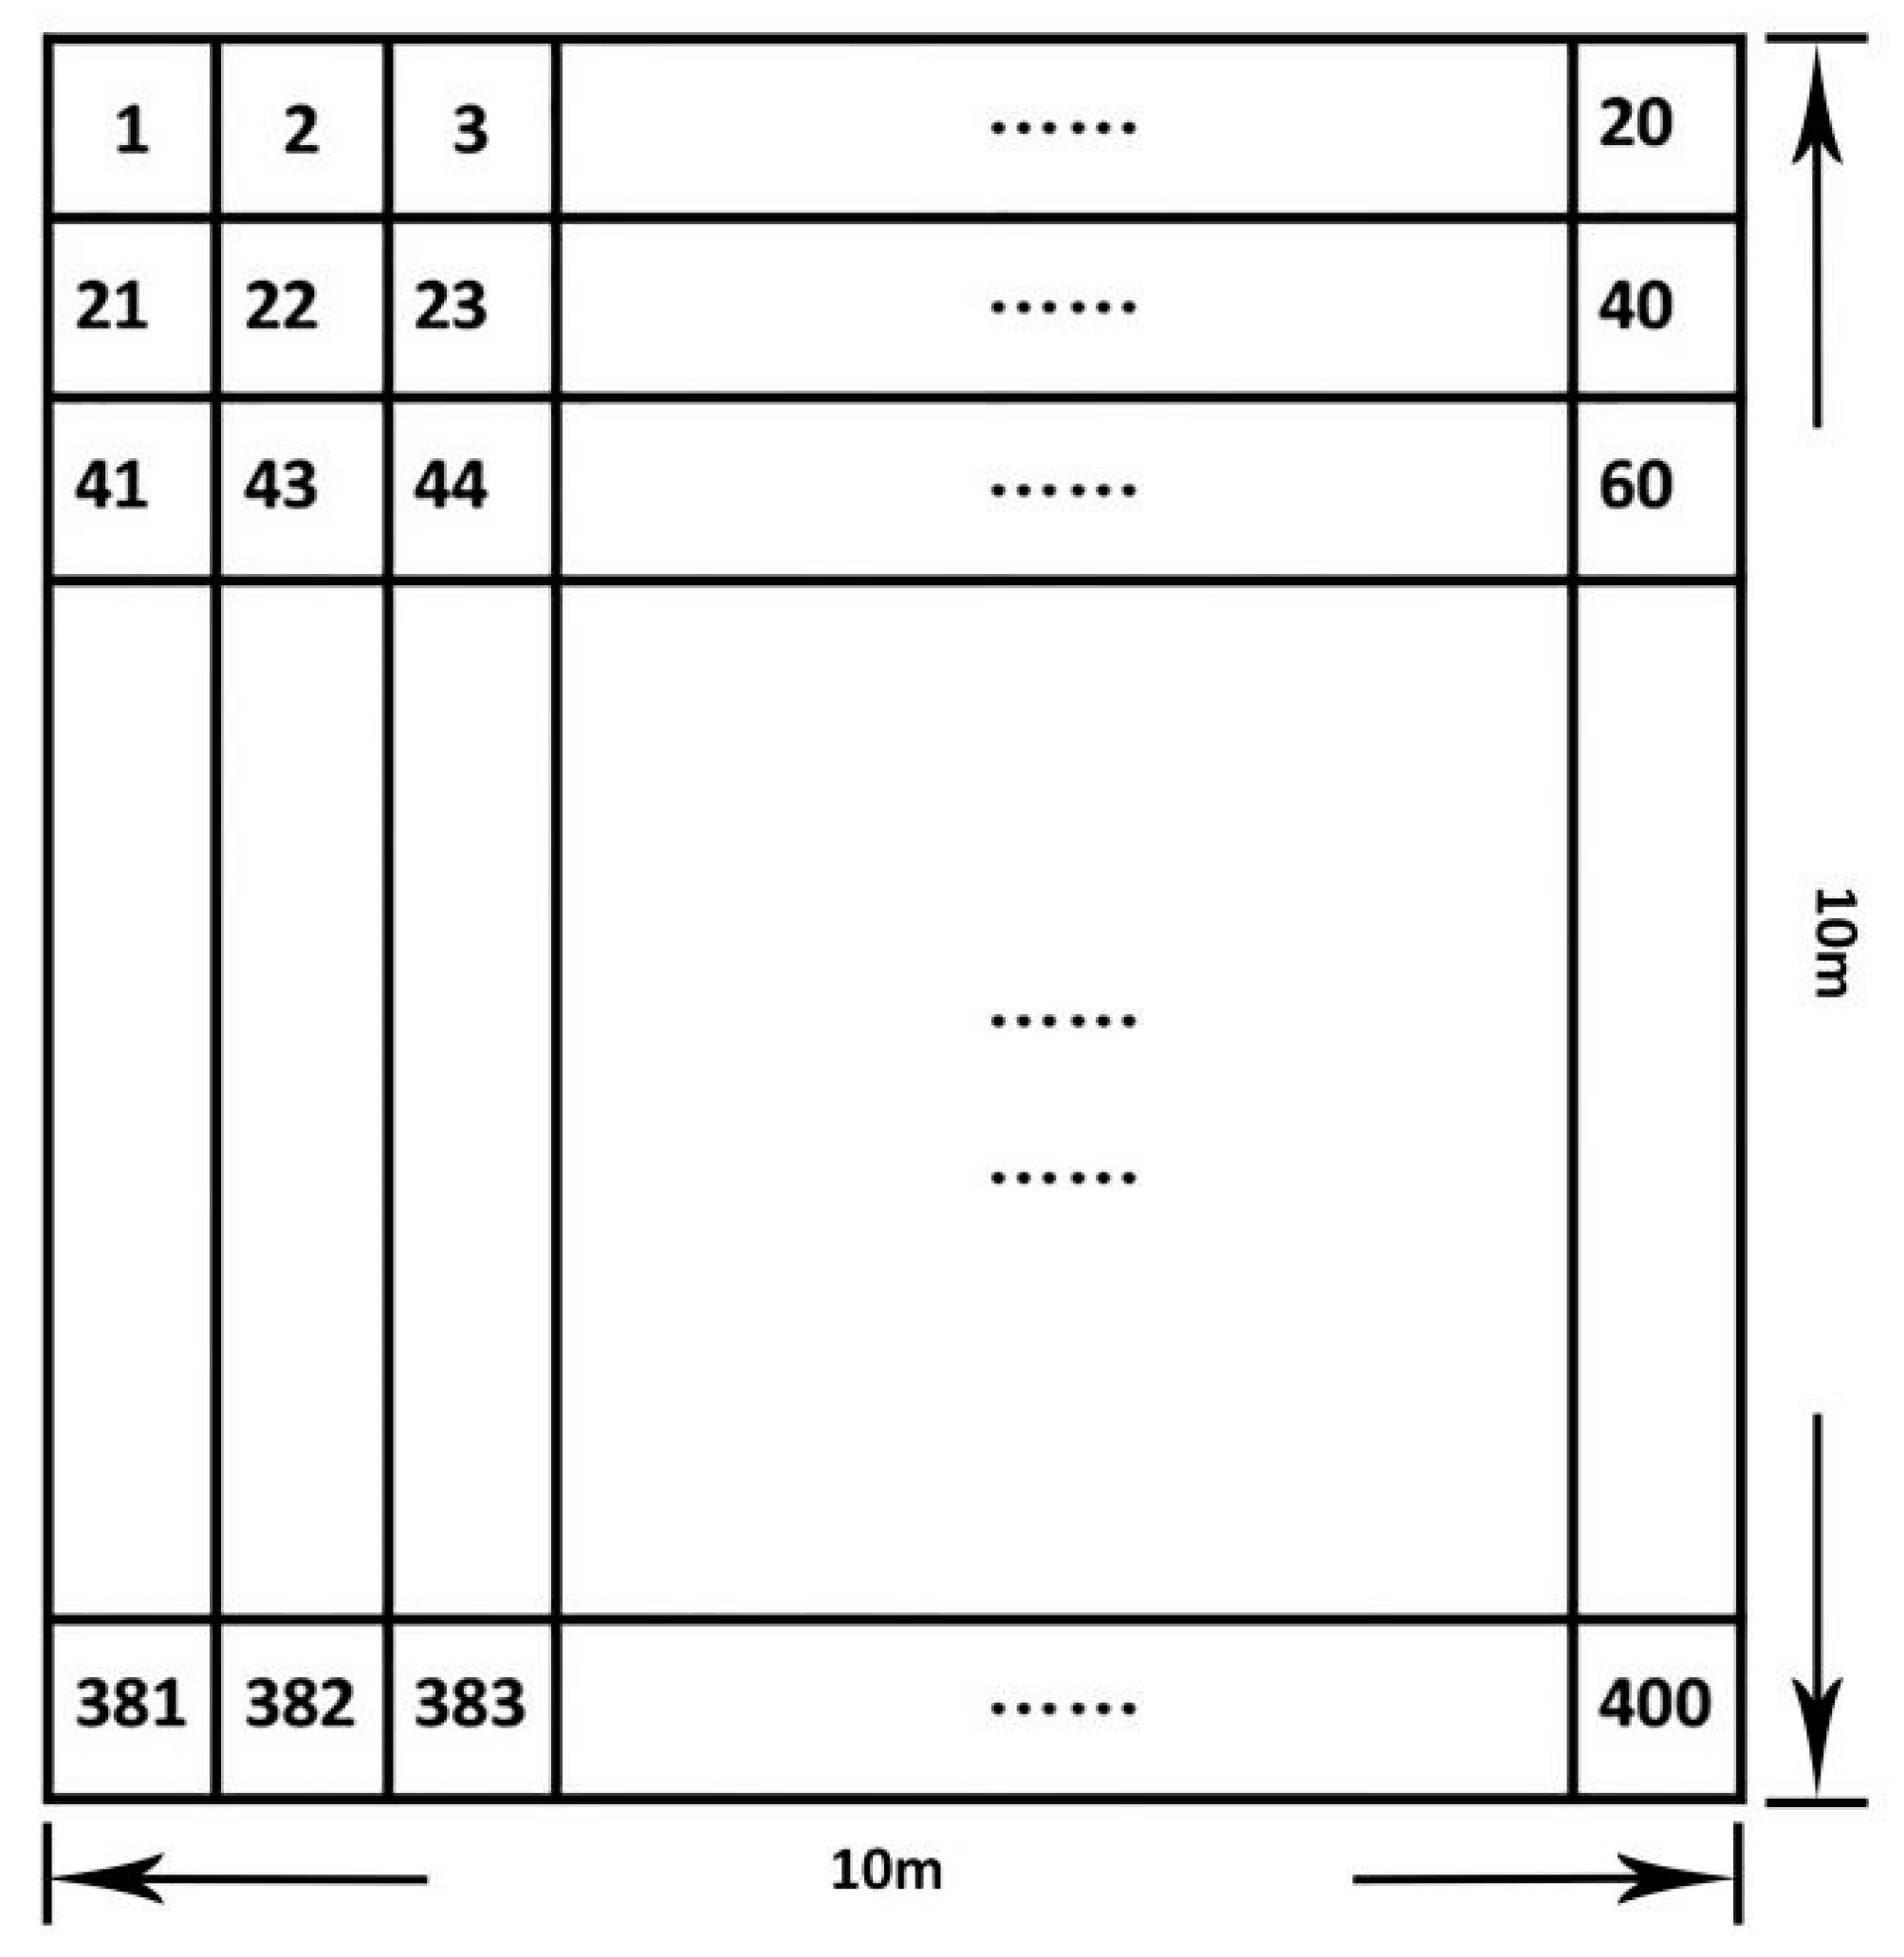
2.2. Field Data Collection

In the summer of 2016 we laid a sample plot of 10 m × 10 m (consistent with the highest spatial resolution of Sentinel 2 images) for each of the five grassland types (swamp meadow, alpine meadow, degraded meadow, steppe meadow and alpine steppe) in the study area, and the boundary of each sample plot was fixed with white cloth strips (Figure 2a). The five selected grassland types covered all grassland types in the study area, and are also the main grassland types in the Qinghai-Tibet Plateau. In each sample plot, a quadrocopter (DJI Phantom 3 Professional, DJI Inc. Shenzhen, China) with an integrated camera (12 megapixels) was used to shoot from above the sample plot at a height of 20 m, and the aerial image of each sample plot was acquired for analyzing the underlying surface heterogeneity of the sample plot. In order to analyze the impact of the number of quadrats on the survey results, we divided each sample plot evenly into 400 0.5 m × 0.5 m quadrats (Figure 3). To facilitate data collection, we customized a 0.5 m × 0.5 m iron frame to determine the extent of each quadrat. In each quadrat, we used the digital camera to photograph an image from above (~1 m), in order to obtain the image of the quadrat (Figure 2b), which was used for fractional vegetation cover (FVC) information extraction. The camera mounted on the quadrocopter and used for ground photography is a three-band digital camera which receives irradiance in the visible region (red, green and blue spectral bands) and stores it as a gray value from 0 to 255 in JPEG format.

2.3. Data Processing Method

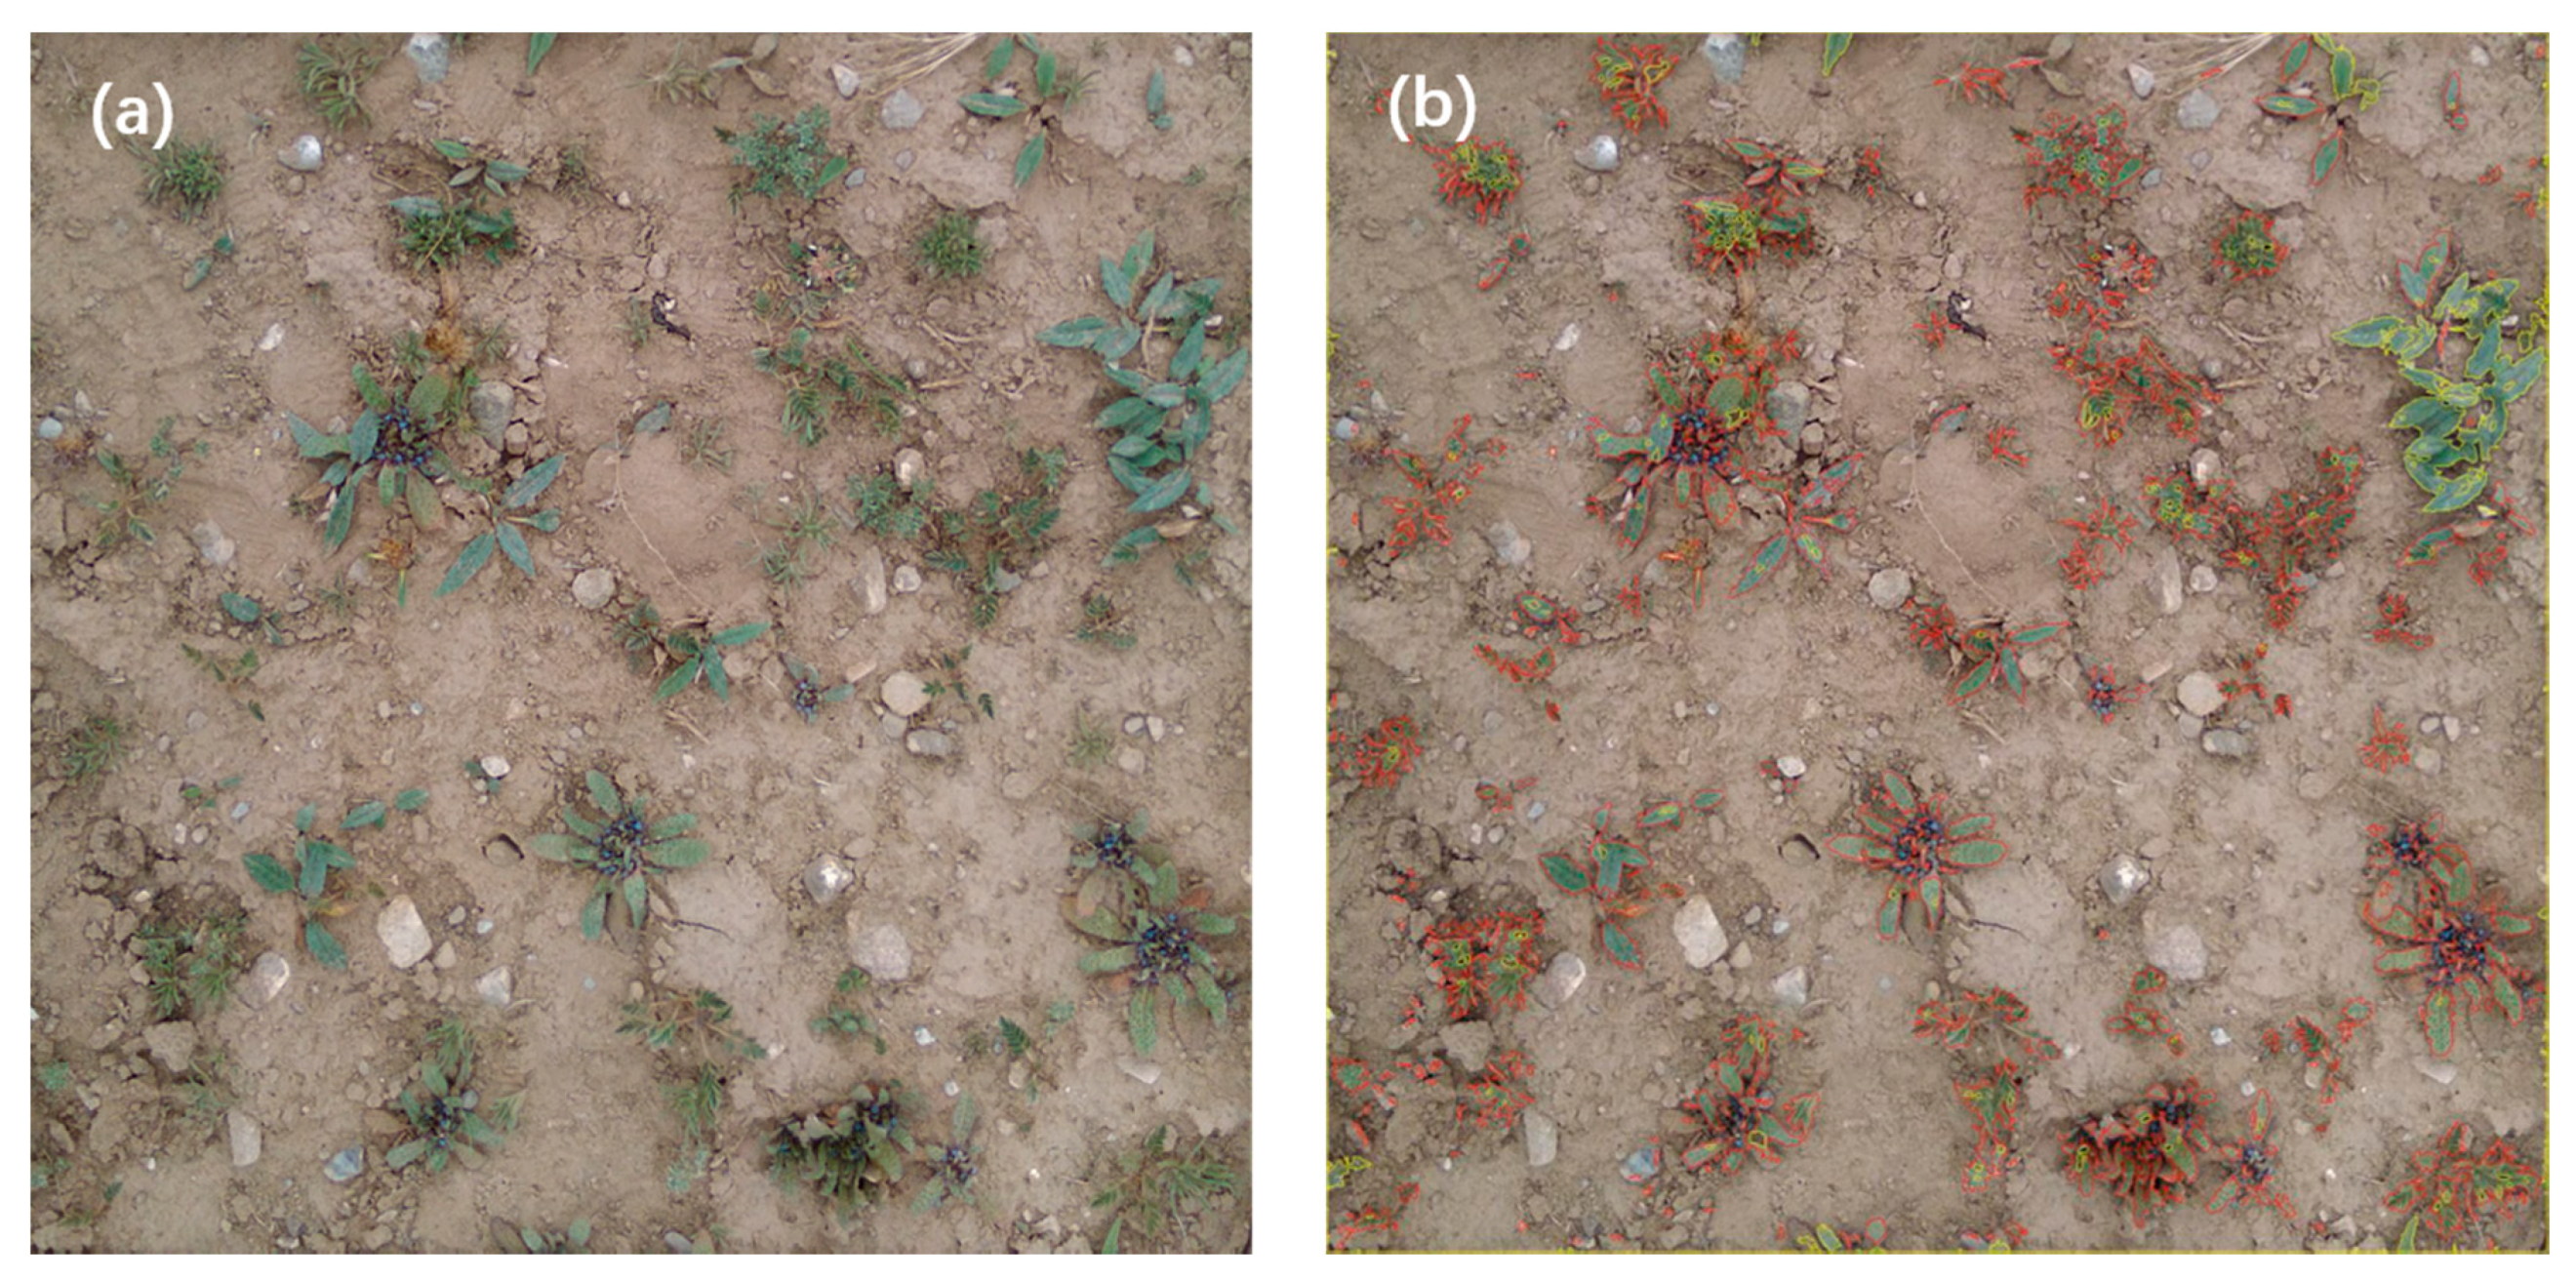
2.3.1. FVC Information Extraction

Before extracting the FVC information, the captured images were edited in Adobe Photoshop CS6 software according to the established boundary (the white cloth strips and iron frames) set by the experiment, since the coverage range of the images taken by the quadrocopter and the ground was larger than the sample plot scale (10 m×10 m) and the quadrat scale (0.5 m×0.5 m), and then the images matching the sample plot size and quadrat size were obtained. The FVC information was extracted from the clipped images by the threshold method, and the index used was the Excess Green Index (EGI = 2G-R-B, where G, R and B, respectively, represent the gray values of the green, red and blue bands in the image). Previous studies suggest that the threshold method based on the EGI had good accuracy [11,12,13]. More specifically, the FVC was calculated as follows. First, the EGI value of each pixel in the image was calculated. Second, an initial EGI threshold was set and compared to each pixel in the image.
If the pixel EGI value was greater than the threshold, then the pixel was regarded as vegetation, otherwise it was regarded as non-vegetation. Third, the classification result was compared with the original image. These steps were repeated to adjust the threshold value until the vegetation shapes in the classified image fit those of the original picture (Figure 4). Finally, the percentage of vegetation pixels of the total pixels was calculated as the FVC of the image. In order to evaluate the accuracy of the FVC obtained by this method, each image was analyzed by two separate people. Finally, the results of these two people were compared and analyzed.

2.3.2. FVC Estimation of Different Quadrat Combinations

After extracting the FVC information from the quadrat image by the threshold method, in order to accurately evaluate the influence of the number of quadrats on the estimation of the FVC of the sample plots, 400 quadrats of each sample plot were numbered, and the mean value of the FVC obtained from the 400 quadrats was considered to be the true value of the FVC of the corresponding sample plot. Then, according to the statistical permutation and combination theory, all permutations and combinations of different numbers of quadrats were extracted (for example, when the number of quadrats is m, there are C 400 m (from m choose 400 = n ! k ! ( n k ) ! ) combinations of quadrats), and the mean FVC obtained by each combination of quadrats was taken as the measured value of the sample plot. Finally, the influence of the number of quadrats on the field survey results was evaluated by the measured and true values of the sample plot.

2.3.3. Calculation of the Degree of Fragmentation of Sample Plot

Landscape fragmentation and FVC are correlated to a certain extent [14]. In order to analyze the correlation between landscape fragmentation and FVC, the images of the sample plot that had extracted the vegetation information by the threshold method were imported into Fragstats 4.2 software after being processed by ArcGIS 10.1 software, and the fragmentation index and the degree of fragmentation in the measurement area were calculated by selecting the patch density (PD) in the landscape pattern index.
P D = N / A
PD was calculated as above, where N is the number of patches and A is the total area of the region. PD is a specific quantification of the fragmentation of the area. The larger the value, the higher the degree of fragmentation [15].

2.4. Accuracy Evaluation Index

Root mean square error (RMSE), mean relative error (MRE) and variance have good statistical significance and are often used for error analyses. Therefore, this study used the above indicators to evaluate the impact of the number of quadrats on the field survey results. RMSE, MRE and variance calculation formulas are as follows:
R M S E = i = 1 n ( y i f i ) 2 / n ;  
M R E = i = 1 n | ( f i y i ) | / n ;  
V a r i a n c e = i = 1 n ( y i y ¯ ) 2 n 1
where f i is the predicted value, y i is the true value, and n is the number of quadrats. Smaller RMSE and MAE values indicate smaller error and higher accuracy, which are closer to the real values. A smaller variance indicates more stable and less volatile sample data.

3. Results and Analysis

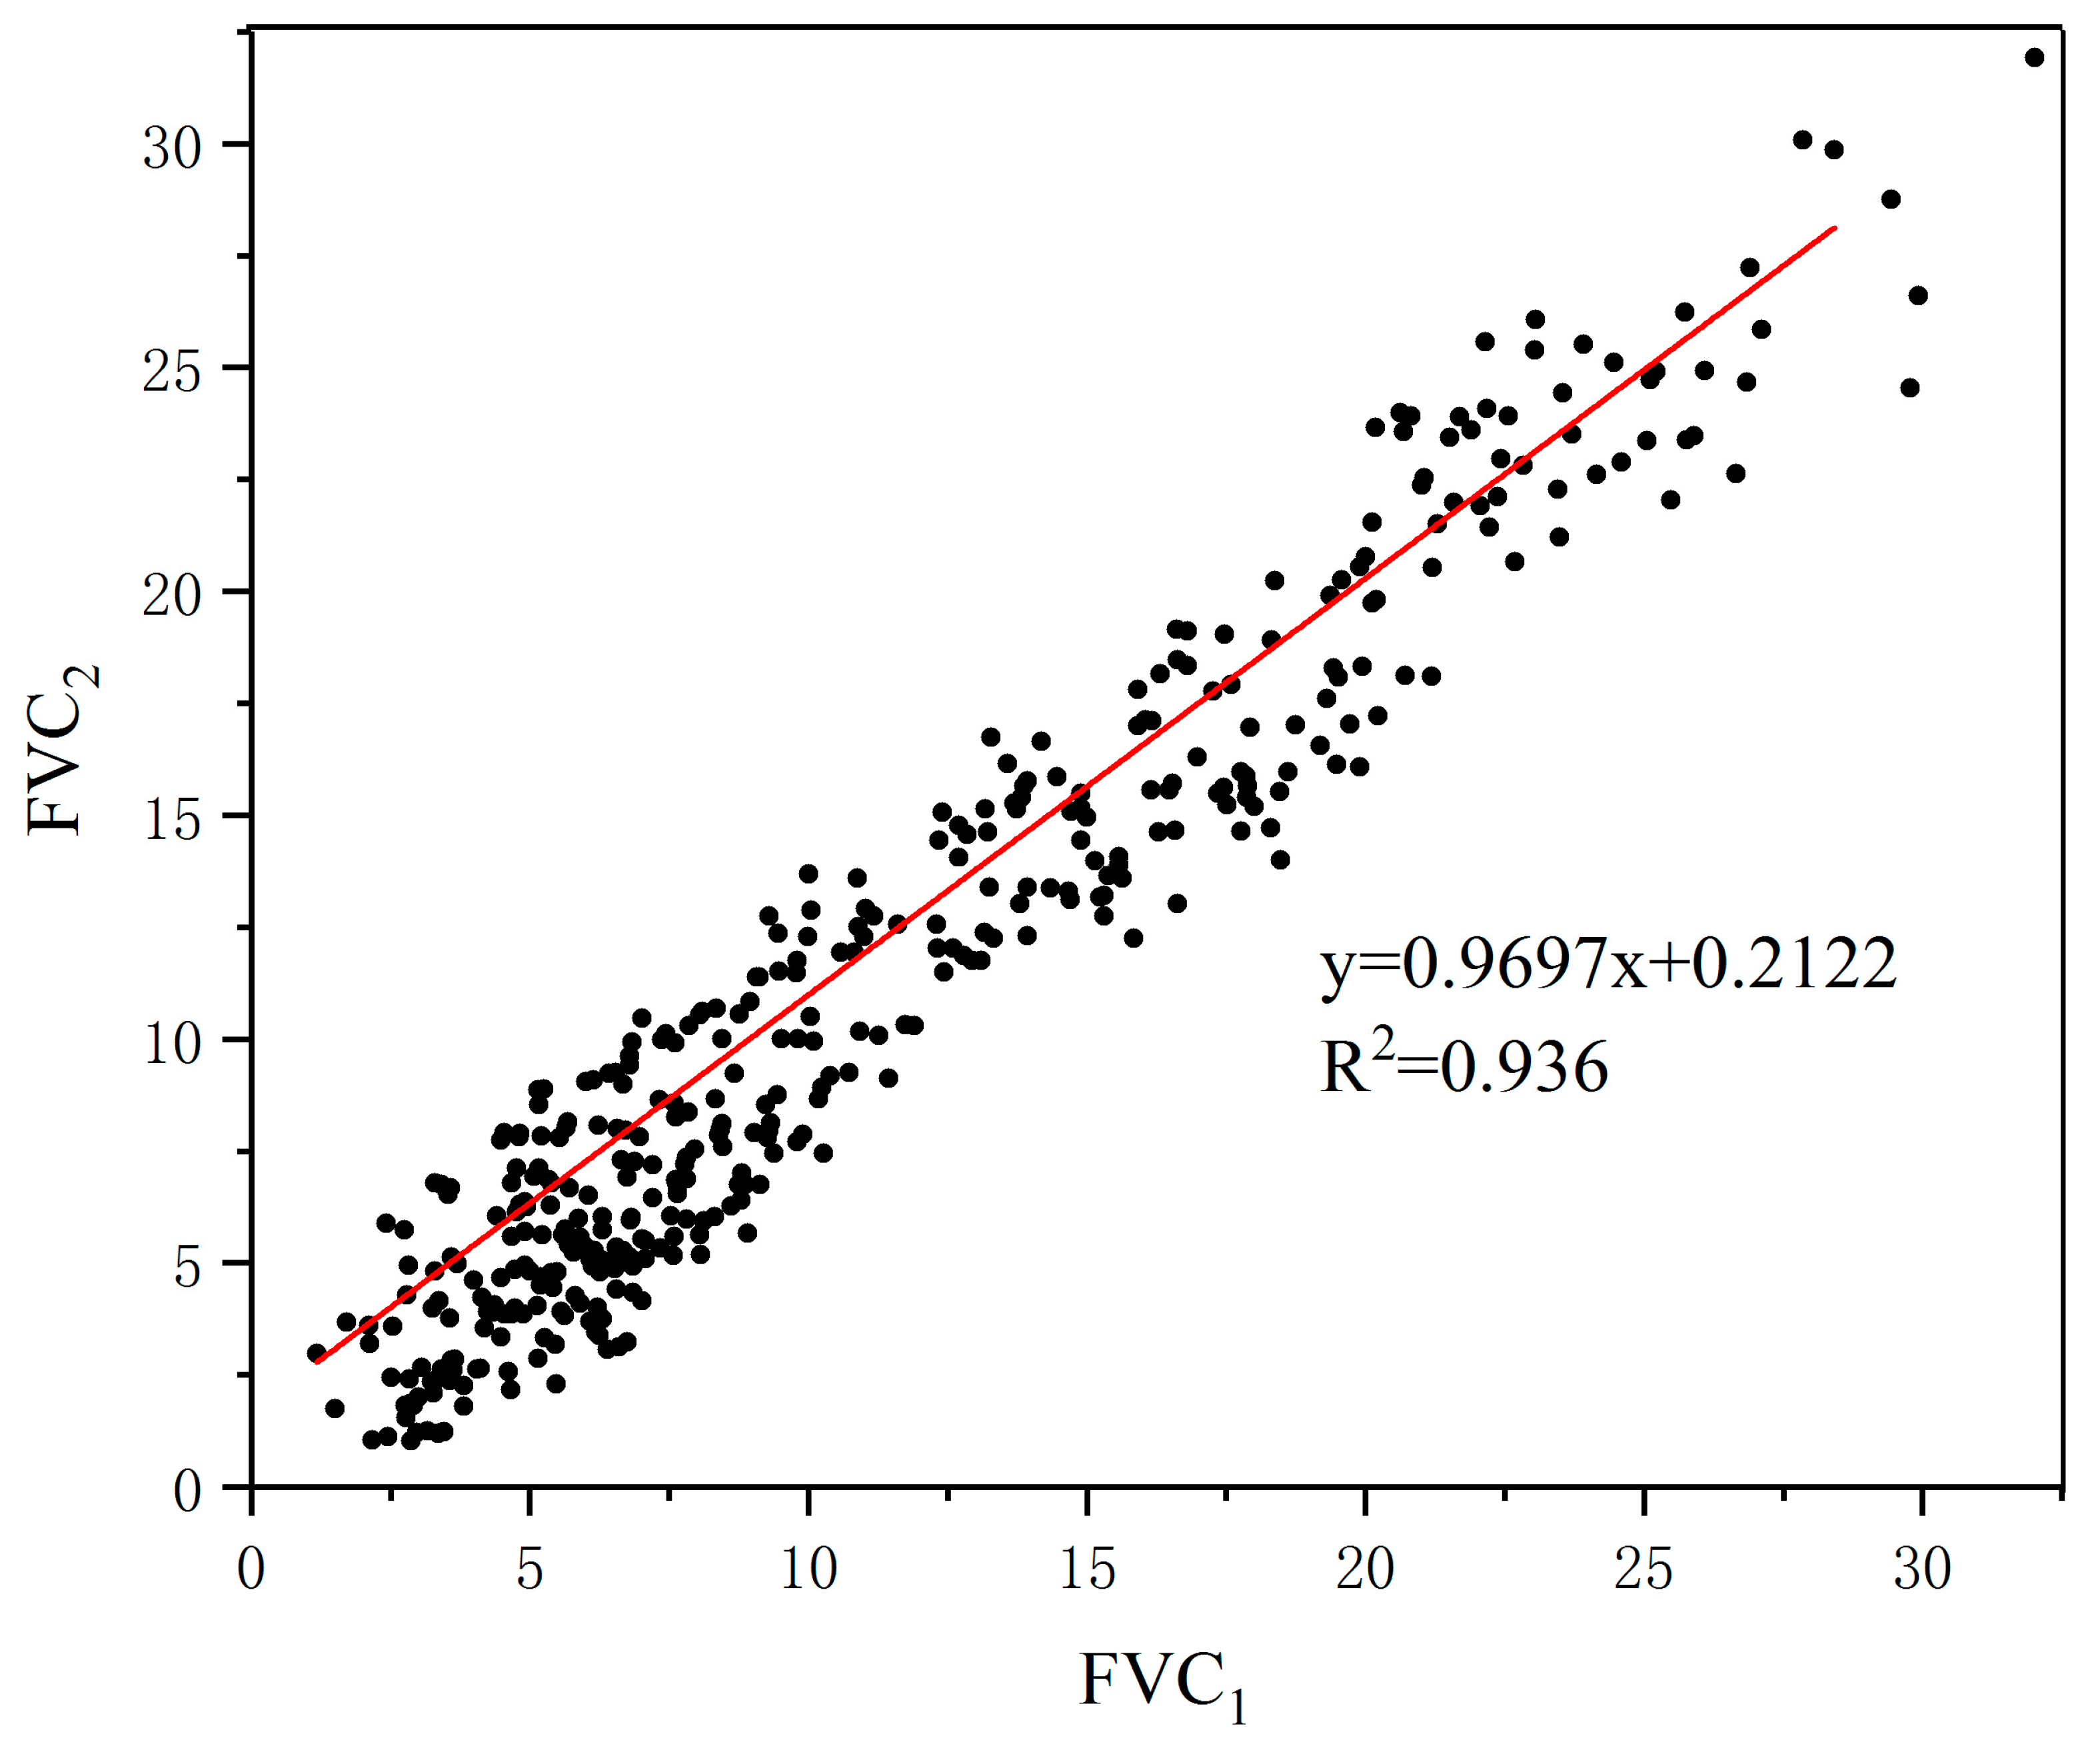
3.1. FVC Information Extraction Based on the Photographic Method

FVC information extracted from quadrat images based on the threshold method (Figure 5) show that the threshold method can distinguish between vegetation and non-vegetation well. By comparison, it is also seen that the extracted results by different people are relatively consistent in spatial distribution (Figure 5b,c), and the spatial distribution of extracted vegetation information is consistent with that of the original image (Figure 5a), indicating that the FVC information extracted by the threshold method is less affected by subjective factors. In order to further study the influence of the threshold method on the FVC estimation of the quadrat image, the FVC data extracted by the two individuals was analyzed (Figure 6). The results show that the two groups of data have very high correlation, and the correlation coefficient reached 0.936, further indicating that the threshold method for FVC information is barely affected by subjective factors and is robust.

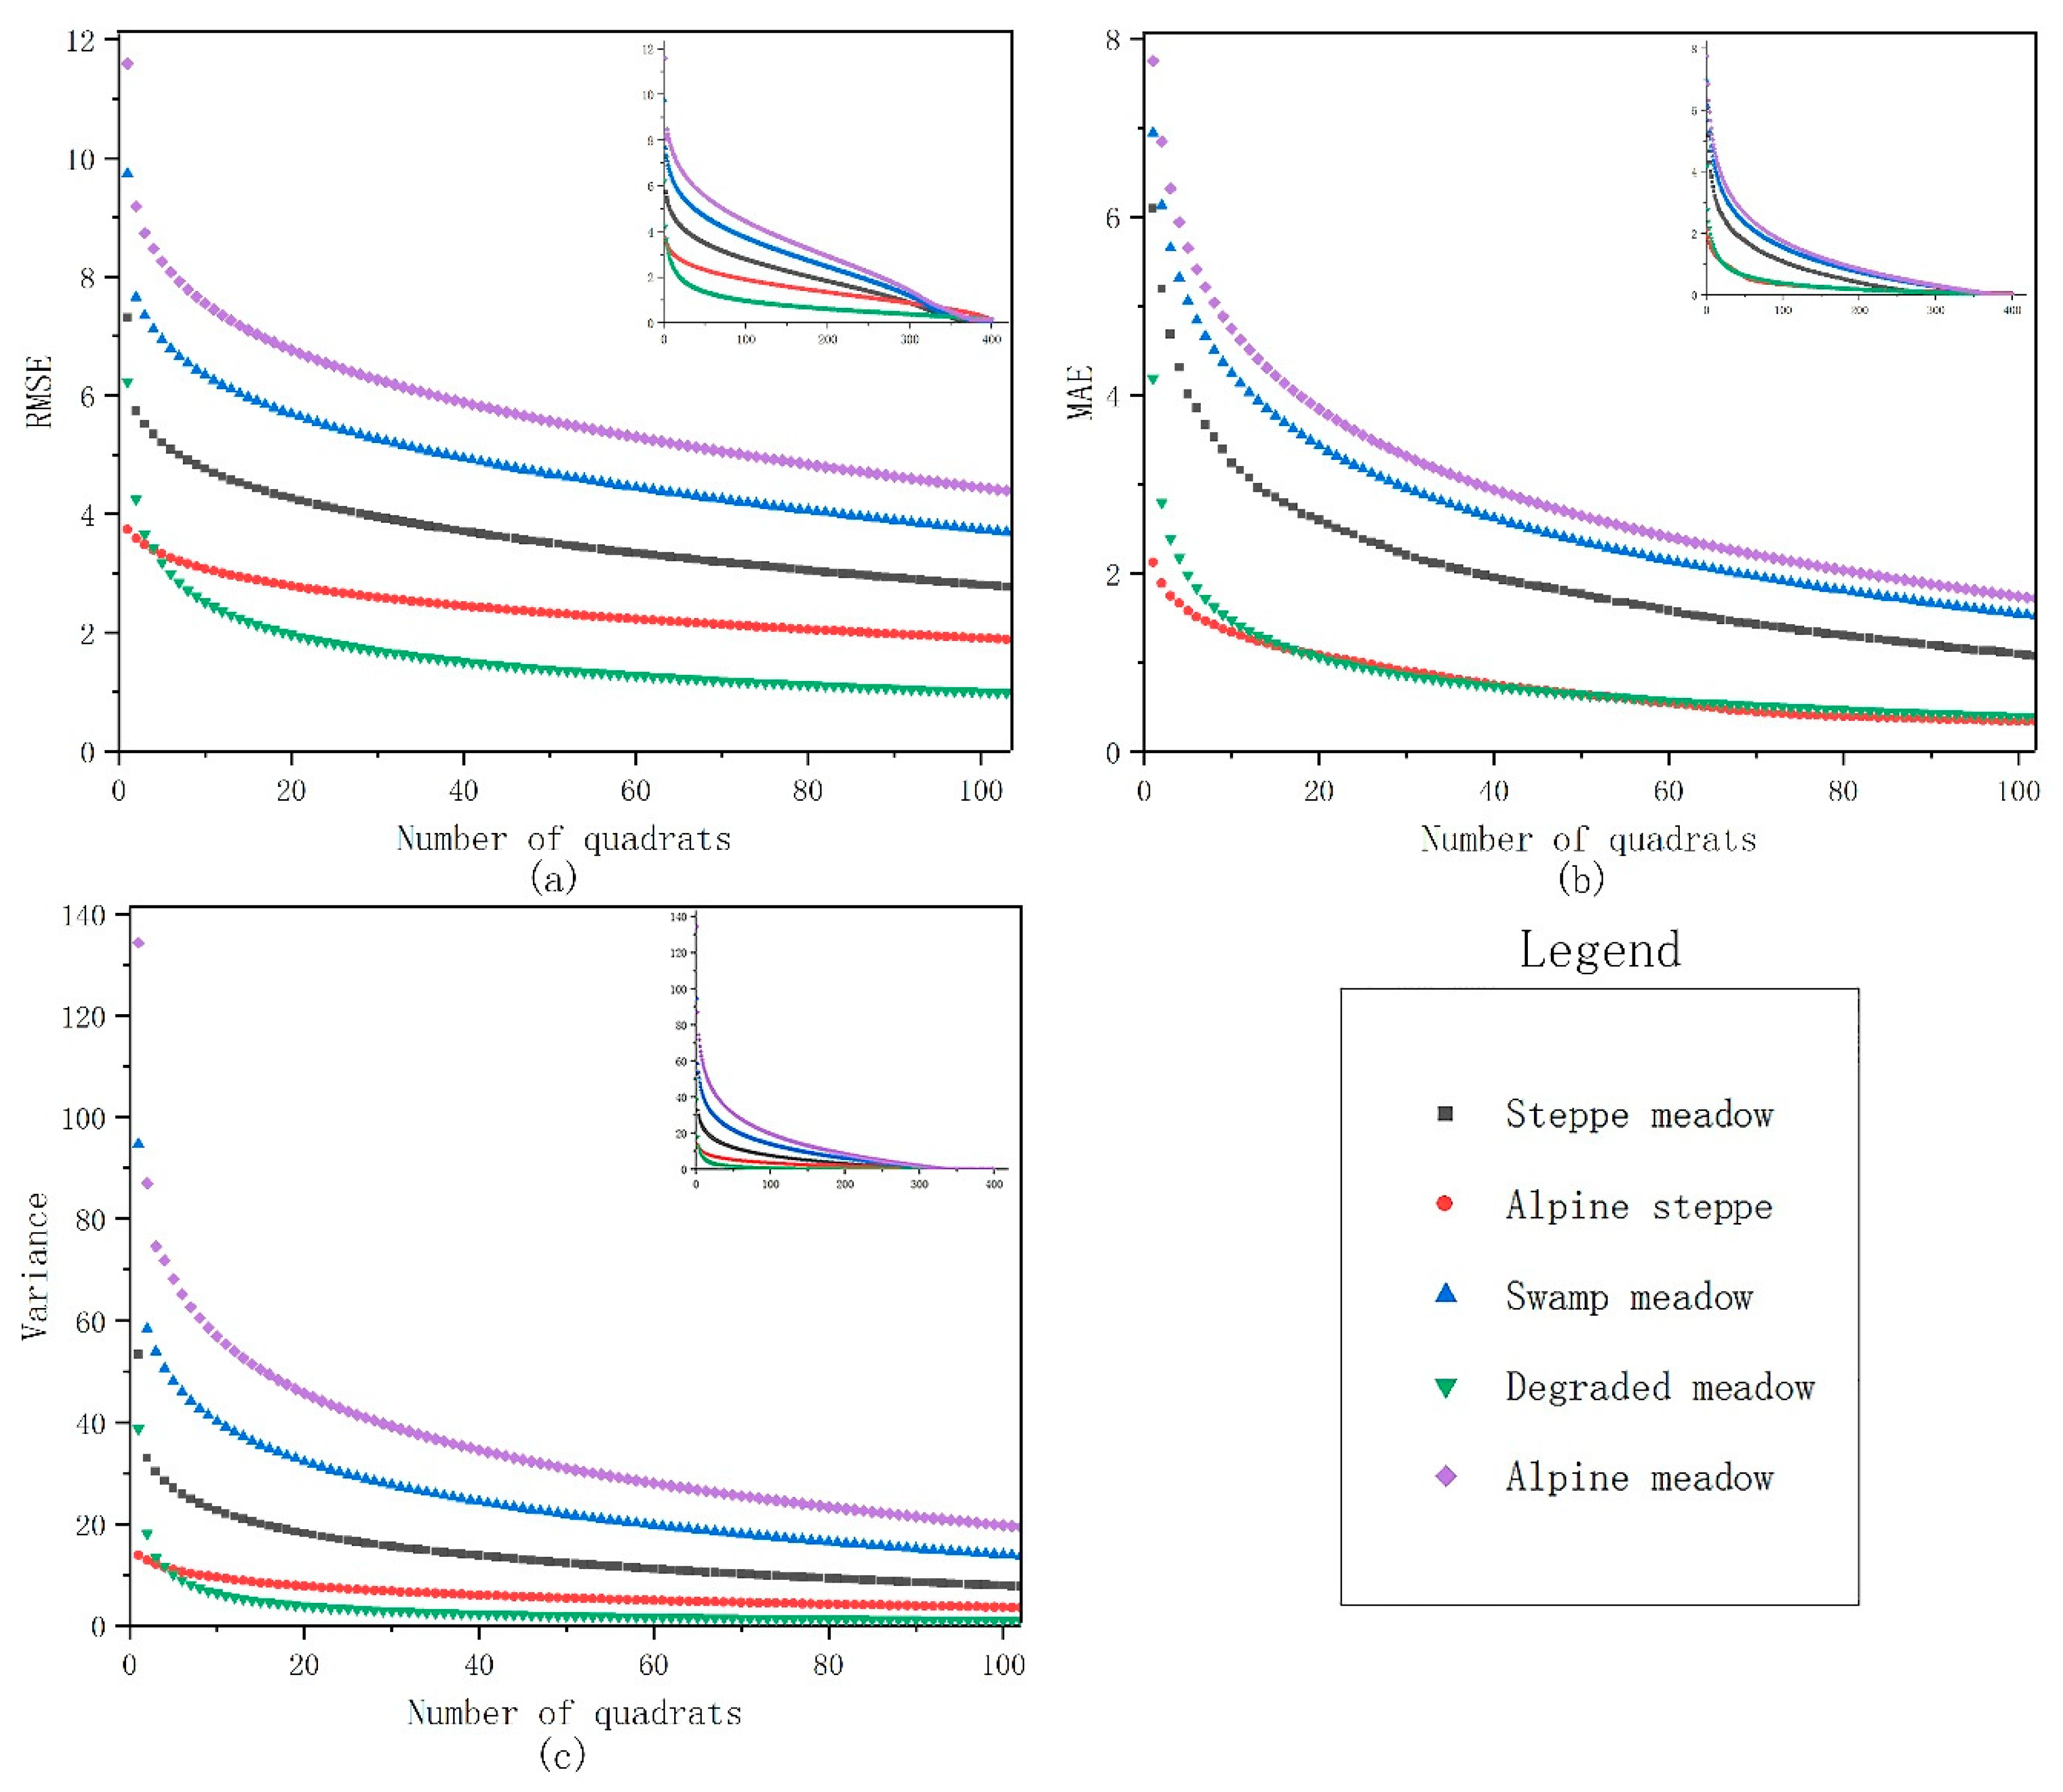
3.2. The Relationship between the Number of Quadrats and the Error of Survey Results

For the five grassland types in the study area, there was a logarithmic relationship between the number of quadrats and the survey error. With the increase of the number of quadrats, the error of the survey results was smaller, and the obtained FVC was closer to the true value of the remote sensing pixel scale. Additionally, different grassland types had specific differences in the relationship between the number of quadrats and the error of survey results of FVC. When the number of quadrats was the same, the largest error of the survey results was observed in the alpine meadow, followed by the swamp meadow, steppe meadow, alpine steppe and degraded meadow. When the error of the survey results was held constant, the degraded meadow required the least amount of quadrats, while the alpine meadow required the most. From the relationship between the error of the survey results and the number of quadrats (Figure 7), it can be seen that with the increase of the number of quadrats, the most obvious error trend is the alpine meadow, and the error trend of the alpine steppe is the smallest.

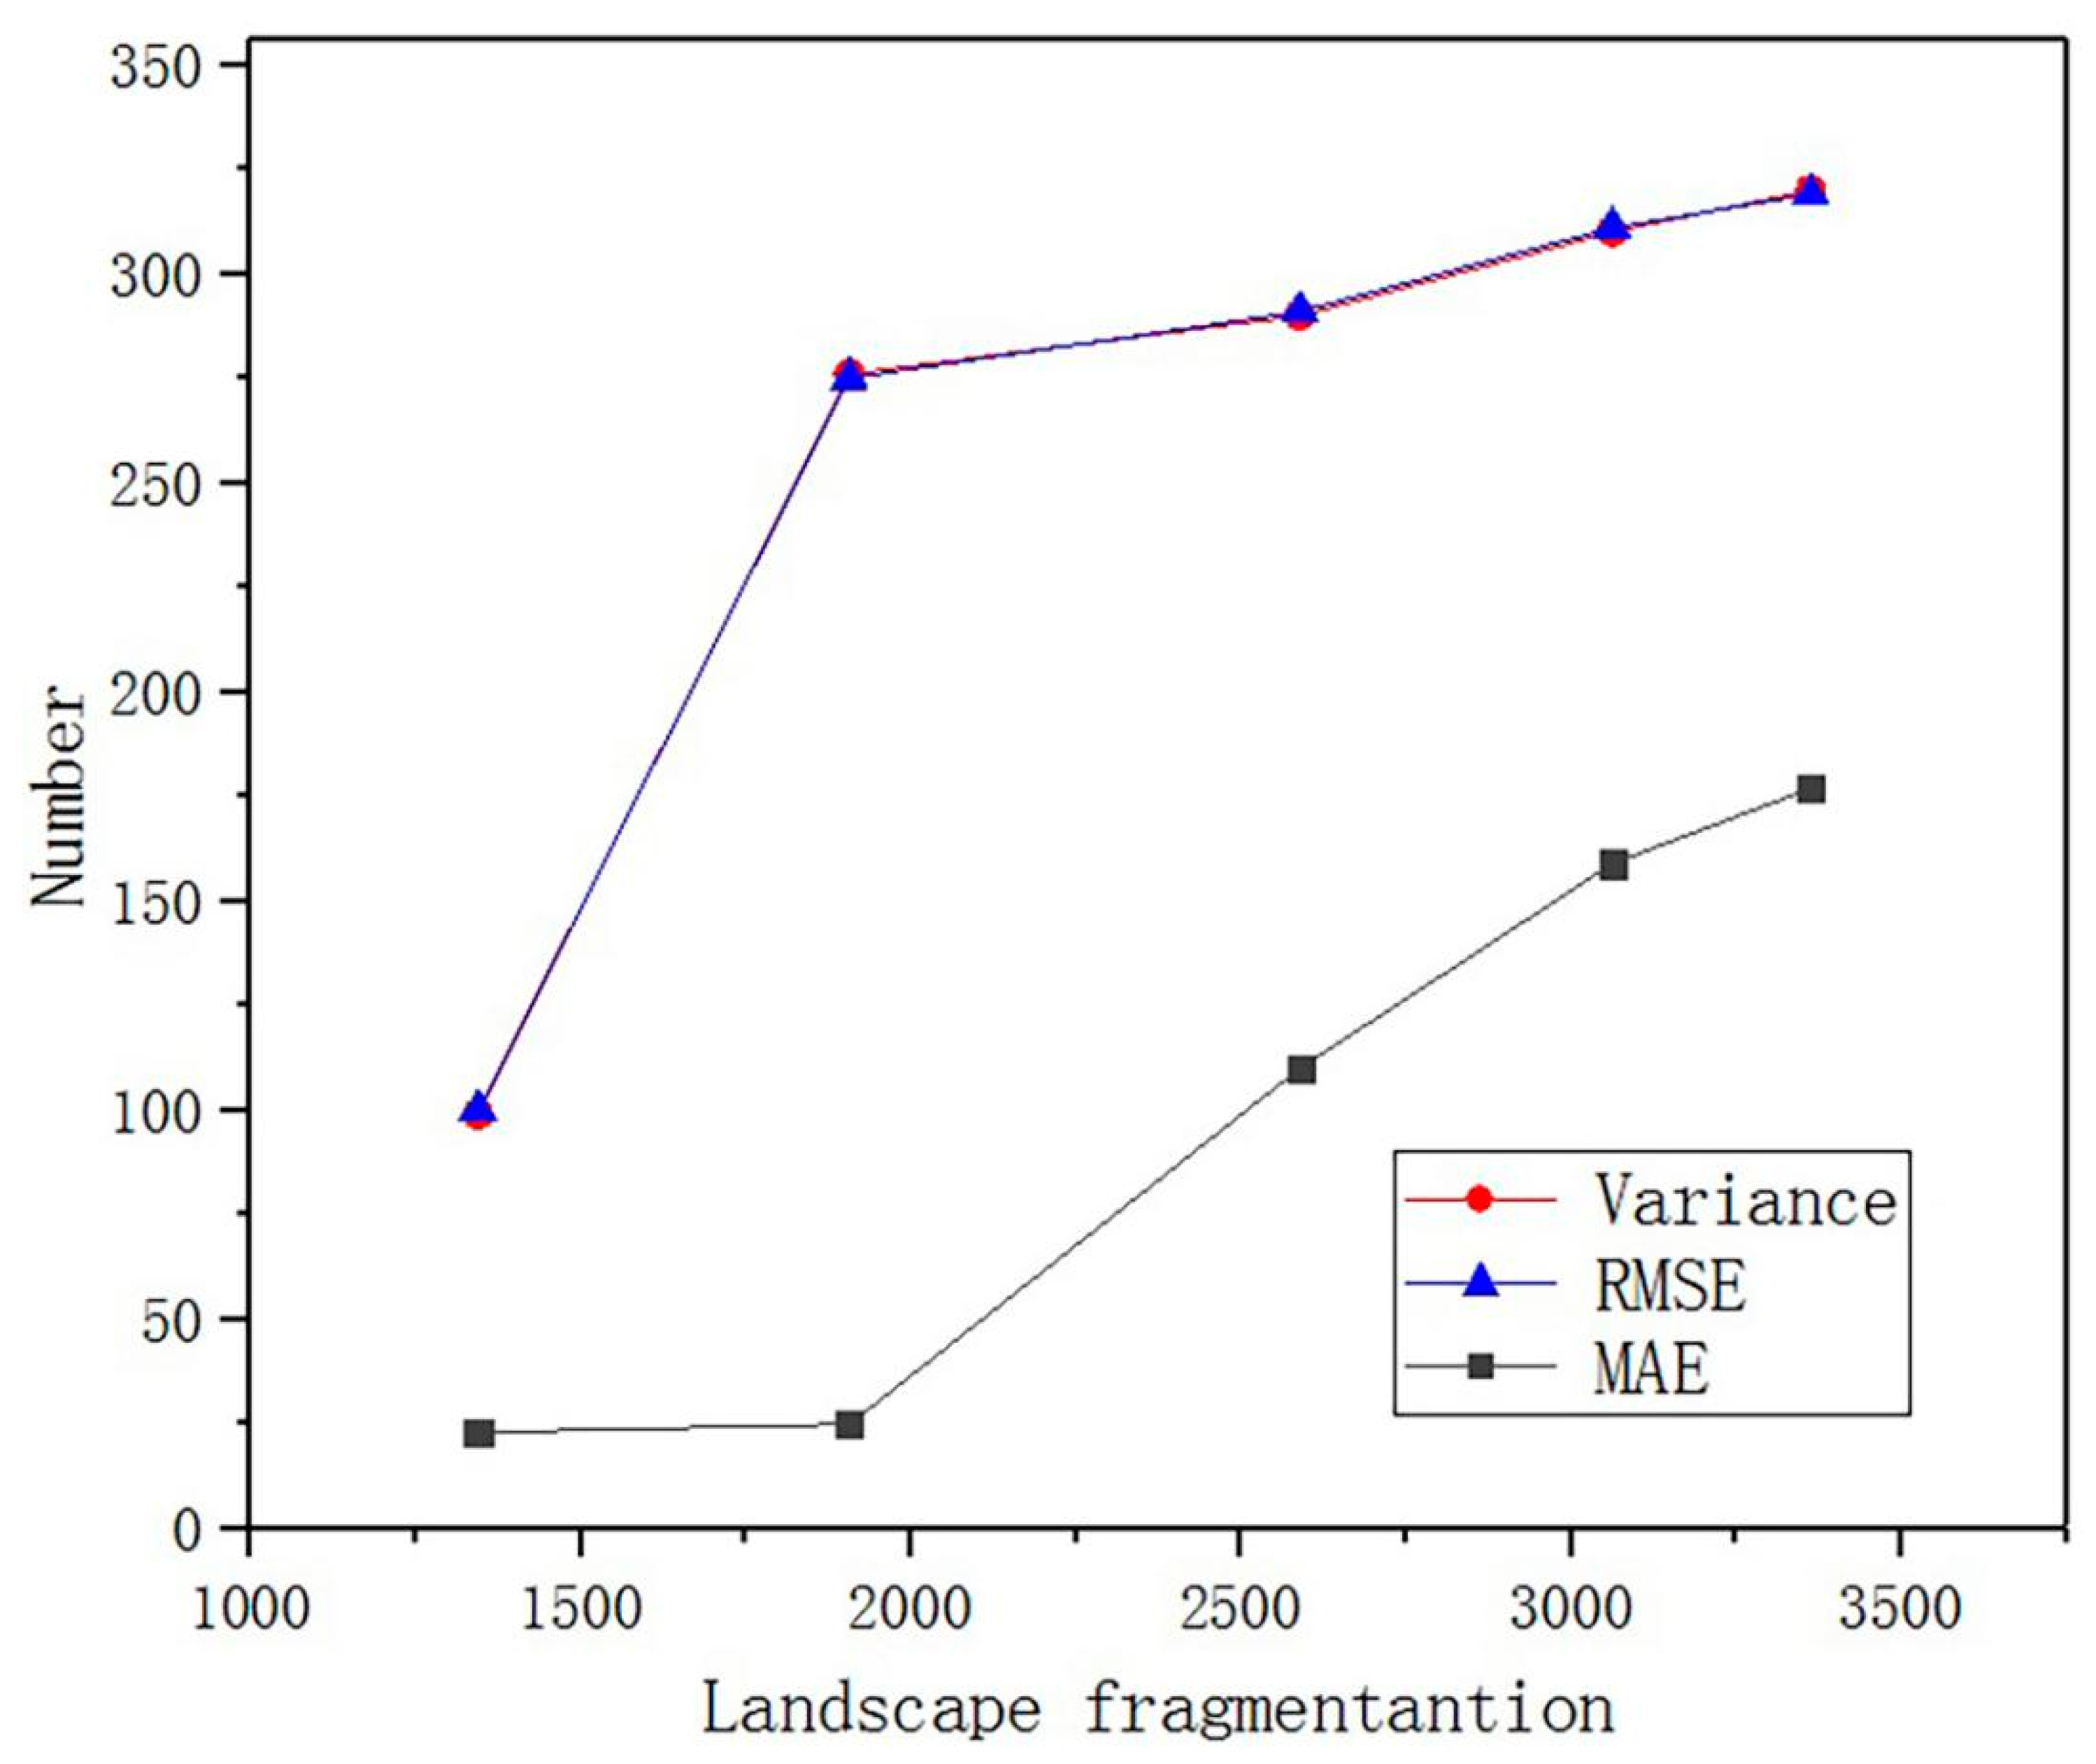
3.3. The Relationship between the Degree of Fragmentation of the Underlying Surface and the Required Number of Quadrats

In this study, the relationship between the degree of fragmentation of the landscape pattern and the survey accuracy of FVC was analyzed by calculating the patch density of five grassland types in the study area. The patch density is the ratio of the number of patches to the area, and its size reflects the degree of fragmentation and spatial heterogeneity of the surface. In order to avoid the influence of the underlying surface heterogeneity, 1 was used as the error measurement value of the three precision indicators of RMSE, MAE and variance, and the number of quadrats required for the five plots in the study area was investigated. The study found that the patch density of the alpine steppe was the smallest, indicating that the alpine steppe was dominated by large patches and the degree of fragmentation was low (Table 1); the patch density of the alpine meadow was the largest, indicating that the patches of the alpine meadow were mainly composed of small patches and the degree of fragmentation was the highest. With the increase of the degree of fragmentation of the plot, the number of ground survey quadrats required to obtain high-precision FVC also increased (Figure 8). The results show that the degree of fragmentation of the underlying surface has a high correlation with the number of quadrats required for high-precision FVC.

4. Discussion

4.1. FVC Extraction Effect

Most of the previous studies have reported that photography is an effective method for the field investigation of FVC, and it is also widely used in ecological environment investigation, and provides ground verification and parameters for remote sensing estimation and related models. For example, Liu et al. [16] use digital photos to estimate FVC under different background conditions. Song et al. [17] propose a new algorithm for extracting FVC from digital photos. Our study utilizes the threshold method to extract the FVC information from the quadrat image (Figure 5), and shows that this method can extract the vegetation information very well. It was also revealed that the spatial distribution results obtained by a different person are consistent, and this consistency is also observed with the spatial distribution of vegetation in the original image. This indicates that the threshold method extracts the quadrat FVC information well and with less subjectivity. In order to further study the influence of the threshold method on the FVC estimation of the quadrat image, the coefficient for the best fit line of the FVC data independently extracted by two persons reached 0.936, which exhibits very good robustness. This study verifies that the FVC information is accurate and reliable, including both the spatial distribution and the absolute value of the vegetation coverage. Therefore, this method can be used in future related research.

4.2. The Effect of the Number of Quadrats on the FVC Survey

The acquisition of ground measured data is the key to quantitative satellite remote sensing inversion, which can not only be used as data for remote sensing inversion, but is also significant for an accurate evaluation and verification of FVC remote sensing monitoring. However, acquiring large-scale measured data that matches the satellite remote sensing pixel scale is a major challenge in the study of FVC [18]. At present, the method most commonly used is to arrange a certain number of plots that match the satellite remote sensing pixel scale in the field, and then arrange several sample quadrats in the sample plot, and take the mean value of the sample survey results as the measured values of the corresponding plots. For example, Yi et al. [19] used the mean of nine quadrats in each plot as a measured value. In addition, Li et al. [1] used the mean of just five quadrats in each plot as a measured value. However, the accuracy of this method has not yet been reported. Most reports take the field survey data as the true value, but few studies have investigated the representativeness of the quadrats in regard to how the various methods and number of quadrats impact the survey results on the satellite remote sensing pixel scale. This study analyzes the spatial correlation between the number of quadrats and the FVC survey results in the satellite remote sensing pixel scale for the five grassland types. We find that there exists an exponential function relationship between the number of quadrats and the survey error for the five grassland types in the study area. With the increase of the number of quadrats, the error of the survey results is smaller, and the obtained FVC is closer to the real data of the satellite remote sensing pixel scale; however, different grassland types have differences in the relationship between the number of quadrats and the error of FVC survey results. Our study suggests that in future studies, the number of quadrats ought to be considered according to the heterogeneity of the underlying surface, as it influences the accuracy of the results when conducting field surveys with the sampling method. This study improves the understanding of quadrat error and helps to better estimate large-scale FVC. However, we have only studied five common grassland types on the Qinghai-Tibet Plateau, and whether other vegetation types also have acquaintance conclusions, needs to be demonstrated in future research.

4.3. Influence of the Degree of Fragmentation on FVC Estimation

Vegetation fragmentation causes the vegetation elements to be broken into numerous small patches, which affects their distribution structure. Therefore, FVC and fragmentation are closely related to the landscape pattern. For example, Kamusoko et al. [20] analyze landscape fragmentation by calculating different levels of landscape indicators and patch number; Saikia et al. [21] use Landsat images to evaluate the degree of fragmentation of land use. Amarnath et al. [22] evaluate the degree of fragmentation using the regression parameter slope and linear regression model based on the measured data. In addition, the fragmentation of underlying surfaces will affect the spectral signal of the remote sensing image and increase the complexity of the pixel component, which will bring uncertainty to satellite remote sensing inversion. For example, trees and grass co-exist in the savannahs, forming a landscape with vegetation fragmentation, which brings certain difficulties to the monitoring of dynamic changes of grass and tree cover in these savannahs [23,24]. In this study, fragmentation analysis was carried out on the plots. It is found (Figure 8) that there are some differences in the degree of fragmentation of the underlying surfaces of different grassland types, and these differences affect the accuracy of the estimation of FVC. For plots with a low degree of fragmentation, the number of field survey samples required to verify the accuracy of FVC is small. This analysis of the degree of fragmentation of the underlying surface provides insight for improving the accuracy of FVC estimation in future studies.

5. Conclusions

In this study, the image data of the ground sample in the source area of the Shule River was obtained by the photography method, and the FVC information was extracted by different people using the threshold method. This study finds that extracting the FVC from the original image based on the threshold method of the pixel is highly reliable, as the data was analyzed by two different people independently and was robust. During the analysis of the relationship between the number of sample quadrats and the accuracy of our FVC survey in the satellite remote sensing pixel scale, it is found that there are logarithmic relationships between the number of quadrats on the ground and the survey error for the five grassland types in the study area. Different grassland types have specific differences in the relationship between the number of sample quadrats and the error of FVC survey results. This study finds that the higher the degree of fragmentation, the more sample quadrats are needed to improve the accuracy of the FVC estimation. Therefore, when obtaining the measured FVC in the field by the sample method, the heterogeneity of the underlying surface should be considered.

Author Contributions

Jianjun Chen designed experiments; Xuning Zhao and Jianjun Chen wrote manuscripts; Xuning Zhao, Jianjun Chen, and Huizi Zhang processed the experimental data; Yu Qin and Shuhua Yi contributed in field surveying and data collection; All authors contributed to the interpretation of the results and the writing of the paper.

Funding

This research was funded by the National Natural Science Foundation of China, grant number 41801030, 41901370, and 41961065; the Guangxi Natural Science Foundation, grant number 2018GXNSFBA281054, 2018GXNSFBA281075, and 2017GXNSFDA198016; the Research Foundation of Guilin University of Technology, grant number GUTQDJJ2017069; the BaGuiScholars program of the provincial government of Guangxi (Guoqing Zhou).

Acknowledgments

The authors would like to thank the editor and three anonymous reviewers for very thoughtful reviews on the previous version of this paper.

Conflicts of Interest

The authors declare no conflict of interest.

References

  1. Li, F.; Chen, W.; Zeng, Y.; Zhao, Q.J.; Wu, B.F. Improving estimates of grassland fractional vegetation cover based on a pixel dichotomy model: A case study in Inner Mongolia, China. Remote Sens. 2014, 6, 4705–4722. [Google Scholar] [CrossRef]
  2. Lehnert, L.W.; Meyer, H.; Wang, Y.; Miehe, G.; Thies, B.; Reudenbach, C.; Bendix, J. Retrieval of grassland plant coverage on the Tibetan Plateau based on a multi-scale, multi-sensor and multi-method approach. Remote Sens. Environ. 2015, 164, 197–207. [Google Scholar] [CrossRef]
  3. Song, W.J.; Mu, X.H.; Ruan, G.Y.; Gao, Z.; Li, L.Y.; Yan, G.J. Estimating fractional vegetation cover and the vegetation index of bare soil and highly dense vegetation with a physically based method. Int. J. Appl. Earth Obs. 2017, 58, 168–176. [Google Scholar] [CrossRef]
  4. Chen, W.; Sakai, T.; Moriya, K.; Koyama, L.; Cao, C.X. Estimation of vegetation coverage in Semi-arid sandy land based on multivariate statistical modeling using remote sensing data. Environ. Model. Assess. 2013, 18, 547–558. [Google Scholar] [CrossRef]
  5. Okin, G.S.; Clarke, K.D.; Lewis, M.M. Comparison of methods for estimation of absolute vegetation and soil fractional cover using MODIS normalized BRDF-adjusted reflectance data. Remote Sens. Environ. 2013, 130, 266–279. [Google Scholar] [CrossRef] [Green Version]
  6. Chen, Y.; Song, Y.Q.; Wang, W. Grassland vegetation cover inversion model based on random forest regression: A case study in Burqin County, Altay, Xinjiang Uygur Autonomous Region. Acta Ecologica Sinica 2018, 38, 2384–2394. [Google Scholar]
  7. Jia, K.; Liang, S.L.; Liu, S.; Li, Y.; Xiao, Z.; Yao, Y.; Jiang, B.; Zhao, X.; Wang, X.; Xu, S.; et al. Global land surface fractional vegetation cover estimation using general regression neural networks from MODIS surface reflectance. IEEE Trans. Geosci. Remote 2015, 53, 4787–4796. [Google Scholar] [CrossRef]
  8. Delamater, P.L.; Messina, J.P.; Qi, J.G.; Cochrane, M.A. A hybrid visual estimation method for the collection of ground truth fractional coverage data in a humid tropical environment. Int. J. Appl. Earth Obs. 2012, 18, 504–514. [Google Scholar] [CrossRef]
  9. Jia, K.; Liang, S.L.; Gu, X.F.; Baret, F.; Wei, X.Q.; Wang, X.X.; Yao, Y.J.; Yang, L.Q.; Li, Y.W. Fractional vegetation cover estimation algorithm for Chinese GF-1 wide field view data. Remote Sens. Environ. 2016, 177, 184–191. [Google Scholar] [CrossRef]
  10. Qin, Y.; Yi, S.; Ren, S.; Li, N.; Chen, J. Responses of typical grasslands in a semi-arid basin on the Qinghai-Tibetan Plateau to climate change and disturbances. Environ. Earth Sci. 2014, 71, 1421–1431. [Google Scholar] [CrossRef]
  11. Chen, J.J.; Yi, S.H.; Qin, Y.; Wang, X.Y. Improving estimates of fractional vegetation cover based on UAV in alpine grassland on the Qinghai-Tibetan Plateau. Int. J. Remote Sens. 2016, 37, 1922–1936. [Google Scholar] [CrossRef]
  12. Yi, S.H.; Chen, J.J.; Qin, Y.; Xu, G.W. The burying and grazing effects of plateau pika on alpine grassland are small: A pilot study in a semiarid basin on the Qinghai-Tibet Plateau. Biogeosciences 2016, 13, 6273–6284. [Google Scholar] [CrossRef]
  13. Chen, J.J.; Yi, S.H.; Qin, Y. The contribution of plateau pika disturbance and erosion on patchy alpine grassland soil on the Qinghai-Tibetan Plateau: Implications for grassland restoration. Geoderma 2017, 297, 1–9. [Google Scholar] [CrossRef]
  14. Baldi, G.; Guerschman, J.P.; Paruelo, J.M. Charactering fragmentation in temperate South America grasslands. Agric. Ecosyst. Environ. 2006, 116, 197–208. [Google Scholar] [CrossRef]
  15. Dewan, A.M.; Yamaguchi, Y.; Rahman, M.Z. Dynamics of land use/cover changes and the analysis of landscape fragmentation in Dhaka Metropolitan, Bangladesh. GeoJournal 2012, 77, 315–330. [Google Scholar] [CrossRef]
  16. Liu, Y.K.; Mu, X.H.; Wang, H.X.; Yan, G.J. A novel method for extracting green fractional vegetation cover from digital images. J. Veg. Sci. 2012, 23, 406–418. [Google Scholar] [CrossRef]
  17. Song, W.J.; Mu, X.H.; Yan, G.J.; Huang, S. Extracting the green fractional vegetation cover from digital images using a shadow-resistant algorithm (SHAR-LABFVC). Remote Sens. 2015, 7, 10425–10443. [Google Scholar] [CrossRef]
  18. Chen, X.X.; Vierling, L.; Rowell, E.; DeFelice, T. Using lidar and effective LAI data to evaluate IKONOS and Landsat 7 ETM+ vegetation cover estimates in a ponderosa pine forest. Remote Sens. Environ. 2004, 91, 14–26. [Google Scholar] [CrossRef]
  19. Yi, S.H.; Zhou, Z.Y.; Ren, S.L.; Xu, M.; Qin, Y.; Chen, S.Y.; Ye, B.S. Effects of permafrost degradation on alpine grassland in a semi-arid basin on the Qinghai-Tibetan Plateau. Environ. Res. Lett. 2011, 6, 045403. [Google Scholar] [CrossRef]
  20. Kamusoko, C.; Aniya, M. Land use/cover change and landscape fragmentation analysis in the Bindura District, Zimbabwe. Land Degrad. Dev. 2007, 18, 221–233. [Google Scholar] [CrossRef]
  21. Saikia, A.; Hazarika, R.; Sahariah, D. Land-use/land-cover change and fragmentation in the Nameri Tiger Reserve, India. Geogr. Tidsskrift-Dan. J. Geogr. 2013, 113, 1–10. [Google Scholar] [CrossRef]
  22. Amarnath, G.; Babar, S.; Murthy, M.S.R. Evaluating MODIS-vegetation continuous field products to assess tree cover change and forest fragmentation in India-A multi-scale satellite remote sensing approach. Egypt. J. Remote Sens. Space Sci. 2017, 20, 157–168. [Google Scholar] [CrossRef]
  23. Ibrahim, S.; Balzter, H.; Tansey, K.; Tsutsumida, N.; Mathieu, R. Estimating fractional cover of plant of functional types in African savanna from harmonic analysis of MODIS time-series. Int. J. Remote Sens. 2018, 39, 2718–2745. [Google Scholar] [CrossRef]
  24. Ibrahim, S.; Balzter, H.; Tansey, K.; Mathieu, R.; Tsutsumida, N. Impact of Soil Reflectance Variation Correction on Woody Cover Estimation in Kruger National Park Using MODIS Data. Remote Sens. 2019, 11, 898. [Google Scholar] [CrossRef]
Figure 1. Spatial distribution of study sites in the upper reaches of Shule River.
Ijgi 08 00497 g001
Figure 2. Field sampling methods and effect diagrams (a) unmanned aerial vehicle (UAV) sampling method; (b) ground sampling method.
Ijgi 08 00497 g002
Figure 3. Diagram of each quadrat in sample plot. The sample plot is 10 m ×10 m and includes 400 sample quadrats, each measuring 0.5 m × 0.5 m, numbered from 1 to 400 and evenly distributed throughout the sample plot.
Ijgi 08 00497 g003
Figure 4. Effect diagram (a) original image; (b) processing result of image (Red curves and yellow curves indicate vegetation contour, non-vegetation contour respectively).
Ijgi 08 00497 g004
Figure 5. Comparison of results of vegetation areas extracted by a different person ((a) is the original image, and (b,c) are the fractional vegetation cover (FVC) information extraction results of this different person, respectively, while white and black represent vegetation and non-vegetation, respectively).
Ijgi 08 00497 g005
Figure 6. Comparison of the FVCs of the quadrat extracted by the different person (FVC1 and FVC2 represent the FVC data obtained by different people, respectively).
Ijgi 08 00497 g006
Figure 7. The relationship between the number of different quadrats and the error of survey results.
Ijgi 08 00497 g007
Figure 8. The relationship between the landscape fragmentation degree and the number of quadrats.
Ijgi 08 00497 g008
Table 1. The patch density of five alpine grassland types.
Grassland
Type
Steppe
Meadow
Alpine
Steppe
Swamp
Meadow
Degraded
Meadow
Alpine
Meadow
PD2588.8821906.5063061.8821343.4803362.939

