Abstract
Location-Based Social Networks (LBSNs) contain rich information that can be used to identify and annotate points of interest (POIs). Discovering these POIs and annotating them with this information is not only helpful for understanding the social behavior of users, but it also provides benefits for location recommendations. However, current methods still have some limitations, such as a long annotating time and a low annotating accuracy. In this study, we develop a hybrid method to annotate POIs with meaningful information from LBSNs. The method integrates three patterns: temporal, spatial, and text patterns. Firstly, we present an approach for preprocessing data based on temporal patterns. Secondly, we describe a way to discover POIs through spatial patterns. Thirdly, we build a keyword dictionary for discovering the categories of POIs to be annotated via mining the text patterns. Finally, we integrate these three patterns to label each POI. Taking New York and London as the target areas, we accomplish automatic POI annotation by using Precision, Recall, and F-values to evaluate the effectiveness. The results show that our F-value is 78%, which is superior to that of the baseline method (Falcone’s method) at 73% and this suggests that our method is effective in extracting POIs and assigning them categories.
1. Introduction
With the rapid expansion in the use of smartphones and the advancements in positioning technology, a large volume of data from Location-Based Social Networks (LBSNs), such as Foursquare, Flickr, and Facebook Places, have been produced [1,2,3,4,5]. These LBSN data contain an enormous amount of check-in records that contain information on location (Latitude/longitude) and time (timestamp) as well as comments. From these check-in records we can discover information which can be used to identify Points of Interest (POIs). These POIs and the meaningful information hidden in the check-in data are not only helpful in understanding the social behaviors of users but also benefit urban planning and location recommendation [2,4,6,7]. Therefore, automatically discovering POIs and map them into categories (hereafter referred to as automatic POI annotation) has become a hot topic in research [7,8,9,10,11].
Current methods of automatic POI annotation can be classified into two main types according to the information patterns used: single pattern-based methods and hybrid pattern-based methods. The basic idea of single pattern-based methods is that they simply use one information pattern during POI annotation. They are further divided into three kinds: temporal pattern-based methods, spatial pattern-based methods, and text pattern-based methods. Hybrid pattern-based methods often combine multiple patterns, such as spatiotemporal pattern-based methods, to perform POI annotation [9,10,11].
The temporal pattern-based methods first discover regular temporal patters from the LBSN data and then use the information inferred from these temporal patterns to discover and annotate POIs. A variety of temporal patterns could be mined from LBSN data. Commonly used temporal patterns include frequency of access to particular locations, duration of the visit, periodicity of visits. Many researchers have found that these temporal patterns can effectively distinguish POIs of different categories, thus they explored the temporal regularity to annotate a POI [8,12,13]. The apparent periodicity of POIs, such as day and night, weekday as well as weekend, was directly explored as a temporal pattern [14]. To discover the implied temporal pattern from users’ visitation trends, Shannon Entropy or other mathematical concepts have been adopted [7]. Despite the fact that methods based on temporal patterns can achieve high accuracy in annotating POIs, these methods only work well when the POIs’ temporal patterns are clear and easily discoverable. However, not all POIs necessarily hold clear temporal patterns, such as sports games or concerts where the event is only temporary and not regular. Furthermore, it is difficult to discover useful temporal patterns from these temporary events without the knowledge of particular locale and its functions.
To address these shortcomings of temporal pattern-based methods, researchers have tried to mine spatial patterns from the raw data of LBSNs and to complete POI annotations. Spatial patterns could be discovered by clustering the check-in records since similar geographical characteristics of check-in records could be allocated to similar groups with similar POIs [15]. People who live close to each other may have similar living habits [6]. Thus, the demographic spatial distribution could also be used as auxiliary information for mining spatial patterns [16]. After obtaining similar groups according to spatial patterns, the information of the known POI category in the group could be used to annotate the unknown POIs in the same spatial groups. However, the accuracy of POI annotations based on spatial patterns is affected by the accuracy of the Global Positioning System (GPS) used, as deviations from true locations could be significant due to noise in mobile devices.
The text pattern-based methods make use of the text patterns in the comments to annotate POIs. For example, patrons of a tourist site might text to their respective friends or family members about the things they saw at the site. This information in the texts reveals the nature of the location and thus can be used to annotate POIs. However, the key issue in text pattern-based methods is how to extract category information from comments. Current research provides two approaches: syntactic based [17] and hot word-based [18]. The syntactic based approach can find more specific geographic words through syntactic dependencies among words [17], but it is time-consuming, and its results are redundant for POI annotation. The hot word-based approach counts the relevance between comment words and check-in locations through Kernel Density Estimation (KDE), then it chooses these highest-ranked words to annotate related locations [18]. Compared with the syntactic-based approach, the hot word method is more efficient, and there are many mature word extraction tools available, but this method [18] directly uses hot words to annotate the location without specifying its category. The text-based methods only focus on the text perspective of LBSN data, and sometimes the texts may not be relevant to the locations of the users’ visit. For example, a person might be texting to his/her friend about something which has nothing to do with the location the person is at. In addition, text pattern methods omit important information hidden in temporal patterns or spatial patterns.
The above three simple pattern methods (temporal pattern, spatial pattern, and the text pattern) can accomplish POI annotation under certain conditions. However, their efficiency and accuracy in POI annotation are not satisfactory. This may be due to the fact that they each only focus on one kind of information, that is, they simply use one of the three patterns separately. Recently, some researchers proposed a hybrid method by considering both temporal and spatial patterns. They believe that the combination of temporal and spatial patterns (i.e., the spatiotemporal patterns) can find POIs and annotate them with specifying categories better since the spatiotemporal pattern could discover POIs based on temporal and spatial thresholds, where a user will stay at a POI long enough to meet these thresholds [9]. Besides, spatiotemporal patterns can also be mined from other perspectives, such as demographic spatial distributions and moving speed [16,19]. Information from these aspects helps to identify the POI category with higher accuracy. For example, with the help of information on movement speed, we can identify whether a POI is a traffic station or not. That is, if the moving speed of many users changes greatly in a POI, it means that these users are traveling on some kind of traffic tool in this POI. Then, it could be inferred with a high probability that this POI is a transportation station [19]. Based on the spatiotemporal pattern, we can first discover useful POIs and then annotate them with semantic information instead of using the whole raw data.
The method of POI annotation based on spatiotemporal patterns optimizes the methods based on temporal or spatial patterns, and it slightly enhances the accuracy and decreases the POI annotation time. However, limitations still exist. For example, it omits rich information hidden in the text comment related to POIs. Considering the methods based on text patterns could mine POI context information with higher accuracy, we put forward a novel hybrid pattern-based method, which successively utilizes temporal, spatial, and text patterns in each step. The proposed method has two main contributions. One is that largely redundant raw data and noise data could be filtered out by making use of temporal periodicity and spatial aggregation, which leads to a reduction in computation time of processing the data. The other contribution is that our method could further improve the accuracy of POI annotation since context information is mined from the text comments related to POIs. In summary, the proposed method is able to annotate an unknown POI category with less labeling time and higher accuracy.
The remainder of this paper is organized as follows. Section 2 explains our methodology, introducing the check-in dataset, essential pre-processing, and key aspects of the hybrid-based approach. Section 3 describes the experimental design, performance metrics, and experimental results. Section 4 discusses the merits and drawbacks between our results and the baseline method (named Falcone’s method) [7]. Finally, the conclusion and future work are presented in Section 5.
2. Methodology
2.1. Basic Idea
The multiple patterns mined from different perspectives of one object could be used together to understand this object better in data mining fields [20]. As for POI annotation, we also believe that the integration of multiple patterns could more accurately annotate the POIs than using one or two of these patterns. This idea results in the development of our new method by comprehensively integrating temporal, spatial, and text patterns to discover and annotate POIs.
The process of the proposed method can also be divided into four parts: preprocessing data, discovering POIs, determining categories, and associating POIs with categories. To implement the above idea, we first preprocessed check-in data based on temporal patterns. Secondly, we discovered POIs through spatial patterns by clustering these check-in data. Thirdly, we built a keyword dictionary for discovering the categories of POIs to be annotated via mining the text patterns. Finally, we associated the category with each POI.
2.2. Study Region and Flickr Data
In actual use, LBSN data is obtained through users’ check-in behavior. Check-in data contains a user’s profile, temporal and spatial information, as well as text comments. Making use of this information helps to discover the context information of check-in locations [21].
The check-in data used in this paper were collected from Flickr, which is an online photo management service that allows uploading and sharing photos publicly or within groups [2]. The metadata in Flickr contains several properties about the record and user ID, upload date and time, location where a photo was taken, description, and tags. The properties of a record are shown in Table 1, where Flickr_id is the identifier of each record on the Flickr website. User_id is the user’s identifier on the Flickr website and represents each registered user. Create_date and Create_time represent the date and time a record was uploaded, respectively. Longitude and Latitude correspond to the geographical location, which are entered automatically by the GPS in the camera or manually by a user who has identified the photo’s location on the map. The last three fields—Title, Content, and User_tags— form the user’s comment text. We can infer from what is in Table 1 that the example may belong to the “College & University” category since its “Content” includes the word “University” and its coordinate (“Longitude” and “Latitude”) is located at New York University.

Table 1.
Flickr metadata properties.
Flickr has released a publicly available dataset of 49 million geotagged photos [22]. We extracted the metadata of partial records created by users worldwide from Flickr. This dataset contained 1,605,291 records, which were distributed worldwide as shown in Figure 1a. Meanwhile, we exploited KDE to analyze the popularity of Flickr check-in records, as shown in Figure 1b. There was apparently high popularity in several regions, such as North America and Europe, which are typically developed regions. It is not difficult to see that the popularity of check-ins in the northern hemisphere is substantially higher than that in the southern hemisphere.
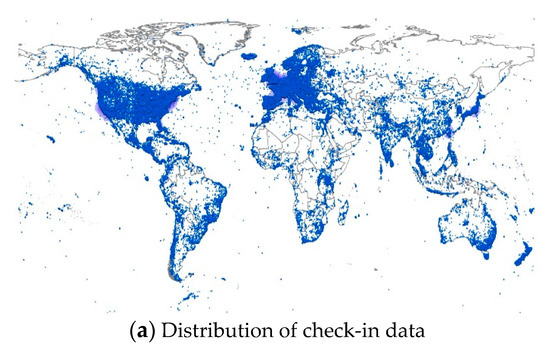
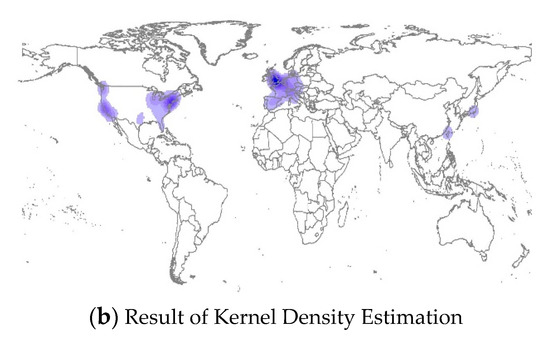
Figure 1.
Distribution of global check-in data. Subfigure (a) is about spatial distribution of check-in data, Subfigure (b) is about the result of check-in locations through Kernel Density Estimation.
To simplify the subsequent computation process and for verifying our method, we selected two regions: New York and London, which are both well-known international cities, where Flickr check-in records are quite dense. Numerically speaking, the coordinates of these two areas are (1) New York (), (2) London (). The spatial distributions of check-ins in the two regions are shown in Figure 2.
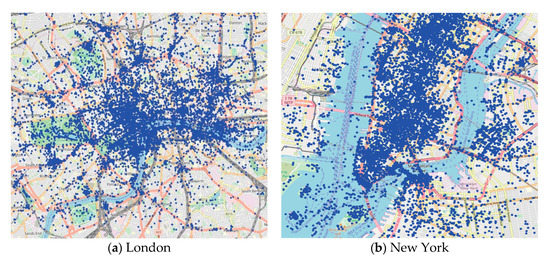
Figure 2.
Distributions of check-in data in two cities. Subfigure (a) and (b) are the spatial distributions of check-in data in London and New York, respectively.
2.3. Preprocessing Flickr Data Based on Temporal Patterns
It is common to preprocess raw data before further analysis, which can ensure the completeness and accuracy of the data. There were some deviations within the Flickr raw dataset. We can exploit the temporal pattern to eliminate obviously wrong data from the raw dataset. For example, the Create_date of some records were obviously wrong (e.g., dates in the 1980s even though Flickr was founded in 2004). As shown in Figure 3, except for these with date errors, most of the records were created from 2005 to 2014. Since the objective of this paper is to infer categories of POIs through spatiotemporal patterns and text information in check-in data, data that were not georeferenced or had errors in any field were filtered out. We selected records according to 2 constraints: (1) the length of the comment text to be greater than 30 words, and (2) the Create_date of check-in between 2005 and 2014.
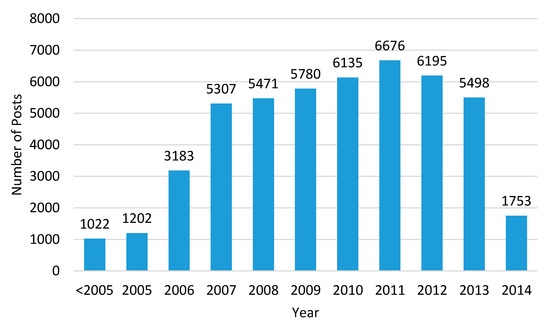
Figure 3.
Distribution of Flickr records over time (years).
Therefore, after deleting records that were invalid or had missing values, 25,205 records in New York and 22,567 records in London remained for our study. Each of these records was then described using the formalized definition:
Definition 1
(check-in record, ). Each check-in record can be expressed as , where denotes a coordinate point, denotes the check-in time, and denotes the user’s description of the photo.
2.4. Discovering POIs through Spatial Patterns
Considering the spatial pattern, where nearby things are more related to each other [6,23], similar geographical characteristics of check-in records could be allocated to similar groups with similar POIs. Besides, a POI might be represented by slightly different GPS coordinates because of coordinate deviation. Therefore, we can cluster these adjacent check-in points to find a spatially representative POI and eliminate coordinate deviation. Here, we give the following formalized definition of a POI:
Definition 2
(POI, ). Each POI can be expressed as , where denotes a coordinate point and .
To discover POIs, we chose DBSCAN [24], which is an algorithm for finding density-based clusters in spatial data. Other algorithms could also have fulfilled this purpose. For instance, the OPTICS method and K-means have both been adapted to mine POIs [7,9]. However, in contrast to these approaches, DBSCAN can effectively deal with noisy points and detect any cluster shape, which coincides with the geographical characteristics of check-in data. Here, the noise refers to some sporadic check-in points, which are likely to be caused by misoperation. Thus, not suitable in the analysis. In DBSCAN, a cluster is defined as a set of densely connected points. There are two main parameters: neighborhood radius EPS and density threshold MINPTS, which limit the size of the minimum cluster and noisy points. Taking the similarity of spatial density and spatial distance as measures of POI, we merged similar points that met the density constraints and extracted clusters using DBSCAN [15]. The clustering result is a set of clusters . Each cluster represents one POI (i.e., ), which is a set of check-in points within space/distance constraints. We used the coordinates of the cluster’s centroid to identify each POI uniquely.
2.5. Determining Categories from the Text Pattern
2.5.1. Extraction of Text Patterns
In addition to mining POI from spatiotemporal information, text contents in Title, Content, and User tags in the Flickr dataset were used to extract the text patterns. More specifically, the text pattern could be landmark information (e.g., a museum or an arena) or event information (e.g., sports games or concerts). Our task of extracting the text patterns included word segmentation and the extraction of geo-related named entities.
Currently, named entity identification tools (Named Entity Recognizer, NER) have been extensively used. Among them, the Stanford Named Entity Recognizer (Stanford NER) [25] is a Conditional Random Field (CRF)-based statistical NER system developed by the Stanford Natural Language Processing Group in 2005, which can conveniently complete word segmentation and named entity extraction. Therefore, we used Stanford NER to extract the keywords which represent the nouns of places and events. The output was a set of word vectors. Here, we give the formalized description of a word vector.
Definition 3
(word vector, ). For each record, there is a word vector w W containing geo-related words that are expressed as . Here, denotes a geo-related named entity and .
2.5.2. Determination of Category
In order to explore the meanings of POIs more normatively, it is necessary to generalize the meanings into several categories. This is also a common practice in the related works of POI annotation [7,16,26]. We surveyed the categories in different works, as shown in Table 2. It is not difficult to find that, although these annotation methods were different, the categories in each paper were very similar.

Table 2.
Points of interest (POI) categories in related works.
Like the work of Goodchild and Satman [27,28], we also used Google Places, which is widely used to provide location-related information and represent the ground truth labels. As a public data source, Google Places can provide detailed information about 100 million places across a wide range of categories, from the same database as Google Maps. The database of Google Places contains about 133 types to describe POIs for search queries. By contrast, as shown in Table 2, the number of categories was between 6 and 13 in most related works. Similarly, we generalized these types into seven categories after Majid et al. [26]: “College & University”, “Outdoors & Recreation”, “Office”, “Arts & Entertainment”, “Travel & Transportation”, “Shopping & Services”, and “Health”. In addition, we used “Other places” to represent all other types. Note that in the last two columns of Table 2, there is a slight difference between that in Falcone’s work [7] and ours, especially in the third row (i.e., “Professional & Other Places” and “Office”).
Additionally, for each category, we randomly selected some of the labeled samples to extract their high-frequency keywords, then we constructed a keyword dictionary for matching POI and category. The formulation of the dictionary is defined as follows:
Definition 4
(Dictionary, ). , , where represents the keywords contained in the ith category .
2.6. Association between POIs and Categories
So far, we obtained POIs that were mined from check-in data based on temporal patterns in Section 2.3, spatial patterns in Section 2.4, and categories that were determined based on text patterns in Section 2.5. In this section, we will associate POIs with the most likely category. The final output should be a tuple that contains the location and category of a POI (i.e., an annotated POI).
Definition 5
(Annotated POI, ). An annotated POI represents a POI labeled with a category, which can be defined as , where s represents the category information used to describe the POI .
Our annotation process can be viewed as a matching process, which is described in Algorithm 1. First, for each POI, we traversed each check-in record in the region of this POI. Using the Knuth–Morris–Pratt (KMP) algorithm [29], we matched each word vector with a category in keyword dictionary , then determined the category of this check-in. Furthermore, we defined the reliability for each category to which the POI belonged. The total match count for each category is calculated as follows:
where and . In addition, the reliability of the POI’s category is defined as follows.
As described above, the category with the highest weight was chosen from the top of , which was used to measure the reliability of classification.
| Algorithm 1. POI annotation algorithm |
| Input: // set of POI // set of word vector Output: // set of annotated POI |
| 1. 2. FOR each POI 3. CREATE 4. FOR each coordinate point and 5. 6. IF MATCH(,) = THEN 7. 8. END IF 9. END FOR 10. COMPUTE based on 11. IF TOP THEN 12. and 13. 14. END IF 15. END FOR |
We further analyzed the time complexity of Algorithm 1. Let be the number of POIs, be the number of coordinate points aggregated in one POI, and be the length of the word vector. The function MATCH(,) in Step 6 can be supported efficiently by the KMP algorithm, whose time complexity is . Note that the total number of categories is eight (seven categories plus the “Other Categories”), that is, the max value of is a constant 8, which can be ignored. The time complexity of Steps 1 and 4 are and , respectively. Hence, we can claim that for a given POI and word vector, the time complexity of our category matching method is , that is, Algorithm 1 is of linear time complexity with respect to the number of POIs, the number of coordinate points, and the length of word vector. In other words, compared to the scale of the problem, our algorithm has reached the optimal time complexity.
3. Results
In this section, we used the check-in data in the two study regions to evaluate the method presented and demonstrate its effectiveness.
3.1. Results of Discovering POIs
When applying the DBSCAN algorithm, we need to calculate the distance between two locations. Since it is affected by the curvature of the Earth, the distance between GPS coordinates needs to be converted. Using Google Maps API (Application Program Interface), we calculated the actual distance of all the check-in points. For the two key parameters, taking New York as an example, we set EPS = 48 m and MINPTS = 1 (these values are validated as the most suitable parameters for this situation as discussed in the next section).
The clustering results are shown in Figure 4. Except for black, which indicates noise, the various colors indicate different clusters, respectively. As we can see, in the study region of New York, the clusters with a high density and large area were concentrated on Manhattan Island, while small-sized and medium-sized clusters were mainly located on the marginal areas of the island and the other side of the rivers. However, in the London study region, there were two gathering centers, which were close to St. James’s and the Covent Garden.
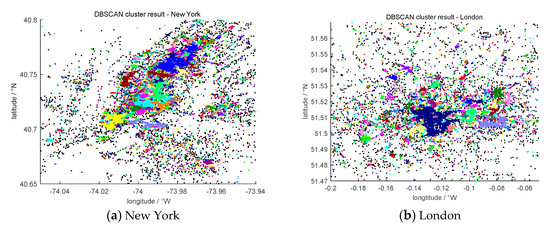
Figure 4.
Result of location clusters in New York (a) and London (b).
3.2. Results of POI Categories
To build a keyword dictionary for mapping POIs to categories, we adopted the Stanford NER to extract keywords from the text information of check-ins. Then, we took the location types in Google Places as the ground truth. The location types were generalized into seven categories with different keywords.
As shown in Figure 5, we counted the frequencies of keywords in each category and found that there were large differences in the word frequencies of different categories. We assumed that a word mentioned more than 3000 times can be considered a high-frequency word. For example, the “Outdoors & Recreation” category had multiple high-frequency keywords (e.g., “park” and “square” were mentioned more than 4000 times), while “Travel & Transportation” only had one high-frequency keyword (“street”). The word frequencies of the remaining categories were relatively low. In particular, keywords of “Health”, “Shopping & Services”, “office”, and “College & University” did not appear more than 1000 times.
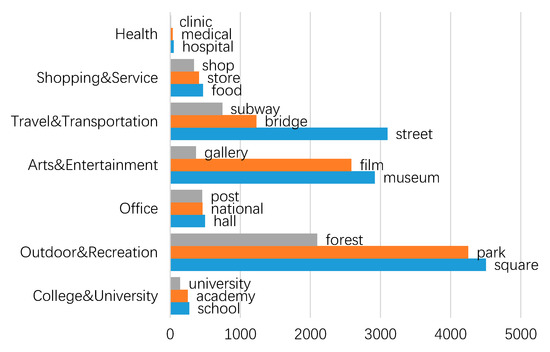
Figure 5.
Word frequency of the top 3 keywords in each category.
The keyword dictionary is shown in Table 3. There were eight categories in total, and seven of them each had several representative keywords. In addition, the unknown category called “Other places” had no keywords.

Table 3.
Categories and example keywords used in our method.
3.3. Results of Associating POIs with Meaningful Information
After determining the available classification, we matched each POI (i.e., cluster) to different categories using the annotation algorithm described in Section 2.6. For instance, the example in Table 1 was classified into the “College & University” category, which is consistent with the inference in Section 2.2. The detailed classification results and the reliability of POI annotations are shown in Table 4. Reliability is the highest priority for a category in the cluster and is calculated by Equations (1) and (2).

Table 4.
Part of the interesting locations results.
As shown in Table 4, the average reliability was 70.8%. The reliability of cluster 54 reached 100%, but this was meaningless because that cluster was classified as an unknown category. Apart from cluster 54, cluster 5 belonged to the “Office” category with 85.71% reliability, which exceeded the reliability of other clusters. Moreover, cluster 23 was labeled as “Outdoors & Recreation” with 50.00% reliability, which was the lowest of these selected clusters. This is because people always go to “Office” with a clear and serious purpose, while their reasons for going to “Outdoors & Recreation” can vary significantly.
Figure 6 shows the spatial distribution of POIs in New York and London. We used different colors and tags to annotate different POI categories. As can be seen, New York and London show different spatial POI distributions. We found that “Office” (blue crosses) in London and “College & University” (light blue pentagons) in New York had relatively concentrated distributions, which corresponded to government agencies near St. James’s Park and Columbia University on Manhattan Island. Other POI categories (e.g., “Travel & Transportation” (green Xs), “Shopping & Services” (purple triangles), and “Arts & Entertainment” (brown circles)) were distributed discretely in both study regions.
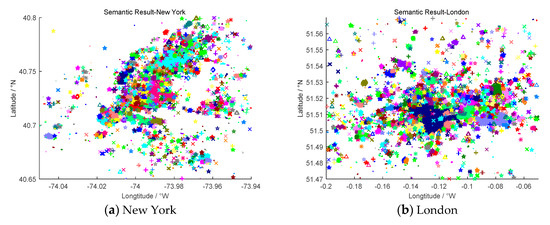
Figure 6.
Spatial distribution of POIs in New York (a) and London (b).
With the aim of expressing the proportion of each POI annotation more intuitively, we analyzed the clustering results. The distribution of POIs among the categories is depicted in Table 5. It can be seen that the proportion of the POI categories was generally similar in New York and London, with slight differences reflected in two categories. In New York, there were 10% more POIs of “Outdoors & Recreation” and 4% less “Office” than that in London. From the inside of a city, taking New York as an example, most users tended to check-in at outdoor leisure venues, public office areas, and arts and entertainment areas, with each accounting for 36.04%, 22.07%, and 12.76% of the POIs, respectively. This result shows that users were more willing to share their locations at the workplace or in leisure areas. In contrast, medical and health areas had the lowest check-in frequency (0.84%). The experimental results are consistent with the fact that people generally do not want to share their poor physical condition with the public.

Table 5.
Proportion of each location category in POI annotation.
Moreover, according to users’ temporal patterns, we divided the check-in data in New York into two subsets—weekdays and weekends—and we annotated the POIs for each subset. The results are shown in Figure 7. We can see that the proportions of POIs in each category changed slightly on weekdays and weekends. For example, during a weekday, the proportion of “Outdoors & Recreation” and “Arts & Entertainment” categories decreased by about 1%, while there was a slight increase for that of Office. Such a trend is consistent with people’s daily routines, though it is slight. This is mainly because most Flickr data were submitted by travelers rather than residents, and the weekly periodicity is not obvious.

Figure 7.
Proportion of each location category in POI annotation. for (a) weekdays and (b) weekend days.
4. Discussion
4.1. Parameter Settings
The results of DBSCAN are sensitive to the values of two parameters (i.e., EPS and MINPTS) which should be set to different values depending on the specific goals to be achieved. In this paper, our specific goal was to make two measures (the proportion of noise and the largest cluster ratio) to be as small as possible. The proportion of noise (Nratio) is the ratio of the number of noisy points to the total number of points in the clustering results and the largest cluster ratio (Clargest) is the proportion of points in the largest cluster with respect to the total number of locations. Making these two as small as possible would allow us to make use of check-in data as much as possible (i.e., we can reduce the number of noisy points) and to be as sure as possible that no single cluster consists of too many points (i.e., we want to avoid excessive concentrations of POIs). We designed a set of experiments to execute DBSCAN with various values to achieve these goals.
The resulting changes in the Nratio and Clargest are shown in Figure 8 based on different values of MINPTS and EPS. As shown in Figure 8, when the EPS was less than 40, the Nratio decreased rapidly, while Clargest remained smooth, when the EPS was more than 40, the Nratio changed slowly, and when the EPS was more than 48, Clargest increased significantly. Regarding MINPTS, the Nratio was sensitive to MINPTS, which was the lowest when MINPTS was equal to 1, while Clargest was hardly affected by MINPTS. In general, we aim to minimize the sum of the Nratio and Clargest. Thus, we set EPS = 48 m and MINPTS = 1. Under these conditions, the Nratio of the dataset was 12.76% and Clargest was 12.26%.
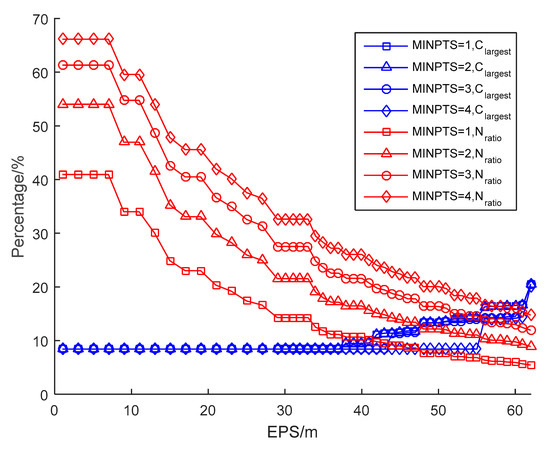
Figure 8.
Effect on clustering results of various values of MINPTS and EPS.
4.2. Evaluation of Results
To evaluate the performance of POI annotation, we adopted the same evaluation criteria as that used in Falcone’s work [7] (i.e., Precision, Recall, and F-value), which are calculated as follows:
Where Precision is the portion of correctly labeled check-ins () among the total number of check-ins marked as such (). Recall is the proportion of correctly labeled check-ins among the true check-ins of this category () in the real world. F-value is the harmonic mean of Precision and Recall. In the evaluation of POI annotation results, we randomly selected some POIs in the study regions and obtained their real category data through Google Maps API. Numerically, we selected 5 groups and 80 samples in each group. The Precision, Recall, and F-value values are in Table 6 as well as their averages.

Table 6.
Evaluation of the annotation results.
As shown in Table 6, the Precision is very high (at 90%) for the class “Office”, which means 90% of POIs were correctly classified into the correct category. In addition, the Precision for the classes “Outdoors & Recreation” and “Arts & Entertainment” are both over 80%, while that for “College & University”, “Shopping & Services”, and “Health” are relatively low, close to 70%. In particular, “Travel & Transportation” yields the poorest Precision of 68%. There are two possible reasons for the categories with low precisions. On the one hand, the distribution of POIs marked as these categories were too disperse, or the sample data contained positioning errors. On the other hand, the frequencies of keywords in “Shopping & Services” and “Health” were relatively lower than in other categories. Moreover, the trend of Recall for each category was similar to that of the precision: the Recall values of “Outdoors & Recreation” and “Office” are the two highest at 90% and 88%, respectively, that is, the proportion of places belonging to “Office” and “Outdoors & Recreation” that were correctly classified are 90% and 88%, respectively.
In addition, to illustrate the universality of the proposed method, we compared the F-values in two cities (London and New York). As evidenced by the values (Y-axis) in Figure 9, overall the F-values of the annotation results are similar in London to that in New York. The most significant difference existed in the class “Outdoors & Recreation”, where the F-value in London was lower than that in New York. This may be due to less sampled POIs of “Outdoors & Recreation” in the study region of London. The results of this experiment demonstrate that our method is able to achieve similar performance in different regions.
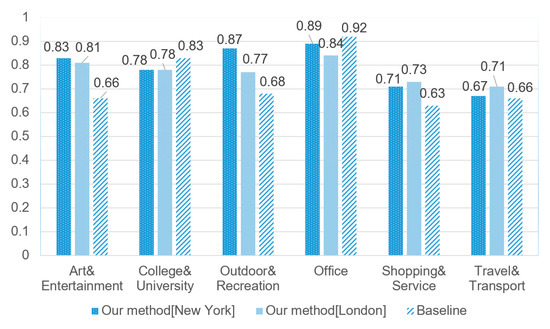
Figure 9.
F-value comparison.
Furthermore, in order to verify the effectiveness of our method, we compared the F-values of our method with that of the baseline method (Falcone’s method) [7], whose work was most similar to ours. Based on a dataset collected in London from Twitter, Falcone et al. [7] performed POI annotation experiments with six kinds of classifiers for POIs, which covers the most commonly used methods. Therefore, we chose it as our baseline. The baseline also generalized eight categories. However, as shown in Table 2, these categories did not overlap with our eight categories, so an entire comparison between them could not be conducted. Therefore, we selected six repetitive parts from eight categories to compare.
In Figure 9, it can be observed that with regard to “Arts & Entertainment”, “Outdoors & Recreation”, and “Shopping & Services”, the F-value of our method exceeded that of the baseline. This is because the behavior related to these categories often has certain randomness (i.e., irregular spatiotemporal patterns). However, the baseline classifier was constructed based on regular spatiotemporal patterns. These irregular characteristics in the spatiotemporal patterns cause their lower classification accuracy. With the help of text patterns mined from the text content, our approach can cope with this randomness. In addition, the average F-values of our method and the baseline for London areas 78% and 73%, respectively. This means that although the baseline’s F-value for “Office” was slightly superior to ours, our method outperformed the baseline by 5% in terms of the overall average F-value. Note that the category divisions in Falcone’s work [7] would be unsuitable because it merged POIs belonging to “Professional” and “Other Places” into one category (as shown in Table 2), which would increase the accuracy of classification for the corresponding category “Office” to some extent. Besides, Falcone et al. [7] designed two classification tasks: binary classification for a given category and triple classification for simplified categories. If the number of categories is over three, multiple extra iterations are required in the method of Falcone et al. [7]. In contrast, we can infer eight categories for each location automatically without extra iterations, which shows that our method is more computationally efficient.
5. Conclusions
This research was inspired by the idea that temporal information, spatial information, and the content of comments should all be comprehensively considered in annotating POIs. In this paper, we presented a novel method by successively utilizing spatiotemporal fields and text contents to automatically attach appropriate annotations to the POIs. The proposed method includes four key stages: (1) exploring temporal patterns to preprocess raw data from the Flickr database, (2) extracting spatial patterns to discover POIs with the DBSCAN algorithm, (3) mining the text patterns to construct a dictionary for each category, and (4) associating POIs with the most likely category.
The proposed method can annotate POI with higher accuracy and in less time. This is because the application of spatiotemporal patterns reduces the number of annotations required, and the utilization of text patterns discovers the context information of POIs better. Our method was evaluated using two study regions selected in New York and London. From the experimental results of the case studies, we conclude that our method is pervasive for different cases and is able to annotate POIs, whether check-in data have spatiotemporal patterns or not, with an F-value of 78%, which is superior to that of the baseline by Falcon et al. [7] which achieved an F-value of 73%. The method is generalizable to other data if these data contain similar information as the Flickr data. We also noticed that with the proposed approach the precision of annotating one category decreases as the number of keywords in the category decreases. Subsequent work will be focused on finding a new approach to cope with this issue.
Author Contributions
Conceptualization: Zhiqiang Zou and Xu He; Methodology: Zhiqiang Zou and A-Xing Zhu; Software: Zhiqiang Zou and Xu He; Validation: Zhiqiang Zou, Xu He and A-Xing Zhu; Formal Analysis: Zhiqiang Zou and Xu He; Investigation: Zhiqiang Zou and Xu He; Resources: Zhiqiang Zou; Data Curation: Xu He; Writing-Original Draft Preparation: Zhiqiang Zou and Xu He; Writing-Review & Editing: Zhiqiang Zou and A-Xing Zhu; Visualization: Xu He; Supervision: A-Xing Zhu; Project Administration: Zhiqiang Zou and A-Xing Zhu; Funding Acquisition: Zhiqiang Zou and A-Xing Zhu.
Funding
The work reported here was supported by grants from National Natural Science Foundation of China (No. 41571389, 41871300), the Key Laboratory of Spatial Data Mining Information Sharing of Ministry of Education, Fuzhou University (No. 2016LSDMIS07), National Basic Research Program of China (No. 2015CB954102), Natural Science Research Program of Jiangsu (No. 14KJA170001), PAPD, and National Key Technology Innovation Project for Water Pollution Control and Remediation (No. 2013ZX07103006). Supports to A-Xing Zhu through the Vilas Associate Award, the Hammel Faculty Fellow Award, the Manasse Chair Professorship from the University of Wisconsin-Madison, and the ‘One-Thousand Talents’ Program of China are greatly appreciated.
Acknowledgments
Thanks to Minhui He for her experimental work. The comments from James E. Burt and other members in the GIS group in the Department of Geography, University of Wisconsin-Madison are much appreciated.
Conflicts of Interest
The authors declare no conflicts of interest.
References
- Li, L.; Goodchild, M.F.; Xu, B. Spatial, temporal, and socioeconomic patterns in the use of twitter and flickr. Cartogr. Geogr. Inf. Sci. 2013, 40, 61–77. [Google Scholar] [CrossRef]
- Tasse, D.; Liu, Z.; Sciuto, A.; Hong, J.I. State of the Geotags: Motivations and Recent Changes. In Proceedings of the 11th International AAAI Conference on Web and Social Media, Montreal, QC, Canada, 15–18 May 2017; AAAI: Palo Alto, CA, USA, 2017. [Google Scholar]
- Khazaei, E.; Alimohammadi, A. An Automatic User Grouping Model for a Group Recommender System in Location-Based Social Networks. ISPRS Int. J. Geo-Inf. 2018, 7, 67. [Google Scholar] [CrossRef]
- Sansonetti, G. Point of interest recommendation based on social and linked open data. Pers. Ubiquit. Comput. 2019, 23, 199–214. [Google Scholar] [CrossRef]
- Cao, K.; Huang, Q.Y. Geo-sensor(s) for potential prediction of earthquakes: can earthquake be predicted by abnormal animal phenomena? Ann. GIS 2018, 24, 125–138. [Google Scholar] [CrossRef]
- Zhu, A.-X.; Lu, G.; Liu, J.; Qin, C.-Z.; Zhou, C. Spatial prediction based on Third Law of Geography. Ann. GIS 2018, 24, 225–240. [Google Scholar] [CrossRef]
- Falcone, D.; Mascolo, C.; Comito, C.; Talia, D.; Crowcroft, J. What is this place? Inferring place categories through user patterns identification in geo-tagged tweets. In Proceedings of the 6th International Conference on Mobile Computing, Applications and Services, Austin, TX, USA, 6–7 November 2014; IEEE: Piscataway, NJ, USA, 2015. [Google Scholar]
- Daggitt, M.L.; Noulas, A.; Shaw, B.; Mascolo, C. Tracking urban activity growth globally with big location data. R. Soc. Open Sci. 2016, 3, 150688. [Google Scholar] [CrossRef] [PubMed]
- Zou, Z.; Yu, Z. An innovative GPS trajectory data based model for geographic recommendation service. Trans. GIS 2017, 21, 880–896. [Google Scholar] [CrossRef]
- Silva, T.H.; Viana, A.C.; Benevenuto, F. Urban computing leveraging location-based social network data: A survey. ACM Comput. Surv. 2018, 52, 17. [Google Scholar] [CrossRef]
- Giannopoulos, G.; Meimaris, M. Learning Domain Driven and Semantically Enriched Embeddings for POI Classification. In Proceedings of the 16th International Symposium on Spatial and Temporal Databases (SSTD ‘19), Vienna, Austria, 19–21 August 2019; ACM: New York, NY, USA, 2019; pp. 214–217. [Google Scholar]
- Noulas, A.; Scellato, S. Exploiting Semantic Annotations for Clustering Geographic Areas and Users in Location-based Social Networks. In Proceedings of the Social Mobile Web, Papers from the 2011 ICWSM Workshop, Barcelona, Catalonia, Spain, 21 July 2011. [Google Scholar]
- Ye, M.; Shou, D. On the Semantic Annotation of Places in Location-Based Social Networks. In Proceedings of the 17th ACM SIGKDD International Conference on Knowledge Discovery and Data Mining, San Diego, CA, USA, 21–24 August 2011; ACM: New York, NY, USA, 2011; pp. 520–528. [Google Scholar]
- Malmi, E.; Minh, T.; Do, T.; Gatica-perez, D. Checking in or Checked in: Comparing Large-Scale Manual and Automatic Location Disclosure Patterns. In Proceedings of the 11th International Conference on Mobile & Ubiquitous Multimedia, Ulm, Germany, 4–6 December 2012; ACM: New York, NY, USA, 2012. [Google Scholar]
- Zou, Z.; Xie, X. Mining User Behavior and Similarity in Location-Based Social Networks. In Proceedings of the 2015 Seventh International Symposium on Parallel Architectures, Algorithms and Programming (PAAP), Nanjing, China, 12–14 December 2015; IEEE: Piscataway, NJ, USA, 2016; pp. 167–171. [Google Scholar]
- Krumm, J.; Rouhana, D. Placer: Semantic place labels from diary data. In Proceedings of the 2013 ACM International Joint Conference on Pervasive and Ubiquitous Computing, Zurich, Switzerland, 8–12 September 2013; ACM: New York, NY, USA, 2013; pp. 163–172. [Google Scholar]
- Yuan, Y.; Liu, H. Spatial Relation Extraction from Chinese Characterized Documents Based on Semantic Knowledge. J. Geo-Inf. Sci. 2014, 16, 681–690. [Google Scholar]
- Wu, F.; Wang, H. SemMobi: A semantic annotation system for mobility data. In Proceedings of the 24th International Conference on World Wide Web, Florence, Italy, 18–22 May 2015; ACM: New York, NY, USA, 2015; pp. 255–258. [Google Scholar]
- Zhu, Y.; Sun, Y. Nokia mobile data challenge: Predicting semantic place and next place via mobile data. In Proceedings of the Nokia Mobile Data Challenge Workshop, Newcastle, UK, 18–19 June 2012. [Google Scholar]
- Li, Y.; Li, T.; Liu, H. Recent advances in feature selection and its applications. Knowl. Inf. Syst. 2017, 53, 551–577. [Google Scholar] [CrossRef]
- Gao, H.; Liu, H. Mining human mobility in location-based social networks. In Synthesis Lectures on Data Mining and Knowledge Discovery; Han, J., Getoor, L., Wang, W., Gehrke, J., Grossman, R., Eds.; Morgan & Claypool: Wintersport Ln Williston, VT, USA, 2015; Volume 7, pp. 1–115. [Google Scholar]
- Thomee, B.; Shamma, D.A. YFCC100M: The New Data in Multimedia Research. Commun. ACM 2016, 59, 64–73. [Google Scholar] [CrossRef]
- Tobler, W.R. A Computer Movie Simulating Urban Growth in the Detroit Region. Econ. Geogr. 1970, 46 (Suppl. 1), 234–240. [Google Scholar] [CrossRef]
- Ester, M.; Kriegel, H.P. A density-based algorithm for discovering clusters in large spatial databases with noise. Kdd 1996, 96, 226–231. [Google Scholar]
- Finkel, J.R.; Grenager, T.; Manning, C. Incorporating non-local information into information extraction systems by gibbs sampling. In Proceedings of the 43rd Annual Meeting on Association for Computational Linguistics, Ann Arbor, Michigan, 25–30 June 2005; Association for Computational Linguistics: Stroudsburg, PA, USA, 2005; pp. 363–370. [Google Scholar]
- Majid, A.; Chen, L.; Mirza, H.T.; Hussain, I.; Chen, G. A system for mining interesting tourist locations and travel sequences from public geo-tagged photos. Data Knowl. Eng. 2015, 95, 66–86. [Google Scholar] [CrossRef]
- Goodchild, M.F. Citizens as sensors: The world of volunteered geography. Geojournal 2007, 69, 211–221. [Google Scholar] [CrossRef]
- Satman, M.H.; Altunbey, M. Selecting Location of Retail Stores Using Artificial Neural Networks and Google Places API. Int. J. Stat. Probab. 2014, 3, 67. [Google Scholar] [CrossRef]
- Knuth, D.E.; Morris, J.H. Fast pattern matching in strings. SIAM J. Comput. 1977, 6, 323–350. [Google Scholar] [CrossRef]
© 2019 by the authors. Licensee MDPI, Basel, Switzerland. This article is an open access article distributed under the terms and conditions of the Creative Commons Attribution (CC BY) license (http://creativecommons.org/licenses/by/4.0/).