Article

Software Systems Approach to Multi-Scale GIS-BIM Utility Infrastructure Network Integration and Resource Flow Simulation

1
Urban Sciences Building, Newcastle University, Newcastle upon Tyne NE4 5TG, UK
2
Ordnance Survey, Southampton SO16 0AS, UK
*
Author to whom correspondence should be addressed.
ISPRS Int. J. Geo-Inf. 2018, 7(8), 310; https://doi.org/10.3390/ijgi7080310
Submission received: 27 April 2018 / Revised: 8 July 2018 / Accepted: 25 July 2018 / Published: 1 August 2018

Abstract

:
There is an increasing impetus for the use of digital city models and sensor network data to understand the current demand for utility resources and inform future infrastructure service planning across a range of spatial scales. Achieving this requires the ability to represent a city as a complex system of connected and interdependent components in which the topology of the electricity, water, gas, and heat demand-supply networks are modelled in an integrated manner. However, integrated modelling of these networks is hampered by the disparity between the predominant data formats and modelling processes used in the Geospatial Information Science (GIS) and Building Information Modelling (BIM) domains. This paper presents a software systems approach to scale-free, multi-format, integrated modelling of evolving cross-domain utility infrastructure network topologies, and the analysis of the spatiotemporal dynamics of their resource flows. The system uses a graph database to integrate the topology of utility network components represented in the CityGML UtilityNetwork Application Domain Extension (ADE), Industry Foundation Classes (IFC) and JavaScript Object Notation (JSON) real-time streaming messages. A message broker is used to disseminate the changing state of the integrated topology and the dynamic resource flows derived from the streaming data. The capability of the developed system is demonstrated via a case study in which internal building and local electricity distribution feeder networks are integrated, and a real-time building management sensor data stream is used to simulate and visualise the spatiotemporal dynamics of electricity flows using a dynamic web-based visualisation.

Graphical Abstract

1. Introduction

Infrastructure networks enable the provision of connected services and the resources that are necessary for the function of societies in cities. Digital technologies make economic investment more worthwhile by improving the delivery of these services and resources. For example, in order to design a more responsive energy grid that can deliver cleaner energy more flexibly [1], we need to be able to model buildings and their demand, the wider urban environment, and infrastructure networks [2,3]. The networks that transport the resources of gas, water, electricity and heat from suppliers to consumers span multiple spatial scales, from macro distribution down to micro intra-building consumption [4]. This multi-scale manifestation presents significant challenges to the integrated topological modelling of these networks and there is currently no accepted means by which the spatiotemporal dynamics of the resource flows across these networks can be monitored and analysed.
The breadth of spatial scales spanned by infrastructure networks is such that the challenge of their modelling sits within both the Geospatial Information Science (GIS) and Building Information Modelling (BIM) domains; the disparity between these domains has yielded a diversity of data formats, which implement different semantic and geometric models, and are underpinned by different base languages, thus hindering data integration and software interoperability [5,6,7]. In order for the complexity of infrastructure systems to be mastered for improved resource allocation and asset management; facility operators, engineers, and urban planners require an approach to the modelling of infrastructure networks that addresses the data integration challenges that are encountered in real-world, practical scenarios [7].
Research on GIS-BIM integration has not yet enabled this; work has focused predominantly on geometry [8] with relatively little consideration of capturing network topologies and a reliance on overlapping concepts between existing schemas. Furthermore, existing data standards do not readily facilitate the representation of data dynamics [9], which limits the extent to which models can be used to simulate resource flows. There is a clear need for integrated modelling approaches that enable the representation of complete flows through end-to-end topologies, enabling the deeper spatiotemporal analytical capabilities that are required in a range of application domains [10].
In this paper, we present a method that brings together the topologies that are represented in multiple, disparate data sets as a system-of-systems; we use a graph database to integrate the topology of infrastructure components that are connected across multiple scales but are modelled in separate static models and dynamic data streams. We also show how the spatiotemporal evolution of resource flows can be disseminated for ingestion by client-side analytics and visualisation systems.
The utility of the developed system is evaluated for electricity demand-supply visualisation across the GIS-BIM interface; we present a case study in which the topology of circuited electrical consumer components of an Industry Foundation Classes (IFC) model is integrated with the local neighbourhood electricity distribution feeder network encoded in the CityGML UtilityNetwork Application Domain Extension (ADE). A real-time stream of JavaScript Object Notation (JSON) messages, derived from a building management system, is then used to enrich the topology of the integrated network and capture the spatiotemporal dynamics of electricity consumption. A publish-subscribe message broker is deployed for dissemination of the dynamics of the integrated network to client systems. A web-based visualisation system is developed as an example exploitation client to the backend capability, validating the method for demand-supply visualisation.

2. Previous Research

Previous GIS-BIM integration research efforts have employed a range of techniques and for a variety of purposes. Given the comprehensiveness and popularity of IFC for exchange of BIM models and the predominance of CityGML for exchange of urban information [11,12], these two formats are either fundamental to many of these studies or have been used in the implementation or demonstration of many research methods.
Irizarry and Karan [13] devised a multi-stage GIS-BIM integration workflow that facilitates the optimisation of tower crane location on construction sites; Amirebrahimi et al. [14] designed a semi-automated process, involving the ArcGIS Interoperability Extension, which enables the visualisation of flood damage to buildings. Deng et al. [12] focus on mapping by means of a reference ontology and Cheng et al. [15] propose a semi-automated framework for schema mapping that makes use of linguistic and text mining techniques. Semantic web technologies, Resource Description Framework (RDF) graphs, and the SPARQL query language were used by Karan et al. [16] and Hor et al. [17] to link information between BIM and GIS models. Kang et al. [18] proposed an Extract, Transform, Load (ETL) architecture that is specific to GIS-BIM integration. The above studies made extensive use of the CityGML and IFC formats in addressing integration challenges. However, despite the breadth of techniques and target use cases, the integration of utility networks has received relatively little attention [5,19]. Berlo and Laat’s work [8] on the CityGML GeoBIM Application Domain Extension (ADE) has strengthened the two formats’ capabilities by enriching CityGML with semantics from IFC and the UtilityNetwork ADE [20] was developed to enable the representation of utility networks. Hijazi et al. [19] found that most IFC building service concepts can be mapped into the UtilityNetwork ADE without the loss of information, and Becker et al. [21] later proposed a specialisation of the ADE with a geospatial information model for multi-infrastructure utility networks.
Although these developments have increased the richness of topological information that can be represented and integrated, the flexibility and applicability of many integration methods are limited by a reliance on the overlap of concepts that are represented in established domain-specific schemas. Furthermore, the emergence of smart sensor networks [22] is resulting in a growing volume of sensor data describing the flow of data through infrastructure networks and these data need to be related to the digital models. Standards organisations, such as BuildingSMART and the Open Geospatial Consortium (OGC), are modifying and extending existing data formats to address such evolving requirements but there remains a need to devise methods of representing more generically the topologies of infrastructure networks and the dynamics of utility resource flows.

3. Method Design and Implementation

In this section, we present a software systems approach to integrating the topologies of multi-scale infrastructure resource networks within cities and simulating the flow of resources through them. We show how a graph database can be used to integrate the topologies that are represented in instances of different schemas, regardless of overlapping concepts, that the method is flexible enough to enable the integration of the topology derived from real-time data streams, and how the same data streams can be used to simulate resource flows through updates on the properties of graph network relationships. We also show a means of disseminating continuously the evolving state of the integrated network in support of demand-supply visualisation.
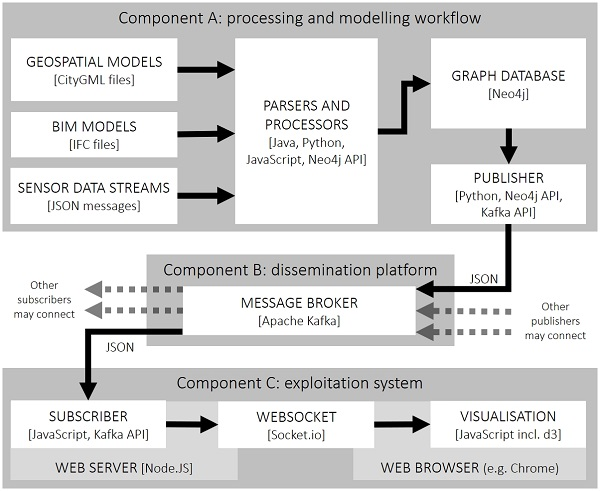
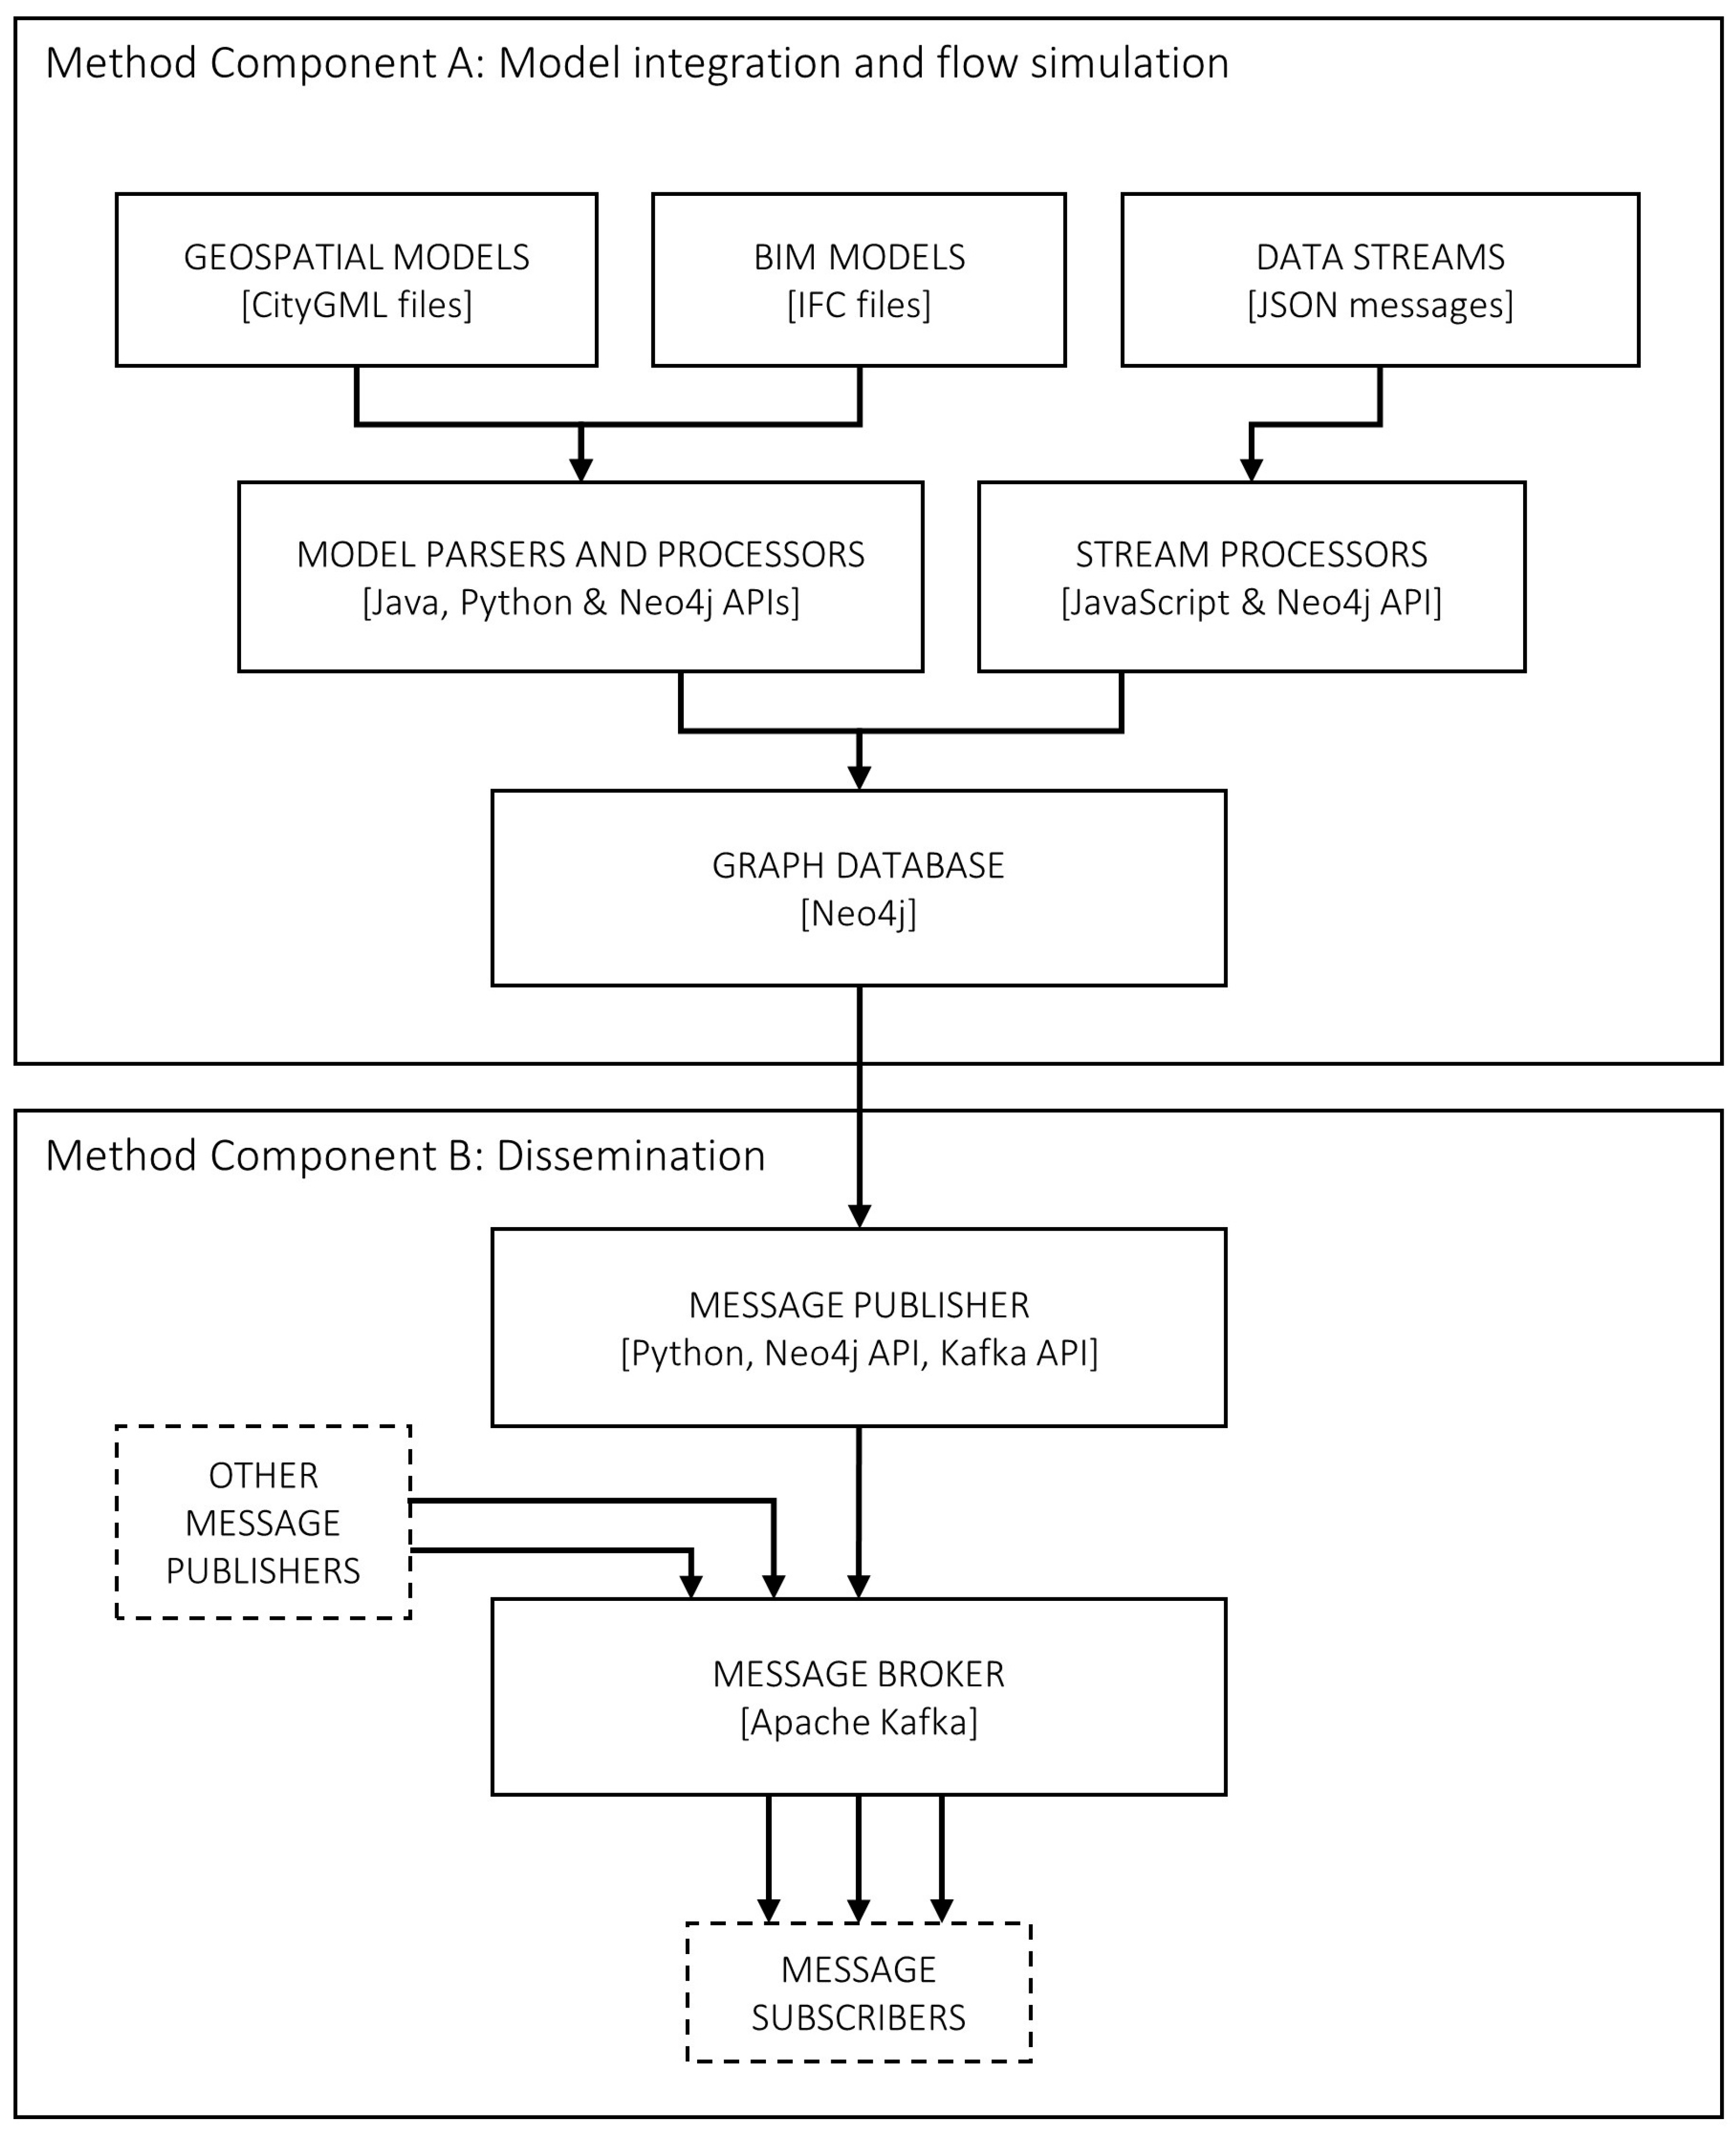
The overall software system is represented in Figure 1. The system comprises two main components: (i) an integration and simulation component in which the topologies represented the disparate static data models are derived and integrated, and associated real-time data feeds of the flows across the integrated network embedded; and (ii) a dissemination component that publishes messages that indicate changes to the network’s structure and flows.
The integration and simulation component comprises three main functions: (i) the system identifies salient elements within the separate data models that form the sub-networks of the system; (ii) the sub-networks are integrated to form a single network graph model in a graph database; and (iii) real-time sensor streaming data are used to identify additional topology structure in the network graph and to dynamically modify the spatiotemporal properties of network nodes.
As IFC is the predominant format for BIM model exchange [11,12], a Python-based application was developed to extract internal building network elements and their topology from IFC models using the IfcOpenShell-python module. Elements are matched against a pre-populated gazetteer of elements types, their IDs are used for unique identification, and the IfcRelConnectsPortToElement and IfcRelConnectsPorts relationships are used to identify the connectivity between the elements. Given the wide usage of the CityGML [11,12] for urban-scale modelling, a custom Java-based Document Object Model (DOM) parser was developed for processing instances of the format’s UtilityNetwork Application Domain Extension (ADE) [23]. The application traverses the XML tree, extracts Node elements from a FeatureGraph and uses InteriorFeatureGraph XLink references to connect the nodes. The JSON format is used commonly for transmission of real-time data and is used for representation of building management data in the case study of Section 4; for these reasons, the integration system was designed to handle streaming data that are structured in the JSON format. The UtilityNetwork ADE and IFC are domain-specific modelling schemas but JSON is not; the precise implementation of the JSON parser was thus tailored according to the structure of the JSON messages that were used in the case study.
In the system, extracted elements and their topological connectivity are pushed to a Neo4j graph database. A graph database was selected as they have been found to be efficient for storing and querying topologically connected data [24,25]. Furthermore, it has been proposed that graph theory and graph models are suitable for understanding urban topologies [26] and integrating models of urban data [27], and that graph databases can be used for the detection of spatial-semantic changes in CityGML documents [
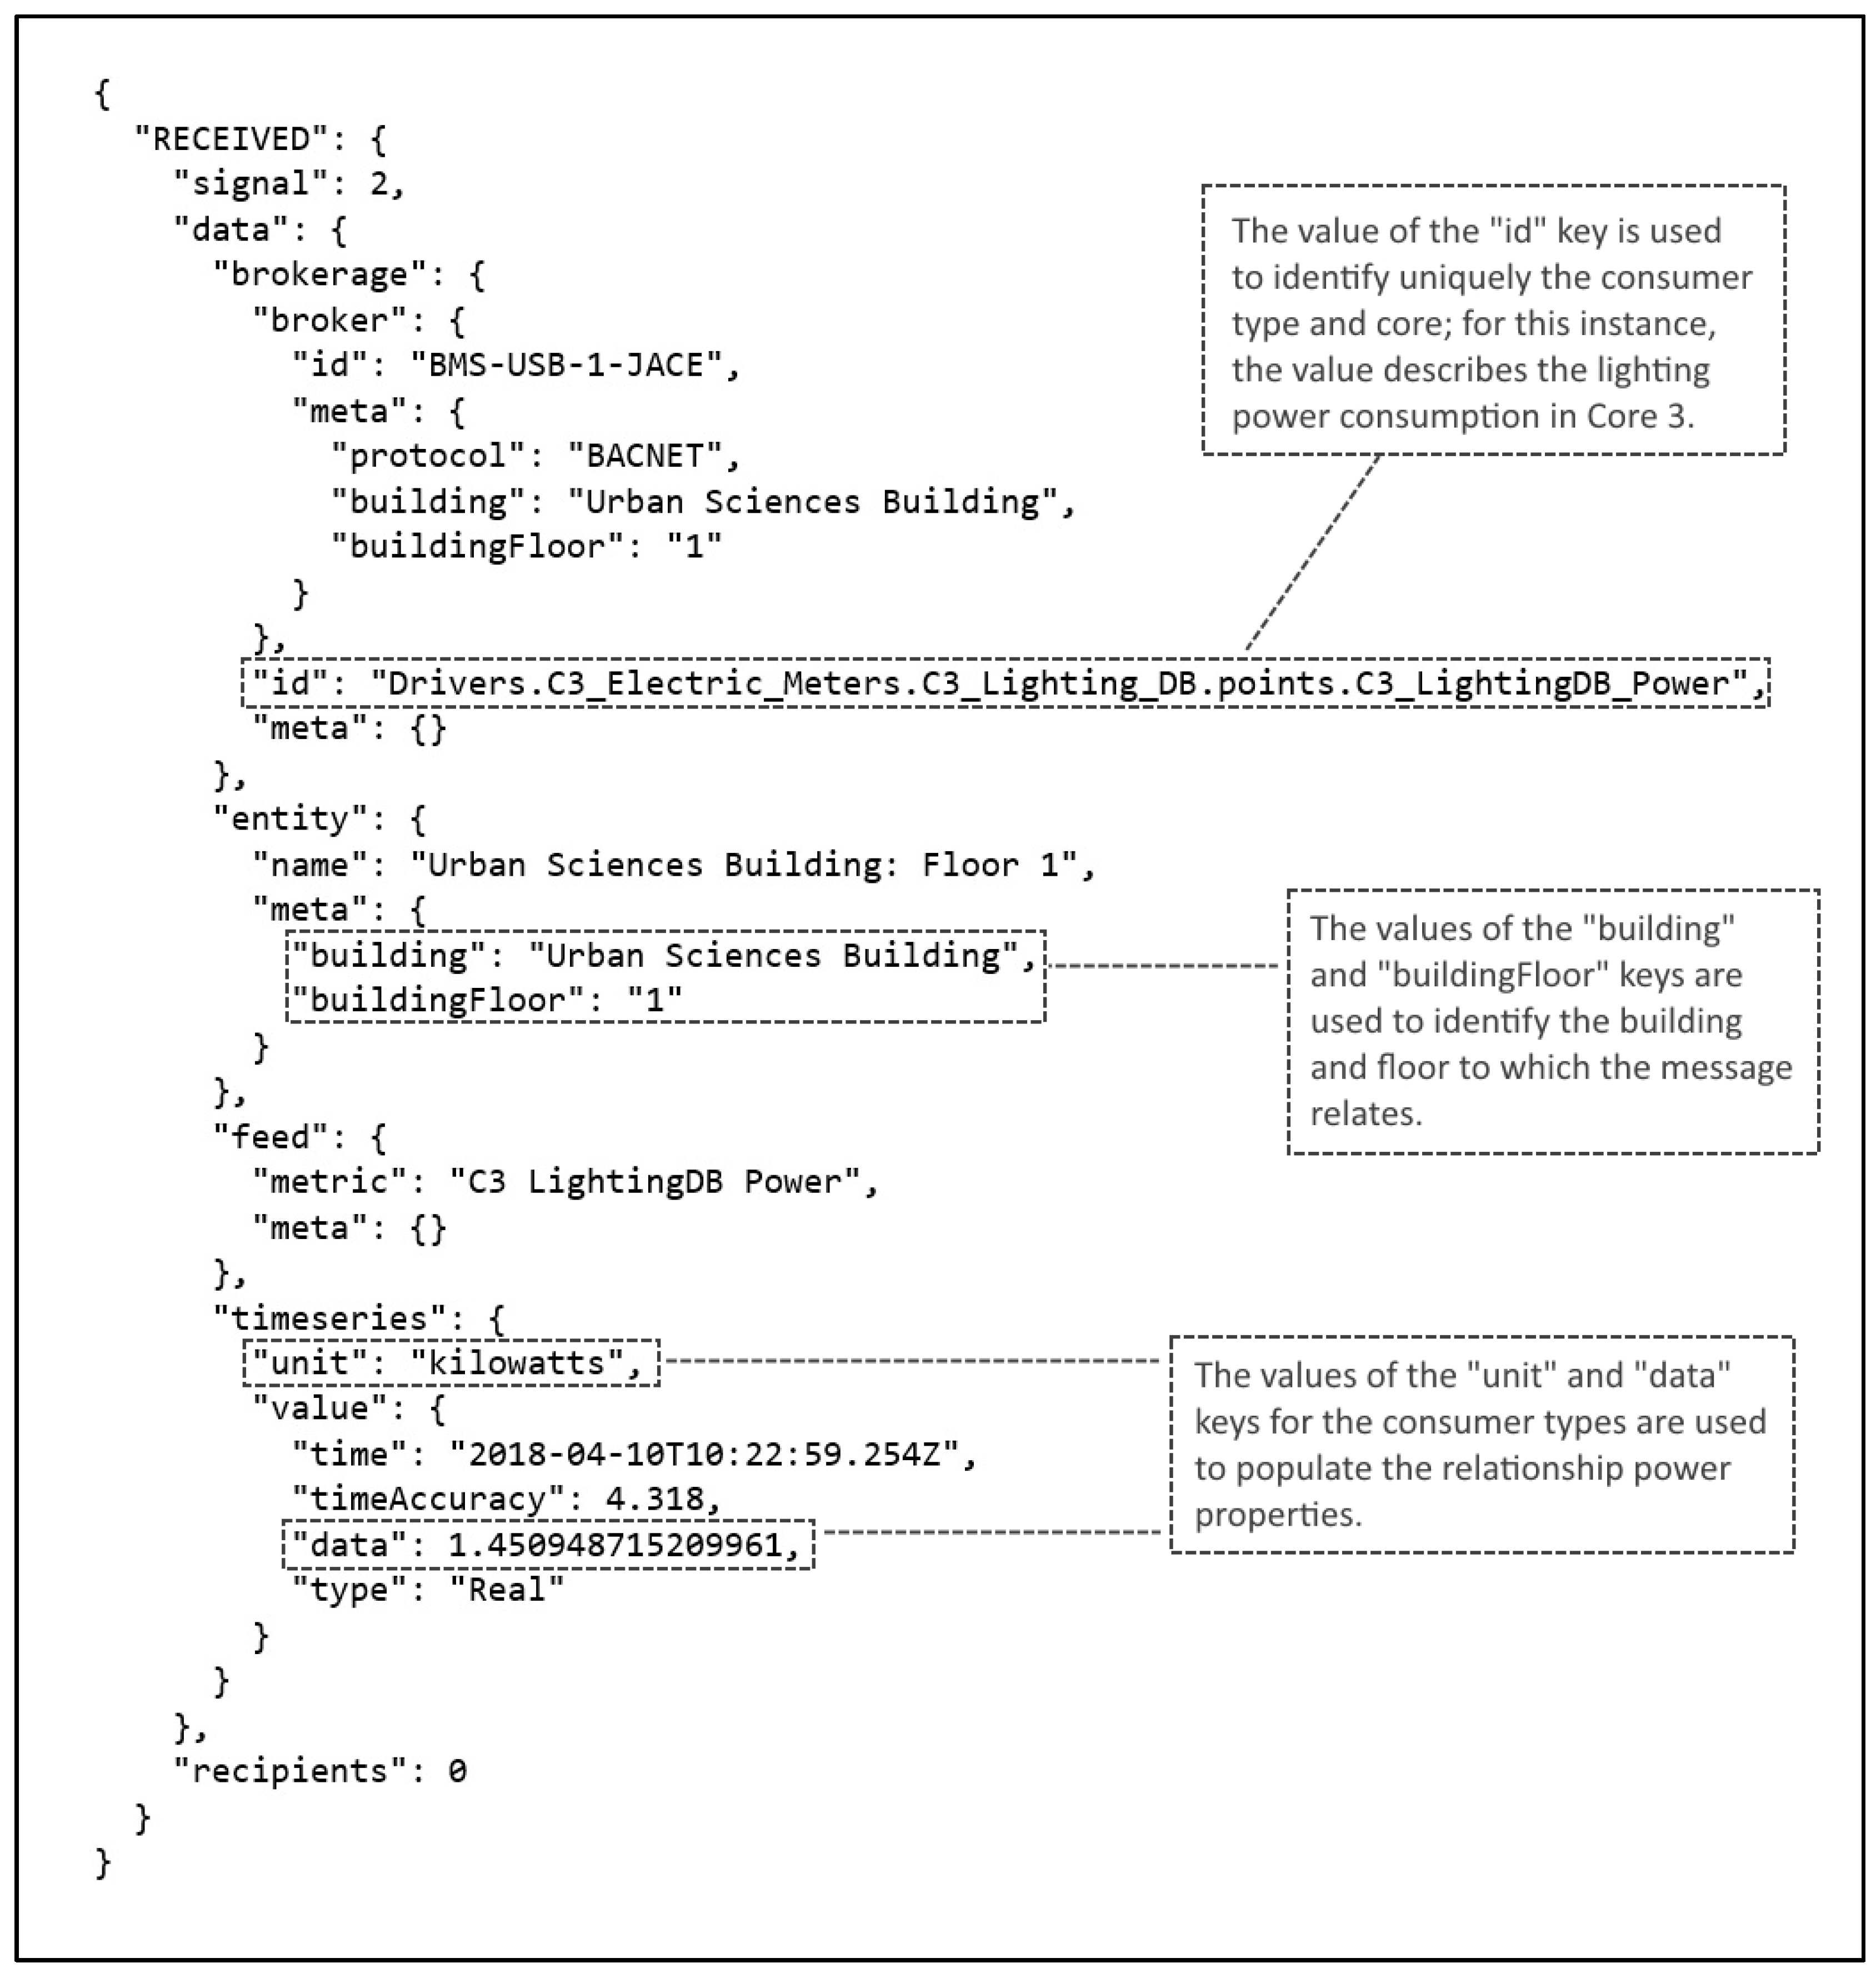
28]. The sub-networks derived from each data source are integrated into a single network by executing Neo4j Cypher queries that run ‘merge’ clauses on building nodes with matching identifiers across the CityGML and IFC files, and JSON stream. The sub-networks are integrated by their connection to a common building node and the use of the merge clause (rather than the ‘create’ clause) avoids duplication by only creating a node if it does not already exist in the database. For the CityGML files, the GML IDs of the building nodes are used for unique identification; for the IFC files, the name of the IfcBuilding element is used; for the JSON stream, the structure of the messages determines which key-value pair/s should be used for the unique identification of the building and consumer end-point to which the message relates. As for the building nodes, the use of merge clauses avoids the duplication of consumer nodes. The streams are used to update dynamically the temporal state of the integrated network through the use of ‘set’ clauses, which update property values on relationship pairs containing target consumer nodes. This real-time attribution of values to relationships constitutes the dynamic simulation of resource flows through the infrastructure network within the graph database.
The dissemination component of the system in Figure 1 allows for the integrated infrastructure network and the associated dynamic resource flows to be exploited. This is achieved by making the state of the graph network at any particular time available to other systems. Conceptually, this is achieved by repeatedly capturing and then disseminating snapshots of the network’s state and flows at some time interval (e.g., every second). The technical implementation involves a daemon (background application) that recursively executes Cypher queries to capture the state of the entire database instance at a time interval set by the system administrator. The instances are then published as a JSON messages to a topic on an Apache Kafka [29] message broker. The JSON messages contain arrays of node and relationship objects that collectively describe the network topology and flow state at the instant the database was queried. Any other systems may then connect to the broker, receive the messages by subscribing to the topic, and exploit them for analysis and/or visualisation. The dissemination component has been designed such that outputs from other processing and modelling workflows may publish messages to the same broker; similarly, other exploitation systems may subscribe to messages for analysis and/or visualisation purposes.

4. Case Study: Electricity Demand-Supply Visualisation across the GIS-BIM Interface

In order to evaluate the software system described in Section 3, we apply it to the resource of electricity, encompassing the electricity networks within buildings and the distribution feeder networks to which they are connected. The network elements that are relevant to these scales include distribution-level substations, the feeder network through which substations supply buildings, the buildings themselves, and the electrical appliances and devices within the buildings. The use of a specific case study enables an evaluation and validation of the system against the specific objective of modelling and visualising the flow of electricity across the GIS-BIM interface. The case study was devised to include enough variety of data that the system could be evaluated thoroughly, while also ensuring that the complexity of the source data would not reduce the clarity of the results. The study employs one small feeder network containing a highly instrumented building and another building footprint, allowing the testing of the system on all three of the data formats described in Section 3 and the topological configurations they are commonly used to represent.

4.1. Electricity Distribution Feeder Network Modelling

In the United Kingdom (UK), distribution operators manage the flow of electricity from transmission substations, through distribution networks, to end-users [4]. However, there is no availability of ‘open’ data that describe the spatial layout of local distribution feeder networks, which are necessary for the modelling in this case study. For this reason, local distribution feeder networks were derived from other data sources using the approach of Ji et al. [30], applying a heuristic algorithm to generate plausible synthetic data for an area of the city of Newcastle upon Tyne, UK (Figure 2). The substations are identified from Ordnance Survey Points of Interest Data, the building footprints are from a filtered Ordnance Survey MasterMap® topographic layer, and the connecting cables and connection points between the substations and buildings are derived from the road network of the Ordnance Survey MasterMap® Integrated Transport Network (ITN) data.
The distribution feeder networks were output as a pair of Esri Shapefiles, one containing the network nodes and the other the edges. The nodes consist of substations, substation access nodes, building access nodes, and buildings; the edges represent cables that carry electrical current. A workspace was developed in the Feature Manipulation Engine (FME) software that executes a mapping of these Shapefiles into an instance of the CityGML UtilityNetwork ADE. From this set of networks, a single feeder distribution network was selected for use in this study and is shown in the inset of Figure 2. The network contains two building nodes and a single substation, which is situated within 200 m of the two buildings. One of the buildings represents a real building footprint from Ordnance Survey data and it is labelled Building X. The footprint for Building X has a UK Ordnance Survey topographic identifier (TOID), which identifies it uniquely within the UK. The other building footprint represents Newcastle University’s Urban Sciences Building (USB); having been completed in September 2017 [31], the USB is too new for representation in Ordnance Survey data—for this reason, the node was inserted manually into the network and assigned an artificial TOID.

4.2. Intra-Building Electricity Network Modelling

The system shown in Figure 1 was used to process two distinct data sources used for representing electricity network components and resource flows at the intra-building scale. The first source is a static BIM model of a small, synthetic, low-complexity building, which is used to represent a plausible subset of the typical electricity consumer components that would be found in Building X. The second source is a real-time sensor data stream of JSON messages that describes both the internal electrical componentry of the USB and the electrical consumption of these components.

4.2.1. BIM Model with Electrical Components

To represent the internal components of Building X, a BIM model was created using Autodesk Revit (Figure 3). In order to keep the model complexity manageable, while still demonstrating that the system is applicable to several instances of realistic and familiar object types, the building shell was populated with three floor lights, two television displays screens, two electrical panels (one feeding the lights; the other the screens), and a corresponding electric socket outlet for each of these five consumer elements.
Within the Revit modelling environment, the components were connected to form electrical circuits. Two ring circuits were created; one for the lighting and one for the screens. Wires branch off from the sockets on the circuits to feed the lights and screens, and each circuit is connected to electrical panels, which are treated as connection points into the building.
The Revit families for the electrical components were modified by adding IfcExportAs and IfcExportType parameters that specify the correspondence between the Revit families and IFC elements. This ensured that the exported IFC model contained entities that are valid within the IFC2x3 schema and represent as accurately as possible the electrical components in the Revit model. Floor lights were exported as an IfcLightFixture (POINTSOURCE type), TV display screens as IfcElectricAppliance (TV type), wall sockets as IfcOutlet (POWEROUTLET type), and electric panels as IfcDistributionFlowElement (no type).
Within Revit, the TOID for Building X (as it appears in the feeder network of Section 4.1) was assigned to the ‘Building Name’ parameter. This value was then automatically assigned to the name attribute of the IfcBuilding element in the output IFC file, ensuring that the building and elements of the BIM model could be integrated with the feeder network by reference to a common building node.

4.2.2. Real-Time Building Sensor Data Stream

The USB has seven floors (including the ground floor) and many of the electrical consumers are serviced by one of three busbars, which run vertically through the building; each floor is zoned into three cores, each supplied by a different busbar. A set of Revit projects and IFC models exist for the USB—one of the three-dimensional (3D) architectural IFC models is presented in Figure 4, along with a plan view of the zoning of the third floor into its three cores.
The building contains approximately 2500 sensors, measuring variables such as air temperature, humidity, lighting level, occupancy, and electricity consumption. The Urban Observatory (UO) [32] collects sensor readings, which are communicated using the Building Automation and Control network (BACnet) protocol, that indicate changes in measured values. Across the entire building, approximately 40 changes are recorded each second, which are published as JSON messages via an Application Programming Interface (API) and broadcast through a websocket.
The 3D models of the USB are complex and range in size from around 150 to 750 megabytes, such that applying the same approach as for Building X (Section 4.2.1) would result in network models of too much topological complexity for the scope of this study; instead, the real-time sensor data stream was exploited for a similar result through a parsing of the content of a subset of the JSON messages broadcast via a websocket that was provided by the UO. Figure 5 shows a single JSON message with attributes that describe the sensor and the data that it recorded. The messages are received and filtered in real-time for power consumption of lighting, mechanical equipment and power sockets. These JSON messages contain information that enables a modelling of the hierarchy and relative spatial layout of the intra-building electricity consumer network: with reference to Figure 5; the “id” value specifies the consumer type and core to which the message relates; the values of “unit” and “data” provide a real-time power figure for the consumer type; “buildingFloor” values identify the floor on which the consumer sits; and, the “building” value is used to identify the building. Although it cannot be guaranteed that the building name is unique (even on a national scale), for the purpose of the case study, this value was treated as a TOID to enable the integration of information from the data stream with the feeder network of Section 4.1 (in the same way as for the IfcBuilding entity in Section 4.2.1).

4.3. Integrated Modelling and Flow Simulation

The data sources that are described above represent the electricity features spanning the GIS-BIM interface, with the distribution feeder network model of Section 4.1 representing infrastructure networks external to buildings, and the BIM model of Section 4.2.1 and building sensor data stream of Section 4.2.2 representing the features inside buildings. These connected elements need to be represented in a way that facilitates their integration into a single, multi-scale network, which in turn enables the simulation of electrical flow through the topology. However, although some infrastructure network modelling use cases—such as simulating the physical propagation of the effects of a network node failure—may demand a highly complex representation of elements, connections, and attributes, a utility resource demand-supply visualisation may provide a clearer understanding of resource flows if it is based on a simpler, abstracted topology.
Firstly, the system described in Section 3 was used to model the topology of all the electrical components and connections that are represented in the static models—the distribution network represented in CityGML (Section 4.1) and the BIM model represented in IFC (Section 4.2.1).
Figure 6 shows the integrated topology of the synthetic electricity distribution feeder network (Figure 2) and the internal electrical connectivity of Building X (Figure 3), as represented in the Neo4j graph database. The figure shows the single substation, two buildings (Building X and the Urban Sciences Building), the access points for the buildings and substation; and the electrical panels, light fixtures and screens inside Building X. The integrated network is shown at a minimal level of abstraction, representing the complete topology derived from the data sources. These nodes can be related directly to the nodes of the distribution feeder network and the consumer elements of the BIM model of Building X.
For the purpose of demand-supply visualisation in this case study, much of the complexity of the topology shown in Figure 6 is redundant. For example, a facilities manager might be interested in energy losses by identifying upstream supply (from a substation, for example) that is not accounted for by downstream consumption (within a building), but has no concern for the physical elements through which the electricity passes. In order to reduce the complexity, the integration and simulation system (Figure 1) was further developed such that it derives an abstracted topology by an automatic execution of queries that merge the nodes and relationships between the substation, buildings, and consumer nodes into single relationships that connect the substation to its buildings and the buildings to their consumers. The relative simplicity of this abstracted topology leads to a more intuitive visualisation of the flow of electricity through the network because the network layers represent a change in spatial scale.
With the network abstracted to this simpler topology, the consumer elements that are derived from the real-time data stream (Figure 5) can also be integrated. Furthermore, the building floors and cores (zones) to which the sensors relate can be derived from the building management data; these describe how the consumers are distributed vertically (floors) and horizontally (cores) through the building, allowing for additional layers of topology to be introduced to the demand-supply hierarchy of the USB. The system was modified to introduce these topological layers to the graph representation. The result of integrating the abstracted topology of the electricity networks derived from the CityGML and IFC with the consumer types derived from a batch of JSON messages of the USB data stream is shown in Figure 7.
In Figure 7, the topology of electrical components inside the USB is derived from messages spanning a period of approximately 5 s. In order to demonstrate more clearly the dynamics of the network integration, this subset of the network is modelled in isolation. Figure 8 shows the evolution of the integrated network when the graph database is populated with data from (different) messages over a time window of approximately 10–15 s, captured at three points in time. As more messages are received from the data stream, more consumer types are identified across the floors and cores of the USB. In Figure 8a, after exposure to the data stream for two or three seconds, messages have been received for two cores on the ground floor but only one core and one consumer type on each of the second, third and fourth floors. Around five seconds later, at (b), values have been received for other cores on the higher floors and for different consumer types. Given exposure to a further five seconds of sensor messages, at (c), the network is becoming even more populated by consumer types across the vertical floors and horizontal cores.
The time series data and unit values from the USB data stream are used to assign real-time power values to the properties on the graph relationships that connect the core nodes to the consumer type nodes. Throughout the hierarchy, the power values on each level are summed to provide a value for its parent level in the demand-supply tree. For visualisation purposes, the individual lights and screens in Building X were assigned constant, nominal values that are comparable in magnitude to those for the consumer types (which each represent the power used by multiple entities) in the USB.
As described in Section 3, a background application recursively executes Cypher queries that capture the state of the entire database instance. For this case study, the time interval for this recursion was set at a single second. The JSON node objects contain name values that uniquely identify each node; the relationship objects contain electrical power values, and source and target node names. Collectively, the arrays of these objects that are stored in each JSON message are sufficient to represent the topology and flow of the integrated network.

4.4. Electricty Demand-Supply Visualisation

The specific objective of the case study is to evaluate the system for modelling and visualising the flow of electricity across the GIS-BIM interface. As a validation of the method, it is important to test whether the system of Figure 1 can be readily exploited for this purpose. As a client to the dissemination component (Component B) of the system shown in Figure 1, we developed a lightweight exploitation system that enables the visualisation of the spatiotemporal dynamics of the integrated network. Component C in Figure 9 shows the web technologies used in this system, along with their configuration.
A Node.JS web server is deployed with a script that subscribes to the required topic on the Kafka message broker (Component B, Figure 1) and sends the received JSON messages through another web socket (developed using the Socket.IO technology) to a connecting web browser. In conjunction with the JavaScript visualisation code and the HTML provided by the server, the browser uses the messages to display a dynamic Sankey diagram—based on the d3 and d3-sankey JavaScript libraries [33,34]—to show the real-time flow of electricity.
Figure 10 shows an example visualisation that represents the electricity consumption from the substation to the two individual buildings (the USB and Building X) and then through to the individual consumers within the buildings. The vertical bars represent the network nodes and the connecting grey curved bands represent the relationships between these nodes; this structure relates directly to topology depicted in Figure 7. The visualisation depicts the building management data received by the integration system for the USB over a 10-second interval. The heights of the bars and widths of the bands correspond to the magnitude of power consumption through the relationship. The individual consumer types in the USB were measured to consume electricity in the range 0.1–10 kilowatts; for Building X, the consumer elements were assigned a constant 2-kilowatt output.
In the same way that Figure 10 shows the flow of electricity through the network of Figure 7, the Sankey diagrams of Figure 11 corresponds directly to the evolving network of Figure 8 for the USB in isolation; it shows how the backend system of Figure 1 can be used by the exploitation system of Figure 9 in order to gain a visual understanding of changing electricity flows through an evolving topology using a real-time data stream. With reference to Figure 11; by the time that the network has reached state (c), it can already be seen that Core 1 has a relatively high consumption across all of the floors (where data for Core 1 have been received); it is also clear that the lighting (labelled ‘Lighting’) across the entire building is consuming more power than that the mechanical equipment (labelled ‘Mech’) and consumers that are connected to power sockets (labelled ‘Power’). The shrinking of vertical bar height for the USB from (a) to (c) is only a result of the visualisation needing to accommodate an increasing number of consumer types (and the spaces between them) on the right-hand side.

5. Discussion

This paper presents a method and implementation system for integrated modelling of infrastructure networks and simulation of resource flows across the GIS-BIM divide. A case study was used to evaluate the method, applying the system to the intra-urban and intra-building scales of an electricity demand-supply network for the purpose of demand-supply visualisation. The case study showed that the method enables continuous, real-time integration of the elements of GIS and BIM models that are required for electricity flow simulation, avoiding mappings between static data formats; instead, a graph database was used for representation of the elements from both domains and across the multiple scales, an approach that also enabled the integration of a real-time building management sensor data stream, which was used to enrich the network with additional elements, topological structure, and flow data. By parsing the models for salient elements only, the system eliminated much of the modelling complexity inherent in integration methods that attempt lossless or near-lossless conversions [15,35]. The integrated model and flow data were made available for exploitation through a dissemination platform, which manages messages that describe the real-time state of the network using a message broker.
It has been shown that a graph database can be used to represent and integrate the topologies of multi-scale electricity networks, and can be updated and queried in real-time to support electrical power flow visualisation. Future work could attempt to verify that this method can be extended to networks of other types of resources, such as gas and water supply and waste water. Further to its suitability for modelling and processing urban topologies [26,27], a graph database enables intuitive, human-readable concept models of systems to be reflected in the database structure, which results in a schema that is easier to interpret. There is no need to predefine the database schema since new nodes, relationships, and properties can be added on-the-fly; this flexibility is powerful for a utility resource network model that must integrate data from diverse and dynamic data sources. More generally, the requirement for integration methods to enable deeper mathematical modelling [10] would be facilitated by the speed and efficiency of using graph databases to execute queries on connected data [24,25], and the relative simplicity of constructing query statements.
A message broker was demonstrated as an effective platform for exposing in real-time the state of the integrated electricity network for use in a web-based visualisation. The hosting of the broker on a dedicated, persistent, and accessible (virtual) machine afforded confidence in the reliable availability of real-time data. Beyond the thematic data filtering applied prior to modelling in the graph database, further filtering could be applied by applications that execute database queries for specific subsets of the nodes, relationships, and their properties, returning results to a broker topic that is associated with the query. Subscribing to that topic would be equivalent to subscribing to the database query, with the topic serving as a use-case view of the graph database, which is itself a thematic view of the integrated elements derived from the diverse, semantically rich data sources. The Kafka message broker technology used in this study is highly scalable; it can be deployed as a cluster spanning several servers [29], with the ability to communicate data through multiple topics. The Kafka Streams API [36] could be used to support the development of applications and micro-services that perform processing on real-time data streams and future work should consider employing the technology for implementing the concept of thematic and use case views of a graph database.
The method that is presented in this paper can be scaled to integrate larger, more complex infrastructure network and BIM models; and more varied, higher velocity real-time data streams as these sources become increasingly available. In order to exploit fully the potential of the revolution in BIM and the instrumentation of urban environments, there is a requirement to start developing the methods and tools that can integrate, analyse, and visualise these sources in a way that facilitates critical decision-making. The system presented in this paper was developed to the extent that it could be used to evaluate the method for the case study and further development is required to prove its scalability. For example, the method of capturing snapshots of the entire state of the network is unlikely to be computationally efficient enough to be scalable to very large networks. Instead, the messages would either need to capture the entire state of smaller sub-networks (related to a particular theme, for example) or only capture the changes that occur to the network; in the latter case, a client system would need to reconstruct complete topologies and flows from multiple messages stored on the broker. Similarly, the means of identifying elements that are common to multiple data sources—which is fundamental to the integration and currently makes use of UK-specific TOIDs—would also need to be generalised to ensure referencing consistency and universal uniqueness; alternatively, the geometries and geolocations present in each source could be used to identify spatial coincidence of elements and thus infer their equivalence. It will also be important to establish a way to relate real-time data streams to entities found in data models. Currently, the system is capable of relating the flow data only to the topology derived from the same data source and future research should consider enabling the ability to associate a data feed with entities that are derived from other data streams and model instances.
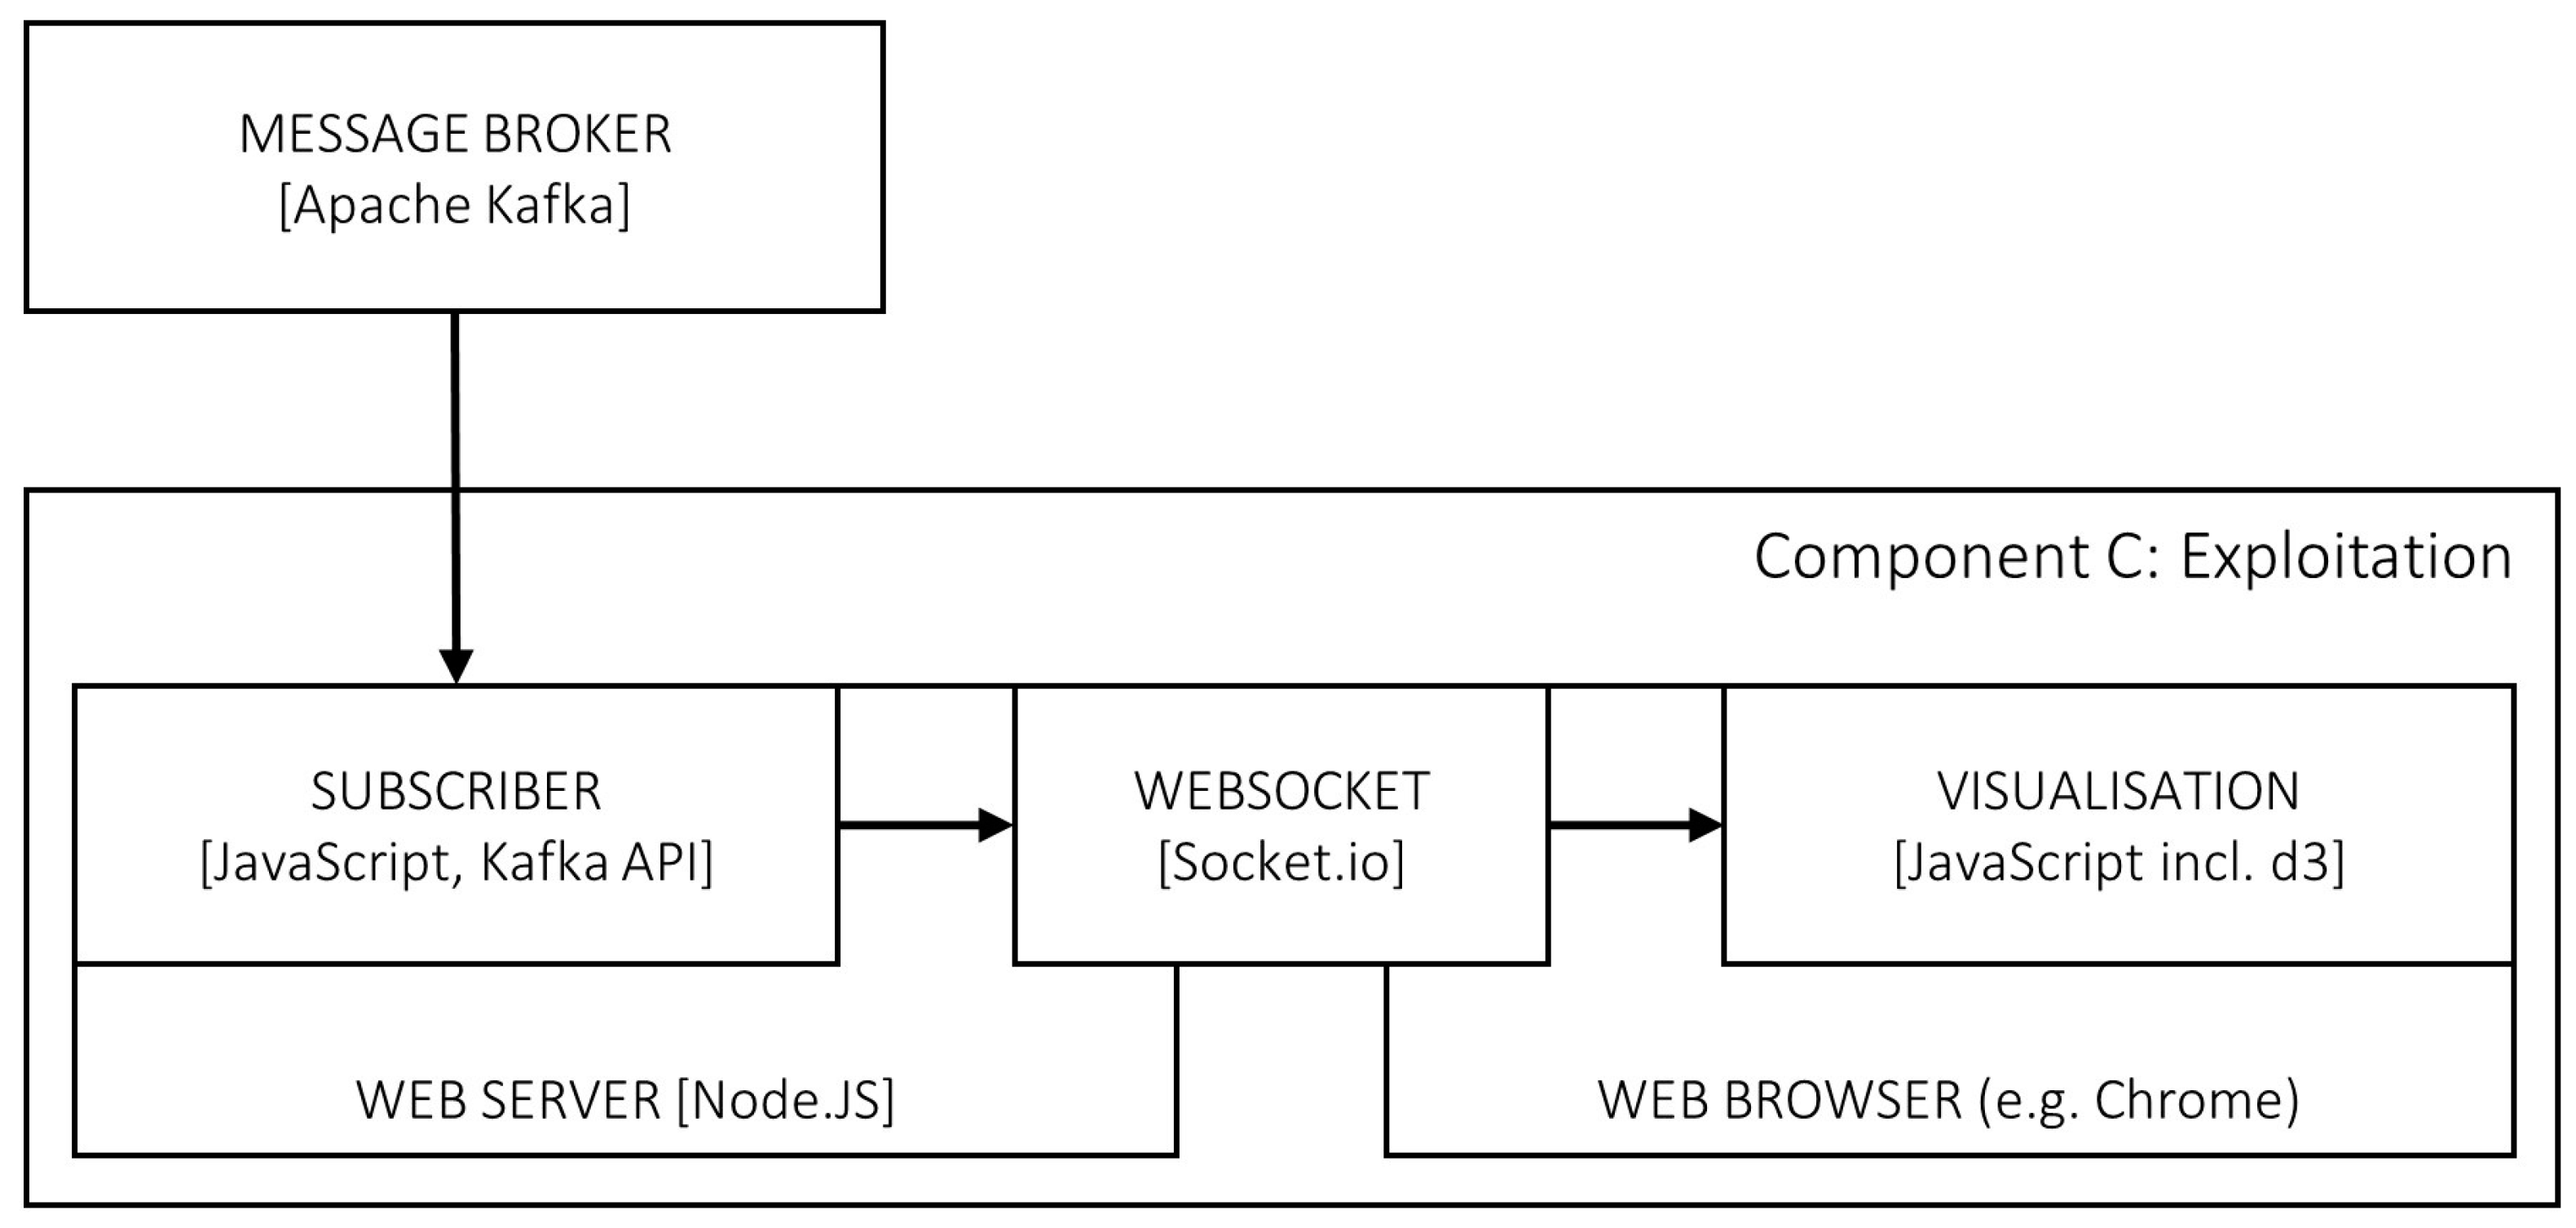
A more developed implementation of the method has the potential to provide many aspects of the spatiotemporal analytical capabilities required for more general GIS-BIM integration [10]. For example, a regional energy provider could deploy the processing, modelling, and dissemination components of the system, publishing messages that describe the state of the integrated intra-urban and intra-building demand-supply network that it manages. A facility manager could then subscribe to a topic on the broker, exploiting the published messages (in a similar way to component C of Figure 9) on a dashboard that supports fault diagnosis through highlighting anomalies in a flow visualisation; at the same time, a civil systems engineer or urban planner could subscribe to the same topic and conduct analyses on historic time-series data in support of assessing the impact of proposed modifications to the supporting infrastructure.
The geometries and geolocations encoded in the data sources could be used for several other purposes: to render multi-scale 3D visualisation in augmented or virtual reality environments, providing a more intuitive and immersive visualisation platform to users [37,38]; for the detection of clashes between physical assets that would otherwise be represented in disjoint GIS and BIM models; and, to enable the querying of intra-building flow data from geospatial software environments, such as drilling down from an urban-scale topographic map to view the real-time electricity flow within an individual dwelling or factory. The utilisation of timestamps on messages in the broker topic, or on updates to the graph database, would further exploit the method’s potential; by allowing replays of network flow evolution from historic time series data, the system could facilitate the diagnosis of anomalies in usage patterns with alerts issued for values falling outside a predefined tolerance—for example, identifying that an increase in energy costs is due to the machinery in a factory activating erroneously at night.
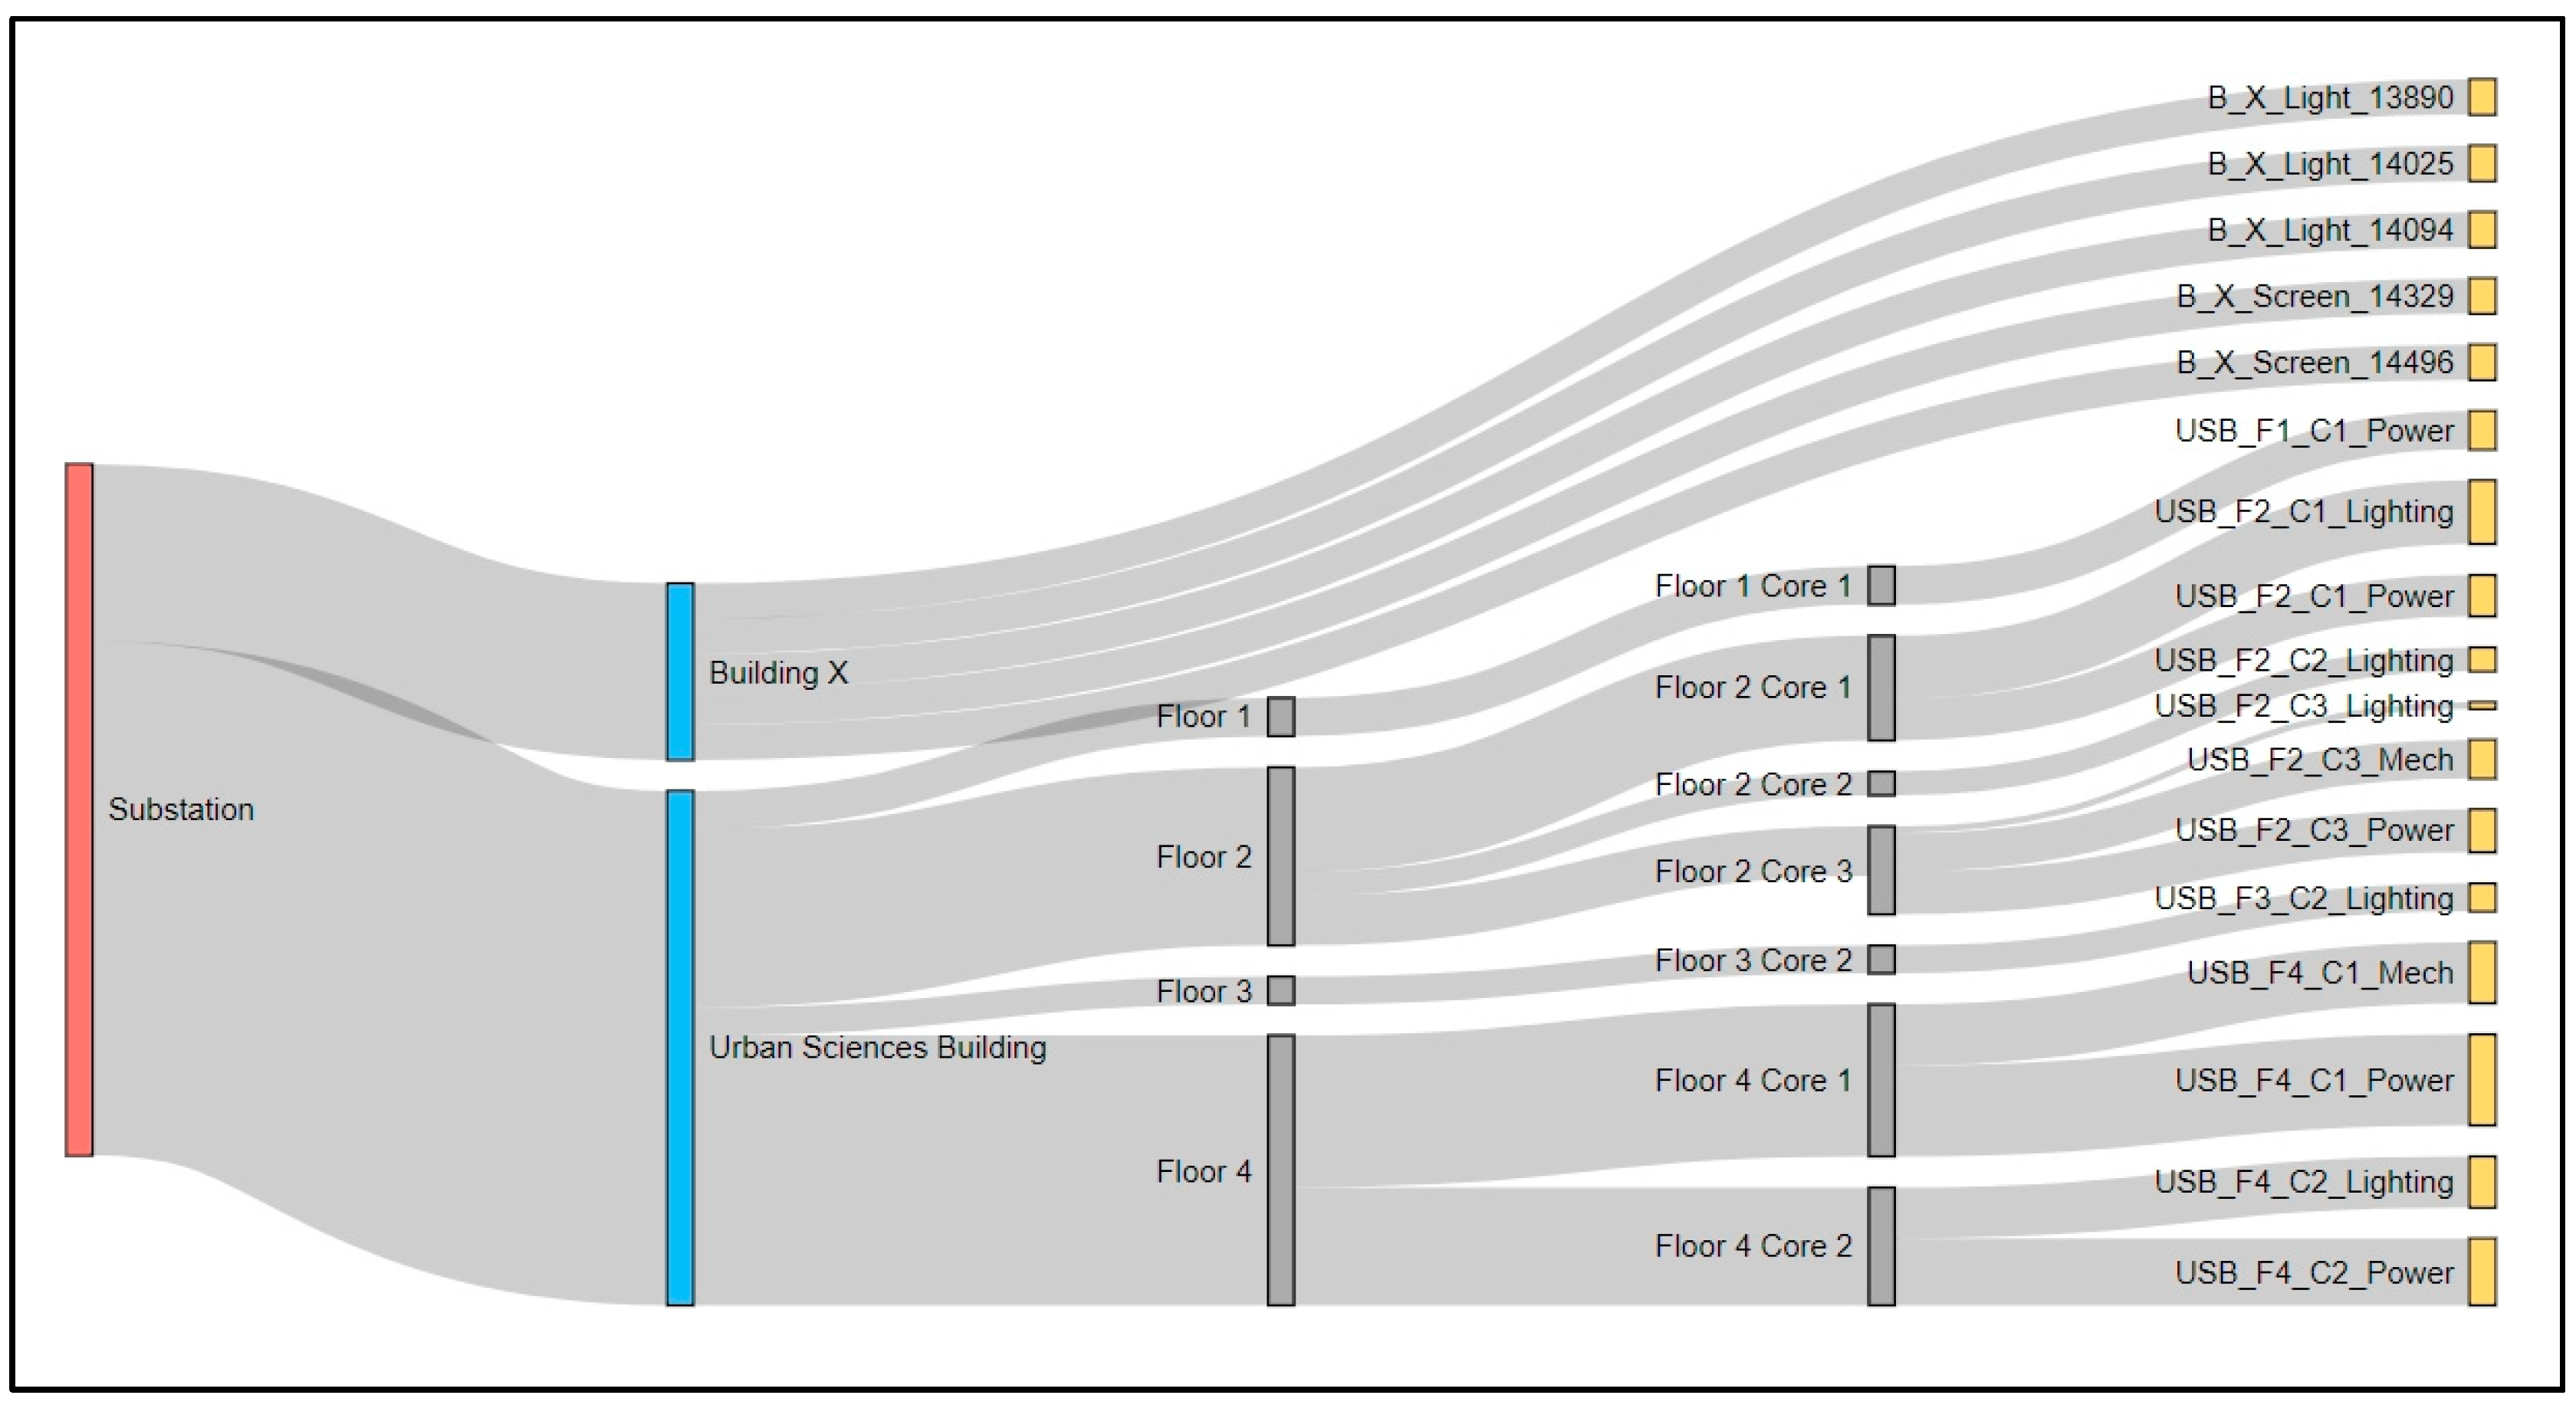
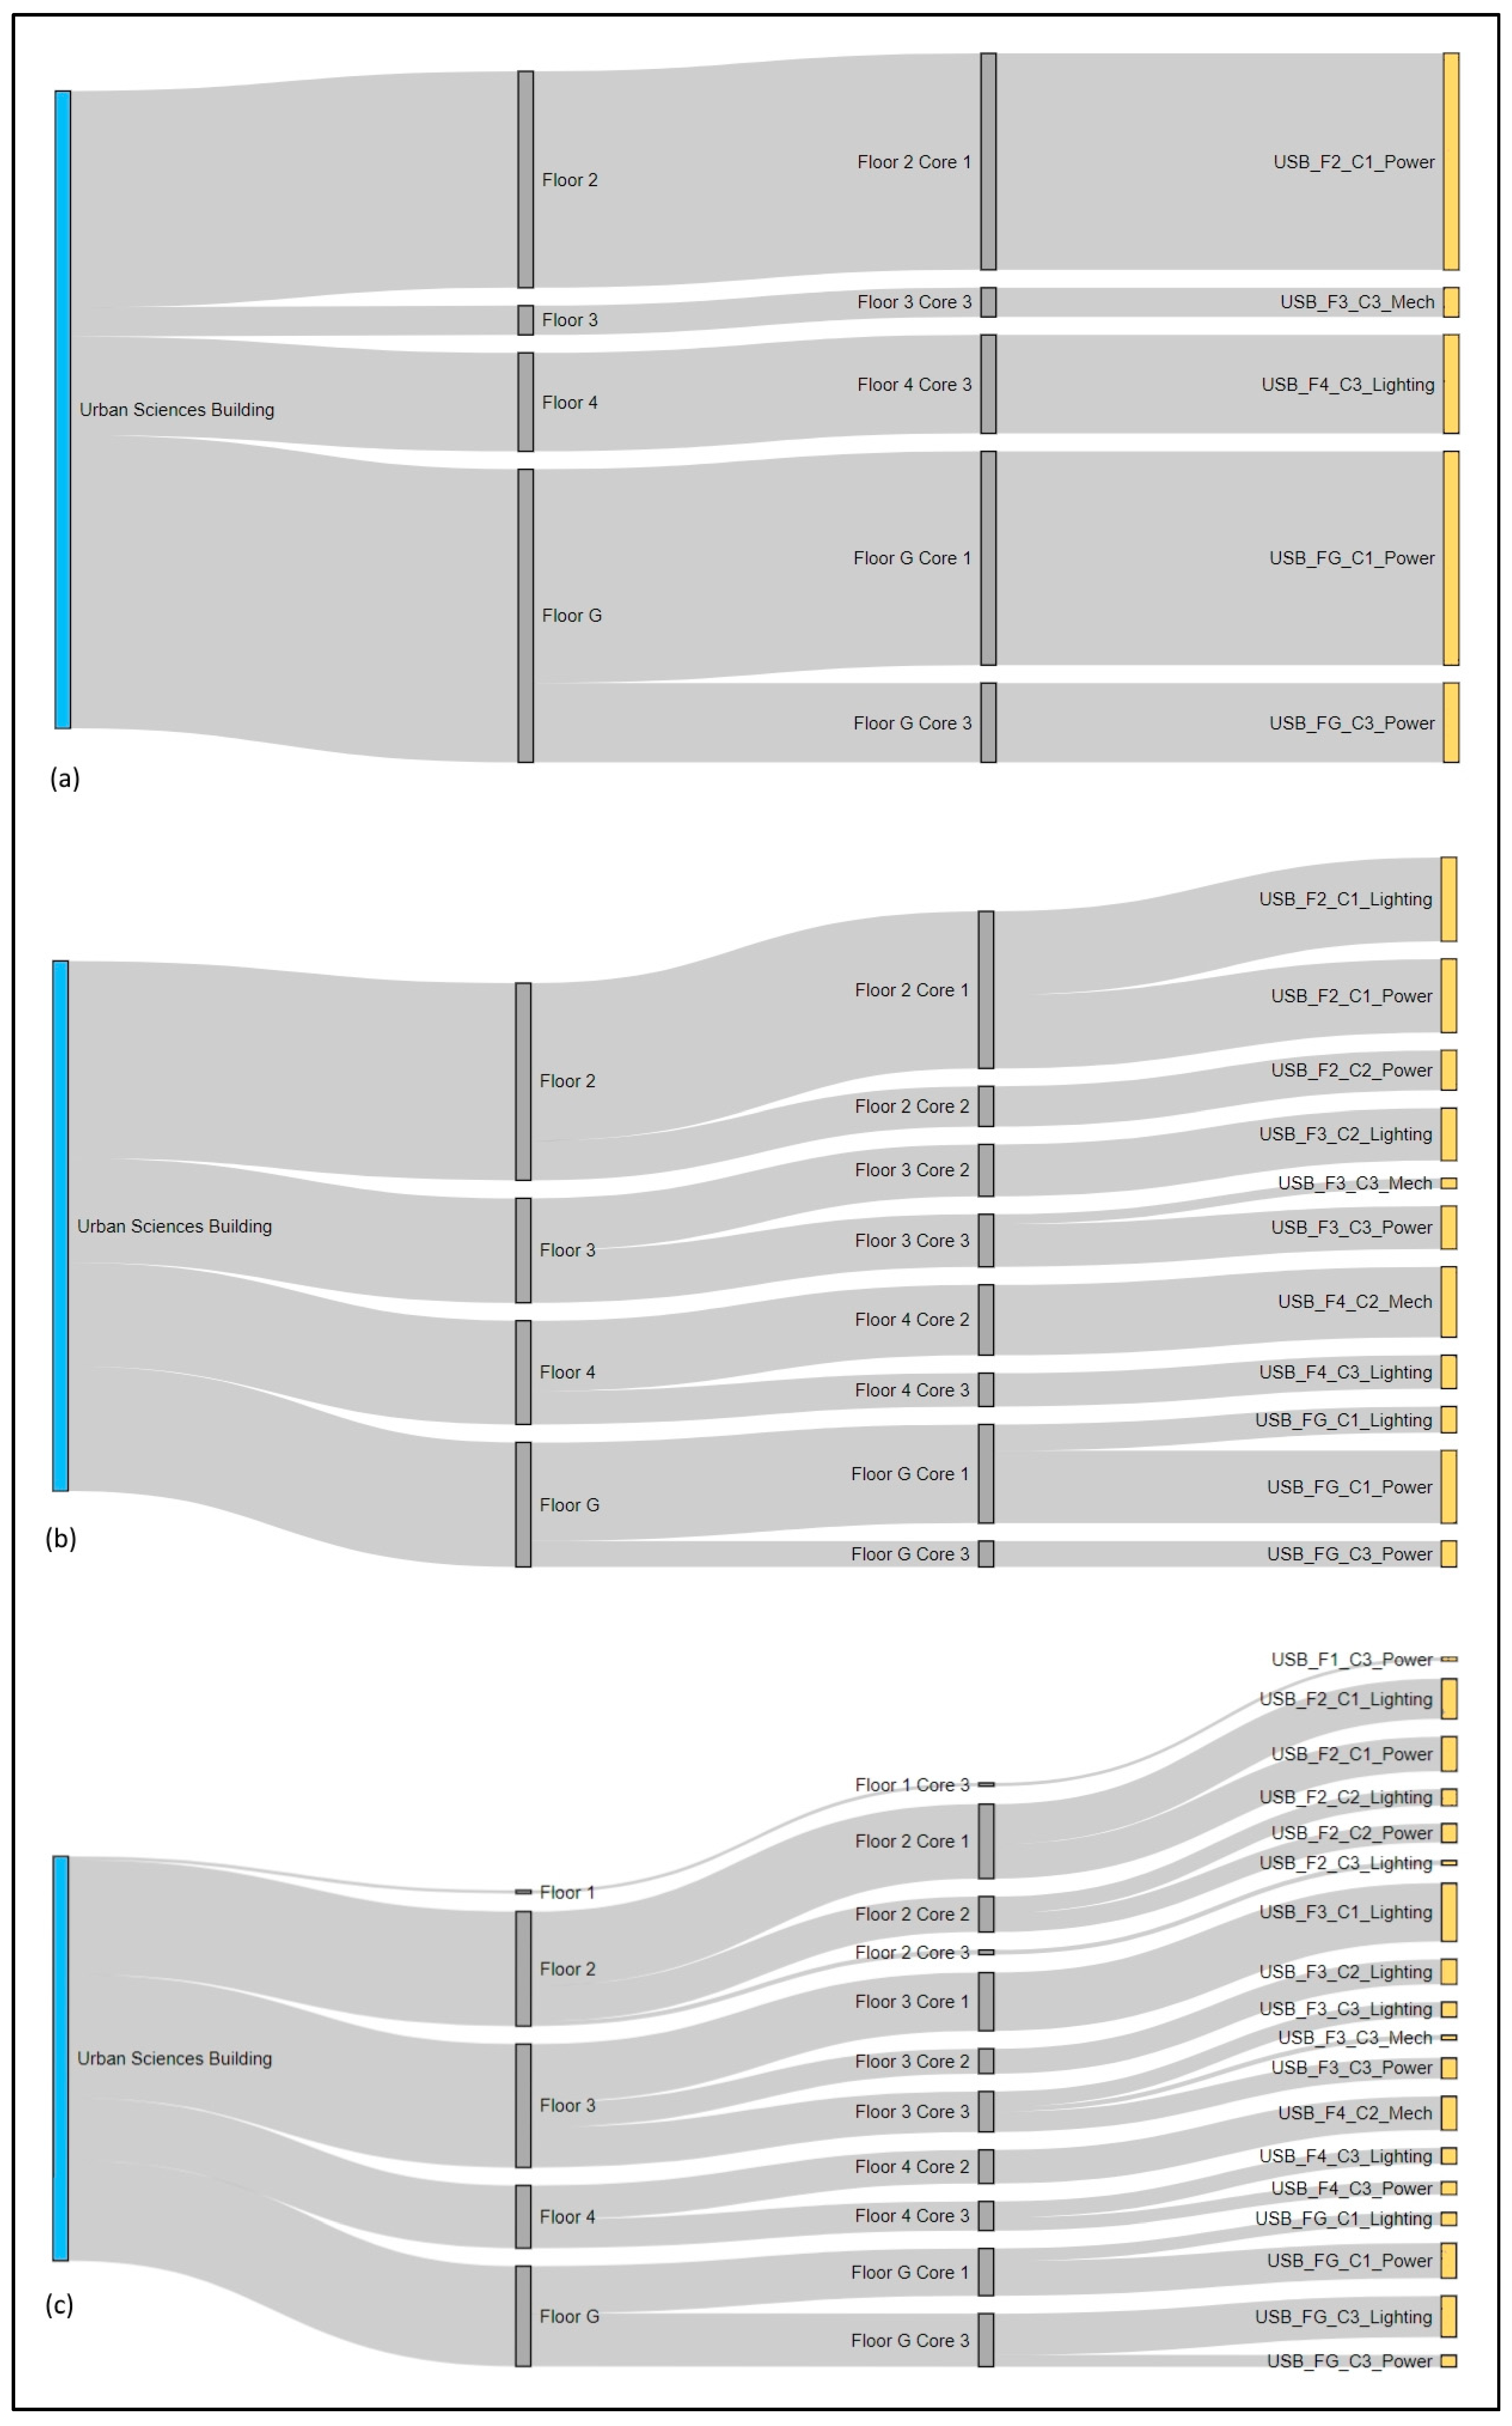
Future work should also focus on practical applications of the visualisation and analytical capabilities that the method allows, such as the dynamic Sankey visualisations of Figure 10 and Figure 11. Sankey diagrams have an extensive history in mapping and exploration of flows in operational systems [39,40]. Researchers have studied their use for estimating energy flows from sparse sensor data [41] and visual representation of interdependencies between electricity, heat, and gas networks [42]. The results of the case study presented in this paper have shown that Sankey diagrams can be used to represent flows from real-time sensor data in systems with evolving topologies that are derived from disparate data sources. A more developed version of the underpinning integration system presented in this research, which is able to model multi-resource interdependencies, could be used to show visually the effects of these couplings on flow dynamics. Such a system would also enable analyses for purposes such as anomaly detection; for example, if a set of resource provision services have failed, root cause analysis can applied by querying the graph for common dependencies [43]. Erdener et al. [44] identify gas-fired power plants in electricity systems and electricity-driven compressors in gas systems as the most significant dependencies in coupled gas-electricity systems, and active demand-side response (DSR) strategies stand to benefit from the modelling of coupled systems; Qadrdan et al. [45] showed that a significant reduction in gas consumption can be achieved by electricity peak shaving through DSR. For the system presented in this paper to enable this at an intra-building scale, the parsing and graph representation of IFC models would need substantial further development and capturing the topologies of building systems is likely to be key to exploiting smart building technologies.

6. Conclusions

This manuscript presents a GIS-BIM integration and simulation method and implementation, which enables visualisation and analysis of resource flows through multi-scale infrastructure networks. The research demonstrates the effectiveness of using a graph database, message broker, and web technologies in a custom software system that integrates electricity network elements across multiple scales, derived from CityGML UtilityNetwork ADE models, IFC models, and JSON messages from a real-time data stream. The system was evaluated in a case study that focused on the challenge of dynamic visualisation of electricity demand-supply across the urban and building scales, validating the method as a means of understanding in real-time the flow of utility resources across the internal-external building interface. The research contributes to addressing the integration challenge that is presented by the tradition of modelling building interiors and external urban environments separately in the disparate BIM and GIS domains. A graph representation enables a more flexible approach to integrating the topologies derived from diverse datasets, without reliance on existing schemas and their overlapping concepts, and which is able to represent dynamics such as resource flows. Continuation research should focus on associating data feeds with entities that are derived from other data streams and model instances, scaling the capability to multiple buildings and distributions networks, applying the approach to other types of utility resources and their interdependencies, devising a spatial method for matching entities across data sources, and testing the operational robustness of the approach to a range of use cases.

Supplementary Materials

At the time of writing, a 3D model of the Urban Sciences Building in Newcastle upon Tyne is available at https://3d.usb.urbanobservatory.ac.uk/ and the building’s real-time BMS data stream at https://api.usb.urbanobservatory.ac.uk/live (wss://api.usb.urbanobservatory.ac.uk/).

Author Contributions

T.G., S.B. and P.J. conceived and designed the research and methods; T.G. implemented the methods and produced the results; S.B., P.J. and J.M. supervised the research; T.G. and S.B. wrote the paper, which P.J. reviewed and edited; Q.J. generated some of the source data.

Funding

The research project described in this manuscript is part of a PhD CASE studentship, funded by the Engineering and Physical Sciences Research Council and Ordnance Survey.

Acknowledgments

This manuscript contains OS data © Crown copyright and database right (2018). Thanks and credit are due to: Isaac Boates (European Institute for Energy Research) and Tatjana Kutzner (Technische Universität München) for providing example FME workspaces and guidance in support of mapping data into the schema of CityGML UtilityNetwork ADE; John White (Poyton Bradbury Wynter Cole Architects) for providing a shell Revit model, which formed the basis of the BIM model used in this research; Luke Smith (Urban Observatory, Newcastle University) for support with utilising the USB data stream and feedback on the manuscript; Andrew Davey (Equin Ltd.) for guidance on web development, and feedback on the research and the manuscript; Carsten Roensdorf (Ordnance Survey) for feedback on the research and the manuscript; Mohammad Royapoor (Centre for Energy Systems Integration, Newcastle University) for guidance on electrical engineering; Anne Spaa (School of Design, Northumbria University) and Maria Pregnolato (School of Engineering, Newcastle University) for assistance with refining the figures in the manuscript; Alistair Ford (School of Engineering, Newcastle University) for proofreading the manuscript.

Conflicts of Interest

Jeremy Morley (fourth author) is one of the research supervisors and the Chief Geospatial Scientist at Ordnance Survey, which is one of the research sponsors. The authors declare no further conflicts of interest.

References

  1. UK Infrastructure and Projects Authority. National Infrastructure Delivery Plan 2016–2021, 2016. Available online: https://assets.publishing.service.gov.uk/government/uploads/system/uploads/attachment_data/file/520086/2904569_nidp_deliveryplan.pdf (accessed on 27 July 2018).
  2. UK Infrastructure and Projects Authority. Government Construction Strategy 2016–20, 2016. Available online: https://assets.publishing.service.gov.uk/government/uploads/system/uploads/attachment_data/file/510354/Government_Construction_Strategy_2016-20.pdf (accessed on 27 July 2018).
  3. UK Government. Digital Built Britain Level 3 Building Information Modelling—Strategic Plan, 2015. Available online: https://assets.publishing.service.gov.uk/government/uploads/system/uploads/attachment_data/file/410096/bis-15-155-digital-built-britain-level-3-strategy.pdf (accessed on 27 July 2018).
  4. UK Parliamentary Office of Science & Technology. Electricity Demand-Side Response, 2014. Available online: http://researchbriefings.parliament.uk/ResearchBriefing/Summary/POST-PN-452 (accessed on 27 July 2018).
  5. Cheng, J.C.P.; Lu, Q.; Deng, Y. Analytical review and evaluation of civil information modeling. Autom. Constr. 2016. [Google Scholar] [CrossRef]
  6. Isikdag, U.; Zlatanova, S. Towards Defining a Framework for Automatic Generation of Buildings in CityGML Using Building Information Models. In 3D Geo-Information Sciences; Springer: Berlin/Heidelberg, Germany, 2009; pp. 79–96. [Google Scholar]
  7. Fosu, R.; Suprabhas, K.; Rathore, Z.; Cory, C. Integration of Building Information Modeling (BIM) and Geographic Information Systems (GIS)—A literature review and future needs. In Proceedings of the 32nd CIB W78 Conference 2015, Eindhoven, The Netherlands, 27–29 October 2015; pp. 196–204. [Google Scholar]
  8. De Laat, R.; van Berlo, L. Integration of BIM and GIS: The development of the CityGML GeoBIM extension. In Advances in 3D Geo-Information Sciences; Springer: Berlin/Heidelberg, Germany, 2011; pp. 211–225. [Google Scholar] [CrossRef]
  9. Chaturvedi, K.; Kolbe, T.H. Dynamizers—Modeling and Implementing Dynamic Properties for Semantic 3D City Models. In Proceedings of the Eurographics Workshop on Urban Data Modelling and Visualisation, Delft, The Netherlands, 23 November 2015; pp. 43–48. [Google Scholar] [CrossRef]
  10. Song, Y.; Wang, X.; Tan, Y.; Wu, P.; Sutrisna, M.; Cheng, J.; Hampson, K. Trends and Opportunities of BIM-GIS Integration in the Architecture, Engineering and Construction Industry: A Review from a Spatio-Temporal Statistical Perspective. ISPRS Int. J. Geo-Inform. 2017, 6, 397. [Google Scholar] [CrossRef]
  11. Liu, X.; Wang, X.; Wright, G.; Cheng, J.; Li, X.; Liu, R. A State-of-the-Art Review on the Integration of Building Information Modeling (BIM) and Geographic Information System (GIS). ISPRS Int. J. Geo-Inform. 2017, 6, 53. [Google Scholar] [CrossRef]
  12. Deng, Y.; Cheng, J.C.P.; Anumba, C. Mapping between BIM and 3D GIS in different levels of detail using schema mediation and instance comparison. Autom. Constr. 2016, 67, 1–21. [Google Scholar] [CrossRef]
  13. Irizarry, J.; Karan, E.P. Optimizing Location of Tower Cranes on Construction Sites through GIS and BIM Integration. Electron. J. Inf. Technol. Constr. 2012, 17, 361–366. [Google Scholar]
  14. Amirebrahimi, S.; Rajabifard, A.; Mendis, P.; Ngo, T. A data model for integrating GIS and BIM for assessment and 3D visualisation of flood damage to building. In Proceedings of the Locate 2015, Brisbane, Australia, 10–12 March 2015; Available online: http://ceur-ws.org/Vol-1323/Paper27.pdf (accessed on 30 July 2018).
  15. Cheng, J.C.P.; Deng, Y.; Anumba, C. Mapping BIM schema and 3D GIS schema semi-automatically utilizing linguistic and text mining techniques. J. Inf. Technol. Constr. 2015, 20, 193–212. [Google Scholar]
  16. Karan, E.P.; Irizarry, J.; Haymaker, J. BIM and GIS Integration and Interoperability Based on Semantic Web Technology. J. Comput. Civ. Eng. 2016. [Google Scholar] [CrossRef]
  17. Hor, A.-H.; Jadidi, A.; Sohn, G. BIM-GIS Integrated geospatial information model using semantic web and RDF graphs. ISPRS Ann. Photogramm. Remote Sens. Spat. Inf. Sci. 2016, III-4, 73–79. [Google Scholar] [CrossRef]
  18. Kang, T.W.; Hong, C.H. A study on software architecture for effective BIM/GIS-based facility management data integration. Autom. Constr. 2015, 54, 25–38. [Google Scholar] [CrossRef]
  19. Hijazi, I.; Ehlers, M.; Zlatanova, S.; Becker, T. Initial Investigations for Modeling Interior Utilities within 3D Geo Context: Transforming IFC-Interior Utility to CityGML/UtilityNetworkADE. In Advances in 3D Geo-Information Sciences; Springer: Berlin/Heidelberg, Germany, 2011; pp. 73–93. [Google Scholar]
  20. Kutzner, T.; Kolbe, T.H. Current state of development of the CityGML UtilityNetworkADE. In Proceedings of the 1st Jt. SIG 3D OGC Work. CityGML Util, Munich, Germany, 13–14 October 2016; Available online: https://en.wiki.utilitynetworks.sig3d.org/images/upload/20160913_-_Kutzner_-_Current_state_of_development_of_the_CityGML_UtilityNetworkADE.pdf (accessed on 27 July 2018).
  21. Becker, T.; Nagel, C.; Kolbe, T.H. Semantic 3D modeling of multi-utility networks in cities for analysis and 3D visualization. In Progress and New Trends in 3D Geoinformation Sciences; Springer: Berlin/Heidelberg, Germany, 2013; pp. 41–62. [Google Scholar]
  22. Jaradat, M.; Jarrah, M.; Bousselham, A.; Jararweh, Y.; Al-Ayyoub, M. The Internet of Energy: Smart Sensor Networks and Big Data Management for Smart Grid. Procedia Comput. Sci. 2015, 56, 592–597. [Google Scholar] [CrossRef]
  23. Becker, T.; Nagel, C.; Kolbe, T.H. UtilityNetworkADE. 2016. Available online: http://www.citygmlwiki.org/index.php/CityGML_UtilityNetworkADE (accessed on 1 August 2018).
  24. Khan, W.; Shahzad, W. Predictive Performance Comparison Analysis of Relational & NoSQL Graph Databases. Int. J. Adv. Comput. Sci. Appl. 2017, 8, 523–530. [Google Scholar]
  25. Holzschuher, F.; Peinl, R. Performance of graph query languages. In Proceedings of the Joint EDBT/ICDT 2013 Workshops, Genoa, Italy, 18–22 March 2013. [Google Scholar] [CrossRef]
  26. De Almeida, J.P.; Morley, J.G.; Dowman, I.J. A graph-based algorithm to define urban topology from unstructured geospatial data. Int. J. Geogr. Inf. Sci. 2013, 27, 1514–1529. [Google Scholar] [CrossRef] [Green Version]
  27. Falkowski, K.; Ebert, J. Graph-Based Urban Object Model Processing. In Proceedings of the CMRT09, Paris, France, 3–4 September 2009; Available online: http://www.isprs.org/proceedings/XXXVIII/3-W4/pub/CMRT09_115.pdf (accessed on 31 July 2018).
  28. Nguyen, S.H.; Yao, Z.; Kolbe, T.H. Spatio-Semantic Comparison of Large 3D City Models in CityGML Using a Graph Database. ISPRS Ann. Photogramm. Remote Sens. Spat. Inf. Sci. 2017, IV-4/W5, 99–106. [Google Scholar] [CrossRef]
  29. Apache Foundation, Apache Kafka. Available online: https://kafka.apache.org/ (accessed on 20 March 2018).
  30. Ji, Q.; Barr, S.; James, P.; Fairbairn, D. A heuristic spatial algorithm for generating fine-scale infrastructure distribution networks. Proceedings of GISRUK 17, Manchester, UK, 18–21 April 2017; Available online: http://huckg.is/gisruk2017/GISRUK_2017_paper_37.pdf (accessed on 27 July 2018).
  31. Newcastle University, Urban Sciences Building. Available online: http://www.ncl.ac.uk/sciencecentral/urban/ (accessed on 8 March 2018).
  32. Newcastle University, Newcastle Urban Observatory. Available online: http://uoweb1.ncl.ac.uk/ (accessed on 1 August 2018).
  33. Bostock, M. d3 JavaScript Library. Available online: https://d3js.org/ (accessed on 27 July 2018).
  34. Bostock, M. d3-Sankey JavaScript Library. Available online: https://github.com/d3/d3-sankey (accessed on 27 July 2018).
  35. El-Mekawy, M.; Östman, A. Semantic Mapping: An Ontology Engineering Method for Integrating Building Models in IFC and CITYGML. In Proceedings of the 3rd ISDE Digital Earth Summit, Nessebar, Bulgaria, 12–14 June 2010; Available online: https://cartography-gis.com/pdf/32_El-Mekawy_Sweden_paper.pdf (accessed on 27 July 2018).
  36. Apache Foundation, Kafka Streams API. Available online: https://kafka.apache.org/10/documentation/streams/ (accessed on 20 March 2018).
  37. Wang, X. Augmented Reality in Architecture and Design: Potentials and Challenges for Application. Int. J. Archit. Comput. 2009, 7, 309–326. [Google Scholar] [CrossRef] [Green Version]
  38. Chi, H.L.; Kang, S.C.; Wang, X. Research trends and opportunities of augmented reality applications in architecture, engineering, and construction. Autom. Constr. 2013, 33, 116–122. [Google Scholar] [CrossRef]
  39. Schmidt, M. The Sankey diagram in energy and material flow management: Part I: History. J. Ind. Ecol. 2008, 12, 82–94. [Google Scholar] [CrossRef]
  40. Riehmann, P.; Hanfler, M.; Froehlich, B. Interactive sankey diagrams. In Proceedings of the IEEE Symposium on Information Visualization, Washington, DC, USA, 23–25 October 2005. [Google Scholar]
  41. Abdelalim, A.; O’Brien, W.; Shi, Z. Development of Sankey diagrams to visualize real HVAC performance. Energy Build. 2017, 149, 282–297. [Google Scholar] [CrossRef]
  42. Liu, X.; Mancarella, P. Modelling, assessment and Sankey diagrams of integrated electricity-heat-gas networks in multi-vector district energy systems. Appl. Energy 2016, 167, 336–352. [Google Scholar] [CrossRef]
  43. Neo4j, Neo4j Graph Database. Available online: https://neo4j.com/ (accessed on 21 March 2018).
  44. Erdener, B.C.; Pambour, K.A.; Lavin, R.B.; Dengiz, B. An integrated simulation model for analysing electricity and gas systems. Int. J. Electr. Power Energy Syst. 2014, 61, 410–420. [Google Scholar] [CrossRef]
  45. Qadrdan, M.; Cheng, M.; Wu, J.; Jenkins, N. Benefits of demand-side response in combined gas and electricity networks. Appl. Energy 2017, 192, 360–369. [Google Scholar] [CrossRef]
Figure 1. A depiction of the integration, simulation and dissemination method used in this research.
Ijgi 07 00310 g001
Figure 2. Heuristically derived electricity distribution feeder networks for an area of the city of Newcastle upon Tyne, UK. The inset zooms in on a single, small distribution feeder network (located in the top-right of the figure) that is used as the subject network for this study. Contains OS data © Crown copyright and database right (2018).
Ijgi 07 00310 g002
Figure 3. Building Information Modelling (BIM) model of the low-complexity, synthetic Building X with lights, screens, electric panels, electric sockets, and the cables that connect these elements.
Ijgi 07 00310 g003
Figure 4. A 3D architectural IFC model of the Urban Sciences Building, Newcastle upon Tyne, UK, and a plan view of the electrical supply zoning layout for the third floor.
Ijgi 07 00310 g004
Figure 5. A single JSON message recording the lighting power consumption in core 3 of the first floor of the USB as 1.45 kilowatts.
Ijgi 07 00310 g005
Figure 6. The integrated topology of the electricity distribution network highlighted in Figure 2 and the internal electrical components of Building X, as shown in Figure 3.
Ijgi 07 00310 g006
Figure 7. An abstracted, integrated electricity network topology spanning the intra-urban and intra-building scales.
Ijgi 07 00310 g007
Figure 8. An evolution of the graph network when the database is used to model only the topology derived for the USB, showing its growth from state (a) to (b) and then (c) as more messages are received from data stream.
Ijgi 07 00310 g008
Figure 9. A depiction of the web-based software system developed to exploit the integration and simulation system of Figure 1 for the case study.
Ijgi 07 00310 g009
Figure 10. Screenshot of a dynamic Sankey diagram, showing electrical power consumption through the network depicted in Figure 7. The thickness of the lines is proportional to the power consumption.
Ijgi 07 00310 g010
Figure 11. Three snapshots, with a time-lapse of approximately 5 s, of an evolving visualisation of the flow of electricity through the Urban Science Building from state (a) to (b) and then (c); in real-time, the visualisation is updated each second.
Ijgi 07 00310 g011

