1. Introduction
Public participation is the process by which an organization, institution or individual consults with interested or affected individuals, civil society organizations, citizen groups and/or government agencies with the aim of making widely acceptable and sustainable decisions regarding a societal issue or problem. This is based on the belief that those who will be directly or indirectly affected by a decision should have a right to be involved in the process of making such decisions. In most countries, the common tools and methods used for participatory planning include public surveys, referenda, focused groups, town hall meetings, public hearings, commissions of inquiry among others. Since the publication of Arnstein’s Ladder of Citizen Participation [
1] highlighting the various levels of participation, public participation has been discussed using various attributes, categorizations and levels. The aim of participatory planning is to make widely acceptable and sustainable decisions regarding a societal issue or problem. This is based on the belief that those who will be directly or indirectly affected by a decision should have the right to be involved in the process of making such decisions. The importance of involving different stakeholders in the design and implementation of urban plans is widely recognized [
2,
3,
4,
5]. While traditional ways of urban planning rely on expert knowledge [
6], there has been advocacy towards multi-sectoral approaches to planning involving local citizens, experts, agencies and institutions. This is informed by the notion that the traditional top-down approach of urban planning is unable to cope with the growing complexity of sustainable urban management [
6]. Some argue that the voices of the traditionally voiceless (e.g., poor and minority groups) are critical if plans are to succeed in achieving equity, efficiency and sustainability [
7]. The importance of citizens’ involvement in decision-making was recognized by the United Nations over 25 years ago and anchored in Principle 10 of the Rio Declaration of 1992 [
8]. Proponents of participatory planning argue that it can produce commonly accepted objectives, thus guaranteeing commitment of citizens to the planning course [
7]. It also increases transparency in decision-making, better and efficient planning programmes and enhances the quality of local governance [
9]. Despite the numerous advantages, participatory planning can be time consuming, complex and sometimes difficult especially where multiple actors are involved [
7,
9,
10]. Participation of local communities and/or disadvantaged groups in planning has been difficult particularly where programs are controlled or located in powerful political and bureaucratic structures [
7], and dominated by the ‘haves’ instead of the ‘have not’s’ [
11]. In Kenya, the traditional participation (including e-participation) channels exhibit trends where decision-making processes are mostly controlled by the politically influential and the ‘haves’ rather than the ‘have not’s’. In most cases, the channels for inviting public participation in planning processes like newspapers and electronic media are sometimes not accessible by many members of the public, disenfranchising this group of their rights to participate. As such, the goal of making planning decisions widely acceptable and sustainable is not reached, explaining the need for innovative ways of enhancing public participation.
The use of 3D visualization and e-participation methods is becoming increasingly popular in urban planning and management. This is supported by continued technological innovations in computer vision and internet technology witnessed in the past few years [
12,
13,
14]. Two-dimensional (2D) visualizations have always been used to present geographic information in town planning sessions. However, they are often difficult to understand [
12], especially for stakeholders who have little or no experience in interpreting maps. There is sufficient evidence that 3D visualization is capable of stimulating stakeholder involvement and improving their understanding of plans presented. In their study in Catolina, Irene et al., as quoted by Milosz et al. [
13], report that “the various groups of people that have participated have been very positive about the usefulness of the 3D technology. Spatial planners even considered these tools to be potential solutions to some of their most common communication problems with citizens” [
13] (p. 60). Koeva, in her study of the creation of interactive web-based visualization of cultural heritage projects is Sofia (Bulgaria) concludes that “image-based modelling and panoramic visualization are simple, fast and effective techniques suitable for simultaneous virtual representation of many objects” [
14] (p. 6). In Korea, Kim discusses the use of 3D simulation and visualization techniques for various applications including development control [
15]. Al-Hanbali, Fadda, and Rawashdeh, in their work on 3D modelling in GIS environment demonstrated 3D modelling as a way of offering a flexible and interactive system for providing the best visual interpretation, planning and decision-making process. 3D digital models makes it possible even for non-experts to exert more control over what they wish to see as opposed to what the planners want them to see [
16].
One the other hand, the internet has provided a channel through which people, governments and other institutions communicate and exchange information planning [
17]. Karakaya further argues that internet technology can be used by local authorities to increase their internal efficiency, to have better communication with their partner organizations as well as join up their services with them [
5]. Peng, Hansen and Prosperi portend that the internet can become a forum around which community-based issues, information, alternative perspectives, and decisions evolve [
18,
19]. The internet enables collective intelligence, collaborative content creation and linking by the user who contributes towards common knowledge [
17].
Widespread availability of smart mobile phones and the internet has enabled real time participatory applications, such as FixMyStreet, a web-based, mobile app in the U.K. where residents can report, view or discuss local problems. Cologne city’s “Sag’s uns” [
20], Seattle’s “Find it Fix it” apps that allow residents to reports hazards or indecencies [
21] and Kenya’s e-citizen (
www.ecitizen.go.ke. This is a government-to-citizen model of service delivery) or eCAALYX Android smartphone app [
22]. Mobile phones are usually used as communication tools. However, they have also been used by ordinary people to mobilize others [
23] who were previously passive into action. The progressive use of mobile phones has enabled the acquisition and utilization of spatial data that is easier, faster and cheaper [
23,
24] as opposed to the traditional ways, which are costly and time consuming. Furthermore, mobile phones have provided opportunities for governments and other planning agencies to explore different ways to interact with citizens, not only in the provision of information, but also to engage in dialogue [
23]. South Africa’s award-winning 32211 SMS tip-off crime line presents a successful case study of the minimization of this fear where anonymity is guaranteed, not by the government or the police, but by private enterprises [
23].
3D visualization and e-participation offers opportunities for efficient and effective public participation, thus bridging possible gaps in the traditional top-down methods of planning [
2]. 3D modelling and visualization facilitates the creation of different perspectives of reality through inclusive interaction of stakeholders. E-participation on the other hand creates independence of space and time, offering the choice of how, when and where to participate. This study therefore aims to explore how the combined use of 3D visualization and e-participation can help in improving public participation in Kenya. The next section of this article discusses the methods and tools used during the study while the third section presents the results and further discussions on the findings.
2. Materials and Methods
Planning is a participatory process, therefore, it is essential to develop tools that can foster faster understanding and use of the plans among different users [
1,
25,
26] while promoting interaction and information exchange [
25,
27,
28]. An explorative case study was carried out to establish the usability (an aspect of perceived added value) of a Planning Support System (PSS) and the usability of e-communication channels in a planning process. Since it was not possible to control all of the influencing factors in a quantitative experiment, an explorative case study was chosen and mixed with other qualitative methods. This was because little is known about the usability of 3D visualization and e-participation in real planning processes, making an exploratory study the best option [
29,
30].
The perceived added value of a new tool, such as a PSS, can be studied using three factors: the support capabilities of the PSS, its usability, and the context [
31]. Usability in this context was defined as the extent to which a product can be used by specified users to achieve certain goals effectively, efficiently and satisfactorily in a specified context of use [
32,
33]. The variables used for this study were: usability, communicative ability of the abstract and realistic 3D visualization. Usability was tested using three indicators as proposed by different authors. These included: efficiency, effectiveness and satisfaction [
12,
31,
33], while communicative ability was tested using communication and learning outcomes [
31,
33,
34,
35]. The usability of e-participation on the other hand was measured using the concepts of communication, collaboration and learning.
2.1. Study Area
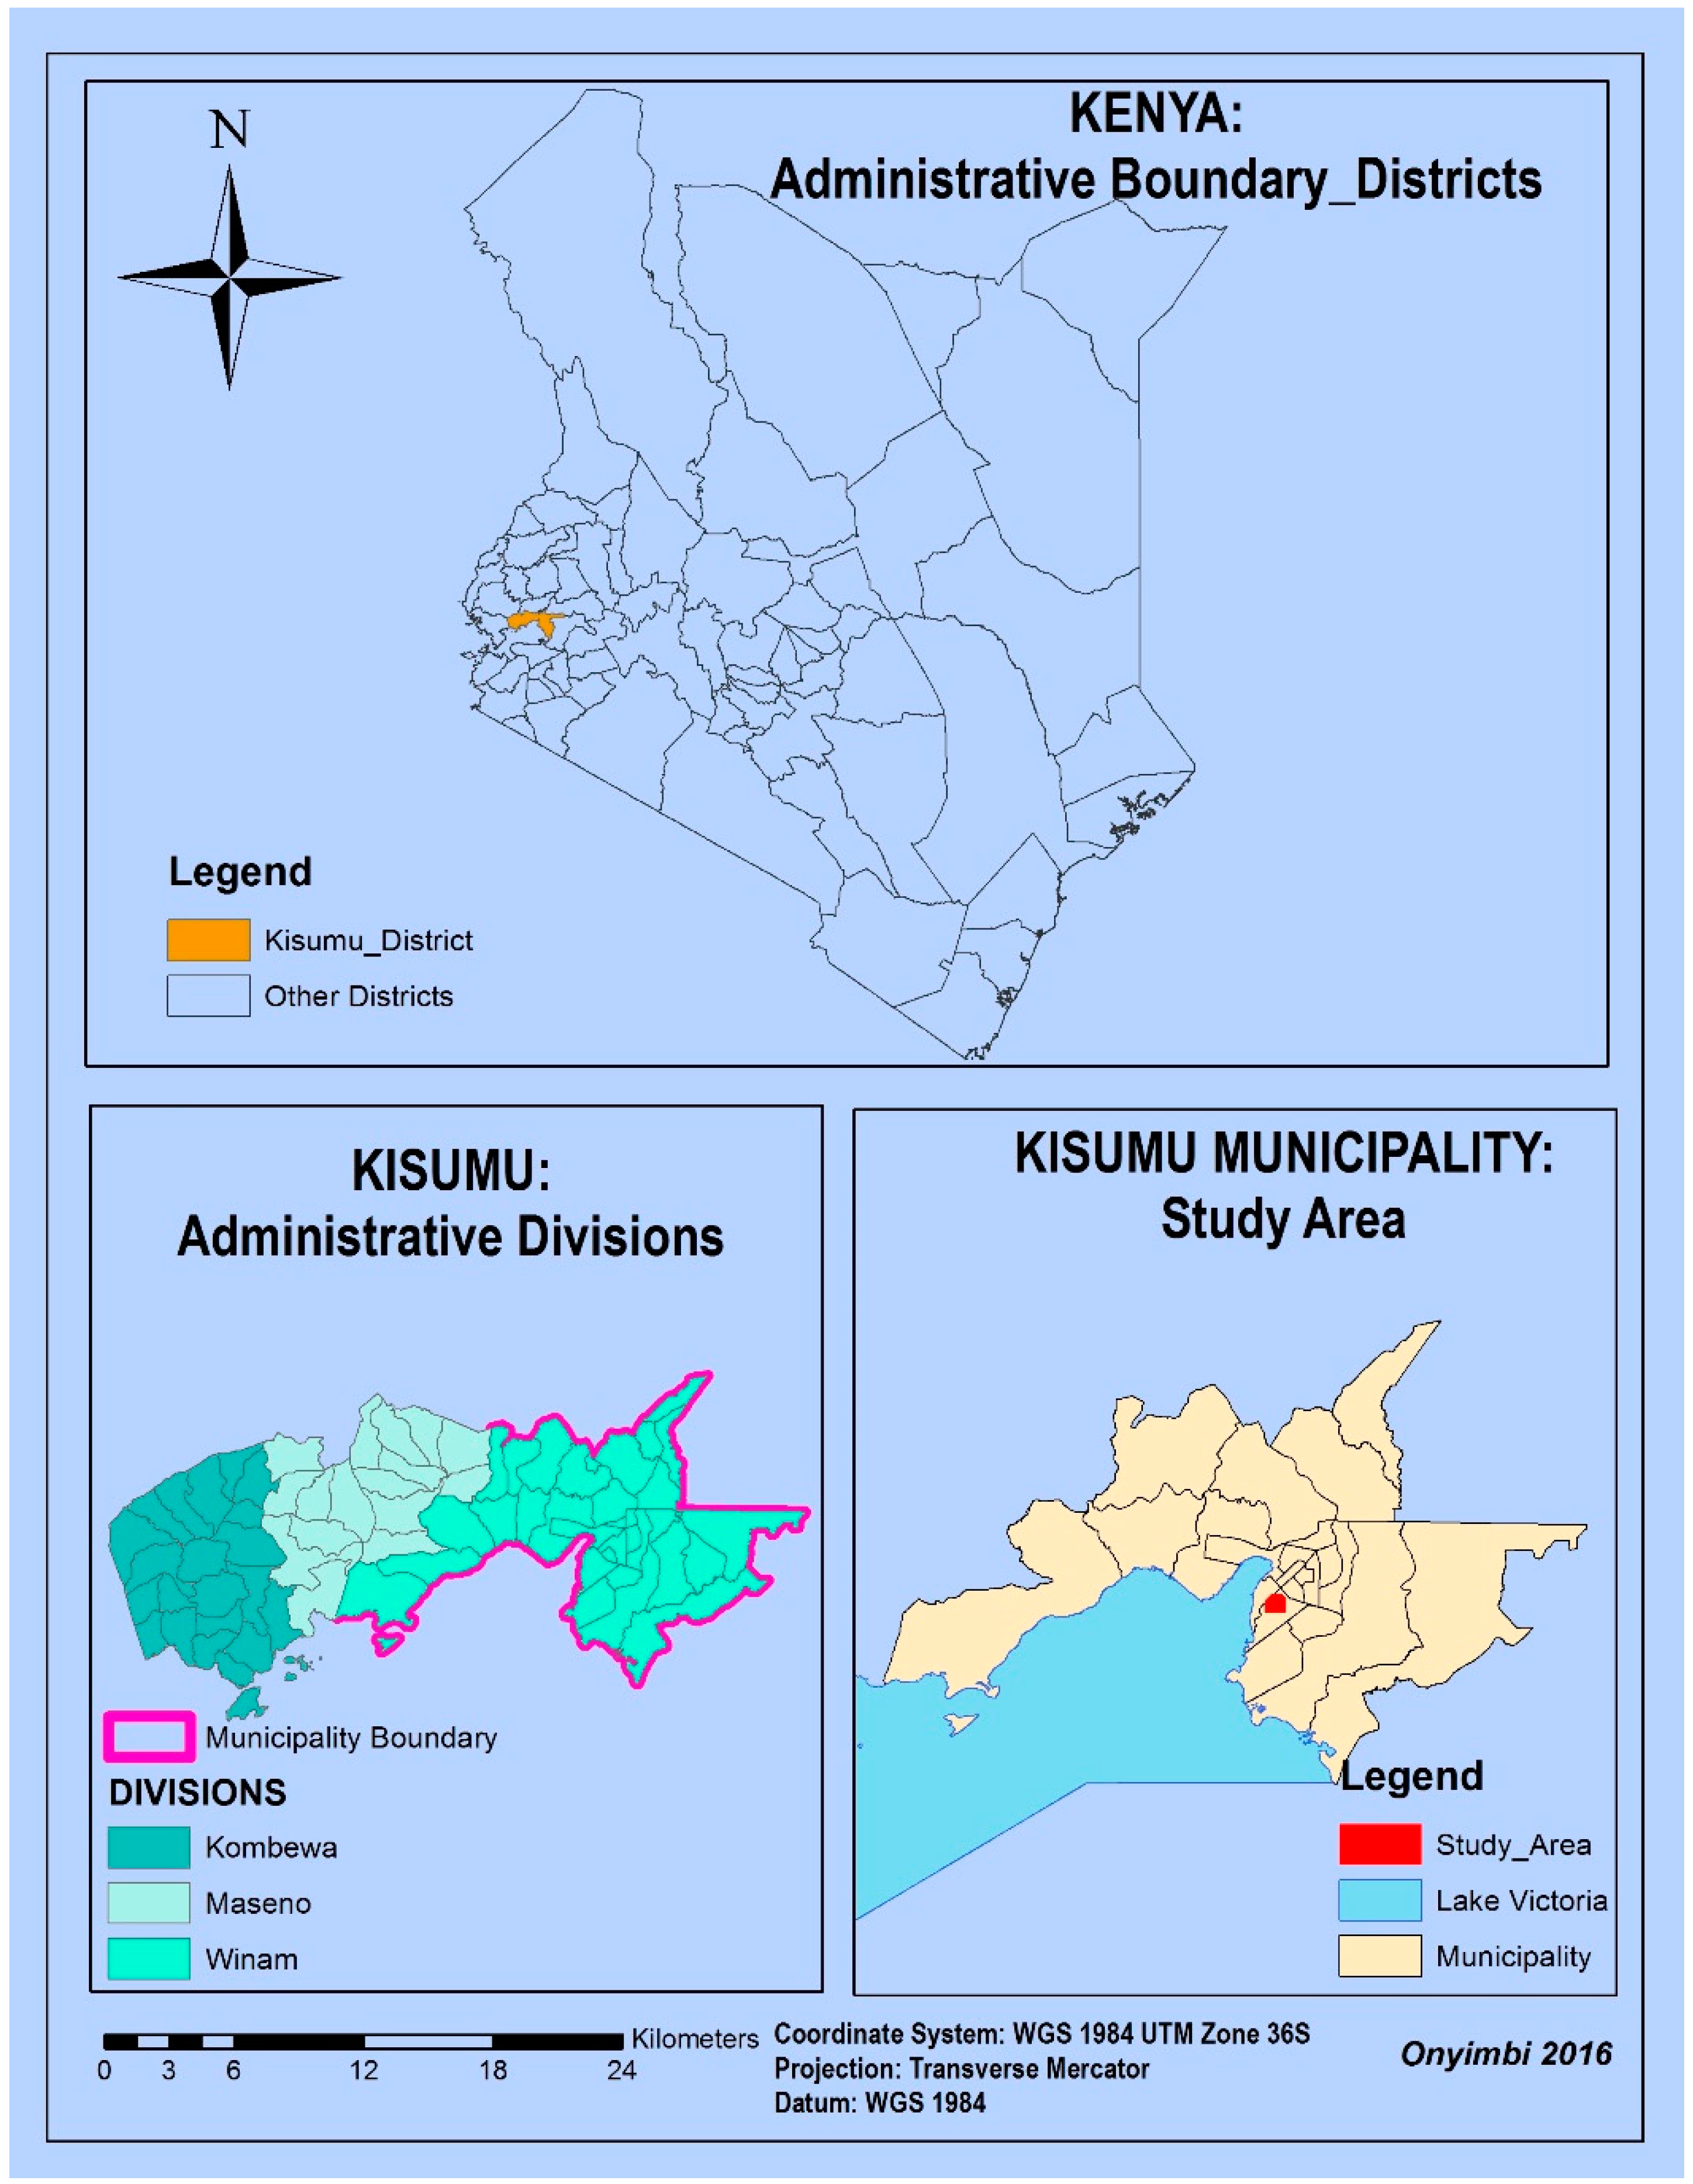
This study was carried out in Kisumu, an inland port city along the shores of Lake Victoria, Kenya. Kisumu, the third largest city of Kenya, is located on the Northern tip of the Winam Gulf of Lake Victoria (
Figure 1). The study was carried out in the central business district, with a particular focus on a proposed redevelopment area owned by the Kenya Railways Corporation. In Kisumu, just like in other towns in Kenya, the public is rarely involved at the initial stages of plan conceptualization and preparation, but only at the presentation of the draft or final plans. These presentation meetings have sometimes suffered from stakeholder apathy, with reported cases of boycotts or lack of attendance. In Kisumu, the current planning practice does not promote or enhance public participation. The use of new technologies to promote public participation has largely been ignored or unexplored.
Despite Kenya’s government focus on improving public participation to incorporate local knowledge and solutions into urban and community planning processes, most planning processes in Kisumu have not paid attention to the possibilities that 3D visualisation and e-participation may offer in improving the quality and quantity of public participation.
2.2. 3D Modelling and Visualization
For this study, a 3D City web geoportal was created and used during stakeholder workshops. The main objective of designing the 3D scene was to test how different users accept, interact with and perceive the use of 3D web-based visual representations compared to a 2D abstract representation in planning processes.
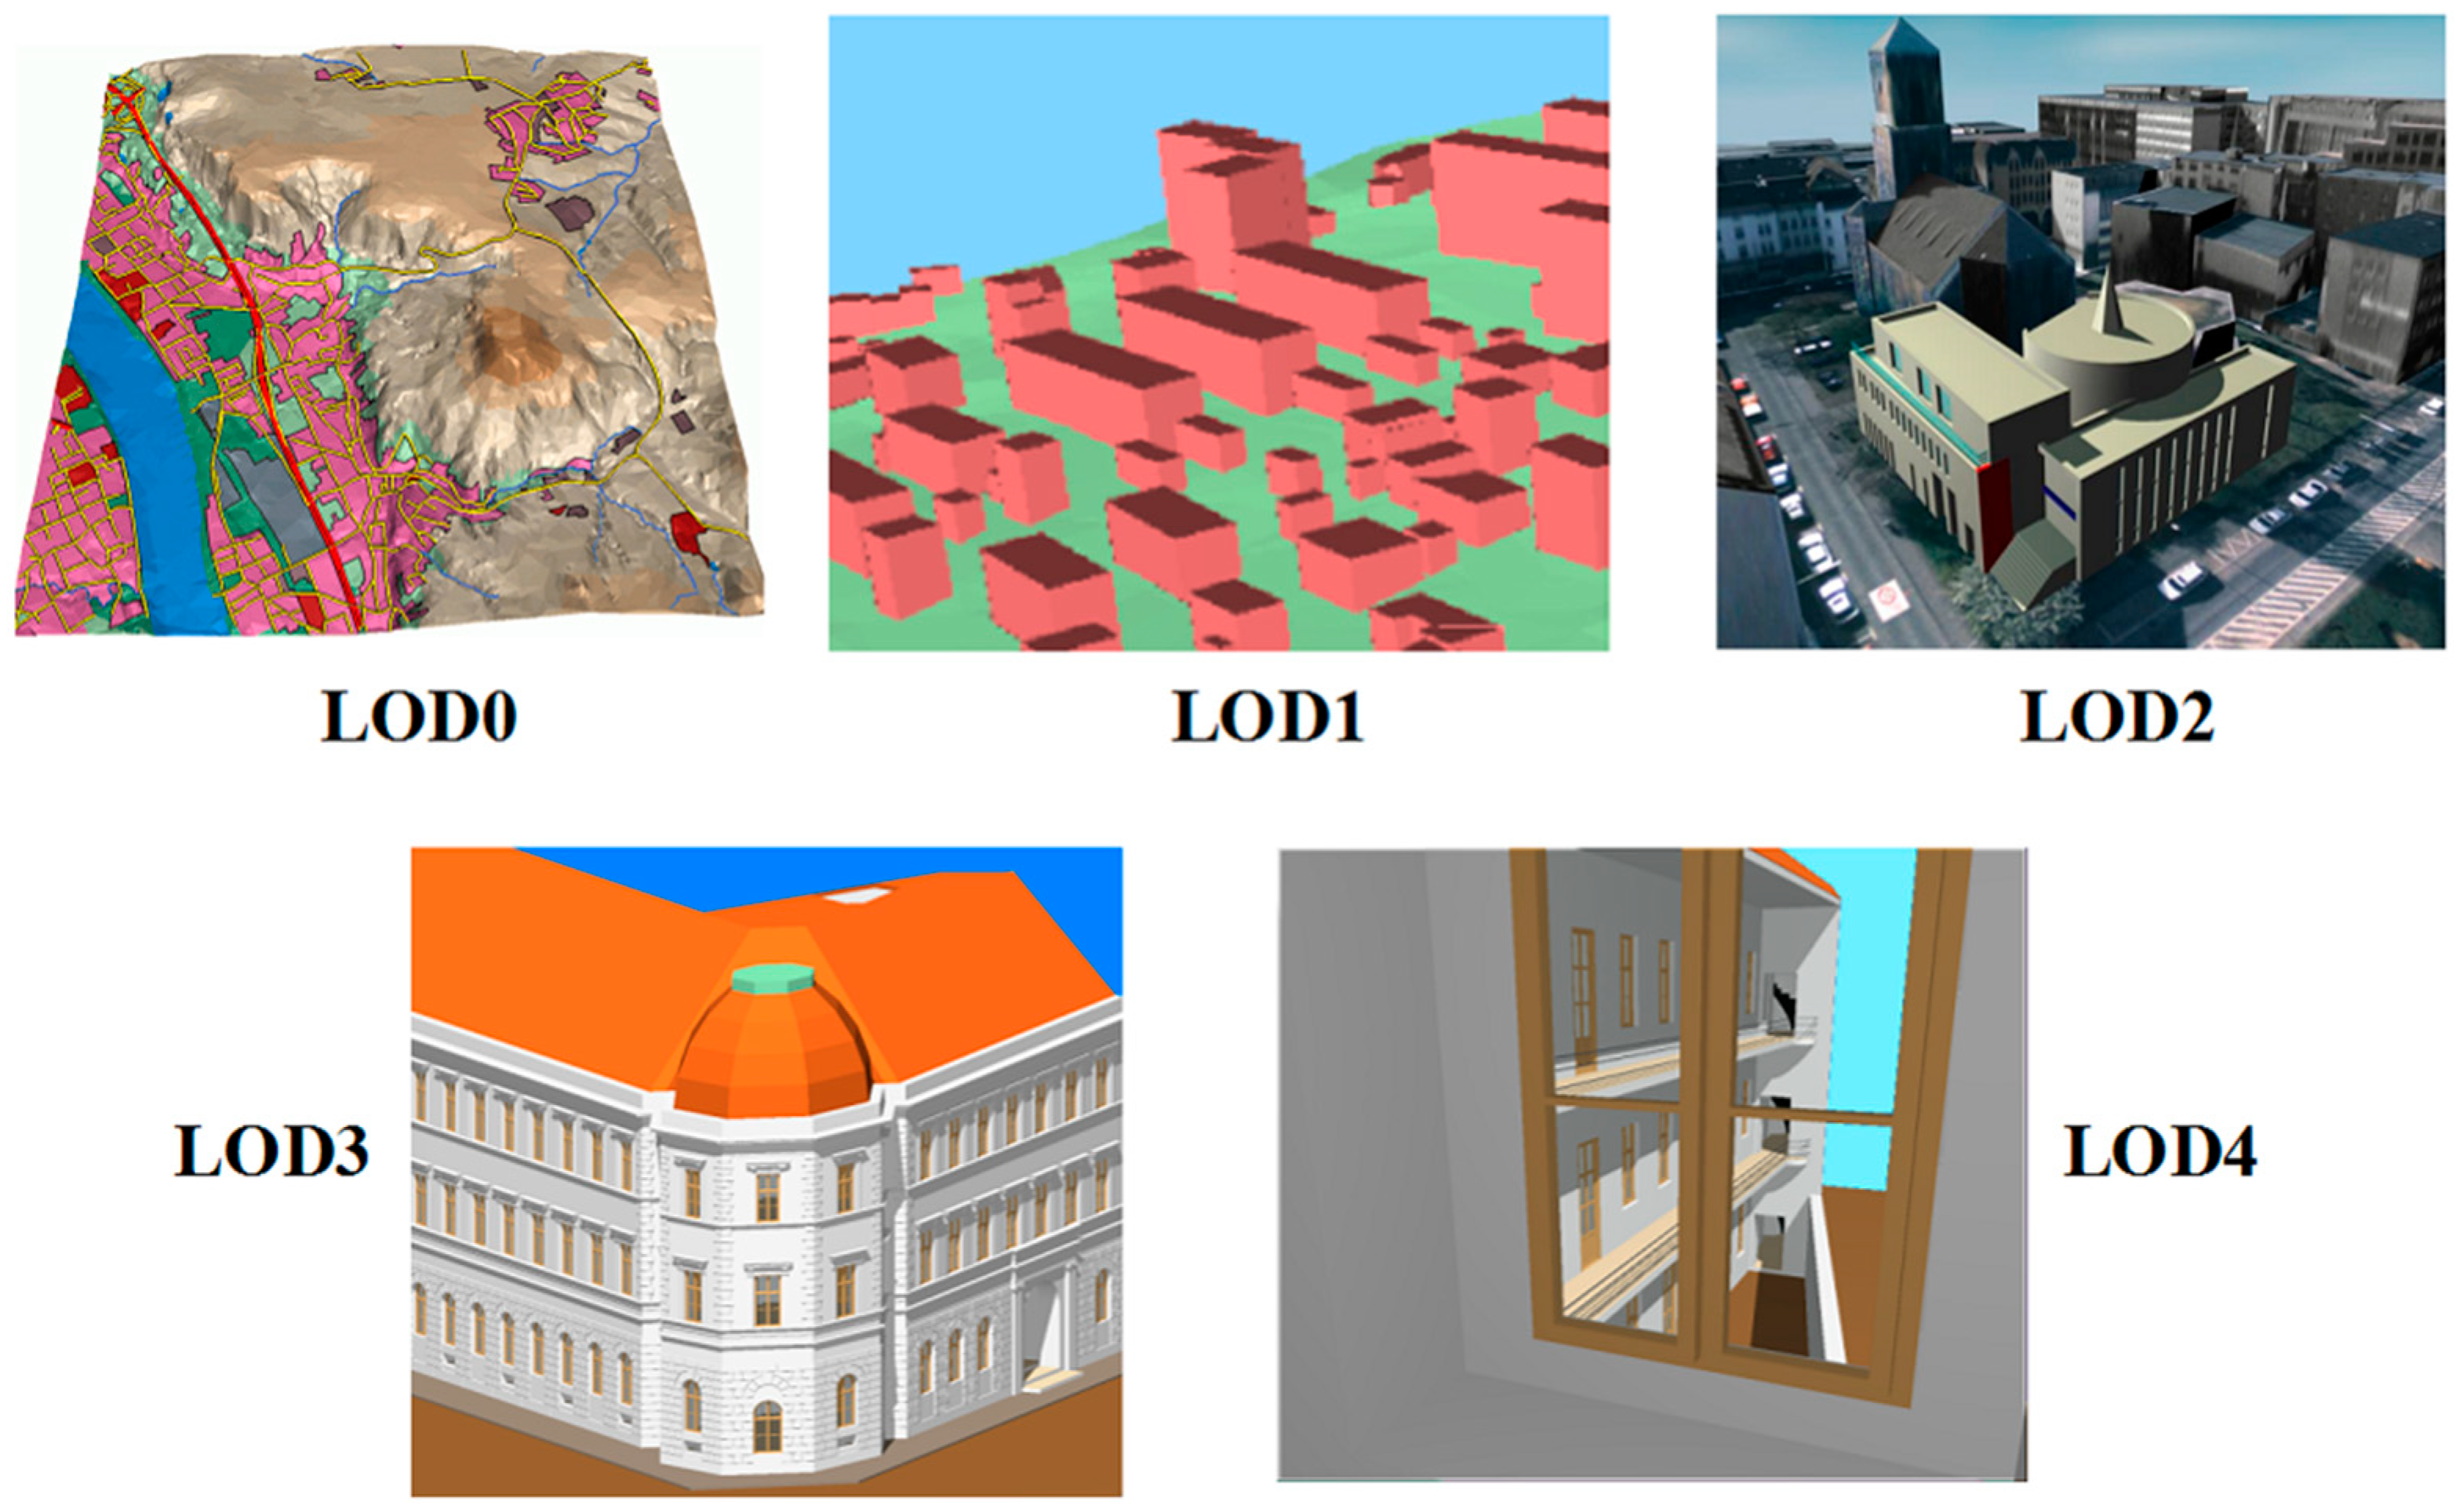
3D modelling was done in various levels of detail (LoD). These multiple scales ranged from LOD0 to LOD4 as defined by City GML specifications (
Figure 2).
Using Procedural Rule Based Modelling offered by CityEngine, a 3D model was created and exported into an online geoportal provided by ArcGIS online. The 3D model of the selected part of the city (Area of Interest in
Figure 1) was created by using a 0.50 m resolution GeoEye Mono satellite image of 2009 as a raster base. A 90 m resolution Shuttle Radar Topography Mission (SRTM) Digital Elevation Model (DEM) was used as the base terrain. To start the modelling process, the satellite image was draped over the DEM. Shapefiles of the 2D building footprints, road network, land parcels and planning zones obtained from the local government were imported into Esri CityEngine 2016 for creating 3D models. Building heights were measured from the ground using a laser distance-measuring gadget. This was the cheapest option given that the cost of obtaining a stereo-pair of high-resolution images of the study area, which could be used to extract heights, was high. CityEngine provided easy and flexible options for editing and texturing using Computer Generated Architecture (CGA) shape and grammar-based 3D procedural modelling. The CGA rule file allowed changes in different parameters of objects such as the height, position, texture, surface type and direction among others. Rule files (.cga) were authored and modified in the Rule Editor of CityEngine. Using building heights and a single-line CGA rule file, a LoD1 model was created by extruding the buildings from the footprints. A LoD2 model of the buildings was generated by texturing the LoD1 model with the photos of buildings obtained from the street view (Google Earth) and from terrestrial photos taken by the first author during this fieldwork. Therefore, the aim was to obtain a photorealistic visualisation. The edited rule files were then applied to generate the 3D model of the study area. The observed advantage of Rule Based Modelling is the ease with which texturing can be performed with minimum effort. The 3D model was generated as a *.cej file and exported as a CityEngine WebScene Model (*.3ws) with a series of ancillary documents.
2.3. Planning Workshops
To assess the perceived added value of the created 3D PSS, two workshops were organized. The goal of the workshop was to evaluate the usability of the PSS and e-participation channels used with different users. The first workshop involved students from the School of Planning and Architecture, Maseno University. The second workshop was for professionals including physical planners (5), architects (3), surveyors (5), civil engineers (2) and others (4) from Kisumu. These professionals were chosen since they deal and interact with spatial matters in most of their daily work
There are a variety of ways of evaluating usability. However, two groups are distinguishable:
usability testing and
usability inspection [
13]. The difference lies in the level of expertise required to perform the evaluation. For usability inspection, the evaluation is performed by experts [
13,
25,
26], while for usability testing, the designed product is assessed by end users [
1,
13,
37]. For this study, usability testing was adopted since it involved different users testing the developed 3D geo-visual model. The three main factors for measuring the usability of visualizations were: task completion time (faster interpretation-
efficiency), task completion correctness (number of correct answers-
effectiveness) and the general opinions of the respondents (
satisfaction). Apart from quantitative measures, qualitative user data has been assessed in the past to discover patterns in users’ behaviour [
29,
38]. This was also significantly used in evaluating satisfaction.
This model was used with two pre-designed sets of tasks during the workshop sessions. In task 1, a list of ten feature names were presented in numerical order. On an A3 sized paper, the 2D plan (
Appendix A.1) showing the plot numbers and road networks for this area were presented to the participants. Each participant was required to select a name of a feature from the provided list and then using their spatial knowledge of the city, locate the feature in the provided 2D map. Upon locating a feature, each participant was expected to indicate on the 2D map the number corresponding to the name on the list provided (
Appendix A.2.1). This task was performed in 10 minutes, after which all the maps were collected from participants.
Task 2 involved the use of the 3D city model visualized in the web-based geoportal. In a similar format as Task 1, features were marked with the letters A–J on the geoportal. A sheet of paper with the letters A–J was also provided to each participant (
Appendix A.2.2). The task required each participant to identify a feature marked by a letter on the 3D city model in the web-based geoportal and write the name against the corresponding letter on the sheet of paper provided. This task was also timed for 10 minutes. Finally, the proposed redevelopment area was presented to the participants in the 3D web-based geoportal. Participants were asked to navigate through, compare and analyse the layers of the areas with the two proposed redevelopment scenarios visualised in the geoportal. A questionnaire was administered at the end of all the tasks and a short general discussion thereafter to find out participants perceptions on the use of both 3D and 3D visualization. The first author and two research assistants controlled the environment, issued task materials, guided layer navigation, monitored time and guided the subsequent discussions.
2.4. Interviews
Planning professionals, other key informants and sampled residents were also interviewed. This was carried out to gain a general insight into the professional planners’ perspective of the use of e-participation and 3D visualization in planning processes in the country in general and Kisumu city in particular. Emphasis was put on comparing the use of 2D versus 3D representations and traditional (paper adverts and notices) versus digital ways (e-participation) of inviting and conducting public participation exercises. A total of 78 residents were interviewed and 300 questionnaires sent to planners. However, only 207 questionnaires were filled and returned. Key informants interviewed included a city planning officer, the Dean of the School of Planning and Architecture at Maseno University, a county architect, a private physical planner and a Community Based Organization project manager. The list of the key informants and interview dates/time are presented in
Table 1.
3. Results
3.1. Modelling and PSS Application
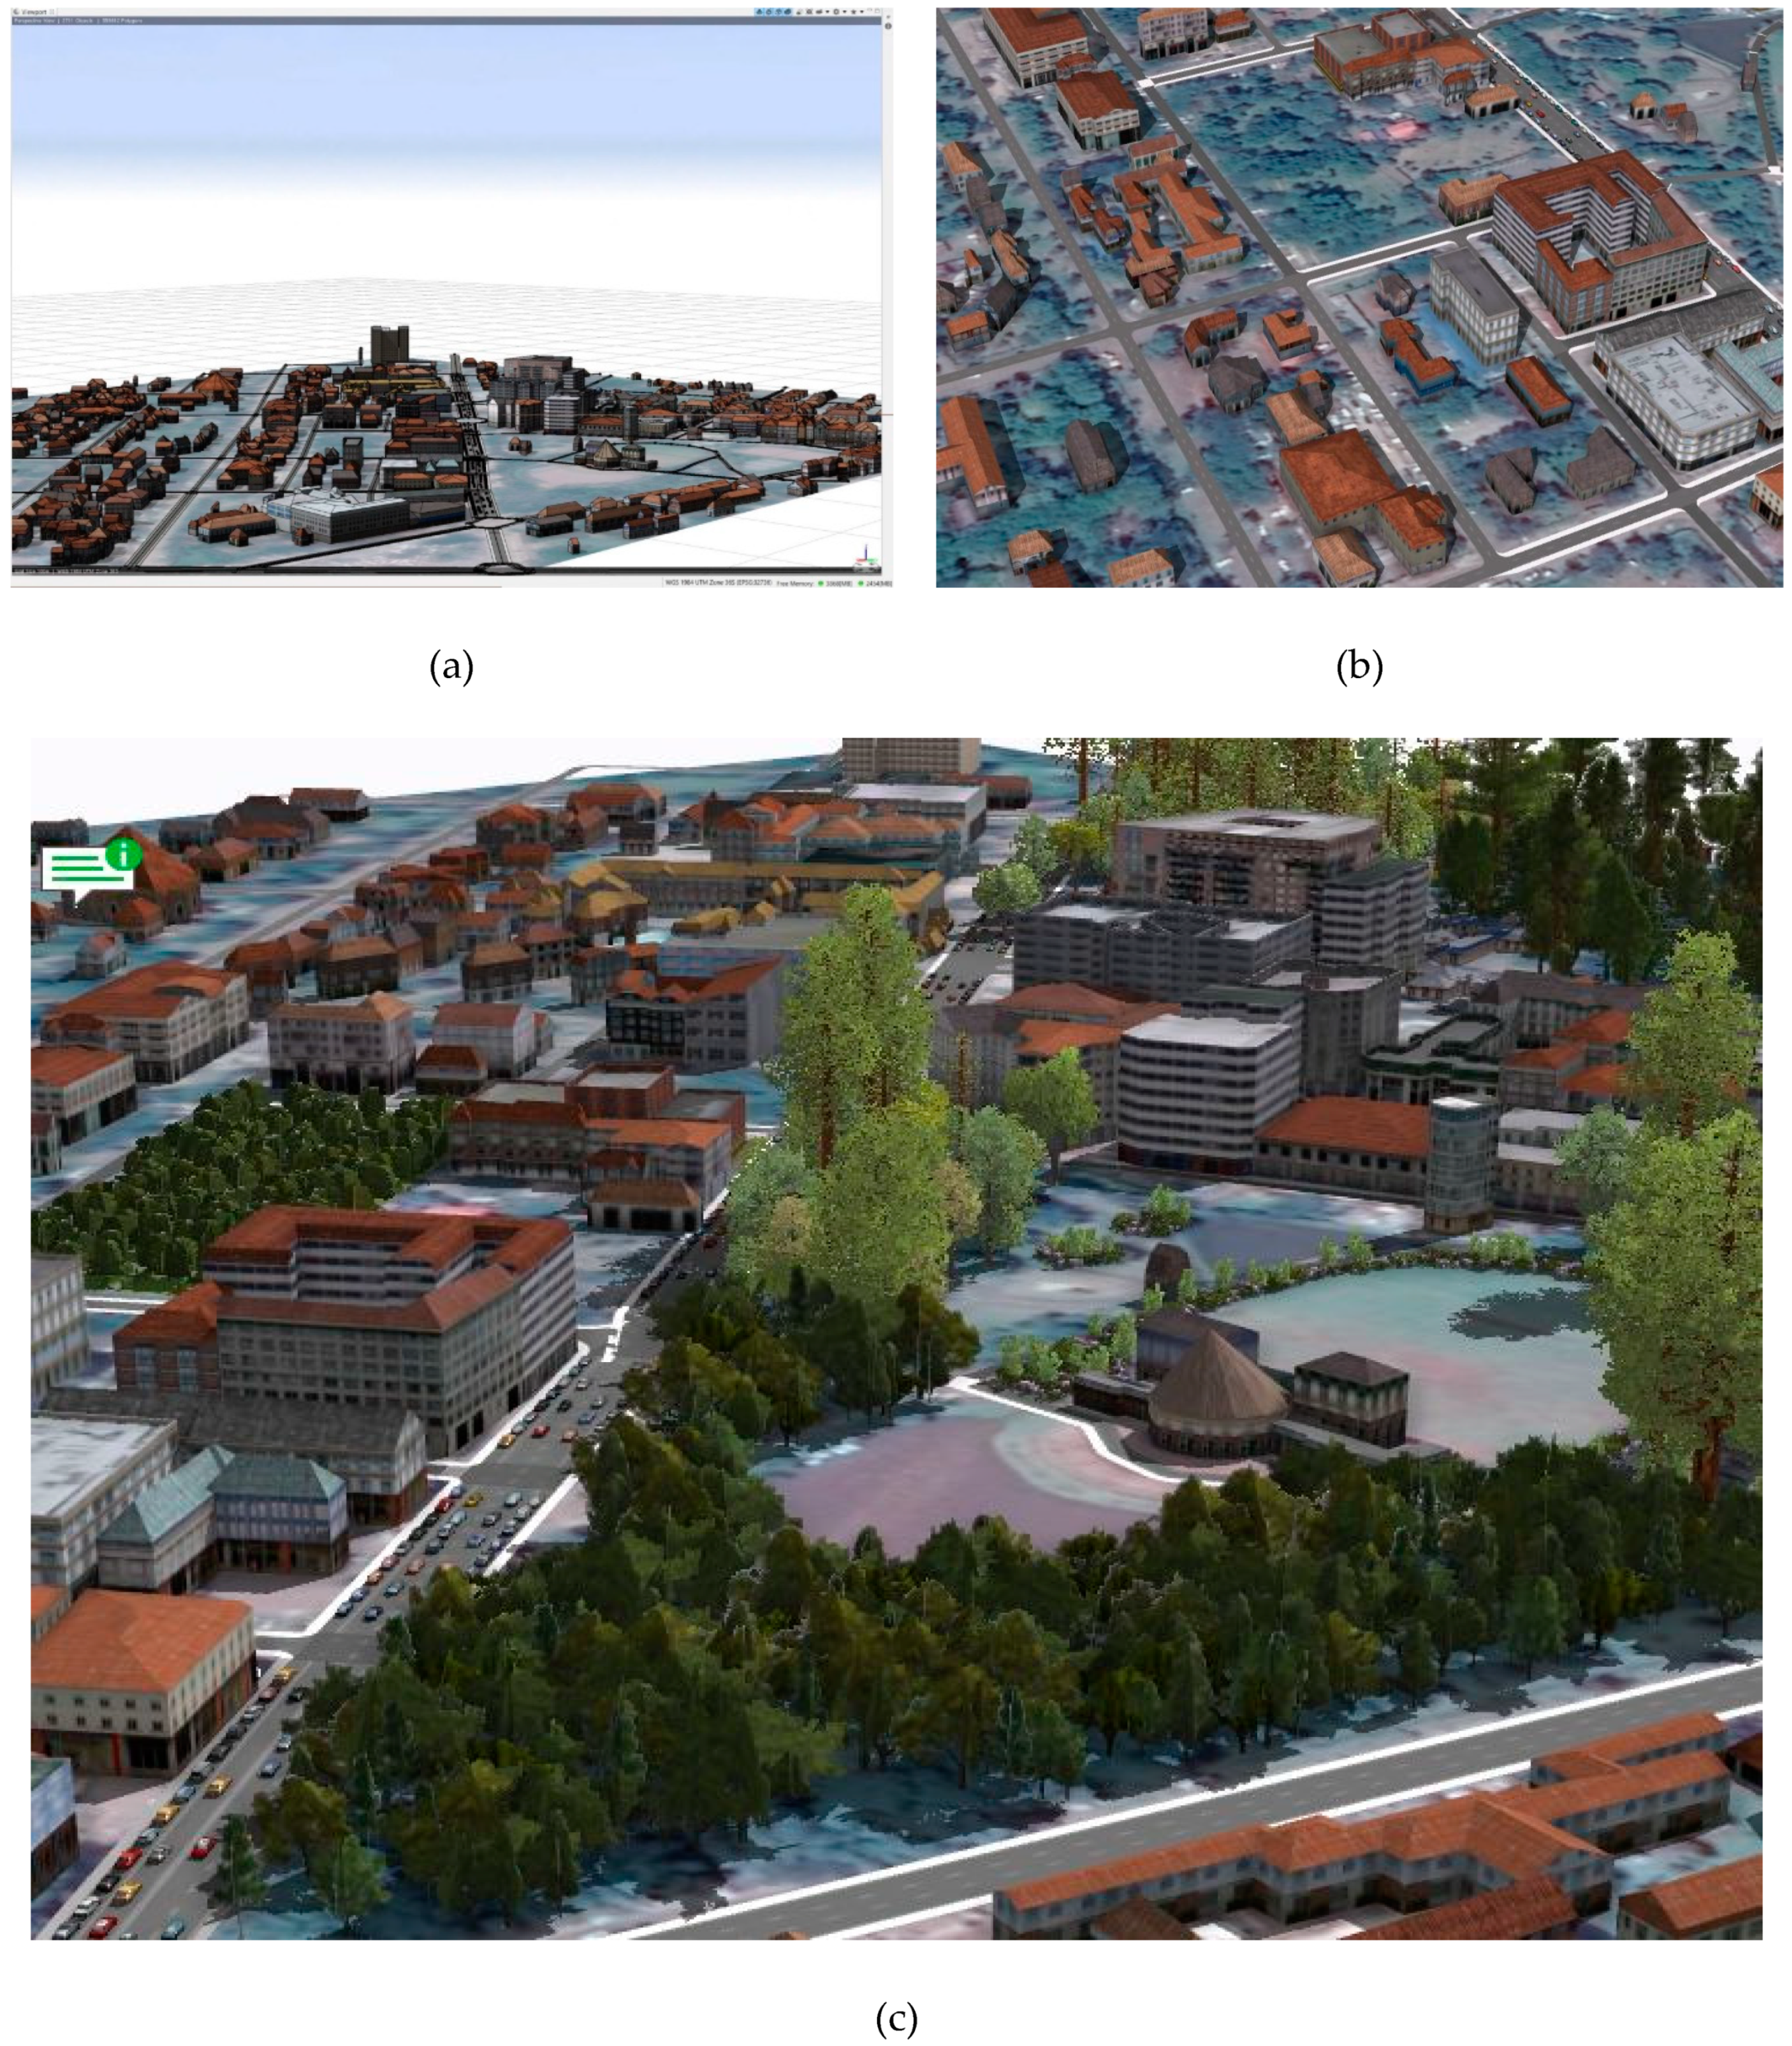
A 3D model was created and exported into a web-based geoportal supported by Esris ArcGIS online (
http://arcg.is/2k68mrQ). The 3D model was used during the two workshops as a PSS.
Figure 3 shows the various captions of the final model, with (c) showing a comment left by a user about a particular building.
3.2. Questionnaire Return Rate
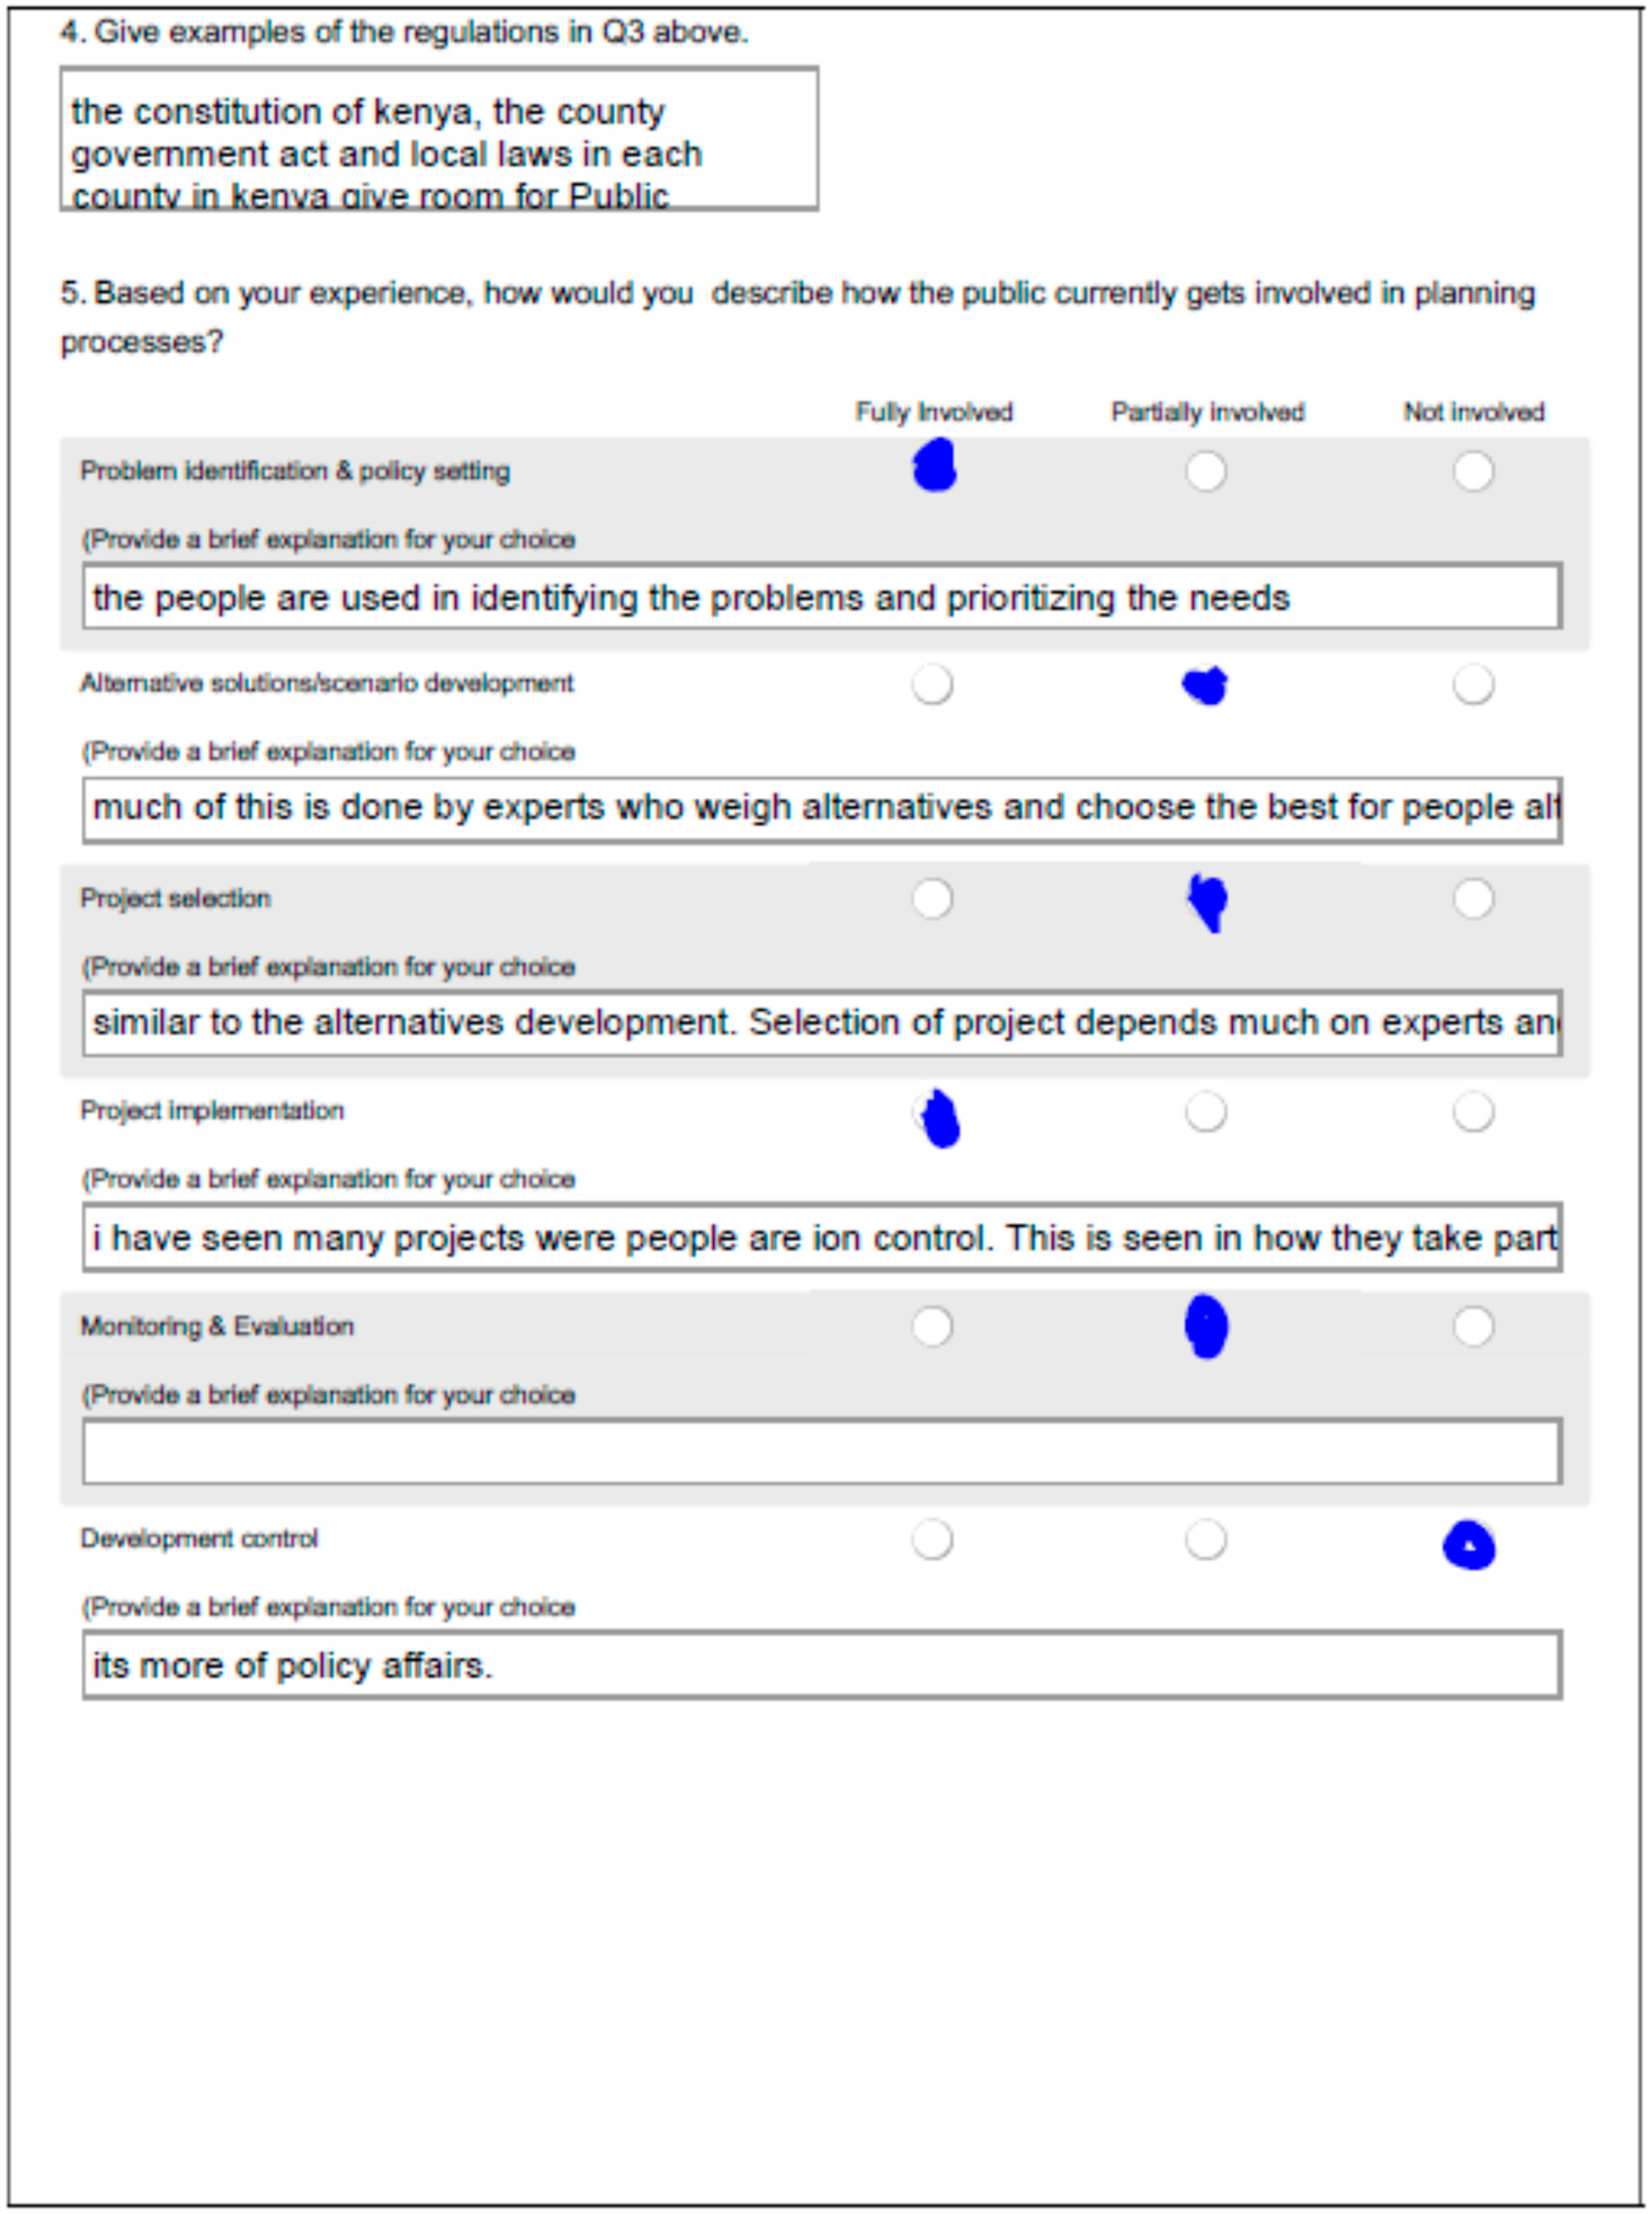
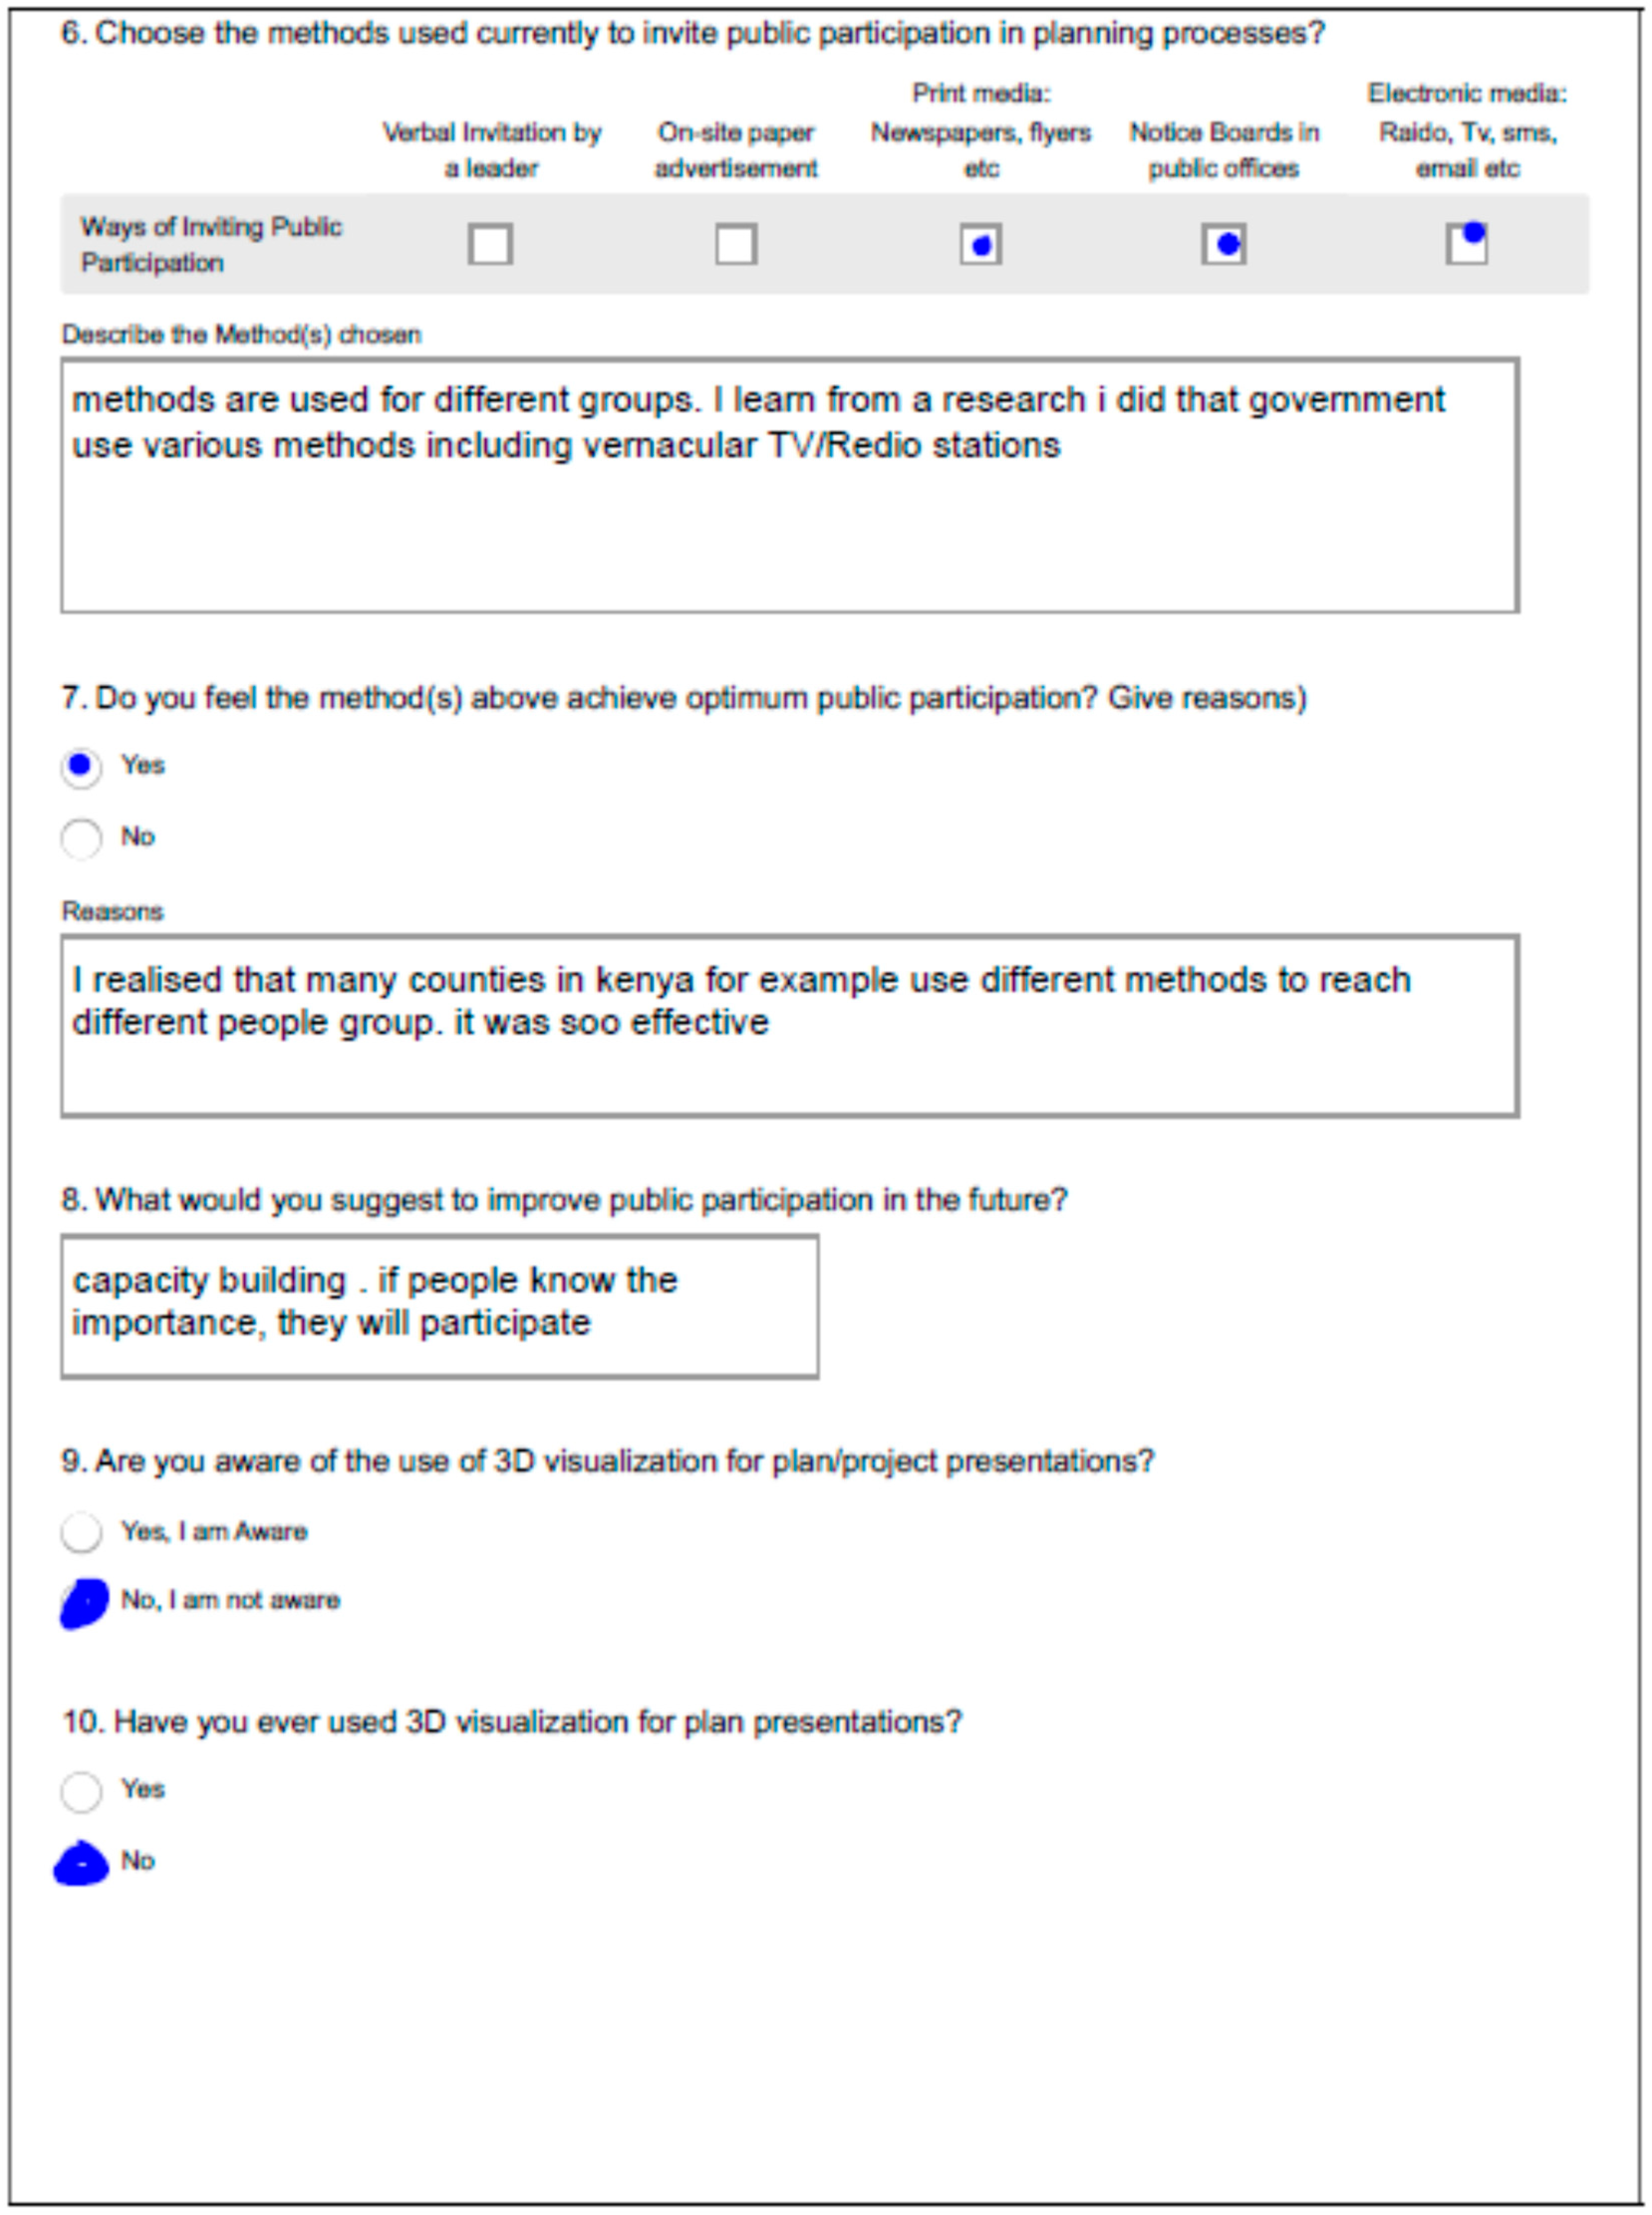
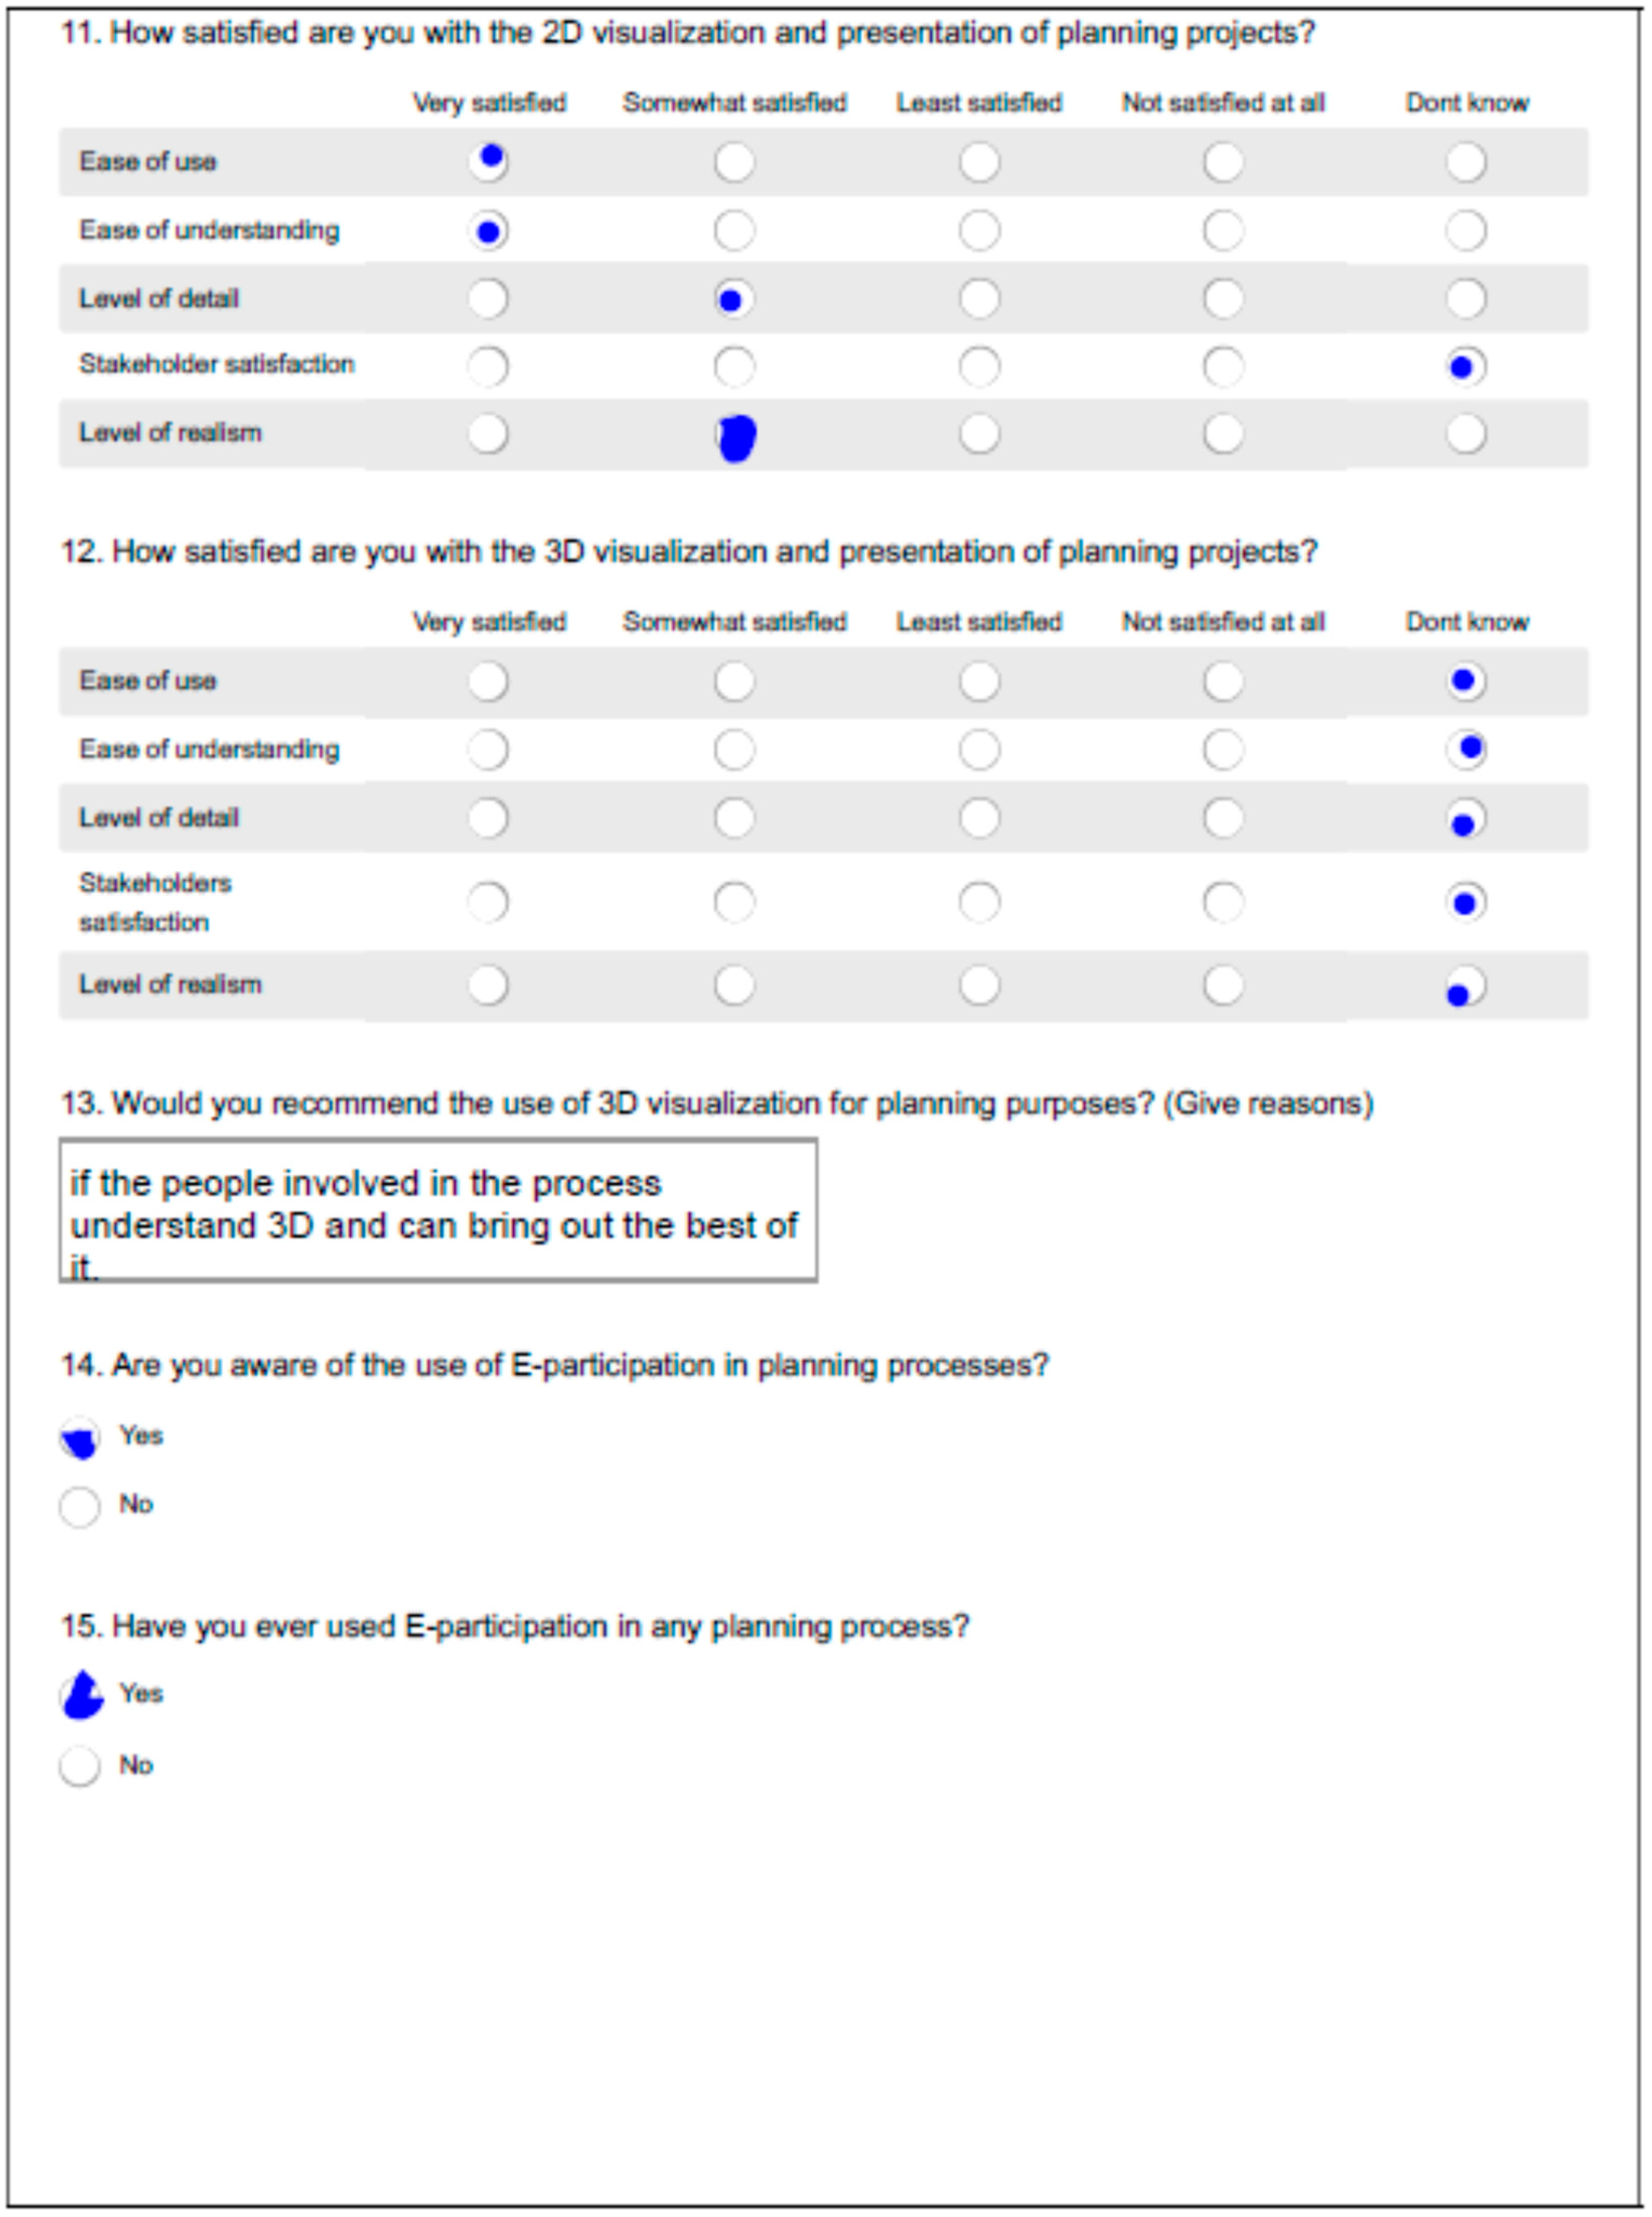
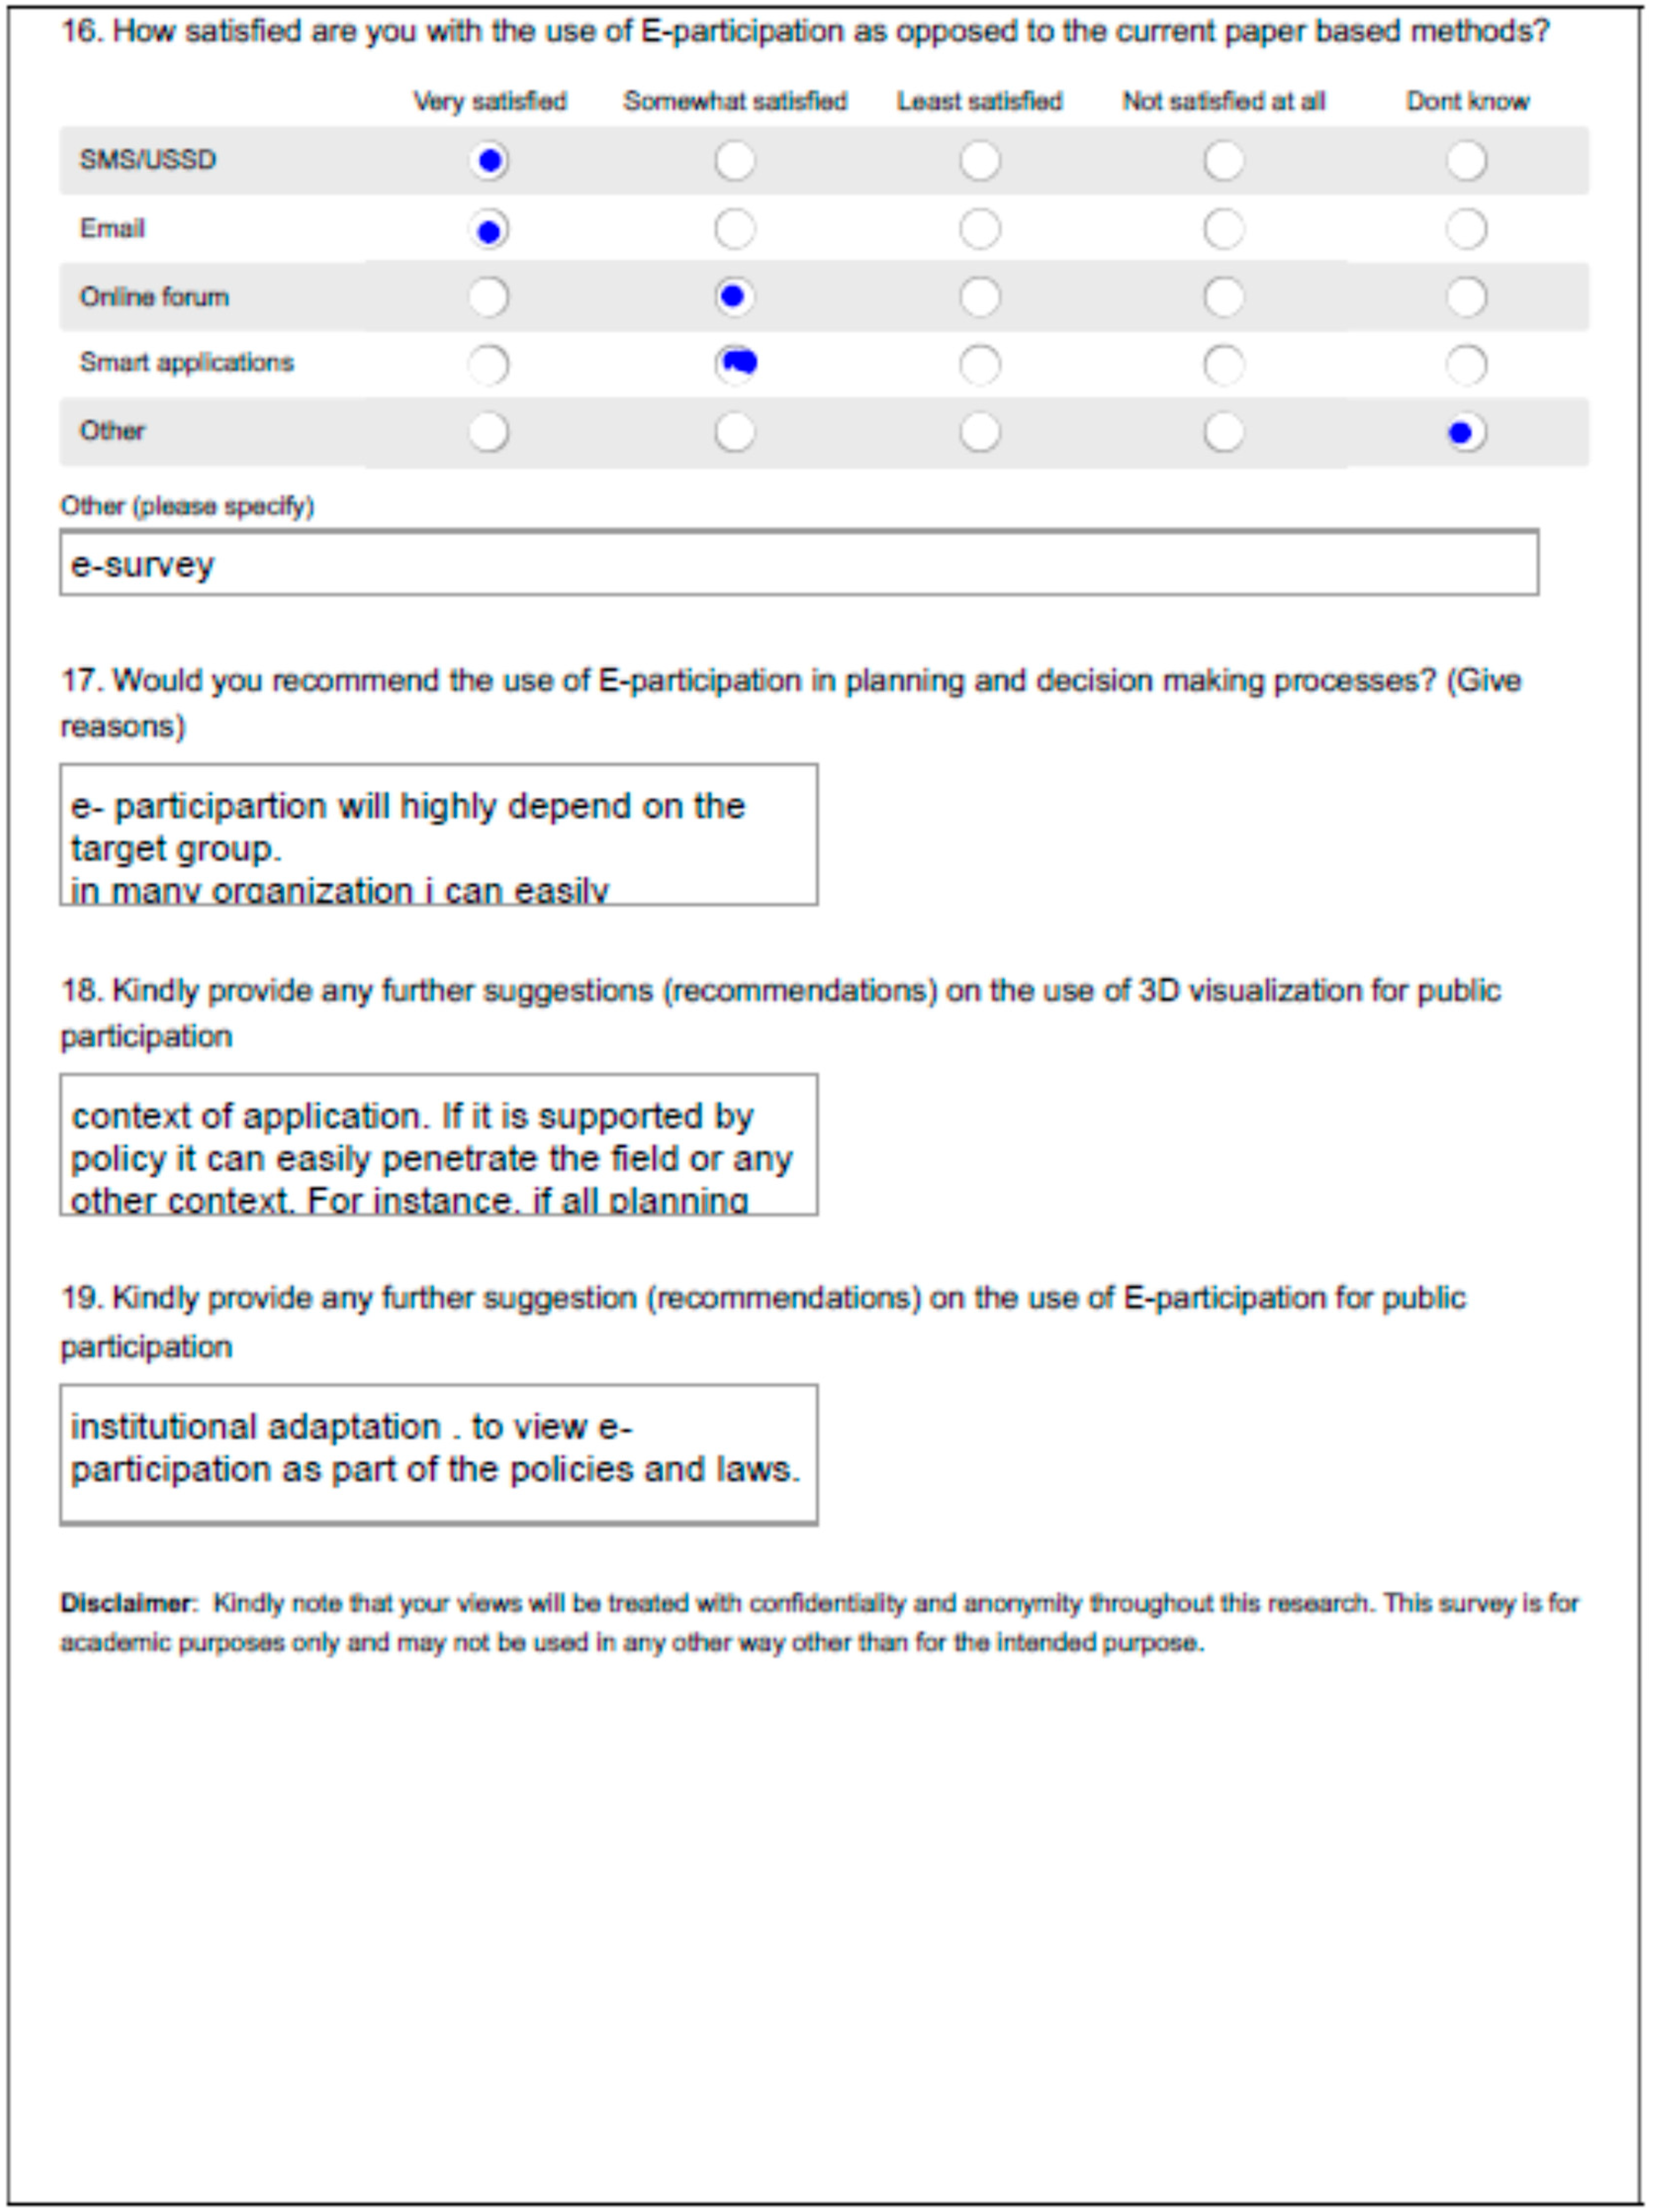
A total of 300 questionnaires were dispatched to planners via email and other social media channels. From the 300 dispatched questionnaires, 207 were filled and returned giving a response rate of 69.0%. However, some questionnaires had mandatory questions unanswered. Only a total of 185 questionnaires were fully answered. From the workshops, a total of 38 questionnaires were given out, all were filled and returned (
Appendix A.3), while for the household survey, only 78 out of the 90 printed questionnaires were correctly filled and returned. According to Fincham and Glaser, acceptable response rates vary by how the survey is conducted [
39,
40]. For mail, 60–70% is very good, phone: 70–80%, e-mail: 40–60%, online: 30% average and for face-to-face: 80–85% response rates were acceptable. Therefore, the return rates presented in
Table 2 were appropriate for data analysis and discussion for this study.
3.3. Usability and Communicative Ability of the 3D Model
Usability of the PSS was evaluated using three indicators; effectiveness, which referred to the number of correct answers given by the respondents within the specified time, efficiency, which referred to the amount of time spent in answering the questions provided in the exercises while satisfaction pointed to respondents’ preference of use of the provided 2D or 3D options. Communicative ability was evaluated based on the PSS’s ability to communicate information (communication), and new ideas/information obtained by users from the PSS and, the ease of learning the functionality of the system (learning).
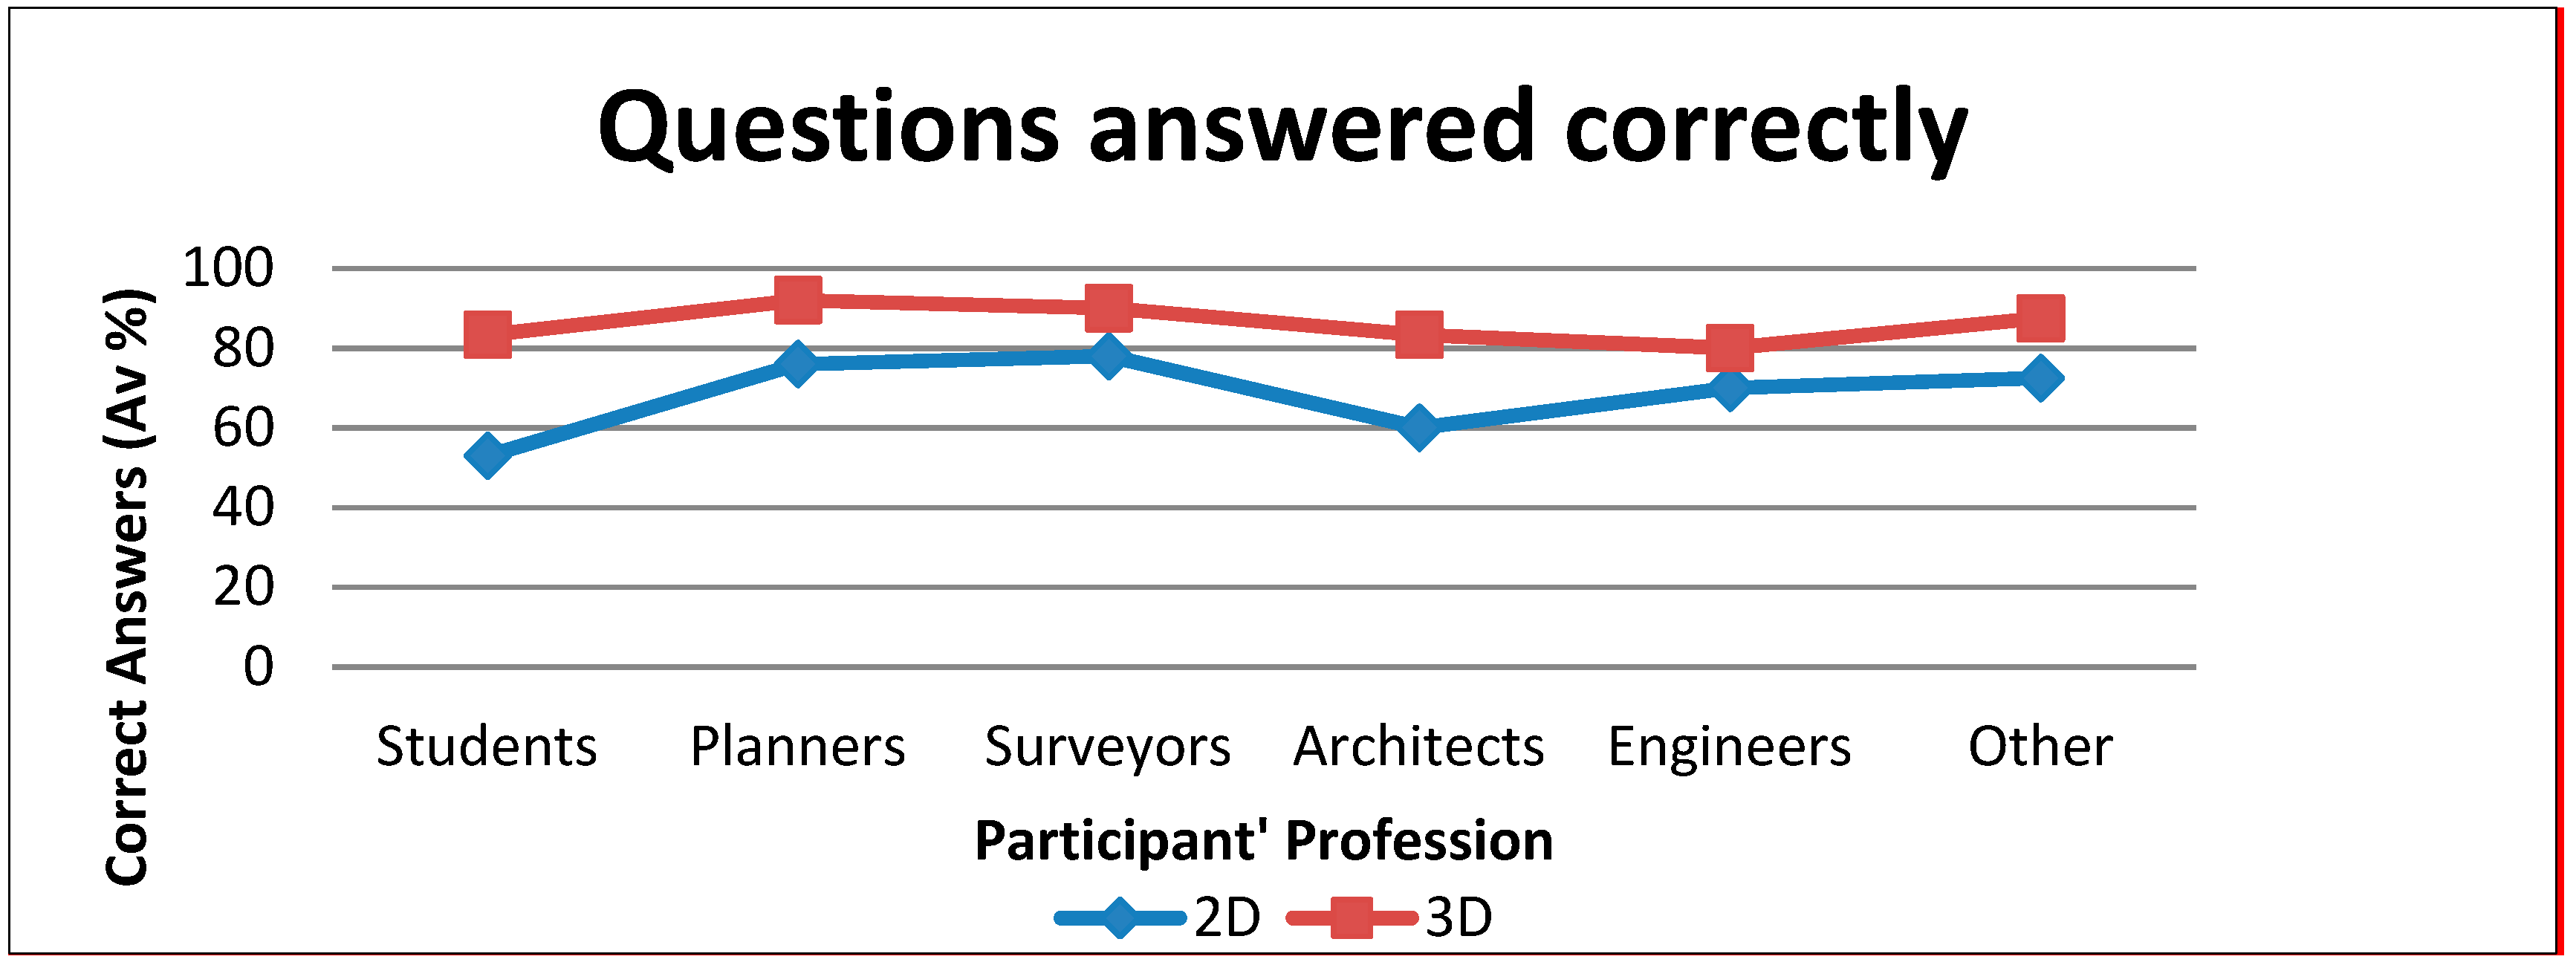
Each professional group showed different characteristics in respect to effectiveness as shown in
Figure 4.
Generally, the entire professional group answered more correct answers in the 3D task as compared to the 2D task. Students performed fairly low in the 2D task (53%), while engineers performed low in the 3D task. Engineers and surveyors however had a very minimal difference in the number of correctly answered questions in 2D and 3D tasks.
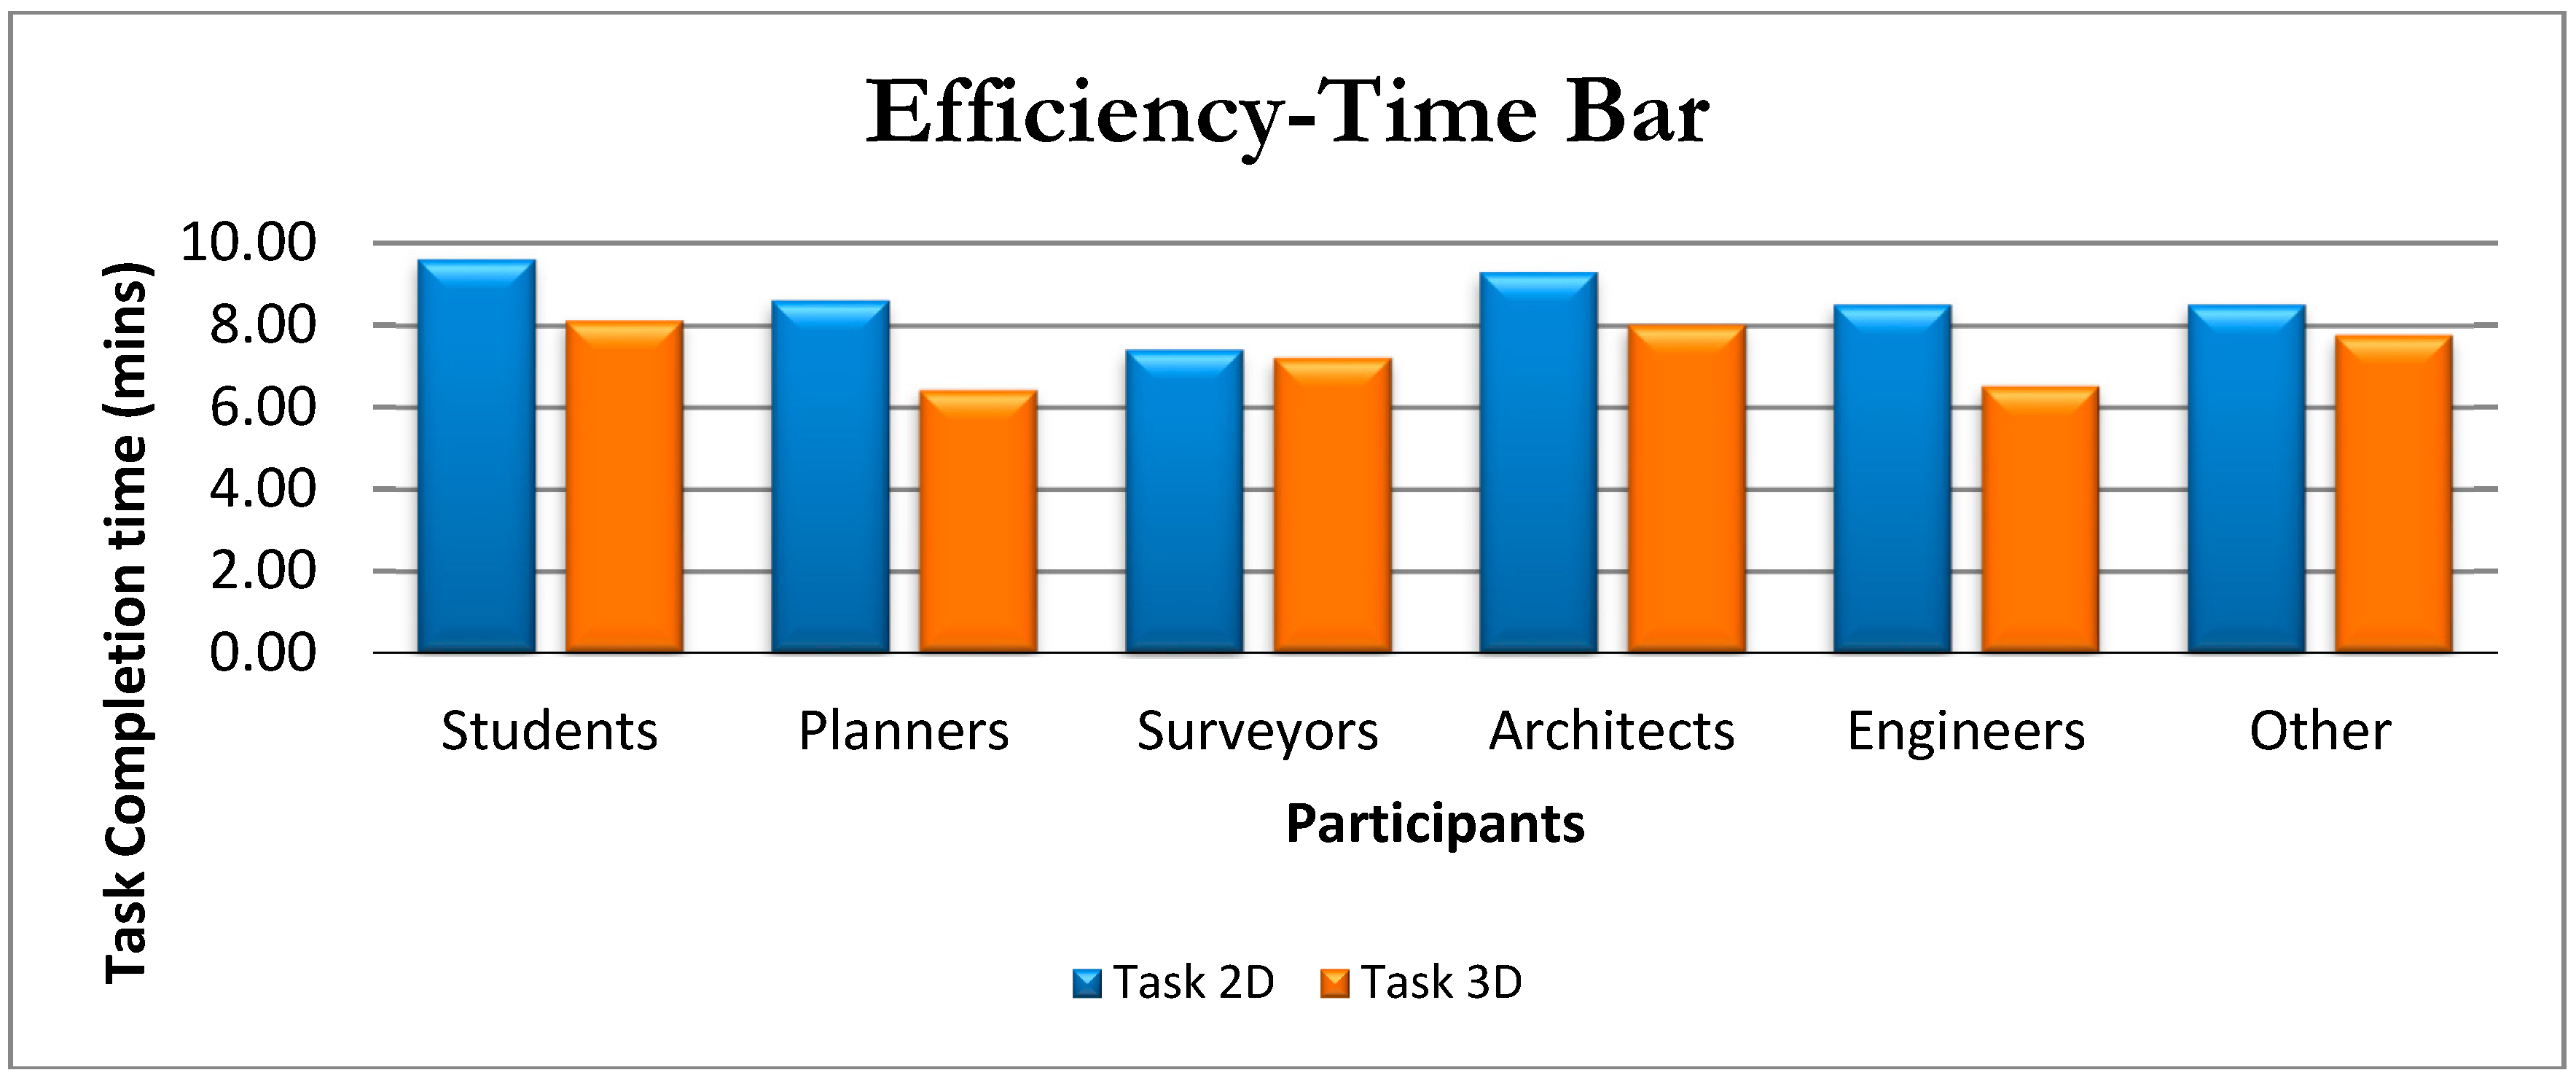
Efficiency measured the effectiveness with respect to the time spent on answering the questions. Planners took a shorter time on average in answering questions related to 3D compared to 2D while the student group took the longest times (12) for both 2D and 3D tasks (
Figure 5). On average, no particular group managed to get all the correct answers in the specified time.
Responses from the questionnaire pointed to a likely preference for 3D over 2D where 83% of the 37 respondents were more satisfied with the use of 3D than 2D representation.
The communication was evaluated based on its flexibility and the ability to convey information that triggers a change of thought from the participant. 89.2% of the respondents were of the opinion that 3D representation was more flexible to deal with than 2D.
Learning was evaluated based on the participant’s perception of the tool’s ability to improve their understanding and knowledge of the planning scenario(s) and the thought-changing process triggered by the PS tool presented. 81% of the respondents indicated that the 3D representation was easier to use and had improved their understanding of the plan and the area, as opposed to 56.7% indicating that their understanding improved when 2D presentation was used.
3.4. E-participation
The main goal of e-participation is to ensure sufficient access to the tool by all users and the possibility to ‘participate’ at any time or from any location, anonymously or not. The 3D web-based geoportal made this participation possible. The participants were able to view and navigate through the different objects in the model, and even leave comments, particularly on the redevelopment area.
Traditional methods of inviting public participation in Kenya (e.g., newspaper adverts, notices and local leaders) and actual participation (e.g., town/community hall meetings, local chief’s ‘barazas’, public gatherings convened by a local administrative leader, usually a chief or his/her assistant) were comparatively evaluated against the different methods of e-participation. Results from the key informant interviews, survey respondents and participants (
Table 3) pointed to the interviewee’s preference for e-participation methods, particularly on channels for invitation to participate and the actual participation. A significant number of participants preferred the use of SMS/USSD citing high penetration of mobile phones among the populace.
Reasons cited for their preference included time and cost saving, convenience, non-victimization, participation independent of space and time of day, ability to bring more participants on board, some degree of transparency and audit trail (accountability) among others.
4. Discussion
The results revealed useful insights into the characteristics of the participants and their use of both 2D and 3D representations of the geographic space and scenarios. It also pointed to how the integration of a 3D model in a web-based geoportal, with other e-participation methods could impact public participation in planning processes.
The majority of respondents from the household survey mentioned local leaders as their primary source of invitation to participate in the project. This is open to manipulation by ‘influential stakeholders and politicians’ who may use the leaders to front their personal, sectorial or political agenda [
4,
41,
42]. The development and use of these PSS tools can play a great role in mitigating such risks. An interactive web-portal opens communication channels, which can minimize the influence of local leaders and powerful politicians and stakeholders in the process by reducing potential contact with participants. For example, an SMS linked to a geoportal can facilitate a faster and cheaper participation option, ensuring not only more but also equitable participation, eliminating discriminatory invitations by leaders. While the use of SMS may have potential advantages, its use may be curtailed because of a variety of reasons. SMSs are character-restrained and may not contain a lot of details as may be necessary. Where details are needed, the cost of SMSs, especially from the source, may be higher, thus discouraging its use. Where a population is composed of linguistically diverse people and lower literacy levels, it may be hard to structure SMSs that may have wider reach. Sometimes, it may call for a tedious process of designing SMSs in different tribal languages. Another concern may be on privacy issues where respondents would not feel comfortable responding to a SMS whose sources or intended purpose they may not be certain about. The majority of residents interviewed showed particular interest in contributing ideas to the planning processes rather than for financial compensation, expressing both their instrumental and normative goals. This further solidified the claim by [
41]) that residents may be willing to participate, but perhaps the channels used to disseminate information or invitations to participate do not achieve optimum circulation. This was also seen in the results from practising planners, where 77.3% of respondents observed that the medium used to invite public participation had not achieved optimum or satisfactory levels.
Participants showed that the use of the 3D web-based tool was more effective than 2D paper-based representations. Effectiveness varied with the different professional groupings, with planners and surveyors scoring higher than other groupings. However, we conclude that the two methods are all effective, only varying in degrees of effectiveness. A correlation analysis performed showed that the Ease of Use and participants’ consideration of 3D over 2D had a strong positive correlation to the professional background of participants (0.266 and 0.186, respectively). The differences noted among various groups confirmed the assertion by te Brömmelstroet that differences in use of such tools depend on differences in professional backgrounds, languages and/or skills [
36].
Participant’s satisfaction was gauged based on their preferential choices between 2D and 3D. From the results, it was observed that 83.8% of the respondents from the workshops felt satisfied with the 3D tool and its capabilities and may consider 3D over 2D presentations in future planning work. This may be related to the learning concept where over 80% of respondents opined that the 3D tool improved their understanding, thus increasing their satisfaction rating. From the comments made by respondents in the questionnaires, we concluded that the respondents identified more with realistic and precise representations in 3D as opposed to 2D. A similar observation was made by [
12].
Another important role played by PSS is to enhance interdisciplinary communication through learning [
43]. In both tasks, some level of communication was reached based on the learning curves. However, the 3D web-based tool scored higher in this respect. Some participants were more concerned with what they actually learnt from the PSS tool (outcome) rather than how the tasks were done (process). This corroborates views held by Pelzer et al., that learning is perceived by users to be the most important added value of any PSS applications [
31]. Pelzer and Geertman argue that tool involvement prior to or during workshops seems to be both an important prerequisite for learning, and a learning process in itself [
43].
It is important however to point out that all the two workshops were semi-mediated and guided (facilitated), where users were taken through what to do. Perhaps such a workshop setting may produce different results from those where the PSS is chauffeured or fully mediated, or even in cases where each individual may be allowed to run the PSS outside a workshop set-up. Facilitation plays the role of maximizing the relevant goals of a specific meeting and involves general behaviours, specific interventions, and roles that together seek to maximize process gains and minimize process losses [
44,
45]. This study focused more on PSS use amongst different users. The biggest limitation however was the technical development of a full web-based 3D PSS with fully integrated e-participation features. Perhaps, this limitation forms an integral area for further research and the development of such an application for use in different workshop set-ups.


