The results of our analysis are presented and discussed in this section. They are presented in the following subsections:
3.1. Location and Product Downloading
We will present the results concerning the download frequency of each product and the location indicated by the users. Regarding downloads by product; results are shown in
Table 3 where the highest percentage of downloads corresponds to the DEM05. It can be seen that the amount of downloads decreases when increasing the grid size (lower spatial resolution). The reason for this may be the users’ tendency to use the product with the better performance, in this case with the better spatial resolution, regardless of whether or not it is the most suitable for a specific task.
In relation to the location of the download, the survey has several items to determine the place where users reside, and where the download occurs. The majority of downloads take place in Spain (12,470), and downloads in other countries are minimal. France, Portugal and the United Kingdom account for 3 or 4 downloads. It is interesting to note that a long list of Hispano-American countries appear with only one download. We think that the use of the same language makes it easy to test this download system.
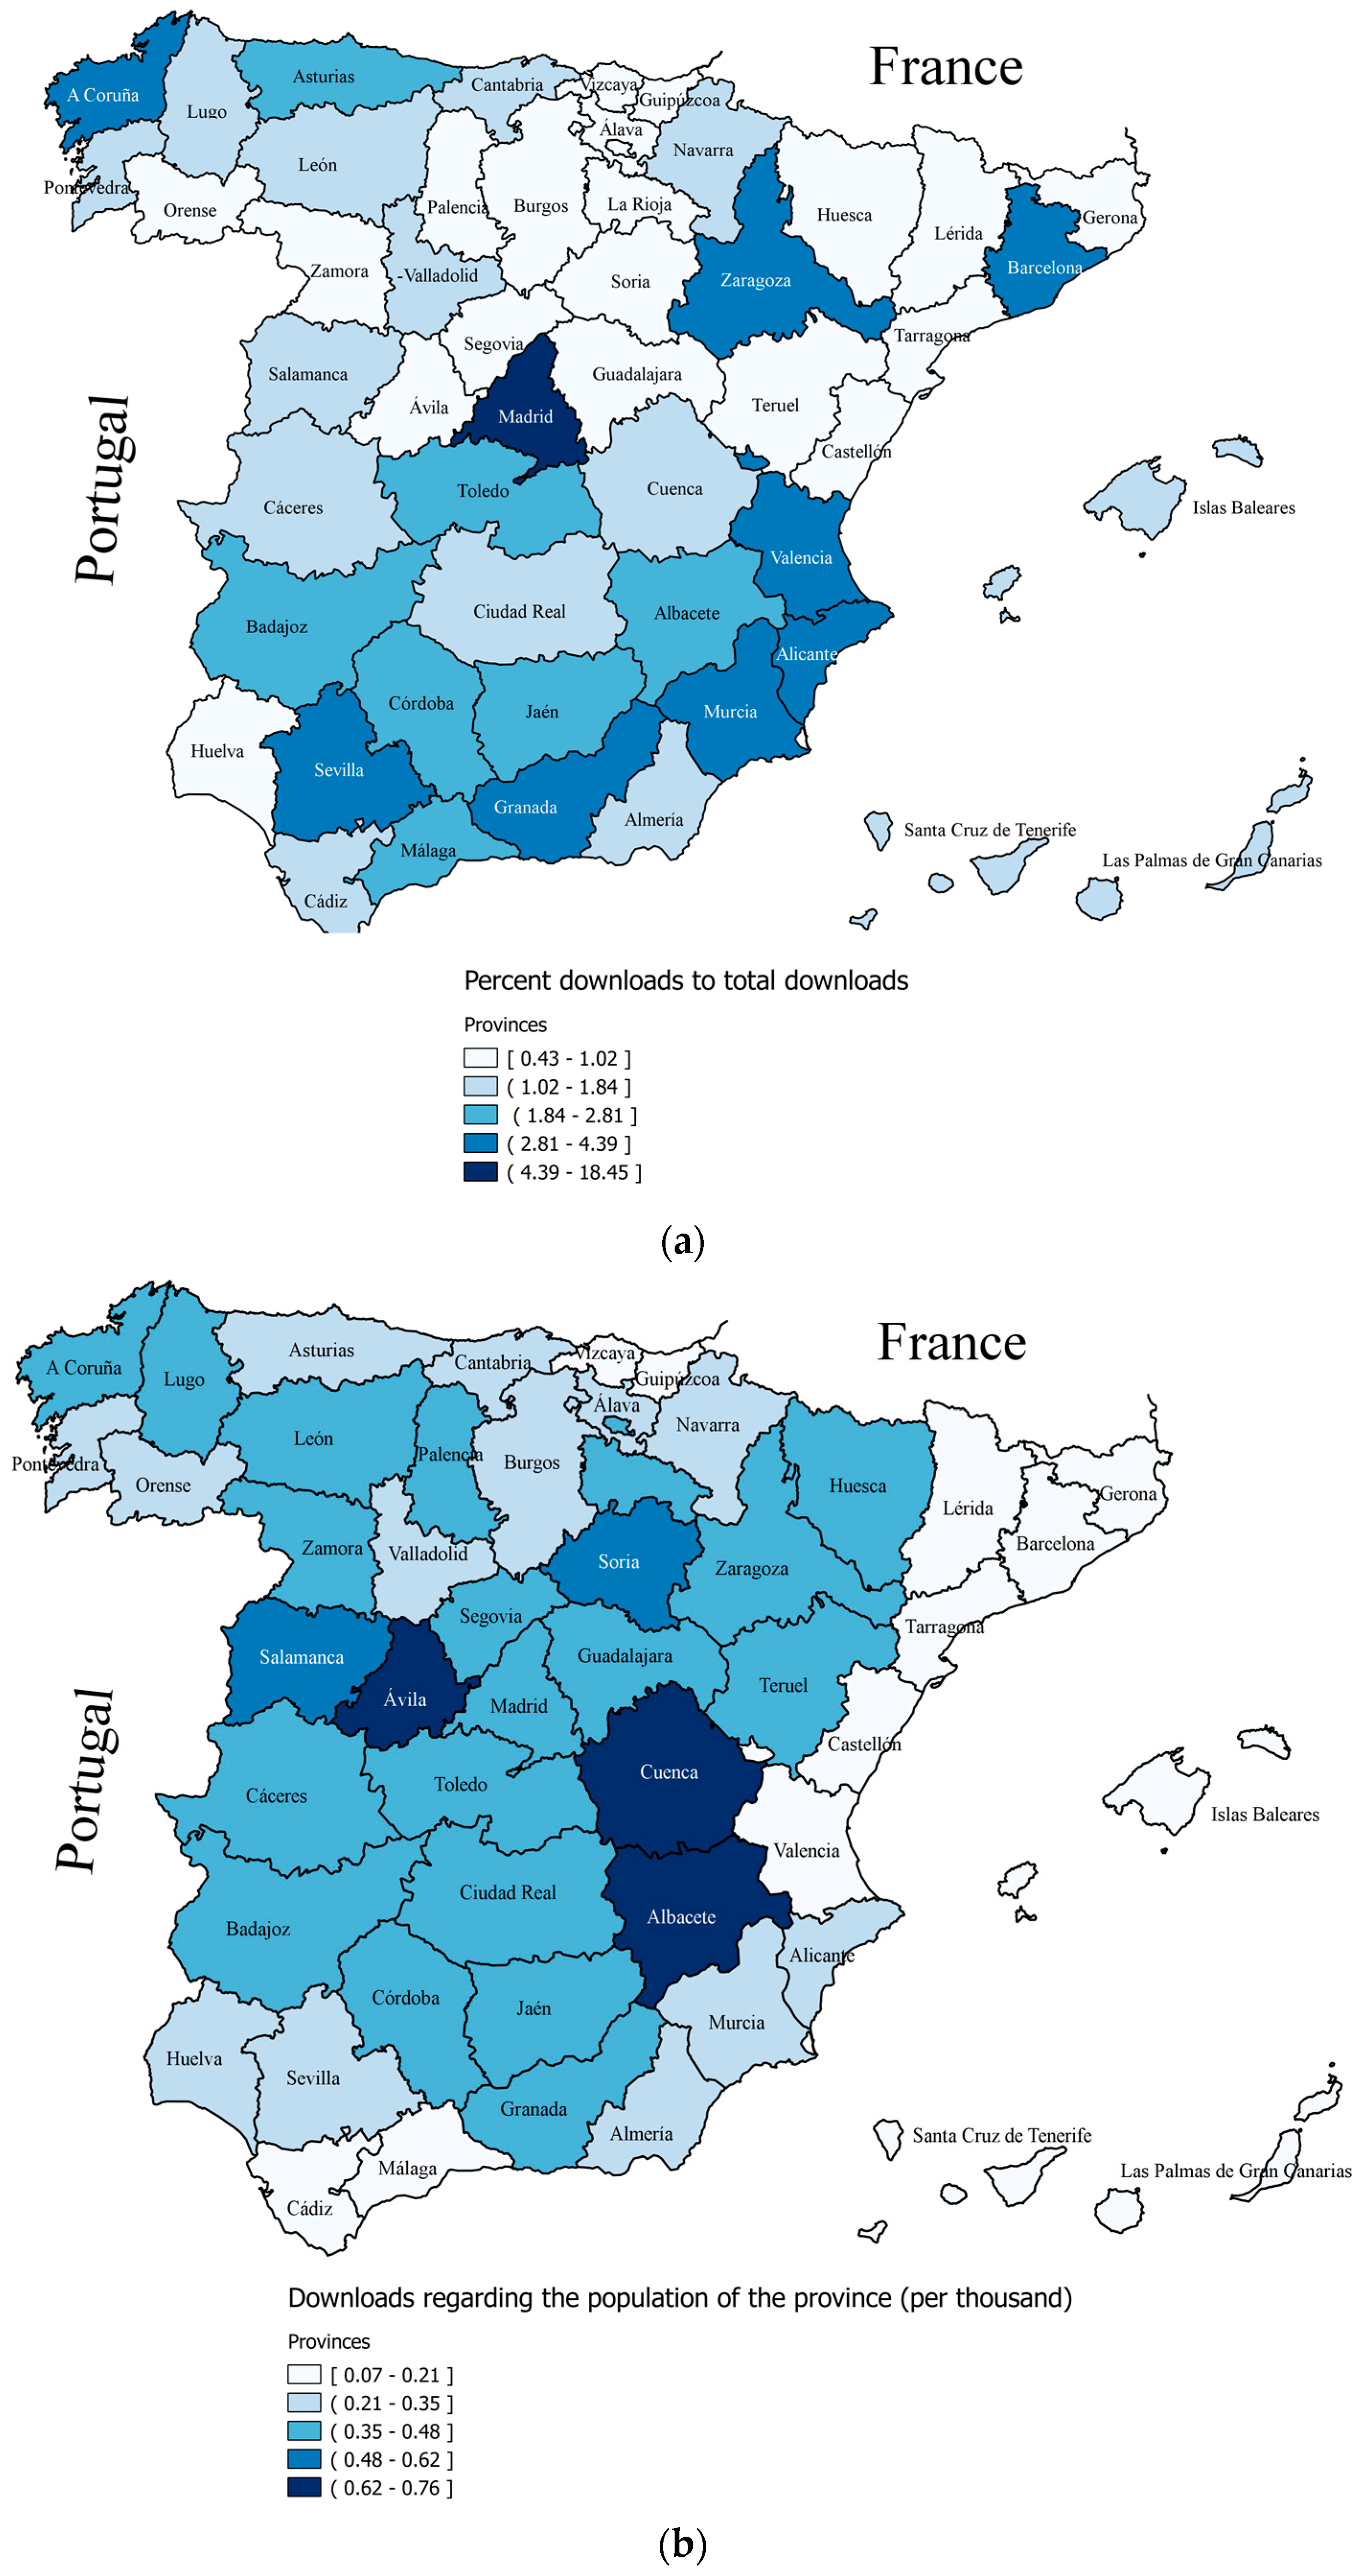
Figure 2 presents two maps with the distribution of downloads in Spain by provinces.
Figure 2a represents the percentage of the total downloads in each province.
Figure 2b represents the number of downloads per thousand per province and relative to its population (official population data published by the
Instituto Nacional de Estadística for 2014). In the first map we used the method of Natural Break Intervals for its representation. In this case data are grouped creating intervals so that the internal variance of the intervals is less than the variance between intervals. This method is similar to a statistical cluster and we obtain the groups that are presented in the population. For the second map we used intervals of equal amplitude in order to represent a variable which behaves very regularly. In
Figure 2a it can be seen that the province of Madrid holds the highest percentage of downloads (approximately 18%), and this is a very noticeable difference from the other provinces. At first it appears that this high percentage of downloads in Madrid could be due to its high population and economic importance, although in this respect we should also highlight other provinces such as Barcelona. However, in the case of Barcelona there is a regional mapping service (
Instituto Cartográfico y Geológico de Cataluña, ICGC) that provides an alternative downloading system for this region of Spain. In the second interval ([2.81, 4.39]), there are seven provinces of peripheral character (La Coruña, Barcelona, Valencia, Alicante, Murcia, Granada, Seville) and an interior province (Zaragoza). This is interesting because coastal provinces in Spain are more dynamic and usually have more economic power than interior provinces. Finally, in this Figure we highlight the existence of an east-west strip of land consisting of provinces where the lowest percentage of downloads was detected.
The percentage of downloads in each province was represented in
Figure 2a and can be detailed a little more if we take into account the population of each province.
Figure 2b represents per-thousand downloads for the total population in each province. Thus, it complements the perspective of
Figure 2a.
Figure 2b includes provinces such as Avila, Cuenca and Albacete in the range of higher values. In the case of Avila, we believe this may be due to the existence of a university with studies related to Geomatics; and as we will see later, the university world is a big user of DEMs. In this case the periphery effect also exists, but with a different sense to that of
Figure 2a. The relation between downloads and population is not linear: downloads increase with population but not proportionally, so that the ratio per-thousands of downloads decreases with the increase of population. It is important to notice the low level of this ratio in the regions of Cataluña and Valencia. We believe this is motivated by regional mapping agencies which allow the downloading of similar products.
3.2. User Profile
One of our main objectives is to establish users’ profiles. In the download system, a user is each person or institution that is registered in the system and has a different identification. Thus, several people can access under the same identity, and one person can access with different identifications. With these limitations, we were able to identify a total of 6087 different users in the period considered. This was possible because we had a unique identifier provided by the IGN (
Instituto Geográfico Nacional) as a combination of name and e-mail of the downloader. The survey form has 9 options that can determine user’s profiles of various kinds, whose analysis is straightforward and is shown in
Table 4. The profile with more weight is that related to particular users, where freelances are included. The second most important user profile corresponds to the universities, including teaching, research and final degree preparation or similar work. As expected, smaller companies have a higher percentage of downloads than larger ones. The public administrations (national, regional and local) accumulate 3.99% of total downloads. All of this indicates that the predominant use (>95%) is not related to the work of public administrations. Considering each of the three downloadable products,
Table 4 shows that there is a great similarity in the download behavior. In relation to the spatial resolution (grid size), it is interesting to note that for administrations and enterprises the percentage of downloads increases with the increase of resolution. For the case of universities and private users, the situation is the opposite. We think that public administrations and enterprises work at greater scales (local) and that universities work with smaller scales (regional or national).
If we cross the profile of user marked in the survey and the standard comments of use, we observe that there are some inconsistencies. For all user profiles the standard comment on the majority use is Teaching-Study. In some profiles, such as medium-sized businesses, the second most frequent comment is Leisure-Sports-Tourism, which does not seem logical. In third and fourth position of the number of downloads appear standard comments of the most coherent use, thus in Regional Administration, Large Company and Medium-sized business Geomatics appears in third place and in some other profiles research appears in fourth place, as in the profile University. These last standard comments on the use of DEMs seem more logical. However, with the most standard comment use being related to Teaching-Study it makes us think that regardless of the user’s profile downloading for the development of work related to Geomatic, Environmental, Geological, Biological studies, etc. are the ultimate goals of those downloaded DEMs.
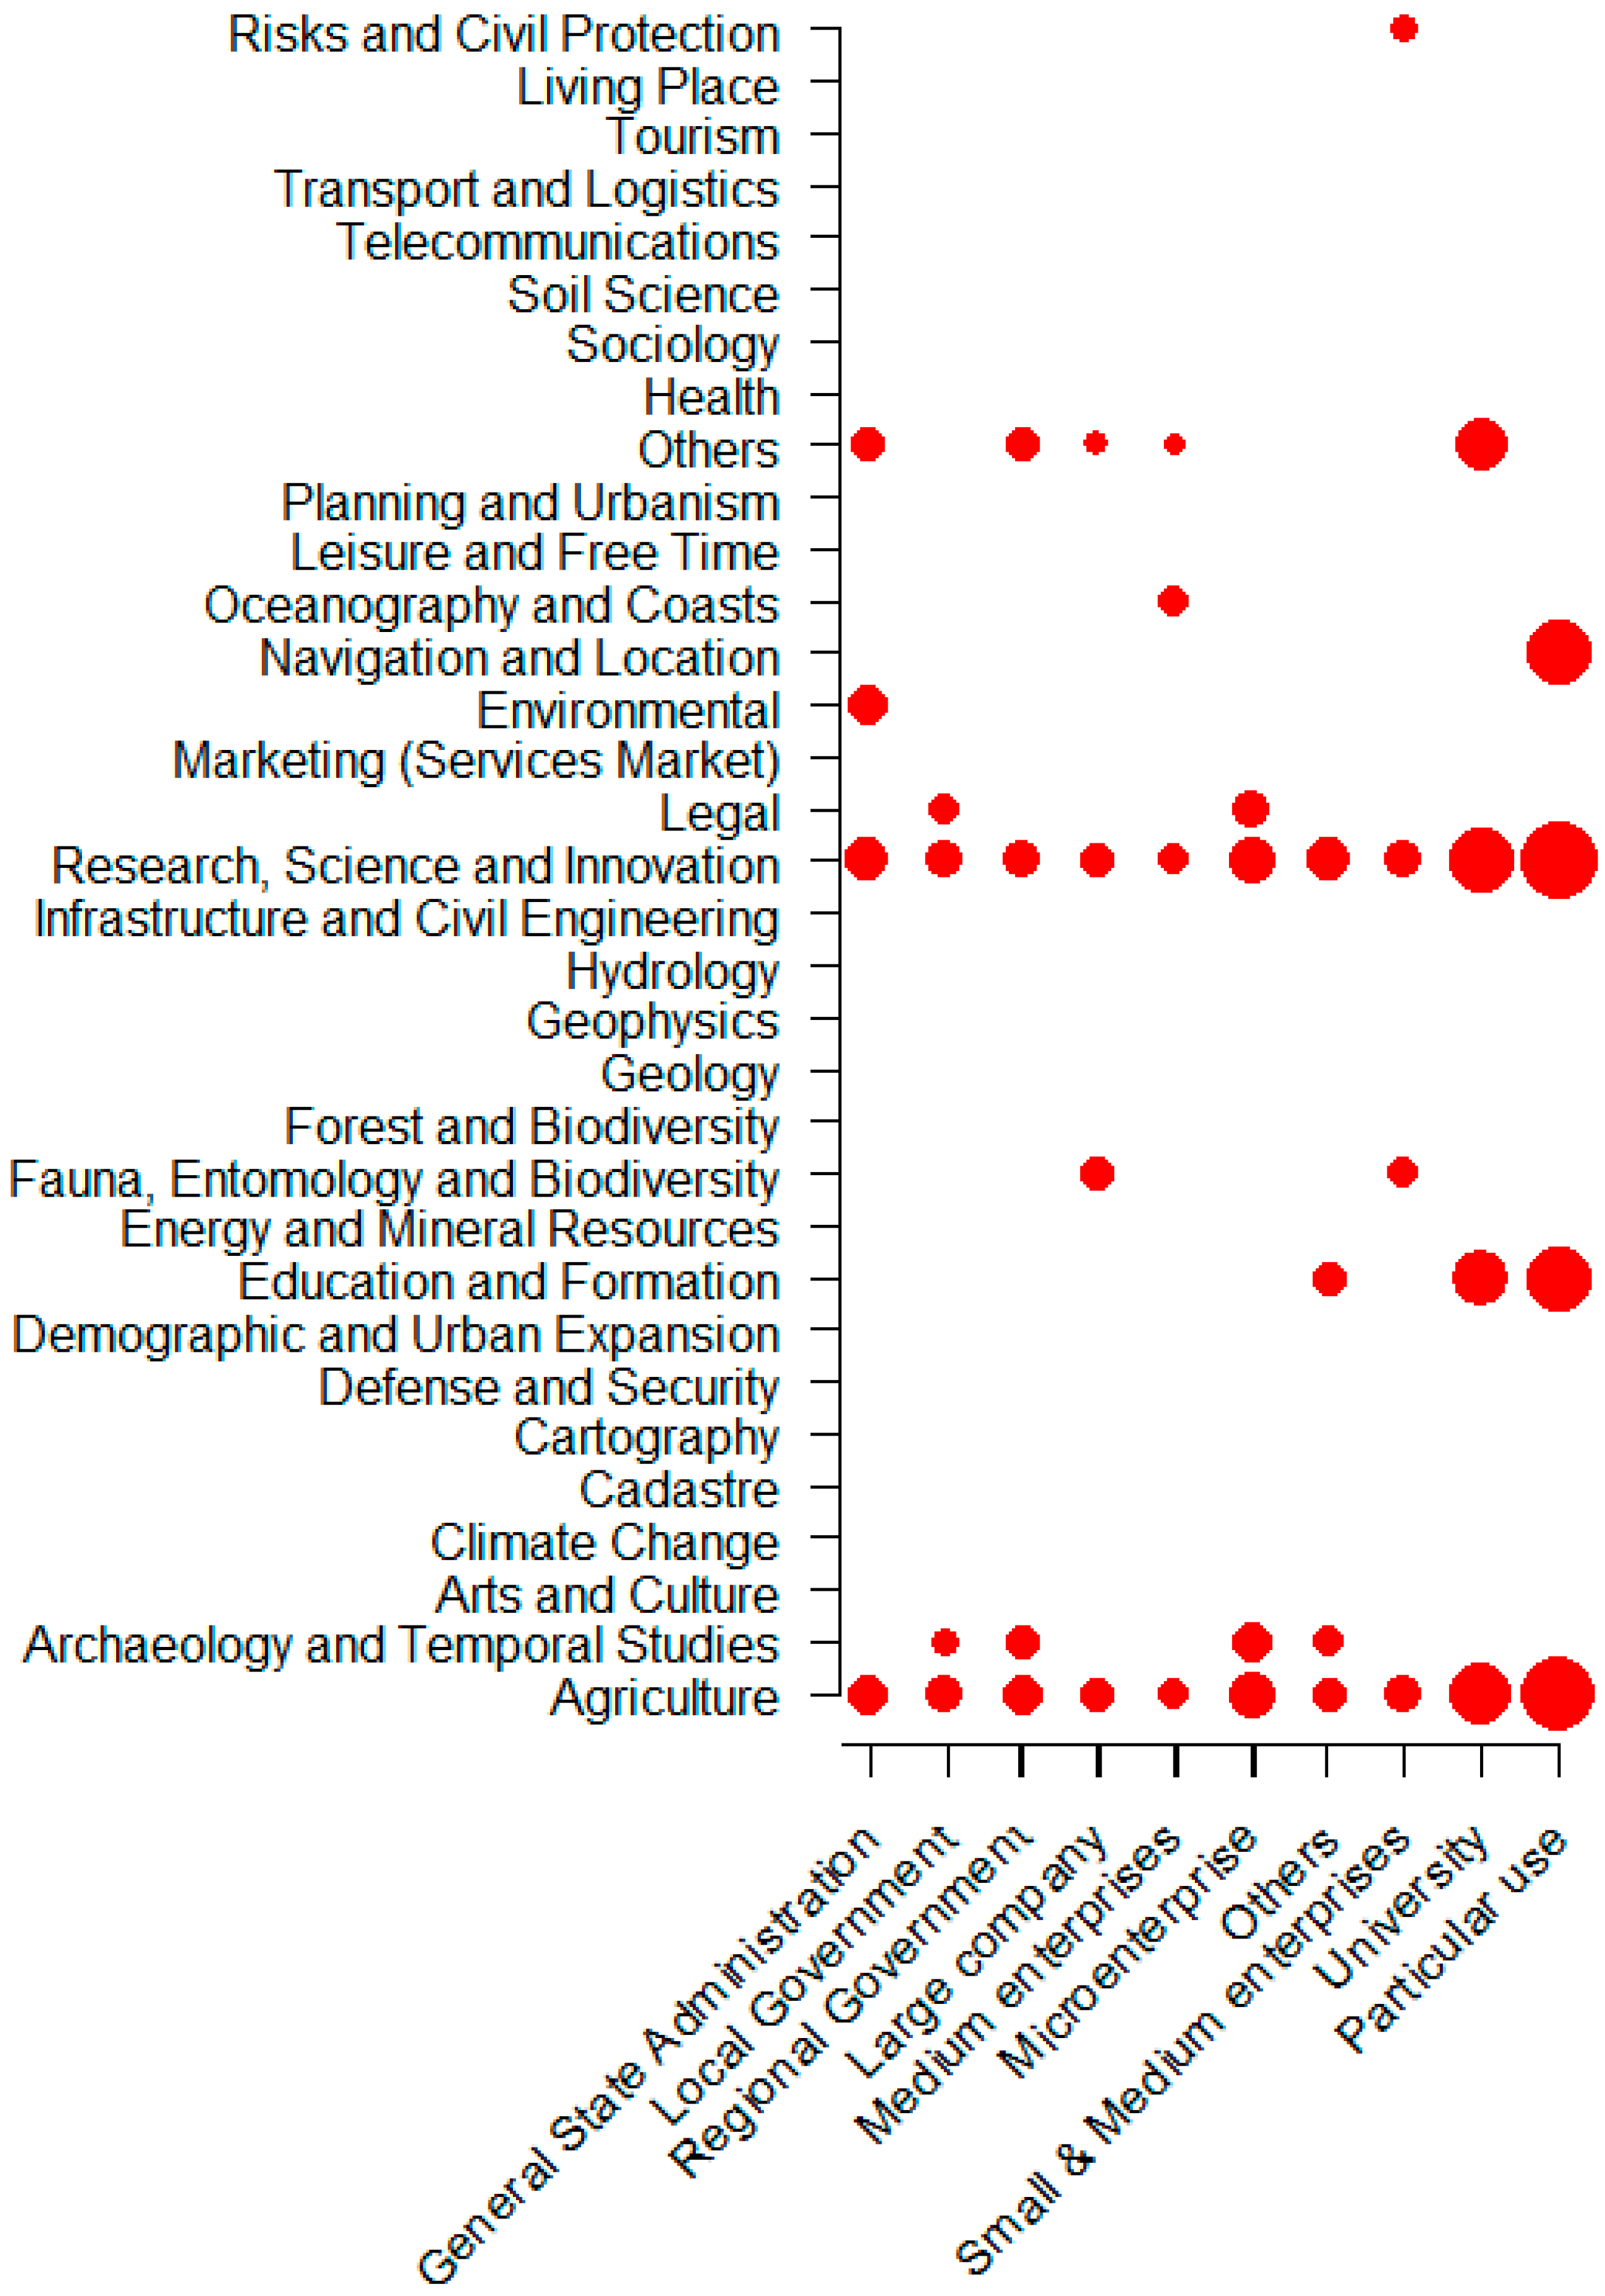
Figure 3 shows the relation between user profiles and sectors. For clarity purposes, for each user profile only the four sectors accounting for the largest numbers of cases are represented, and dots are drawn in a log-scale. As can be observed, only ten sectors have representation in this figure (rows with dots), and two of them are predominant (Agriculture and Research, Science and Innovation). The last is of interest because all user profiles perform applications in these two sectors. Leaving aside the case of “others”, Education and Training and Archeology and Temporal Studies are also highlighted in this figure. We can highlight the relation between Archeology and temporal studies with Local and Regional Governments and Microenterprises. In Spain, these two administrations (Local and Regional) are responsible for the historical heritage, and free professionals (microenterprises) usually perform these tasks. Finally, the importance of Education and Training is obvious for the University user profile but
Figure 3 also indicates that DEMs are used in particular uses for training (self-training?).
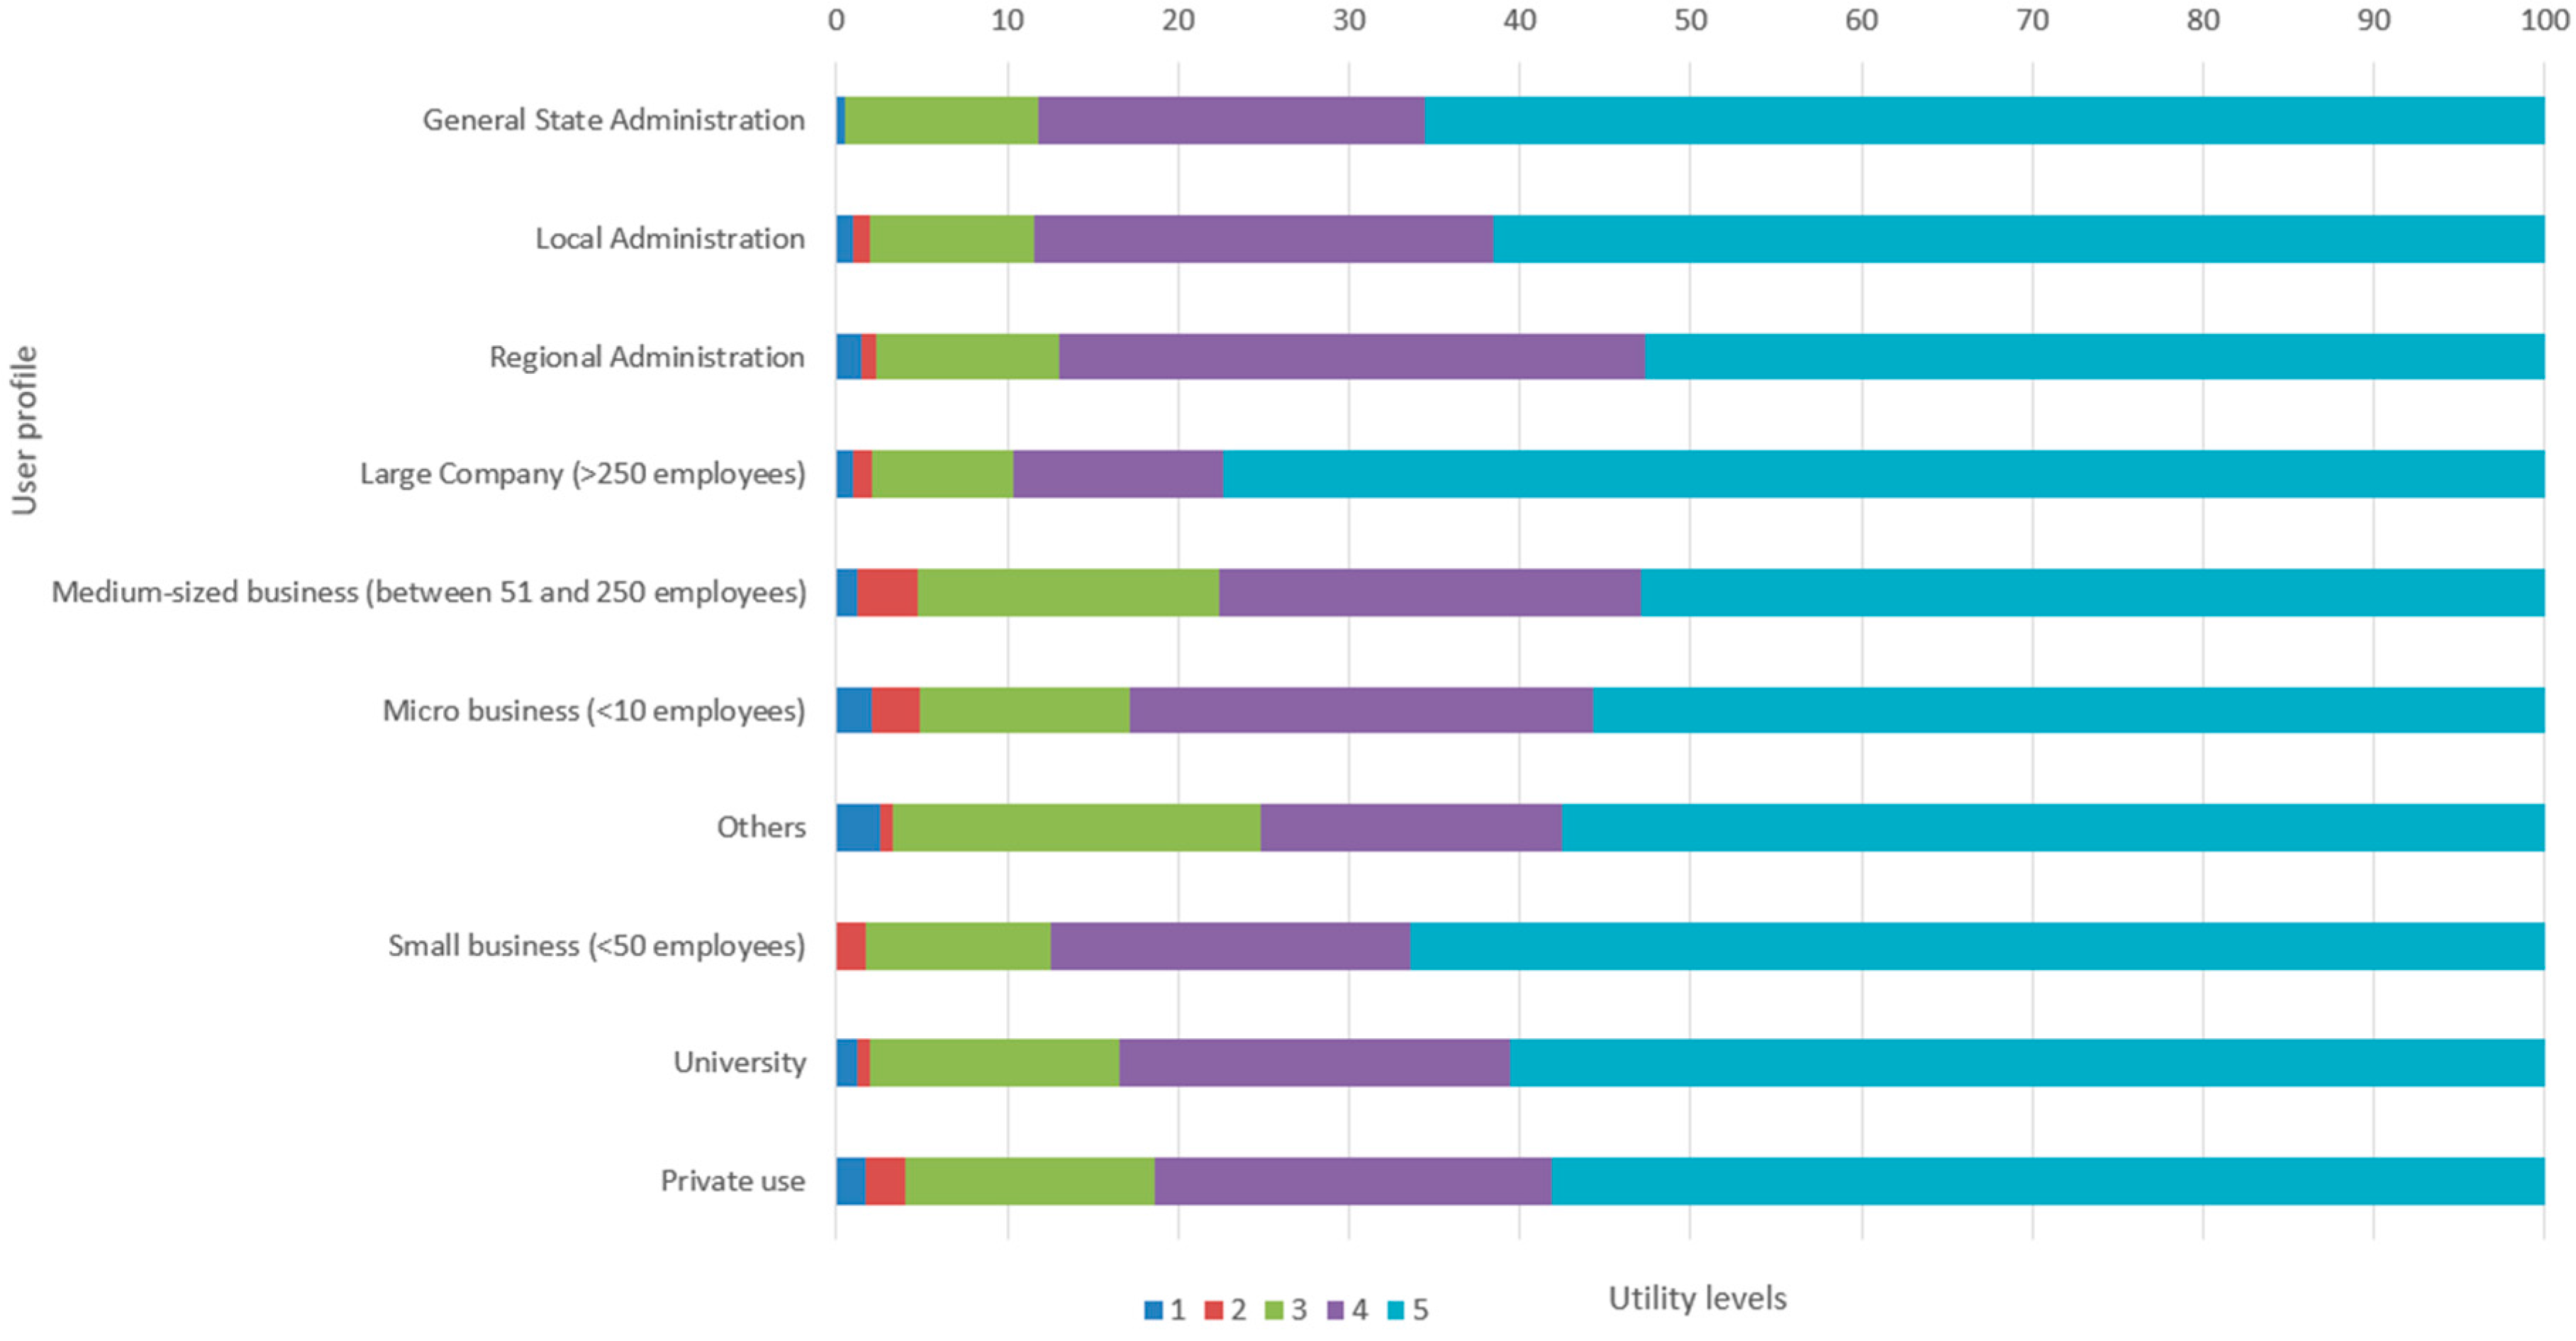
Next, we can establish the relationship between the user profile and the level of utility that they give to the DEM.
Figure 4 shows the percentage of each level of utility granted by each user profile.
As shown in
Figure 4, utility is well valued by all the profiles, with level 5 always receiving more than 50%, especially in large companies where the percentage is the highest of all in level 5 of utility. However, where the percentage of level 5 is lower is in the profile of medium-sized businesses and regional administration. It is difficult to obtain justified conclusions that explain this behavior, since there are no obvious reasons. However, it can be observed in the downloads percentages of
Table 4 that both profiles have percentages of DEM200 downloads very close to DEM05 values, that is to say that both low resolution and high-resolution models are used in both profiles. This may be because the objective of the work covers a large area of territory. Probably working on a large area of territory is in studies where the utility of the DEM loses importance with respect to other cartographic models.
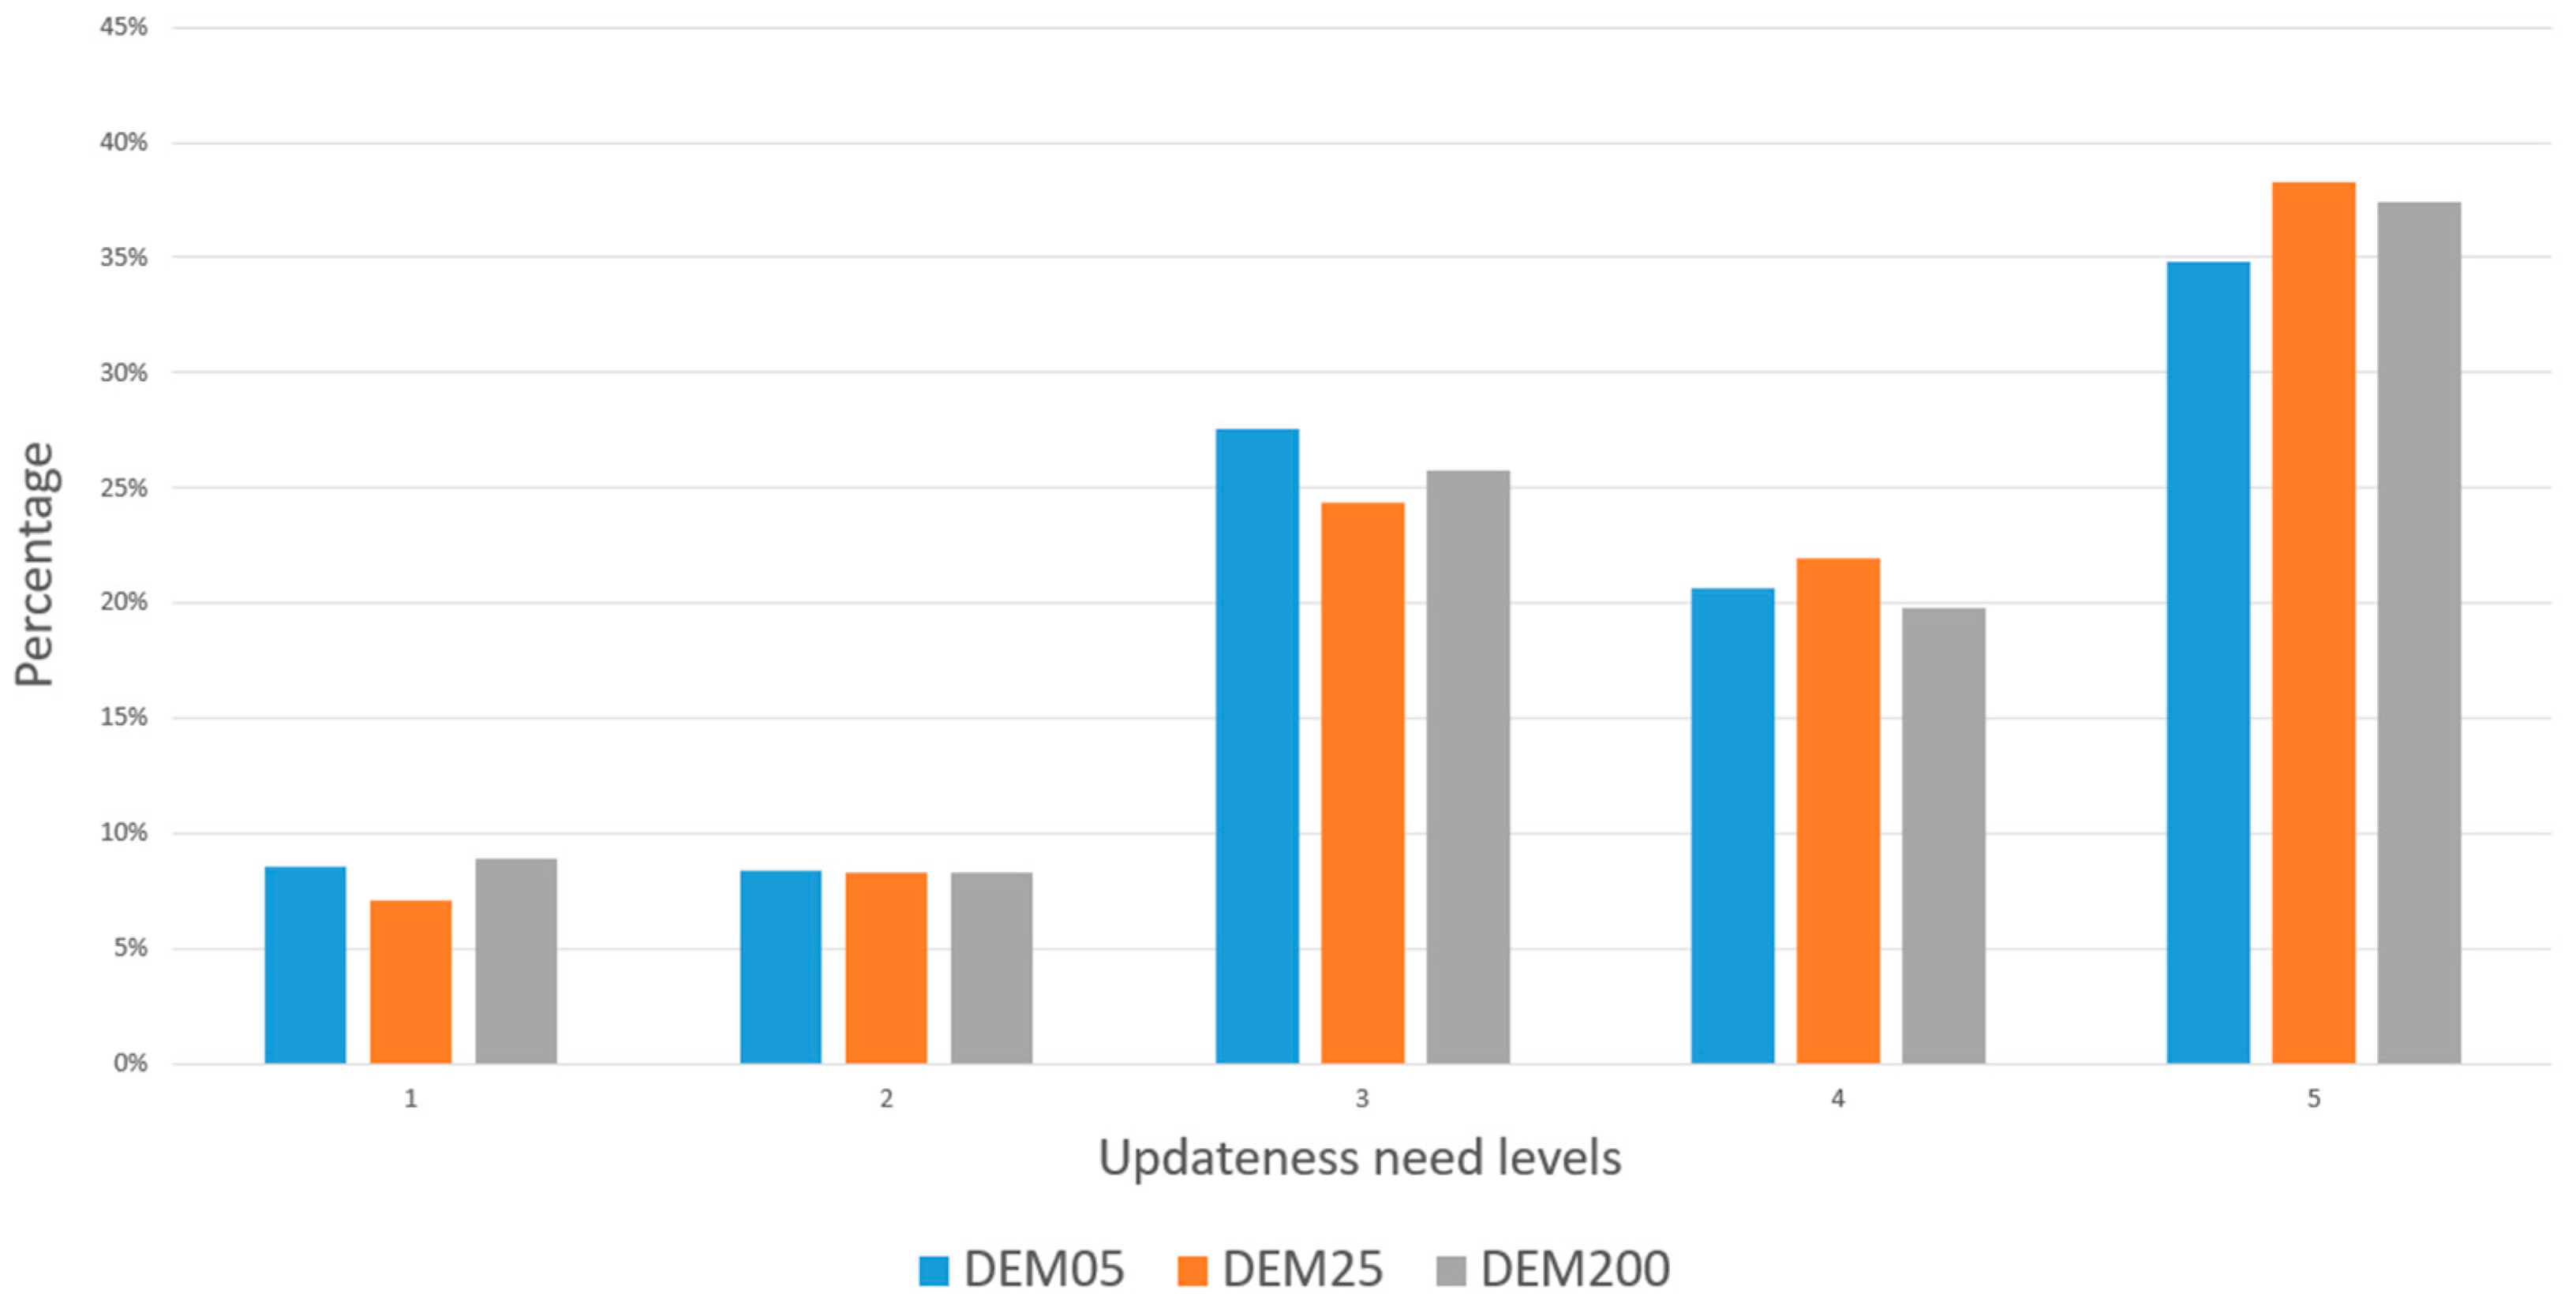
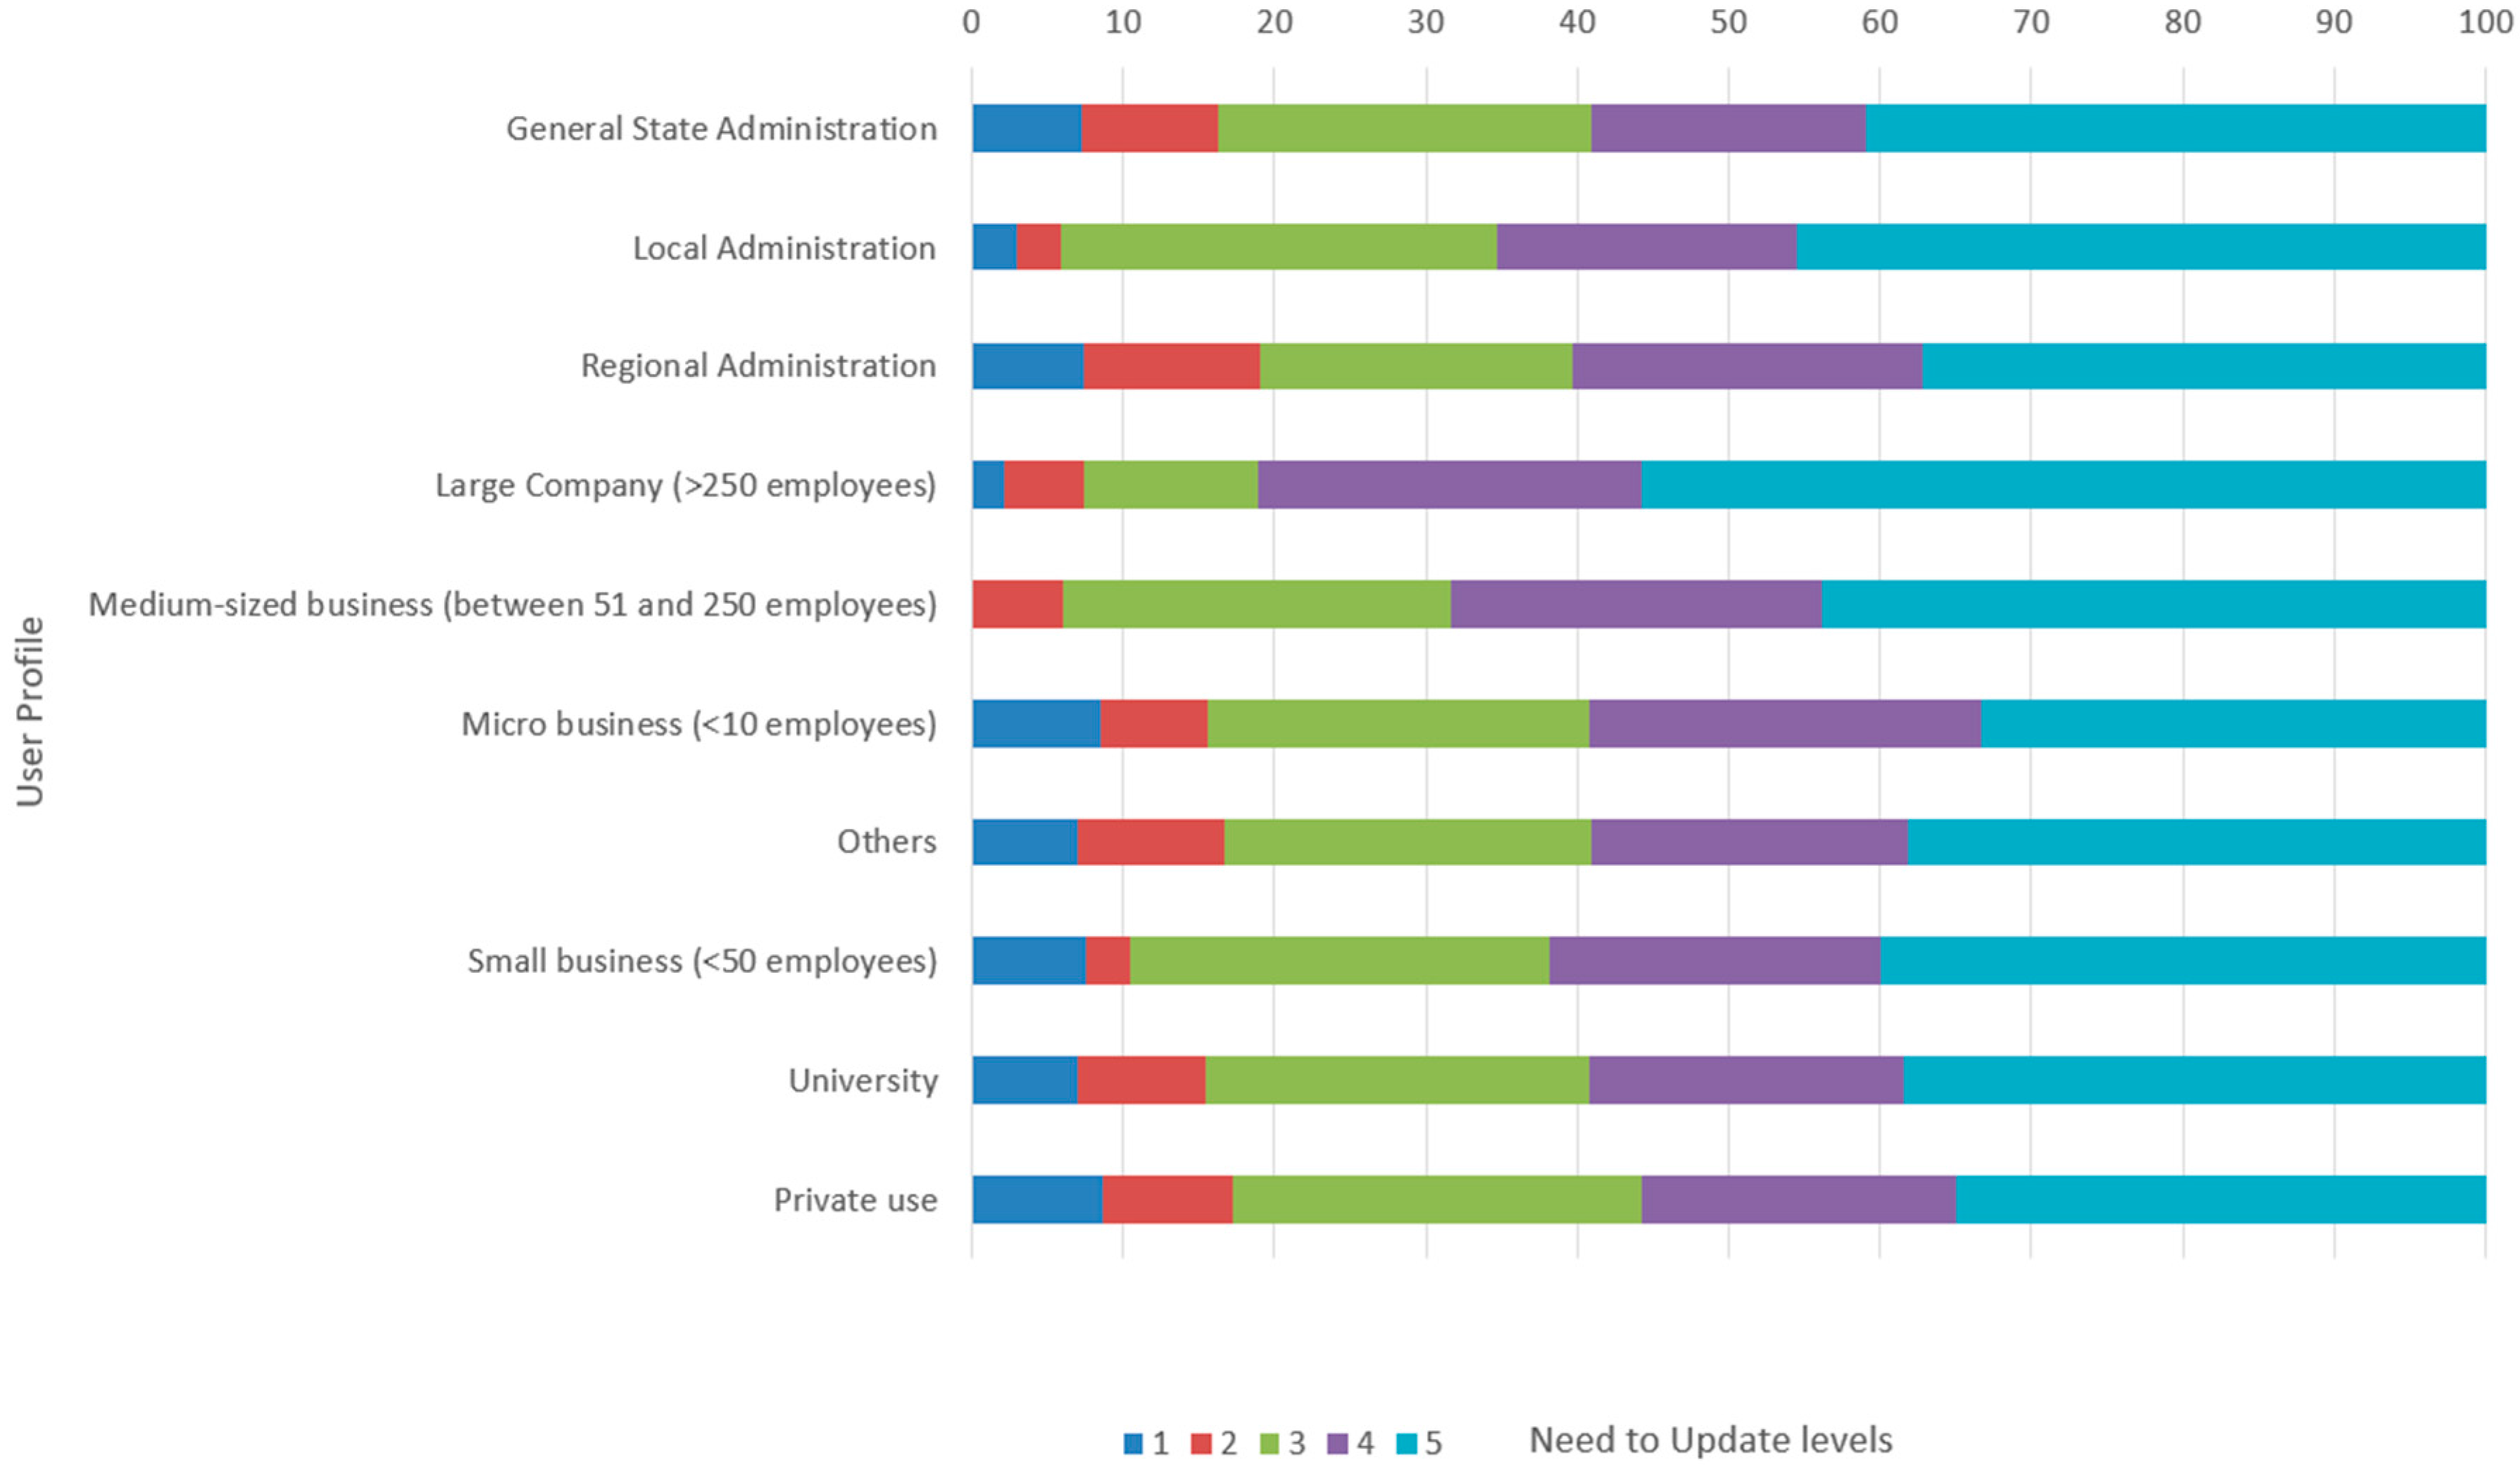
On the other hand, we have analyzed the behavior of the percentage of the levels assigned to the need to update the DEM in each user profile (
Figure 5).
In this case the percentages of level 5 are lower, not exceeding 50% in any user profile, except in large companies, which as with utility is the user profile with the highest percentage of level 5 assigned. The profile of large companies has the most marked thematic area: Environmental, Cartography and Infrastructure and Civil Engineering, being the only profile that includes Infrastructures and Civil Engineering among the most marked. This could be one of the reasons why both utility and the need to update at level 5 are considered to be higher, since infrastructures need a shorter update period due to their constant change, and therefore they need a more detailed and updated knowledge of the environment. Even so, the need to update is an aspect less valued by the user than the utility of the DEM.
Other interesting information is that related to the registration profile, and
Table 5 presents the available data. Here the more important issue is that the majority of users are recorded as people, independently of whether they work for a company/administration or not.
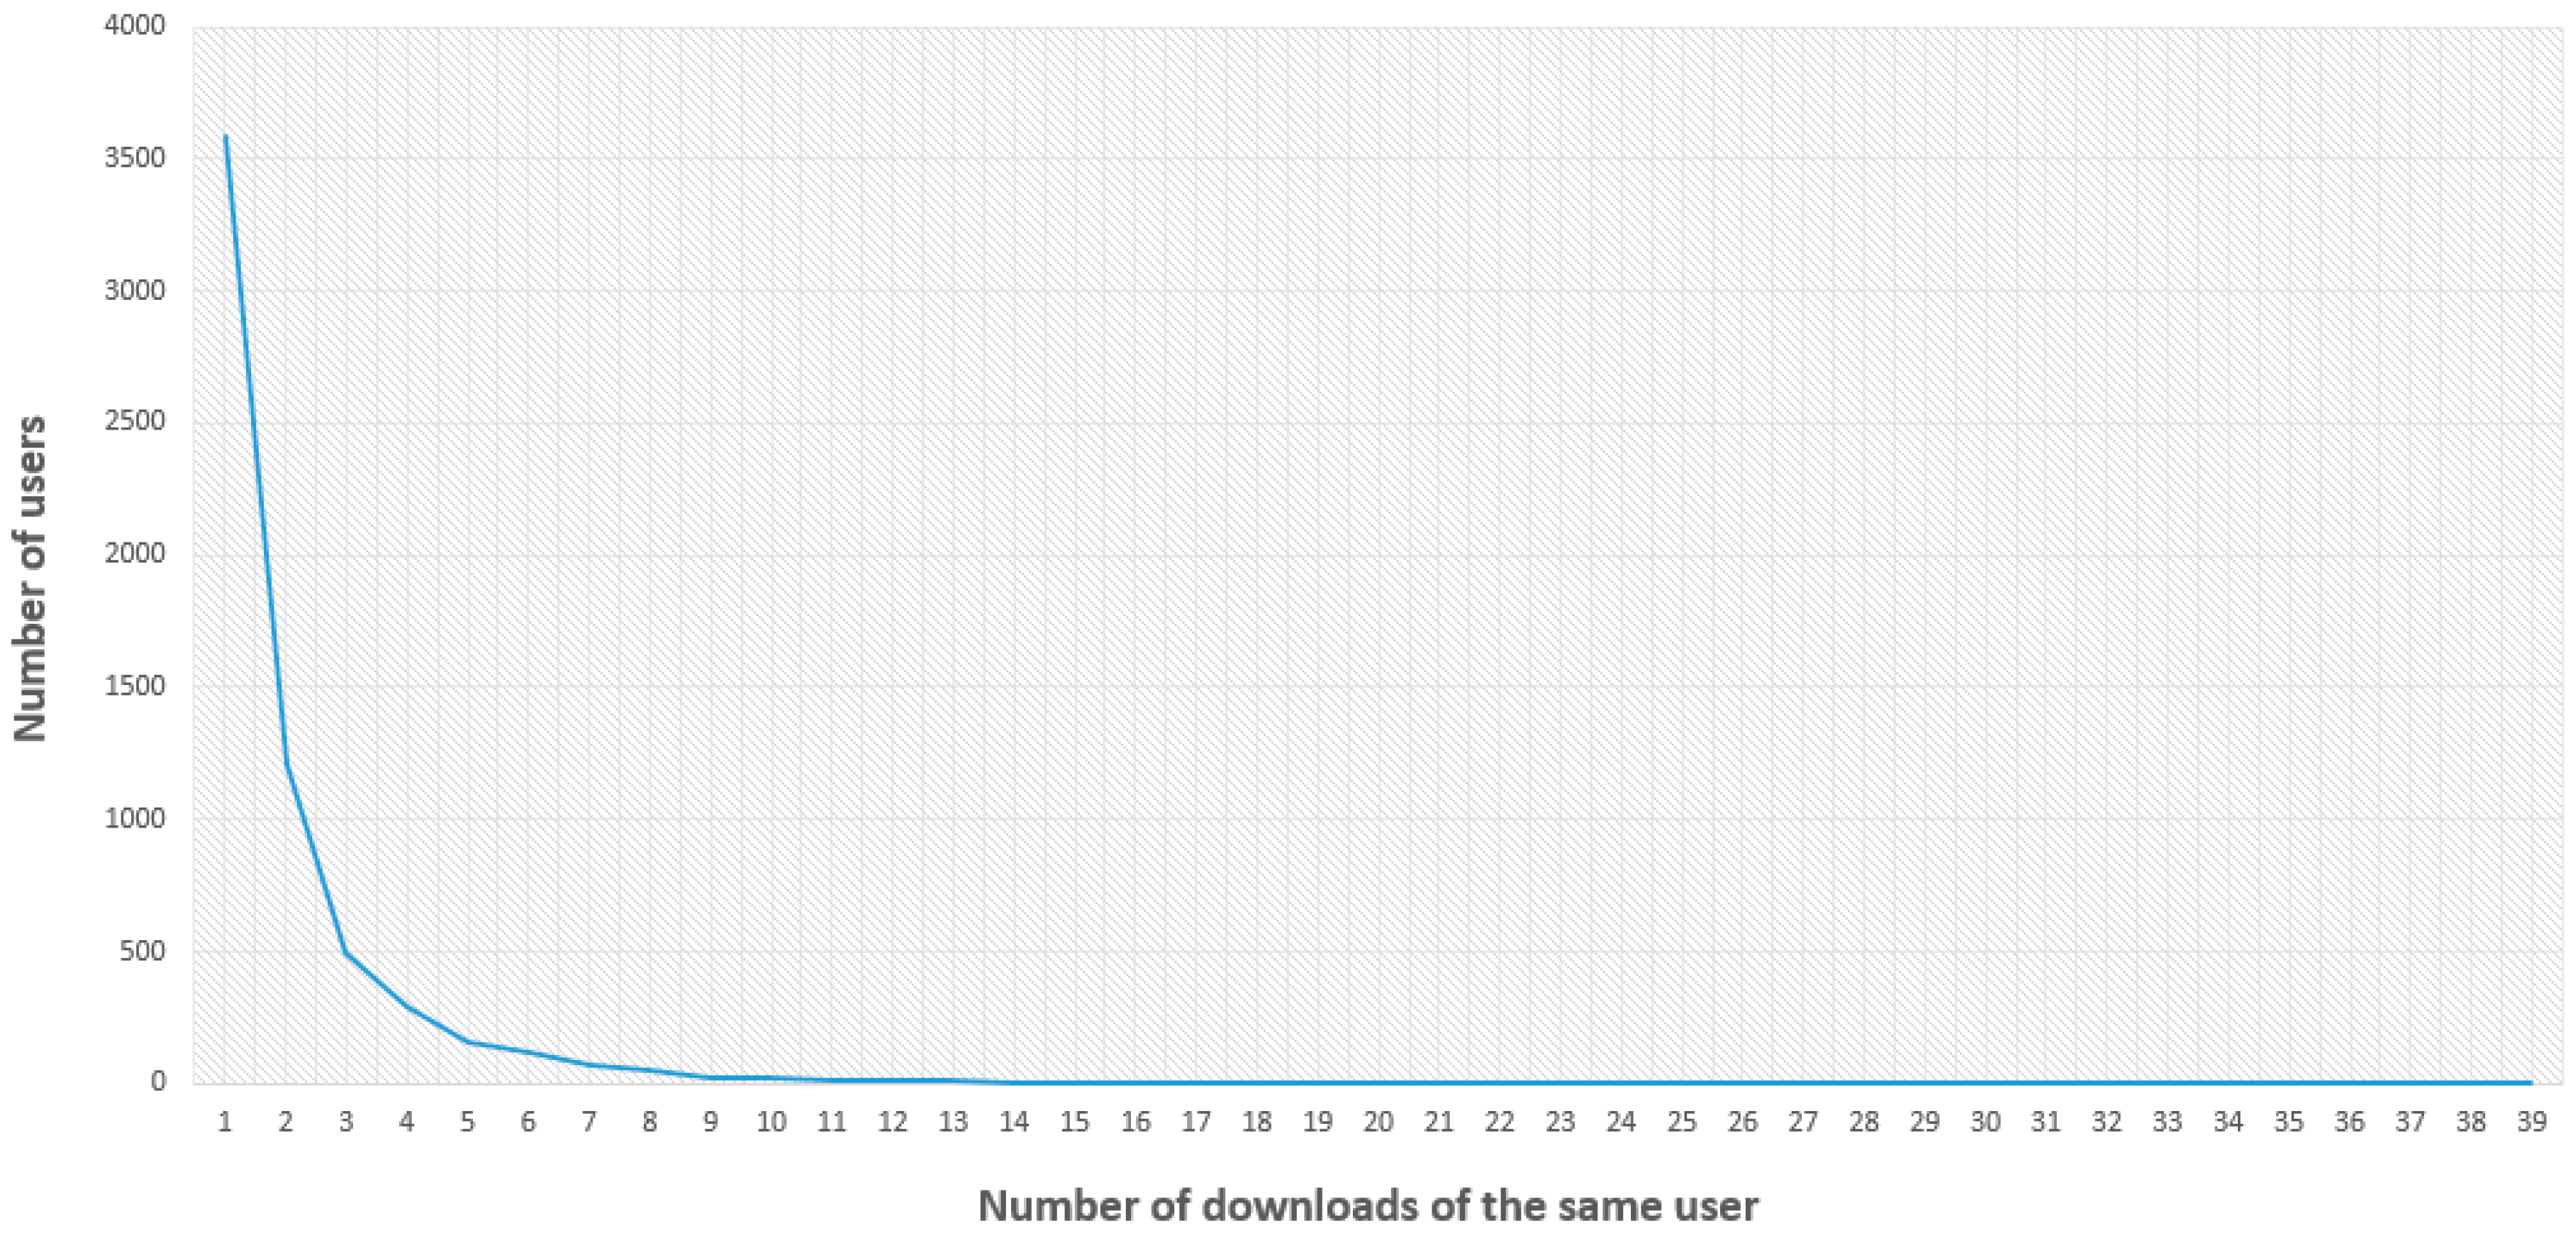
Another aspect of interest is the activity performed by users, that is the number of downloads performed in the year of analysis.
Figure 6 shows the number of users (vertical axis) against the number of downloads (horizontal axis). As can be seen, the number of downloads ranges from 1 to 39, but the vast majority of users only perform one download. The most common number of downloads is between 1 and 3. Users who perform 1 or 2 downloads accumulate 80% of cases, and users who perform up to 5 downloads accumulate 95% of cases.
In view of the results we might think that most users are occasional users, as they perform 1 or 2 downloads. However, we must clarify this statement based on download user habits, the download system and the survey system. The survey system includes a record for each download, but the download can include multiple files. Indicating different download habits, for example file by file or several files together, produces a number of different records although the number of files downloaded may finally be the same.
3.3. Use of the Product
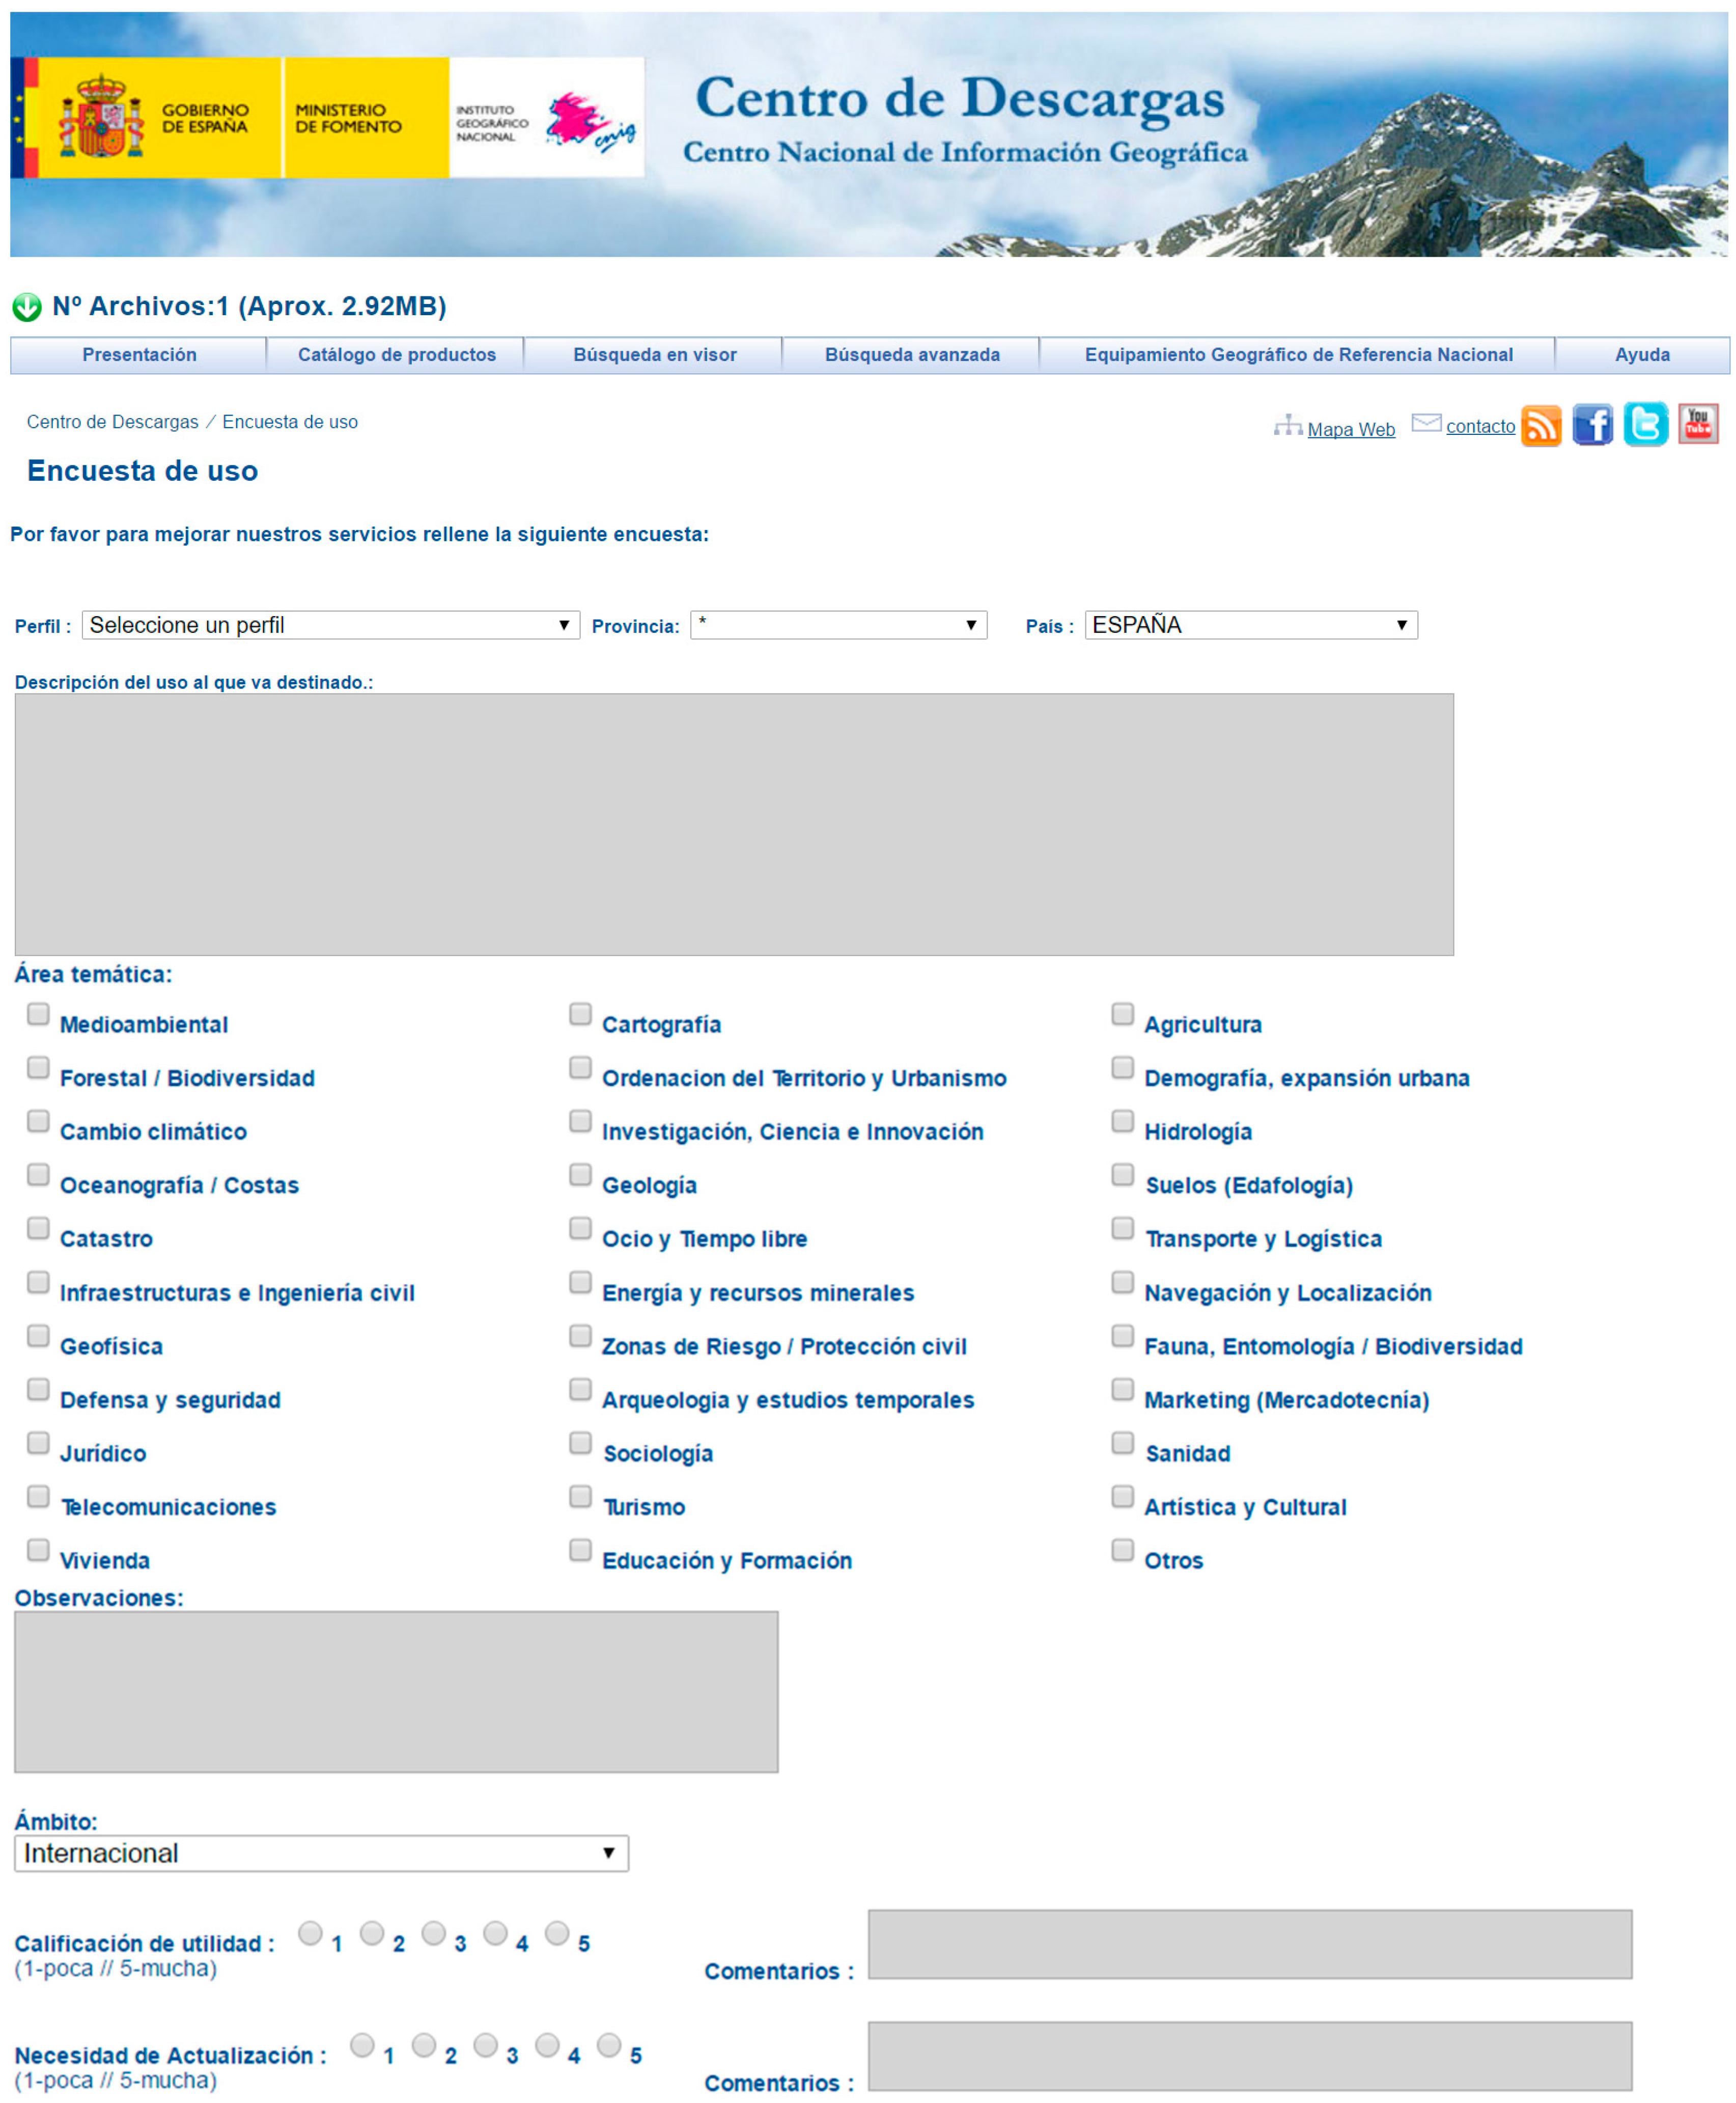
To characterize the use of the product, we can use the item “Thematic Area” (Sectors) from the survey form. This item provides the ability to mark a multiple choice in order to indicate all the sectors where they will use the products. In addition, in order to complement this information, the user is offered an item for comments (“Comments about the sectors”), and a free text item (“Description of intended use”). The item “Description of intended use” was normalized with the terms of
Table 2. Here we present the results from these items.
Table 6 shows the frequency with which they have selected one or more options in relation to these Sectors or Thematic Areas. Nearly 73% of users mark a single thematic area. We consider that this indicates a strong focus on specific implementations. Almost 95% of users are included in the group of the first three categories of the table, that is, they mark 3, 2 or 1 in the item Thematic Area. There are cases of users who indicate a large number of areas, in some cases even selecting all options. However, the percentage of these cases is very low.
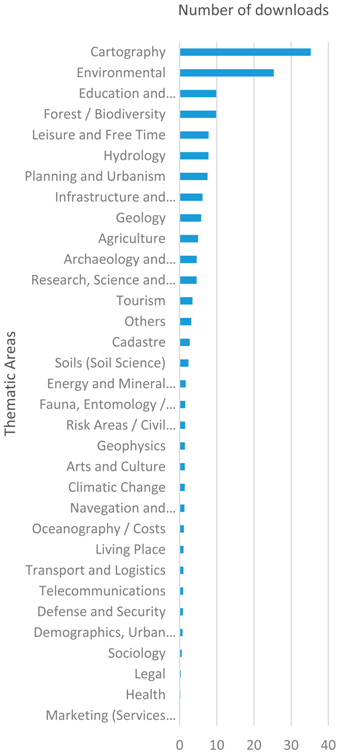
Table 7 presents the distribution of the accounts received by each Thematic Area. The figure included in the table represents the % of downloads with respect to the total number of downloads; and the figures the percentages in relation to the total number of records. This information clearly indicates the main Thematic Areas of use for the DEMs in Spain. In this way applications related to Cartography and the Environment are clearly more numerous, with more than 3000 counts (60.57%). A second group of activities are those that are in the vicinity of 1000 counts (42.62%), which are: Hydrology, Education and Formation, Leisure and Free Time, Planning and Urbanism, Forest and Biodiversity. We could establish a third group around the value of 500 counts (54.69%) and a last one below this value.
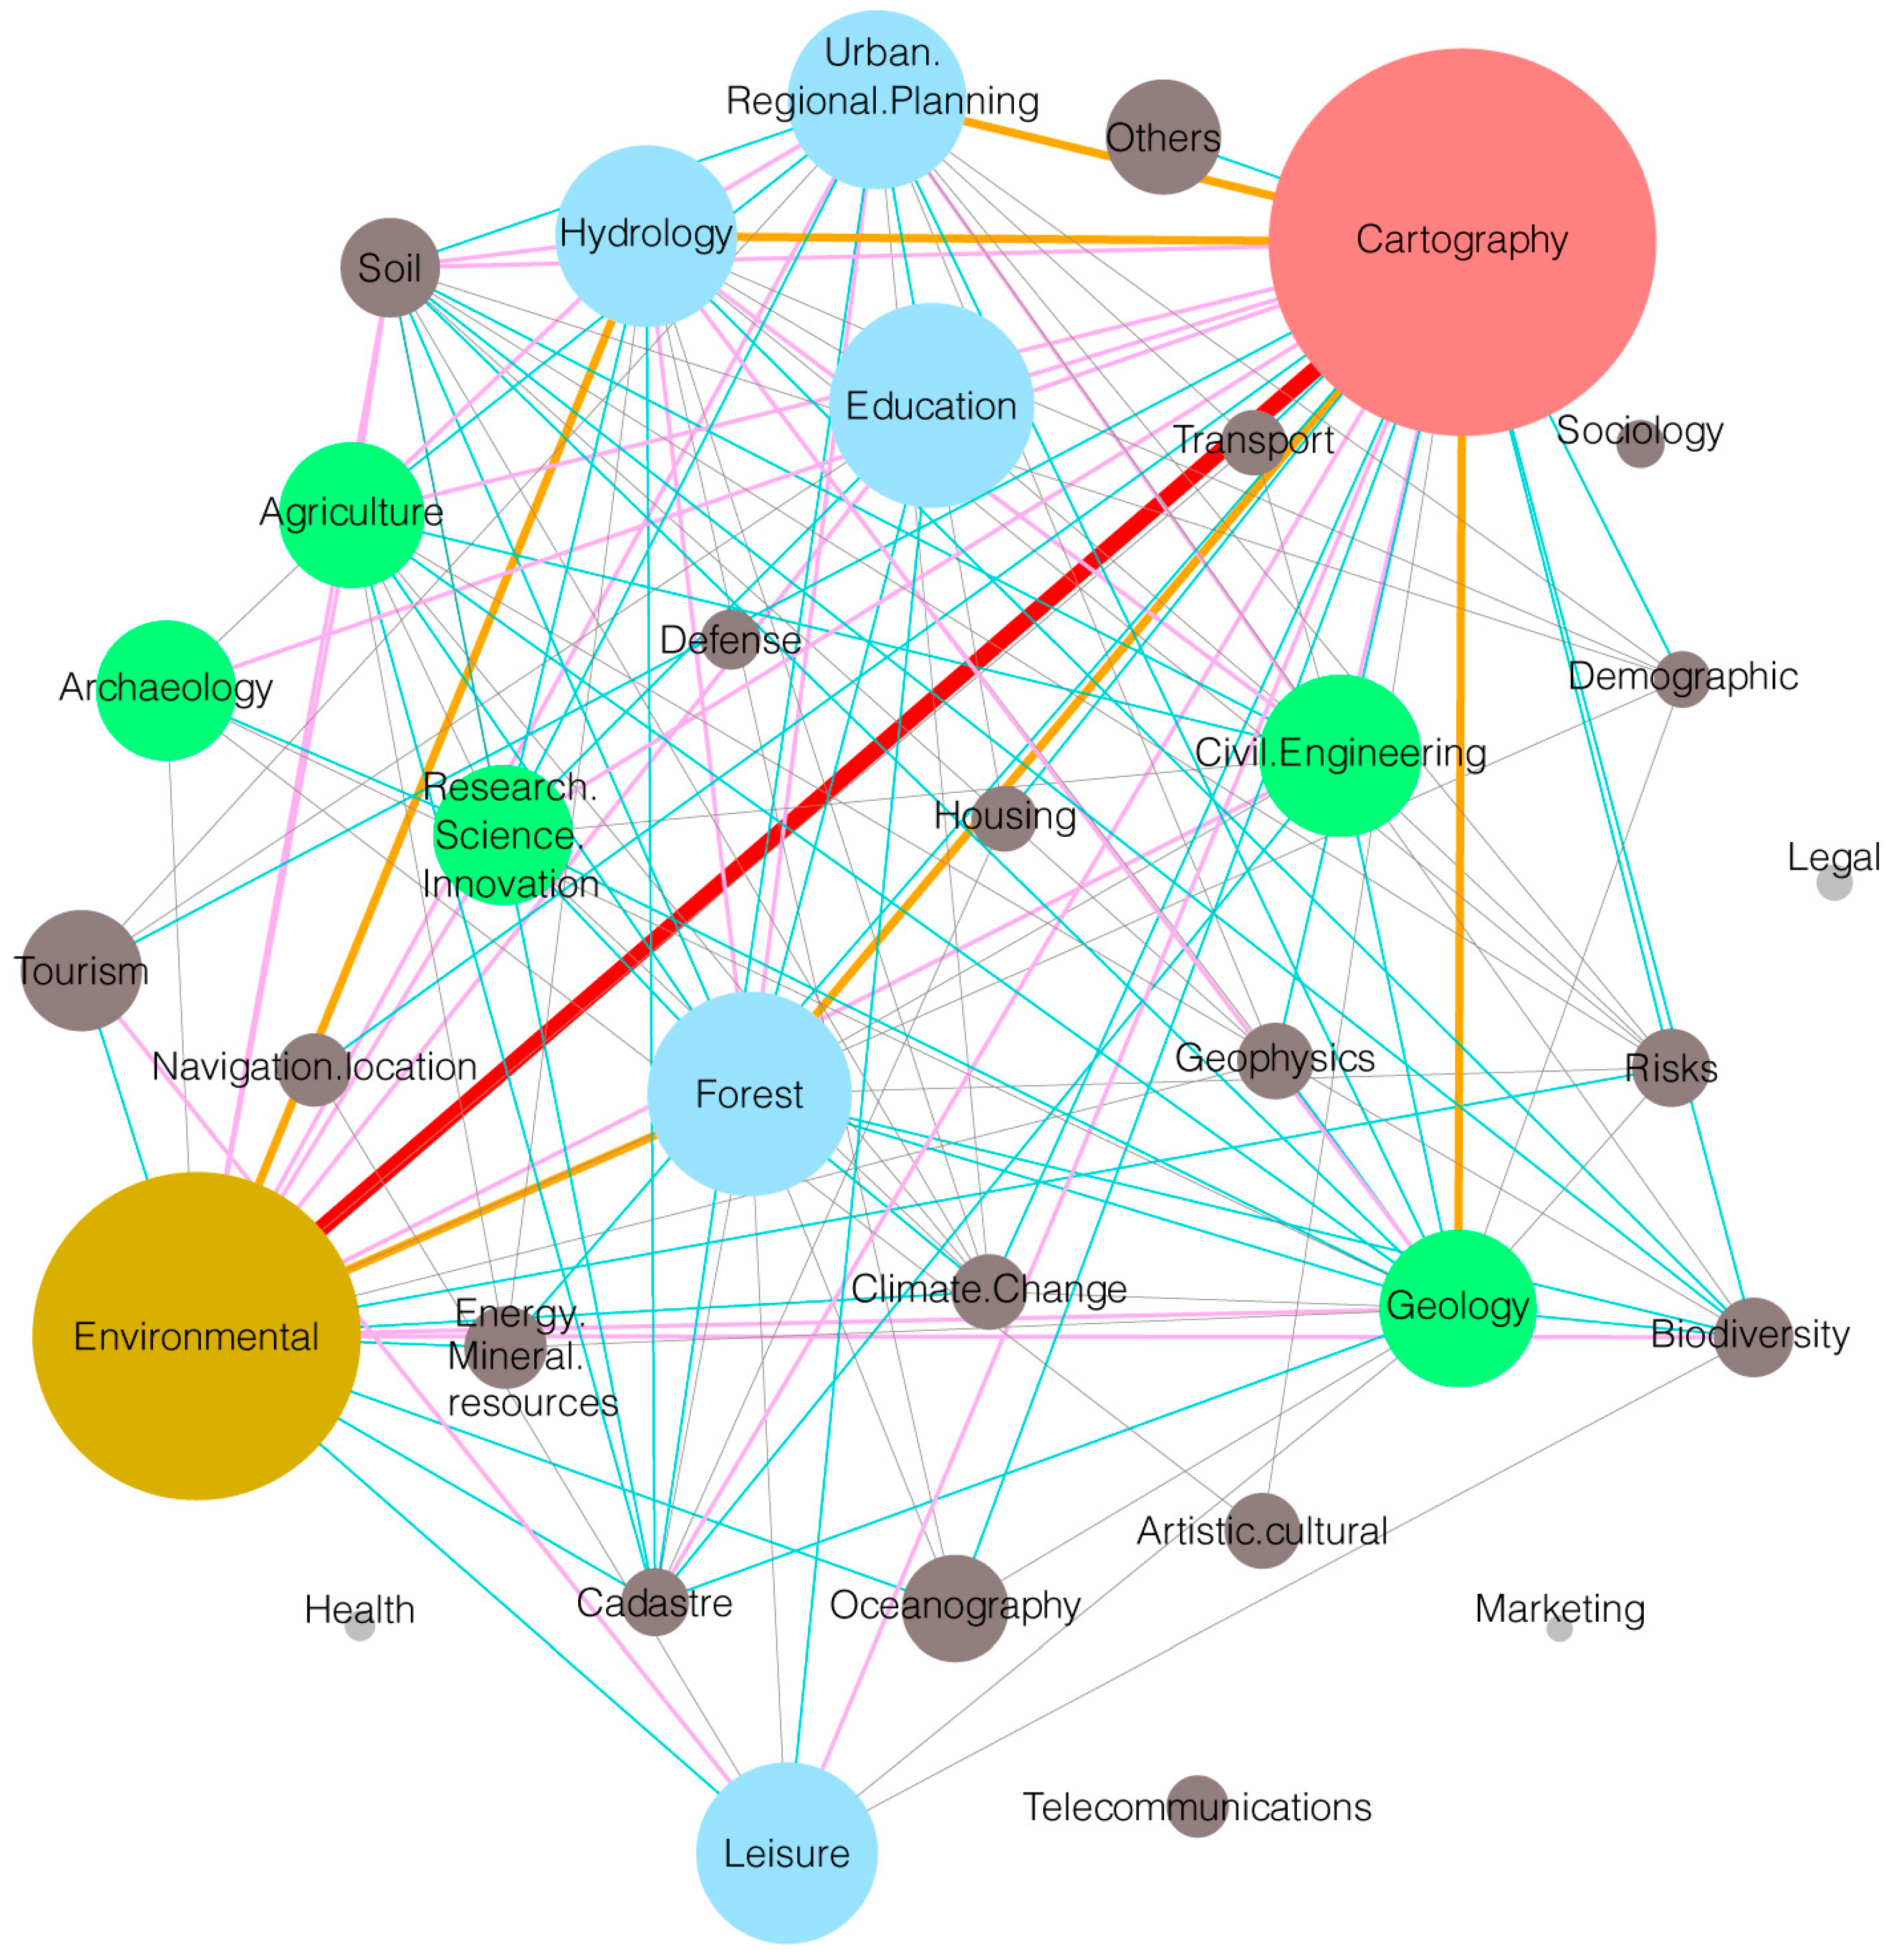
In order to obtain a graphical representation of “Thematic areas” of use, a network graphic (
Figure 7) was derived using a force-directed graph algorithm (in this case the igraph library in R). This graph presents one node for each thematic area, and their size is proportional to the number of checks of each thematic area. The edge widths have been plotted in a color scale range according to the weights of relations, that is, the connections between thematic areas have a different thickness depending on the times that the user jointly indicates both thematic areas, but only the most representative relations are shown. The strongest relation occurs between Cartography and the Environmental sectors, and both have a strong relation with Hydrology and Forest. There is also a remarkable relation between Urban and Regional Planning, Cartography and Geology. There are sectors such as Health, Telecommunications, Marketing, Legal and Sociology which do not show highlighted relations.
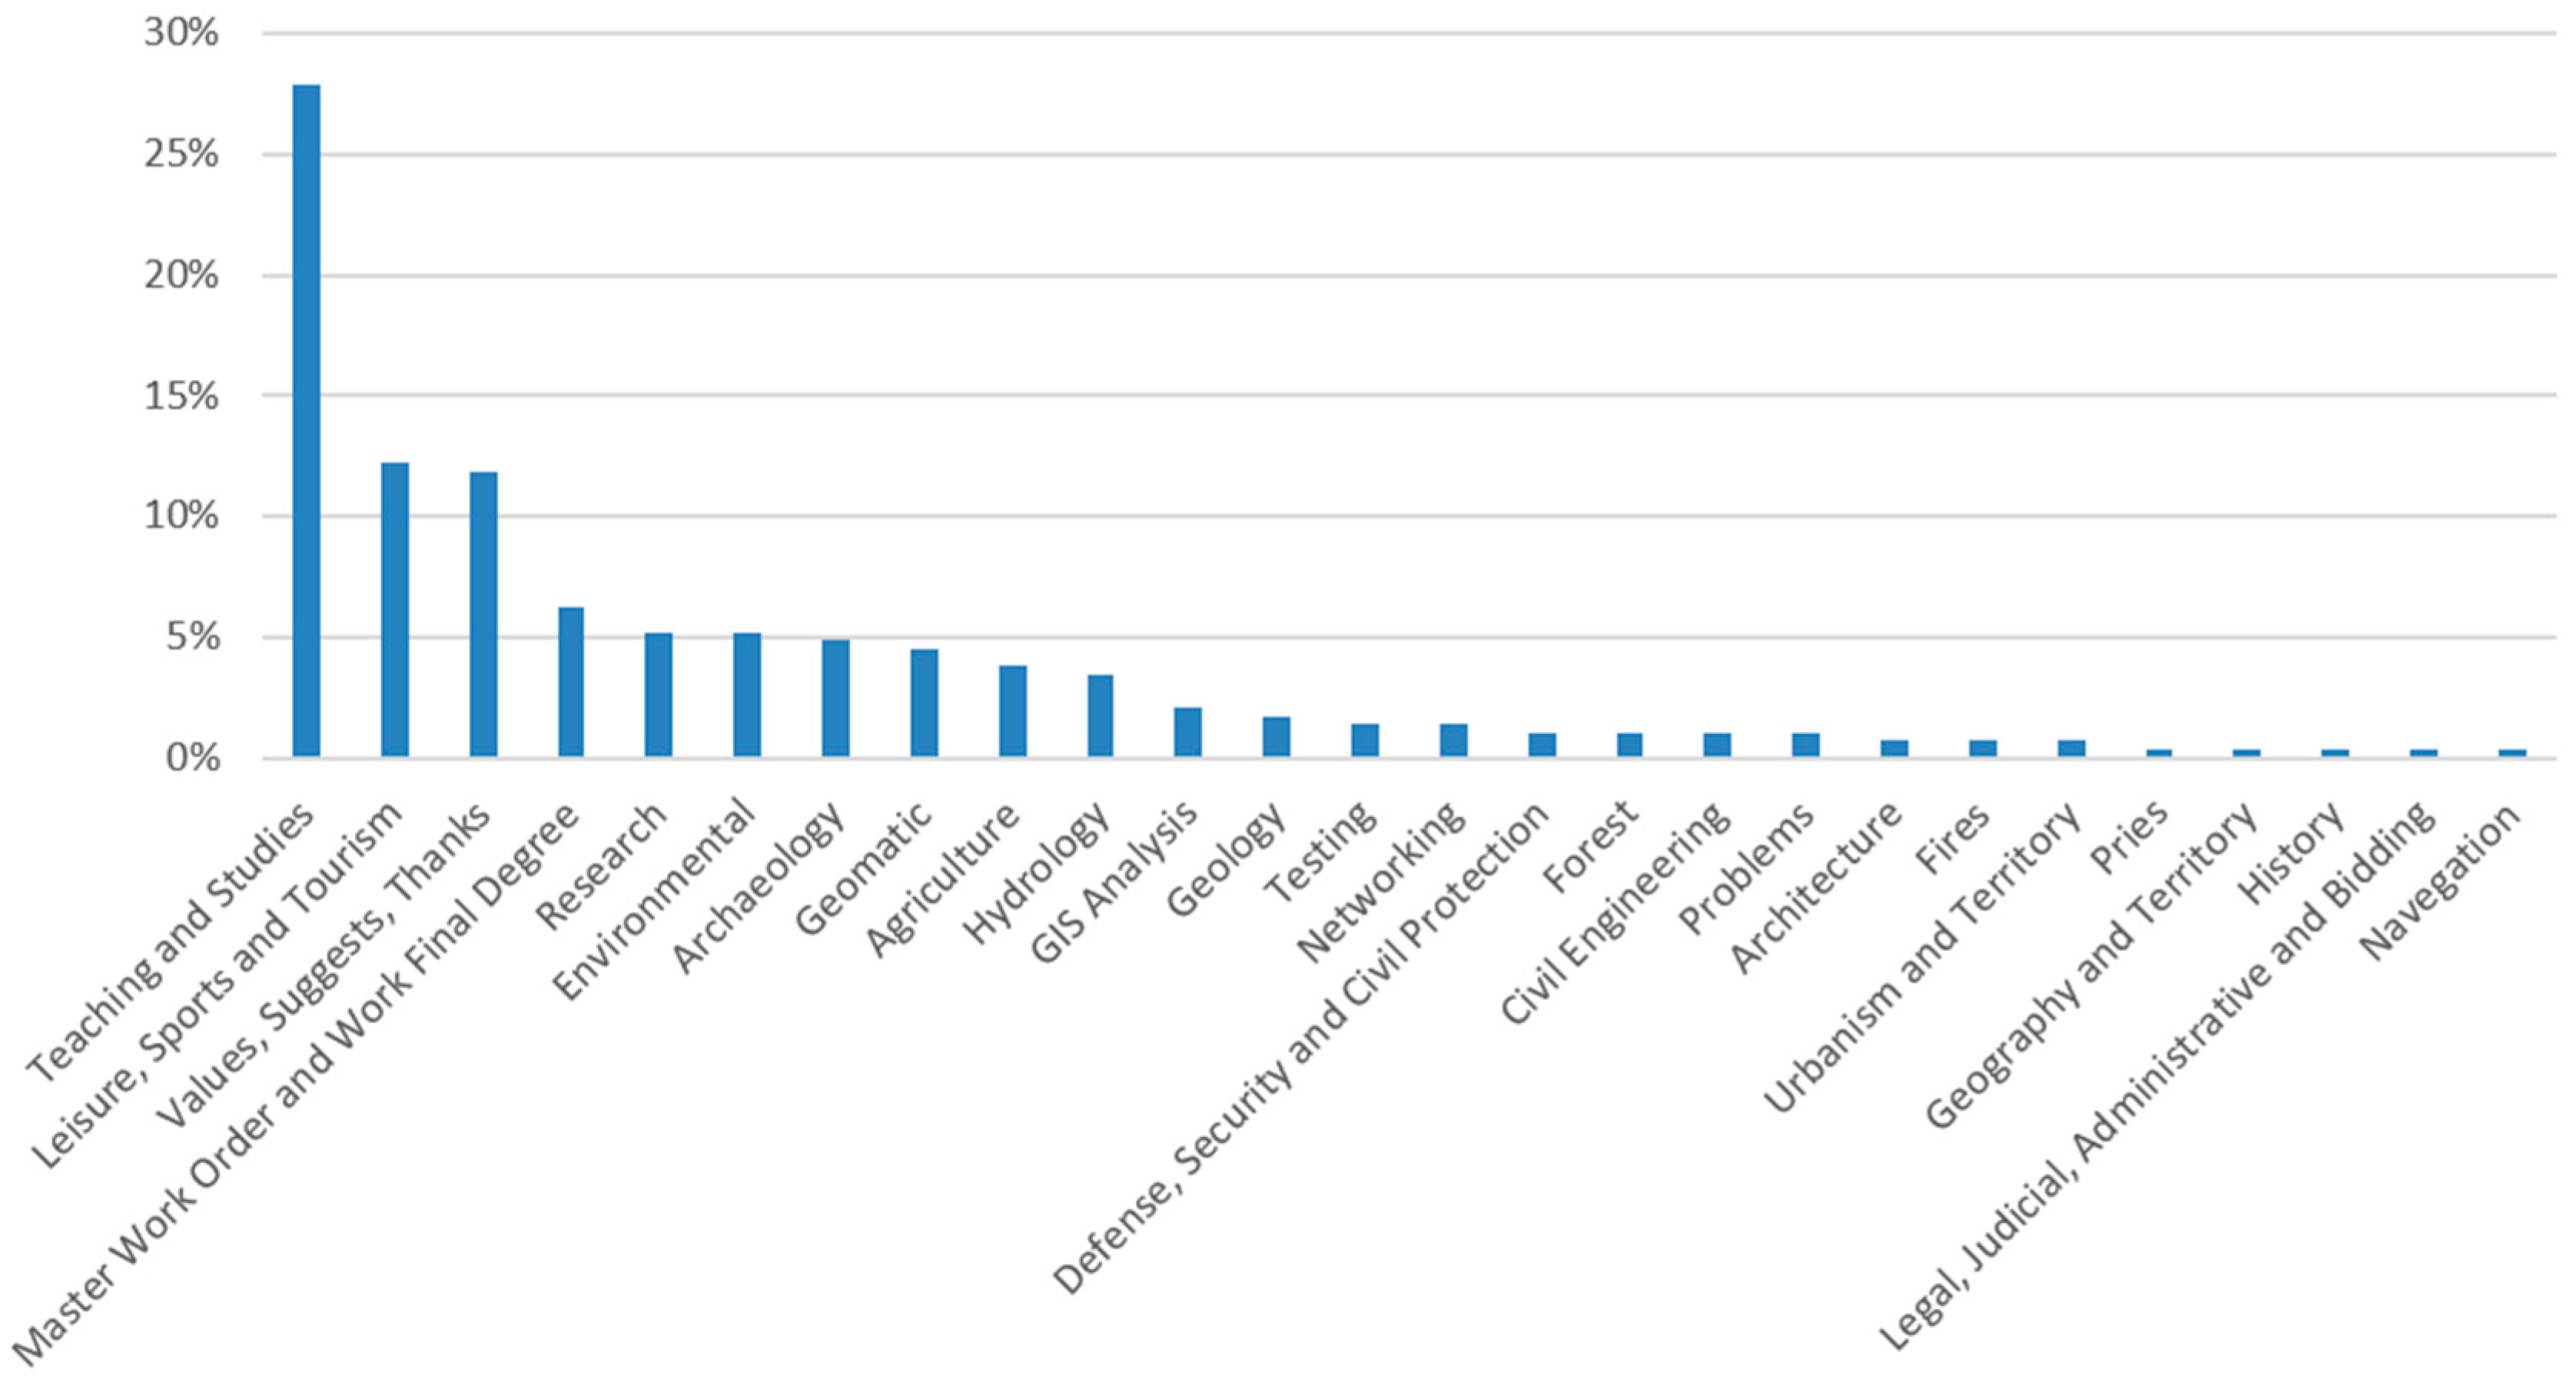
There is a free-text item for comments regarding the “Thematic Area”. It was used 580 times by users to include their remarks. These remarks have been standardized according to the above criteria. Users do not answer this item 11,913 times, which accounts for 95.36% of cases. In the 580 cases with answers only 287 cases specify relevant information, and the remaining cases (293) include rubbish information (e.g., strange codes, absurd texts, etc.). Therefore, there is 50% of useless cases. In
Figure 8 we can see the percentage of each normalized response relative to the total of 287 responses specified. As we can see, though less in number these standardized comments follow a distribution very similar to the comments of the standardized “Description of intended use”. This result is logical because people use this free-text item in order to explain the same idea. Also, it is noteworthy that the category “Valuation, Suggestions and Thanks” takes a high percentage of cases. This category was not present in the case of the standard “Description of intended use”. This category includes many cases of thanks-giving and positive remarks about the products.
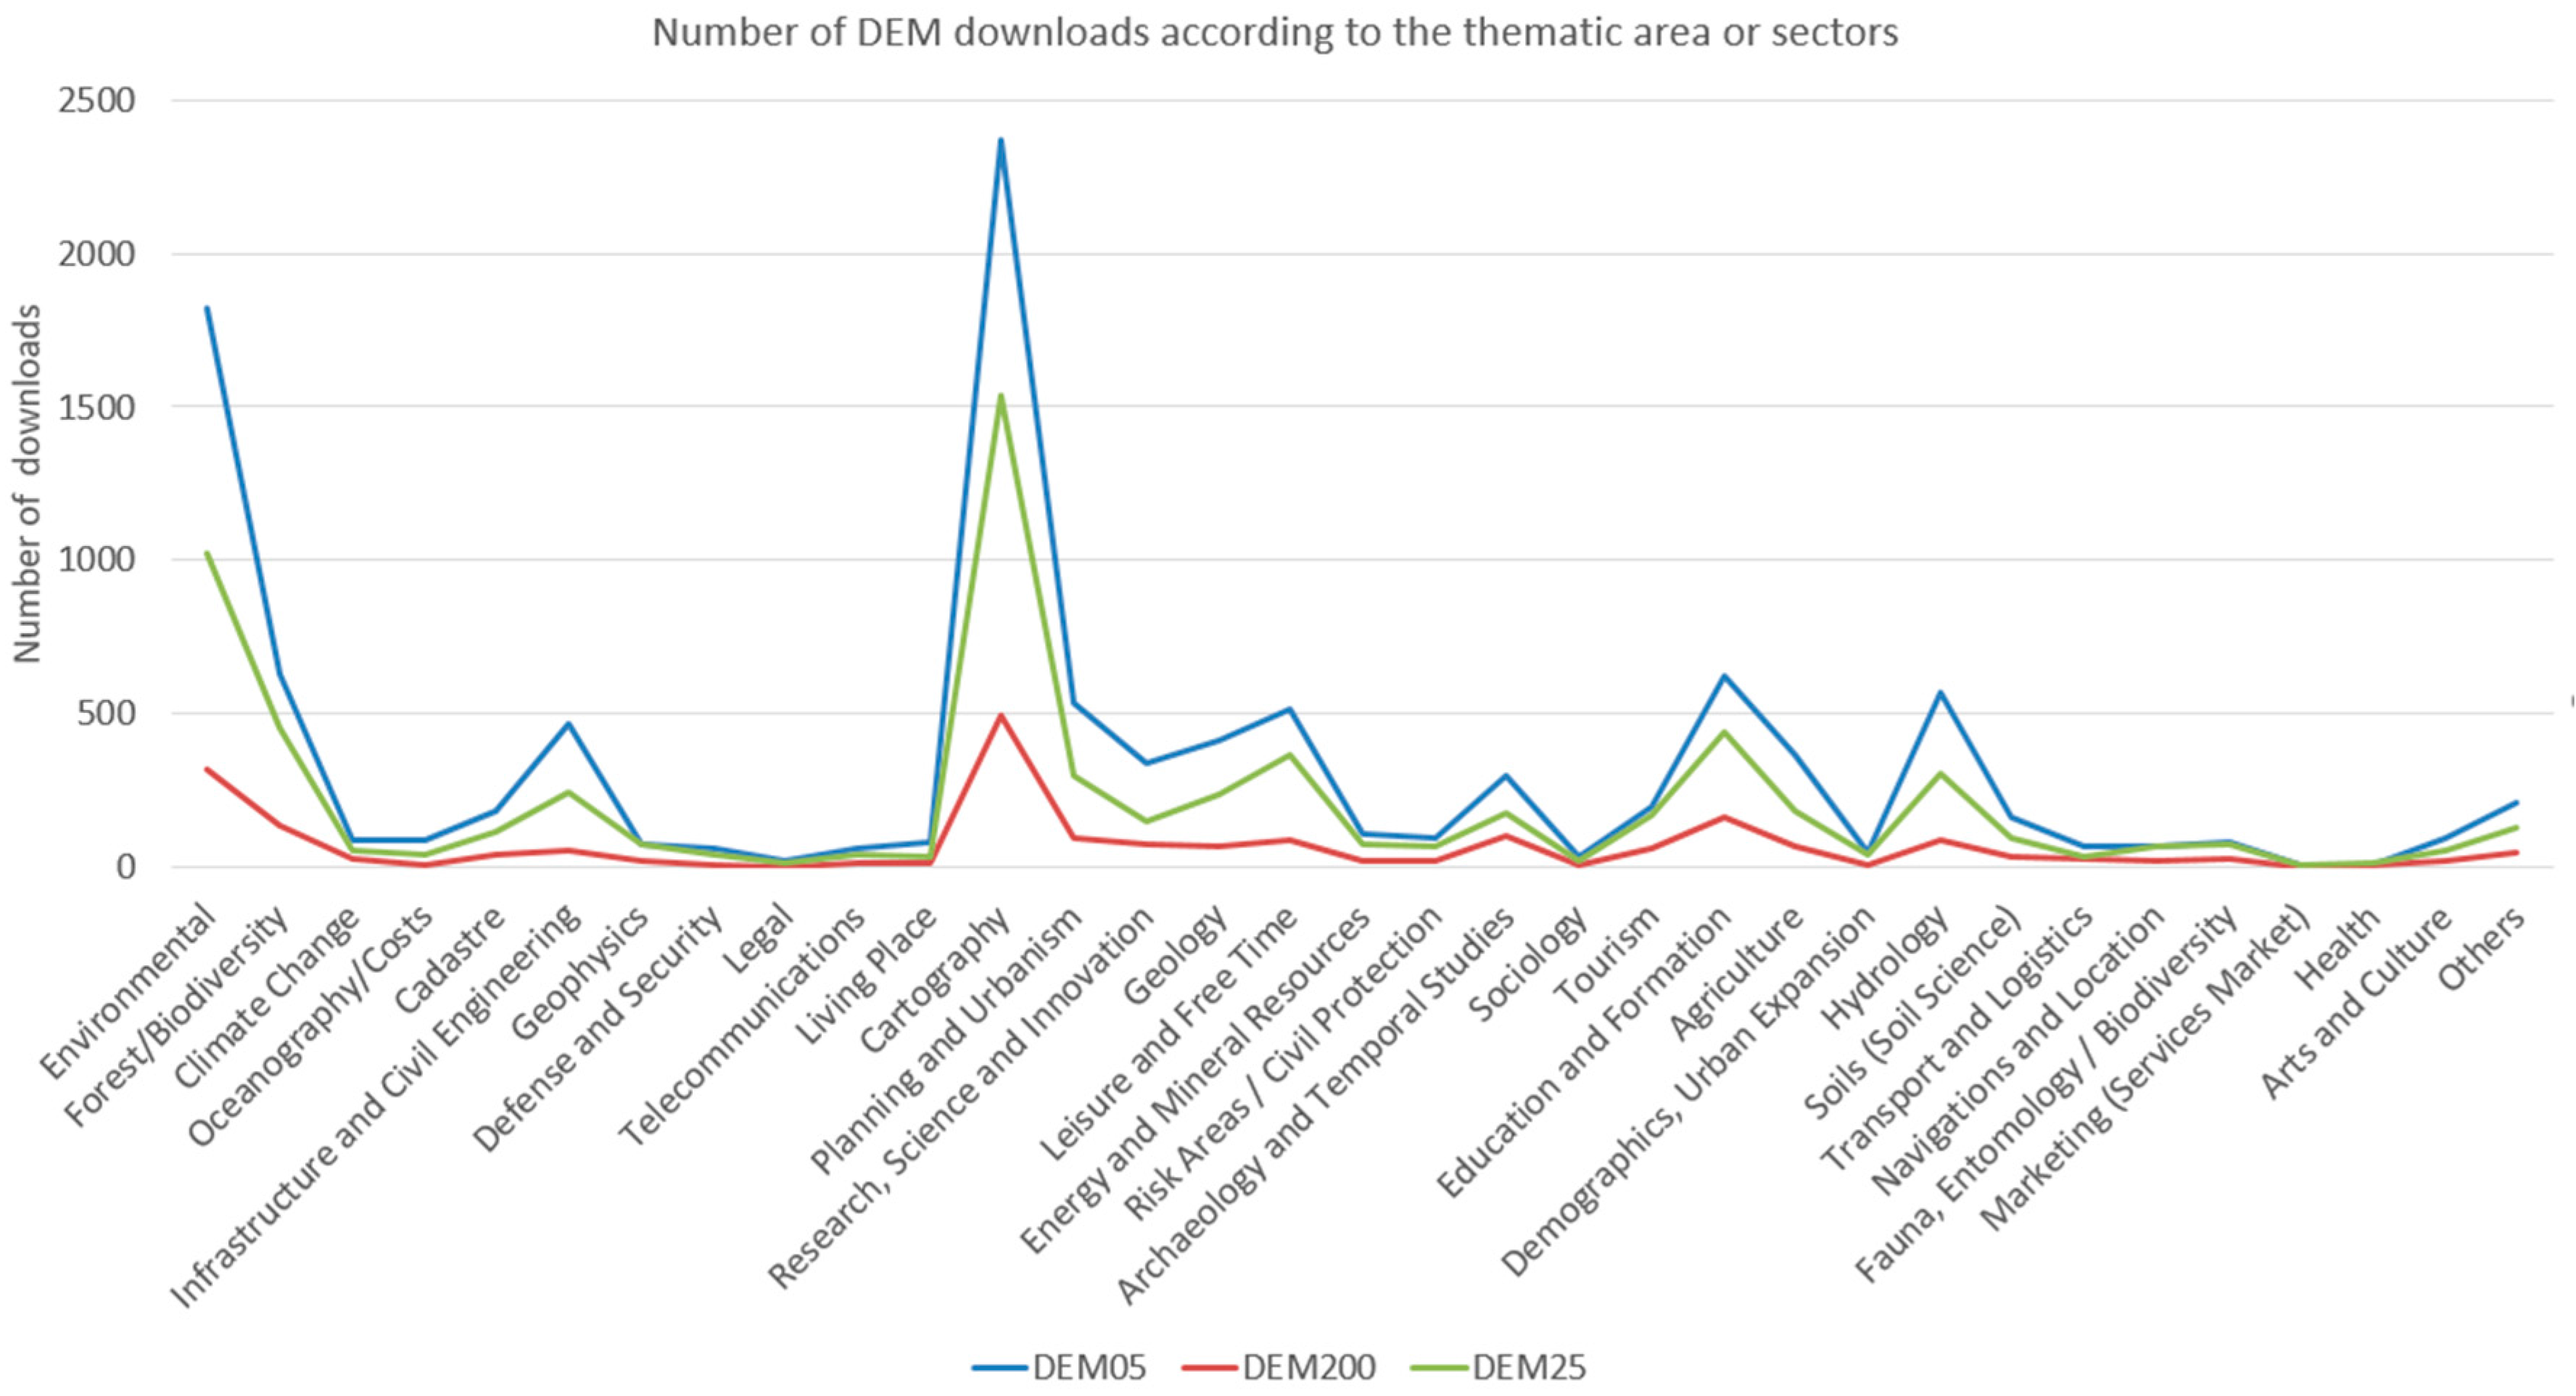
If we establish a relationship between the selected Thematic Area and the type of DEM downloaded, we obtain
Figure 9.
In a first impression, the three curves follow a similar behavior in the different thematic areas. In those thematic areas that can work at any scale such as Cartography, Urbanism and Planning, Hydrology, Forestry and Biodiversity and the Environment, the curves keep an equidistance between the three types of DEM. Meanwhile in thematic areas such as Legal and Sociology the curves join, since in these studies we could not clearly define the scope of study and this is reflected in the similar downloads in the three types of DEM. We also observed that in thematic areas such as Geophysics, Energy and Mineral Resources, Risk Areas/Civil Protection, Demography and Urban Expansion and Tourism the downloads of DEM05 and DEM25 are almost identical, while the downloads of DEM200 are much smaller. This is related to the possibility of studying at large and medium scales of these thematic areas. Finally, we see how in the areas of Marketing and Health the curves are practically reversed. This is typical of studies in a large area of territory, where the DEMs do not have the need for a large resolution and it is not a priority in the objective pursued in those studies.
Finally, we will conduct an analysis of the standardized item “
Description of intended use”, and for this purpose we use the first 43 terms of
Table 2. In this process only one term is assigned to each remark given by a user.
Table 8 shows the standardized terms, the total account of cases and the corresponding percentage. We wish to emphasize that the survey requires users to complete this item, although the answers are not always useful. So there are more than 14% of cases with rubbish information (e.g., single letters, numbers, nonsense, insults, etc.), and these cases are labeled as Unspecified in
Table 8.
The bold terms of
Table 8 are those with a frequency greater than 5%, here the “Unspecified” case has been excluded. “Teaching and Studies” is the case described most frequently. For their specificity, the cases of “Master’s degree final project and Bachelor’s degree final project” have been considered separately. Together they reached 34.8%, which is more than a third of the intended uses related to education. This ensures a great future potential with users of a high technical level. Also, this is in line with the profiles we have described above.
The term “Leisure Sports and Tourism” reaches almost 10% of the total and is set as the second term most used by users. It is interesting to observe how leisure activities are so important among users of DEMs. This suggests the existence of business opportunities by creating value-added products focused on specific sports. Under the term “Geomatics” we have included all the mapping activities (Geodesy, Cartography, Topography, Photogrammetry, etc.), so a high percentage is reached given the high functionality of DEMs in this field. We believe that this is a primarily professional use, which includes freelances and small businesses.
Research is the last term that accounts for more than 5% of cases. This activity is closely related to other terms (Teaching and Studies and Master’s and Bachelor’s Degree Final Projects), which often include a research component. However, we considered it independently because it has been explicitly indicated by many users, and also for the remarkable technological implications of the research. Therefore, in the future we would expect the existence of highly trained professionals and many scientific and educational publications based on DEMs.
Once we have described the terms of higher percentages, there is a diverse group of professional applications of great interest and importance. Within this group we can highlight the Hydrological applications (accounting for 4.1% of cases), and the applications related to the Environment, Archaeological Heritage, Agriculture, etc. All of these applications could be grouped under the heading of professional applications, which should also include Geomatics, and they would provide the importance of professional uses, in this case reaching more than 28% of cases.
In view of the above, we can group applications into three main types: first, applications for teaching and research uses; second, professional applications; and finally, sport and leisure uses. There are other answers that have not been discussed so far which we also consider it important to mention. In particular, there are those that have been normalized with the following terms: “Problems”, “Curiosity” and “3D Visualization”. Some comments indicate problems with the data, mainly with downloads and formats, but they are scarce. Although it is not the most suitable site for these comments, some users use this field for that purpose. The normalized term “Curiosity” provides entries that demonstrate an attitude of exploration of the product by the user; the user seeks a first contact with the product in order to discover its functionality. Finally, the normalized term “3D Visualization” includes entries related to the development of visual and immersive environments, and we would like to highlight these cases for their presumed importance for the future.
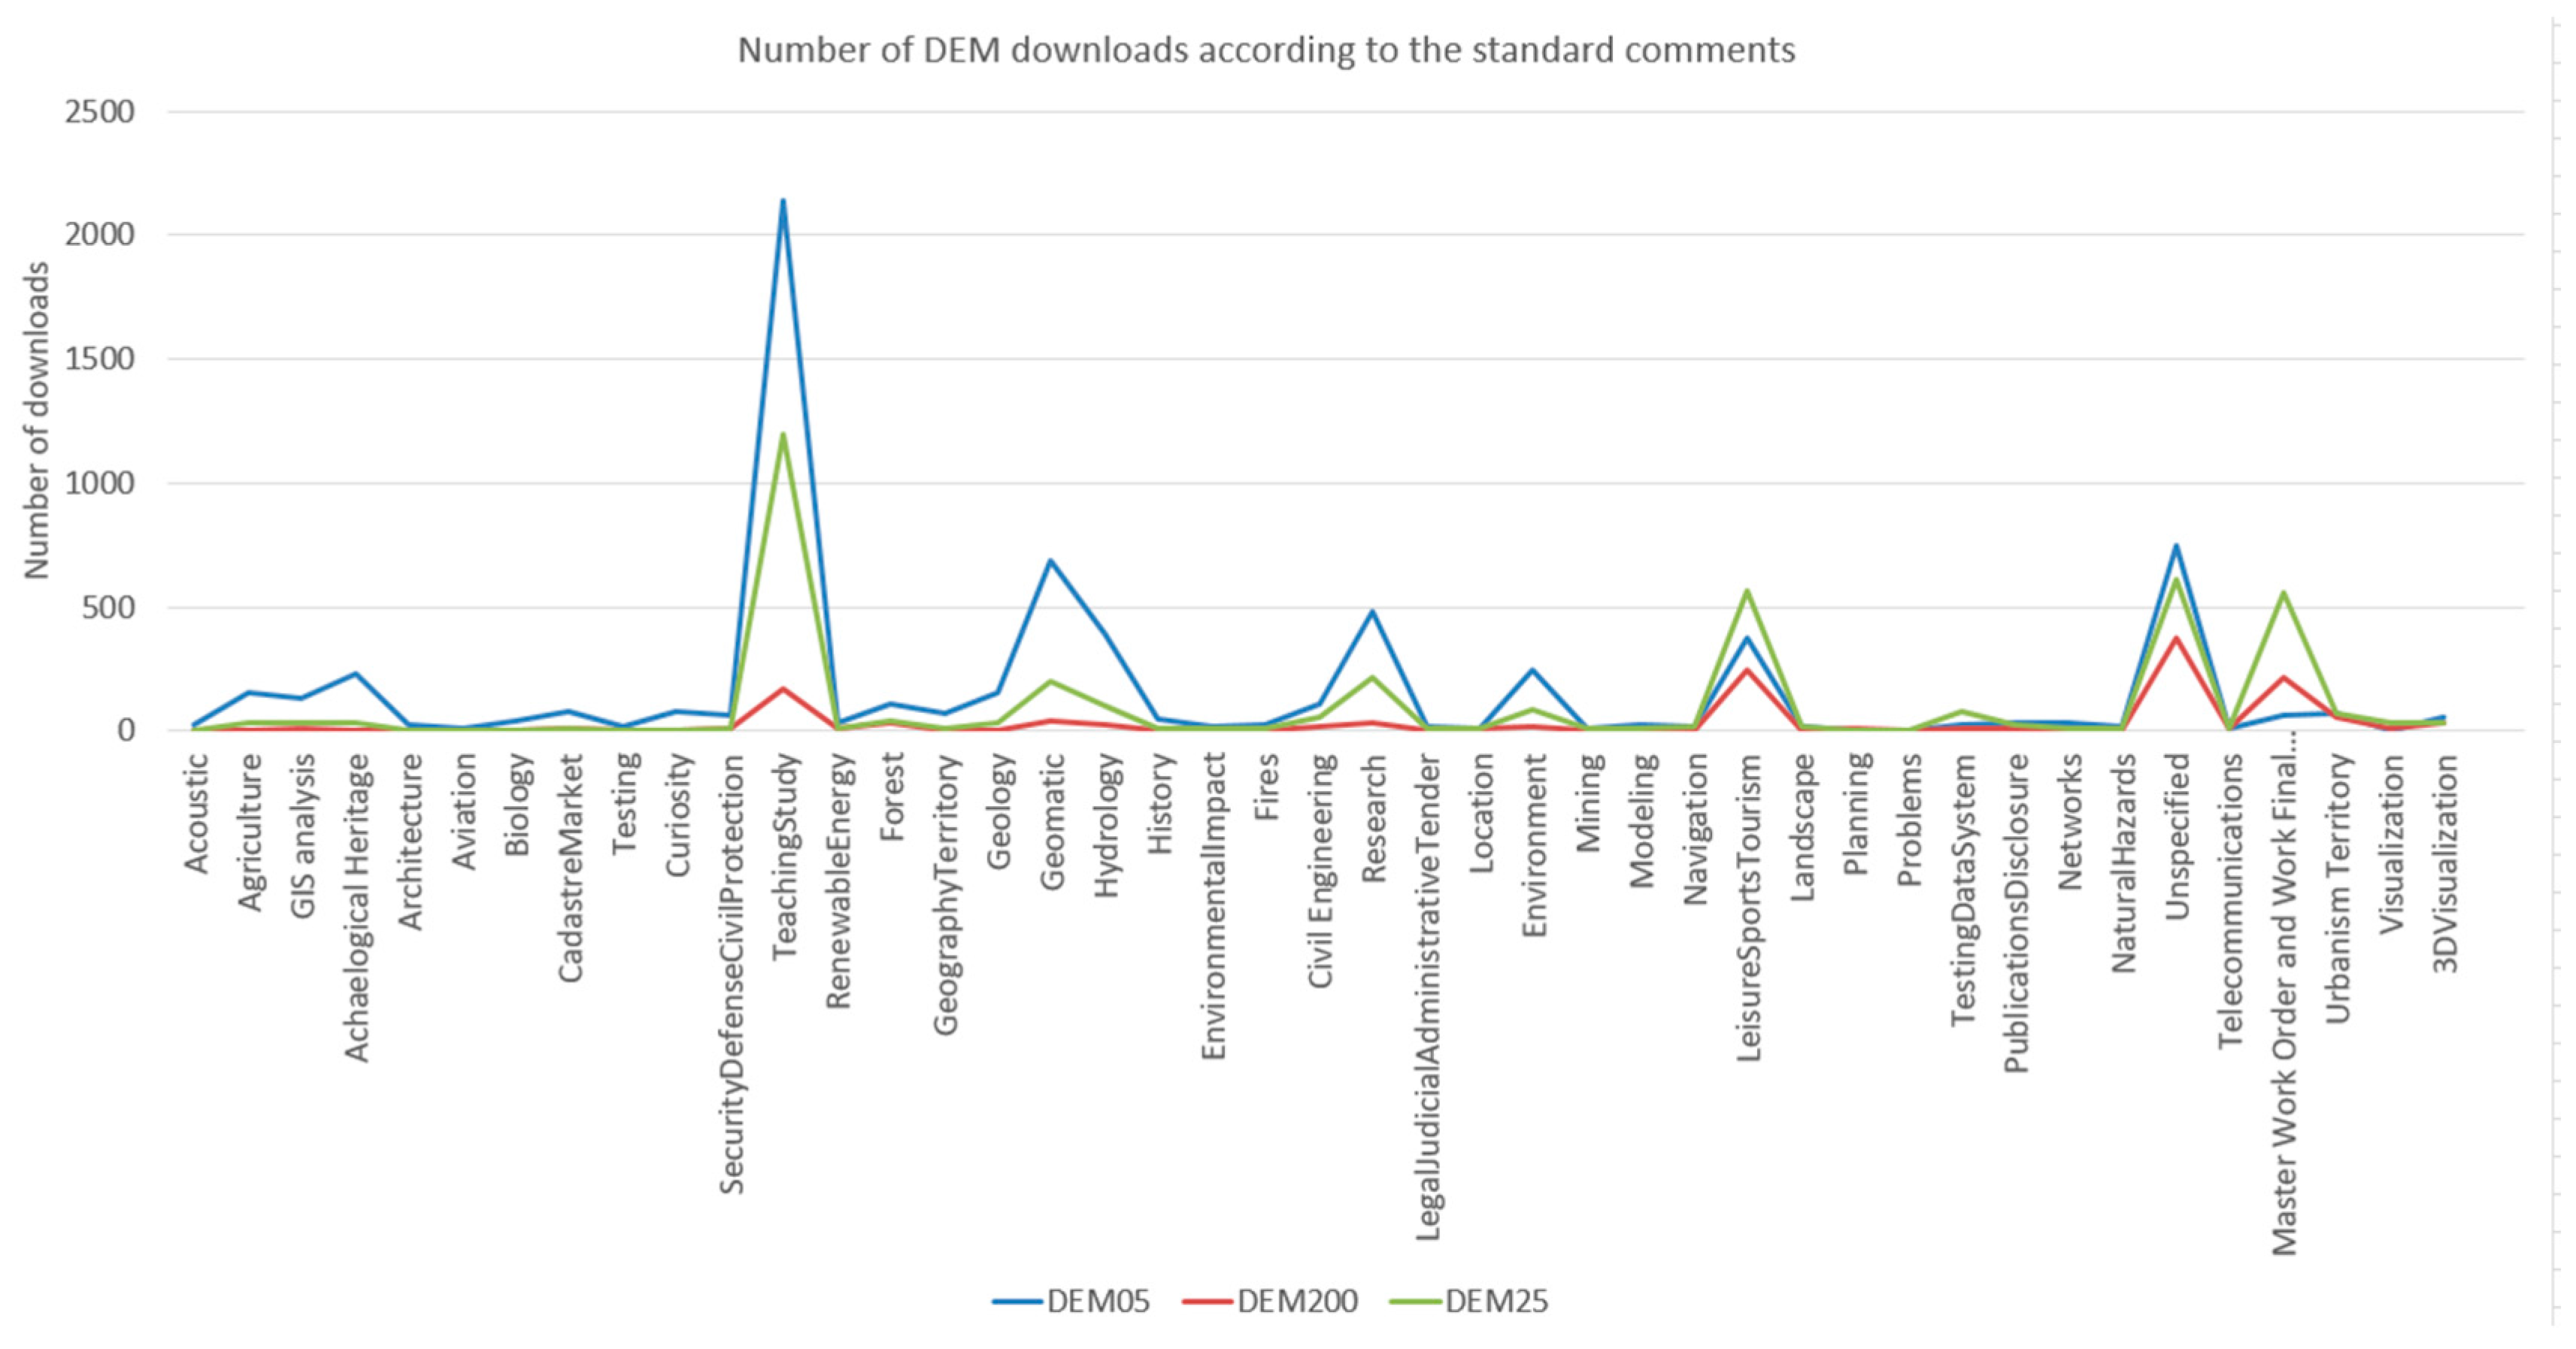
If we relate the standard comments of use with the type of DEM downloaded, we obtain
Figure 10.
We observe how the highest percentages of downloads of digital terrain models are of higher resolution (DEM05) in almost all areas, so this occurs in: Agriculture, GIS analysis, archeology, architecture, Teaching and Study, Geology, Hydrology, Environmental Impact, Civil Engineering, Research, Environment, etc. As happened with the thematic areas, it seems logical that in certain studies the use of high resolution is more frequent to cover a limited extent, however models with lower resolution can be used for larger extensions, although it is usually less frequent. In “Leisure Tourism and Sports”, in “Testing Data System” and in the “Master Work Order and Work Final Degree”, the most downloaded DEM is that of intermediate resolution. This may be logical since for sports activities it is not necessary to have the highest resolution of the DEM. In the case of “Testing Data System” and “Master Work Order and Work Final Degree” there is no reasonable explanation to justify this type of resolution and no other. The use of DEM05 would be more justified in the master’s and final degree projects, since in the use of “Teaching and Study” it is like that. Also in the thematic areas DEM05 is the most frequent in the field of research and education and training.
The fact that more intermediate resolution models are used in “Master Work Order and Work Final Degree”, we think is because the user who has commented on this use is a university user who is heading towards the completion of their work and they are generally studies of medium territorial extension and mainly related to environmental issues.
3.4. Valuation of the Product
The valuation of the product by users is the last aspect to be analyzed in this study. To this end the survey provides two items, “Utility” and “Need to update the product”. These items are valued numerically, and there are also two free text items for the user to make comments. First we will analyze the utility and then the need to update.
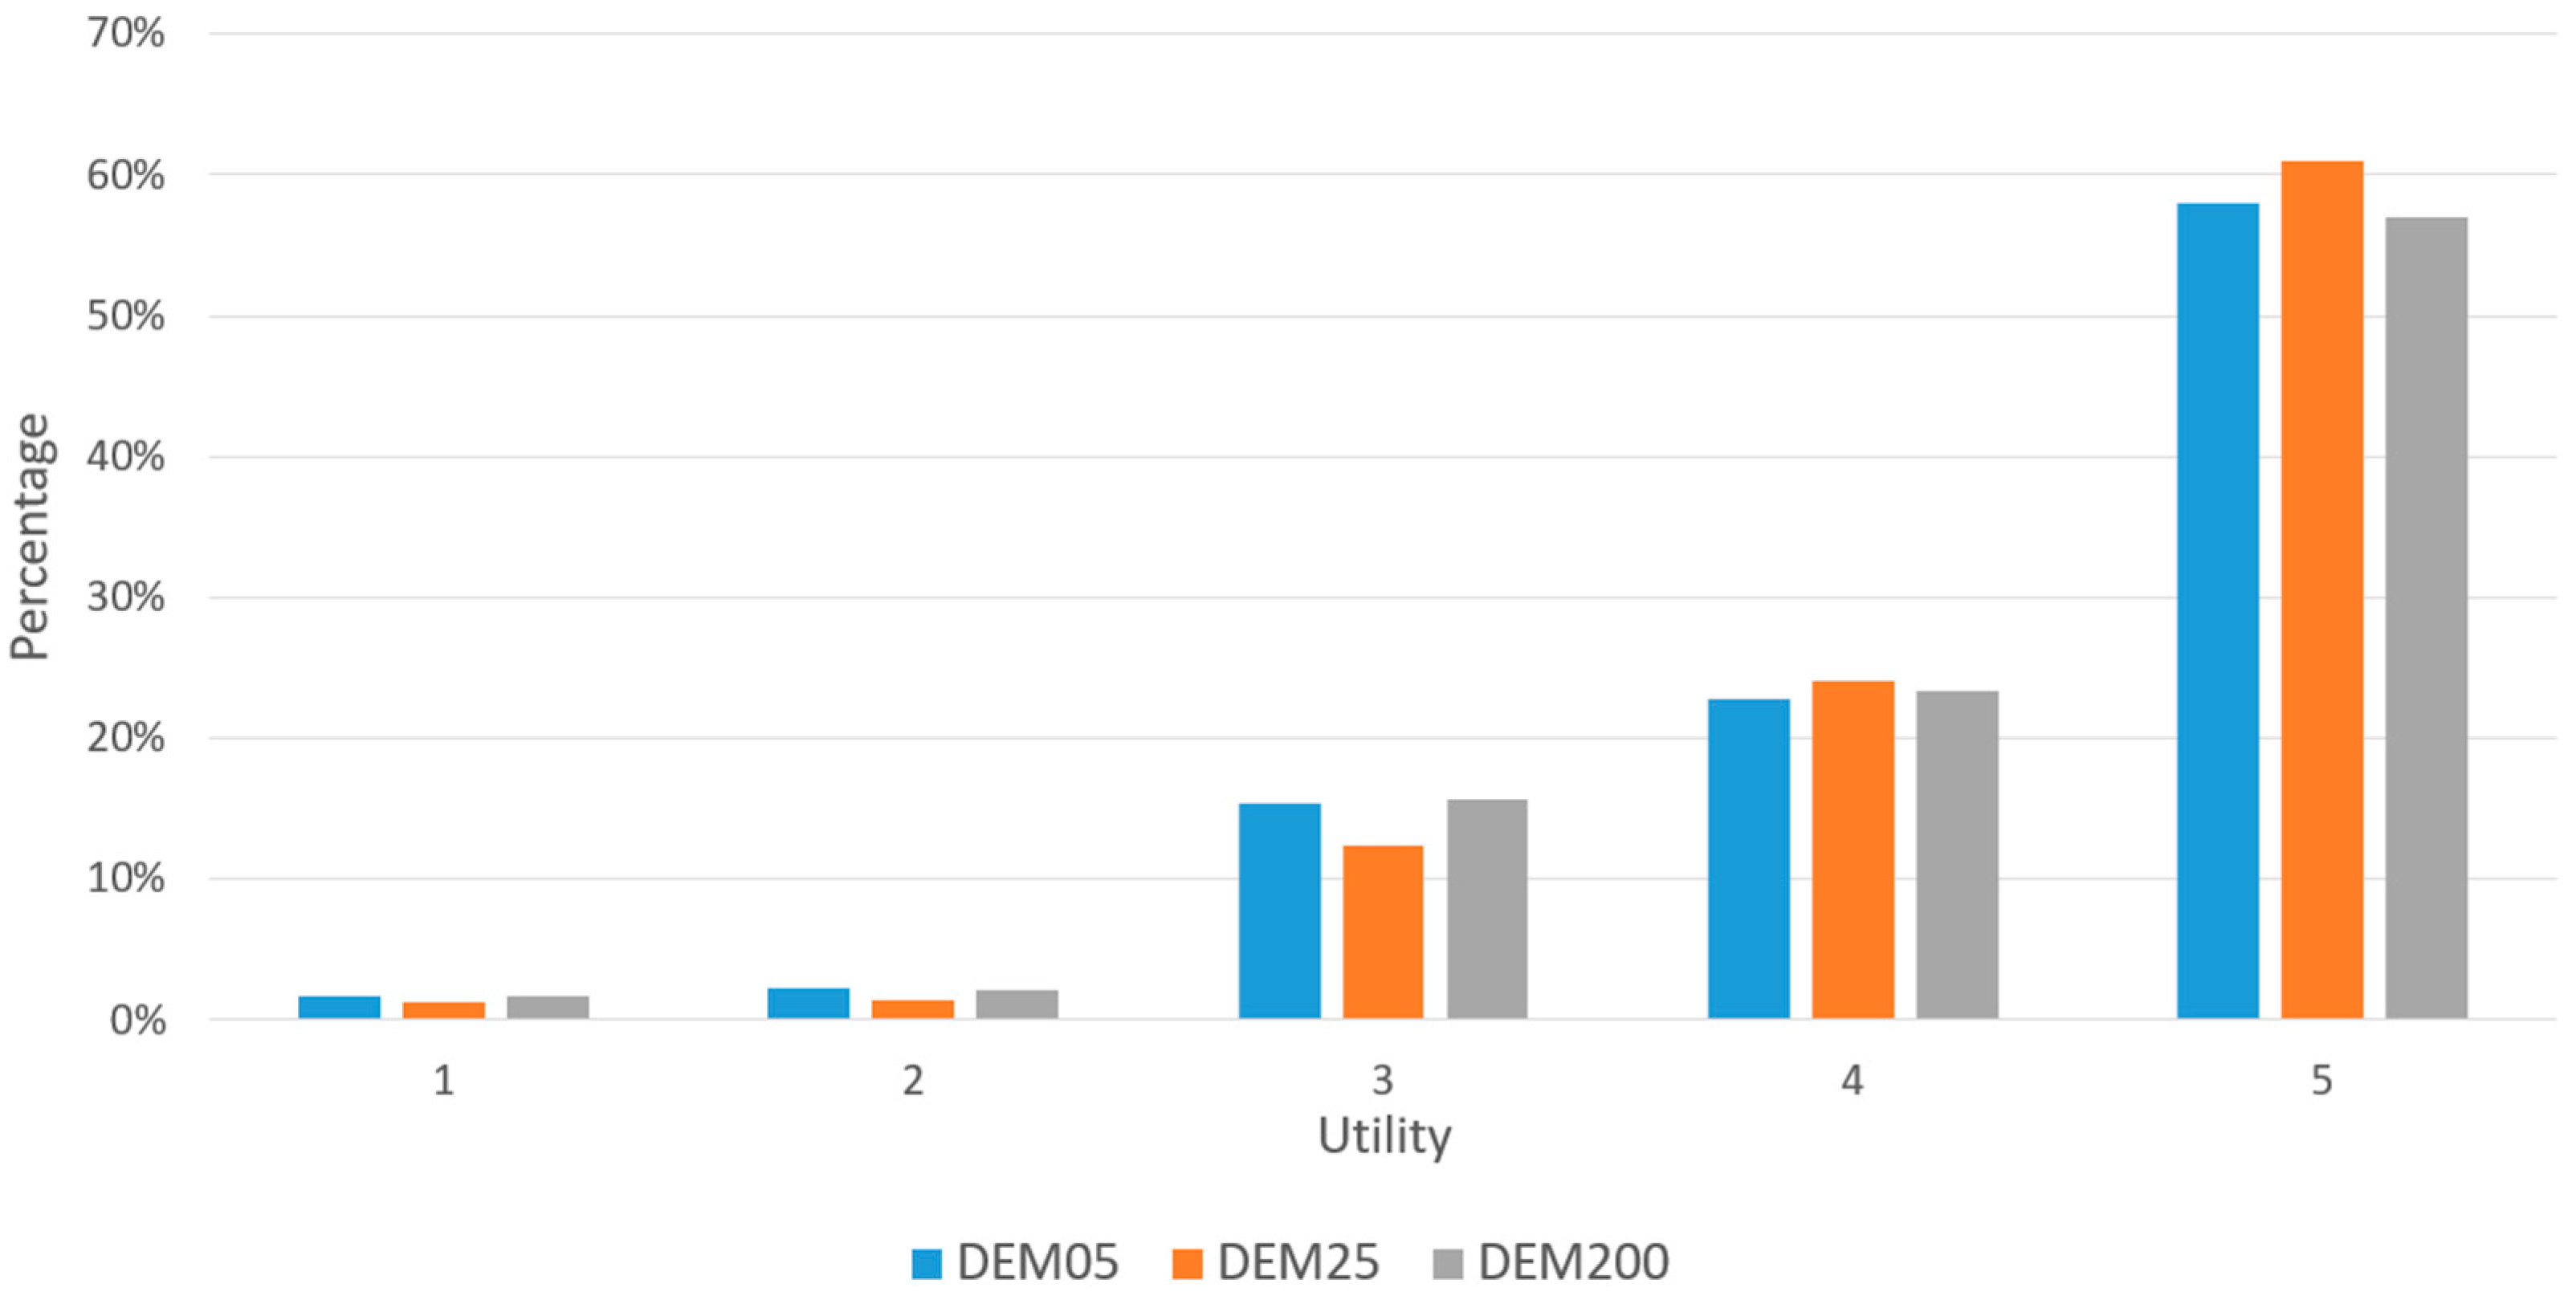
Figure 11 presents the frequencies of the assessment of the level of utility that users have assigned to each product (DEM05, DEM25 and DEM200). Higher values mean higher utility (see
Table 1 for possible values). Users mark mostly the highest level of utility for all three products. If you look at the DEM of highest spatial resolution (DEM05) the utility value 5 scores more than twice the utility value 4, and a third of users consider values between 4 and 3. The same thing happens with DEM200 and DEM25.
Considering all products together,
Table 9 shows the distribution of valuations. The percentage of cases that consider the utility value 5 reaches 58.9%. It is remarkable that the percentages for the utility values 1 and 2 are very low, not reaching 4% together. It is well known that in many surveys that apply Likert’s scale users avoid selecting extreme values; however, we believe that our case is not the same. If the survey respondent knows the possibilities of DEMs, it would be illogical to think that he is going to respond to this item with a low value. So why are there values of 1 and 2? We believe that these correspond to atypical responses, that is, users are assessing other aspects or are simply mistaken when answering. In conclusion, we can say that the DEMs are generally considered very useful.
The other issue discussed in this section is the assessment of “Need to update”. It is not a direct evaluation of the product, but guides us regarding a trait that these products must have.
Figure 12 shows the relative frequency histogram for each product and for each option of the assessment. Once again, the three products (DEM05, DEM25 and DEM200) are valuated in a very similar way, with small differences in percentage values. But
Figure 7 shows a behavior very different from that of
Figure 11. The need to update is a minor item for most users. In this case value 5 is not so far from value 4. Value 3 reaches 25% and values 1 and 2 cannot be considered as outlier answers.
Table 10 presents the aggregate data for the three products. As indicated above, in this case the percentages are somewhat more divided than in the assessment of utility. Thus, the percentage of value 5 is 36.2% and the lowest values (1 and 2) accumulate 16.5%, a remarkable amount. In addition, we note that the sequence of values from level 5 up to 3 do not follow a trend of gradual decline (level 3 exceeds level 4), as in the utility-assessment case. In this case we believe that the frequency peak that occurs at level 3 is due to the bias to the central value that may appear in the answers to questions when using Likert’s scale [
17].
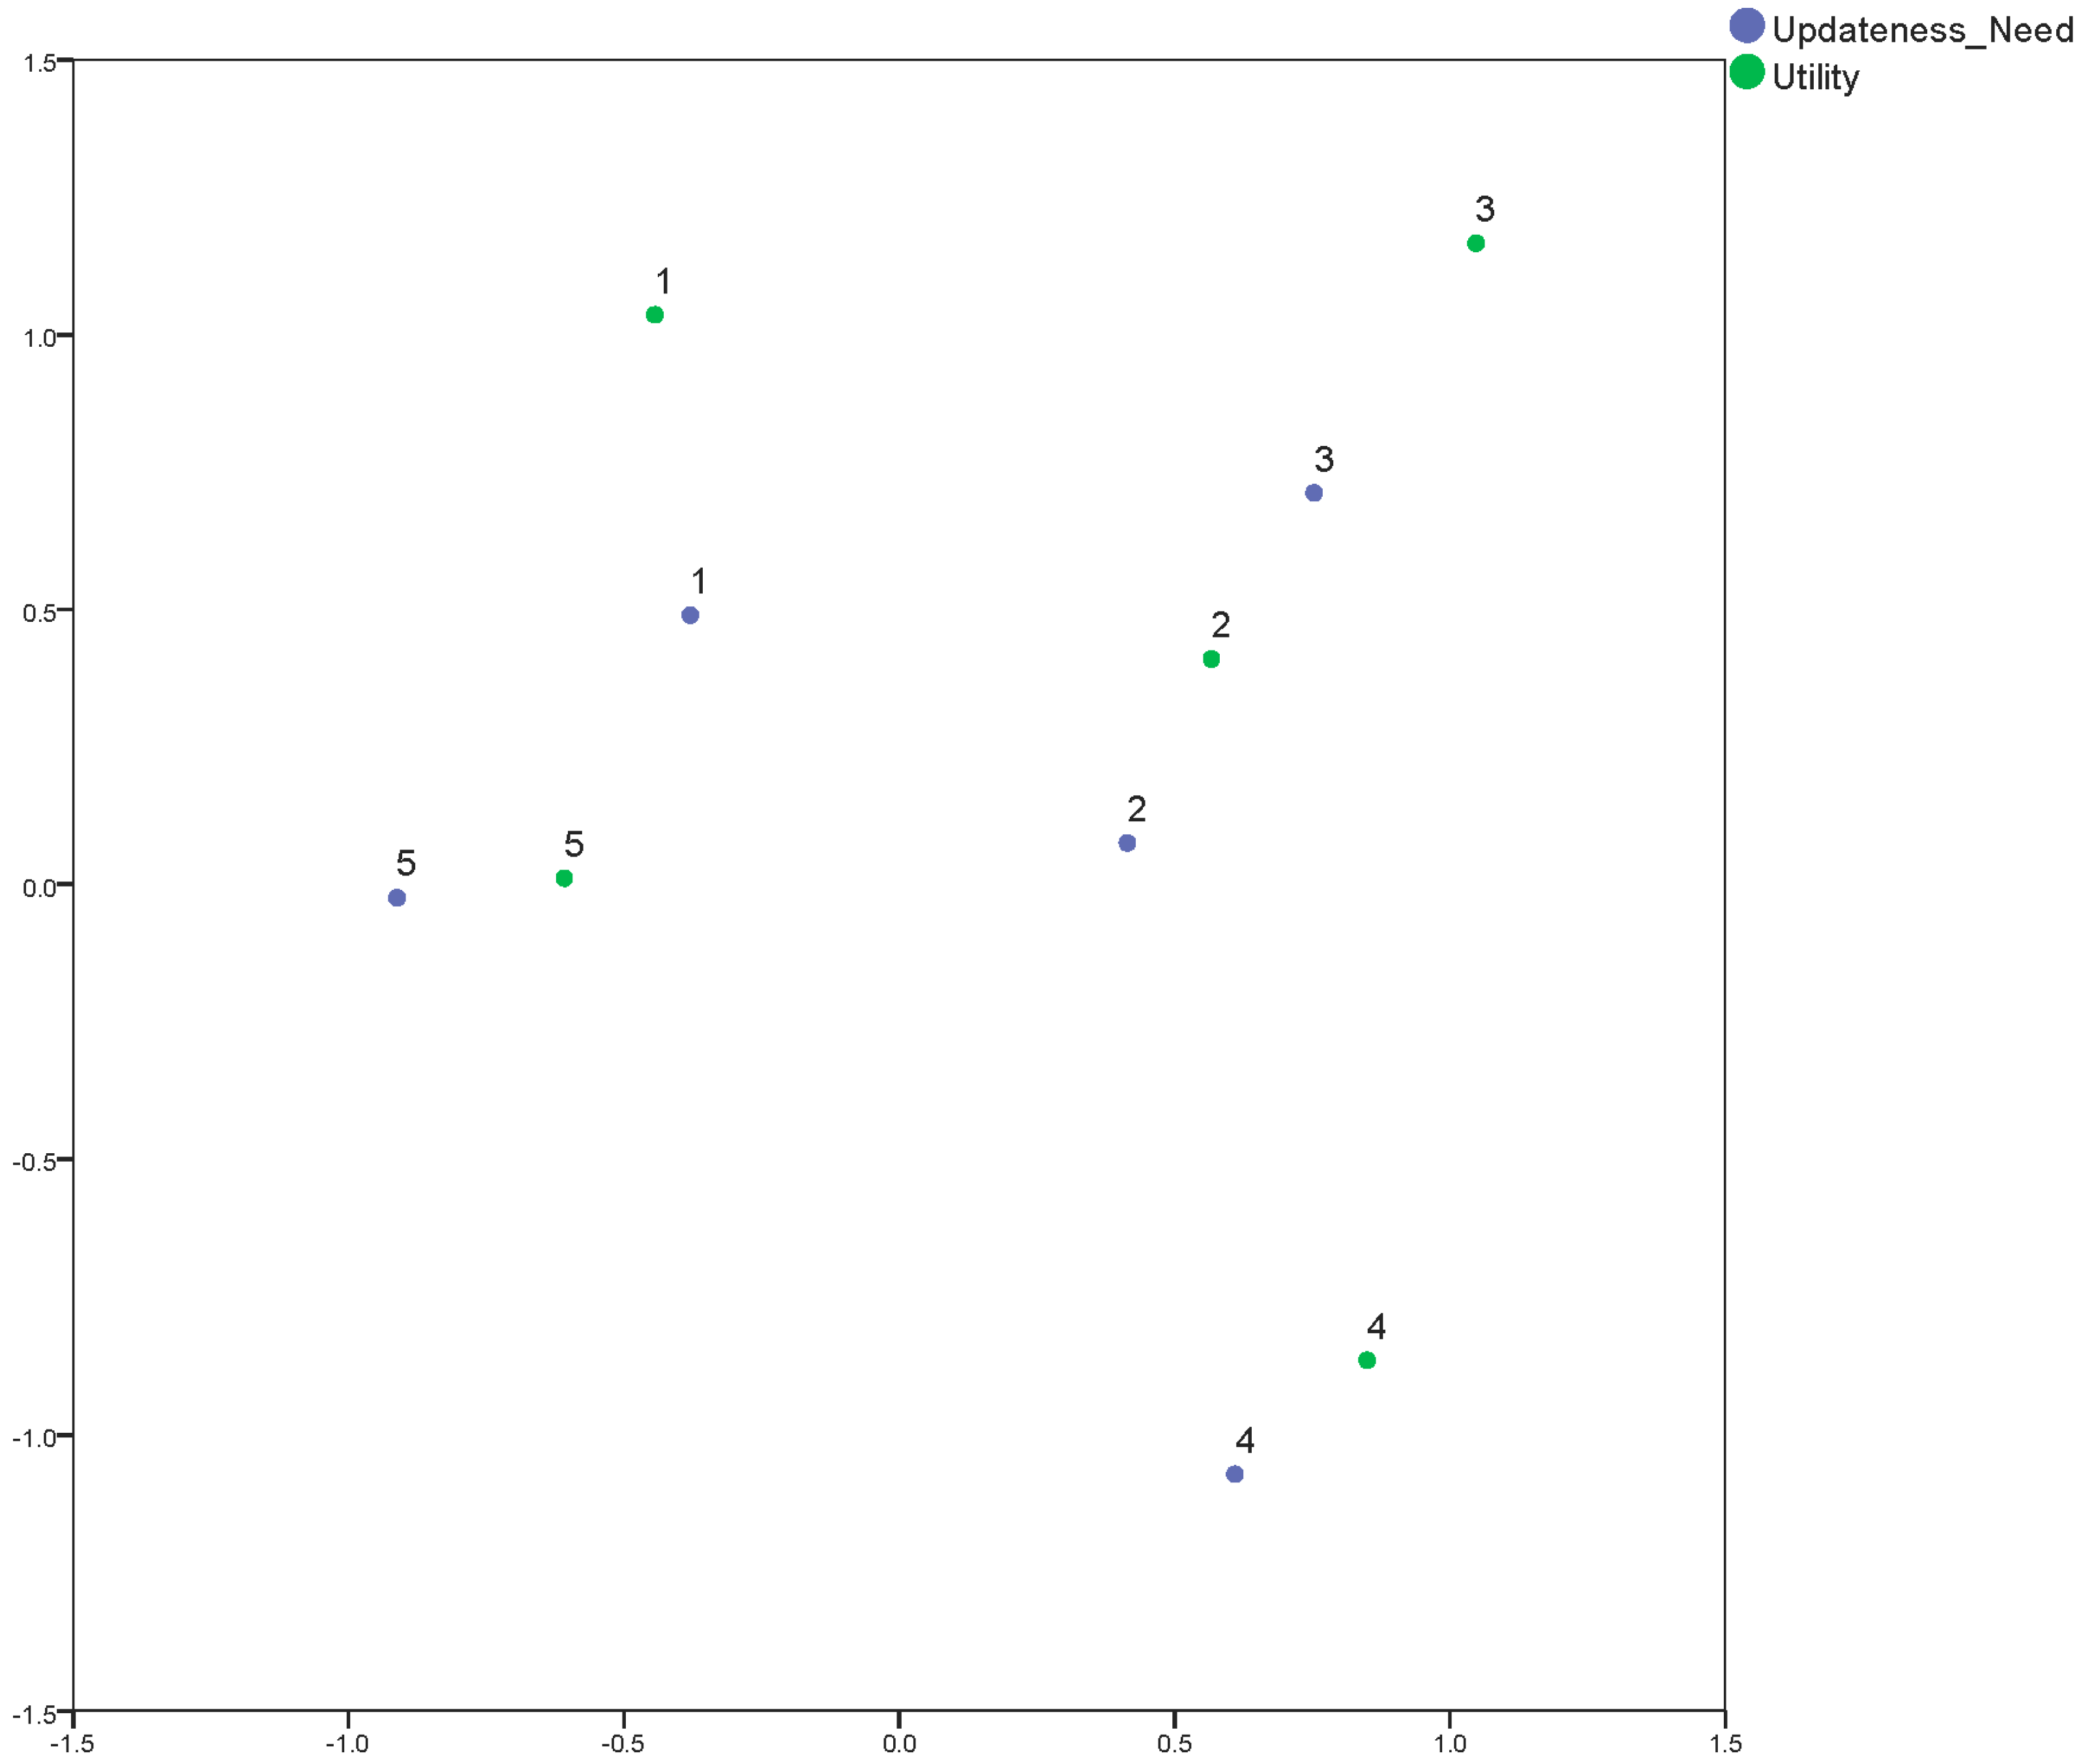
The cross tabulation absolute frequencies between Need to Update and Utility scores are shown in
Table 11. A Pearson Chi squared test indicates that there is no statistical independence between both variables, which implies that both variables have a great correlation. This situation is shown by
Figure 13 where it can be observed, in normalized axis, that the points representing the same values of Need to Update and Utility are close to each other.
There is a dependence between both variables because it is logical, since the user that considers the DEM very useful should consider that updating it is very necessary as well. This leads us to ponder whether it is necessary to include the two items in the survey, as maybe a single item that groups both ideas would have been sufficient.


